we take pride in what
TRANSCRIPT

We take pride in what we stand for because with it we have gotten to where we are.
RC 7588
Insuring happiness since 1970

RC 7588
...leading the way to what lies beyond.
That’s where we are headed; the next frontier

CONTENTS
OverviewIn this section:
An introduction to the report covering who we are, notableevents, and a snapshot of where and how we do business.
Our MissionHow We Do ItOur Core ValueNotice Of Annual General Meeting
Business ReviewIn this section:
The Chairman's reflections on the year, and review ofCorporate profile.
Chairman’s StatementCorporate Profile
3568
1014
GovernanceIn this section:
The governance framework, including the role andeffectiveness of the Board and the alignment of theinterests of management with long term value creation.
Board of DirectorsDirectors’ ReportStatement of Directors’ ResponsibilitiesCorporate Governance ReportComplaint ChannelsManagement’s Discussion and AnalysisIndependent Auditors’ ReportCompany information and Summary of Significant Accounting Policies
16202324262830
33
Group Financial StatementsIn this section:
The statutory financial statements of both the Group and the Company and associated audit report.
Consolidated Statement Of Financial PositionConsolidated Statement Of Comprehensive IncomeConsolidated Statement Of Changes In EquityCompany Statement Of Changes In EquityConsolidated Statement Of Cash FlowsNotes To The Financial Statements
AppendixIn this section:
Other National Disclosures.
Value Added StatementFive Year Financial SummaryNon-life Business Statement Of Financial PositionNon-life Business Statement Of Comprehensive IncomeNon-life Business Revenue AccountLife Business Statement Of Financial PositionLife Business Statement Of Comprehensive IncomeLife Business Revenue AccountDeposit Administration Revenue AccountLife Business Annuity StatementLeadway At A GlanceLeadway SubsidiariesBranch Director
484950525354
136137140141142145146147148150151152153

www.leadway.comAnnual Report & Accounts 20162
Mr. Oye Hassan-Odukale, MFRC H I E F E X E C U T I V E O F F I C E R
RC 7588
Limited.

VISION STATEMENTTo be a leading insurance company and non- banking financial solutions provider in Nigeria, leveraging on our strategic capabilities in other selected markets.
MISSION STATEMENTTo be a service provider of choice,
bringing insurance as a risk management tool to the consciousness of all; adding
value to our clients and other stakeholders in an efficient and reliable manner.
3www.leadway.comAnnual Report & Accounts 2016

One’s art, skill and decision making abilities kind of change as one gets older, by nature of the fact that you're hopefully gaining wisdom
and you're starting to watch things with a better overview.
Anonymous
OverviewIn this section:
An introduction to the report covering who we are, notable events, and a snapshot ofwhere and how we do business.
Our mission.......................................... How we do it........................................ Our core values.................................... Notice of Annual General Meeting......
3568
www.leadway.comAnnual Report & Accounts 20164
RC 7588

WHAT WE DOLeadway offers insurance services in life and general
businesses (property & casualty). Leadway also offers allied financial services like bond, secured credit, miscellaneous
financial losses and fund/portfolio management.
Leadway enjoys the patronage of clients spanning all the major industries including Construction & Engineering, Manufacturing, Oil and Gas, Shipping, Government
Establishments, Ministries and Parastatals. Leadway increasingly attracts patronage from retail clients
from a wide variety of backgrounds.
OUR RESPONSIBILITIESIn discharging our responsibilities, we pledge that come
what may -rain or shine, dull or bright- the Company must always meet its financial obligations to all its customers,
primary of which is claims. Without claims there will be no insurance business.
The conceptual basis of our Camel logo is rested on the slogan of the company being an Efficient and Reliable
carrier of financial burden/obligations which in turn ensures the happiness of its customers.
OUR CULTURELeadway Assurance has come a long way since its
establishment in 1970 to carry on business as a composite insurer.
Its Board of Directors comprises of men and women of integrity with several decades of experience in financial
services and other diverse fields in-between them.The Board is collectively responsible for the success of the
company and works with management to achieve company objectives.
5www.leadway.comAnnual Report & Accounts 2016
HOW WE DO IT

“iSCORE”...our core values for success
Integrity Service CustomerFocus
Openness RespectFor
The Individual
Excellence
www.leadway.comAnnual Report & Accounts 20166
RC 7588


www.leadway.comAnnual Report & Accounts 20168
NOTICE OF ANNUALGENERAL MEETING
th8 May, 2017.
Dear Shareholder,
NOTICE IS HEREBY GIVEN that the 45th Annual General Meeting of LEADWAY ASSURANCE COMPANY LIMITED will convene at the Meeting Room, First Floor, Leadway House, 121/123, Funsho
stWilliams Avenue, Iponri, Surulere, Lagos on Thursday 1 June, 2017 at 11am for the following purposes:
Ordinary Business1. To adopt the reports of the directors and auditors, including the statement of accounts for
the year ended 31 December 2016.2. To declare a dividend.3. To re-elect Directors of the Company.4. To authorize the Directors to fix the auditor's remuneration.5. To transact any other business that may be transacted at an Annual General Meeting.
By Order of the Board
Sunday OrolekeCompany Secretary
Notes:1. A member entitled to attend and vote at the meeting may appoint a proxy (who need not be a member)
to attend and vote in his place. In order to be valid, an instrument appointing a proxy must be deposited at the Office of the Company Secretary at Leadway House, 121/123 Funsho Williams Avenue, Iponri, Surulere, Lagos, or at Leadway House, NN28/29, Constitution Road, Kaduna not later than 48 hours before the time appointed for the meeting.
2. The Register of Members and their shareholding is available for inspection, at the office of the Company Secretary during normal business hours, from the date of this notice until close of business on 25th of May, 2017.
RC 7588

9www.leadway.comAnnual Report & Accounts 2016
Business ReviewIn this section:
The chairman's reflections on the year, and a summary Of the corporate profile.
Chairman’s Statement..............................................Corporate Profile......................................................
1014

CHAIRMAN’S STATEMENT
Distinguished Shareholders, Members of the Board of Directors, Ladies and Gentlemen, I am very pleased to welcome you to the 45th Annual General Meeting of our company, and to present to you our financial statements and reports for the year ended 31 December 2016.
Gen. Mar tin Luther AgwaiC H A I R M A N
www.leadway.comAnnual Report & Accounts 201610
Southern part of the country witnessed renewed attacks on oil installations and restiveness by the Niger Delta Militants, which all compounded the challenges for the already stressed Nigerian economy. The impact of the monetary policy responses to these economic shocks are believed to have been mixed. With the various challenges within the year, the data released by the National
OPERATING ENVIRONMENTThe operating environment in the year 2016 was significantly impacted by the recessionary state of the economy which was itself caused by decline in government revenue, shortage of inflow of major foreign currencies into the economy, rise in interest rates, inflation etc. While the terrorism in most parts of the Northern Nigeria abated, the South-
RC 7588

“”
Notwithstanding the depressed economic environment, investment income increased by 27% from N9.9billion in 2015 to N12.9billion in 2016. In addition, the company recorded significant income from foreign exchange gains following the devaluation of the Naira.
11www.leadway.comAnnual Report & Accounts 2016
of the economic recession as purchasing power for personal and commercial customers with attendant impact on premium income without corresponding reduction in claims, thereby compelling insurance operators to grapple for market share within weakening insurance penetration rate The efforts of the National Insurance Commission at reinforcing standards has been commendable with the release of the draft roadmap for transition to Risk Based Insurance Solvency regime in Nigeria. With the proposed migration from the capital regime to the Economic Capital Module, insurance operators would assume the level of exposure that corresponds to their capital outlay and posit their solvency levels.The steady growth of the insurance industry was slightly impaired in 2016 due to the impasse between the insurance and bank regulators on the bancassurance model of sale of insurance as both regulators failed to reach a consensus on the framework for the referral model adopted by the CBN. A similar impasse was experienced between the insurance and pension regulators with the Pension Commission seeking to enforce the law and ensure that Pension Funds and Assets (annuity inclusive) are held with a Pension Fund Custodian, thereby halting the sale of annuity for a few months.With a quick resolution to the lingering regulatory challenges, the Nigerian insurance industry can, notwithstanding the c hal lenging operating environment, channel its efforts towards insurance penetration, contribute significantly to the GDP and focus on attaining the standard and rating of global insurance industries.
FINANCIAL RESULTSThe company recorded a 13% increase in Gross Premium Written from N46.6billion in 2015 to N52.7billion in 2016, this is largely attributable to the significant increase in premiums written under annuity
Bureau of Statistics showed that the Real Gross Domestic Product (GDP) contracted by -1.51% compared to +2.79% in 2015. The major driver of the economy, though with a depressed performance, was the non-oil sector which recorded a -0.33% decline in real terms compared with the +3.14% recorded in 2015. This was credited to the significant downward contribution in Manufacturing, Construction and Trade activities, though moderated by the continued growth in Agriculture. The data obtained from the National Bureau of Statistics (NBS) indicated that Nigeria's inflation rate increased from +9.6% in the preceding year to +18.55% in the year 2016 due to import inflation and rising food costs as incidences of insurgency and drought continued to ravage Nigeria's North Eastern plains. The various measures by the Central Bank of Nigeria (CBN) did not achieve much in tackling rising inflation.
Despite the prevailing economic challenges, the Nigerian All Share Index closed the year with a decline of -6.2% at 26,874 compared with 28,642 recorded in 2015 with all sectors and indices closing negative with the exception of the NSE Banking index, due to the uncertainly of foreign exchange availability and the ambiguity of the various monetary policies. Notwithstanding the harsh operating environment, the country recorded some positive developments which included the implementation of Treasury Single Account System thereby providing a clear status of the revenue of the Federal Government and potentially plugging leakages, the anti-corruption war of the Federal Government and successes recorded by the Nigerian Army over the terrorism that plagued the Northern part of the country.
INSURANCE INDUSTRYThe insurance industry was not immune from the impact

www.leadway.comAnnual Report & Accounts 201612
Chairman’s Statement
Gen. Mar tin Luther AgwaiC H A I R M A N
scenario, your company will remain alert to opportunities to take advantage of the next wave of growth by tooling to achieve operational nimbleness and efficiencies. We will garner the collective ideas of the new age and preserve the experience of the old to remain a competitive brand of repute in our industry and able partner to all of our stakeholders. Following the retirement of Mallam Umar Yahaya, Dr. Konyinsola Ajayi and Dr. A.B.C. Orjiako in compliance with the 2009 NAICOM Code of Good Corporate Governance, the Board gained three seasoned men of proven integrity to fill the vacancy created by the retirement of the erstwhile directors. General (retired) Martin Luther Agwai was appointed a Non-
rdExecutive Director effective 3 August 2016 and thsubsequently, Chairman effective 10 November
2016 while Mr. Odein Ajumogobia and Mr. Seyi Bickersteth were appointed Non-Executive Directors
steffective 1 January 2017. Their appointments will be presented to shareholders for ratification in the course of the meeting.
CONCLUSIONWe are consistently inspired by the doggedness, unflinching support and patronage of our revered customers, brokers, agents and other stakeholders. We thank you for your unsullied loyalty and pledge our improved services to your contentment.I also express my special appreciation to the creativity, prudence, diligence, dedication and teamwork of our management and staff in the effective running of your company's affairs. I am confident that your company will continually succeed in its aspirations. I thank you all for trusting us to serve you.
business. The Net underwriting income slightly increased by 3% from N39.9billion in 2015 to N41.2billion in 2016, mainly due to the prior year's premium written earned in the current year.There was a significant increase in claims expenses in 2016 by 61% from N14.3billion in 2015 to N23.0billion in 2016. This came largely from increase in reserves held for our Specialty lines. In addition, translation of dollar-denominated reserves for outstanding claims in General Insurance Specialty line increased the claims incurred position together with increase in annuity reserves. Overall, the business recorded improvement in underwriting profit from a loss position of (N12.9billion) in 2015 to N10.2billion in 2016. The improvement came largely from positive movements in transfer to Life funds and reduced yield in annuity investment. Notwi th s tand ing the depressed economic environment, investment income increased by 27% from N9.9billion in 2015 to N12.9billion in 2016. In addition, the company recorded significant income from foreign exchange gains following the devaluation of the Naira. The overall performance of the Company after tax increased marginally by 4% from N6.3billion in 2015 to N6.6billion in 2016.The Company's assets grew by 21% from N137.3billion in 2015 to N166billion in 2016 following significant investment in bonds as well as gains recorded in foreign currency translation.
DIVIDENDIn fulfilment of our undertaking to ensure competitive returns to our distinguished shareholders for their equity investments in the company, your board recommends a dividend of N1.5billion which translates to 16 kobo per share subject to withholding tax at the prevailing rate.
FUTURE OUTLOOK We join others in being hopeful that the country will emerge from recession in 2017. However, the economic conditions would still feel recessionary because of prospects for weak growth. Under this
RC 7588

13www.leadway.comAnnual Report & Accounts 2016
Insuring happiness since 1970

Mallam Umar Yahaya Chairman (Retired 31 March, 2016) Gen. Martin Luther Agwai Chairman (Appointed 10 November, 2016) Mr. Oye Hassan-Odukale Managing Director Mr. Tunde Hassan-Odukale Executive Director Ms. Adetola Adegbayi Executive Director Mr. Jeremy Rowse Non-Executive Director Dr. Konyinsola Ajayi Non-Executive Director (Retired 31 March, 2016) Dr. A.B.C Orjiako Non-Executive Director (Retired 31 March, 2016) Mrs. Mowunmi Sotubo Non-Executive Director Mr. Eugene Curley Non-Executive Director Mr. Seyi Bickersteth Non-Executive Director (Appointed 1 January, 2017) Mr. Odein Ajumogobia Non-Executive Director (Appointed 1 January, 2017)
Directors
Company secretary: Sunday Oroleke FRC/2014/NBA/00000007297
Registered Office: NN 28/29 Constitution Road, Kaduna State, Nigeria
Auditors: PricewaterhouseCoopers Chartered AccountantsLandmark Towers5B, Water Corporation Road, OniruVictoria Island, LagosTel: (01) 2711700www.pwc.com/ng
Bankers: Access Bank PlcCitibank Nigeria Limited Diamond Bank PlcFBN Bank (Uk) Limited Fidelity Bank PlcFirst Bank of Nigeria LimitedFirst City Monument Bank Limited FSDH Merchant Bank Nigeria Limited Guaranty Trust Bank PlcKeystone Bank Nigeria Limited Mainstreet Bank Limited
Stanbic IBTC Bank PlcStandard Chartered Bank Nigeria Limited Sterling Bank PlcUnion Bank PlcUnited Bank of Africa Plc Wema Bank PlcZenith bank Plc
Reinsurers African Reinsurance CorporationContinental Reinsurance Plc WAICA ReinsuranceHannover Reinsurance Company Limited Munich Reinsurance of Africa Limited Swiss Reinsurance Africa LimitedAIG Europe Kiln Syndicate Ace Global
Actuaries HR Nigeria LimitedFRC/NAS/00000000738
Estate Surveyor and Valuer Diya Fatimilehin & Co.FRC/2013/NIESV/00000002773
Bankers and other professional advisors
Certificate of Incorporation NumberRC 7588
Date Of Incorporation22 September 1970
NAICOM License NumberRIC-025
Corporate Profile
www.leadway.comAnnual Report & Accounts 201614
RC 7588

15www.leadway.comAnnual Report & Accounts 2016
GovernanceIn this section:
The governance framework, including the role and effectiveness of the Board and the alignment of the interests of management with long term value creation.
The biggest determinant in our lives is culture, where we are born, what the environment
looks like. But the second biggest determinant is probably governance, good governance or
a certain kind of governance makes a huge difference in our lives.
Nicolas Berggruen
Board of Directors..................................................Directors’ Report.....................................................Statement of Directors’ Responsibilities.............Corporate Governance Report...........................Complaint Channels...............................................Management’s Discussion and Analysis..............Independent Auditors’ Report..............................Company information and Summary of Significant Accounting Policies..............................
16202324262830
33

BOARD OF DIRECTORS
Ÿ Director, First Bank of Nigeria Plc.
Ÿ Member, Royal Society of Mathematics and the
Institute of Actuaries
Ÿ Alumnus, University of London
Ÿ Alumnus, City University, London
Ÿ Alumnus, Harvard Business School, USA
Ÿ Former Director, Stanbic IBTC Bank Plc.
Ÿ Former Director, Union Assurance
Ÿ Visiting Professor, African Leadership Center,
London
Ÿ Former Chief of Army Staff, Nigerian Army.
Ÿ Former Chief of Defense Staff, Nigerian Army.
Ÿ Former Chairman, Subsidy Reinvestment
Programme.
Ÿ Alumnus, National Defense University,
Washington DC, USA
Ÿ Alumnus, Administrative Staff College of Nigeria
Ÿ Member, Executive Committee of the African Insurance
Organization
Ÿ Past Chairman, Nigerian Insurers Association
Ÿ Former Member, Federal Government of Nigeria’s
Committee for the review of Insurance Laws.
Ÿ Munich Re Fellow, Georgia State University
Ÿ Alumnus, University of Houston, Texas USA
Ÿ Alumnus, Harvard Business School, USA
RC 7588
www.leadway.comAnnual Report & Accounts 201616
Mr. Tunde Hassan-OdukaleE X E C U T I V E D I R E C T O R
Mr. Oye Hassan-Odukale, mfrC H I E F E X E C U T I V E O F F I C E R
Gen. Martin Luther AgwaiC H A I R M A N

17www.leadway.comAnnual Report & Accounts 2016
Ms. Adetola AdegbayiE X E C U T I V E D I R E C T O R
Mrs. Mowunmi SotuboN O N - E X E C U T I V E D I R E C T O R
Ÿ Director, Leadway Hotels Limited
Ÿ Alumnus, University of Bristol
Ÿ Alumnus , University of South Wales.
Ÿ Associate, Chartered Insurance Institute, London
Ÿ Associate, Chartered Institute of Arbitrators, UK.
Ÿ Director, Santam South Africa
Ÿ Former Chief Executive, African Life Assurance,
Johannesburg, South Africa
Ÿ Former Member, Board of the Life Offices Association of
South Africa
Ÿ Former Member, Ghana Investment Advisory Council
Ÿ Alumnus, Rhodes University South Africa
Ÿ Alumnus, University of Cape Town, South Africa
Ÿ Director, Leadway Properties and Investment Limited
Ÿ Managing Director, Sables Nigeria Limited
Ÿ Alumnus, Ahmadu Bello University, Zaria.
Mr. Jeremy RowseN O N - E X E C U T I V E D I R E C T O R

www.leadway.comAnnual Report & Accounts 201618
BOARD OF DIRECTORS
Mr. Eugene CurleyN O N - E X E C U T I V E D I R E C T O R
BOARD OF DIRECTORS
Ÿ Former Attorney General and Commissioner of Justice,
Rivers State.
Ÿ Former Minister of State for Petroleum Resources.
Ÿ Former Minister of Foreign Affairs
Ÿ Member, Nigerian Bar Association
Ÿ Alumnus, Harvard Law School Massachusetts.
Ÿ Fellow, Chartered Institute of Arbitrators (FCI) Arb
London
Ÿ Director, Nigeria-South Africa Chamber of Commerce.
Ÿ Director, Nigerian Economic Summit Group
Ÿ Former National Senior Partner, KPMG Nigeria
Ÿ Former Chairman KPMG Africa
Ÿ Alumnus, York University, Canada.
Ÿ Fellow, Institute of Chartered Accountants of Nigeria
(FCA).
Ÿ Managing Director, CTF Solutions, UK
Ÿ Former UK Diplomat
RC 7588
Mr. Oluseyi BickerstethN O N - E X E C U T I V E D I R E C T O R
Mr. Odein AjumogobiaN O N - E X E C U T I V E D I R E C T O R

19www.leadway.comAnnual Report & Accounts 2016

www.leadway.comAnnual Report & Accounts 201620
RC 7588
Directors' ReportFor the year ended 31 December 2016
The directors have pleasure in presenting their annual report on the affairs of Leadway Assurance Company Limited ("the Company") and subsidiary companies ("the Group") together with the audited financial statements and the auditor's report for the year ended 31 December 2016.
Legal form and principal activityThe Company was incorporated as a private limited liability company in September 1970. It obtained a license to operate as an insurance company in January 1971 and commenced business in January 1971.
The Company is principally engaged in the business of providing risk underwriting and related financial services to its customers. Such services include provision of life and non-life business insurance services to both corporate and individual customers.
Subsidiary CompaniesThe Company holds 53% shareholding in Leadway Capital and Trust Limited, 51.2% in Leadway Hotels Limited, 75% in Leadway Properties and Investments Limited and 71% shareholding in Leadway Pensure PFA Limited.
Operating ResultsThe highlights of the Group and Company's operating results for the year ended 31 December 2016 are as follows:
An examination of data and facts to uncover and understand cause-effect relationships, thus providing basis for problem solving and decision making.
Group31-Dec-16
Group 31-Dec-15
Company 31-Dec-16
Company 31-Dec-15
N’000 N’000 N’000 N’000Gross Premium Written 52,700,272 46,640,828 52,718,567 46,648,918Profit before tax Income tax expense
8,791,606 (1,206,754)
9,301,030 (413,974)
7,361,449 (699,492)
6,484,941 (105,012)
Appropriation of profit attributable to owners of the company
Transfer to:
- Contingency reserve 1,448,231 1,031,113 1,357,793 943,301
Profit for the year 7,584,852 8,887,056 6,661,957 6,379,929 Other Comprehensive Income
1,371,798
(1,243,922)
1,425,012
(1,187,527)
Total Comprehensive Income
8,956,650
7,643,134
8,086,969
5,192,402
Earnings per Share (kobo) – Basic/diluted 84 108 72 73
Profit attributable to: - Owners of the Company - Non – controlling interest
7,143,178 441,674
8,711,508 175,548
6,661,957 -
6,379,929 -
7,584,852 8,887,056 6,661,957 6,379,929
- Retained earnings
5,694,947
7,680,395
5,304,164
5,436,628
- 7,143,178 8,711,508 6,661,957 6,379,929

OVERVIEWBUSINESSREVIEW GOVERNANCE
GROUP FINANCIALSTATEMENTS APPENDIX
21www.leadway.comAnnual Report & Accounts 2016
Directors' ReportFor the year ended 31 December 2016
DividendsThe dividends paid in 2016 and 2015 were N1,000,000,000 (N11.39kobo per share) and N850,000,000 (10 kobo per share) respectively.
A dividend in respect of the year ended 31 December 2016 of N16.02kobo per share, amounting to a total dividend of N1.5 billion is to be proposed at the annual general meeting. These financial statements do not reflect this dividend payable.
Directors and their interestThe directors who held office, together with their direct and indirect interests in the Shares of the company, were as follows:
(Number of 50k ordinary shares held in thousands) Direct Indirect Direct Indirect 31-Dec-16 31-Dec-16 31-Dec-15 31-Dec-15 Gen. Martin Luther Agwai** Chairman - - - - Mallam Umar Yahaya* Chairman 2,506 - 2,495 - Mr. Oye Hassan-Odukale Managing Director 20,682 1,205,856 20,605 1,201,403 Mr. Tunde Hassan-Odukale Executive Director - 452,197 - 537,554 Ms. Adetola Adegbayi Executive Director 12,203 - 12,203 - Mr. Jeremy Rowse Non-Executive Director - - - - Dr. Konyinsola Ajayi* Non-Executive Director - 14,437 - 14,372 Dr. A.B.C. Orjiako** Non-Executive Director - - - - Mrs. Mowunmi Sotubo Non-Executive Director 291,673 - 290,404 - Mr. Eugene Curley*** Non-Executive Director - - - - Mr. Seyi Bickersteth** Non-Executive Director - - - -Mr. Odein Ajumogobia** Non-Executive Director - - - -
Retirement and Appointment of Directors* Having spent a cumulative period of nine years on the Board, three of our directors; Mallam Umar Yahaya (Chairman), Dr. Konyinsola Ajayi, and Dr. A.B.C. Orjiako retired as Non-Executive Directors with effect from 30th March 2016.
** Following the retirement of the Chairman, Mallam Umar Yahaya, the board of directors of the Company appointed Gen. Martin Luther Agwai (rtd) as the new Chairman of the Company with effect from 10th November 2016.
Mr. Seyi Bickersteth and Mr. Odein Ajumogobia were also appointed as Independent Non-Executive Directors effective 1st January 2017.
*** During the year, Swiss Re-Direct Investments Company Limited acquired 25% of the shares of Leadway Assurance Company Limited. Following this transaction, Mr. Eugene Curley was appointed as Director to represent Swiss Re's interest on the Board. The appointment took effect from 5th May 2016.
Analysis of ShareholdingThe analysis of the distribution of the shares of the Company is as follows:
31 December 2016 No of
Shareholders Percentage of shareholders
No of holdings (‘000)
Percentage of holdings
Share range
Above 400,000,000 5 11% 6,546,333 70% 200,000,001 - 400,000,000 6 15% 1,914,578 20% 100,000,001 - 200,000,000 2 5% 278,728 3% 50,000,001 - 100,000,000 6 15% 441,843 5% Below 50,000,000 Total 22 54% 183,418 2%Total 41 100% 9,364,900 100%
31 December 2015 No. of
Shareholders Percentage of shareholders
No. of holdings (‘000)
Percentage of holdings
Share range
Above 400,000,000 5 11% 5,413,196 62% 200,000,001 - 400,000,000 6 15% 1,895,645 21% 100,000,001 - 200,000,000 2 5% 277,940 3% 50,000,001 - 100,000,000 6 15% 441,219 5% Below 50,000,000 Total 22 54% 751,593 9%Total 41 100% 8,779,593 100%
Property and equipment
Information relating to changes in property and equipment is given in Note 13 to these financial statements.
www.leadway.comAnnual Report & Accounts 201622
RC 7588
Directors' ReportFor the year ended 31 December 2016
Employment of disabled personsThe Group operates a non-discriminatory policy in the consideration of applications for employment, including those received from disabled persons. The Group's policy is that the most qualified and experienced persons are recruited for appropriate job levels irrespective of an applicant's state of origin, ethnicity, religion or physical condition. In the event of any employee becoming disabled in the course of employment, the Group is in a position to arrange appropriate training to ensure the continuous employment of such a person without subjecting him/her to any disadvantage in his/her career development. Currently, the group has 1 person in its employment with a physical disability.
Health, safety, and welfare of employeesThe Group maintains business premises designed with a view to guaranteeing the safety and healthy living conditions of its employees and customers alike. Employees are adequately insured against occupational and other hazards.
Employee involvement and trainingThe Group encourages participation of employees in arriving at decisions in respect of matters affecting their well-being. Thus, the Group provides opportunities for employees to deliberate on issues affecting them, with a view to making inputs to decisions thereon. The Group places a high premium on the development of its manpower. Consequently, employees are sponsored for various training courses both locally and internationally.
Directors' interests in contractsIn accordance with section 277 of the Companies and Allied Matters Act of Nigeria, none of the directors has notified the Company of any declarable interest in contracts deliberated by the Company during the year (2015: Nil).
AuditorsMessrs PricewaterhouseCoopers has indicated their willingness to continue in office as auditors in compliance with section 357(2) of the Companies and Allied Matters Act of Nigeria.
BY ORDER OF THE BOARD
Sunday OrolekeFRC/2014/NBA/00000007297Company Secretary
121/123 Funso Williams AvenueIponriLagos
18 April 2017
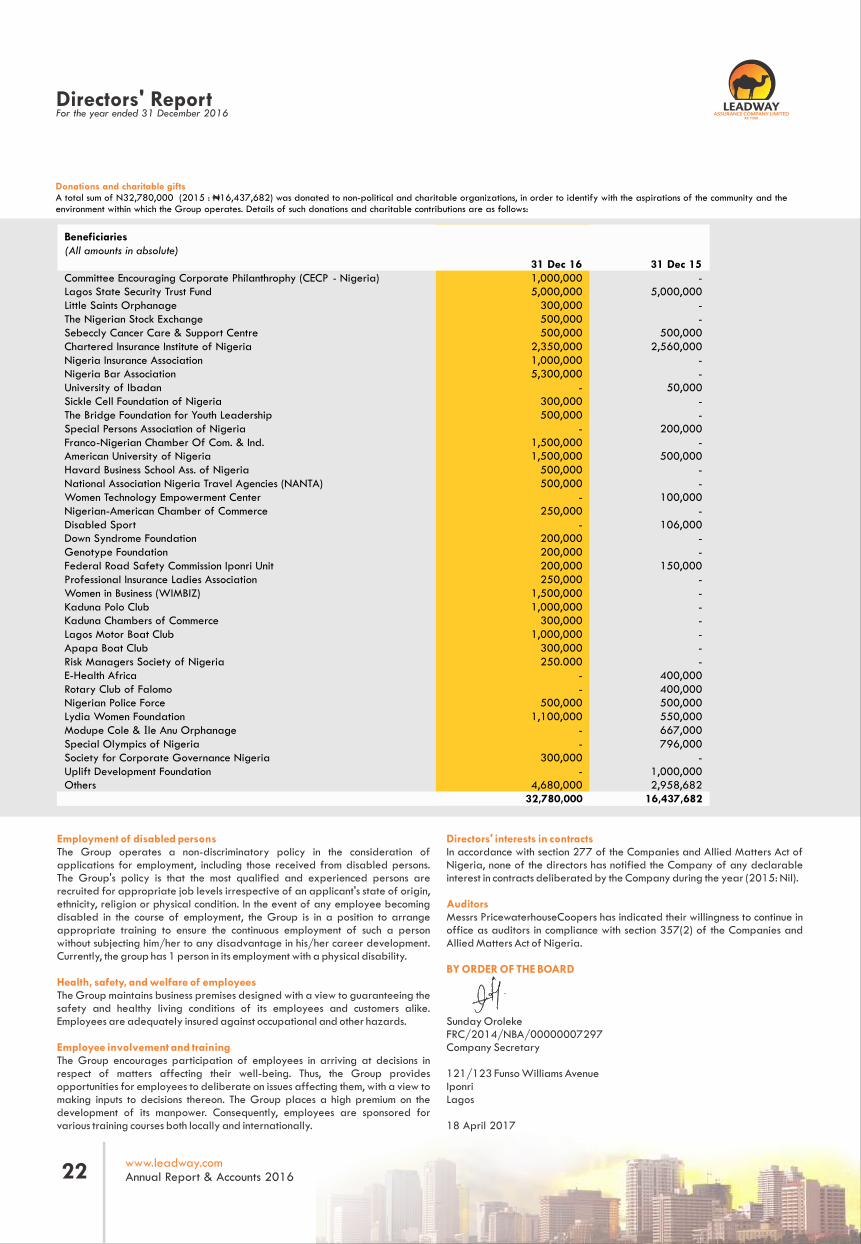
Committee Encouraging Corporate Philanthrophy (CECP - Nigeria) - Lagos State Security Trust Fund 5,000,000 Little Saints Orphanage - The Nigerian Stock Exchange - Sebeccly Cancer Care & Support Centre 500,000 Chartered Insurance Institute of Nigeria 2,560,000 Nigeria Insurance Association - Nigeria Bar Association - University of Ibadan 50,000 Sickle Cell Foundation of Nigeria - The Bridge Foundation for Youth Leadership - Special Persons Association of Nigeria 200,000 Franco-Nigerian Chamber Of Com. & Ind. - American University of Nigeria 500,000 Havard Business School Ass. of Nigeria - National Association Nigeria Travel Agencies (NANTA) - Women Technology Empowerment Center 100,000 Nigerian-American Chamber of Commerce - Disabled Sport 106,000 Down Syndrome Foundation - Genotype Foundation - Federal Road Safety Commission Iponri Unit 150,000 Professional Insurance Ladies Association - Women in Business (WIMBIZ) - Kaduna Polo Club - Kaduna Chambers of Commerce - Lagos Motor Boat Club - Apapa Boat Club - Risk Managers Society of Nigeria - E-Health Africa 400,000 Rotary Club of Falomo 400,000 Nigerian Police Force 500,000 Lydia Women Foundation 550,000 Modupe Cole & Ile Anu Orphanage 667,000 Special Olympics of Nigeria 796,000 Society for Corporate Governance Nigeria - Uplift Development Foundation 1,000,000 Others 2,958,682
1,000,000 5,000,000
300,000 500,000 500,000
2,350,000 1,000,000 5,300,000
- 300,000 500,000
- 1,500,000 1,500,000
500,000 500,000
- 250,000
- 200,000 200,000 200,000 250,000
1,500,000 1,000,000
300,000 1,000,000
300,000 250.000
- -
500,000 1,100,000
- -
300,000 -
4,680,000
Beneficiaries(All amounts in absolute)
31 Dec 1531 Dec 16
16,437,682
32,780,000
Donations and charitable giftsA total sum of N32,780,000 (2015 : N16,437,682) was donated to non-political and charitable organizations, in order to identify with the aspirations of the community and the environment within which the Group operates. Details of such donations and charitable contributions are as follows:

OVERVIEWBUSINESSREVIEW GOVERNANCE
GROUP FINANCIALSTATEMENTS APPENDIX
23www.leadway.comAnnual Report & Accounts 2016
Statement of Directors' Responsibilities in relation to the consolidated and separate financial statements for the year ended 31 December 2016
The directors accept responsibility for the preparation of the consolidated and separate financial statement that give a true and fair view of the statement of affairs of the Group and Company at the reporting date and of its comprehensive income in the manner required by the Companies and Allied Matters Act of Nigeria and the Insurance Act of Nigeria. The responsibilities include ensuring that the Group:
- Keeps proper accounting records that disclose, with reasonable accuracy, the financial position of the Group and comply with the requirements of the Companies and Allied Matters Act and the Insurance Act;
- Establishes adequate internal controls to safeguard its assets and to prevent and detect fraud and other irregularities; and
- Prepares its financial statements using suitable accounting policies supported by reasonable and prudent judgments and estimates, that are consistently applied.
- The directors accept responsibility for the financial statements, which have been prepared using appropriate accounting policies supported by reasonable and prudent judgments and estimates, in compliance with,
- International Financial Reporting Standards (IFRS) as issued by the International Accounting Standards Board (IASB);
- The requirements of the Insurance Act; relevant guidelines and circulars issued by the National Insurance Commission (NAICOM); and
- The requirements of the Companies and Allied Matters Act; and
- Financial Reporting Council of Nigeria Act.
The directors further accept responsibility for the maintenance of accounting records that may be relied upon in the preparation of the financial statements, as well as adequate systems of internal financial control.
The directors have made assessment of the Group's ability to continue as a going concern and have no reason to believe that the Group will not remain a going concern in the year ahead.
Statement of Directors’ ResponsibilitiesFor the year ended 31 December 2016
_____________________________________Mr. Oye Hassan-Odukale Managing DirectorFRC/2013/IODN/0000000196318 April 2017
________________________________Ms. Adetola AdegbayiExecutive DirectorFRC/2013/CIIN/0000000207118 April 2017
SIGNED ON BEHALF OF THE DIRECTORS BY:

www.leadway.comAnnual Report & Accounts 201624
RC 7588
Corporate Governance ReportFor the year ended 31 December 2016
IntroductionLeadway Assurance Company Limited Group is committed to adhering to high standards of good corporate governance at all levels of its operations. The Board of Directors has continued to ensure the implementation of corporate governance principles that guarantee fairness, accountability and transparency in all its dealing within and outside the Company and its subsidiaries. Leadway complies with all laws, regulations, rules, and guidelines, applicable to the insurance business, including the Code of Business Ethics and Principles on Good Corporate Governance issued by the National Insurance Commission (NAICOM).
Board structureThe Board of Leadway comprises a total of seven directors as at 31 December 2016. This includes the Chairman, (who is a Non-Executive Director), the Managing Director, two Executive Directors and three Non-Executive Directors. The members of the Board are reliable, skilled and experienced. Their level of expertise has manifested in the high quality of management policies formulated over the years.
Board responsibilityThe Board is saddled with the responsibility of making policies for the company, reviewing corporate performance, monitoring strategic decisions while ensuring regulatory compliance, safeguarding shareholders' interest and fulfilling the expectations of stakeholders. The Board met five times in the last financial year and through their leadership, the company was able to achieve its set objectives. The record of the attendance is provided below:
Meetings Held 1 2 3 4 5 Names 4th February
2016 30th March,
2016 5th May,
2016 3rd August,
2016 10th November,
2016 Mr. Oye Hassan-Odukale Mr. Tunde Hassan-Odukale Mallam Umar Yahaya * NLD NLD NLDDr. Konyinsola Ajayi NLD NLD NLDMr. Jeremy Rowse Mrs. Mowunmi Sotubo *Ms. Adetola AdegbayiDr. A.B.C. Orjiako NLD NLD NLD Mr. Eugene Curley NYA NYA Gen. Martin Luther Agwai (rtd) NYA NYA NYA *
Separation of role of Chairman from the Managing DirectorThe way and manner the company structured the roles of the Chairman and the Managing Director has assisted in averting overlaps of roles. The Chairman who is first among equals is responsible for the overall leadership of the Board and for creating an enabling environment for the effectiveness of individual directors, while the Managing Director is responsible for the day-to-day running of the company to achieve overall efficiency of management controls. This is done in accordance with the NAICOM's guidelines on Code of Good Corporate Governance for Insurance Industry.
Tenure of DirectorsThe tenure of each of the company's non-executive director is for a defined period. A non-executive director can be re-elected for additional terms subject to satisfactory performance and approval by the shareholders. Over the years, the board has observed well-defined appointment process for the appointment of new directors.
Conflict of interestTo maintain high ethical standards for the conduct of its business, the company ensures that each director and employee discloses to the board his/her interest in any other company within the insurance industry and in position where their self-interests conflict with their duty to act in the best interest of the company.
Committees of the boardThe Board committees have been engineered to ensure proper coordination and effectiveness and these committees are saddled with responsibilities which are aimed at enhancing the operations of the company. Over the years, the committees have rendered immense assistance to the board through regular reporting. Below are the committees and their roles:
a. Enterprise Risk Management and Technical Committee:This committee monitors risk, risk responses and activities. It also oversees the group risk management and effectiveness of technical controls and reports. In recent times, the committee has assisted the board in the monitoring of the quality, integrity, and reliability of the risk management process. It comprises five directors with three as Non-Executive Directors. The committee is chaired by a Non-Executive Director and held four meetings in 2016:
- 2 February 2016- 5 May 2016- 1 August 2016- 8 November 2016
Key:
Present * Apology NLD - No Longer A Director NYA - Not Yet

OVERVIEWBUSINESSREVIEW GOVERNANCE
GROUP FINANCIALSTATEMENTS APPENDIX
25www.leadway.comAnnual Report & Accounts 2016
Directors' ReportFor the year ended 31 December 2016
b. Finance, Investment and General Purpose Committee:This committee is saddled with the responsibility of assisting the Board in its financial oversight functions. It assists in the periodic review of management accounts, corporate finance, investment portfolio performance assessment, budgeting and budgetary control, capital investment appraisal and compliance with relevant accounting standards. It consists of 4 directors with two as non-executives directors. One of the non-executives is the chairman. The Committee had four meetings in 2016:
- 2 February 2016- 4 May 2016- 2 August 2016- 9 November 2016
c. Audit and Compliance Committee: The membership of this committee includes two non-executive directors, one of which is the chairman. Over the years, the committee has made significant impact in the review of financial statements and internal audit work plan. It serves as a bridge between the board and external auditors as it takes delivery of audit reports and other statements from the external auditors. The Committee had two meetings in 2016:
- 3 February 2016- 4 May 2016
d. Nomination and Remuneration Committee:The membership of this committee includes two non-executive directors, one of which is the chairman. Its responsibility includes identifying and nominating for approval candidates to fill board vacancies, constitution of board committees or change of its terms of reference, review of the structure, size, and composition of the Board, consideration of succession planning, board performance evaluation and the remuneration of the board.
- 10 November 2016
Relationship with ShareholdersThe company has adopted an efficient accounting reporting system which is aimed at achieving transparency. This has helped in keeping the shareholders in the know of the effectiveness of the enterprise and the future prospects. This singular act has over time reinvigorated the confidence the shareholders have in the company.
Social responsibilityThe company has impacted tremendously on the lives of the less privileged in the society through its corporate social responsibility. It has provided support in education, health and community welfare, to mention but a few.

IntroductionLeadway Assurance Company Limited considers clients and customers as important stakeholders in its business. One of our main selling points at Leadway Assurance Company Limited over the years has been our excellent customer service. We therefore consider customers' feedback as a necessary and important factor in our drive to always treat customers fairly.
Complaints ChannelWe have provided various channels for customers to provide feedback on our products and services. These platforms include:
• Our Leadway Assurance Company Limited Customer Service front desks, corporate office and designated branches for walk in customers• Complaint e-mail channel; [email protected]• Our Leadway Assurance Company Limited hotline; 01-2700700, 01-2800700• Our website platform; www.leadway.com• Correspondence from customers; [email protected]• Social media - Facebook - www.facebook.com/LeadwayAssurance/ - Twitter - @LeadwayInsure - Google Plus - Plus.google.com/+LeadwayAssurance - Linkedin - www.linkedin.com/company/leadway-assurance-co--ltd
Resolution MechanismAt Leadway Assurance Company Limited, we have put in place a standard system to ensure that customers' feedback are received and promptly resolved. For this purpose, we have a dedicated Customer Service Department (CSD) which is responsible for the prompt investigation and resolution of customers’ complaints within the approved period. The Customer Service Department liaises with other units within the organization and ensures that customers' complaints are satisfactorily resolved.
Customers' complaints are stream-lined based on the type of complaints to provide an enabling environment for proper monitoring, proper documentation and effective feedback process of received complaints.
The process flow of customer complaint and resolution is as follows:
· The customer care officer acknowledges and attends to the various customers' complaints.· The complaint is reviewed and it is determined if the complaint could be resolved at first-level.· Where the complaint can be resolved at the first level, a resolution is immediately provided to the customer.· If such complaint cannot be resolved at the first level, the customer care officer creates a case on our Dynamics CRM (Customer Relationship Management)
application. This will in turn generate a Case ID number for escalation and tracking of the case to resolution.· Customer Care Officer forwards and follow-up on the complaint with the appropriate unit in the organization to handle.· Upon resolution, the customer is contacted and the resolution is explained to the customer.· The case is closed and marked as resolved.
In addition to our present process, we are currently building a more robust CRM to adequately manage all complaints and to give the best response time in this area of our services.
Customer’s opinion on productsTo enrich our customers experience we also periodically evaluate public/customer opinion about our services, products, and policies. The evaluation is conducted in various ways including:
· One-on-one focus meetings with key customers· Interviews with selected customers· Online Customer Feedback Survey and Questionnaires administered to customers
This is to afford our organization the opportunity of receiving customers' perception about the company, in order to ensure that efforts can be put in place to close such gap(s) in our service delivery or improve upon the process, service or product.
Feedback on Customer’s Complaints to Leadway AssuranceFeedback on customers' complaints is provided to Management and other relevant Units in the organization.
The feedback gathered ensures that:
· Leadway Assurance Company Limited retains her customers as customers feel appreciated and respected,· The quality service delivered at Leadway Assurance Company Limited is maintained and made uniform across board.· A reliable source of identifying improvement opportunities is presented to management.· A reliable source of data on customers' complaints and expectations is collated.
The feedbacks are circulated to management staff through the company's internal information channel for the general information of all staff.
Complaints and FeedbackFor the year ended 31 December 2016
www.leadway.comAnnual Report & Accounts 201626
RC 7588

Month Complaints received during the year
Number of complaints resolved
Number Complaints unresolved
Number of unresolved
complained with SLA*
January 27 27 - - February 13 13 - - March 18 18 - - April 10 10 - - May 20 20 - - June 39 39 - - July 17 17 - - August 14 14 - - September 7 7 - - October 5 5 - - November 3 3 - - December 3 3 - - 176 176 - - * Service Level Agreements
Report of complaints received and resolved by the organization between January-December 2016.
Complaints not resolved within the turnaround time, can be attributed mainly to the unavailability of these customers either via mail or phone call after resolution of their complaint but all complaints are usually treated within 24hrs (depending on the source of the error).
OVERVIEWBUSINESSREVIEW GOVERNANCE
GROUP FINANCIALSTATEMENTS APPENDIX
27www.leadway.comAnnual Report & Accounts 2016

www.leadway.comAnnual Report & Accounts 201628
RC 7588
Leadway Group is made up of Leadway Assurance Company Limited, (parent company) and 4 subsidiaries. The group is registered and incorporated in Nigeria and its major business activities are: Insurance risk underwriting provisions of leisure and trusteeship services, and asset, pension, and fund management services to corporate, retail sector and individuals in Nigeria. The Group is also established and run in such a way that it will become the biggest insurance company in Nigeria with future outlook to expand to other part of African countries.
Part of the Group's strategy is also to use technology and international best practice to provide its customers with tailor-made solutions, superior services and specially designed programs to assist its patrons through a network of regional and agency offices spread all over Nigeria.
This 'Management Discussion and Analysis’ (MD&A) has been prepared as at December 31, 2016 and should be read in conjunction with the consolidated financial statement account of Leadway Assurance Company Limited and subsidiary companies.
Forward Looking StatementsThe MD&A contains factual statements relating to Leadway Assurance Company Limited Group's financial and other projections, expected future plans, event, financial and operating results, objectives and performance as well as underlying assumptions all of which involve risk and uncertainties.
These statements reflect management's current belief and are based on information available to Leadway Assurance Company Limited and are subject to certain risk, uncertainties, and assumptions.
Business Strategy of the Company and Overall PerformanceThe Strategy of the Company remains a series of measures, initiatives, and target aimed at profitable growth and market leadership across our businesses. We will aspire to maintain market leadership in corporate businesses while aggressively investing to take advantage of emerging opportunities in retail, as the future of insurance in Nigeria.
Our focus for 2016 - 2017 will be to continue to deliver on the series of initiatives and actions - that we have identified in prior years and to which we continue to tweak for relevance - that we anticipate will take us to the goals we have set.
For the year ended 31 December 2016Management's Discussion and Analysis
Performance ratios (based on Gross Written Premium)
% % % %
10 11 10 11 44 31 26 18 11 11 8 7 64 52 43 36 20 (28) 20 (28)
Underwriting expenses ratio Claims ratio Operating expenses ratio Combined ratio Underwriting profit ratio Profitability ratio 17 20 14 14
Performance ratios (based on Net Written Premium)% % % %
12 12 12 12 33 21 33 21 14 12 10 9 58 46 55 42
Underwriting expenses ratio Claims ratio Operating expenses ratio Combined ratio Underwriting profit ratio Profitability ratio
26 (33) 26 (33) 21 23 18 16 The Group experienced a growth of 13% in Gross written premium 3% in net premium when compared to prior year result.
The major growth recorded came from annuity business.
Financial Performance
Gross PremiumNet PremiumTotal Underwriting IncomeInvestment IncomeClaims expensesAnnuity ClaimUnderwriting expensesUnderwriting ProfitOperating expensesProfit before tax
Earnings per share
52,700,272 46,640,828 13% 52,718,567 46,648,918 13%41,256,760 39,939,075 3% 41,275,055 39,947,166 3%43,110,613 40,845,569 6% 43,128,908 40,853,660 6%10,762,301 12,210,264 -12% 10,490,455 9,955,505 5%13,464,887 8,324,568 -62% 13,465,180 8,324,918 -62%
9,597,747 6,039,540 -59% 9,597,747 6,039,540 -59%5,041,651 4,956,757 -2% 5,041,651 4,956,757 -2%
10,534,358 (12,992,951) 181% 10,552,360 (12,992,951) 181%5,628,190 4,929,240 -14% 4,286,250 3,495,726 -23%8,791,606 9,301,030 -5% 7,361,449 6,484,941 14%
83kobo 108kobo 66kobo 73kobo
Group Company31-Dec-16 31-Dec-15 % change 31-Dec-16 31-Dec-15 % change

OVERVIEWBUSINESSREVIEW GOVERNANCE
GROUP FINANCIALSTATEMENTS APPENDIX
29www.leadway.comAnnual Report & Accounts 2016
Revenue and Underwriting ResultThe increase recorded in the Group's earned income for the year positively impacted the net premium performance with the line posting 3% growth when compared with prior year performance. The Group paid out N23.1billion in claims and insurance benefits, an increase of 61% over previous year's payout. The claims ratio was a bit high for the period under review at 44% of Gross premium compared with 31% in prior year. The increase came largely from annuity payments to annuitants as well as higher claims paid on some non-life policies.
The underwriting result at the end of the year amounted to a N10.1billion profit when compared to a loss of N12.9billion recorded in the prior year ended December 2015.
Investment IncomeInvestment income for the year amounted to N12.9 billion, while prior year stood at N12.2 billion which translates to an increase of 6% when compared with prior year. Investment Income continues to play an important part in our income strategy.
Operating ExpensesThe Group Total Operating expenses for the year stood at N6billion as against N4.9 billion in the prior year. This represents an increase of 23%.
Foreign exchange revaluation gainThe extraordinary impacts of exchange rate were driven by macro events in the economy. This resulted in exchange gains moving up significantly as stated in the financial statements, while at the same time, liabilities denominated in foreign currencies were also translated at the closing rate to reflect a conservative position of these liabilities thus reducing the impact of exchange gains on the bottom line in the financial statements. The foreign currencies liabilities are well- matched as the assets supporting them were also held in foreign currencies as at 31st December 2016.
Similarly, bond yields also moved up from 11.16% in 2015 to 15.28% in 2016 thereby producing lower valuation and higher fair value loss in the accounts due to inverse relationship between bond yield and value. However, the impact of fair value loss was adjusted against the carrying value for our Life Business Insurance funds to reflect the lower value.
For the year ended 31 December 2016Management's Discussion and Analysis

PricewaterhouseCoopers Chartered Accountants, Landmark Towers, 5B Water Corporation Road, Victoria Island, Lagos, Nigeria
Independent auditor’s reportTo the Members of Leadway Assurance Company Limited
Report on the audit of the consolidated and separate financial statementsOur opinionIn our opinion, the consolidated financial statements give a true and fair view of the consolidated and Separate financial position of Leadway Assurance Company Limited ("the company") and its subsidiaries (together "the group") as at 31 December 2016, and of their consolidated and separate financial performance and their consolidated and separate cash flows for the year then ended in accordance with International Financial Reporting Standards and the requirements of the Companies and Allied Matters Act, the NigerianInsurance Act and the Financial Reporting Council of Nigeria Act.
What we havve audited
Leadway Assurance Company Limited's consolidated and separate financial statements comprise:
the consolidated and separate statements of financial position as at 31 December 2016;the consolidated and separate statements of comprehensive income for the year then ended;the consolidated and separate statements of changes in equity for the year ended;the consolidated and separate statements of cash flows for the year then ended; andthe notes to the consolidated and separate financial statements, which include a summary of significant accounting policies.
Basis for opinionWe conducted our audit in accordance with International Standards on Auditing (ISAs). Our responsibilities under those standards are further described in the Auditor's responsibilities for the audit of the consolidated and consolidated financial statements section of our report.
We believe that the audit evidence we have obtained is sufficient and appropriate to provide a basis for our opinion.
IndependenceWe are independent of the Group in accordance with the International Ethics Standards Board for Accountants' Code of Ethics for Professional Accountants (IESBA Code). We have fulfilled our other ethical responsibilities in accordance with the IESBA Code.
Other informationThe directors are responsible for the other information. The other information comprises the Directors Report, Corporate Governance Report, Statement of Directors' Responsibilities, Statement of Value Added and Five Year Financial Summary (but does not include the consolidated and separate financial statements and our auditor's report thereon), which we obtained prior to the date of this auditor's report, and the Group'scomplete Annual report and Chairman's Statement, which are expected to be made available to us after that date.
Our opinion on the consolidated and separate financial statements does not cover the other information and we do not and will not express any form of assurance conclusion thereon.
RC 7588
www.leadway.comAnnual Report & Accounts 201630

In connection with our audit of the consolidated and separate financial statements, our responsibility is to read the other information identified above and, in doing so, consider whether the other information isMaterially inconsistent with the consolidated and separate financial statements or our knowledge obtained in the audit, or otherwise appears to be materially misstated. If, based on the work we have performed on the other information that we obtained prior to the date of this auditor's report, we conclude that there is a material misstatement of this other information, we are required to report that fact. We have nothing to report in this regard.
When we read the Group's complete Annual report and Chairman's Statement, if we conclude that there is a material misstatement therein, we are required to communicate the matter to those charged with governance.
Responsibilities of the directors and those charged with governance for the consolidated and separate financial statements.The directors are responsible for the preparation of the consolidated and separate financial statements that give a true and fair view in accordance with International Financial Reporting Standards and the requirements of the Companies and Allied Matters Act, the Financial Reporting Council of Nigeria Act and the Nigerian Insurance Act, and for such internal control as the directors determine is necessary to enable the preparation of consolidated and separate financial statements that are free from material misstatement, whether due to fraud or error.
In preparing the consolidated and separate financial statements, the directors are responsible for assessing the Group's ability to continue as a going concern, disclosing, as applicable, matters related to going concern and using the going concern basis of accounting unless the directors either intend to liquidate the Group or tocease operations, or has no realistic alternative but to do so.
Those charged with governance are responsible for overseeing the Group's financial reporting process.
Auditor’s responsibilities for the audit of the consolidated and separate financial statementsOur objectives are to obtain reasonable assurance about whether the consolidated and separate financialstatements as a whole are free from material misstatement, whether due to fraud or error, and to issue anauditor's report that includes our opinion. Reasonable assurance is a high level of assurance, but is not aguarantee that an audit conducted in accordance with ISAs will always detect a material misstatement when itexists. Misstatements can arise from fraud or error and are considered material if, individually or in the aggregate, they could reasonably be expected to influence the economic decisions of users taken on the basis of these consolidated and separate financial statements.
As part of an audit in accordance with ISAs, we exercise professional judgment and maintain professionalscepticism throughout the audit. We also:
Identify and assess the risks of material misstatement of the consolidated and separate financial statements, whether due to fraud or error, design and perform audit procedures responsive to those risks, and obtain audit evidence that is sufficient and appropriate to provide a basis for our opinion. The risk of not detecting a material misstatement resulting from fraud is higher than for one resulting from error, as fraud may involve collusion, forgery, intentional omissions, misrepresentations, or the override of internal control.
Obtain an understanding of internal control relevant to the audit in order to design audit procedures that are appropriate in the circumstances, but not for the purpose of expressing an opinion on the effectiveness of the Group's internal control.
31www.leadway.comAnnual Report & Accounts 2016
Independent Auditors’ Report

Evaluate the appropriateness of accounting policies used and the reasonableness of accounting estimates and related disclosures made by the directors.
Conclude on the appropriateness of the directors' use of the going concern basis of accounting and, based on the audit evidence obtained, whether a material uncertainty exists related to events or conditions that may cast significant doubt on the Group's ability to continue as a going concern. If we conclude that a material uncertainty exists, we are required to draw attention in our auditor's report to the related disclosures in the consolidated and separate financial statements or, if such disclosures are inadequate, to modify our opinion. Our conclusions are based on the audit evidence obtained up to the date of our auditor's report. However, future events or conditions may cause the Group to cease to continue as a going concern.
Evaluate the overall presentation, structure and content of the consolidated and separate financialstatements, including the disclosures, and whether the consolidated and separate financial statementsrepresent the underlying transactions and events in a manner that achieves fair presentation.
Obtain sufficient appropriate audit evidence regarding the financial information of the entities or business activities within the Group to express an opinion on the consolidated and separate financial statements. We are responsible for the direction, supervision and performance of the group audit. We remain solely responsible for our audit opinion.
We communicate with those charged with governance regarding, among other matters, the planned scope andtiming of the audit and significant audit findings, including any significant deficiencies in internal control thatwe identify during our audit.
Report on other legal and regulatory requirementsThe Companies arid Allied Matters Act requires that in carrying out our audit we consider and report to youon the following matters. We confirm that:
we have obtained all the information and explanations which to the best of our knowledge and belief werenecessary for the purposes of our audit;
the company has kept proper books of account, so far as appears from our examination of those books andreturns adequate for our audit have been received from branches not visited by us; and
the company statement of financial position and comprehensive income are in agreement with the booksof account.
i)
ii)
iii)
For: PricewaterhouseCoopersChartered AccountantsLagos, NigeriaEngagement Partner: Anthony OputaFRC/2013/ICAN/00000000980 20 April 2017
RC 7588
www.leadway.comAnnual Report & Accounts 201632
RC 7588

1. General InformationLeadway Assurance Company Limited is a company incorporated and domiciled in Nigeria. The address of its registered office is 28/29 Constitution Road, Kaduna State, Nigeria. The Company was incorporated as a private limited liability company on 22 September 1970. It obtained a license to operate as an insurance company in January 1971 and commenced business in January 1971.
The Company is principally engaged in the business of providing risk underwriting and related financial services to its customers. Such services include provision of life and non-life underwriting insurance risks to both corporate and individual customers.
The Company holds 53% shareholding in Leadway Capital and Trust Limited (formerly, Leadway Trustees Limited), 51.2% in Leadway Hotels Limited, 100% in Leadway Properties and Investments Limited and 69.53% shareholding in Leadway Pensure PFA Limited.
The consolidated financial statements of the Group for the year ended 31 December 2016 comprises the Company and its subsidiaries (together referred to as the "Group" and individually as" Group entities"). These financial statements were authorized for issue by the directors on the 18 April 2016.
2. Summary of significant accounting policiesThe principal accounting policies applied in the preparation of these consolidated financial statements are set out below. These policies have been consistently applied to all the periods presented, unless otherwise stated.
2.1 Basis of preparationThe consolidated financial statements of Leadway Assurance Company Limited have been prepared in accordance with International Financial Reporting Standards (IFRS) and IFRS Interpretations Committee (IFRIC) applicable to companies reporting under IFRS.The consolidated financial statements have been prepared under the historical cost convention, as modified by:
i. Financial instruments at Fair value through profit or lossii. Available for sale financial assetsiii. Investment propertiesiv. Revaluation of land and buildingsv. Valuation of insurance liabilities
The preparation of financial statements in conformity with IFRS requires the use of certain critical accounting estimates. It also requires management to exercise its judgment in the process of applying the group's accounting policies. The areas involving a higher degree of judgment or complexity, or areas where assumptions and estimates are significant to the consolidated financial statements are disclosed in note 4.
2.2 Changes in accounting policy and disclosures2.2.1New and amended standards adopted by the group There are no IFRS or IFRIC interpretations that are effective for the first time for the financial year beginning on or after 1 January 2016 that would be expected to have a material impact on the group.
2.2.2 New standards and interpretations not yet effective The following new or revised standards and amendments which have a potential impact on the Group are not yet effective for the year ended 31 December 2016 and have not been applied in preparing these consolidated financial statements. The Group also plans to apply all the standards and amendments disclosed below once they are applicable. However, the Group's assessments of the new standards and amendments are that they are not expected to have asignificant impact on the Group operations and financial position. The group is currently yet to assess IFRS 9’s full impact.
Company Information and Summary of Significant Accounting PoliciesFor the year ended 31 December 2016
OVERVIEWBUSINESSREVIEW GOVERNANCE
GROUP FINANCIALSTATEMENTS APPENDIX
33www.leadway.comAnnual Report & Accounts 2016

2.3 Basis of consolidation(a) Subsidiaries Subsidiaries are entities (including structured entities) over which the group has control. The group controls an entity when the group is exposed to, or has rights to, variable returns from its involvement with the entity and has the ability to affect those returns through its power over the entity. Subsidiaries are fully consolidated from the date on which control is transferred to the group. They are deconsolidated from the date that control ceases.
The financial statements have been prepared using uniform accounting policies for like transactions and other events in similar circumstances. Investments in subsidiary companies are carried at cost less any accumulated impairment losses in the Company's separate financial statements.
The group applies the acquisition method to account for business combinations. The consideration transferred for the acquisition of a subsidiary is the fair values of the assets transferred, the liabilities incurred to the former owners of the acquiree and the equity interests issued by the group. The consideration transferred, includes the fair value of any asset or liability resulting from a contingent consideration arrangement. Identifiable assets acquired, liabilities and contingent liabilities assumed in a business combination are measured initially at their fair values at the acquisition date. The group recognises any non-controlling interest in the acquiree on an acquisition-by-acquisition basis, either at fair value or at the non-controlling interest's proportionate share of the recognised amounts of acquiree's identifiable net assets. Acquisition-related costs are expensed as incurred.
If the business combination is achieved in stages (Step acquisition), the acquisition date carrying value of the acquirer's previously held equity interest in the acquiree is re-measured to fair value at the acquisition date; any gains or losses arising from such re-measurement are recognised in income statement.
Any contingent consideration to be transferred by the group is recognised at fair value at the acquisition date. Subsequent changes to the fair value of the contingent consideration that is deemed to be an asset or liability is recognised in accordance with IAS 39 either in income statement or as a change to other comprehensive income. If the contingent consideration is outside the scope of IAS 39, it is accounted for in accordance with IAS 37 or the appropriate IFRS.
For the year ended 31 December 2016
Company Information and Summary ofSignificant Accounting Policies
www.leadway.comAnnual Report & Accounts 201634
RC 7588
IFRS Effective Date Key RequirementsAmendments to IAS 7 Statement of Cash Flows
1 January 2017
IFRS Effective Date Key Requirement IFRS 16, 'Leases' 1 January 2019
IFRS 15, 'Revenue from contracts with customers'
1 January 2017
IFRS 9, 'Financial instruments' 1 January 2018
Amends IAS 7 to include disclosures that enable users of financial statements to evaluate changes in liabilities arising from financing activities. The amendment specifies that the following changes arising from financing activities are disclosed (to the extent necessary): (i) changes from financing cash flows; (ii) changes arising from obtaining or losing control of subsidiaries or other businesses; (iii) the effect of changes in foreign exchange rates; (iv) changes in fair values; and (v) other changes.
This standard sets out the principles for the recognition, measurement, presentation and disclosure of leases. The objective is to ensure that lessees and lessors provide relevant information in a manner that faithfully represents those transactions. This information gives a basis for users of financial statements to assess the effect that leases have on the financial position, financial performance and cash flows of the entity.
IFRS 15 provides a single, principles based five-step model to be applied to all contracts with customers.The five steps in the model are Identification of the contract with the customer, Identification of the performance obligations in the contract, Determination of the transaction price, Allocation of the transaction price to the performance obligations in the contracts, and Recognition of revenue when (or as) the entity satisfies a performance obligation.
IFRS 9 is part of the IASB’s project to replace IAS 39. It addresses classification, measurement and impairment of financial assets as well as hedge accounting.
IFRS 9 replaces the multiple classification and measurement models in IAS 39 with a single model that has only three classification categories: amortised cost, fair value through OCI and fair value through profit or loss.
The entity is yet to assess the impact of this standard on the group.

For the year ended 31 December 2016
Company Information and Summary ofSignificant Accounting Policies
The excess of the consideration transferred, the amount of any non-controlling interest in the acquiree and the acquisition-date fair value of any previous equity interest in the acquiree over the fair value of the identifiable net assets acquired is recorded as goodwill. If the total of consideration transferred, non-controlling interest recognised and previously held interest measured is less than the fair value of the net assets of the subsidiary acquired in the case of a bargain purchase, the difference is recognised directly in the income statement.Inter-company transactions, balances and unrealised gains on transactions between group companies are eliminated. Unrealised losses are also eliminated. When necessary amounts reported by subsidiaries have been adjusted to conform with the group's accounting policies.
(b) Changes in ownership interests in subsidiaries without change of controlTransactions with non-controlling interests that do not result in loss of control are accounted for as equity transactions - that is, as transactions with the owners in their capacity as owners. The difference between fair value of any consideration paid and the relevant share acquired of the carrying value of net assets of the subsidiary is recorded in equity. Gains or losses on disposals to non-controlling interests are also recorded in equity.
(c) Disposal of subsidiariesWhen the group ceases to have control, any retained interest in the entity is remeasured to its fair value at the date when control is lost, with the change in carrying amount recognised in income statement. The fair value is the initial carrying amount for the purposes of subsequently accounting for the retained interest as an associate, joint venture or financial asset. In addition, any amount previously recognised in other comprehensive income in respect of that entity is accounted for as if the group had directly disposed of the related assets or liabilities. This may mean that amounts previously recognised in other comprehensive income are reclassified to income statement.
(d) AssociatesAssociates are all entities over which the Group has significant influence but not control, generally accompanying a shareholding of between 20% and 50% of the voting rights. Investments in associates are accounted for using the equity' method of accounting. Under the equity method, the investment is initially recognised at cost and the carrying amount is increased or decreased to recognise the investor's share of the income statement of the investee after the date of acquisition. The Group's investment in associates include goodwill identified on acquisition (when applicable).If the ownership interest in an associate is reduced but significant influence is retained, only a proportionate share of the amounts previously recognised in other comprehensive income is reclassified to income statement where appropriate.
The Group's share of post-acquisition profit or loss is recognised in the income statement, and its share of post-acquisition movements in other comprehensive income is recognised in other comprehensive income with a corresponding adjustment to the carrying amount of the investment. When the group's share of losses in an associate equals or exceeds its interest in the associate, including any other unsecured receivables, the Group does not recognise further losses, unless it has incurred legal or constructive obligations or made payments on behalf of the associate.
The Group determines at each reporting date whether there is any objective evidence that the investment in the associate is impaired. If this is the case, the Group calculates the amount of impairment as the difference between the recoverable amount of the associate and its carrying value and recognises the amount adjacent to share of profit/(loss) of associates in the income statement.Investments in associate are carried at cost less any accumulated impairment losses in the Company's separate financial statements.
2.4 Segment reportingA segment is a distinguishable component of the Group that is engaged in providing products or services (business segment), or in providing products or services within a particular economic environment (geographical segment), which is subject to risks and rewards that are different from those of other segments. The Group's primary format for segment reporting is based on business segments.
Operating segments are reported in a manner consistent with the internal reporting provided to the chief operating decision-maker. The chief operating decision-maker, who is responsible for allocating resources and assessing performance of the operating segments, has been identified as the Board of directors.
2.5 Foreign currency translation(a) Functional and presentation currencyItems included in the financial statements of each of the Group's entities are measured using the currency of the primary economic environment in which the entity operates (the 'functional currency'). Except otherwise stated the consolidated financial statements are presented in thousands of Naira (NGN), which is the Group's functional and presentation currency.
(b) Transactions and balancesForeign currency transactions are translated into the functional currency using the exchange rates prevailing at the dates of the transactions. Foreign exchange gains and losses resulting from the settlement of such transactions and from the translation at year-end exchange rates of monetary assets and liabilities denominated in foreign currencies are recognised in the income statement.Foreign exchange gains and losses that relate to borrowings and cash and cash equivalents are presented in the income statement within 'finance income or cost'. All other foreign exchange gains and losses are presented in the income statement within 'Other operating income' or 'Other operating expenses'.
Changes in the fair value of monetary securities denominated in foreign currency classified as available for sale are analysed between translation differences resulting from changes in the fair value of the security, and other changes in the carrying amount of the security. Translation differences related to changes in amortised cost are recognised in income statement; other changes in carrying amount are recognised in 'other comprehensive income'.
Translation differences on non-monetary financial assets and liabilities held at fair value through income statement are reported as part of the fair value gain or loss. Translation differences on non-monetary financial assets such as equities classified as available-for-sale financial assets are included in 'other comprehensive income'.
2.6 Financial assets and liabilitiesIn accordance with IAS 39, all financial assets and liabilities (including derivative financial instruments) have to be recognised in the consolidated financial statements and measured in accordance with their assigned categories.
OVERVIEWBUSINESSREVIEW GOVERNANCE
GROUP FINANCIALSTATEMENTS APPENDIX
35www.leadway.comAnnual Report & Accounts 2016

www.leadway.comAnnual Report & Accounts 201636
RC 7588
Category Classes as determined by the Group Financial Assets
Financial assets at fair value through profit or
Financial assets at fair value through profit or loss
Listed Debt Securities Treasury bills with 90 days maturity Federal Government of Nigeria bonds
Listed Equity Securities Shares Loans and receivables
Cash and cash equivalents
Cash in hand and bank Placements Treasury bills with 90 days
Loans and advances
Commercial loans Loans to policyholders Agency loans Advances under finance lease
Trade receivable Insurance Receivables Due from contract, brokers, agents and insurance companies
Reinsurance Assets Due from reinsurers Other Receivables Other receivables
Available for sale
Investment Securities
Listed Equity Shares Unlisted Equity Shares
Held to maturity
Held to maturity financial assets
Listed Debt Securities
State Government bonds
FGN Treasury bills Corporate bonds Eurobonds FGN bonds
Financial liabilities
Financial liabilities at fair value
through P&L
NIL
NIL
NIL
Financial liabilities at
amortised cost
Trade Payables Reinsurance payable
Insurance payable
Other liabilities Commission payable Due to employees Accrued expenses
Insurance contract liabilities Outstanding claims Life funds
Borrowings Term loans Others
2.6.1 Financial Assets:Initial recognitionRegular-way purchases and sales of financial assets are recognized on the settlement date i.e. the date on which the group receives value for a purchase sale of assets. All financial assets are initially recognized at fair value, which includes directly attributable transaction costs for financial instruments not classified as at fair value through income statement. Financial instruments are derecognized when the rights to receive cash flows from the financial instruments have expired or where the group has transferred substantially all risks and rewards of ownership.
Subsequent measurement
Subsequent measurement of financial instruments depends on their classification. Subsequent to initial measurement, financial instruments are measured either at fair value or amortized cost, depending on their classification:
(a) Financial assets held at fair value through profit or lossThis category has two sub-categories: Financial assets held for trading and those designated at fair value through profit or loss at inception.
A financial asset is classified as the "financial assets at fair value through profit or loss" category at inception if acquired principally for the purpose of selling in the short term, if it forms part of a portfolio of financial assets in which there is evidence of short –term profit taking, or if so designated by management.
Financial assets designated as fair value through profit or loss at inception are those that are held in internal funds to match insurance and investment contracts liabilities that are linked to the changes in fair value of these assets. The designation of these assets to be at fair value through profit or loss eliminates or significantly reduces a measurement or recognition inconsistency (sometimes referred to as " an accounting mismatch") that would otherwise arise from measuring assets or liabilities or recognizing the gains and losses on them on different bases.
Upon initial recognition, attributable transaction costs are recognized in the income statement as incurred. Subsequent to initial recognition, they are remeasured at fair value, with gains and losses arising from changes in this value recognized in Net fair value gains/(Losses) in the income statement in the period in which they arise. The fair values of quoted investments in active markets are based on current bid prices.
Interest earned and dividends received while holding trading assets at fair value through profit or loss are included in investment income.
Financial assets at fair value through profit or loss are presented within "Operating activities" as part of changes in working capital in the statement of cash flows.
For the year ended 31 December 2016
Company Information and Summary ofSignificant Accounting Policies
OVERVIEWBUSINESSREVIEW GOVERNANCE
GROUP FINANCIALSTATEMENTS APPENDIX
37www.leadway.comAnnual Report & Accounts 2016
For the year ended 31 December 2016
Company Information and Summary ofSignificant Accounting Policies
(b) Held-to-maturityHeld-to-maturity investments are non-derivative financial assets with fixed determinable payments and fixed maturities that management has both the positive intention and ability to hold to maturity other than:
- those that the Group upon initial recognition designates as at fair value through income statement;- those that the Group designates as available for sale; and- those that meet the definition of loans and receivables.
Held to maturity investments include corporate and government bonds. Interests on held-to- maturity investments are included in the consolidated financial statement and reported as interest income within investment income.
Held-to-maturity financial assets are recognized initially at fair value plus any directly attributable transaction costs and are subsequently carried at amortized cost, using the effective interest method, less any accumulated impairment losses. Any sale or reclassification of a more than insignificant amount of held-to-maturity investments not close to their maturity would result in the reclassification of all held-to-maturity investments as available-for-sale, and prevent the Group from classifying financial assets as held-to-maturity for the current and the following two financial years.
(c) Available-for-saleAvailable for sale financial investments include equity and debt securities. The Group classifies as available-for-sale those financial assets that are generally not designated as another category of financial assets, and strategic capital investments held for an indefinite period of time, which may be sold in response to needs for liquidity or changes in interest rates, exchange rates or equity prices.Available-for-sale financial assets are carried at fair value, with the exception of investments in equity instruments where fair value cannot be reliably determined, which are carried at cost. Fair values are determined in the same manner as for investments at fair value through the income statement. Unrealised gains and losses arising from changes in the fair value of available-for-sale financial assets are recognized in other comprehensive income while the investment is held and are subsequently transferred to the income statement upon sale or de-recognition of the investment.
Dividends received on available-for-sale instruments are recognized in the income statement when the Group's right to receive payment has been established.
(d) Loans and receivablesLoans and receivables include non-derivative financial assets with fixed or determinable payments that are not quoted in an active market, other than those classified by the Group as fair value through income statement or available-for-sale. Loans and advances consist primarily of trade receivables, commercial loans, staff loans, policyholders loan and loans to agents. These are managed in accordance with a documented policy.
Loans and receivables are measured at amortized cost using the effective interest method, less any accumulated impairment losses. Loans granted at below market rates are fair valued by reference to expected future cash flows and current market interest rates for instruments in a comparable or similar risk class and the difference between the historical cost and fair value is accounted for as employee benefits under staff costs.
Trade receivables Trade receivables arising from insurance contracts are stated after deducting allowance made for specific debts considered doubtful of recovery. Trade receivables are reviewed at every reporting period for impairment (See 2.6f(iii)) for the accounting policy on impairment of trade receivables).
Loans to Policy holders Loans to policyholders represent loans availed to life insurance policy holders and are recognized at amortized cost.
Reinsurance and Co-insurance recoverable The group cedes business to reinsurers in the normal course of business for the purpose of limiting its net loss through the transfer of risks. Premium Ceded comprises the share of gross written premiums transferred to reinsurers based on agreed arrangements. Reinsurance arrangements does not relieve the Group from its direct obligation to policyholders.
Finance Lease Leases in which a significant portion of the risks and rewards of ownership are retained by the lessee are classified as finance leases. Finance leases are capitalized at the lease's commencement at the lower of the fair value of the leased property and the present value of the minimum lease payments.
(e) Fair value measurementThe best evidence of the fair value of a financial instrument on initial recognition is the transaction price, i.e. the fair value of the consideration paid or received, unless the fair value is evidenced by comparison with other observable current market transactions in the same instrument, without modification or repackaging, or based on discounted cash flow models and option pricing valuation techniques whose variables include only data from observable markets.
Subsequent to initial recognition, the fair values of financial instruments are based on quoted market prices or dealer price quotations for financial instruments traded in active markets. If the market for a financial asset is not active or the instrument is an unlisted instrument, the fair value is determined by using applicable valuation techniques. These include the use of recent arm's length transactions, discounted cash flow analyses, pricing models and valuation techniques commonly used by market participants.
Where discounted cash flow analyses are used, estimated cash flows are based on management's best estimates and the discount rate is a market-related rate at the balance sheet date from a financial asset with similar terms and conditions.
Where pricing models are used, inputs are based on observable market indicators at the balance sheet date and profits or losses are only recognized to the extent that they relate to changes in factors that market participants will consider in a setting price.
(f) Impairment of financial assets(i) Financial assets carried at amortized costThe carrying amounts of these assets are reviewed at each reporting date to determine whether there is any objective evidence of impairment. A financial asset is considered to be impaired if objective evidence indicates that one or more events that have occurred since the initial recognition of the asset have had a negative effect on the estimated future cash flows of that asset and can be reliably estimated. Objective evidence that a financial asset or group of assets is impaired

www.leadway.comAnnual Report & Accounts 201638
includes observable data that comes to the attention of the Group about the following events: Significant financial difficulty of the issuer or debtor:
- A breach of contract, such as a default or delinquency in payments;- It becoming probable that the issuer or debtor will enter bankruptcy or other financial reorganization;- The disappearance of an active market for that financial asset because of financial difficulties; or- Observable data indicating that there is a measurable decrease in the estimated future cash flow from a group of financial assets since the initial
recognition of those assets, although the decrease cannot yet be identified with the individual financial assets in the Group.
For financial assets measured at amortized cost, the Group first assesses whether objective evidence of impairment exists individually for financial assets that are individually significant and individually or collectively for financial assets that are not individually significant. Individually significant financial assets are tested for impairment on an individual basis. The remaining financial assets are assessed collectively in groups that share similar credit risk characteristics. An impairment loss in respect of a financial asset measured at amortized cost is calculated as the difference between its carrying value and the present value of the estimated future cash flows discounted at the original effective interest rate.
The carrying amount of the asset is reduced through the use of an allowance account, and the amount of the loss is recognized in the income statement. If the financial asset has a variable interest rate, the discount rate for measuring any impairment loss is the current effective interest rate determined under contract. The Group may measure impairment on the basis of an instrument's fair value using an observable market price.
For the purpose of a collective evaluation of impairment, financial assets are grouped on the basis of similar credit risk characteristics. Those characteristics are relevant to the estimation of future cash flows for groups of such assets by being indicative of the issuer's ability to pay all amounts due under the contractual terms of the debt instrument being evaluated. If in a subsequent period, the amount of the impairment loss decreases and the decrease can be related objectively to an event occurring after the impairment was recognized (such as improved credit rating), the previously recognized impairment loss is reversed by adjusting the allowance account. The amount of the reversal is recognized in the income statement.
(ii) Assets classified as available-for-sale
Available-for-sale financial assets are considered impaired if there is objective evidence of impairment, resulting from one or more loss events that occurred after initial recognition but before the reporting date, that have an impact on the future cash flows of the asset. In the case of equity investments classified as available-for-sale, a significant or prolonged decline in the fair value of the security below its cost is an objective evidence of impairment resulting in the recognition of an impairment loss. In this respect, a decline of 20% or more is regarded as significant, and a period of 12 months or longer is considered to be prolonged- If any such quantitative evidence exists for available-for-sale financial assets, the asset is considered for impairment, taking qualitative evidence into account.
All impairment losses are recognized through the income statement. If any loss on the financial asset was previously recognized directly in equity as a reduction in fair value, the cumulative net loss that had been recognized in equity is transferred to the income statement and is recognized as part of the impairment loss. The amount of the loss recognized in the income statement is the difference between the acquisition cost and the current fair value, less any previously recognized impairment loss.
Subsequent decreases in the amount relating to an impairment loss, that can be linked objectively to an event occurring after the impairment loss was recognized in the income statement, is reversed through the income statement. An impairment loss in respect of an equity instrument classified as available-for-sale is not reversed through the income statement but accounted for directly in equity.
(iii) Trade receivablesTrade receivables, are a significant part of loans and receivables, are initially recognized at fair value and subsequently measured at amortized cost less provision for impairment. An allowance for impairment is made when there is an objective evidence (such as the probability of solvency or significant financial difficulties of the debtors) that the Group will not be able to collect all the amount due under the original terms of the invoice. Allowances are made based on an impairment model which considers the loss given default for each customer, probability of default and emergence period which serves as an impairment trigger based on the age of the debt. Impaired debts are derecognised when they are assessed as uncollectible. If in a subsequent period the amount of the impairment loss decreases and the decrease can be related objectively to an event occurring after the impairment was recognized, the previously recognized impairment loss is reversed to the extent that the carrying value of the asset does not exceed its amortized cost at the reverse date. Any subsequent reversal of an impairment loss is recognized in the income statement.
In respect of other receivables, impairment losses recognized in prior periods are assessed at each reporting date for any indications that the loss has decreased or no longer exists. An impairment loss is reversed if there has been a change in the estimates used to determine the recoverable amount. An impairment loss is reversed only to the extent that the asset's carrying amount does not exceed the carrying amount that would have been determined, net of depreciation or amortization if no impairment loss had been recognized.
2.6.2 Financial liabilitiesThe Group classifies its financial liabilities, other than financial guarantees and loan commitments, as measured at amortized cost or fair value through profit and loss
Trade and Other PayablesTrade and other payables are recognized initially at fair value and subsequently measured at amortized cost using the effective interest method. The fair value of a non-interest bearing liability is its discounted repayment amount. If the due date of the liability is less than one year discounting is omitted.
2.6.3 Offsetting Financial InstrumentsFinancial assets and liabilities are set off and the net amount presented in the statement of financial position when, and only when, there is a legally enforceable right to set off the recognized amounts and intends either to settle on a net basis or to realize the asset and settle the liability simultaneously.
2.6.4 Derecognition of financial instrumentsA financial asset is derecognized when the contractual rights of the Group to the cash flows from the asset expire, or its rights to receive the contractual cash flows on the financial asset in a transaction that transfers substantially all the risks and rewards of ownership of the financial asset are transferred, or when it assumes an obligation to pay those cash flows to one or more recipients, subject to certain criteria.
For the year ended 31 December 2016
Company Information and Summary ofSignificant Accounting Policies
www.leadway.comAnnual Report & Accounts 2016
RC 7588

Any interest in transferred financial assets that is created or retained by the Group is recognized as a separate asset or liability. The Group derecognises a financial liability when its contractual obligations are discharged, canceled or expired.
2.7 Cash and cash equivalentsCash and cash equivalents include cash in hand and at bank, call deposits and short-term highly liquid financial assets with original maturities of three months or less from the acquisition date, which are subject to insignificant risk of changes in their fair value, and are used by the Group in the management of its short-term commitments. Cash and cash equivalents are carried at amortized cost in the statement of financial position.
2.8 Deferred acquisition costsAcquisition costs comprise all direct and indirect costs arising from the origination of insurance contracts.Deferred acquisition costs represent a portion of the commission which is incurred during a financial year and are deferred to the extent that they are recoverable out of future revenue margins. It is calculated on a time apportionment basis over the tenor of the policies.
2.9 Investment propertyInvestment property comprises investment in land or buildings held primarily to earn rentals or capital appreciation or both.
The Group's investment property is initially recognized at cost including transaction costs. The carrying amount includes the cost of replacing part of an existing investment property at the time that cost is incurred if the recognition criteria are met, and excludes the cost of day to day servicing of an investment property. An investment property is subsequently measured at fair value with any change therein recognized in the income statement. Fair values are determined individually, on a basis appropriate to the purpose for which the property is intended and with regard to recent market transactions for similar properties in the same location.
Fair values are reviewed annually by an independent valuer, holding a recognized and relevant professional qualification and with relevant experience in the location and category of investment property being valued. Any gain and loss arising from a change in the fair value is recognized in the income statement.
Subsequent expenditure on investment property is capitalized only if the future economic benefit will flow to the Group; otherwise, they are expensed as incurred.
Investment properties are disclosed separate from the Property and equipment used for the purposes of the business.
The Group separately accounts for a dual purpose property as investment property if it occupies only an insignificant portion. Otherwise, the portion occupied by the Group is treated as property and equipment.
2.10 Statutory depositThese deposits represent bank balances required by the insurance regulators of the Group to be placed with relevant central banks of groups operating jurisdictions. These deposits are stated at cost. Interest on statutory deposits is recognized as earned in other receivables and the corresponding amount is recognized in the statement of comprehensive income within investment income.
2.11 Intangible assets(a) GoodwillThe goodwill that arises upon the acquisition of subsidiaries is included in intangible assets. Subsequent to initial recognition, goodwill is measured at cost less accumulated impairment losses. Goodwill has an indefinite useful life and it is tested annually for impairment.
Goodwill is allocated to cash-generating units or groups of cash-generating units for the purpose of impairment testing. The allocation is made to those cash-generating units or groups of cash-generating units that are expected to benefit from the business combination in which the goodwill arose identified in accordance with IFRS 8.
Goodwill has an indefinite useful life and is tested annually as well as whenever a trigger event has been observed for impairment by comparing the present value of the expected future cash flows from a cash generating unit with the carrying value of its net assets, including attributable goodwill and carried at cost less accumulated impairment losses. Impairment losses on goodwill are not reversed. Gains and losses on the disposal of an entity include the carrying amount of goodwill relating to the entity sold.
(b) Purchased softwareRecognition of software acquired is only allowed if it is probable that future economic benefits to this intangible asset are attributable and will flow to the Group.
Software acquired is initially measured at cost. The cost of acquired software comprises its purchase price, including any import duties and non-refundable purchase taxes, and any directly attributable expenditure on preparing the asset for its intended use. After initial recognition, software acquired is carried at its cost less any accumulated amortization and any accumulated impairment losses. Maintenance costs should not be included.
Internally developed software is capitalized when the Group has the intention and demonstrates the ability to complete the development and use of the software in a manner that will generate future economic benefits, and can reliably measure the costs to complete the development. The capitalized costs include all costs directly attributable to the development of the software. Internally developed software is stated at capitalized cost less accumulated amortization and impairment.
Subsequent expenditure on software assets is capitalized only when it increases the future economic benefits embodied in the specific asset to which it relates. All other expenditure is expensed as incurred. Amortisation is recognized in the income statement on a straight-line basis over the estimated useful life of the software, from the date that it is available for use. The estimated useful life of software is three years subject to annual reassessment.
2.12 Property and equipmentRecognition & MeasurementProperty and equipment comprise land and buildings and other properties owned by the Group.Items of Property and equipment are carried at cost less accumulated depreciation and impairment losses except for land and building which is carried at revalued amount. Cost includes expenditure that is directly attributable to the acquisition of the asset.
For the year ended 31 December 2016
Company Information and Summary ofSignificant Accounting Policies
OVERVIEWBUSINESSREVIEW GOVERNANCE
GROUP FINANCIALSTATEMENTS APPENDIX
39www.leadway.comAnnual Report & Accounts 2016

www.leadway.comAnnual Report & Accounts 201640
RC 7588For the year ended 31 December 2016
Company Information and Summary ofSignificant Accounting Policies
Subsequent costsSubsequent costs are included in the asset's carrying amount or recognized as a separate asset, as appropriate, only when it is probable that future economic benefits associated with the item will flow to the Group and the cost of the item can be measured reliably. All other repairs and maintenance costs are charged to the income statement during the financial period in which they are incurred.
Subsequent costs on replacement parts on an item of property are recognized in the carrying amount of the asset and the carrying amount of the replaced or renewed component is derecognized.
Subsequent measurementAll items of Property and equipment except land and buildings are subsequently measured at cost less accumulated depreciation and impairment losses.
Land and buildingsLand and buildings are subsequently carried at revalued amounts, being fair value at the date of revaluation less subsequent accumulated depreciation and impairment losses, if any. They are valued on an open market basis by qualified property valuers at each reporting date. Land is however not depreciated.
When an individual property is revalued, any increase in its carrying amount (as a result of revaluation) is transferred to a revaluation reserve, except to the extent that it reverses a revaluation decrease of the same property previously recognized as an expense in the statement of income statement.
When the value of an individual property is decreased as a result of a revaluation, the decrease is charged against any related credit balance in the revaluation reserve in respect of that property. However, to the extent that it exceeds any surplus, it is recognized as an expense in the income statement.
When Land and buildings are revalued, any accumulated depreciation at the date of the revaluation is eliminated against the gross carrying amount of the asset and the net amount restated to the revalued amount
DepreciationDepreciation is calculated on property and equipment excluding land on the straight line basis to write down the cost of each asset to its residual value over its estimated useful life.
Depreciation begins when an asset is available for use and ceases at the earlier of the date that the asset is derecognised or classified as held for sale in accordance with IFRS 5.
The estimated useful lives for the current and comparative periods are as follows:Buildings - 50 yearsOffice equipment - 5 yearsComputer equipment - 3 yearsFurniture and fittings - 5 yearsMotor vehicles - 4 years
Capital work in progress is not depreciated. The Group's capital work in progress relates to capital expenditure on properties to be for the company's activities. Upon completion, it is transferred to the relevant asset category. Depreciation methods, useful lives and residual values are reassessed at each reporting date.
De-recognitionUpon disposal of any item of property and equipment or when no future economic benefits are expected to flow from its use. such items are derecognized from the books. Gains and losses on disposal of assets are determined by comparing proceeds with their carrying amounts and are recognized in the income statement in the year of de-recognition.
2.13 Impairment of non-financial assetsThe Group's non-financial assets with carrying amounts other than investment property are reviewed at each reporting date to determine whether there is any indication of impairment. If any such indication exists then the asset's recoverable amount is estimated. For intangible assets that have indefinite useful lives or that are available for use, the recoverable amount is estimated each year at the same time.
An impairment loss is recognized if the carrying amount of an asset or its cash-generating unit exceeds its recoverable amount. A cash-generating unit is the smallest identifiable asset group that generates cash flows that largely are independent of other assets and groups. Impairment losses are recognized in income statement.
The recoverable amount of an asset or cash-generating unit is the greater of its value in use and its fair value less costs to sell. In assessing value in use, the estimated future cash flows are discounted to their present value using a pre-tax discount rate that reflects current market assessments of the time value of money and the risks specific to the asset.
2.14 Classification of insurance contractsThe Group enters into insurance contracts as its primary business activities. Insurance contracts are those that the Group accepts significant insurance risk from another party (the policyholder) by agreeing to compensate the policyholder or other beneficiary if a specified uncertain future event (the insured event) adversely affects the policyholder or the other beneficiary. The Group as a guide defines significant insurance risk as the possibility of having to pay benefit on the occurrence of an insured event that is at least 10% more than the benefit payable if the insured event did not occur.
The Group classifies financial guarantee contracts and accounts for these as insurance contracts in accordance with IFRS 4.
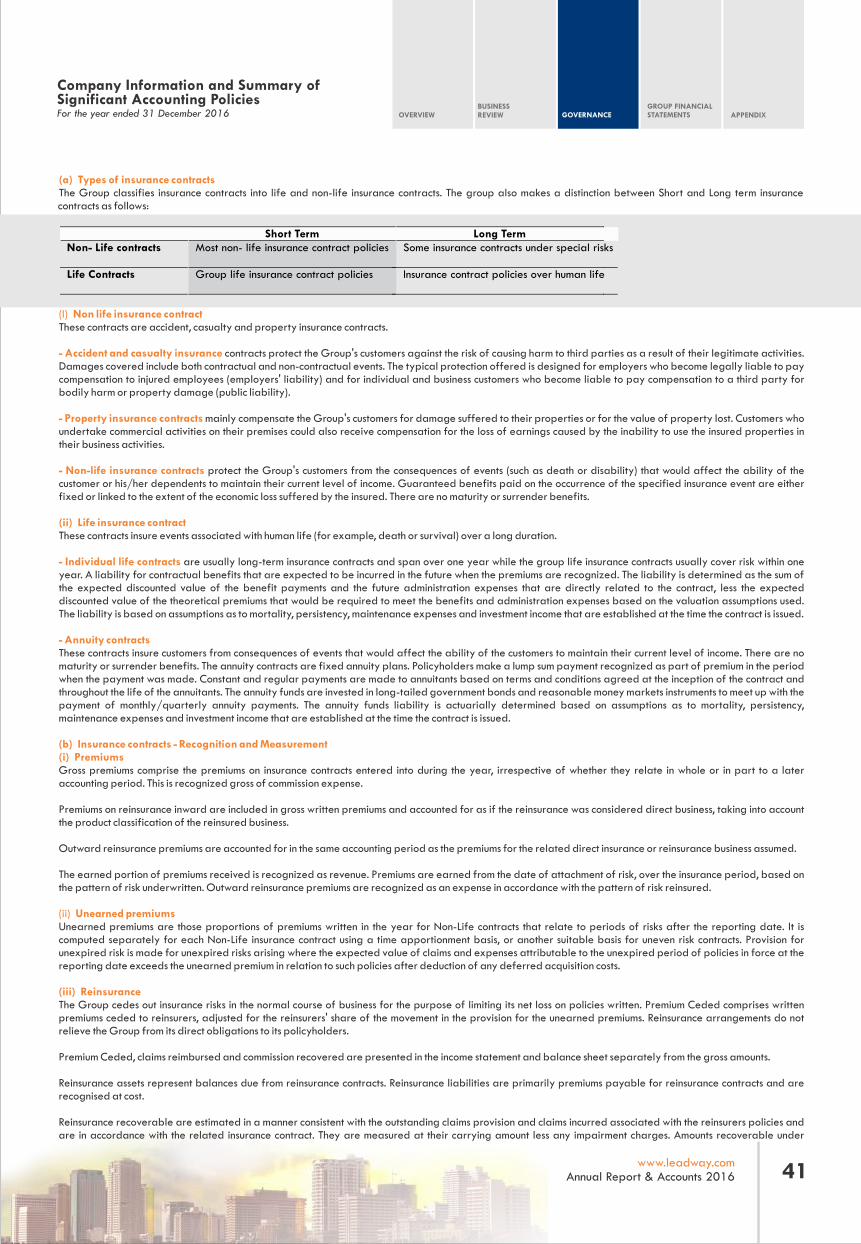
OVERVIEWBUSINESSREVIEW GOVERNANCE
GROUP FINANCIALSTATEMENTS APPENDIX
41www.leadway.comAnnual Report & Accounts 2016
For the year ended 31 December 2016
Company Information and Summary ofSignificant Accounting Policies
(a) Types of insurance contractsThe Group classifies insurance contracts into life and non-life insurance contracts. The group also makes a distinction between Short and Long term insurance contracts as follows:
Short Term Long Term Non- Life contracts Most non- life insurance contract policies Some insurance contracts under special risks
Life Contracts Group life insurance contract policies Insurance contract policies over human life
(I) Non life insurance contractThese contracts are accident, casualty and property insurance contracts.
- Accident and casualty insurance contracts protect the Group's customers against the risk of causing harm to third parties as a result of their legitimate activities. Damages covered include both contractual and non-contractual events. The typical protection offered is designed for employers who become legally liable to pay compensation to injured employees (employers' liability) and for individual and business customers who become liable to pay compensation to a third party for bodily harm or property damage (public liability).
- Property insurance contracts mainly compensate the Group's customers for damage suffered to their properties or for the value of property lost. Customers who undertake commercial activities on their premises could also receive compensation for the loss of earnings caused by the inability to use the insured properties in their business activities.
- Non-life insurance contracts protect the Group's customers from the consequences of events (such as death or disability) that would affect the ability of the customer or his/her dependents to maintain their current level of income. Guaranteed benefits paid on the occurrence of the specified insurance event are either fixed or linked to the extent of the economic loss suffered by the insured. There are no maturity or surrender benefits.
(ii) Life insurance contractThese contracts insure events associated with human life (for example, death or survival) over a long duration.
- Individual life contracts are usually long-term insurance contracts and span over one year while the group life insurance contracts usually cover risk within one year. A liability for contractual benefits that are expected to be incurred in the future when the premiums are recognized. The liability is determined as the sum of the expected discounted value of the benefit payments and the future administration expenses that are directly related to the contract, less the expected discounted value of the theoretical premiums that would be required to meet the benefits and administration expenses based on the valuation assumptions used. The liability is based on assumptions as to mortality, persistency, maintenance expenses and investment income that are established at the time the contract is issued.
- Annuity contracts These contracts insure customers from consequences of events that would affect the ability of the customers to maintain their current level of income. There are no maturity or surrender benefits. The annuity contracts are fixed annuity plans. Policyholders make a lump sum payment recognized as part of premium in the period when the payment was made. Constant and regular payments are made to annuitants based on terms and conditions agreed at the inception of the contract and throughout the life of the annuitants. The annuity funds are invested in long-tailed government bonds and reasonable money markets instruments to meet up with the payment of monthly/quarterly annuity payments. The annuity funds liability is actuarially determined based on assumptions as to mortality, persistency, maintenance expenses and investment income that are established at the time the contract is issued.
(b) Insurance contracts - Recognition and Measurement(i) PremiumsGross premiums comprise the premiums on insurance contracts entered into during the year, irrespective of whether they relate in whole or in part to a later accounting period. This is recognized gross of commission expense.
Premiums on reinsurance inward are included in gross written premiums and accounted for as if the reinsurance was considered direct business, taking into account the product classification of the reinsured business.
Outward reinsurance premiums are accounted for in the same accounting period as the premiums for the related direct insurance or reinsurance business assumed.
The earned portion of premiums received is recognized as revenue. Premiums are earned from the date of attachment of risk, over the insurance period, based on the pattern of risk underwritten. Outward reinsurance premiums are recognized as an expense in accordance with the pattern of risk reinsured.
(ii) Unearned premiumsUnearned premiums are those proportions of premiums written in the year for Non-Life contracts that relate to periods of risks after the reporting date. It is computed separately for each Non-Life insurance contract using a time apportionment basis, or another suitable basis for uneven risk contracts. Provision for unexpired risk is made for unexpired risks arising where the expected value of claims and expenses attributable to the unexpired period of policies in force at the reporting date exceeds the unearned premium in relation to such policies after deduction of any deferred acquisition costs.
(iii) ReinsuranceThe Group cedes out insurance risks in the normal course of business for the purpose of limiting its net loss on policies written. Premium Ceded comprises written premiums ceded to reinsurers, adjusted for the reinsurers' share of the movement in the provision for the unearned premiums. Reinsurance arrangements do not relieve the Group from its direct obligations to its policyholders.
Premium Ceded, claims reimbursed and commission recovered are presented in the income statement and balance sheet separately from the gross amounts.
Reinsurance assets represent balances due from reinsurance contracts. Reinsurance liabilities are primarily premiums payable for reinsurance contracts and are recognised at cost.
Reinsurance recoverable are estimated in a manner consistent with the outstanding claims provision and claims incurred associated with the reinsurers policies and are in accordance with the related insurance contract. They are measured at their carrying amount less any impairment charges. Amounts recoverable under

reinsurance contracts are assessed for impairment at each balance sheet date. If there is objective evidence of impairment, the Group reduces the carrying amount of its reinsurance assets to its recoverable amount and recognizes the impairment loss in the income statement as a result of an event that occurred after its initial recognition, for which the Group may not be able to recover all amounts due and the event has a reliably measurable impact on the amounts that the Group will receive from the reinsurer.
(iv) Commission incomeCommissions are recognized on ceding business to the reassurer and are credited to the income statement account.
(v) Underwriting expensesUnderwriting expenses are made up of acquisition and maintenance expenses.Underwriting expenses for insurance contracts and investment contracts are recognized as an expense when incurred, with the exception of acquisition costs which are recognized on a time apportionment basis in respect of risk.
(vi) Claims incurredClaims incurred consist of claims and claims handling expenses paid during the financial year together with the movement in the provision for outstanding claims. The provision for outstanding claims represents the Group's estimate of the ultimate cost of settling all claims incurred but unpaid at the balance sheet date whether reported or not. The provision includes an allowance for claims management and handling expenses.
The provision for outstanding claims for reported claims is estimated based on current information and the ultimate liability may vary as a result of subsequent information and events and may result in significant adjustments to the amounts provided. Adjustments to the amounts of claims provision for prior years are reflected in the income statement in the financial period in which adjustments are made, and disclosed separately if material.
Reinsurance recoverable are recognized when the Group records the liability for the claims and are not netted off claims expense but are presented separately in the income statement.
Claims incurred in respect of long-term insurance contracts especially pure life business and annuity contracts consist of claims arising during the year including provision for policyholders' liabilities. Outstanding claims on long-term insurance contracts that have occurred at the balance sheet date and have been notified by the insured are carried at the claim amounts advised.
(vii) Deferred acquisition costsAcquisition costs comprise insurance commissions, brokerage and other related expenses arising from the generation and conclusion of Non- Life Insurance insurance contracts. The proportion of acquisition costs that correspond to the unearned premiums is deferred as an asset and recognized in the subsequent period. They are recognized on a basis consistent with the related provisions for unearned premiums.
(viii) Salvages Some non-life insurance contracts permit the Group to sell (usually damaged) property acquired in the process of settling a claim. The Group may also have the right to pursue third parties for payment of some or all costs of damages to its client's property (i.e. subrogation right). Salvage recoveries are presented net of the claim expense.
(ix) SubrogationSubrogation is the right for an insurer to pursue a third party that caused an insurance loss to the insured. This is done as a means of recovering the amount of the claim paid to the insured for the loss. A receivable for subrogation is recognized in other receivables when the liability is settled and the Group has the right to receive future cash flow from the third party.
2.15 Insurance Contract LiabilitiesThe recognition and measurement of Insurance contract liabilities is determined as follows:
(i) Non-life business
(a) Reserves for unearned premium and unexpired riskThe reserve for unearned premium is calculated on a time apportionment basis in respect of risk accepted during the year with the exception of construction all risk policies where the risk increases with term and progress on the project at hand. A provision for additional unexpired risk reserve is recognized for an underwriting year where it is determined that the estimated cost of claims and expenses would exceed the unearned premium reserve.
(b) Reserves for outstanding claimsThe reserve for outstanding claims is maintained at the total amount of outstanding claims incurred plus claims incurred but not reported ("IBNR") as at the reporting date. The IBNR is based on the liability adequacy test.
(c) Liabilities Adequacy TestThe net liability for insurance contracts is tested annually for adequacy by actuarial valuation. This is carried out by discounting current estimates of all future contractual cash flows and comparing this amount to the carrying value of the liability net of deferred acquisition costs.
Where a shortfall is identified, an additional provision is made and the Group recognizes the deficiency in the income statement for the year. The method of valuation and assumptions used, the cash flows considered and the discounting and aggregation practices adopted have been set out in the following notes.
Reserving methodology and assumptionsFor non-life insurance risks, the Group uses different methods to incorporate the various assumptions made in order to estimate the ultimate cost of claims. The two methods more commonly used are the Discounted Inflation-adjusted Basic Chain Ladder and the Expected Loss Ratio methods adjusted for assumed experience to date.
Claims data was grouped into triangles by accident year or quarter and payment year or quarter. The choice between quarters or years was based on the volume of data in each segment. The analysis was conducted by line of business.
Company Information and Summary ofSignificant Accounting PoliciesFor the year ended 31 December 2016
www.leadway.comAnnual Report & Accounts 201642
RC 7588

For the year ended 31 December 2016
Company Information and Summary ofSignificant Accounting Policies
Discounted inflation-adjusted basic chain ladder methodHistorical claims paid were grouped into 6 years cohorts - representing when they were paid after their underwriting year. These cohorts are called claim development years and the patterns for 6 years was studied. The historically paid losses are projected to their ultimate values for each underwriting year by calculating the loss development factors for each development year. The ultimate claims are then derived using the loss development factors and the latest paid historical claims.
The historically paid losses are inflated using the corresponding inflation index in each of the accident years to the year of valuation and then accumulated to their ultimate values for each accident year to obtain the projected outstanding claims. These projected outstanding claims are then further multiplied by the future inflation index from the year of valuation to the future year of payment of the outstanding claims.
The resulting claims estimated is discounted to the valuation date using a discount factor raised by years as a result of applying historical inflation rates to determine the appropriate discount rate to allow for a margin of prudence.The future claims (the ultimate claim amount less paid claims to date) are allowed payment periods in line with the development patterns. The outstanding claims reported and that paid to date are then subtracted from the total future claims to give the resulting IBNR figure per accident year or quarter, i.e. IBNR = (Ultimate claim amount) minus (paid claims till date) minus (claims outstanding).Assumptions underlying the Discounted Inflation-adjusted Basic Chain Ladder method
This method assumes the following:
- The future claims follows a trend pattern from the historical data - Payment patterns will be broadly similar in each accident year. Thus, the proportionate increases in the known cumulative payments from one development year to the next is used to calculate the expected cumulative payments for the future development periods. - The runoff period is six (6) years and hence the method assumes no more claims will be paid subsequently.
Expected loss ratio methodThis method was adopted where the volume of data available is too small to be credible when using a statistical approach. Special risk reserves were estimated based on this method. Under this method, the ultimate claims were obtained by assuming loss ratio of 50%, where loss ratio is defined as claims incurred divided by earned premiums. Outstanding claims is stated as amount estimated less paid claims.
(ii) Life businessThese contracts insure events associated with human life (for example, death or survival) over a long duration. Premiums are recognized as revenue when they become payable by the contract holder. Premiums are shown before deduction of commission.
Benefits are recorded as an expense when they are incurred.
A liability for contractual benefits that are expected to be incurred in the future is recorded when the premiums are recognized. The liability is determined as the sum of the expected discounted value of the benefit payments and the future administration expenses that are directly related to the contract, less the expected discounted value of the theoretical premiums that would be required to meet the benefits and administration expenses based on the valuation assumptions used (the valuation premiums). The liability is based on assumptions as to mortality, persistency, maintenance expenses and investment income that are established at the time the contract is issued. A margin for adverse deviations is included in the assumptions.
Where insurance contracts have a single premium or a limited number of premium payments due over a significantly shorter period than the period during which benefits are provided, the excess of the premiums payable over the valuation premiums is deferred and recognised as income in line with the unexpired insurance risk of the contracts in force or, for annuities in force, in line with the amount of future benefits expected to be paid.The liabilities are recalculated at each balance sheet date using the assumptions established at the inception of the contracts.
Actuarial valuation of the life fund is conducted annually to determine the net liabilities on the existing policies and the adequacy of the assets representing the insurance funds as at the date of the valuation. All deficits arising, therefore, are charged to the income statement while the surplus is appropriated to the shareholders and credited to the income statement.
2.16 Investment contractsInvestment contracts are those contracts that transfer financial risk with no significant insurance risk.Investment contracts with guaranteed and fixed terms are initially measured at a fair value less transaction cost that is incremental and directly attributable to the acquisition or issue of the contract.
The Group re-estimates at each reporting date the expected future cash flows and recalculate the carrying amount of the financial liability by calculating the present value of estimated future cash flows using the financial liability's original effective interest rate. Any adjustment is immediately recognized as income or expense in the income statement.
2.17 Trade and other payablesTrade and other payables are recognized initially at fair value and subsequently measured at amortized cost using the effective interest method. The fair value of a non-interest bearing liability is its discounted repayment amount. If the due date of the liability is ‘less than one year’ discounting is omitted.
2.18 ProvisionsA provision is recognized if, as a result of a past event, the Group has a present legal or constructive obligation that can be estimated reliably, and it is probable that an outflow of economic benefits will be required to settle the obligation.
Provisions are determined by discounting the expected future cash flows discounted at a rate that reflects current market assessments of the time value of money and the risks specific to the obligation.
2.19 Employee benefitsShort-term benefitsShort-term employee benefit obligations include wages, salaries and other benefits which the Group has a present obligation to pay, as a result of employees' services provided up to the balance sheet date. The accrual is calculated on an undiscounted basis, using current salary rates.
OVERVIEWBUSINESSREVIEW GOVERNANCE
GROUP FINANCIALSTATEMENTS APPENDIX
43www.leadway.comAnnual Report & Accounts 2016

For the year ended 31 December 2016
Company Information and Summary ofSignificant Accounting Policies
A provision is for the amount expected to be paid under short-term cash bonus or profit-sharing plans if the Group has a present legal or constructive recognizedobligation to pay this amount as a result of past service provided by the employee and the obligation can be estimated reliably.
Post Employment BenefitsThe Group operates a defined contributory retirement scheme as stipulated in the Pension Reform Act 2004. Under the defined contribution scheme, the Group pays fixed contributions of 10% to a separate entity - Pension Fund Administrators; employees also pay the same fixed percentage to the same entity. Once the contributions have been paid, the Group retains no legal or constructive obligation to pay further contributions if the Fund does not hold enough assets to finance benefits accruing under the retirement benefit plan. The Group's obligations are recognized in the income statement.
Termination benefitsTermination benefits are payable whenever an employee's employment is terminated before the normal retirement date or whenever an employee accepts voluntary redundancy in exchange for these benefits. The Group recognizes termination benefits when it is demonstrably committed either to terminate the employment of current employees according to a detailed formal plan without possibility of withdrawal, or to provide termination benefits as a result of an offer made to encourage voluntary redundancy if it is probable that the offer will be accepted and the number of acceptances can be estimated. Benefits falling due more than 12 months after balance sheet date are discounted to present value.
2.20 Income tax(i) Current taxIncome tax comprises of current and deferred tax. Income tax expense is recognized in the income statement except to the extent that it relates to items recognized directly in equity, in which case it is recognized in equity.Current tax is the expected tax payable on taxable income for the year, using tax rates enacted or substantively enacted at the balance sheet date, and any adjustment to tax payable in respect of previous years.
(ii) Deferred taxationDeferred taxation, which arises from timing differences in the recognition of items for accounting and tax purposes, is calculated using the liability method. Deferred taxation is provided fully on timing differences, which are expected to reverse at the rate of tax likely to be in force at the time of reversal. A deferred tax asset is recognized to the extent that it is probable that future taxable profits will be available against which the associated unused tax losses and deductible temporary differences can be utilized. Deferred tax assets are reduced to the extent that it is no longer probable that the related tax benefit will be realized.
Deferred tax is not recognised for the following temporary differences: the initial recognition of assets or liabilities in a transaction that is not a business combination and that affects neither accounting nor taxable profit, differences relating to investments in subsidiaries to the extent that they probably will not reverse in the foreseeable future and differences arising from investment property measured at fair value whose carrying amount will be recovered through use. Deferred tax assets are reviewed at each reporting date and are reduced to the extent that it is no longer probable that the related tax benefit will be realized.
Additional income taxes that arise from the distribution of dividends are recognized at the same time as the liability to pay the related dividend is recognized.
2.21 Share capital and reservesShare capitalThe Group classifies ordinary shares and shares premium as equity when there is no obligation to transfer cash or other assets.Incremental costs directly attributable to the issue of shares are recognized as deductions from equity net of any tax effects.
Dividend on ordinary sharesDividend distribution to the Group's shareholders is recognized as a liability in the financial statements in the period in which the dividends are approved by the Group's shareholders. Dividends that are proposed but not yet declared are disclosed in the notes to the financial statements. Dividends on the Group's ordinary shares are recognized in equity in the period in which they are paid or if earlier, approved by the Group's shareholders.
(a) Contingency reservesThe Group maintains contingency reserves in accordance with the provisions of the Insurance Act 2003 to cover fluctuations in securities and variations in statistical estimates at the rate equal to the higher of 3% of total premium or 20% of the total profit after taxation until the reserve reaches the greater of minimum paid up capital or 50% of net premium for non-life business. Contingency reserve for life business is credited with the higher of 1% of the gross premium and 10% of profit after taxation.
(b) Assets revaluation reservesAssets revaluation reserves represent the fair value differences on the revaluation of items of Property and equipment as at the balance sheet date.
(c) Fair value reservesFair value reserves represents the fair value gains or losses on valuation of financial assets measured at fair value through equity.
(d) Treasury sharesWhere the company or any member of the Group purchases the company's share capital, the consideration paid is deducted from the shareholders' equity as treasury shares until they are cancelled or disposed of. Where such shares are subsequently sold or reissued, any consideration received is included in shareholders' equity.
2.22 Earnings per shareThe Group presents basic earnings per share for its ordinary shares. Basic earnings per share are calculated by dividing the profit attributable to ordinary shareholders of the group by the number of shares outstanding during the year.
Earnings per share are determined by dividing the income statement attributable to ordinary shareholders by the weighted average number of ordinary shares adjusted for the bonus shares issued.
2.23 Revenue RecognitionRevenue comprises the fair value of services, net of value-added tax, after eliminating revenue within the Group. Revenue is recognized as follows:
www.leadway.comAnnual Report & Accounts 201644
RC 7588

(i) Insurance contracts:See accounting policy 2.14 b(i) for recognition of premium on insurance contracts.
(ii) Investment and other operating incomeInvestment income comprises interest income earned on short-term deposits, rental income and income earned on trading of securities including all realized and unrealized fair value changes, interest income on loans and finance leases, dividends and foreign exchange differences. Investment income is accounted for on an accrual basis.
Other operating income comprise of fee income and profit on disposal of property and equipment,
(iii) Dividend incomeDividend income for available for sale equities is recognized when the right to receive payment is established.
(iv) Rendering of ServicesRevenue arising from asset management and other related services offered by the Group are recognized in the accounting period in which the services are rendered.
Fee income consists primarily of investment management fees and pension administration fees. These fees are recognized in the period in which the services are rendered.
2.24 Management ExpenseManagement expenses are expenses other than claims and underwriting expenses. They include depreciation expenses and other operating expenses. They are recognized on an accrual basis.
2.25 InventoriesInventories are stated at the lower of cost and net realizable value. Cost is determined using the weighted average method and includes expenditure incurred in acquiring the inventories, production or conversion costs and other costs incurred in bringing them to their existing location and condition.
Net realizable value is the estimated selling price in the ordinary course of business, less applicable variable selling expenses.
For the year ended 31 December 2016
Company Information and Summary ofSignificant Accounting Policies
OVERVIEWBUSINESSREVIEW GOVERNANCE
GROUP FINANCIALSTATEMENTS APPENDIX
45www.leadway.comAnnual Report & Accounts 2016

ASSURANCE COMPANY LIMITED
Registered Office:
Website:E-mail:
Corporate Office:
Connect with us on:

Group Financial StatementsIn this section:
The statutory financial statements of both the Group and the Company and associated audit reports.
484950525354
Consolidated Statement Of Financial Position..........................................Consolidated Statement Of Comprehensive Income................................Consolidated Statement Of Changes In Equity.........................................Company Statement Of Changes In Equity................................................Consolidated Statement Of Cash Flows.....................................................Notes To The Financial Statements...............................................................

As at 31 December 2016Consolidated Statement of Financial Position (All amounts in thousands of Nigerian Naira unless otherwise stated)
Notes Group 31-Dec-2016
Group 31-Dec-2015
Company 31-Dec-2016
Company 31-Dec-2015
ASSETS Cash and cash equivalents 6 26,018,694 17,031,040 24,189,697 14,656,941 Trade receivables 7 169,761 543,971 169,761 543,971 Investment securities 8 - Financial assets at fair value
through profit or loss 8.1 69,429,589 66,322,015 69,326,992 66,214,502
- Available for sale financial assets 8.2 11,210,932 9,603,510
16,478,385
11,206,175
30,508,078
9,598,753
15,697,784
- Held to maturity financial assets 8.3 32,952,921
Reinsurance assets 9 11,720,783 11,405,947 11,720,783 11,405,947 Deferred acquisition cost 10 486,416 423,123 486,416 423,123 Other receivables and prepayments 11 2,137,103 2,281,698 1,115,754 1,114,898 Loans and advances 12 2,463,338 1,919,857 797,368 1,217,079 Property and equipment 13 6,063,939 5,977,671 3,645,335 3,760,439 Investment properties 14 8,820,070 9,537,000 8,159,419 8,795,000 Investment in subsidiaries 15 - 3,637,495 3,294,467 Deferred tax assets 16 286,446 114,129 286,446 114,129 Intangible assets 17 3,899,894 3,640,910 313,804 31,308 Statutory deposits 18 500,000 500,000 500,000 500,000TOTAL ASSETS 176,159,886 145,779,256 166,063,523 137,368,341
LIABILITIES Trade payables 19 2,754,639 2,714,107 2,754 ,639 2,714,107 Current income tax liabilities 20 1,535,019 1,122,772 900,143 651,998 Other liabilities 21 8,964,205 5,355,278 7,097,390 3,895,636 Borrowings 22 204,623 118,446 - - Insurance contract liabilities 23 104,757,646 93,785,535 104,757,646 93,785,535 Investment contract liabilities 24 18,294,287 15,459,507 18,294,287 15,459,507 Deferred tax liabilities 16 825,997 741,772 728,673 556
, 356 TOTAL LIABILITIES 137,336,416 119,297,417 134,532,778 117,063,139 EQUITY Issued and paid up share capital 25 4,682,450 4,389,798 4,682,450 4,389,798 Share premium 25 4,233,748 387,826 4,233,748 387,826 Retained earnings 25 15,624,296 10,838,357 11,537,043 7,232,879 Other reserves 25 11,621,100 8,774,791 11,077,504 8,294,699 TOTAL EQUITY ATTRIBUTABLE TO OWNERS OF THE COMPANY -
36,161,594
24,390,772
31,530,745
20,305,202
Non-controlling interest 26 2,661,876 2,091,067 - -TOTAL EQUITY 38,823,470 26,481,839 31,530,745 20,305,202
TOTAL EQUITY AND LIABILITIES 176,159,886 145,779,256 166,063,523 137,368,341
SIGNED ON BEHALF OF THE BOARD OF DIRECTORS ON 18 APRIL 2017 BY:
____________________________ ____________________________ ____________________________Mr. Oye Hassan-Odukale Ms. Adetola Adegbayi Mr. David Ayodele Onilado FRC/2013/IODN/00000001963 FRC/2013/CIIN/00000002071 FRC/2012/ICAN/00000000482Group Chief Executive Officer Executive Director Chief Financial Officer
The notes on pages 54 to 133 are an integral part of these consolidated financial statements.
www.leadway.comAnnual Report & Accounts 201648
RC 7588

For the year ended 31 December 2016Consolidated Statement of Comprehensive Income (All amounts in thousands of Nigerian Naira unless otherwise stated)
Notes
27 52,700,272 46,640,828 52,718,567 46,648,918 Gross premium income 27 53,655,158 51,064,481 53,673,453 51,072,571 Reinsurance expenses 28 (12,398,398) (11,125,406) (12,398,398) (11,125,406)
premium income 41,256,760 39,939,075 41,275,055 39,947,165 Fees and commission income 29 1,853,853 906,494 1,853,853 906,494 Underwriting income 43,110,613 40,845,569 43,128,908 40,853,659 Claims expenses 30 (23,062,634) (14,364,108) (23,062,927) (14,364,461) Increase in Annuity fund (4,429,557) (33,954,433) (4,429,557) (33,954,433) Increase in individual life fund (42,413) (570,962) (42,413) (570,962) Underwriting expenses 31 (5,041,651) (4,377,614) (5,041,651) (4,377,614)
Total underwriting profit / (loss) 10,534,358 (12,421,548) 10,552,360 (12,413,811) Investment income 32 10,762,301 9,595,339 10,490,455 7,340,580 Profit/loss on investment contracts (355,520) 875,718 (355,520) 875,718 Net fair value gain/(loss) on assets at fair value
33 (17,500,004) 14,927,625 (17,415,674) 14,756,257
Other operating income 34 14,885,700 3,617,631 10,736,521 1,041,750 Employee benefit expenses 35 (3,331,627) (2,330,501) (1,989,513) (1,512,531) Other operating expenses 36 (5,628,190) (4,763,710) (4,286,250) (3,330,195) Finance cost Net impairment gains/(losses) Share of profit of investments accounted for using the equity method Profit before tax
- 201,177 - -
8,791,606 9,301,030 7,361,449 6,484,941
Income tax expense 39 (1,206,754) (413,974) (699,492) (105,012)Profit for the year 7,584,852 8,887,056 6,661,957 6,379,929Other comprehensive income: Items that may be subsequently reclassified to the profit or loss account:
Changes in available -for-sale financial assets net of taxes 1,386,418 (1,442,418) 1,386,864 (1,441,382) Net amount transferred to the income statement
Items within OCI that will not be reclassified to the profit or loss:
(30,353) - (30,353) -
Gain on revaluation of properties and equipment net of tax 15,733 198,496 68,501 253,855
Profit attributable to:7,143,178 8,711,508 6,661,957 6,379,929
- Non-controlling interest 441,674 175,548 - -
Total Comprehensive income attributable to:
- Owners of the Company 8,540,727 7,494,712 8,086,969 5,192,402 - Non-controlling interest 415,923 148,422 - -
Earnings per Share (kobo): -
The notes on pages 54 to 133 are an integral, part of these consolidated financial statements.
Group 31-Dec-2016
Group 31-Dec-2015
Company 31-Dec-2016
Company 31-Dec-2015
OVERVIEWBUSINESSREVIEW GOVERNANCE
GROUP FINANCIALSTATEMENTS APPENDIX
49www.leadway.comAnnual Report & Accounts 2016
Gross premium written
Net
37 (155,829) (30,948) - - 38 (419,583) (369,753) (370,930) (272,827)
Total underwriting expense (32,576,255) (53,267,117) (32,576,548) (53,267,470)
9,367,018 9,500,554 7,732,379 6,757,768
Other comprehensive income for the year
1,371,798 (1,243,922) 1,425,012 (1,187,527)
Total comprehensive income for the year 8,956,650 7,643,134 8,086,969 5,192,402
- Owners of the Company
Profit for the year 7,584,852 8,887,056 6,661,957 6,379,929
Total comprehensive income for the year 8,956,650 7,643,134 8,086,969 5,192,402
-Basic/diluted 40 84 108 72 73
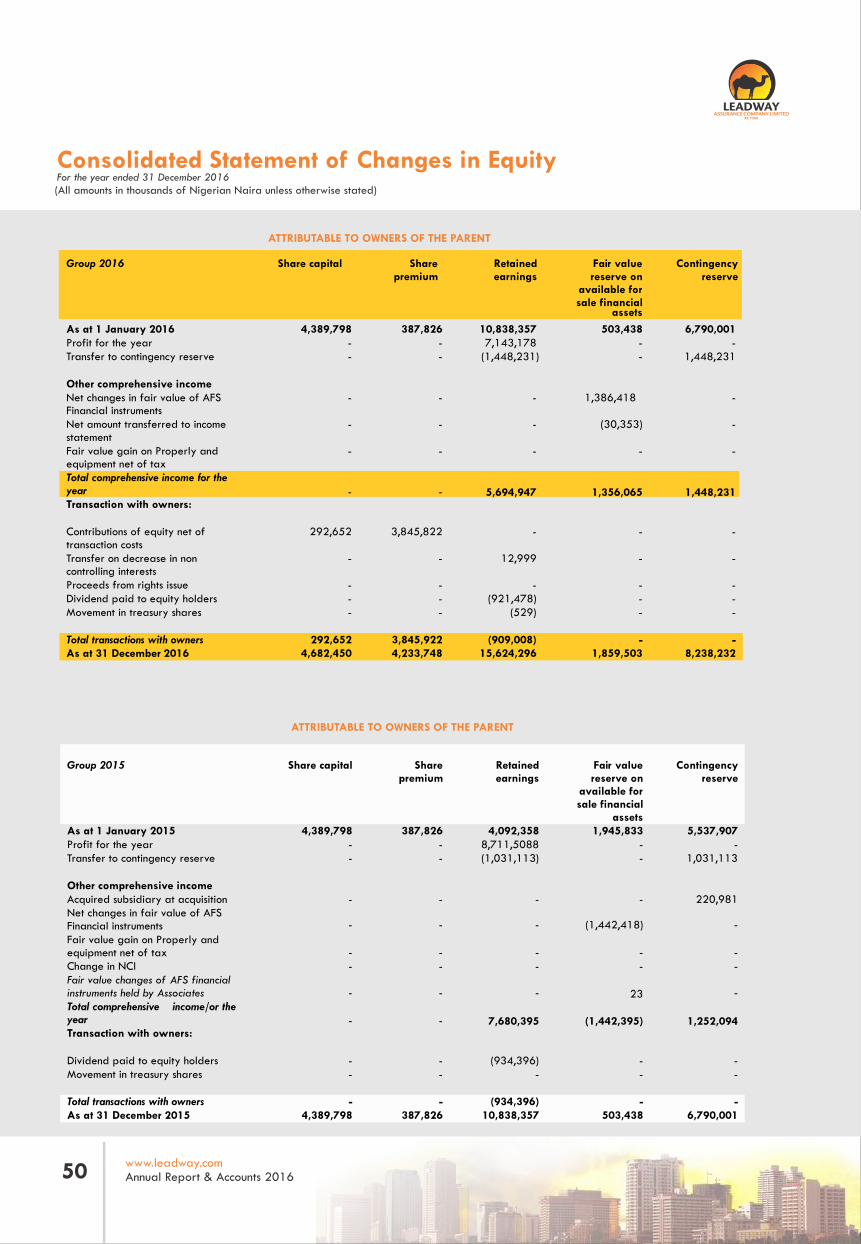
www.leadway.comAnnual Report & Accounts 201650
RC 7588
Consolidated Statement of Changes in Equity (All amounts in thousands of Nigerian Naira unless otherwise stated)For the year ended 31 December 2016
ATTRIBUTABLE TO OWNERS OF THE PARENT
Group 2016
As at 1 January 2016 Profit for the year Transfer to contingency reserve Other comprehensive income Net changes in fair value of AFS Financial instruments Net amount transferred to income statement Fair value gain on Properly and equipment net of taxTotal comprehensive income for the yearTransaction with owners: Contributions of equity net of transaction costs Transfer on decrease in noncontrolling interests Proceeds from rights issue Dividend paid to equity holders Movement in treasury shares
Total transactions with owners As at 31 December 2016
Share capital
4,389,798 - -
-
-
-
-
292,652
-
- - -
292,6524,682,450
Share premium
387,826 - -
-
-
-
-
3,845,822
-
- - -
3,845,9224,233,748
Retained earnings
10,838,357 7,143,178
(1,448,231)
-
-
-
5,694,947
-
12,999
- (921,478)
(529)
(909,008)15,624,296
Fair value reserve on
available for sale financial
assets503,438
- -
1,386,418
(30,353)
-
1,356,065
-
-
- - -
-1,859,503
Contingency reserve
6,790,001-
1,448,231
-
-
-
1,448,231
-
-
---
-8,238,232
ATTRIBUTABLE TO OWNERS OF THE PARENT
Group 2015 Fair value reserve on
available for sale financial
assets
Contingency reserve
As at 1 January 2015 1,945,833 5,537,907 Profit for the year - - Transfer to contingency reserve - 1,031,113 Other comprehensive income Acquired subsidiary at acquisition - 220,981 Net changes in fair value of AFS Financial instruments (1,442,418) - Fair value gain on Properly and equipment net of tax
-
-
Change in NCI - - Fair value changes of AFS financial instruments held by Associates 23 - Total comprehensive income/or the year (1,442,395) 1,252,094 Transaction with owners: Dividend paid to equity holders - - Movement in treasury shares - -
Total transactions with owners - -As at 31 December 2015
Share capital
4,389,798 - -
-
-
-
-
-
-
- -
- 4,389,798
Share premium
387,826 - -
-
-
-
-
-
-
- -
- 387,826
Retained earnings
4,092,3588,711,5088(1,031,113)
-
-
--
-
7,680,395
(934,396)-
(934,396)10,838,357 503,438 6,790,001
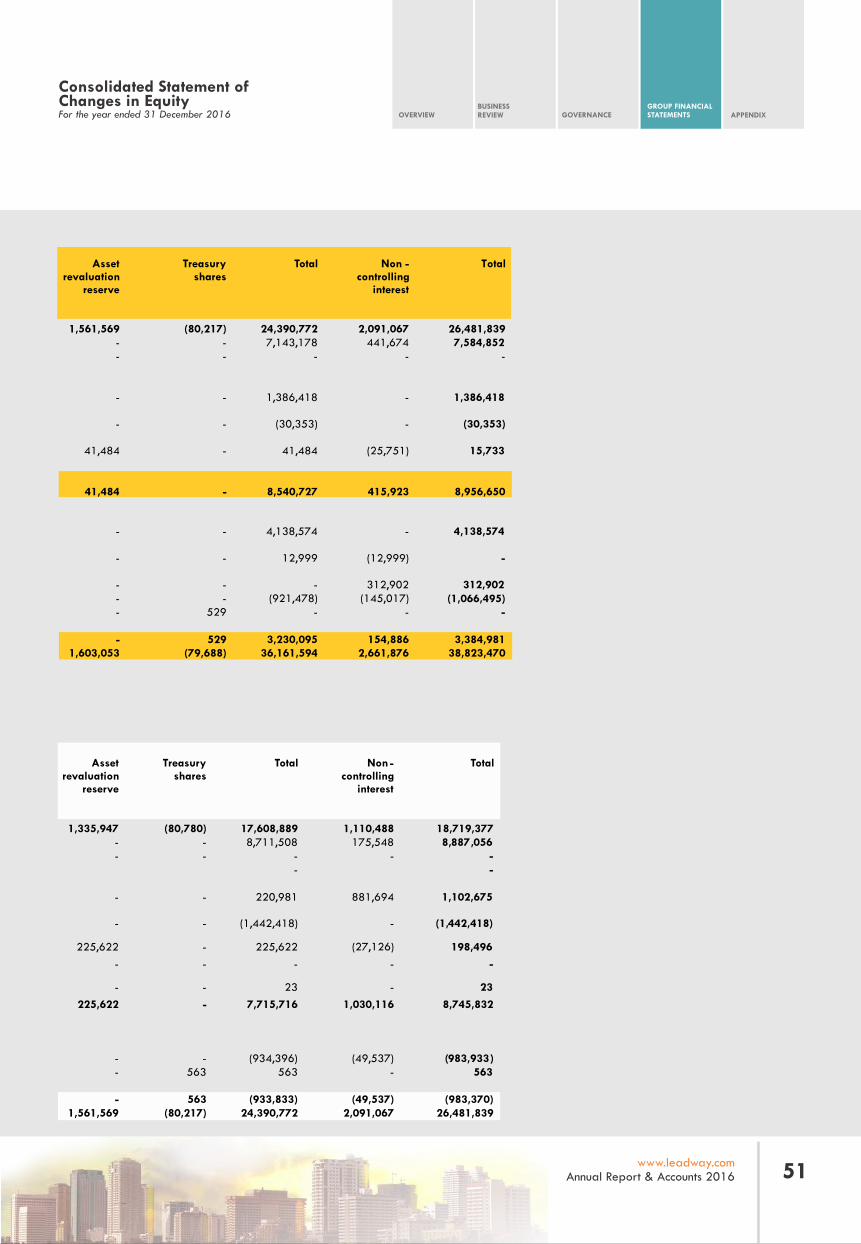
OVERVIEWBUSINESSREVIEW GOVERNANCE
GROUP FINANCIALSTATEMENTS APPENDIX
51www.leadway.comAnnual Report & Accounts 2016
1,561,569 (80,217) - - - -
- -
- -
41,484 -
41,484 -
- -
- -
- - - - - 529
- 529 1,603,053 (79,688)
Asset revaluation
reserve
Treasury shares
Total Non -controlling
interest
Total
24,390,772 2,091,067 26,481,839 7,143,178 441,674 7,584,852
- - -
1,386,418 - 1,386,418
(30,353) - (30,353)
41,484 (25,751) 15,733
8,540,727 415,923 8,956,650
4,138,574 - 4,138,574
12,999 (12,999) -
- 312,902 312,902 (921,478) (145,017) (1,066,495)
- - -
3,230,095 154,886 3,384,981 36,161,594 2,661,876 38,823,470
Asset revaluation
reserve
Treasury shares
Total Non -controlling
interest
Total
1,335,947 (80,780) 17,608,889 1,110,488 18,719,377 - - 8,711,508 175,548 8,887,056 - - - - - - -
- - 220,981 881,694 1,102,675
- - (1,442,418) - (1,442,418)
225,622 - 225,622 (27,126) 198,496 - - - - -
- - 23 - 23 225,622 - 7,715,716 1,030,116 8,745,832
- - (934,396) (49,537) (983,933) - 563 563 - 563
- 563 (933,833) (49,537) (983,370) 1,561,569 (80,217) 24,390,772 2,091,067 26,481,839
Consolidated Statement ofChanges in Equity For the year ended 31 December 2016

(All amounts in thousands of Nigerian Naira unless otherwise stated)
Company Statement of Changes in Equity For the year ended 31 December 2016
Company 2015 Share capital Share
premium Retained earnings
Fair value reserve on
available for sale financial
assets
Contingency reserve
Asset revaluation
reserve
Total
As at 1 January 2015 4,389,798
387,826 2,646,251 1,959,931 5,537,908 1,041,086 15,962,800
Profit for the year
- 6,379,929 - - - 6,379,929 Transfer to contingency reserve
- (943,301) - 943,301 - -
Other comprehensive income
Net changes in fair value of AFS Financial instruments
- - (1,441,382) - - (1,441,382)
Fair value gain on Properly and equipment net of tax
- - - - 253,855 253,855
Total comprehensive income for the year
- 5,436,628 (1,441,382) 943,301 253,855 5,192,402
Transaction with owners:
Dividend paid - (850,000) - - - (850,000)
Total transactions with owners of equity
- (850,000) - - - (850,000)
Company 2016 Share capital
Share premium
Retained earnings reserve on
available for
assets
Contingency reserve
Asset revaluation
reserve
Total
As at 1 January 2016 4,389,798 387,826 7,232,879 518,549 6,481,209 1,294,941 20,305,202 Profit for the year - - 6,661,957 - - - 6,661,957 Transfer to contingency reserve - - (1,357,793) - 1,357,793 - - Other comprehensive incomeNet changes in fair value of AFS Financial instruments
- - - (1,386,864) - - (1,386,864)
Fair value gain on Properly and equipment net of tax
- - - (30,353) - -
Total comprehensive income for the year
- - 5,304,164 1,356,511 1,357,793 68,501 8,086,969
Transaction with owners: Dividend paid - - (1,000,000) - - - (1,000,000) Total transactions with owners of equity 292,652 3,845,922 (1,000,000) - - - 3,138,574
68,501 68,501
Contributions of equity net of transaction cost 292,652 -3,845,922 - - - 4,138,574
Movement Entries- -
-
-
-
--
Net amount transferred to income statement (30,353)
sale financial
Fair value
As at 31 December 2016 4,682,450 4,233,748 11,537,043 1,875,060 7,839,002 1,363,442 31,530,745
www.leadway.comAnnual Report & Accounts 201652
As at 31 December 2015 387,826 7,232,879 518,549 6,481,209 1,294,941 20,305,2024,389,798
RC 7588

OVERVIEWBUSINESSREVIEW GOVERNANCE
GROUP FINANCIALSTATEMENTS APPENDIX
53www.leadway.comAnnual Report & Accounts 2016
Consolidated Statement of Cash Flows(All amounts in thousands of Nigerian Naira unless otherwise stated) For the year ended 31 December 2016
Notes Group 31-Dec-16
Group 31-Dec-15
Company 31-Dec-16
Company 31-Dec-15
Operating activities
Insurance premium received 27 52,700,272 46,391,355 52,718,567 46,399,445 Reinsurance premium paid 28 (11,299,753) (7,021,137) (11,299,753) (7,021,137) Reinsurance commission received 29 1,853,853 906,494 1,853,853 906,494 Insurance benefits and claims paid 30 (19,178,830) (12,704,338) (19,179,123) (12,704,691) Deposit received on investment contracts 24 5,051,290 3,983,855 5,051,290 3,983,855 Claims paid on investment contracts 24 (3,653,975) (2,247,956) (3,653,975) (2,247,956) Reinsurance claims received 30 2,024,611 373,080 2,024,611 373,080 Commission paid (3,843,378) (4,950,917) (3,843,378) (4,950,917) Premium received in advance 3,136,602 - 3,136,602 - Cash paid to insurance brokers and reinsurers 10 (1,485,844) (2,426,036) (1,485,844) (2,426,036) Cash paid to external parties (1,370,394) (6,662,899) (1,515,845) (4,507,440)
23,934,454 15,641,501 23,807,005 17,804,697Corporate tax paid 20 (533,416) (572,570) (451,347) (428,951)
23,401,038 15,068,931 23,355,658 17,375,746 Cash flows from investing activities Investment income received 11,396,068 8,023,359 11,383,072 5,492,430 Purchase of investment property 14 (9,156) (663,984) (6,176) (464,569) Dividend received 725,486 - 725,486 - Other income received 2,526,298 3,136,270 390,618 594,969 Proceeds on disposal of property and equipment
18,742 6,199 14,919 6,199
Payments for Financial assets designated at fair value
8.1 (27,147,171) (20,505,311) (27,152,086) (20,505,311)
Payments for available for sale financial asset 8.2 (727,635) (1,209,302) (727,635) (1,037,481) Payments for Held to Maturity Investment Securities
8.3 (17,318,396) (2,812,999) (15,788,823) (2,812,999)
Payments for Loans and Receivables (2,644,368) (952,326) (804,453) (434,964) Payments for intangible assets 17 (372,866) - (366,213) - Purchase of property and equipment 13 (1,197,489) (682,213) (223,198) (324,111) Proceeds on disposal of Investment Securities 8,267,717 5,473,893 8,267,717 5,205,030 Loans repayment received 2,024,001 - 905,159 - Proceeds from disposal of associates - 997,489 - 997,489 Payment for right issue to subsidiary - - (178,500) - Payment for acquisition of subsidiary, net of cash acquired
- (1,973,604) - (2,000,000)
(24,458,769) (11,162,529) (23,560,113) (15,283,318)Net cash used in investing activities
Cash flows from financing activities Dividend paid to equity holders (parents) (921,478) (934,396) (1,000,000) (850,000) Dividend paid to equity holders (NCI) Proceeds from rights issue
(145,017) (49,537) - -
Repayments of borrowings 312,902 - - - Additions to borrowings 22 (118,446) - - - Proceeds from issue of shares 22 204,623 55,290 - -
4,138,574 4,138,574
Net increase in cash and cash equivalents
2,413,427
2,977,758
2,934,119
1,242,428 Effect of exchange rate fluctuations on cash held
6,495,082 451,033 6,519,492 447,493
Cash and cash equivalents at beginning of year
6 17,110,185 13,681,394 14,736,086 13,046,165
Cash flows from investing activities 6 26,018,694 17,110,185 24,189,697 14,736,086
Net cash used in operating activities
- - Net cash used in financing activities 3,471,158 (928,643) 3,138,574 (850,000)

www.leadway.comAnnual Report & Accounts 201654
RC 7588
Notes to the financial statementsFor the year ended 31 December 2016
ENTERPRISE RISK MANAGEMENT (ERM) STATEMENT
3 . IntroductionLeadway Assurance Company Limited (Leadway) applies an entity-wide approach to its risk management process such that both existing and anticipated risks are identified upfront and appropriate responses are applied to reduce the likelihood of the risk downside while exploiting the opportunities inherent in the risks, thus creating value. The ERM framework has assisted all levels of operation in achieving the company's strategic objectives through systematic and portfolio approach to evaluating and improving on the effectiveness of risk management and control.
PurposeThe general purpose of Leadway's ERM Framework is to provide the internal stakeholders with the guidance that ensures that all decisions made and activities conducted with regard to risk management are in congruence with the entity's goals and business units' objectives.
The specific benefits we envisage gaining from our ERM framework are to:- Protect and strengthen the company's capital base such that risk acceptances are guided by our Risk Appetite Framework and exposures are curtailed
within tolerance limits.
- Give reasonable assurance to our policyholders and the regulators about our ability to pay promptly claims to arise now and in the future.
- Communicate the risks being taken by the company to the investors and ensure that the objectives of the organization are aligned with the expectations of capital providers.
- Reduce Leadway's susceptibility to systemic risks generated by other sectors in the financial system.
- Make our capital requirements more risk- sensitive and to improve the alignment of our company's capital standards.
- Provide the means to promote and demonstrate best practices in governance and risk management, and deliver more efficient use of capital.
Enterprise Risk Management Culture and Philosophy- Our risk management philosophy and culture represent our shared values, attitude, and practice of how we consider risk in our day-to-day operations
across all levels. As insurers, we anticipate risks and in advance, respond appropriately.
- We regard every one of our employees as a risk manager and we all take individual and collective ownership of the ERM responsibilities.
- We observe prudence in underwriting and limit risks to our appetite and set tolerances beyond which we object to unguided.
- We weigh the risk and reward inherent in our daily transactions and pursue those that support value creation to all customers and shareholders.
- We have no tolerance for infractions of laws and regulations and we detest business relationship with disreputable business entities and individuals.

Notes to the financial statementsFor the year ended 31 December 2016 OVERVIEW
BUSINESSREVIEW GOVERNANCE
GROUP FINANCIALSTATEMENTS APPENDIX
55www.leadway.comAnnual Report & Accounts 2016
- We have recorded visible improvement in our risk management strategy that has helped us sustain our leadership position in the Nigerian insurance market and surpass stakeholders' expectations.
- Leadway will continue to pursue value-based risk management objective that strives for an optimal trade- off between risk and reward.Risk Management StrategyOur risk management methodology recognizes that there cannot be the total elimination of risk but we are determined to reduce both the severity and probability of the occurrence of risk events through appropriate responses. We have deployed an ERM policy that focuses on taking an enterprise-level view of the inter-relationship among various risks with a view to providing effective responses to managing the material risks that present the greatest threats to our existence and operations as an insurance and investment company. In so doing we will, in the long run, manage risks that are less significant.
We adopt the following strategies in managing risks in Leadway:i) Incorporate risk management principles into all functions and ensure an environment in which the Board and senior management set the tone for effective
controls.ii) Establish well-defined risk management process for risk identification, assessment, controlling, monitoring and reporting.iii) Entrench a structured and disciplined approach to assets balancing that will prevent concentration of risk in any sector, industry, instrument, product or
entity.iv) Formulation of policies and procedures that ensure that appropriate risk response, as well as other entity directives, internal policies and control
procedures are carried out.v) Ensure good corporate governance and pursue zero tolerance for non-compliance with regulatory compliance.
External PerspectivesLeadway has continued to be in the forefront of many industry initiatives that seek to ensure setting and adhering to global best practice. This informed its involvement in the trade, association and regulatory levels in setting the tone for compliance with legislation, regulations, guidelines, and standards designed for global ratings among insurers. The interest of regulators and notable rating agencies in bringing about the required reforms that will make insurance business more attractive to investors informed Leadway's pro-activeness to becoming the co-chair on the National Risk Assessment Group under the Presidency. We are conversant with the regulatory direction and we (re)position our business to proactively respond to both local and global insurance standards and regulations.
Risk Governance, Roles & ResponsibilitiesOur risk governance focuses on directing and controlling the management of risks within the company by spelling out the roles and responsibilities of the board, management and employees. The policy adopts the three-lines-of-defence model of risk management governance that revolves around the Board, Risk Management Committee and the Audit Committee
Risk Management StrategyOur risk management methodology recognizes that there cannot be the total elimination of risk but we are determined to reduce both the severity and probability of the occurrence of risk events through appropriate responses.
Roles and Responsibilities
The Board- The board has the ultimate accountability for the risk and the related control environment and as such, is responsible for the following:- To approve the risk management framework, set the risk appetite/tolerance level and the risk management strategy escalated to it, from time to time.- To appraise the risk management process and the internal controls for effectiveness, appropriateness, and adequacy.- To ensure that the company's ERM Framework is subject to periodic audit by competent personnel independent of the company's risk management
functions.
Board Risk & Technical Committee- To review risk management framework and policies and present same for board's approval.- Ensure that the ERM framework takes a portfolio view of risk and that strategy and objectives formulation are predicated on sound understanding and
assessment of major risks.- To challenge risk information and examine the appropriateness of the judgments underlying the setting of the company's risk tolerance /limits.
Risk Management Committee- To establish an appropriate structure that recognizes the required level of independence between the risk management officers and those engaged in
the normal insurance operations.- Put in place, a well-resourced risk management department with clearly defined responsibilities and authorities for the company s risk management
activities.- Develop risk management initiatives and regularly review the company's methodology for risk identification, assessment. measurement, mitigation, and
report escalation.- Design and document risk policies and procedures that reflect changes in entity-risk portfolio and ensure their enterprise-wide implementation.
Business Units- Many of the operational risks reside in the business units and risk owners/champions in these units have responsibilities for risk management in the
respective risks. Specifically, business is responsible for the following:- To carry out a weekly review of risks profile in the department/unit in compliance with the entity's risk policies and procedures.- Apply appropriate control measures to manage identified risks and solicit the involvement of the Risk Management & Compliance Department in the
escalation of material risks to Risk Management Committee.- Be involved in all activities designed to propagate risk management culture within the company and in building firewalls against emerging exposures
that may affect the achievement of the company's objectives.- Produce risk management reports input for consolidation into the overall report repository domiciled in the Risk Management & Compliance Department.- Provide information towards the development of new approaches to risk management in its domain and collaborate with RMCD Department to prepare
appropriate risk mitigation plans for the unit.

Enterprise Risk Management Division- Responsible for facilitation and coordination of risk management activities across the company.- Provision of technical assistance and guidance to business units. It will be responsible for raising awareness of risk management across the company.- Reviews and analyzes the company's business and investment proposals to ensure that risks have been adequately identified and proper mitigating
factors put in place.- Develop Key Risk Indicators (KRIs) for monitoring key drivers associated with identified major risks and regular liaison with regulators on compliance issues- Prepare for the Risk Management Committee's review, necessary exception reports with recommendations for improvement of the entire risk management
and reporting system.
- Monitor compliance with the company's ERM policies/procedures on risk limit and access the impact of regulatory" requirements will have on the
company's operations. Internal Audit
- To adopt a risk-based approach to planning and executing the internal audit process/activities by directing internal auditing resources at those areas most important to the organization.
- Evaluate the adequacy and effectiveness of controls encompassing the organization's governance, operations, and information systems.- Develop internal audit plans that identify and assess risks relevant to the activity under review and ensure that the internal auditing objectives reflect the
results of the risk assessment.- To contribute to the effectiveness of the enterprise risk management, by participating in separate evaluations of internal controls and the ERM program,
and recommending improvements.- To provide advice in the design and improvement of control systems and risk mitigation strategies.- To challenge the basis of management's risk assessments and evaluate the adequacy and effectiveness of risk treatment strategies.
Risk LandscapeThe company's risk landscape comprises of the core risks around our business operations and other risks that are external to them. The key risk classifications that have been reported include:(I) Insurance Risk - the risk of loss as a result of improper pricing or/and inadequate reserving. The risk may arise as the insurers are exposed to the risk of timing and expectation of claims and benefit payments. The risk is mitigated through a strong reinsurance program and effective underwriting strategy that diversifies through the appropriate mix.(ii) Operational Risk - the company is exposed to risks associated with process inefficiencies, system failure, human errors and external events. In mitigating the risk we deployed strategies for mining operational loss data and institute effective internal controls to minimize both the occurrence and severity of the operational risk.(iii) Market/Financial Risk - the risk of volatility in the financial market that can expose our income streams to market fluctuations, and assets value being jeopardized due to falling stock prices.(iv) Regulatory/Compliance Risk - the risk of loss arising from regulatory infractions that attract fines and penalties. The company deploys appropriate training aimed at achieving the status of 'most significantly- compliant insurer'. The company Governance and Compliance Policies are periodically audited.(v) Competition Risk: the risk of losing business and market share arising from voluntary customer attrition, price war. inefficient work process and poor service delivery. Our company is able to manage this risk through efficient, technology driven premium service delivery and prompt resolution of customer complaints that has enabled the company to sustain its market leadership status.(vi) Emerging Risk — these are risks that are developing or/and existing risks that are changing to develop other dependencies. We have envisaged that country risk and product risks will become noticeable in the ensuing periods due to the company's strategic, expansion and business growth. We have scanned the environment and have started putting in place, appropriate structures and commensurate capital charge for possible crystallization of these potential risks.
3.1 Capital Management Policies, Objectives and ApproachApproach to capital managementLeadway seeks to optimize the structure and sources of capital to ensure that it consistently maximizes returns to the shareholders and policyholders.
Leadway's approach to managing capital involves managing assets, liabilities and risks in a coordinated way, assessing shortfalls between reported and required capital level on a regular basis and taking appropriate actions to influence the capital position of the company in the light of changes in economic conditions and risk characteristics. An important aspect of the company's overall capital management process is the setting of target risk-adjusted rates of return, which are aligned to performance objectives and ensure that the Group is focused on the creation of value for shareholders.
The Group's primary source of capital includes its equity shareholders' funds and borrowings. Leadway also utilizes adequate and efficient reinsurance arrangements to protect shareholders' funds by reducing the need for further funding following unfavorable events such as catastrophes or just large random single claims.
The capital requirements are routinely forecast on a periodic basis and assessed against both the forecast available capital and the expected internal rate of return, including risk and sensitivity analyses. The process is ultimately subject to approval by the Board.
The Group has developed a framework to identify the risks and quantify their impact on the economic capital. The framework estimates how much capital is required to reduce the risk of insolvency to a remote degree of probability. The framework has also been considered in assessing the capital requirement.
The Company's objectives with respect to capital management are to maintain a capital base that is structured to exceed regulatory requirement and to decide on the efficient use of capita] by assessing the return on capital allocated to the various classes of business and/or products.
Notes to the financial statementsFor the year ended 31 December 2016
Group 31-Dec-16
N’000
Group Company Company
Maximum authorized capital
5,000,000 5,000,000 5,000,000 5,000,000
Paid up share capital 4,682,450 4,389,798 4,682,450 4,389,798
31-Dec-15 31-Dec-16 31-Dec-15N’000 N’000 N’000
www.leadway.comAnnual Report & Accounts 201656
RC 7588

Notes to the financial statementsFor the year ended 31 December 2016
The Group has different requirements depending on the specific operations which it engages in. The Group's main businesses are insurance, property development, pension and asset management, hospitality and trusteeship. The insurance business is divided into life and non-life business. Note 25a shows the authorized and paid up capital for the life and non-life businesses
Insurance industry regulator measures the financial strength of non-life insurers using a solvency margin model. NAICOM generally expect non-life insurers to comply with this capital adequacy requirement This test compares insurers' capital against the risk profile. Section 24 (1) of the Insurance Act, 2003 requires that an insurer shall in respect of its business other than its life insurance business, maintain at all times a margin of solvency being the excess of the value of its admissible assets in Nigeria over its liabilities in Nigeria. The solvency margin shall not be less than 15 percent of the gross premium income fewer reinsurance premiums paid out during the year under review or the minimum paid-up capital whichever is greater. During the year, the Company has complied with this capital requirement. The regulator has the authority to request more extensive reporting and can place restrictions on the Company's operations if the Company falls below this requirement as deemed necessary.
The Parent company has two (2) businesses i.e major lines, life, and non-life businesses and they are required to prepare solvency margin computation separately.
The company's solvency margin as at 31 December 2016 is as follows:
OVERVIEWBUSINESSREVIEW GOVERNANCE
GROUP FINANCIALSTATEMENTS APPENDIX
57www.leadway.comAnnual Report & Accounts 2016
LIABILITIESTrade payables Current Income Tax Liabilities Other Liabilities Borrowings Insurance Contract Liabilities Investment Contract Liabilities Deferred Tax Liabilities Total Liabilities
Excess of admissible assets over liabilities 27,835,496Text I Gross Premium 53,673,453 Less: Reinsurance expense (12,398,398) Net premium 41,275,055 15% thereof 6,191,258 Text II Minimum paid-up capital 5,000,000
The higher thereof: SURPLUS OF SOLVENCY 21,644,238 Solvency ratio 450%
TOTAL N’000
2,754,629900,143
7,097,390-
104,757,64618,294,287
728,673134,532,778
December 2016 ADMISSIBLE
N’0002,754,639
900,143 7,097,390
- 104,757,646 18,294,287
-133,804,105
INADMISSIBLE N’000
- - - - - -
728,673728,673
December 2016 TOTAL ADMISSIBLE INADMISSIBLE
ASSETS N’000 N’000 N’000Cash and Cash Equivalents 24,189,697 21,167,975 3,021,722 Trade Receivable 169,761 169,761 - Investment Securities 111,041,245 111,041,245 - Reinsurance Asset 11,720,783 11,720,783 - Deferred Acquisition Cost 486,416 486,416 - Other Receivables and Prepayments 1,115,754 797,368 1,115,754 Loans and Advances 797,368 313,804 - Intangible assets 313,804 3,645,335 - Property & Equipment 3,645,335 3,645,335 - Investment Properties 8,159,419 8,159,419 - Investment in Associates - - - Investment in Subsidiaries 3,637,495 3,637,495 - Deferred Tax Assets 286,446 - 286,446 Statutory Deposit 500,000 500,000 -Total Assets 166,063,523 161,639,601 4,423,922

www.leadway.comAnnual Report & Accounts 201658
RC 7588
December 2015TOTAL ADMISSIBLE INADMISSIBLE N’000 N’000 N’000
3,479,923 3,479,923 - 651,998 651,998 -
3,129,820 3,120,820 - - - -
93,785,535 93,785,535 - 15,459,507 15,459,507 -
556,356 - 556,356117,063,139 116,506,783 556,356
LIABILITIESTrade payables Current Income Tax Liabilities Other Liabilities Borrowings Insurance Contract Liabilities Investment Contract Liabilities Deferred Tax Liabilities Total Liabilities
Excess of admissible assets over liabilities 19,632,531Text I Gross Premium 51,072,571 Less: Reinsurance expense (11,125,406) Net premium 39,947,165 15% thereof 5,992,075 Text II Minimum paid-up capital 5,000,000
The higher thereof: SURPLUS OF SOLVENCY 13,640,457 Solvency ratio 328%
Notes to the financial statementsFor the year ended 31 December 2016
December 2015TOTAL ADMISSIBLE INADMISSIBLEN’000 N’000 N’000
14,656,941 14,656,941 - 543,971 543,971 -
91,511,939 91,511,039 - 11,405,947 11,405,947 -
423,123 423,123 -
1,114,898 - 1,114,898 1,217,079 1,217,079 -
31,308 31,308 - 3,760,439 3,760,439 - 8,795,000 8,795,000 -
- - - 3,294,477 3,294,467 -
114,129 - 114,129 500,000 500,000 -
137,368,341 136,139,314 1,229,027
ASSETS Cash and Cash Equivalents Trade Receivable Investment Securities Reinsurance Asset Deferred Acquisition Cost Other Receivables and Prepayments Loans and Advances Intangible assets Property & Equipment Investment Properties Investment in Associates Investment in Subsidiaries Deferred Tax Assets Statutory Deposit Total Assets

OVERVIEWBUSINESSREVIEW GOVERNANCE
GROUP FINANCIALSTATEMENTS APPENDIX
59www.leadway.comAnnual Report & Accounts 2016
Notes to the financial statementsFor the year ended 31 December 2016
BLANK PAGEFOR LEGIBILITY OF NEXT PAGE

www.leadway.comAnnual Report & Accounts 201660
RC 7588
3.2 Asset and liability management The Group is exposed to a range of financial risks through its financial assets, financially abilities, reinsurance assets and insurance liabilities. In particular, the key financial risk is that in the long-term its investment proceeds are not sufficient lo fund the obligations arising from its insurance and investment contracts. The most important components of this financial risk are interest rate risk, equity price risk, foreign currency risk and credit risk.These risks arise from open positions in interest rate, currency and equity products, all of which are exposed to general and specific market movements. The risks that the Group primarily faces due to the nature of its investments and liabilities are interest rule risk and equity price risk. The Group manages these positions within an ALM framework that has been developed to achieve long-term investment returns in excess of its obligations
under insurance and investment contracts. Within the ALM framework, the Group periodically produces reports at the portfolio, legal entity and asset and liability class level that are circulated lo the Group's key management personnel. The principal technique of the Group's ALM is lo match assets to the liabilities arising from insurance and investment contracts by reference to the type of benefits payable to contract holders. For each distinct class of liabilities, a separate portfolio of assets is maintained. The Group has not changed the processes used to manage its risks from previous periods.
The Group's ALM is integrated with the management of the financial risks associated with the Group's oilier classes of financial assets and liabilities not directly associated with insurance and investment liabilities. The notes below explain how financial risks are managed using the categories utilized in the Group's ALM framework.
The following tables reconcile the consolidated statement of financial statements lo the classes and portfolios used in the Group's ALM framework.
COMPANY
INVESTMENTS: Fixed Assets: Real Estate 2,836,453 3,134,223 - Office Equipments 161,108 - - Motor Vehicles 139,013 - - Furniture and Fittings 16,788 - - Intangible Assets 312,306 - - Others Investments - - - Commercial loans 155,380 - - Loans to Policy holders - - - Statutory Deposit 300,000 - - Treasury Bills - - - Government Bonds - - - Corporate bonds - 12,873,341 - Quoted Securities 4,311,011 - - Unquoted Securities 3,233,173 - - Bank Placements 2,987,161 14,564,613 - Bank and Cash Balances 2,364,270 - - Related Companies Securities 683,974 - - Related Companies Loans - - - Other assets (see “A” below) 2,955,934 - 9,468,909
(a) HYPOTHECATION OF ASSETS As at 31 December 2016 (All amounts in thousands of Nigerian Naira unless otherwise stated)
OTHER DETAILS (A) NONLIFE BUSINESS LIFE BUSINESS
Intangible assetsPrepaid Reinsurance St Recoverable 336,504Deferred Acquisition Expenses -Premium Debtors 5,145Deferred Tax Assets 87,682Other assets: (Staff loans, prepayments, and sundry 1,182,982TOTAL 1,612,313
Notes to the financial statementsFor the year ended 31 December 2016
11,384,279486,416164,616198,765190,766
12,424,842
11,107,112 18,294,287
641,199 2,098,260 36,816 - 78,353 - 1,498 -
- - 398,572 -
- - 200,000 251,165
- - 3,431,165 2,071,044
413,246 8,261,146 888,828 3,100,893 923,801 1,700,380 216,984 72,504 452,611 695,650
2,953,521 43,246 - -
435,549 - -
11,107,115 18,294,288
TOTAL 20,423,637 30,572,177 9,471,488
Shareholder’s Deposit Admin. Non – Life
Shareholder’s Policy Others
TOTAL 20,423,637 30,572,177 9,468,909
Fund FundFund holder’s Fund
Life

OVERVIEWBUSINESSREVIEW GOVERNANCE
GROUP FINANCIALSTATEMENTS APPENDIX
61www.leadway.comAnnual Report & Accounts 2016
335,680 822,598 11,337,706 - - 197,924 - - 217,366 - - 51,760 - - 313,804 - - - - - 557,170 - 3,218 251,165 - - 500,000
25,398 - 4,566,011 4,340,735 21,071 77,028,899
208,702 42,576 16,820,516 221,912 - 7,988,791
25,500 112,643 4,656,003 763,591 61,941 20,795,772 287,156 26,123 3,393,922
- - 3,637,495 - - - - 1,176,764 14,037,156
6,208,674 2,266,934 166,351,460
Notes to the financial statementsFor the year ended 31 December 2016
Annuity fund
67,976,792
1,469,293 - - - - - - - -
2,469,569 60,974,782
181,758 866,660 288,382
1,505,832 220,516
- - -
67,976,792
TOTALPolicy holder’s
fund (LIFE) Others
6,208,674 2,266,936 166,321,103

Notes to the financial statementsFor the year ended 31 December 2016
COMPANY
Non – Life LifeShareholder’s
FundPolicy holder’s
FundOthers Shareholder’s
FundDeposit Admin.
FundTOTAL 14,382,955 24,030,217 5,836,896 5,922,240 15,459,506
INVESTMENTS: Fixed Assets: Real Estate 2,896,000 3,400,000 391,135 2,634,594 Office Equipments 216,706 - - 51,612 - Motor Vehicles 137,045 - - 91,785 - Furniture and Fittings 62,521 - - 39,693 - Intangible Assets 19,869 - - 11,440 - Others Investments - - - - - Commercial loans 134,427 - - 727,985 - Loans to Policyholders - - - 219,975 Statutory Deposit 300,000 - 200,000 - Treasury Bills - - - 495,436 Government Bonds - - - 102.517 7,830,731 Corporate bonds - 8,290,178 - 103,225 725,890 Quoted Securities 4,090,455 - - 136,554 1,375,913 Unquoted Securities 2,613,511 - 446,914 396,98,5 Bank Placements - 7,428,377 - 54,134 1,686,791 Bank and Cash Balances - 1,390,841 - 97,241 93,191Related Companies Securities
340,946 - - 2,721,421 -
Related Companies Loans - - - - Other assets (see “A” below) 3,571,475 3,520,821 5,836,896 746,593TOTAL 14,382,955 24,030,217 5,836,896 5,922,249 15,459,506
OTHER DETAILS (A)
LIFE BUSINESS Intangible assets
NON-LIFE BUSINESS
Prepaid Reinsurance St Recoverable 11,113,773 292,175 Deferred Acquisition Expenses 423,122 - Premium Debtors 541,478 2,493 Deferred Tax Assets 55,494 Other assets: (Staff loans, prepayments, and sundry 795,324 824,967 TOTAL 12,929,191 1,119,635
(a) HYPOTHECATION OF ASSETS As at 31 December 2015 (All amounts in thousands of Nigerian Naira unless otherwise stated)
www.leadway.comAnnual Report & Accounts 201662
RC 7588

3.3 Financial Risk ManagementThe Group is exposed to a range of financial risks through its financial instrument, reinsurance assets, and insurance liabilities. The key financial risk is that in the long term its investments proceeds are not sufficient to fund the obligations arising from its insurance and investment contracts. The most important components of the financial risks are:
- Credit risks- Liquidity risks- Market risks
3.3.1 Credit risksCredit risks arise from the default of a counter-party to fulfill its on and/or off- balance sheet contractual obligations. Exposure to this risk results from financialtransactions with a counter-party including issuer, debtor, investee, borrower, broker, policyholder, reinsurer or guarantor.
The Group has policies in place to mitigate its credit risks.
(i) The Group's Enterprise risk management policy sets out the assessment and determination of what constitutes credit risk for the company. Compliance with the policy is monitored and exposures and breaches are reported to the company's risk committee. The policy is regularly reviewed for pertinence and for changes in the risk environment.
Net exposure limits are set for each counter-party or group of counter-parties, geographical and industry segment (i.e. limits are set for investments and cash deposits, foreign exchange trade exposures and minimum credit ratings for investments that may be held).
(ii) The Group further restricts its credit risk exposure by entering into master netting arrangements with counter-parties with which it enters into significant volumes of transactions. However, such arrangements do not generally result in an offset of balance sheet assets and liabilities, as transactions are usually settled on a gross basis. However, the credit risk associated with such balances is reduced in the event of a default, when such balances are settled on a net basis. The Group's reinsurance treaty contracts involve netting arrangements.
(iii) The Group's set guidelines determine when to obtain collateral and guarantees. The Group also maintains strict control limits by amount and terms on financial
Policy holder’s fund (LIFE)
Others TOTAL
6,2078,082 2,577,952 137,965,901
402,338 264,589 11,956,001 - - 268,318 - - 228,830 - - 102,214 - - 31,309 - - - - 284,758 1,147,170- - 219,975 - - 500,000 - - 495,436
3,306,942 340,123 68,625,682 331,880 - 11,369,565 575,364 394 6,959,906 223,812 379,227 4,060,449
1,367,746 203,592 12,575,542 - 500,124 2,081,397 - 232,100 3,294,467
- - - - 373,045 14,048,830
6,208,082 2,577,952 137,965,091
Notes to the financial statementsFor the year ended 31 December 2016 OVERVIEW
BUSINESSREVIEW GOVERNANCE
GROUP FINANCIALSTATEMENTS APPENDIX
63www.leadway.comAnnual Report & Accounts 2016
Annuity fund
63,547,234
1,967,345
57,045,3691,918,392
1,834,902
63,547,234
781,226
- - - - - - - - -
-
- -
- -

www.leadway.comAnnual Report & Accounts 201664
RC 7588
Company 31-Dec-15
Company 31-Dec-16
Group 31-Dec-15
3,021,722
Group 31-Dec-16
70,142,244 923,004
9,425,436
Note Group 31-Dec-16
Group 31-Dec-15
Company 31-Dec-16
Company 31-Dec-15
Cash and cash equivalents (excl. cash on hand)
6 26,014,889 17,028,033 24,186,451 14,655,333
Investment securities: - Fair value through profit or loss (excl. equity investments)
8.1 67,888,375 64,792,901 67,888,375 64,792,900
- Held to maturity - Trade receivables 8.3 32,952,921 16,478,385 30,508,078 15,697,784 Loans and advances 7 169,761 543,971 169,761 543,971 Reinsurance receivable 12 3,365,178 2,728,337 1,649,190 1,901,427 Other receivables (excl. prepayments)
9 338,532 471,660 338,532 471,660
11 753,860 943,105 315,285 552,485 Statutory deposits 18 500,000 500,000 500,000 500,000
The Group further manages its exposure to credit risk through counter-party risk via established limits as approved by the Board. These limits are determined based on credit ratings of the counter-party amongst other factors. All fixed income investments are measured for performance on a quarterly basis and monitored by management on a monthly basis.
3.3.1.2 Counter-party Risk(a) Cash and cash equivalent
The group and company's counter-party exposure of its cash and cash equivalent is represented below;
National banks 22,788,068 16,002,031 20,959,630 13,629,331 Foreign banks 999,110 3,021,722 999,110Government - - - - Investment house 205,099 26,892 205,099 26,892
National banks 87% 94% 87% 93% Foreign banks 12% 6% 12% 7%Government 0% 0% 0% 0% Investment house 1% 0% 1% 0%
(a) Investment securities The group and company's counter-party exposure of its investment securities is represented below:
Counterparty
Federal Government in Nigeria 84,949,317 70,856,377 82,504,473 State Government in Nigeria 753,387 923,004 753,387 Corporate with acceptable risk ratings 9,491,905 15,138,59315,138,592
Notes to the financial statementsFor the year ended 31 December 2016
3,021,722
assets. The amounts subject to credit risk are limited to the fair value of 'in the money' financial assets against which the Group either obtains collateral from counterparties or requires margin deposits. Collateral may be sold or repledged by the Group and is repayable if the contract terminates or the contract's fair value falls.
(iv) Reinsurance is placed with counterparties that have a good credit rating and concentration of risk is avoided by following policy guidelines in respect of counterparties' limits that are set each year by the management and are subject to regular reviews. At each reporting date, management performs an assessment of creditworthiness of reinsurers and updates the reinsurance purchase strategy, ascertaining suitable allowance for impairment.(v) The Group sets the maximum amounts and limits that may be advanced to corporate counterparties by reference to their long-term credit ratings and worthiness.
(vi) The credit risk in respect of customer balances incurred on non-payment of premiums or contributions will only persist during the grace period specified in the policy document or trust deed until expiry when the policy is either paid up or terminated. Commission paid to intermediaries is netted off against amounts receivable from them to reduce the risk of doubtful debts.
3.3.1.1 Maximum exposure to credit risk
Group 31-Dec-16
Group 31-Dec-15
Counterparty Company 31-Dec-16
Company 31-Dec-15
26,014,889 17,028,033 24,186,451 14,644,333
100,841,296
80,490,684
81,271,286 98,396,453
Counterparty Group 31-Dec-16
Group 31-Dec-15
Company 31-Dec-16
Company 31-Dec-15
100% 100% 100% 100%
Total assets exposed to credit risk
131,983,516 103,486,392 125,555,672 99,115,560

OVERVIEWBUSINESSREVIEW GOVERNANCE
GROUP FINANCIALSTATEMENTS APPENDIX
65www.leadway.comAnnual Report & Accounts 2016
Notes to the financial statementsFor the year ended 31 December 2016
BLANK PAGEFOR LEGIBILITY OF NEXT PAGE

(c) Trade ReceivablesCredit risk exposure to trade receivables arises from the 30 days window given by NAICOM in the "No Premium No Cover" policy. This gives the brokers latitude to withhold premium collected from the insured for 30 days before remittance. However, they are expected to issue their credit note and remit the premium on or before the expiration of the 30 days grace period. Brokers who fail to remit are reported on a quarterly basis to NAICOM and are subject to the downgrading process in line with the Group's policy. The Group's risk exposure to credit risk is low as the receipt of insurance premium from the insured is a pre-condition for the issuance of insurance cover.
(d) Loans and AdvancesCredit risk exposure to direct business is low as the Company requires debtors to provide guarantees before the inception of insurance policies. The Company's exposure to credit risk arising from brokered business is relatively moderate and the risk is managed by the Group's internal rating model for brokers. Our credit risk internal rating model is guided by several weighted parameters which determine the categorization of brokers the Group transacts businesses with.
(e) Reinsurance ReceivableA reinsurance contract is executed only with reinsurers with a minimum acceptable credit rating. Management monitors the creditworthiness of reinsurers by reviewing their annual financial statements and through ongoing communications. Reinsurance treaties are reviewed annually by management prior to renewal of reinsurance contracts.
3.3.1.3 Credit quality
Notes to the financial statementsFor the year ended 31 December 2016
AA+/AA- A+/A- UNRATED TOTAL Neither past due nor impaired
Cash and cash equivalents (excl. cash on hand)
10,239,028 7,709,134 7,468,341 598,386 26,041,889
Investment securities:Investment securities FVTPL (excl. equity) 1,494,522 295,750 65,946,012 152,091 67,888,375Investment securities - HTM 2,924,927 476,923 27,108,244 2,294,473 32,804,567 Trade receivables - - - 169,761 169,761Loans and advances - - - 3,365,178 3,365,178Reinsurance receivable (excl. IBNR and prepaid reinsurance)
- - - 338,352 338,532
Other receivables (excl. prepayments) - - - 753,860 753,860Statutory deposits - - - 500,000 500,000 Past due and impaired - Investment securities - HTM - - - 148,354 148,354Loans and advances - - - 169,280 169,280 14,658,477 8,481,807 100,522,597 8,489,915 132,152,796
BB+/BB-
Group 2015
TOTAL Neither past due nor impaired
Cash and cash equivalents (excl. cash on hand)
3,939,878 7,229,490 2,109,985 3,748,680 17,028,033
Investment securities FVTPL (excl. equity) 751,151 425,640 561,595 63,052,515 64,792,901 Investment securities - HTM 405,415 774,957 6,613,673 8,684,340 16,478,385 Loans and advances - - - 2,462,898 2,462,898 Trade receivable Other receivables (excl. prepayments) -
-
-
943,105
943,105
Statutory deposits - - - 500,000 500,000 Reinsurance assets (excel; IBNR and prepaid reinsurance
- - - 471,660 471,660
Past due and impaired Loans and advances - - - 265,439 265,439 Trade receivables - - - 63,665 63,665 5,096,444 8,432,088 9,285,253 80,736,273 103,550,057
AA+/AA- UNRATED BB+/BB- A+/A-
Group 2016
www.leadway.comAnnual Report & Accounts 201666
RC 7588

Notes to the financial statementsFor the year ended 31 December 2016
Global Corporate Rating (GCR)'s rating symbols and Definitions
AAA Extremely strong financial security characteristics and is the highest FSR assigned by GCR.
AA+ AA AA-
Has very strong financial security characteristics, differing only slightly from those rated higher.
A+ A A-
Has strong financial security characteristics, but is somewhat more likely to be affected by adverse business conditions than assurers with higher ratings.
BBB+ BBB BBB-
Has good financial security characteristics, but is much more likely to be affected by adverse business conditions than assurers with higher ratings.
BB+ BB BB-
Has vulnerable financial security characteristics, which might outweigh its strengths. The ability of these companies to discharge obligations is not well safeguarded in the future.
B+ B B-
Possessing substantial risk that obligations will not be paid when due. Judged to be speculative to a high degree.
Company 2016
Neither past due nor impaired Cash and cash equivalents (excl . cash on hand)
8,413,836 7,709,134 7,468,341 595,140 24,186,451
Investment securities FVTPL (excl. equity) 1,494,522 295,750 65,946,012 152,091 67,888,375 Investment securities - HTM 480,083 476,923 28,672,950 729,768 30,359,724 Trade receivables - - - 169,761 169,761 Loans and advances - - - 628,088 628,088 Other receivables (excl. prepayments) - - - 315,285 315,285 Statutory deposits - - - 500,000 500,000 Reinsurance assets (excel; IBNR and prepaid reinsurance
- - - 338,532 338,532
Past due and impaired Investment securities – HTM - - - 148,354 148,354 Loans and advances - - - 169,280 169,280 10,388,441 8,481,807 102,087,303 3,746,299 124,703,850
Company 2015
UNRATED TOTAL Neither past due nor impaired Cash and cash equivalents (excl. cash on hand)
3,642,961 6,943,563 2,109,967 1,958,842 14,655,333
Investment securities FVTPL (excl. equity) 751,150 427,640 561,595 63,052,515 64,792,900 Investment securities - HTM 405,416 774,957 6,594,161 7,923,250 15,697,784 Trade receivable - - - 543,971 543,971 Loans and advances - - - 1,697,572 1,697,572 Other receivables (excl. prepayments) - - - 552,485 552,485 Statutory deposits - - - 500,000 500,000 Past due and impaired Loans and advances - - - 203,855 203,855 Reinsurance assets (excel; IBNR and prepaid reinsurance
- - - 471,660 471,660
4,799,527 8,146,160 9,265,723 76,904,150 99,115,560
OVERVIEWBUSINESSREVIEW GOVERNANCE
GROUP FINANCIALSTATEMENTS APPENDIX
67www.leadway.comAnnual Report & Accounts 2016
TOTAL UNRATED BB+/BB- A+/A- AA+/AA-
BB+/BB- A+/A- AA+/AA-

www.leadway.comAnnual Report & Accounts 201668
RC 7588
Notes to the financial statementsFor the year ended 31 December 2016
Collateral held and other credit enhancements and their financial effectThe Group does not hold collateral against their commercial loans. The loans and advances are uncollateralized.
Cash and cash equivalents 26,014,889 - - 26,014,889
Investment securities - FVTPL (excl. equity) 623,223 - 66,225,421 1,039,731 67,888,375 Investment securities – HTM 7,887,268 201,669 24,416,761 447,223 32,952,921 Trade receivables - - - 169,762 169,762 Loans and advances - - - 3,365,178 3,365,178 Other receivables (excl.
- - - 753,860 Statutory deposits 500,000 - - - 500,000 Reinsurance assets (excl. IBNR and prepaid resinurance) 338,532 - - - 338,532Total 35,363,912 201,669 90,642,182 5,775,754 131,983,516
-
Company 2015 Public sector Others Total
Cash and cash equivalents 14,452,847
. _ 202,486 14,655,333Investment securities - FVTPL (exclequity) 1,944,129 - 62,848,771 1,421,602 66,214,502Investment securities - HTM 6,827,399 155,629 8,714,756 - 15,697,784Trade receivable - - - 543,971 543,971Loans and advances - - - 1,901,427 1,901,427Other receivables (excl.
- - - 552,485 552,485Statutory deposits 500,000 - - 500,000Reinsurance assets (excl. IBNR andprepaid resinurance)
471,660- - - 471,660
Total 24,196,035 155,629 71,563,527 4,621,971 100,537,161
Group 2015
Manufacturing/telecom
Public sector Others Total
Cash and cash equivalents 17,028,033
17,028,033
Investment securities - FVTPL (excl.equity) 1,944,129 - 62,848,772 - 64,792,901Investment securities - HTM 9,868,52 - 6,609,860 16,478,385Trade receivable 543,971 543.971Loans and advances 2,728,337 2,728,337Other receivables (excl. - - - 943,105 943,105Statutory deposits 500.000 - - 500,000Reinsurance assets (excl. IBNR andprepaid resinurance) 471,66 471,660
Company 2016
Public sector
Others
Total
Cash and cash equivalents 24,189,697
- - - 24,189,697
Investment securities - FVTPL (excl. equity) 623,223 - 66,225,421 1,039,731 67,888,375Investment securities - HTM 7,887,268 201,669 21,971,917 447,224 30,508,078Trade receivable - - - 169,761 169,761Loans and advances - - - 1,649,190 1,649,190Other receivables (excl.
- - - 315,285 315,285Statutory deposits 500,000 - - - 500,000Reinsurance assets (excl. IBNR andprepaid resinurance) 338,532 - - - 338,532Total 33,538,720 201,669 88,197,338 3,621,191 125,558,918
Manufacturing/Telecom
Manufacturing/Telecom
Group 2016
Public sector Others TotalManufacturing/Telecom
institution Financial
753,860
Concentration of credit riskAll credit risks are concentrated across many industries in Nigeria. The Group monitors concentration of credit risk by sector
- - - Total 29,812,347 69,458,632 4,215,413 103,486,391
institution Financial
institution Financial
institution Financial

OVERVIEWBUSINESSREVIEW GOVERNANCE
GROUP FINANCIALSTATEMENTS APPENDIX
69www.leadway.comAnnual Report & Accounts 2016
Notes to the financial statementsFor the year ended 31 December 2016
3.3.2 Liquidity risksLiquidity risk is the risk that an entity will encounter difficulty in meeting obligations associated with financial instruments. In respect of catastrophic events, there isalso a liquidity risk associated with the timing differences between gross cash outflows and expected reinsurance recoveries.
The following policies and procedures are in place to mitigate the company's exposure to liquidity risk:
- The Company's liquidity risk policy which sets out the assessment and determination of what constitutes liquidity risk for the company. Compliance with the policy is monitored and exposures and breaches are reported to the company's risk committee. The policy is regularly reviewed for pertinence and for changes in the risk environment.
- Guidelines are set for asset allocations, portfolio limit structures and maturity profiles of assets, in order to ensure sufficient funding available to meet insurance and investment contracts obligations.
- Contingency funding plans are in place, which specifies' minimum proportions of funds to meet emergency calls as well as specifying events that would trigger such plans.
- The table that follows summarizes the maturity profile of the non-derivative financial assets and financial liabilities of the Group based on remaining undiscounted contractual obligations, including interest payable.
- For insurance contracts liabilities and reinsurance assets, maturity profiles are determined based on estimated timing of net cash outflows from the recognized insurance liabilities. Unearned premiums and the reinsurers' share of unearned premiums have been excluded from the analysis as they are not contractual obligations.
Repayments which are subject to notice are treated as if notice were to be given immediately.

www.leadway.comAnnual Report & Accounts 201670
RC 7588
3.3.2 Liquidity risksLiquidity risk is the risk that an entity will encounter difficulty in meeting obligations associated with financial instruments. In respect of catastrophic events, there isalso a liquidity risk associated with the timing differences between gross cash outflows and expected reinsurance recoveries.
The following policies and procedures are in place to mitigate the company's exposure to liquidity risk:
- The Company's liquidity risk policy which sets out the assessment and determination of what constitutes liquidity risk for the company. Compliance with the policy is monitored and exposures and breaches are reported to the company's risk committee. The policy is regularly reviewed for pertinence and for changes in the risk environment.
Group Residual contractual maturities of financial assets and liabilities
GroupResidual contractual maturities of financial assets and liabilities
31 December 2015 Note Carrying amount
Gross nominal
0-3 months 3-6 months
Cash and cash equivalents 6 17,031,040 17,103,383 14,785,804 562,012 Trade receivables 7 543,971 543,971 543,971 - Investment securities - FVTPL 8.1 66,322,015 175,781,233 1,421,601 - Investment securities - Available for sale 8.2 9,603,510 9,509,816 5,545,296 - Investment securities - Held to maturity 8.3 16,478,385 21,611,909 79,145 3,629,172 Reinsurance assets (Due from reinsurers) 9 471,660 471,660 471,660 - Other receivables - financial assets 11 918,395 918,395 918,395 - Loans and Advances 12 1,919,857 3,611,676 490,803 270,485 Statutory deposit 18 500,000 500,000 - -
Total financial assets 113,788,833 230,052,042 24,256,675 4,461,669 Trade payables 19 2,714,107 2,714,107 2,714,107 - Other liabilities - financial liabilities 21 2,973,278 3,369,635 1,980,723 - Borrowings 22 118,446 118,446 - - Insurance contract liabilities (excl. IBNR and unearned premium))
23 91,371,054 91,371,054 - -
Investment contract liabilities 24 15,459,507 16,473,787 358,522 338,118 Total financial liabilities 112,636,392 114,047,029 5,053,352 338,118 Gap 1,152,441 116,005,013 19,203,323 4,123,551
6-12 months 1-5 years Over 5 years
1,755,567 - - - - -
62,575 2,031,429 172,265,628 - - 3,964,520
1,320,691 8,502,319 8,080,582 - - - - - -
87,477 2,762,911 - - 500,000
3,226,310 13,296,659 184,810,730
- - - 1,388,912 - -
- 118,446 - 91,371,054 - -
1,005,563 13,180,264 1,591,320
93,765,529 13,298,710 1,591,320
(90,539,219) (2,051) 183,219,410
Notes to the financial statementsFor the year ended 31 December 2016
31 December 2016
Assets Cash and cash equivalents Trade receivables Investment securities - FVTPL Investment securities - Available for sale Investment securities - Held to maturity Reinsurance assets (Due from reinsurers) Other receivables - financial assets Loans and advances Statutory deposit Total financial assets Trade payables Other liabilities - financial liabilities Insurance contract liabilities (excl. IBNR and unearned premium)) Investment contract liabilities Total financial liabilities Gap
Note
6 7
8.1 8.2 8.3 9
11 12 18
19 21 23
24
Carrying amount
24,189,697
169,761 69,326,992 11,206,175 30,508,078
6,538,834 135,169 797,368 500,000
143,372,074
2,754,639 2,372,725
91,371,054
18,294,287
114,792,705
28,579,369
Gross nominal
24,256,995 169,762
217,872,091 12,925,027 32,036,735
6,461,895 135,169
1,912,148 500,000
296,269,822
2,754,639 2,372,725
91,371,054
19,462,007
115,960,425
180,309,397
0-3 months
24,256,995
169,762 6,234,461 6,550,173
497,265 6,461,895
- 68,864
-
44,239,415
2,754,639 - -
423,555
3,178,194
41,061,220
3-6 months
- -
10,577,148 -
1,184,238 - -
75,165 -
11,836,551
- - -
399,450
399,450
11,437,101
6-12 months
- -
37,890,951 -
5,505,029 -
135,169 346,294
-
43,877,443
- 2,372,725
-
1,187,965
3,560,690
40,316,753
1-5 years
- -
11,468,464 -
14,150,770 - -
1,421,825 -
27,041,059
- -
20,497,935
15,571,064
36,068,999
(9,027,940)
Over 5 years
- -
151,701,068 6,374,854
10,699,433 - - -
500,000
169,275,355
- -
70,873,119
1,879,973
72,753,092
96,522,262

OVERVIEWBUSINESSREVIEW GOVERNANCE
GROUP FINANCIALSTATEMENTS APPENDIX
71www.leadway.comAnnual Report & Accounts 2016
Company Residual contractual maturities of financial assets and liabilities
31 December 2016 Note Carrying amount
Gross nominal
0-3 months 3-6 months AssetsCash and cash equivalents 24,189,697 24,189,697 24,189,697 - Trade receivables 169,761 169,762 169,762 - Investment securities - FVTPL 8.1 69,326,992 217,872,091 - - Investment securities - Available for sale 8.2 11,206,175 12,925,027 6,550,173 - Investment securities - Held to maturity 8.3 30,508,078 32,036,735 497,265 1,184,238 Reinsurance assets (Due from reinsurers) 6,538,834 6,461,895 6,461,895 - Other receivables - financial assets 11 135,169 135,169 - - Loans and advances 12 797,368 1,649,190 - - Statutory deposit 18 500,000 500,000 - -
Total financial assets 143,372,074 296,939,566 37,868,792 1,184,238 Trade payables 19 2,754,639 2,754,639 2,754,639 - Other liabilities - financial liabilities 21 2,372,725 2,372,725 - - Insurance contract liabilities (excl. IBNR and unearned premium))
23 91,371,054 91,371,054 - -
Investment contract liabilities 24 18,294,287 18,294,287 - -
Total financial liabilities 114,792,705 114,792,705 2,754,639 -Gap 28,579,369 181,146,861 35,114,153 1,184,238
6-12 months 1-5 years Over 5 years
- - - - - - 114,000 11,461,919 206,296,172 - - 6,374,854 5,505,029 14,150,770 10,699,433 - - - 135,169 - - 79,437 1,569,753 - - - 500,000
5,833,635 27,182,442 223,870,459 - - - 2,372,725 - - - 20,497,935 70,873,119
- 18,294,287 -
2,372,725 38,792,222 70,873,119 3,460,910 (11,609,780) 152,997,340
31 December 2015 Note Carrying amount
Gross nominal
0-3 months 3-6 months
Cash and cash equivalents 6 14,656,941 14,656,941 14,656,941 - Trade receivables 7 543,971 543,971 543,971 - Investment securities - FVTPL 8.1 66,214,502 175,781,233 - 62,575 Investment securities - Available for sale 8.2 9,598,753 9,722,053 5,538,305 - Investment securities - Held to maturity 8.3 15,697,784 20,897,776 79,145 3,040,563 Reinsurance assets (Due from reinsurers) 9 471,660 471,660 471,660 - Other receivables - financial assets 11 552,485 552,485 - - Loans and advances 12 1,217,079 1,901,427 - - Statutory deposit 18 500,000 500,000 - -
Total financial assets 109,453,175 225,027,546 21,290,022 3,103,138 Trade payables 19 2,754,639 3,304,699 3,304,699 - Other liabilities - financial liabilities 21 1,253,064 1,253,064 1,253,064 - Insurance contract liabilities (excl. IBNR and unearned premium))
23 80,342,220 101,060,687 3,702,621 4,175,770
Investment contract liabilities 24 15,459,507 16,473,787 358,522 338,118 Total financial liabilities 99,809,430 122,092,237 8,618,906 4,513,888 Gap 9,643,745 102,935,309 12,671,116 (1,410,750)
6-12 months
1-5 years Over 5 years
- - - - - - - 2,031,429 173,687,229 - - 4,183,748
1,320,691 8,502,319 7,955,058 - - -
552,485 - - 87,056 1,814,371 -
- - 500,000
1,960,232 12,348,119 186,326,035
- - - - - -
8,806,520 47,528,012 36,847,764
1,005,563 13,180,264 1,591,320 9,812,083 60,708,276 38,439,084
7,851,851) (48,360,157) 147,886,951
Company Residual contractual maturities of financial assets and liabilities
It is not expected that cash flows included in the maturity analysis could occur significantly earlier or at significantly different amounts.
3.2.3 Market risksMarket risk is the risk that the fair value or future cash flows of a financial instrument will fluctuate because of changes in market prices. Market risk comprises three types of risk: foreign exchange rates (currency risk), market interest rates (interest rate risk) and market prices (price risk).
- The Group's enterprise risk management policy sets out the assessment and determination of what constitutes a market risk. Compliance with the policy is monitored and exposures and breaches are reported to the company risk committee. The policy is reviewed regularly for pertinence and for changes in the risk environment.
- Guidelines are set for asset allocation and portfolio limit structure, to ensure that assets back specific policyholder's liabilities and that assets are held to deliver income and gains for policyholders which are in line with expectations of the policyholders
- The Group stipulates diversification benchmarks by type of instrument and geographical' area, as the Group is exposed to guaranteed bonuses, cash, and annuity options when interest rates fall.
(a) Currency riskCurrency risk is the risk that the fair value of future cash flows of a financial instrument will fluctuate because of changes in foreign exchange rates.
Notes to the financial statementsFor the year ended 31 December 2016
67

www.leadway.comAnnual Report & Accounts 201672
RC 7588
The Group's principal transactions are carried out in Naira and its exposure to foreign exchange risk arise primarily with respect to US dollar.The Group's financial assets are primarily denominated in the same currencies as its insurance and investment contract liabilities. The main foreign exchange risk arises from recognized assets and liabilities denominated in currencies other than those in which insurance and investment contract liabilities are expected to be settled.
The table below summarizes the Group's financial assets and liabilities by major currencies. Note that irrespective of the currency in which the assets are held, the amounts disclosed against individuals currencies are the Naira equivalent of the respective currencies. The exchange rates applied for each of the listed currencies have been obtained from reliable sources depicting reliable market transactions on 31 December 2016.
Group31 December 2015 Note Naira (N) US Dollars
(USD) UK Pound Sterling (GBP)
Euro Rand (ZAR)
Total
Cash and cash equivalents 6 8,132,639 8,612,703 141,838 143,681 179 17,031,040 Trade receivables 7 543,971 - - - - 543,971 Investment securities - FVTPL 8.1 66,271,177
50,838 - - - 66,322,015
Investment securities - Available for sale
8.2 6,170,517 3,432,993 9,603,510
Investment securities - Held to maturity
8.3 8,203,677 8,274,708 - - - 16,478,385
Reinsurance assets (Due from reinsurers)
9 5,125,351 - - - - 5,125,351
Other receivables - nancial assets
11 1,048,817 - - - - 1,048,817
Loans and advances 12 1,657,989 131,446 - - - 1,789,435 Statutory deposits 18 500,000 - - - - 500,000 Total nancial assets 97,654,138 20,502,688 141,838 143,681 179 118,442,524 Trade payables 19 2,714,107 - - - - 2,714,107 Other liabilities - nancial liabilities
21 2,973,278 - - - - 2,973,278
Borrowings 22 118,446 - - - - 118,446 Insurance contract liabilities (excl. IBNR and unearned premium))
23 71,851,602
8,490,618 80,342,220
Investment contract liabilities 24 15,459,507 - - - - 15,459,507 Total nancial liabilities 93,116,940 8,490,618 - - - 101,607,558 Net FCY exposure 12,012,070 141,838 143,681 179 16,834,966
Group31 December 2016 Notes Naira (N) US Dollars
(USD) UK Pound Sterling (GBP)
Euro Rand (ZAR)
Total
Assets Cash and cash equivalents 6 5,366,938 20,309,325
126,555 215,697
179 26,018,694
Trade receivables 7 169,761 - - - - 169,761 Investment securities - FVTPL 8.1 69,429,589 - - - - 69,429,589 Investment securities - Available for sale
8.2 8,542,508 2,668,424 - - - 11,210,932
Investment securities - Held to maturity
8.3 18,891,120 14,061,801
- - - 32,952,921
Reinsurance assets (Due from reinsurers)
9 338,532 - - - - 338,532
Other receivables - nancial assets
11 569,577 - - - - 569,577
Loans and advances 12 2,239,360 223,978 - - - 2,463,338 Statutory deposits 18 500,000 - - - - 500,000 Total nancial assets
106,047,385
37,263,528
126,555
215,697
179
143,653,344
Trade payables 19 2,754,639 - - - - 2,754,639 Other liabilities - nancial liabilities
21 3,772,280 - - - - 3,772,280
Borrowings 22 204,623 - - - - 204,623 Insurance contract liabilities (excl. IBNR and unearned premium))
23 77,783,622 13,587,432
- - - 91,371,054
Investment contract liabilities 24 18,294,287 - - - - 18,294,287 Total nancial liabilities
102,809,451
13,587,432
- - - 116,396,883
Net FCY exposure
23,676,096
126,555
215,697
179
27,256,461
Notes to the financial statementsFor the year ended 31 December 2016

OVERVIEWBUSINESSREVIEW GOVERNANCE
GROUP FINANCIALSTATEMENTS APPENDIX
73www.leadway.comAnnual Report & Accounts 2016
Company31 December 2016 Note Naira (N) US Dollars
(USD) UK Pound Sterling (GBP)
Euro Rand (ZAR)
Total
Cash and cash equivalents
6 3,537,940 20,309,325 126,556 215,697 179 24,189,697
Trade receivables 7 169,761 - - - - 169,761 Investment securities - FVTPL
8.1 69,326,992 - - - - 69,326,992
Investment securities - Available for sale
8.2 8,537,751 2,668,424 - - - 11,206,175
Investment securities - Held to maturity
8.3 16,446,277 14,061,801 - - - 30,508,078
Reinsurance assets (Due from reinsurers)
9 338,532 - - - - 338,532
Other receivables - nancial assets
11 135,169 - - - - 135,169
Loans and advances 12 573,390 223,978 - - - 797,368 Statutory deposits 18 500,000 500,000
Total nancial assets 99,565,812 37,263,528 126,556 215,697 179 137,171,772
Trade payables 19 2,754,639 - - - - 2,754,639 Other liabilities - nancial liabilities
21 2,372,725 - - - - 2,372,725
Insurance contract liabilities (excl. IBNR and unearned premium))
23 77,783,622 13,587,432 - - - 91,371,054
Investment contract liabilities
24 18,294,287 - - - - 18,294,287
Total nancial liabilities 101,205,273 13,587,432 - - - 114,792,705
Net FCY exposure (1,639,461) 23,676,096 126,556 215,697 179 22,379,067
Company31 December 2015 Note Naira (N) US Dollars
(USD) UK Pound Sterling (GBP)
Euro Rand (ZAR)
Total
Cash and cash equivalents
6 5,758,540 8,612,703 141,838 143,681 179 14,656,941
Trade receivables 7 543,971 - - - - 543,971 Investment securities - FVTPL
8.1 66,163,664 50,838 - - - 66,214,502
Investment securities - Available for sale
8.2 6,165,760 3,432,993 - - - 9,598,753
Investment securities - Held to maturity
8.3 7,423,076 8,274,708 - - - 15,697,784
Reinsurance assets (Due from reinsurers)
9 471,660 - - - - 471,660
Other receivables - nancial assets
11 545,473 - - - - 545,473
Loans and advances 12 1,085,633 131,446 - - - 1,217,079 Statutory deposits 18 500,000 - - - - 500,000
Total nancial assets 88,657,777 20,502,689 141,838 143,681 179 109,446,163
Trade payables 19 2,714,107 - - - 2,714,107 Other liabilities - nancial liabilities
21 2,170,505 - - - - 2,170,505
Insurance contract liabilities (excl. IBNR and unearned premium))
23 71,851,602 8,490,618 - - - 80,342,220
Investment contract liabilities
24 15,459,507 - - - - 15,459,507
Total nancial liabilities 92,195,721 8,490,618 - - - 100,686,339 Net FCY exposure (3,537,944) 12,012,071 141,838 143,681 179 8,759,824
Notes to the financial statementsFor the year ended 31 December 2016

www.leadway.comAnnual Report & Accounts 201674
RC 7588
Company
(I) Interest rate risks:Interest rate risk is the risk that the value or future cash flows of a financial instrument will fluctuate because of changes in market interest rates.Exposure to this risk primarily results from timing differences in the repricing of assets and liabilities as they mature (fixed rate instruments) or contractually repriced (floating rate instruments).
The Group monitors this exposure through periodic reviews of the assets and liability position. Estimates of cash flows, as well as the impact of interest rate fluctuations relating to the investment portfolio and insurance provisions, are modeled and reviewed.The overall objective of these strategies is to limit the net change in the value of assets and liabilities arising from interest rate movements.
While it is more difficult to measure the interest sensitivity of insurance liabilities than that of the related assets, to the extent that such sensitivities are measurable then the interest rate movements will generate asset value changes that substantially offset changes in the value of the liabilities relating to the underlying products. The table below details the interest rate sensitivity analysis of the Group as at 31 December 2016 holding all other variables constant. Based on historical data, 100 basis points change is deemed to be reasonably possible and are used when reporting interest rate risk.
Currency 31 December 2016 31 December 2015 Change in
variables Impact on profit
before tax Impact on equity Impact on profit
before tax Impact on
equity US Dollar +100 basis
points5,085,096 3,559,567 1,201,207 840,845
Pound Sterling + 100 basis points
12,656 8,859 14,184 9,929
Euro + 100 basis points
21,570 15,099 14,368 10,058
US Dollar -100 basis points
(2,367,610) (1,657,327) (1,201,207) (840,845)
Pound Sterling -100 basis points
(12,656) (8,859) (14,184) (9,929)
Euro -100 basis points
(21,570) (15,099) (14,368) (10,058)
CompanyCurrency 31 December 2016 31 December 2015 Change in
variables Impact on profit
before tax Impact on equity Impact on profit
before tax Impact on
equity US Dollar +100 basis
points 2,367,610 1,6.57,327 1,201,207 840,845
Pound Sterling + 100 basis points
12,656 8,859 14,184 9,929
Euro + 100 basis points
21,570 15,099 14,368 10,058
US Dollar -100 basis points
(2,367,610) (1,657,327) (1,201,207) (840,845)
Pound Sterling -100 basis points
(12,656) (8,859) (14,184) (9,929)
Euro -100 basis points
(21,570) (15,099) (14,368) (10,058)
Notes to the financial statementsFor the year ended 31 December 2016
Foreign currency sensitivityThe tables below show the sensitivity of the Group's profit before tax to appreciation or depreciation of the naira in relation to other currencies. Based on the past year's behavior, it is reasonable to assume too basis points appreciation and 100 basis points depreciation of the Naira holding ail other variables constant.
Group

OVERVIEWBUSINESSREVIEW GOVERNANCE
GROUP FINANCIALSTATEMENTS APPENDIX
75www.leadway.comAnnual Report & Accounts 2016
Group 31 December 2016
bearingNon-interest 0-3 months 3-6 months 6-12 months 1-5 years
Cash and cash equivalents 3,868,030 22,150,664 - - - Investment securities - FVTPL 1,541,215 - - 92,670 7,202,115 Investment securities - Held to maturity - 532,439 1,261,903 7,867,020 13,523,6868 Loans and advances 48,491 - - 72,458 381,433 Statutory deposits - - - - -Interest bearing assets 5,457,736 22,683,103 1,261,903 8,032,148 21,107,234Investment contract liabilities - - - - 18,294,287 - - - - 204,623 Interest bearing liabilities - - - - 18,498,910
Gap 5,457,736 22,683,103 1,261,903 8,032,148 21,107,234Cumulative gap 5,457,736 22,683,103 1,261,903 8,032,148 21,107,234 Impact on profit before tax 2,268,310 126,190 803,215 260,832 Taxation at 30% 680,493 37,857 240,965 78,250 Impact on equity
1,587,817
88,333
562,251
182,582
Over 5 years Total
- 26,018,694 60,593,589 64,429,589
9,767,873 32,952,921 1,960,956
2,463,338
500,000 500,00072,822,418 131,364,542
- 18,294,287 - 204,623 - 18,498,910
72,822,418 131,364,54272,822,418 131,364,542
7,282,242 10,740,789 2,184,673 3,222,237 5,097,569
7,518,552
Group 31 December 2015
bearing
Non-interest 3-6 months 6-12 months 1-5 years
Cash and cash equivalents - - Investment securities - FVTPL 1,472,232 - Investment securities - Held to maturity - 631,025 Loans and advances 37,793 - Statutory deposits - -
Interest bearing liabilities 1,510,025 631,025
Gap 1,510,025 631,025Cumulative gap 1,510,025 631,025 Impact on profit before tax Taxation at 30% Impact on equity
0-3 months
- -
266,251 - -
266,251
266,251266,251
26,625 7,988
18,638
63,103 18,931 44,172
- 88,522
3,933,969 56,472
4,078,963
4,078,9634,078,953
407,896 122,369 285,527
- 6,879,758 6,762,633
297,278
13,939,669
(1,638,284)(1,638,284)
(163,828) (49,149)
(114,680)
Over 5 years Total
- 57,881,5024,884,5071,528,314
500,000
64,794,323
64,794,32364,794,232
6,479,4321,943,8304,535,603
-66,322,01516,478,3851,919,857
500,000
85,220,257
69,642,30469,462,304
6,813,2282,043,9894,769,260
Company 31 December 2016
Non-interest bearing
0-3 months 3-6 months 6-12 months 1-5 years
Cash and cash equivalents Investment securities - FVTPL Investment securities - Held to maturity Loans and advances Statutory deposits Interest bearing assetsInvestment contract liabilities Borrowings Interest bearing liabilities
Gap Cumulative gap Impact on profit before tax Taxation at 30% Impact on equity
3,246 1,438,618
- - -
1,441,864- - -
1 441 8641,441,864
- - -
24,186,451 -
532,439 - -
24,718,890- - -
24,718,89024,718,890
2,471,889
741,567 1,730,322
- -
1,261,903 - -
1,261,903- - -
1,261,9031,261,903
126,190
37,857 88,333
- 92,670
7,867,020 40,027
- 7,999,717
- - -
7,999,7177,999,717
799,972 239,992 559,980
- 7,202,115
11,078,843 757,341
- 19,038,29918,294,287
- 18,294,287
744,012744,012
74,401 22,320 52,081
Over 5 years Total
- 60,593,589 9,706,873
- 500,000
70,861,462- - -
70,861,46270,861,462
7,086,146 2,125,844 4,960,302
24,189,697 69,326,992 30,508,078
797,368 500,000
125,322,13518,294,287
- 18,294,287
107,027,848107,027,848
10,558,598
3,167,580 7,391,019
Interest bearing assets 1,510,025 266,251 631,025 4,078,963 13,939,669 64,794,323 85,220,257
Investment contract liabilities - - - - 15,459,507 - 15,459,507Borrowings - - - - 118,446 - 118,446
Notes to the financial statementsFor the year ended 31 December 2016
Borrowings

www.leadway.comAnnual Report & Accounts 201676
RC 7588
Company 31 December 2015
Non-interest bearing
0-3 months 3-6 months 6-12 months 1-5 years
Cash and cash equivalents Investment securities - FVTPL Investment securities - Held to maturity Loans and advances Statutory deposits
Interest bearing liabilities
Gap
Cumulative gap Impact on profit before tax Taxation at 30% Impact on equity
- -
266,251 - -
266,251
266,251
266,251 26,625
- 18,638
- -
631,025 - -
631,025
631,025
631,025 63,103 18,931 44,172
- 88,522
3,933,969 56,472
4,078,963
4,078,963
4,078,953 407,896 122,369 285,527
- 6,879,758 6,762,633
297,278
13,939,669
(1,638,284)
(1,638,284) (163,828) (49,149)
(114,680)
Over 5 years Total
- 57,881,502 4,884,507 1,528,314
500,000
64,794,323
64,794,323
64,794,232 6,479,432 1,943,830 4,535,603
- 66,322,015 16,478,385 1,919,857
500,000
85,220,257
69,642,304
69,462,304 6,813,228 2,043,989 4,769,260
- 1,472,232
- 37,793
-
1,510,025
1,510,025
1,510,025
-7,988
-
(j) Equity price riskThe Group manages its exposure to equity price risk through adherence to investment in eligible stocks as approved by the Board and in line with NAICOM investmentguidelines. Management Investment Committee establishes and approves a list of eligible stocks in line with approval as approved by the Board through its Board
InvestmentCommittee. The investment decisions are subject to authorization(s) levels;
Management Investment Committee1. An investment which would result in exposure to the invested company for not greater than 5% of the issue under consideration i.e. Equities, Bonds etc.2. Investment in any unquoted stock with a value less than N50m.
Board Investment CommitteeI. An investment which would result in exposure to the invested company for greater than 5% of the issue under consideration.ii. Any investment where the value of total exposure to the invested corporate on completion, as a percentage of total Leadway's Asset Under Management, will
exceed 5% as at the time of the investment.iii. Single obligor for any licensed bank over 5% of the bank's total deposit or invested fund.iv. An Investment in any unquoted stock with a value greater than N50m.v. Investment in a start-up venture.vi. Investments in a company, which will result in the Leadway having control of management.vii. Investments denominated in currencies other than Naira and Eurobonds Securities.viii. Securities lending, leveraged investments, derivatives or hedging.
Asset allocation to investment in equity is shown below
The equity price changes are monitored by the investment committee and holdings are adjusted when there is a deviation from the investment policy. The Group manages its exposure to equity price risk using sensitivity analysis to assess potential changes in the value of its investment in equities and impact of such changes on the Group's investment income.
There have been no major changes from the previous year in the exposure to risk or policies, procedures and methods used to measure the risk. A possible change was determined from one-year daily fluctuation in market prices of equities. This indicates that significant proportion of changes in market prices falls in the range of ± 100 basis points.
ALLOCATION TARGET QUOTED EQUITIES
UNQUOTED EQUITIES
Annuity fund 1% 0%Life business shareholders fund 4% 0%non-life business insurance fund 0% 0% non-life business shareholders fund 8% 8%
Financial assets Group
31-Dec-16Group
31-Dec-15 Company 31-Dec-16
Company 31-Dec-15
+/-100 basis point +/- 100 basis point
+/- 100 basis points
+/- 100 basis points
Listed equities (FVTPL) 144,516 152,212 143,862 142,160 Listed equities (AFS) 655,017 554,530 655,017 553,830 Unlisted equities (AFS) 468,572 406,504 468,096 387,877 Impact on profit before tax 144,516 152,212 143,862 142,160 Tax charge of 30% (43,355) (45,664) (43,159) (42,648) Impact on profit after tax 101,161 106,548 100,703 99,512 Impact on equity 1,224,751 1,067,582 1,223,817 1,041,219
- - - - - - - -
Notes to the financial statementsFor the year ended 31 December 2016
Investment contract liabilities - - 15,459,507 15,459,507-Borrowings - - - --
Interest bearing assets
266,251
631,025
4,078,963
13,939,669
64,794,323
85,220,257
1,375, 638
--
--

OVERVIEWBUSINESSREVIEW GOVERNANCE
GROUP FINANCIALSTATEMENTS APPENDIX
77www.leadway.comAnnual Report & Accounts 2016
3.4 Fair values of financial assets and liabilities Accounting classifications, measurement basis, and fair values The table below sets out the Group's classification of each class of financial assets and liabilities, and their fair values.
Group 31 December 2016
Notes At fair value through P/L
Held to Maturity
Loans and receivables
Available for sale
Assets Cash and cash equivalents 6 - - 26,018,694 - Trade receivables 7 - - 169,761 - Investment securities – FVTPL 8.1 69,429,589 - - - Investment securities - Available for sale 8.2 - - - 11,210,932 Investment securities - Held to maturity 8.3 - 32,952,921 - - Reinsurance assets (Due from reinsurers) 9 - - 338,532 - Other receivables - financial assets 10 - - 569,577 - Loans and Advances 12 - - 2,463,338 - Statutory deposit 18 - - - -
Total 69,429,589 32,952,921 29,559,902 11,210,932
Liabilities Trade payables 19 - - - - Other liabilities - financial liabilities 21 - - - - Borrowings 22 - - - - Insurance contract liabilities (excl. IBNR and unearned premium))
23 - - - -
Investment contract liabilities 24 - - - - Total - - - -
Total carrying amount
Fair value Other financial
instruments amortized
- 26,018,694 26,018,694 - 169,761 169,761 - 69,429,589 69,429,589 - 11,210,932 11,210,932 - 32,952,921 31,952,921 - 338,532 338,532
- 569,577 569,577 - 2,463,338 2,463,338 - 500,000 500,000
500,000 143,653,344 142,576,329
2,754,639 2,754,639 2,754,639 3,772,280 3,772,280 3,772,280
204,623 204,623 204,623 91,371,054 91,371,054 91,371,054
18,294,287 18,294,287 18,294,287
116,396,883 116,396,883 116,396,883
Group 31 December 2015
Notes At fair value through P/L
Held to Maturity
Loans and receivables
Available for sale
Assets Cash and cash equivalents 6 - - 17,031,040 - Trade receivables 7 - - 543,971 - Investment securities – FVTPL 8 66,322,015 - - - Investment securities - Available for sale 8 - - - 9,603,510 Investment securities - Held to maturity 8 - 16,478,385 - - Reinsurance assets (Due from reinsurers) 9 - - 471,660 - Other receivables 10 - - 918,395 - Loans and Advances 12 - - 1,919,857 - Statutory deposit 18 - - - -
Total 66,322,015 16,478,385 20,884,923 9,603,510 Liabilities Trade payables 19 - - - - Other liabilities - financial liabilities 21 - - - - Borrowings 22 - - - - Insurance contract liabilities (excl. IBNR and unearned premium))
23 - - - -
Investment contract liabilities 24 - - - -
Total - - - -
Other financial
instruments amortized
Total carrying amount
Fair value
- 17,031,040 17,031,040- 543,971 543,971- 66,322,015 66,322,015- 9,603,510 9,603,510- 16,478,385 16,478,385- 471,660 471,660
- 918,395 918,395- 1,919,857 1,919,857
500,000 500,000 500,000
500,000 113,788,833 113,788,833
2,754,639 2,754,639 2,973,278 2,973,278 2,973,278
118,446 118,44680,342,220 80,342,220 80,342,220
15,459,507 15,459,507 15,459,507
101,648,090 101,648,090 101,648,090
Notes to the financial statementsFor the year ended 31 December 2016
2,754,639
118,446

www.leadway.comAnnual Report & Accounts 201678
RC 7588
Company 31 December 2016
Notes At fair value through P/L
Held to Maturity
Loans and receivables
Available for sale
Assets Cash and cash equivalents 6 - - 24,189,697 - Trade receivables 7 - - 169,761 - Investment securities – FVTPL 8 69,326,992 - - - Investment securities – AFS 8 - - - 11,206,175 Investment securities – HTM 8 - 30,508,078 - - Reinsurance assets (Excel. prepaid reinsurance) 9 - - 338,532 - Other receivables 10 - - 135,169 - Loans and Advances 12 - - 797,368 - Statutory deposit 18 - - - -
Total 69,326,992 30,508,078 25,630,527 11,206,175 Liabilities Trade payables 19 - - - - Other liabilities 21 - - - - Insurance contract liabilities (excl. IBNR and unearned premium)
23 - - - -
Investment contract liabilities 24 - - - -Total - - - -
Other financial
instruments amortized
cost
Total carrying amount
Fair value
- 24,189,697 24,189,697- 169,761 169,761- 69,326,992 69,326,992- 11,206,175 11,206,175- 30,508,078 29,431,063
- 338,352 274,416- 135,169 135,169- 797,368 797,368
500,000 500,000 500,000
500,000 137,171,772 136,030,641
2,754,639 2,754,639 2,754,6392,372,725 2,372,725 2,372,725
91,371,054 91,371,054 91,371,054
18,294,287 18,294,287 18,294,287114,792,705 114,792,705 114,792,705
Company 31 December 2015
Notes At fair value through P/L
Held to Maturity
Loans and receivables
Available for sale
Assets Cash and cash equivalents 6 - - 14,655,333Trade receivables 7 66,214,502 - -Investment securities – FVTPL 8 - - - 9,598,753Investment securities – AFS 8 - 15,697,784 -Investment securities – HTM 8 - - 543,971
Reinsurance assets (Excel. prepaid reinsurance) 9 - - 1,217,079Other receivables 10 - - 471,660Loans and Advances 12 - - 545,473Statutory deposit 18 - - -
Total 66,214,502 15,697,784 17,433,516 9,958,753
Liabilities Trade payables 19 - - -Other liabilities 21 - - -Insurance contract liabilities (excl. IBNR and unearned premium)
23 - - -
Investment contract liabilities 24 - - -Total - - -
Other financial
instruments amortized
cost
Total carrying amount
Fair value
- 14,655,333 14,655,333 - 66,214,502 66,214,502 - 9,598,753 9,598,753 - 15,697,784 15,697,784 - 543,971 543,971
- 1,217,079 1,217,079 - 471,660 471,660 - 545,473 545,473
500,000 500,000 500,000
500,000 109,444,555 109,444,555
2,714,107 1,253,064
80,342,220
15,459,50799,768,898
2,714,107 2,714,107 1,253,064 1,253,064
80,342,220 80,342,220
15,459,507 15,459,50799,768,898 99,768,898
3.3.1 Fair Value Hierarchy The Group's accounting policy on fair value measurement is disclosed in note 2.6. The table below analyses financial instruments carried at fair value, by valuation method. The different levels have been defined as follows:
Level l: Quoted prices (unadjusted) in active markets for identical assets or liabilities that the entity can access at the measurement date.
Level 2: Inputs other than quoted prices included within level l that are observable for the asset or liability, either directly (that is, as prices) or indirectly (that is, derived from prices). These may include quoted prices for similar assets or liabilities in active markets or quoted prices for identical or similar assets and liabilities in markets that are not active.
Level 3: techniques which use inputs which have a significant effect on the recorded fair value that is not based on observable market data (that is, unobservable
Notes to the financial statementsFor the year ended 31 December 2016

OVERVIEWBUSINESSREVIEW GOVERNANCE
GROUP FINANCIALSTATEMENTS APPENDIX
79www.leadway.comAnnual Report & Accounts 2016
inputs).
(a) The following table presents the financial assets and liabilities that are measured at fair value as 31 December 2016. See note 4.1b for non-financial assetsthat are measured at fair value.
Group31 December 2016All amounts are in thousands of Naira unless otherwise stated
Assets Level 1 Level 2 Level 3 TotalInvestment securities: Fair value through profit or loss - Equity securities 1,541,214 - - 1,541,214 - Federal government bond 65,513,381 - - 65,513,381 - State government 712,039 - - 712,039 - Corporate bonds 1,510,862 152,093 - 1,662,955 Available for sale - Listed equity securities 6,550,172 - - 6,550,172 - Unlisted equity securities - 2,172,805 2,487,955 4,660,760
Total 75,827.668 2,324,898 2,487.955 80,640,521
Group31 December 2015All amounts are in thousands of Naira unless otherwise stated
Assets Level 1 Level 2 Level 3 TotalInvestment securities: Fair value through profit or loss - Equity securities 1,421,602 - - 1,421,602 - Federal government bond 61,696,884 - - 61,696,884 - State government 1,259,820 - - 1,259,820 - Corporate bonds 1,406,593 537,116 - 1,943,709 - Available for sale - - Listed equity securities 5,538,304 - - 5,538,304 - Unlisted equity securities - 2,744,525 1,320,681 4,065,206 Total 71,323,203 3,281,641 1,320,681 75,925,525
Company31 December 2016All amounts are in thousands of Naira unless otherwise stated
Assets Level 1 Level 2 Level 3 Total Investment securities: Fair value through profit or loss
- Equity securities 1,438,617 - - 1,438,617 - Federal government bond 65,513,381 - - 65,513,381 - State government 712,039 - - 712,039 - Corporate bonds 1,510,862 152,093 - 1,662,955 - Available for sale - - Listed equity securities 6,550,172 - - 6,550,172 - Unlisted equity securities - 2,172,805 1,888,655 4,061,460Total 75,725,071 2,324,898 1,888,655 79,938,624
Company31 December 2015All amounts are in thousands of Naira unless otherwise stated
Assets Level 1 Level 2 Level 3 TotalInvestment securities: Fair value through profit or loss - Equity securities 1,421,602 - - 1,421,602 - Federal government bond 61,588,952 - - 61,588,952 - State government 1,259,820 - - 1,259,820 - Corporate bonds 1,407,012 537,116 - 1,944,128 - Available for sale - - Listed equity' securities 5,538,305 - - 5,538,305 - Unlisted equity securities - 2,739,767 1,320,681 4,060,448 Total 71,215,691 3,276,883 1,320,681 75,813,255
Notes to the financial statementsFor the year ended 31 December 2016

www.leadway.comAnnual Report & Accounts 201680
RC 7588
There were no transfers between levels 1 and 2 during the year
(I) Financial instruments in level lThe fair value of financial instruments traded in active markets is based on quoted market prices at the balance sheet date. A market is regarded as active if quoted prices are readily and regularly available from an exchange, dealer, broker, industry group, pricing service, or regulatory agency, and those prices represent actual and regularly occurring market transactions on an arm's length basis. The quoted market price used for financial assets held by the group is the current bid price.
(ii) Financial instruments in Level 2The fair value of financial instruments that are not traded in an active market is determined by using valuation techniques. These valuation techniques maximize the use of observable market data where it is available and rely as little as possible on entity-specific estimates. If all significant inputs required to fair value an instrument are observable, the instrument is included in level 2.
If one or more of the significant inputs is not based on observable market data, the instrument is included in Level 3.
Specific valuation techniques used to value financial instruments include:(I) Quoted market prices or dealer quotes for similar instruments;(ii) The fair value of forwarding foreign exchange contracts is determined using forward exchange rates at the balance sheet date, with the resulting value
discounted back to present value;(iii) Other techniques, such as discounted cash flow analysis, are used to determine fair value for the remaining financial instruments
The Group's level 2 corporate bonds, state bonds, and unlisted equities were valued using quoted market prices for similar instruments at the measurement date.
(iii) Financial instruments in level 3The following table presents the changes in Level 3 instruments for the year ended 31 December 2016
All amounts are in thousands of Naira unless otherwise stated
Varying valuation techniques in determining the fair value of Level 3 item, investments in AFC, Capital Bancorp, Lekky Budget Limited, Main-street Technologies, Oakwood Park Limited, are as follows:
Valuation technique Unobservable inputs Range of unobservable inputs (probability -weighted average)
Relationship of unobservable inputs to fair value
Adjusted fair value comparison approach
P/E multiples P/BV multiples
10% illiquidity discount the higher the illiquidity discount the lower the fair value
Opening balance 1,320,681 325,438 1,320,681 325,438Acquisitions - - - -
Disposals - - - -
Reclassification from investments at cost less impairment (see note 8.2.1a)
- 181,927 - 181,927
Changes in fair value recognized in other 1,356,511 813,316 1,356,511 813,316comprehensive income
EV/EBITDA or P/E valuation multiple - the company determines appropriate comparable public company/is based on industry, size, developmental stage, revenue generation and strategy. The company then calculates a trading multiple for each comparable company identified. The multiple is calculated by either dividing the quoted price of the comparable company by its net income (P/E). The trading multiple is then adjusted for discounts/premiums with regards to such consideration as illiquidity and other differences, advantages, and disadvantages between the company's investee company and the comparable public companies based on company-specific facts and circumstances.A reasonable change in the illiquidity discount will not result in a material change to the fair value of the investment.
Financial instruments not measured at fair valueThe following table sets out fair values of financial instruments not measured at fair value and analyses them by level in the fair value hierarchy into which each fair value measurement is categorized.
Notes to the financial statementsFor the year ended 31 December 2016
Equity Securities - Available for Group Group Company Companysale
31-Dec-l6 31-Dec-15 31 -Dec -16 31-Dec-15
Balance, end of year 2,677,192 1,320,681 2,677,192 1,320,681

OVERVIEWBUSINESSREVIEW GOVERNANCE
GROUP FINANCIALSTATEMENTS APPENDIX
81www.leadway.comAnnual Report & Accounts 2016
Notes to the financial statementsFor the year ended 31 December 2016
Group31 December 2016
All amounts are in thousands of Naira unless otherwise stated
Assets Level 1 Level 2 Level 3 Total Cash and cash equivalents
` 26,018,694 26,018,694
Held to maturity investment securities:
State bonds - 753,387 - 753,387 Corporate bonds - 15,138,592 - 15,138,592 Federal government bonds
10,050,088 - - 10,050,088
Federal government treasury bills
7,010,854 - - 7,010,854
Trade receivables - 169,761 - 169,761 Loans and advances - - 2.463,338 2,463,338 Reinsurance assets (Excl. prepaid reinsurance)
338,532 338,532
Other receivables - - 569,577 569,577 Statutory deposits - 500,000 - 500,000 Total financial assets 17,060,942 42,580,434 3,371,447 63,012,823 Liabilities Investment contract liabilities
- - 18,294,287 18,294,287
Trade payables - - 2,754,639 2,754,639 Other liabilities - - 3,772,280 3,772,280 Borrowings - - 204,623 204,623 Total financial liabilities
- - 25,025,829 25,025,829
Group31 December 2015
All amounts are in thousands of Naira unless otherwise stated
Assets Level 1 Level 2 Level 3 Total Cash and cash equivalents - 17,031,040 - 17,031,040 Held to maturity investment securities:
State bonds - 1,280,672 1,280,672 Corporate bonds - 8,601,051 - 8,601,051 Federal government bonds 5.960,294 - - 5,960,294 Federal government treasury" bills 56,347 - - 56,347 Trade receivables - 543,971 543,971 Loans and advances - - 1,789,435 1,789,435 Reinsurance assets (Excl. prepaid reinsurance)
- - 471,660 471,660
Other receivables - - 918,395 918,395 Statutory deposits - 500,000 - 500,000 - Total financial assets 6,016,641 27,956,734 3,179,490 37,152,865 Liabilities Investment contract liabilities - - 15,459,507 15,459,507 Trade payables - - 2.714,107 2,714,107 Other liabilities - - 2,973,278 2,973,278 Borrowings - - 118,446 118,446 Total financial liabilities - - 21,265,338 21,265.338
Notes to the financial statementsFor the year ended 31 December 2016

www.leadway.comAnnual Report & Accounts 201682
RC 7588
Company 31 December 2016
All amounts are in thousands of Naira unless otherwise stated
Assets Level 1 Level 2 Level 3 Total Cash and cash equivalents - 24,189.697 - 24,189,697 Held to maturity investment securities:
State bonds - 753,387 - 753,387 Corporate bonds - 15,138,593 - 15,138,593 Federal government bonds 10,050.088 - - 10,050,088 Federal government treasury bills
4,566.010 - - 4,566,010
Trade receivables - 169,761 - 169,761 Loans and advances - - 797,368 797,368 Reinsurance assets (Excl. prepaid reinsurance)
- - 274,416 274,416
Other receivables - - 135,169 135,169 Statutory deposits - 500,000 - 500,000 - Total financial assets 14,616,098 40,751,438 1,206,953 56,574.489 Liabilities Investment contract liabilities - - 18,294,287 18,294,287 Trade payables - - 2,754,639 2,754,639 Other liabilities - - 2,372,725 2,372,725 Total financial liabilities - - 23,421,651 23,421,651
Company 31 December 2015
All amounts are in thousands of Naira unless otherwise statedAssets Level 1 Level 2 Level 3 Total
Cash and cash equivalents - 14,656,941 - 14,656,941 Held to maturity investment securities: State bonds - 1,280,672 - 1,280,672 Corporate bonds - 8,601,051 - 8,601,051 Federal government bonds 5,179,693 - - 5,179,693 Federal government treasury bills 56,347 - - 56,347 Trade receivables - 543,971 - 543,971 Loans and advances - - 1,217,079 1,217,079 Reinsurance assets (Excl. prepaid reinsurance)
- - 471,660 471,660
Other receivables - - 543,473 543,473 Statutory deposits - 500,000 - 500,000 Total financial assets 5,236,040 25,582,635 2,234,212 33,052,887 Liabilities Investment contract liabilities - - 15,459,507 15,459.507 Trade payables - - 2,714,107 2,714,107 Other liabilities - - 1,253,064 1,253,064 - Total financial liabilities - - 19,426,678 19,426,678
The fair value of financial assets and liabilities that are not carried at fair value were determined respectively as follows:
(I) CashIncluded in the balances of cash and cash equivalents are cash and balances with banks and short-term placement. The carrying amount of cash and cash equivalents is a reasonable approximation of fair value.
Notes to the financial statementsFor the year ended 31 December 2016

OVERVIEWBUSINESSREVIEW GOVERNANCE
GROUP FINANCIALSTATEMENTS APPENDIX
83www.leadway.comAnnual Report & Accounts 2016
(All amounts in thousands of Nigerian Naira unless otherwise stated)Before
Reinsurance Share of
Gross After
Reinsurance Share of net
SA
7,0292,379,419 2,262,366
(ii) Held to maturity investment securitiesThe fair value of held to maturity treasury bills and bonds are determined with reference to quoted prices in active market for identical assets, valued using market prices of individual securities at the reporting date. Where this information is not available, fair value is estimated using quoted market prices for securities with similar characteristics.
(I) Loans and advances and borrowingsThe estimated fair value of loans and advances represents the discounted amount of estimated future cash flows expected to be received. Expected future cash flows are discounted at the current market rate to determine the fair value.
(iv) Trade receivables, Other Receivables, Reinsurance Assets (Excl. prepaid reinsurance), Trade payables and Other liabilitiesThe estimated fair value of receivables and payables with no stated maturity which includes no interest payables and receivables is the amount repayable or received on demand. The carrying amounts are a reasonable approximation of their fair values which are payable on demand.
(v) Investment contract liabilitiesInvestment contracts are those that do not transfer significant insurance risk from the contract holder to the issuer. The carrying amount of investment contract liability is a reasonable approximation of fair value.
3.5 Management of Insurance Risk The Group issues contracts that transfer insurance risk or financial risk or both. This section summarizes these risks and the way the Group manages them. Insurance RiskThe risk in any insurance contract is the possibility that the event insured against occurs, resulting in a claim. This risk is very random and unforeseeable. The principal risk that the Group faces under its insurance contracts is that the actual claims and benefits payments exceed the carrying amount of the insurance liabilities. This could occur because the frequency or severity of claims and benefits are greater than estimated. Insurance events are random, and the actual number and amount of claims and benefits will vary from year to year from the level established using statistical techniques.Our insurance underwriting strategy has been developed in such a way that the types of insurance risks accepted are diversified to achieve a sufficiently large population of risks to reduce the variability of the expected outcome. Insurance risk is increased by the lack of risk diversification in terms of type and amount of risk, geographical location and type of industry covered.
Non-life Insurance Contracts(a) Frequency and severity of claims: The frequency and severity of claims can be affected by several factors. The most significant are the increasing level of awards for the damages suffered as a result of road accidents. The Group manages these risks through its underwriting strategy, adequate reinsurance arrangements and proactive claims handling and investigations.
Underwriting limits are in place to enforce appropriate risk selection criteria. For example, the Group has the right not to renew certain policies, it can impose excess or deductibles and has the right to reject the payment of a fraudulent claim. Insurance contracts also entitle the Group to pursue third parties for payment of some or all of claims costs. The reinsurance arrangements include excess and proportional coverage. The effect of such reinsurance arrangements is that the Group should not suffer total net insurance losses in any one year.
The Group has a specialized claims unit that ensures mitigation of the risks surrounding all known claims. This unit investigates and adjusts all claims in conjunction with appointed loss adjusters. The Group actively manages and pursues early settlements of claims to reduce its exposure to unpredictable developments.
Risk concentration is assessed per class of business. The concentration of insurance risk before and after reinsurance by class in relation to the type of insurance risk accepted is summarized below, with reference to the carrying amount of the insurance liabilities (gross and net of reinsurance) arising from all non-life insurances.
Insurance risk concentration per class of business showing the type of risk, carrying the amount of the reinsurance "liabilities.
The table below shows the Group life risk exposure by industry or sector in 2016. The table shows that the company's exposure is highly skewed towards Civil Service/Government agency followed by Oil and Gas and Estate Management/Insurance. Banking & Financial Institutions respectively.
The table below shows the Group life risk exposure by industry or sector in 2015. The table shows that the company's exposure is highly skewed towards Civil Service/Government agency followed by Oil and Gas and Estate Management/Insurance. Banking & Financial Institutions respectively.
Estate Management/Insurance, banking & Financial Institutions Oil & Gas Civil services/Government Agency Engineering & Construction Marketing & Consulting/Supplies & Trading/Courier Services Manufacturing Radio & Television/Electronics & Telecommunication Marine & Aviation Education, Research & Professional Institution1 Foods & Beverages/Agro-allied Health Service provider Religious Institutions/NGO/Club & Associations Hotels and Resorts/catering serves Miscellaneous/Others Security Personnel
457,829
506,653 410,796
79,137
87,717 106,716
73,034 61,109 33,234 25,245 89,819 14,602
368,982
19%
21% 17% 3%
4% 4% 3% 3% 1% 1% 4% 1% 16% 1%
436,277
484,318 409,808
63,066
84,338 91,927 71,223 58,775 32,870 24,289 86,912 14,602
343,152 6,993
19%
21% 18% 3%
4% 4% 3% 3% 1% 1% 4% 1% 15% 0%
Notes to the financial statementsFor the year ended 31 December 2016
57,717 2% 53,816 2%

Notes to the financial statementsFor the year ended 31 December 2016
b) Sources of uncertainty in the estimation of future claim paymentsClaims on non-life insurance contracts are payable on a claims-occurrence basis. The Group is liable for all insured events that occurred during the term of the contract. There are several variables that affect the amount and timing of cash flows from these contracts. These mainly relate to the inherent risks of the business activities carried out by individual contract holders and the risk management procedures they adopted. The estimated cost of claims includes direct expenses to be incurred in settling claims, net of the expected subrogation value and other recoveries.
The Group takes all reasonable steps to ensure that it has appropriate information regarding its claims exposures. However, given the uncertainty in establishing claims provisions, it is likely that the final outcome will prove to be different from the original liability established. The reserves held for these contracts comprises of a provision for IBNR, a provision for reported claims not yet paid and a provision for unearned premiums at the end of the reporting period.
(c) Process used to decide on assumptionsNon-life insurance contract liabilities: The discounted inflation adjusted chain ladder method (IABCL) was applied for reserving in respect of non-life risk, with the exception of special risk policies reserved using the Expected Loss Ratio Approach. The discounted inflation adjusted chain ladder method (IABCL) method involves historically paid losses being inflated using the corresponding inflation index in each of the accident years to the year of valuation and then accumulated to their ultimate values for each accident year to obtain the projected outstanding claims. The projected outstanding claims are then further multiplied by the future inflation index from the year of valuation to the future.
The Expected Loss Ratio Approach was adopted for the special risk sub-category of non-life risks due to the volume of data available being too small to becredible when using a statistical approach. Under this method, the ultimate claims are obtained by assuming loss ratio. Paid claims already emerged is thendeducted for from the estimated ultimate claims.
The provision for outstanding claims, including IBNR, was determined for each line of business on both gross and net of reinsurance basis. A yearly cohort from the year 2008 has been adopted in building the historical claims. The reserve was calculated using the inflation adjusted chain ladder method. Under this method, the historically paid losses are inflated using the corresponding inflation index in each of the accident years to the year of valuation and then accumulated to their ultimate values for each accident year to obtain the projected outstanding claims. These projected outstanding claims are then further multiplied by the future inflation index from the year of valuation to the future year of payment of the outstanding claims. The following official inflation index below was adopted:
Year Inflation index
Accumulated Inflation Index
2007 6.6% 193.2%2008 15.1% 175-0%2009 13 9% 138.9%2010 11.8% 109.8%2011 10.3% 87.6%2012 12.0% 70.1%2013 8.0% 51.9% 2014 8.3% 40.6%2015 9.6% 29.9%2016 18.5% 18.5%
See note 23.4 for claims development tables
Key assumptionsThe methods assume that future claims follow a regression pattern from the historical data. Hence payment patterns will be broadly similar in each accident year. Thus the proportionate increase in the known cumulative payments from one development year to the next is used to calculate the expected cumulative payments for the future development periods.
- The run off period is six (6) years.- An implicit assumption of the chain ladder is that weighted past average inflation will remain unchanged into the future.- We assume gross claim amount includes all related claim expenses. If this is not the case, we will hold a separate reserve to cover claim expenses.- The UPR is calculated on the assumption that risk will occur evenly during the duration of the policy.- The BF method assumes past experience is not fully representative of the future.- Historical average loss ratio under gross Special Risk is 26% and 6.5% is the proportion of recoveries to ceded premiums, we have assumed loss
ratio of 50% and 20% respectively.
Life insurance contract liabilities Individual risk business comprises whole life assurances, endowment assurances and term assurances of descriptions, including mortgage protection and credit life. For all individual risk business, the gross premium method of valuation was adopted. Reserves were calculated via a cash flow projection approach, taking into account future office premium, expenses and benefit payments, including payments on surrender where applicable. Future cash flows were discounted back to the valuation date at the valuation rate of interest.
An unexpired premium reserve was included for Group life business, after allowing for acquisition expenses. An additional unexpired risk reserve was also held for any inadequacies in the unexpired risk reserve for meeting claims in respect of the expired period. The claim rates underlying the additional unexpired risk reserve were based on pooled historical scheme claims experience.
An allowance was made for incurred but not reported (IBNR) claims in group life to take care of delay in reporting claims. This was based on a loss ratio, which uses historical claims rates, from which the IBNR is determined. The cash flow projection method applied in respect ofindividual risk is also applied to the group life.
www.leadway.comAnnual Report & Accounts 201684
RC 7588

Notes to the financial statementsFor the year ended 31 December 2016
Key assumptionsMaterial judgment is required in determining the liabilities and, in particular, in the choice of assumptions. Assumptions in use are based on past experience, current internal data, external market indices and benchmarks which reflect current observable market prices and other published information. Assumptions and prudent estimates are determined at the date of valuation and no credit is taken for possible beneficial effects of voluntary withdrawals. Assumptions are further evaluated on a continuous basis in order to ensure realistic and reasonable reserves are set aside to meet liabilities.
(i) Sensitivity analysis on insurance contract liabilitiesThe analysis which follows is performed for possible movements in key assumptions with all other assumptions held constant, and shows the impact on gross and net liabilities, profit before tax and equity. The correlation of assumptions will have a significant effect in determining the ultimate claims liabilities, but to demonstrate the impact due to changes in assumptions, the assumptions had to be changed on an individual basis.
It should be noted that movements in these assumptions are non-linear. Sensitivity information will also vary according to the current economic assumptions, mainly due to the impact of changes to both the intrinsic cost and time value of options and guarantees. When options and guarantees exist, they are the main reason for the asymmetry of sensitivities.Sensitivities were not applied to the Reinsurance for individual life business as its value is immaterial. Also, Mortality sensitivity tests were applied in the opposite direction for the annuity business. These are as shown on the next page;
OVERVIEWBUSINESSREVIEW GOVERNANCE
GROUP FINANCIALSTATEMENTS APPENDIX
85www.leadway.comAnnual Report & Accounts 2016

Life insurance contract liabilities
Base Interest rate +1%
Interest rate 1%
Expenses+ 10%
Expenses -10%
Expense Inflation
+2%
Expense Inflation
-2%
Lapses +10%
Individual Traditional (excluding annuity)
2,686,270 2,639,426 2,738,512 2,736,643 2,637,330 2,718,746 2,659,854 2,674,159
Annuity 67,976,792 64,871,919 71,398,057 68,121,969 67,831,615 68,263,511 67,756,732 67,976,792Individual Investment Linked
8,361,419 8,361,419 8,361,419 8,361,419 8,361,419 8,361,419 8,361,419 8,361,419
Group DA 10,402,304 10,402,304 10,402,304 10,402,304 10,402,304 10,402,304 10,402,304 10,402,304Group Life – UPR
520,844 520,844 520,844 520,844 520,844 520,844 520,844 520,844
Group Life – IBNR
788,423 788,423 788,423 788,423 788,423 788,423 788,423 788,423
Other Group Risk
10,057 10,025 10,089 10,692 9,426 10,095 10,018 10,045
Additional reserves
200,000 200,000 200,000 200,000 200,000 200,000 200,000 200,000
Reinsurance (75,795) (75,795) (75,795) (75,795) (75,795) (75,795) (75,795) (75,795)Net liability 90,870,314 87,718,565 94,343,853 91,066,499 90,675,566 91,189,547 90,623,799 90,858,191% change in liability
3.82% 0.22% -0.21% 0.35% -0.27% -0.01%
Summary Base Interest rate +1%
Interest rate 1%
Expenses+ 10%
Expenses - 10%
Expense Inflation
+ 2%
Expense Inflation -
-2%
Lapses+10%
Individual 79,224,482 76,072,764 82,697,988 79,420,032 79,030,364 79,543,676 78,978,005 79,212,370Group 11,645,832 11,645,801 11,645,865 11,646,467 11,645,202 11,645,871 11,645,794 11,645,821Net liability 90,870,314 87,718,565 94,343,853 91,066,499 90,675,566 91,189,547 90,623,799 90,858,191
% change in liability
- -3% 4% 0% 0% 0% 0% 0%
- The mortality stress has been applied in the opposite direction for annuities. For example, the 5% strengthening of the mortality assumption was modeled as 5% lighter mortality for annuitants
- All stresses were applied independently- All stresses were applied independently
(b) Non-life insurance contract liabilities
Class of business Base 5% Development
Ratio
-5% Development
Ratio
1% Inflation
Rate
-1% Inflation
Rate
Accident 962,137 985,545 938,730 971,426 952,918 Engineering 464,561 479,605 449,517 467,113 462,040 Fire 2,057,531 2,216,024 1,899,039 2,069,611 2,045,499 Marine 1,421,832 1,453,574 1,390,089 1,431,368 1,412,318 Motor 975,814 1,074,647 876,980 98,5,774 965,897 Bond 421,579 493,514, 381,614 421,579 421,579 Special Risks 15,709,923 15,920,040 15,499,805 15,709,923 15,709,923
Total 22,013,377 22,622,949 21,435,774 22,056,794 21,970,174Account outstanding
18,494,853 18,494,853 18,494,853 18,494,853 18,494,853
Difference 3,518,524 4,128,096 2,940,921 3,561,941 3,475,321
Percentage change 2.8% -2.6% 0.2% -0.2%
1% Discount
Rate
-1% Discount
Rate
954,936 969,504 460,284 468,960
2,045,213 2,070,082 1,414,358 1,429,430 969,883 981,859 421,579 421,579
15,709,923 15,709,923
21,976,176 22,051,33718,494,8,53 18,494,853
3,481,323 3,556,484
-0.2% 0.2%
The key assumptions to which the estimation of liabilities is particularly sensitive to are as follows:
Mortality and morbidity ratesAssumptions are based on standard industry and national tables, according to the type of contract written and the territory in which the insured person resides. They reflect recent historical experience and are adjusted when appropriate to reflect the Group's experience.
An appropriate, but not an excessive prudent allowance is made for expected future improvements. Assumptions are differentiated by sex, underwriting class, and contract type.
An increase in rates will lead to a larger number of expected claims (and claims could occur sooner than anticipated), which will increase the reserve and reduce reported profits for the shareholders.
www.leadway.comAnnual Report & Accounts 201686
RC 7588
-3.47%

Lapses -10%
Mortality +5%
Mortality - 5%
2,698,955 2,708,937 2,663,516
67,976,792 68,275,450 67,687,294 8,361,419 8,361,419 8,361,419
10,402,304 10,402,304 10,402,304 520,844 520,844 520,844
788,423 788,423 788,423
10,068 10,168 9,947
200,000 200,000 200,000
(75,795) (75,795) (75,795) 90,883,010 91,191,750 90,557,952
0.01% 0.35% -0.34%
Lapses 10%
Mortality +5%
Mortality - 5%
79,237,166 79,545,806 78,912,229 11,645,844 11,645,944 11,645,723 90,883,010 91,191,750 90,557,952
0% 0% 0%
OVERVIEWBUSINESSREVIEW GOVERNANCE
GROUP FINANCIALSTATEMENTS APPENDIX
87www.leadway.comAnnual Report & Accounts 2016

www.leadway.comAnnual Report & Accounts 201688
RC 7588
LongevityAssumptions are based on standard industry and national tables, adjusted when appropriate to reflect the Group's experience.An appropriate, but not an excessive prudent allowance is made for expected future improvements. Assumptions are differentiated by sex, underwriting class, and contract type.
An increase in longevity rates will lead to an increase in the expected number of annuity payments to be made, which will increase the reserve and reduce reported profits for the shareholders.
Investment returnThe weighted average rate of return is derived based on a model portfolio that is assumed to back Liabilities, consistent with the long—term asset allocation strategy. These estimates are based on current market returns as well as expectations about future economic and financial developments. An increase in investment return would lead to a reduction in reserves and an increase in reported profits for the shareholders.
ExpensesOperating expense assumption reflects the projected costs of maintaining and servicing in—force policies and associated overhead expenses. The current level of expenses is taken as an appropriate expense base, adjusted for expected expense inflation if appropriate.
An increase in the level of expenses would result in an increase in expected expenditure thereby reducing reported profits for the shareholders.
Lapses and surrender ratesLapses relate to the termination of risk policies or investment policies that have not acquired a value due to non-payment of premiums. Surrenders relate to the voluntary termination of policies by policyholders. Policy termination assumptions are determined using statistical measures based on the Company's experience and vary by product type.
An increase in lapse rates early in the life of the policy would tend to reduce profits for shareholders to the unrecouped initial expenses.
Life insurance liabilities are determined as the sum of the discounted value of the expected benefits and future administration expenses directly related to the contract, less the discounted value of the expected theoretical premiums that would be required to meet these future cash outflows. Discount rates are based on the long-term risk-free rate plus an adjustment for risk.
A decrease in the discount rate will increase the value of the insurance liability and therefore reduce profits for the shareholders with the exception of a perfectly matched annuity portfolio where both assets and liabilities will increase by the same magnitude.
The following table outlines the general form of terms and conditions that apply to contracts sold in each category of business, and the nature of the risk incurred by the Group.
S/N Name Features 1 Leadway Immediate
Annuity Plan Designed to help with the cost of retirement by providing a guaranteed income for the rest of the policyholder's life. The annual payments can be made monthly, quarterly or annually. During the stated g uarantee period, the annuity period payment will continue whether the annuitant is alive or not. If the annuitant dies before the end of the guarantee period the present value of the outstanding payment due within the guarantee period shall be payable in a lump sum to the named beneficiary or to the estate of the annuitant under probate.
2 Comfort5plus plan
It offers protection against the unexpected for full 5 years. The benefit is only paid when the risk (death, critical illness, and accidental medical expenses) occurs. If none of these crystallizes, nothing is paid to the beneficiary. Two options are available: Option A: Payment of Sum Assured and a 10-year quarterly immediate annuity of 20% Sum Assured upon death. Upon Critical Illness, the benefit is 300% of sum assured and termination of policy afterward. On injury due to personal accident medical expenses up to a maximum of 100,000 is paid per annum. Option B: Payment of Sum Assured and a 10-year quarterly immediate annuity of 20% Sum Assured up on death. Upon Critical Illness, the benefit is 300% of sum assured. If critical illness leads to death, an extra benefit of 80% of sum assured is paid. On injury due to personal accident, medical expenses up to a maximum of 100,000 is paid per annum.

OVERVIEWBUSINESSREVIEW GOVERNANCE
GROUP FINANCIALSTATEMENTS APPENDIX
89www.leadway.comAnnual Report & Accounts 2016
3 Annuity certain Policyholder buys into this product and pays a lump -sum premium. The policyholder, in turn, receives predefined payments throughout the term of the policy. If the policyholder dies within the annuity period, the balance in the annuity is payable to the beneficiary, but if he survives the annuitant (policyholder) gets the annuity.
Education The Policy covers payment of fees for the named beneficiary children or ward whilst in school or college in the event of death, total permanent disabl ement (optional cover) or critical illness (optional cover) of the named parent and/or Policyholder. The policy has a term of one year and is renewable subject to underwriting terms. Premium payment can be made in installments subject to a maximum of three times annually.
The benefit shall be payable to the named school through the named guardian for the unexpired school years as stated in the schedule.
5 Family Benefit Plan Leadway's Funeral Insurance Cover Plan. Designed to address any unforeseen financial worries in the event of the loss of an insured life or death of the policyholder. They provide funeral insurance cushion which can be extended to your spouse, parents and/or parents-in-laws. The policy benefits can be extended to cover Critical Illnes s and Accidental Permanent and Total Disability (Optional).
- A whole Life Assurance that pays the sum assured on death on policyholder or any of the parents or spouse insured.
- Policy terminates on the first death. - Additional grocery voucher of N25,00 0 on the death of any member and a family
support benefit payable for 6 months in installments of N20, 000 on the death of the policyholder.
6 Family Benefit Plan
Plus Whole Life Assurance that pays the sum assured on the death of each of the members including the policyholder and spouse.
Pays benefit for deaths of all the lives insured up to the death of the policyholder.
Additional grocery voucher of N25,000 on the death of any member and a family support benefit payable for 6 months in installments of N20,000 on the death of the policyholder.
7 Group life Sum assured is payable in the event of death of a member while in the service of the employer and before retirement Refund of premium: in the event of the assurance on the life of a member being ter minated before the normal retirement date from any cause other than death, the Company will pay to the employer a rebate in respect of the relative premium proportionate to the unexpired portion of the then current year of assurance.
Rates of premium used in determining contributions and sum assured are guaranteed for 12 months, Leadway has the right to charge extra premiums on medical grounds.
8 Credit Life Credit Life Protection that pays outstanding loan amount on death
9 Credit Life Protection that pays outstanding loan amount, 6 months job loss and PTD Rider in the event of a claim.
Personal Loan Protection Plan
10 Term Assurance The Leadway Term Assurance product is a simple but flexible life insurance product that pays out a lump sum if death occurs during the period of cover.
11. Mortgage Protection Plan
Credit life protection that pays outstanding loan amount on death. It also has a PTD rider benefit.
12 REN Credit Life Credit Life Protection that pays outstanding loan amount on death. It also has a PTD rider benefit
13 RSL Credit Life Insurance
Credit Life Protection that pays outstanding loan amount on death, critical illness, and Permanent Disability with 6 months job loss cover
14 Vehicle LoanProtection Plan
Credit Life Protec tion that pays outstanding loan amount on Death and Permanent Disability with 6 months job loss cover
15 Heritage Credit Life Protection
Credit Life Protection that pays outstanding loan amount on Death and Permanent Disability with 3 months job loss cover
16 Heritage PersonalProtection Plan
Credit Life Protection that pays outstanding loan amount on Death and Permanent Disability- with 6 months job loss cover
17 Small and Medium Enterprise
Credit Life Protection that pays outstanding loan amount on death or named Critical Illness
18 Credit CardProtection
Credit Life Protection that pays outstanding loan amount on death
4

www.leadway.comAnnual Report & Accounts 201690
RC 7588
19 GTB Credit Life Protection
Credit Life Protection that pays outstanding loan amount on Death and Permanent Disability with 6 months job loss cover
20 Persona] CreditLoan
Credit Life Protection that pays outstanding loan amount with one month Job loss
21 erm LoanProtection Plan
Credit Life Protection that pays outstanding loan amount on Death, Critical Illness or Permanent Total Disability
22 Group Credit Life Credit Life Protection that pays outstanding loan amount on Death and Critical Illness, 6 months job loss and PTD Rider
23 Group MortgageProtection
Credit Life Protection that pays outstanding loan amount on death, or PTD, with 12 months Job loss
24 Private Health Plan Designed to provide covers for Healthcare Total Permanent Disability and Funeral Expenses in the event of death.
Funeral and Accidental Total Permanent Disability cover is a fixed benefit chosen by policyholder, with a minimum of N200.000
25 Leadway Lifestyle Protection Plan
Leadway Lifestyle Protection is a life insurance plan that provides you with a life cover and also optionally protects you against Critical Illness, Permanent Total Disability and Job Loss.
The product pays a sum assured on occurrence of the insured risks within the policy term. The minimum policy term is one year.
For having consecutive claim -free years, you receive a cash -back payment which is a rate on the premiums paid in the year.
Investment contract liabilities -The following table outlines the deposit based (DA) products)
S/N Name Features 1. Deferred annuity
plan This product meets protection and savings needs of a policyholder towards funding an annuity pension at retirement. Contributions from policy holder are to be invested in a fund. The accumulated return on the investment aswell as the invested amount is due on maturity. Payment of Sum Assured + Savings account balance upon death. Minimum policy term is 3 years. On choosing critical illness and/or PTD riders, payment of sum assured on the riders + Savings account balance in the event of claim.
2 Leadway Investment Plan
A death benefit where the benefit payable is 125% of the investment premium (with the 25% subject to a maximum of N 5 million) or the value of the account balance, whichever is higher. A guaranteed amount (known at inception) is paid upon maturity of the investment. Policyholders can avail additional Life Cover, Critical illness and PTD cover.
3 Personal Savings Plan
Deposit Based Savings. Death benefit is half the account balance subject to be a maximum of Ni million.
4 Education Savings Plan
Payment of Sum Assured (Target amount) upon Death and Maturity. Policy terminates after payment of any benefit. Critical illness, Accidental, Total and Permanent disability are optional riders and attract additional premium.
5 Leadway Target Plan
Endowment Assurance. Maturity benefit is Sum Assured payable in advance for 4 years after maturity. On death, waiver of premium and 150% sum assured is payable. On critical illness, 100% of sum assured is payable and waiver of premiums.
6 Education Savings Plan
Payment of Sum Assured + Sav ings account balance upon death, Minimum policy term is 5 years, on choosing critical illness and/or PTD riders, payment of sum assured on the riders.

OVERVIEWBUSINESSREVIEW GOVERNANCE
GROUP FINANCIALSTATEMENTS APPENDIX
91www.leadway.comAnnual Report & Accounts 2016
7 Leadway Savings
Plan Payment of Sum Assured + Savings account balance upon death. At maturity, account deposit balance is paid. On choosing critical illness and/or PTD riders, payment of sum assured on the riders + Savings account balance in the event of claim.
8 Custodian Deposit based savings. Risk component is the outstanding premium payable. It is thus a decreasing term assurance with start sum assured equal to contracted total premium. Risk benefit is funded by the Nil and partial allocations on the premiums. The structure for Nil and Partial allocation. Year 1- 75% allocation. Year 2 to year 4 90% allocation. Year 6 afterwards - 97% allocation. The product is running off.
9 Individual Deposit
Admin The life cover granted during the policy shall be future unpaid premiums up to cessation date provided the policy is in force. This policy has nil allocation between 4 months to 8 months during which the overhead cost of the Company are met. If term assurance is not opted for, 100% premium will be transferred to the policyholder's account for investment purpose. When policyholder dies, the balance in the policyholder's account plus total premium due after death and before maturity is payable to the beneficiary. If the policyholder surrenders or terminates the policy; the balance in the policyholder's account is payable. On maturity, accumulated balance in the policy holder's account is paid or instalment payment of the maturity benefit through the period of child's education.
10 Pearl Deposit based savings. No risk cover. The product is running off. No new business.
11 Group Deposit Admin
Guaranteed interest (renewable annually) on all deposits received from employer. Contribution to the fund can be on individual basis or on pool basis. If a member leaves the service of the employer before normal retirement date, accrued benefit up to withdrawal date in respect of employee's and employer's contribution shall be paid to the member. Pension option: In the event of the benefit becoming payable; it could be applied in whole or in part to secure a Pension. This pension is payable at equal intervals to the member until he dies, however the payment is guaranteed for a predefined period. If a member leaves the service of the employer before normal retirement date, accrued benefit up to withdrawal date in respect of employee's and employer's contribution shall be paid to the member. If a member dies before the expiration of the guaranteed period a cash sum shall be payable.
4. Critical accounting estimates and judgement.The Company makes estimates and assumptions that affect the reported amounts of assets and liabilities within the next financial year. Estimates and judgements are continually evaluated and based on historical experience and other factors, including expectations of future events that are believed to be reasonable under the circumstances.
These disclosures supplement the commentary on enterprise risk management (see note 3). Estimates where management has applied judgements are:(a) Ultimate liability arising from claims made under insurance contracts(b) Determination of fair value of level 3 financial instruments(c) Assessment of impairment of goodwill on acquired subsidiaries
(a) The ultimate liability arising from claims made under insurance contractsThe estimation of the ultimate liability arising from claims made under insurance contracts is one of the Group's most critical accounting estimate. There are several sources of uncertainty that need to be considered in the estimate of the liability that the Group will ultimately pay for such claims.The ultimate cost of outstanding claims is estimated by using a standard actuarial claims projection techniques called the Basic Chain Ladder (BCL).
The main assumption underlying these technique is that the Group's past claims development experience can be used to project future claims development and hence ultimate claims costs. As such, this method extrapolates the development of paid and incurred losses, average costs per claim and claim numbers based on the observed development of earlier years and expected loss ratios. Historical claims development is mainly analyzed by accident years and the assumptions used are those implicit in the historical claims development data on which the projections are based. Additional qualitative judgment is used to assess the extent to which past trends may not apply in future, (for example to reflect one-off occurrences, changes in external or market factors such as public attitudes to claiming, economic conditions, levels of claims, inflation, judicial decisions and legislation, as well as internal factors such as portfolio mix, policy features and claims handling procedures) in order to arrive at the estimated ultimate cost of claims that present the likely outcome from the range of possible outcomes, taking account of all the uncertainties involved.
See note 3.5 (i) for sensitivity analysis on insurance contract liabilities.

www.leadway.comAnnual Report & Accounts 201692
RC 7588
(b) Determination of fair value of level 3 financial instruments.
Investments in unquoted equity securities that are classified as equity securities at fair value available for sale financial instrument in line with the accounting policies as set out in note 2.6e of the statement of significant accounting policies. See note 3.41a for the valuation methodology for the determining the fair value and the sensitivity analysis of unobservable input
(c) Assessment of impairment of goodwill on acquired subsidiaries
Goodwill on acquired subsidiaries was tested for impairment using discounted cash flow valuation method. Projected cash flows were discounted to present value using a discount rate of 16.8% and a cash flow growth rate of 18% over a period of 5 years. The Group determined the appropriate discount rate at the end of the reporting period. See note 17 for further details.
5. SEGMENT INFORMATION(All amounts in thousands of Nigerian Naira unless otherwise stated)
The board of directors is the group's chief operating decision-maker. Management has determined the operating segments based on the information reviewed by the board of directors for the purpose of allocating resources and assessing performance from the product and services perspective. Segment information is presented in respect of the Group's business segments and is based on the Group's management and reporting structure. The Group is organized into five operating segments. These segments distribute their products through various forms of brokers, agencies and direct marketing programs. Management identifies its reportable operating segments by based on the Group's management and reporting structure. These segments and their respective operations are as follows:
Non life insurance business
This component offers protection against different forms of risk (i.e. Engineering, fire, general accident, bond and marine) to individuals and corporate customers. Its revenue stream is driven by premium income and investment income from investment securities. The policies issued are usually short tenored.
Life insurance business
This component offers life assurance for individuals and groups (i.e. Death, permanent disability or critical illness), and acquisition of annuities. Deposits are also accepted for investment contracts with guaranteed interest. Its revenue stream is driven by premium income, annuities, and investment income from invest men I securities. The policies issued are usually long tenored.
Trusteeship
This component is principally engaged in the business of providing Trust Management, Investment Management and related financial services to its customers. Such services include provision of loans and advances to both corporate and individual customers by way of commercial loans or lease. Its revenue stream is driven by interest on deposits and loans and trustee fees.
Hospitality
This component owns a hotel "Leadway Hotel Limited". Its revenue stream is driven by room occupancy.
Property management
This component is involved in the property management, outsourcing services, software application provision, hotel development and real estate acquisition.
Pension fund management
This component carry on the business of pension fund management and administration in line with the Pension Reform Act 2014.

OVERVIEWBUSINESSREVIEW GOVERNANCE
GROUP FINANCIALSTATEMENTS APPENDIX
93www.leadway.comAnnual Report & Accounts 2016
BLANK PAGEFOR LEGIBILITY OF NEXT PAGE

RC 7588
www.leadway.comAnnual Report & Accounts 201694
The consolidated financial data for the reporting segments for the year ended 31 December 2016 is as follows:
SEGMENT INCOME STATEMENT
31-Dec-16 Non life Life Trusteeship Hospitality Property management
Pension fund management
Revenue from external customers: Gross premium income 21,539,968 32,133,485 - - - - Reinsurance expenses (12,213,623) (184,775) - - - - Net premium revenue 9,326,345 31,948,710Commission income from insurance contracts 1,825,376 28,477 - - - - Net fair value gain/(loss) on assets at fair value (208,587) (17,207,088) - - - (84,329) Investment income 2,100,826 8,389,629 - - - 323,992 Other operating income 10,086,595 649,927 531,649 785,817 44,648 3,265,660
Net income 23,130,555 531,649 785,817 44,648 3,505,323 Claims expenses (10,023,855) (13,039,071) - - - - Underwriting expenses (3,238,505) (1,803,147) - - - - Increase in annuity fund - (4,429,557) Increase in individual life fund - (42,413) Employee benefit and other operating expenses
(4,016,532) (2,259,228) (95,607) (871,714) (24,525) (1,978,279}
Interest expense - finance cost - - (155,829) - - - Net impairment (losses)/gains (27,520) (343,410) (39,784) (7,607) - - Income tax charge (614,626) (84,866) (54,115) 46,862 (13,528) (486,481)
Net Expense (17,921,038) (22,001,692) (345,335) (832,459) (38,053) (2,464,760)
Reportable segment profit 5,209,517 1,807,963 186,314 (46,642) 6,595 1,040,563 Other segment disclosures:
Depreciation and amortization expense (312,951) (83,927) (2,060) (119,856) (68) (99,295)
Notes to the financial statementsFor the year ended 31 December 2016
23,809,655

OVERVIEWBUSINESSREVIEW GOVERNANCE
GROUP FINANCIALSTATEMENTS APPENDIX
95www.leadway.comAnnual Report & Accounts 2016
Total segment income
Inter-segment income and
consolidation adjustments
Total
53,673,453 (18,295) 53,655,158
(12,398,398) - (12,398,398) 41,275,055 (18,295) 41,256,760
1,853,853 - 1,853,853 (17,500,004) - (17,500,004)
10,814,447 (52,146) 10,762,301 15,364,296 (478,596) 14,885,700
51,807,647 (549,037) 51,258,610(23,062,926) 292 (23,062,634) (5,041,652) - (4,429,557) (4,429,557) - (4,429,557)
(42,413) - (42,413)
(9,245,885) 286,068 (8,959,817) (155,829) 0 (155,829) (418,321) - (419,583)
(1,206,754) - (1,206,754)
43,603,337 286,360 (43,318,238)
8,204,310 (262,677) 7,940,372
(618,157) - (732,040)
Notes to the financial statementsFor the year ended 31 December 2016

RC 7588
www.leadway.comAnnual Report & Accounts 201696
31-Dec-16 Non-life Life Trusteeship Hospitality Property management
Pension fund management
Reportable segment assets Cash and cash equivalent 19,916,045 4,273,651 265,487 325,141 330,651 907,719 Investment securities 20,417,525 90,623,722 181,804 - 6,545 2,444,842 Trade receivables 164,616 5,145 - - - - Reinsurance assets 11,384,279 336,504 - - - - Deferred acquisition cost 486,416 - - - - - Other receivables and prepayments 315,791 1,854,912 2,317,943 103,705 190,390 863,075 Investment in subsidiaries 683,974 2,953,521 - - - - Investment properties 3,134,223 5,025,196 - - - 660,651 Deferred tax asset 198,765 87,682 - - - - Intangible assets 312,306 1,498 11,774 2,545 - 50,192 Property and equipment 3,153,362 491,971 5,235 2,214,899 38 198,434 Statutory deposits 300,000 200,000 - - - - Total reportable segment assets
60,467,302 105,853,802 2,782,243 2,646,290 527,624 5,124,913Reportable segment liabilities Insurance contract liabilities 30,572,177 74,185,467 - - - -Investment contract liabilities - 18,294,287 - - - -Trade payables and other liabilities 8,226,443 1,883,176 1,096,638 408,247 32,344 476,940 Borrowings - - 746,592 95,472 222,336 - Current tax liabilities 647,887 252,256 55,602 12,752 23,944 - Deferred tax liabilities 597,158 131,504 1,111 75,038 - 21,176 Total reportable segment liabilities 40,043,665 94,746,690 1,899,943 591,509 278,624 498,116NET ASSETS 20,423,637 11,107,112 882,300 2,054,781 249,000 4,626,797
Other segment disclosure: Addition to property and equipment 230,667 164,676 34,392 157,442 2,740 92,296
SEGMENT ASSETS AND LIABILITIES
STATEMENT OF COMPREHENSIVE INCOME
31December 2015 Non-life Life Trusteeship Hospitality Property management
Pension fund management
Revenue from external customers: Gross premium income 19,512,935 31,559,6,37 - - - -Reinsurance expenses (10,899,216) (226,190) - - - -Net premium revenue 8,613,719 31,333,447 - - - -
Commission income from insurance contracts
877,632 28,862 - - - -
Net fair value gain/(loss) on assets at fair value
904,172 13,983,819 - - - 192,586
Investment income 1,561,413 8,393,381 - - - 148,099 Other operating income 911,719 130,743 305,798 726,602 54,521 1,788,469
Net income
12,868,655
305,798
726,602
54,521
2,129,154
Claims expenses (4,425,413) (9,939,044) - - - - Underwriting expenses (2,034,621) (2,922,137) - - - - Increase in annuity fund - (33,954,433) - - - - Increase in individual life fund - (570,962) - - - - Employee benefit and other operating expenses (3,618,484) (1,431,155) (88,964) (801,864) (29,916) (1,225,482) Interest expense - finance cost - (36,819) - - - Net impairment (losses)/gains 199,615 (472,443) (94,987) (1,938) - - Income tax charge 63,325 (168,337) (26,559) 4,827 20,383 266,847
Net Expense (9,815,578) (247,329) (798,975) (50,299) (1,492,329)
Reportable segment profit 3,053,077 3,326,854 58,469 (72,373) 4,222 636,825Other segment disclosures: Depreciation and amortization expense (363,478) (93,749) (9,101) (27,723) (12) (77,679)
Share of profit of investmentsaccounted for using the equity method
- - - -- -
Notes to the financial statementsFor the year ended 31 December 2016
53,870,252
(1,084,887)
(50,543,398)

OVERVIEWBUSINESSREVIEW GOVERNANCE
GROUP FINANCIALSTATEMENTS APPENDIX
97www.leadway.comAnnual Report & Accounts 2016
Total segment income
Total
26,018,694 (0) 26,018,694 113,674,438 (80,996) 113,593,442
169,761 - 169,761 11,720,783 - 11,720,783
486,416 - 486,416 5,645,816 (1,045,375) 4,600,441 3,637,495 (3,637,495) - 8,820,070 - 8,820,070
286,447 (1) 286,446 378,315 3,521,579 3,899,894
6,063,939 (0) 6,063,939 500,000 - 500,000
177,402,174 (1,242,288) 176,159,886
104,757,644 104,757,646 18,294,287 - 18,294,287 12,123,788 (404,944) 11,718,844 1,064,400 (859,777) 204,623
992,441 542,578 1,535,019 825,987 10 825,997
138,058,547 (722,131) 137,336,41639,343,627 (520,157) 38,823,470
682,213 - 1,197,489
Total segment income
-segment income and
consolidation adjustments
Total
51,072,572 (8,901) 51,064,481
(11,125,406) (0) (11,125,406)39,947,166 (8,091) 39,939,075
906,494 - 906,494
(15,080,577) (152,952) 14,927,625
10,102,893 (507,554) 9,595,3393,917,852 (300,221) 3,617,631
69,954,982 (767,641) 69,187,341(14,364,457) 349 (14,364,108) (4,956,758) - (4,377,614)
(33,954,433) - (33,954,433)(570,962) - (570,962)
(7,195,865) 101,654 (7,094,211) (1,121,706) 1,090,758 (30,948)
(369,753) - (369,753)(413,974) - (413,974)
(62,947,908) 1,771,905 (61,176,003)
7,007,074 1,004,264 8,011,338
(571,742) - (571,742)
- 201,177 201,177
Notes to the financial statementsFor the year ended 31 December 2016
-
Consolidation/inter-segment
balances

RC 7588
www.leadway.comAnnual Report & Accounts 201698
SEGMENTS, ASSETS AND LIABILITIES
The group is domiciled in Nigeria. No geographical segment information has been provided in these financial statements as there in only one geographical segment. Although the trusteeship and property management segments do not meet the quantitative thresholds required by IFRS 8 for reportable segments, management they are closely monitored by the Chief operating decision maker as potential growth segments and arc expected lo materially contribute lo group revenue in the near future.
No single customer contributed up to 5% of the Croup's revenue in the year (2015: Nil).
Notes to the financial statementsFor the year ended 31 December 2016
management
1,760,407
31-Dec-15 Non-life Life Trusteeship Hospitality Property management
Pension Fund
Reportable segment assets Cash and cash equivalent 8,819,219 5,837,723 312,209 143,718 307,762 Investment securities 14,994,143 76,516,894 186,273 66,470 6,991 714,133 Trade receivables 541,477 2,494 - - - - Loans and advances - - - - - - Reinsurance assets 11,113,773 292,174 - - - - Deferred acquisition cost 423,123 - - - - - Other receivables and prepayments 929,676 1,999,050 1,418,683 152,220 161,243 829,588 Investment in subsidiaries 340,946 2,953,521 - - - - Investment properties 3,400,000 5,395,000 - - - 742,000 Deferred tax asset - 58,635 - - - - Intangible assets 19,869 11,440 7,740 5,632 - 74,562 Property and equipment 3,312,350 448,091 6,154 2,030,744 107 179,228 Statutory deposits 300,000 200,000 - - - - Total reportable segment assets 44,194,576 93,715,022 1,931,059 2,398,784 476,103 4,299,918 Reportable segment liabilities Insurance contract liabilities 24,030,217 69,755,318 - - - - Investment contract liabilities - 15,459,507 - - - - Trade payables and other liabilities 5,008,219 2,198,276 582,483 498,161 23,975 390,060 Borrowings - - 605,556 320,000 220,000 - Current tax liabilities 374,781 277,218 28,884 (1) 23,526 - Deferred tax liabilities 453,896 102,458 1,321 134,683 - 42,148 Total reportable segment liabilities 29,867,113 87,792,777 1,218,244 952,843 267,501 432,208 NET ASSETS 14,327,463 5,922,245 712,815 1,445,941 208,602 3,867,710 Other segment disclosures: Additions to property and equipment 230,667 164,676 34,392 157,442 2,740 92,296 Current tax liabilities 374,781 277,218 28,884 (1) 23,526 - Deferred tax liabilities 453,896 102,458 1,321 134,683 - 42,148

OVERVIEWBUSINESSREVIEW GOVERNANCE
GROUP FINANCIALSTATEMENTS APPENDIX
99www.leadway.comAnnual Report & Accounts 2016
Notes to the financial statementsFor the year ended 31 December 2016
Total segment balances
Consolidation/ Inter-segment
balances
Total
17,181,038 (149,998) 17,031,040 92,484,904 (80,994) 92,403,910
543,971 - 543,971 - -
11,405,947 - 11,405,947 423,123 - 423,123
5,490,460 (1,288,905) 4,201,555 3,294,467 (3,294,467) - 9,537,000 - 9,537,000
58,635 55,494 114,129 119,243 3,521,667 3,640,910
5,976,674 997 5,977,671 500,000 - 500,000
147,015,462 (1,236,206) 145,779,256
93,785,535 - 93,785,535 15,459,507 - 15,459,507
8,701,174 (631,789) 8,069,385 1,145,556 (1,027,110) 118,446
704,408 418,364 1,122,772 734,506 7,266 741,772
120,530,686 (1,233,269) 119,297,417
26,484,776 (2,937) 26,481,839
682,213 - 682,214 704,408 418,364 1,122,772 734,506 7,266 741,772

RC 7588
www.leadway.comAnnual Report & Accounts 2016100
Cash on hand 3,805 3,007 3,246 1,608Cash at bank 3,864,225 2,305,207 3,390,677 2,101,703Tenored deposits 22,150,664 14,722,826 20,795,774 12,553,630Treasury bills with initial matutiry 90 days
- 79,145 - 79,145
Group 31-Dec-16
Group 31-Dec-15
Company 31-Dec-16
Company 31-Dec-15
Group
31-Dec-16 Group
31-Dec-15 Company 31-Dec-16
Company 31-Dec-15
Cash on hand 3,805 3,007 3,246 1,608 Cash at bank 3,864,225 2,305,207 3,390,677 2,101,703 Tenored deposits 22,150,664 14,722,826 20,795,774 12,553,630
Tenored deposits are made up of placements with banks and other financial institutions with less than 3 months maturity from the date of acquisition. The carrying amounts disclosed above reasonably approximates fair value at the reporting date.
Cash and cash equivalents for cash flow purpose includes the following:
6. Cash and cash equivalents
Group
31-Dec-16 Group
31-Dec-15
Company 31-Dec-16
Company 31-Dec-15
Analysis of premium debtors in days 0-30 days
169,761 543,971 169,761 543,971
7. Trade receivables(a) Trade receivable comprises the following:
Group 31-Dec-16
Group 31-Dec-15
Company 31-Dec-16
Non-life assurancereceivables
164,616 541,478 164,616 541,478
Life insurance receivables 5,145 2,493 5,145 2,493
Current 169,761 543,971 169,761 543,971 169,761 543,971 169,761 543,971
(b) The age analysis of gross insurance receivables as at the end of the year is as follows:
Group 31-Dec-16
Group 31-Dec-15
Company 31-Dec-16
Company 31-Dec-15
Balance beginning of year - 230,833 - 230,833 Allowance no longer required (see note 38)
- (230,833) - (230,833)
Balance end of year - - - -
( c) The movement in allowance for impairment of trade receivables is as follows:
Company 31-Dec-15
8. Investment Securities The Group's investment securities are summarized below by measurement category in the table below:
Group 31-Dec-16
Group 31-Dec-15
Company 31-Dec-16
Company 31-Dec-15
Financial assets at fair value through profit or loss (see note 8.1 below)
69,429,589 66,322,015 69,326,992 66,214,502
Available for sale (see note 8.2 below) 11,210,932 9,603,510 11,206,175 9,598,753 Held to maturity (see note 8.3 below) 32,952,921 16,478,385 30,508,078 15,697,784
Notes to the financial statementsFor the year ended 31 December 2016
113,593,442 92,403,910 111,041,245 91,511,039 Current 83,112,655 74,897,875 83,112,655 74,897,875 Non-current 30,480,787 17,506,035 27,928,590 16,613,164 113,593,442 92,403,910 111,041,245 91,511,039
169,761 543,971 169,761 543,971
169,761 543,971 169,761 543,971
26,018,694 17,110,185 24,189,697 14,736,086
26,018,694 17,031,040 24,189,697 14,656,941

OVERVIEWBUSINESSREVIEW GOVERNANCE
GROUP FINANCIALSTATEMENTS APPENDIX
101www.leadway.comAnnual Report & Accounts 2016
The assets comprised in each of the categories above the detailed in the table below: 8.1 Financial assets at fair value through profit or loss
Group 31-Dec-16
Group 31-Dec-15
Company 31-Dec-16
Company
Designated at fair value through profit or loss Debt securities - Listed 67,888,375 64,792,901 67,888,375 64,792,900
Equity securities: 1,445-162 1,428,592 1,438,617 1,421,602
31-Dec-15
Movement in Financial assets designated at fair value through profit or loss Group
31-Dec-16 Group
31-Dec-15 Company 31-Dec-16
Company 31-Dec-15
Opening balance Additions 66,322,015 32,611,259 66,214,502 32,481,495 Disposals 27,147,172 23,520,041 27,152,086 23,521,076 Accrued Interest (7,418,865) (3,875,631) (7,418,865) (3,875,631) Interest received 8,702,831 2,935,585 8,702,831 2,936,620 Fair value changes (8,268,679) (2,935,585) (8,268,679) (2,936,620)
Group 31-Dec-16
Group 31-Dec-15
Company 31-Dec-16
Company 31-Dec-15
Equity securities at fair value - Listed 6,550,172 5,538,305 6,550,172 5,538,305 -Unlisted (see note a(i) below) 4,066,217 3,165,808 4,061,460 3,161,051
Less allowance for impairment loss (see note (b) below) (24,960)
(24,960)
(24,960)
(24,960)
8.2 Available for sale financial assetsCertain unquoted investment securities listed below for which fair values could not be reliably estimated have been carried at cost less impairment. There are no active markets for these equity instruments, fair value information are therefore not available making it impracticable for the group to fair value these investments. The group does not intend to dispose any of these investments within the next financial year.
Notes to the financial statementsFor the year ended 31 December 2016
- Listed
69,333,537 66,221,493 69,326,992 66,214,502 Held for trading Equity securities - Listed
96,052 100,522
96,052 100,522 Total financial assets at fair value through profit or loss.
69,429,589 66,322,015 69,326,992 66,214,502
Current 69,429,589 66,322,015 69,326,992 66,214,502 69,429,589 66,322,015 69,326,992 66,214,502
Opening balance (17,054,884) 14,066,346 (17,054,883) 14,087,562 69,429,589 66,322,015 69,326,992 66,214,502
Current 6,550,172 5,538,305 6,550,172 5,538,305 Non-Current 4,660,760 4,065,205 4,656,003 4,060,448 11,210,932 9,603,510 11,206,175 9,598,753
Unlisted (see note a(ii) below) 619,503 924,357 619,503 924,357 11,235,892 9,628,470 11,231,135 9,623,713
Total available for sale financial assets 11,210,932 9,603,510 11,206,175 9,598,753

RC 7588
www.leadway.comAnnual Report & Accounts 2016102
a (i) Analysis of unlisted available for sale financial assets:
a (ii) At cost
Group 31-Dec-16
Group 31-Dec-15
Company 31-Dec-16
Company 31-Dec-15
Lagos Building Investment Company Ltd 49,920 49,920 49,920 49,920 Energy and Allied Insurance Pool of Nigeria 183,000 114,480 183,000 114,480 Verod Capital Management Ltd 370,579 743,953 370,579 743,953 Others 16,004 16,004 16,004 16,004
Group 31-Dec-16
Group Company 31-Dec-16
At fair value
Company 31-Dec-15
Africa Finance Corporation 1,113,963 775,329 1,113,963 775,329 African Reinsurance Company Limited 1,371,461 835,099 1,371,461 835,099 Capital Bancorp 148,351 227,194 148,351 227,194 Food Concept Limited 6,300 7,700 6,300 7,700 Lekky Budget Limited 49,113 12,094 49,113 12,094 Mainstreet Technologies 380,103 124,137 380,103 124,137 MTN 795,044 886,169 795,044 886,169 Oakwood Park Limited 66,714 70,846 66,714 66,714 West African Milk Company Limited 55,250 44,688 55,250 44,688 JDI investment company Ltd 44,688 87,409 44,688 86,784 Nigeria Liability Insurance Pool 30,473 95,143 30,473 95,143
31-Dec-15
(b) The movement in the allowance for impairment losses on available for sale unquoted equities is as follows
Group 31-Dec-16
Group 31-Dec-15
Company 31-Dec-16
Company 31-Dec-15
Balance, beginning of year 24,960 249,007 24,960 249,007 Charge for the year - - - - Write off - (224,047) - (224,047)
Movement in Financial assets designated at available for sale
Group 31-Dec-16
Group 31-Dec-15
Company 31-Dec-16
Company 31-Dec-15
Opening balance Additions 9,603,510 10,175,445 9,598,753 10,170,690 Disposals 727,635 1,458,308 727,635 1,286,487 Fair value changes (476,724) (338,819) (476,724) (168,036) Impairment 1,356,511 (1,442,418) 1,356,511 (1,441,382) Write-offs - (2 4,960) - (24,960)
8.3 Held to maturity financial asserts
Closing balance - (224,046) - (224,046) 11,210,932 9,603,510 11,206,175 9,598,753
Group 31-Dec-16
Group 31-Dec-15
Company 31-Dec-16
Company 31-Dec-15
Debt securities: - Listed
32,952,921 16,478,385 30,508,078 15,697,784
Current Non – current
Notes to the financial statementsFor the year ended 31 December 2016
Others 4,757 - - - A 4,066,217 3,165,808 4,061,460 3,161,051
B 619,503 924,357 6l9,503 924,357 Less: Specific allowance for impairment (unquoted equity securities) C
(24,960)
(24,960)
(24,960)
(24,960)
Total unlisted equities (A+B+C) 4,660,760 4,065,205 4,656,003 4,060,448
Balance, end of year 24,960 24,960 24,960 24,960
32,952,921 16,478,385 30,508,078 15,697,784 7,235,491 3,145,068 7,235,491 3,145,068
25,717,430 13,333,317 23,272,587 12,552,716 32,952,921 16,478,385 30,508,078 15,697,784

OVERVIEWBUSINESSREVIEW GOVERNANCE
GROUP FINANCIALSTATEMENTS APPENDIX
103www.leadway.comAnnual Report & Accounts 2016
The entity's investment in Dana bonds was impaired by N18.97million (2015: Nil). Held to maturity assets are analyzed below:
Group 31-Dec-16
Group 31-Dec-15
Company 31-Dec-16
Company 31-Dec-15
Federal Government Debt Securities 10.70% FGN May 2018 681,337 657,794 681,337 657,794 7.00% FGN Oct 2019 241,785 225,530 241,785 225,530 10.00% FGN Jul 2030 1,216,670 1,211,488 1,216,670 1,211,488 15.10% FGN Apr 2017 1,693,966 1,478,228 1,693,966 1,478,228 16.00% FGN Jun 2019 120,103 120,101 120.103 120.101 13.05% FGN AUG 2016 - 833,077 - 833,077 15.54% FGN Feb 2020 843,602 327,690 843,602 327,690 l6.39%FGN Jan 2022 - 125,524 - - 14.5% FGN JUL 2021 945,301 - 945,301 - 12.50% FGN JAN 2026 1,326,479 - 1,326,479 - 12.40% FGN MAR 2036 2,781,482 - 2,781,482 - 12.1493% FGN JUL 2034 199,363 - 199,363 - FGN treasury bill 7,010,854 1,084,044 4,566,010 495,436
State Government Bonds Lagos State bonds 480,083 551,280 480,083 551,280 Bayelsa State bonds 30,423 49,344 30,423 49,344 Benue State bonds - 5,002 - 5,002 Delta State bonds 80,150 112,787 80,150 112,787 Ekiti State bonds 9,842 13,822 9,842 13,822 Osun State bonds 152,889 190,769 152389 190,769
Federal Mortgage of Nigeria Bond 5,280 25,228 5,280 25,228 Lafarg'e WAPCO bond 201,669 - 201,669 - Local Contractor Bond Series III 639,155 652,079 639,155 652,079 United Bank for Africa Pic Bond 154,838 154,855 154,838 154,855 Dana Group of Companies Bond 129,382 129,750 129,382 129,750
GTB Finance BV, 7.50%, 2016 - 2,505,478 - 2,439,009 Access Bank Eurobond 7.25%, 2017 52,896 1,130,009 52,896 1,130,009 FBN Finance BV 2020 8.25% 1,111,880 553,317 1,111,880 553,317 First Bank 8% Jul, 2021 2,039,217 1,022,039 2,039,217 1,022,039 FGN 6.75% Eurobond, 2021 2,358,551 1,562,612 2,358,551 1,562,612 ETI 8.75% Aug 2021 1,564,705 1,020,041 1,564,705 1,020,041 Access Bank Eurobond 9.25%, 2021 592,737 419,746 592,737 419,746 FGN 6.38% Eurobond, 2023 4,243,879 204,764 4,243,879 204,764 GTB 6.00% Nov 2018 87,402 53,271 87,402 53,271 Zenith 6.25% Apr 2019 89,778 58,716 89,778 58,716 Access 10.50% Oct 2021 1,762,918 - 1,762,919 -
The debt securities are interest bearing and have stated interest rates of 7 to 16.4 per cent for government bonds and 6.75 to 17.25 per cent for the corporate bonds. The contractual maturity dates are 1 to 20 years for the government securities and 1 to 7 years for the corporate bonds.
Movement in Financial assets designated as Held to Maturity
Opening balance 16,478,385 13,542,479 15,697,784 13,482,180 Additions 17,239,251 3,218,152 15,709,678 3,211,984 Disposals (1,414,821) (996,379) (1,414,821) (996,380) Acquisition of subsidiary - 714,133 - - Accrued interests 2,474,520 406,995 2,339,851 400,826 Interest payment (1,824,414) (406,995) (1,824,414) (400,826) 32,952,921 16,478,385 30,508,078 15,697,784
Corporate Bonds
Notes to the financial statementsFor the year ended 31 December 2016
13,903,963 8,529,993 13,903,964 8,463,524 Grand Total 32,952,921 16,478,385 30,508,078 15,697,784
Forte Oil 104,305 - 104,305 - 1,234,629 961,912 1,234,629 961,912
Eurobonds
753,387 923,004 753,387 923,004
17,060,942 6,063,476 14,616,098 5,349,344

RC 7588
www.leadway.comAnnual Report & Accounts 2016104
9. Reinsurance assets
Prepaid reinsurance (see note (a) below) Reinsurance recoverabelow) Due from reinsurers Less allowance for impairment (see note (c) below):
Group 31-Dec-16
Group 31-Dec-15
Company 31-Dec-16
Company 31-Dec-15
5,181,949 6,280,596 5,181,949 6,280,596 ble (see note (b) 6,200,302 4,653,691 6,200,302 4,653,691
338,532 471,660 338,532 471,660
Reinsurance recoverable Due from reinsurers Current Non – current 11,720,783 11,405,947 11,720,783 11,405,947
- - - - - - - -
11,720,783 11,405,947 11,720,783 11,405,947
11,508,724 11,193,888 11,508,724 11,193,888 212,059 212,059 212,059 212,059
(a) The movement in prepared reinsurance is as follows:
Group 31-Dec-16
Group 31-Dec-15
Company 31-Dec-16
Company 31-Dec-15
Balance, beginning of the year 6,280,596 6,280,596 6,280,596 6,280,596 Additions in the year 11,299,751 11,125,406 11,299,751 11,125,406 Released in the year (see note 29) (12,398,398) (11,125,406) (12,398,398) (11,125,406) Balance, end of year 5,181,949 6,280,596 5,181,949 6,280,596
(b) The movement in reinsurance recoverable is as follows:
Group 31-Dec-16
Group 31-Dec-15
Company 31-Dec-16
Company 31-Dec-15
Balance, beginning of the year 4,653,691 4,653,691 4,653,691 4,653,691 (Decrease)/increase during the year 1,546,611 - 1,546,611 - Balance, end of year 6,200,302 4,653,691 6,200,302 4,653,691
(c ) The movement in allowance for impairment is as follows:
Group 31-Dec-16
Group 31-Dec-15
Company 31-Dec-16
Company 31-Dec-15
Balance, beginning of the year - 1,546,157 - 1,546,157 Write-off during the year - (1,546,157) - (1,546,157) Balance end of year - - - -
10. Deferred acquisition costsDeferred acquisition costs represent commissions on unearned premium relating to the unexpired period of risks and comprise:
Group 31-Dec-16
Group 31-Dec-15
Company 31-Dec-16
Company 31-Dec-15
Motor 120,023 125,968 120,023 125,968 Fire 159,075 134,263 159,075 134,263 General accident 56,325 34,119 56,325 34,119 Marine 96,176 86,227 96,176 86,227 Bond 4,983 6,642 4,983 6,642 Engineering 49,834 35,904 49,834 35,904 486,416 423,123 486,416 423,123
The movement in deferred acquisition costs is as follows: Group
31-Dec-16 Group
31-Dec-15 Company 31-Dec-16
Company 31-Dec-15
Balance, beginning of year 423,123 428,964 423,123 428,964 Cost incurred during the year 1,485,844 1,390,406 1485,844 1,390406 Amortization for the year (1,422,551) (1,396,247) (1422,551) (1,396,247) Balance, end of year 486,416 423,123 486,416 423,123 Current 486,416 423,123 486,416 423,123 486,416 423,123 486,416 423,123
Notes to the financial statementsFor the year ended 31 December 2016
11,720,783 11,405,947 11,720,783 11,405,947

OVERVIEWBUSINESSREVIEW GOVERNANCE
GROUP FINANCIALSTATEMENTS APPENDIX
105www.leadway.comAnnual Report & Accounts 2016
11. Other receivables and prepayments
Group 31-Dec-16
Group 31-Dec-15
Company 31-Dec-16
Company 31-Dec-15
Financial assets: Accrued interest on statutory deposits 38,011 25,073 38,011 25,073 Receivable from third party - 321,091 - 321,091 Accrued rental income 230,342 96,082 230,342 96,082 Trusteeship fee receivable 379,955 367,037 - - Dividend receivables 14,594 75,533 14,281 75,221 Receivable from related parties 90,958 58,289 32,651 35,018
Less: impairment allowance on: Allowance for impairment losses – financial asset
(184,283) (24,710) (180,116) (7,012)
Allowance for impairment losses – non financial asset
(76,697) (228,344) (37,028) (199,604)
Deposit for shares relates to payments made for the acquisition of shares in Motorways Assets Limited which had not been allotted as at 31 December 2016.
The balances of Receivable from related parties relates to transactions from related party that is not a subsidiary of the group, hence the balances have not been eliminated.
Receivable from third party relates to purchase of landed property where ownership had not been transferred as at 31 December 2015. This has now been transferred to investment properties in the current year.
Group 31-Dec-16
Group 31-Dec-15
Company 31-Dec-16
Company 31-Dec-15
Balance, beginning of year 253,054 254,809 206,616 201,607 Charge for the year (see note 38) 23,288 13,877 11,617 11,584 Allowance no longer required (15,362) (15,632) (1,089) (6,575)
Notes to the financial statementsFor the year ended 31 December 2016
(iii) The movement in allowance of impairment of other receivable is as follows
Balance, end of year 260,980 253,054 217,144 206,616
(260,980) (253,054) (217,144) (206,616) Net other receivables 2,137,103 2,281,698 1,115,754 1,114,898 Current 1,709,080 1,853,675 997,634 996,778 Non-current 428,023 428,023 118,120 118,120 2,137,103 2,281,698 1,115,754 1,114,898
- 753,860 943,105 315,285 552,485 Non-financial assets: Prepayment 120,978 266,890 99,407 118,123 Deposit for shares 540,124 22,000 540,124 22,000 Inventory and other consumables - 171,863 - - Sundry Debtors 983,121 1,130,894 378,082 628,906 1,644,223 1,591,647 1,017,613 769,029 Gross other receivables 2,398,083 2,534,752 1,332,898 1,321,514

RC 7588
www.leadway.comAnnual Report & Accounts 2016106
12. Loans and Advances
Group 31-Dec-16
Group 31-Dec-15
Company 31-Dec-16
Company 31-Dec-15
Gross Commercial loans 986,493 1,297,228 1,317,677 1,591,179 Annuity loans 1,899,915 Mortgage loans 61,505 Staff loans 55,304 982,120 51,155 56,122 Agency loans 28,282 30-934 28.282 30,934
Loan to policy holders 252,076 223,192 252,076 223,192 Advance under finance lease 81,603 194,863 -
(i) The movement in allowance for impairment of loans is as follows Group
31-Dec-16 Group
31-Dec-15 Company 31-Dec-16
Company 31-Dec-15
Balance, beginning of year 744,039 487,308 684,348 462,112 Charge for the year (see note 38)
- Commercial loans 126,994 378,631 169,779 344,136 - Staff Loans - - - - - Agency loans - - - - - Policy holders loans Write off (2,305) 3,217 (2,305) 3,217 - Commercial loans - - - - - Staff Loans - - - - - Agency loans - - - - - Policy holders loans -
- -
(ii) The movement in allowance for impairment of advances under finance lease is as follows:
Group 31-Dec-16
Group 31-Dec-15
Company 31-Dec-16
Company 31-Dec-15
Balance, beginning of year 64,441 8,381 - - Addition during the year (see note 39) - Specific impairment - 58,444 - - - Collective impairment - - - - Write back (31,329) (2,384)
Current (Gross) 2,494,823 1,410,882 778,835 778,835 Non Current (Gross) 870,355 1,317,455 870,355 1,122,592
Notes to the financial statementsFor the year ended 31 December 2016
125,117
- 3,365,178 2,728,337 1,649,190 1,901,427 Specific impairment allowance on: - Commercial loans (706.923) (449,443)
(6,230)
- Staff loans (5,481) (5,481) - Agency loans (5,647) (5,647) - Mortgage loan (464) - - - - Policy holders loans (912) (3,217) (912) (3,217) - Advance under finance lease (see note (ii) below
Collective impairment – loans (32,352) (58,211) - - Collective impairment – advance under finance lease
(149,301) (58,211) (147,540) (278,357)
(760) (6,230) - -
Net loans and advances
(692,242) (391,646)
(5,481) (5,481)(5,647) (5,647)
2,463,338 1,919,857 797,368 1,217,079
(901,840) (808,480) (851,822) (684,348)
- - - - Balance, end of year 868,728 744,039 851,822 684,348
33,112 64,441
3,365,178 2,728,337 1,649,190 1,901,427

OVERVIEWBUSINESSREVIEW GOVERNANCE
GROUP FINANCIALSTATEMENTS APPENDIX
107www.leadway.comAnnual Report & Accounts 2016
Cost or valuation
Balance, beginning of year Additions
Revaluation surplus/(deficit)
Write off
Disposals
Balance, end of year
Accumulated depreciation
Balance, beginning of year
Charge for the year Reversal of accumulated depreciationdue to revaluation
Write off
Disposals
Balance, end of year
Net book value beginning of year
Land Building
2,250,870 2,479,0291,260 160,228
(160,577) 135,749
-
- -
2,091,553 2,775,006
- -
- 61,936- (61,936)
- -
- -
- -
2,250,870 2,479,029
OfficeEquipment
ComputerEquipment
Furniture & Fittings
Motor Vehicles
Capital Work in progress
Total
587,148 969,106 963,563 973,493 - 8,223,209 153,216 171,670 11,419 386,377 313,319 1,197,489
- - - (24,828)
- - (263,868) - - (263,868)
(6,238) (14,741) - (108,298) - (129,277)
734,126 1,126,035 711,114 1,251,572 313,319 9,002,725
390,765 780,090 425,139 649,544 - 2,245,538
201,183 208,054 75,585 323,906 - 870,664 - - - - (61,936)
- - - - - -
(5,945) (8,880) - (100,655) - (115,480)
586,003 979,264 500,724 872,795 - 2,938,786
196,383 189,016 538,424 323,949 - 5,977,671
(iii) Movement in loans and advances is as follows:
Group 31-Dec-16
Group 31-Dec-15
Company 31-Dec-16
Company 31-Dec-15
Balance, beginning of year 1,919,857 1,220,651 1,217,079 1,129,468 Additional loans granted 2,644,368 952,326 804,453 434,964 Loan repayment received (2,024,001) - (905,159) - Accrued interests 178,493 154,136 227,365 160,882 Interests received (130,690) (150,525) (378,897) (285,999) Impairment losses (124,689) (256,731) (167,474) (222,236)
13. Property and equipment
13.1 Group – 2016
(i) Fair values of land and buildings On a determined basis, the Group engages the services of external, independent and qualified valuers to determine the fair value of the group's land and buildings. As at 31 December 2016, the fair values of the land and buildings have been determined by Diya Fatimilehin & Co., Estate Surveyor and Valuers (FRC/2013/NIESV/00000002773). The revaluation surplus net of applicable deferred income taxes was credited to other comprehensive income and is shown in "asset revaluation reserve" in shareholders equity (Note 25). See note 13.4b for the analyses of land and buildings carried at fair value and the fair valuation method used.
Diya Fatimilehin & Co., a qualified independent professional estate surveyor was appointed in 2016 to replace the former valuers, Funsho Oladimeji & Co.
Consequent to the revaluation of the Group's land and buildings at 31 December 2016, the accumulated depreciation at that date was eliminated against the gross carrying amount of the properties and the net amount restated to the revalued amount.
(ii) The Group had no capital commitments as at the balance sheet date (31 December 2015: Nil), (iii) No leased assets are included in property and equipment (31 December 2015: Nil) (iv) No borrowing cost was capitalized as borrowing liability does not relate to purchase of property and equipment
For each revalued class of property, plant and equipment, the carrying amount that would have been recognized had the assets been carried under the cost model; and the revaluation surplus, indicating the change for the period and any restrictions on the distribution of the balance to shareholders
Notes to the financial statementsFor the year ended 31 December 2016
--
-
Balance end of year 2,463,338 1,919,857 797,368 1,217,079
Net book value end of year 2,091,553 2,775,006 148,123 146,771 210,390 378,777 313,319 6,063,939

RC 7588
www.leadway.comAnnual Report & Accounts 2016108
If Land and Buildings were stated using the historical cost basis, the carrying value will be as follows:
13.2 Company – 2016
Balance, beginning of year 1,143,000 2,018,000 537,925 893,513 508,314 785,586 - 5,886,338 Additions - 1,237 10,072 82,512 8,384 120,973 - 223,198
Revaluation surplus/(deficit) (242,338) 258,364 - - - - - 16,026
Write off - - - - - -
Disposals - - - (14,406) - (21,650) - (36,056)
Balance, end of year 900,662 2,277,621 547,997 961,619 516,698 884,909 - 6,089,506
Accumulated depreciation
Balance, beginning of year - - 406,290 756,750 406,099 556,760 - 2,125,899
Charge for the year - 52,475 60,963 96,276 60,199 126,916 - 396,829 Reversal of accumulated depreciation due to revaluation
- (52,475) - - - - (52,475)
Disposals - - - (8,639) - (17,443) - (26,082)
Balance, end of year - - 467,253 844,387 466,298 666,233 - 2,444,171
Net book value beginning of year 1,143,000 2,018,000 131,635 136,763 102,215 228,826 - 3,760,439
Land Building equipment Office Computer
equipment Furniturefittings
Motor vehicles Total Capital work
in progressCost or valuation
Group 31-Dec-16
Group 31-Dec-15
Company 31-Dec-16
Company 31-Dec-15
Land: Cost 153,024 153,024 153,024 153,024 Accumulated Depreciation - -
Buildings Cost 164,030 164,030 164,030 164,030 Accumulated Depreciation (38,258) (34,978) (38,258) (34,978) 125,772 129,052 125,772 129,052
Notes to the financial statementsFor the year ended 31 December 2016
- - 153,024 153,024 153,024 153,024
Net book value end of year 900,662 2,277,621 80,744 117,232 50,400 218,676 - 3,645,335

OVERVIEWBUSINESSREVIEW GOVERNANCE
GROUP FINANCIALSTATEMENTS APPENDIX
109www.leadway.comAnnual Report & Accounts 2016
Cost or valuation Land Building Office equipment
Computer equipment
Furniture & fittings
Motor vehicles
Capital work in
progress
Total
Balance, beginning of year 2,216,250 2,453,467 559,994 781,281 517,446 745,618 376,282 7,650,338 Additions 21,870 2,924 56,574 189,429 94,765 316,652 - 682,214
Revaluation surplus/(deficit) 92,750 105,746 - - - - - 198,496
Transfer from (to) investment property (80,000) - - - - - - (80,000)
Transfer from work n progress - - - - 376,282 - (376,282) -
Disposals - - (29,420) (1,604) (24,930) (88,777) - (144,731)
Reveal of accumulated depreciation due to revaluation
- (83,108) - - - - - (83,108)
Balance, end of year 2,250,870 2,479,029 587,148 969,106 963,563 973,493 - 8,223,209
Accumulated depreciation
Balance, beginning of year - - 385,642 670,180 367,712 533,168 - 1,956,702
Charge for the year - 83,108 30,103 110,890 70,116 149,118 - 443,335 Reversal of accumulated depreciation due to revaluation
- (83,108) - - - - - (83,108)
Disposals - - (24,980) (980) (12,689) (32,742) - (71,391)
Balance, end of year - - 390,765 780,090 425,139 649,544 - 2,245,538
Net book value beginning of year 2,216,250 2,453,467 174,352 111,101 149,734 212,450 376,282 5,693,636
13.3 Group – 2015
Cost or valuation Land Building Office equipment
Computer equipment
Furniture & fittings
Motor vehicles
Total
Balance, beginning of year 1,165,000 1,866,564 506,072 779,092 484,070 725,218 5,526,016 Additions - 2,924 51,913 116,025 24,244 129,005 - 324,111
Revaluation surplus 58,000 148,512 - - - - 206,512
Disposals - - (20,060) (1,604) - (68,637) - (90,301)
Reclassification (80,000) - - - - - - (80,000)
Balance, end of year 1,143,000 2,018,000 537,925 893,513 508,314 785,586 - 5,886,338
Accumulated depreciation
Balance, beginning of year - - 360,215 668,556 344,065 525,543 - 1,898,379
Charge for the year - 47,342 62,540 89,174 62,034 97,161 - 358,251 Reversal of accumulated depreciation due to revaluation - (47,342) - - - - - (47,342)
Disposals - - (16,465) (980) - (65,944) - (83,.389)
Balance, end of year - - 406,290 756,750 406,099 556,760 - 2,125,899
Net book value beginning of year 1,165,000 1,866,564 145,857 110,536 140,005 199,674 - 3,627,637
Capital workin progress
13.4 Company – 2015
Notes to the financial statementsFor the year ended 31 December 2016
-
-
Net book value end of year 1,143,000 2,018,000 131,635 136,763 102,215 228,826 - 3,760,439
Net book value end of year 2,250,870 2,479,029 196,383 189,016 538,424 323,949 - 5,977,671

RC 7588
www.leadway.comAnnual Report & Accounts 2016110
There were no transfers between levels 1 and 2 during the year
Valuation techniques used to derive level 2 fair valuesLevel 2 fair values of land and buildings have been derived using the market valuation approach. Sales prices of comparable land and buildings in close proximity are adjusted for differences in key attributes such as property size and age.
Group31 December 2016
Level 1 Level 2 Level 3 Total Property and equipment - Land - - - Building - - Total - -
Group 31 December 2015All amounts are in thousands of Naira unless otherwise stated
Assets Level 1 Level 2 Level 3 Total Property and equipment - Land - 2,250,870 - 2,250,870 - Building - 2,479,029 - 2,479,029 Total - 4,729,899 - 4,729,899
Company31 December 2016All amounts are in thousands of Naira unless otherwise stated
Company31 December 2015All amounts are in thousands of Naira unless otherwise stated
Assets Level 1 Level 2 Level 3 Total Property and equipment - Land - 900,662 - 900,662 - Building - 2,277,621 - 2,277,621 Total - 3,178,283 - 3,178,283
Assets Level 1 Level 2 Level 3 Total Property and equipment - Land - 1,143,000 - 1,143,000 - Building - 2,018,000 - 2,018,000 Total - 3,161,000 - 3,161,000
Notes to the financial statementsFor the year ended 31 December 2016
All amounts are in thousands of Naira unless otherwise stated
(b) Non financial instruments measured at fair valueThe following table sets out fair values of non-financial instruments measured at fair value and analyses them by level in the fair value hierarchy into which each fair value measurement is categorized
2,091,553 2,775,006 4,866,559
2,091,553 2,775,006 4,866,559

OVERVIEWBUSINESSREVIEW GOVERNANCE
GROUP FINANCIALSTATEMENTS APPENDIX
111www.leadway.comAnnual Report & Accounts 2016
14. Investment Properties
Group 31-Dec-16
Group 31-Dec-15
Company 31-Dec-16
Company 31-Dec-15
Office property 5,288,347 5,732,000 5,380,682 4,990,000 Residential property 3,531,723 3,805,000 2,778,737 3,805,000 8,820,070 9,537,000 8,159,419 8,795,000 Non current 8,820,070 9,537,000 8,159,419 ' 8,795,000 8,820,070 9,537,000 8,159,419 8,795,000
(a) The movement in investment properties during the year is shown below:
Group 31-Dec-16
Group 31-Dec-15
Company 31-Dec-16
Company 31-Dec-15
Balance, beginning of the year 9,537,000 7,800,000 8,795,000 7,450,000 Improvement to investment properties - 350,410 - 356,410 Reclassification from other assets (see ‘I’ below 321,324 - 321,324 - Reclassification to investment property - 80,000 - 80,000 Additional cost incurred during the year 9,156 307,574 6,176 108,159 Fair value gain/(loss) (1,047,410) 903,010 (963,081) 800,431 As at end of the year 8,820,070 9,537,000 8,159,419 8,795,000
The analysis of investment properties is as follow:
Group 31-Dec-16
Group 31-Dec-15
Company 31-Dec-16
Company 31-Dec-15
Cadastral Property, Abuja 2.757,185 2,200,000 2,757,185 2,200,000 Thomas Wyatt House 1,405,080 1,300,000 1,405,080 1,300,000 Ozumba Mbadiwe Property 1,144,343 1,490,000 1,144,343 1,490,000 George Street Property 849,839 1,350,000 849,839 1,350,000 Siun Property, Abeokuta 74,074 - 74,074 - Bedwell, Ikoyi 1,729,148 2,100,000 1,729,148 2,100,000 Enugu Landed Property 44,741 85,000 44,741 85,000 Abeokuta Property 155,009 270,000 155,009 270,000 Others 660,650 742,000
(i) The reclassification relates to a landed property situated at Siun, Sagamu-Abeokuta road. In 2015, the deposit for the property was recognized in other assets at cost. However, in 2016, the company obtained the necessary allocation papers from the relevant authorities and consequently reclassified to Investment property at its cost and then its fair value was determined. The fair value of the property was determined by Diya Fatimilehin & Co., Estate Surveyors and Valuers (FRC/2013/NIESV/00000002773).
(b) The Group's investment properties are held for the purpose of capital appreciation and rental income generation. The Group's investment properties were revalued by Diya Fatimilehin& Co, Estate Surveyors and Valuers (FRC/2013/NIESV/00000002773) using the Comparative approach method of valuation to arrive at the open 'market value as at 31 December 2016. Fair value gains have been recognized in the income statement in line with the fair value model of IAS 40. Rental income on investment property included in the statement of comprehensive income for the year is N261 million (2015: N176 million).
Diya Fatimilehin & Co, a qualified independent professional estate surveyor was appointed in 2016 to replace the former valuers, Funsho Oladimeji &Co.
(c) Non-financial instruments measured at fair value The following table sets out fair values of non-financial instruments measured at fair value and analyses them by level in the fair value hierarchy into which each fair value measurement is categorized.
Group31 December 2016All amounts are in thousands of Naira unless otherwise stated
Assets Level 1 Level 2 Level 3 Total Investment properties - Office property - 5,288,347 - 5,288,347 - Residential property - 3,531,723 Total - 8,820,070 8,820,070
3,531,723
Notes to the financial statementsFor the year ended 31 December 2016
--
- - 8,820,070 9,537,000 8,159,419 8,795,000

RC 7588
www.leadway.comAnnual Report & Accounts 2016112
Company31 December 2015
All amounts are in thousands of Naira unless otherwise stated
Assets Level 1 Level 2 Level 3 Total Investment properties - Office property - 5,372,000 5,732,000 - Residential property - 3,805,000 - 3,805,000 Total - 9,537,000 - 9,537,000
Company31 December 2016
All amounts are in thousands of Naira unless otherwise stated
Assets Level 1 Level 2 Level 3 Total Investment properties - Office property - 5,380,682 - 5,380,682 - Residential property - 2,778,737 - 2,778,737 Total - 8,159,419 -
There were no transfers between levels 1 and 2 during the year
Valuation techniques used to derive level 2 fair values
Level 2 fair values of land and buildings have been derived using the market valuation approach. Sales prices of comparable land and buildings in close proximity are adjusted for differences in key attributes such as property size and age.
15. Investment in subsidiaries
(a) The Company's investment is subsidiaries is as stated below:
Company31 December 2015
All amounts are in thousands of Naira unless otherwise stated
Assets Level 1 Level 2 Level 3 Total Investment properties - Office property - 4,990,000 - 4,990,000 - Residential property - 3,805,000 - 3,805,000 Total 8,795,000 - 8,795,000
(b) Nature of investments in subsidiaries 2016 and 2015 Name of entity Nature of
business Country of incorporation
Proportion of ordinary shares directly held by parent/group
Proportion of ordinary shares held by non -controlling interest (%)
Leadway Capital And Trusts Limited Note i Nigeria 53 47 Leadway Hotel Limited Note ii Nigeria 51.2 48.8 Leadway Properties and Investments Limited Note iii Nigeria 100 - Leadway Pensure PFA Limited Note iv Nigeria 69.5 30.5
Company 31-Dec-16
Company 31-Dec 15
47,696 47,696 Leadway Hotels Limited 636,278 293,250 Leadway Properties and Investments Limited 200,312 200,312 Leadway Pensure PFA Limited 2,753,209 2,753,209 3,637,495 3,294,467
Leadway Capital and Trusts Limited
Notes to the financial statementsFor the year ended 31 December 2016
8,159,419

OVERVIEWBUSINESSREVIEW GOVERNANCE
GROUP FINANCIALSTATEMENTS APPENDIX
113www.leadway.comAnnual Report & Accounts 2016
All subsidiaries undertakings are included in the consolidation. The proportion of the voting rights in the subsidiaries undertakings held directly by the parent company do not differ from the proportion of ordinary shares held. The parent company further does not have any shareholdings in the preference shares of subsidiaries undertakings included in the Group.
The company did not provide financial support to any of its subsidiaries during the year. In addition, the directors are not aware of any significant restriction that may prevent the transfer of capital within the group.
(I) Leadway Capital and Trusts Limited was incorporated in 1995 as Leadway Trustees Limited but its services became commercial in 1999. The Company has been registered with the Securities and Exchange Commission since 2000. The Company provides Fund Management and Portfolio management services to retirement benefits funds, employee benefit schemes and other special funds.
(ii) Leadway Hotel Limited provides hotel and hospitality services. During the year, Leadway exercised its option on the rights issue made by hotel. This additional acquisition of shares resulted in a 0.2% increase in Leadway's interest in the investee company from 51% to 51.2%. The increase is attributable to the rights that were not taken up by a minority equity holder.
(iii) Leadway Properties and Investments Limited is involved in property management, outsourcing services, software application provision, hotel development, real estate acquisition
(iv) Leadway Pensure PFA Limited was incorporated as Pensure PFA Limited (a limited liability company) on 25 August 2004. It was granted an operating license by PENCOM on 7 December, 2005 and commenced operations in the same month. The Company's name was changed to Leadway Pensure PFA Limited in August 2006 following a corporate re-branding exercise. The principal activity is to carry out the business of pension fund management and administration in line with the Pension Reform Act, 2004. It is the licensed Pension Fund Administrator of Leadway Pensure RSA, Retiree and other Managed Funds following the enactment of the Pension Reform Act, 2004.
The table below summarizes the financial information of all to the Group's subsidiaries before any intra-group elimination. Note 5 on segment reporting shows the summarized financial information of all the subsidiaries.
31 December 31 December 31 December 31 December 2016 2015 2016 2015 2016 2015 2016 2015 Assets Cash and cash equivalent 330,651 307,764 907,719 1,760,407 325,140 143,71S 265,487 312,210 Other receivables and prepayments 190,390 161,243 863,076 829,588 103,706 152,220 2,317,943 1,418,683 Investment securities 6,545 6,991 2,444,842 714,133 - 66,471 181,804 186,273 Deferred tax asset 4 - - - - - - - Property and equipment 38 107 198,435 179,228 2,214,899 2,030,744 5,235 7,152 Intangible assets - - 50,192 74,562 2,545 5,632 11,774 7,741 Investment property - - 660,651 742,000 - - - - Total Assets 527,628 476,105 5,124,915 4,299,918 2,646,290 2,398,785 2,782,243 1,932,057 Liabilities Other liabilities 32,344 23,974 476,942 390,060 408,247 492,091 1,096,639 582,481 Borrowings 222,336 220,000 - - 95,472 326,070 746,592 605,555 Current tax liability 23,944 23,526 542,577 418,366 12,752 8,063 55,602 28,884 Deferred tax liability - 7,267 21,176 75,038 134,683 1,111 1,321 Total liabilities 278,624 274,767 1,040,695 850,574 591,509 960,907 1,899,944 1,218,241 Capital and reserves Share capital 2,025 2,025 1,642,361 1,642,361 75,000 75,000 440,000 440,000 Retained earnings 262,535 214,424 1,813,931 1,309,405 363,929 340,079 442,299 273,818 Share premium - - 53,465 53,465 500,000 500,000 - - Deposit for shares - - 641,192 - - - Other reserves (15,557) (15,111) 574,463 444,113 474,660 522,798 - - Total equity 249,003 201,338 4,084,220 3,449,344 2,054,781 1,437,877 882,299 713,818
Total Liabilities and Equity 527,628 476,105 5,124,915 4,299,918 2,646,290 2,398,784 2,782,243 1,932,059
Leadway Properties Leadway Pensure PFA Leadway Hotel Limited Leadway Capital & Trust Limited
Notes to the financial statementsFor the year ended 31 December 2016
42,148

RC 7588
www.leadway.comAnnual Report & Accounts 2016114
16. Deferred taxation Deferred income tax assets and liabilities are offset when there is a legally enforceable right to offset current tax assets against current tax liabilities and when the deferred income taxes assets and liabilities relate to income taxes levied by the same taxation authority on either the taxable entity or different taxable entities where there is an intention to settle the balances on a net basis.
The movement on deferred tax assets account during the year was as follows:
Group 31-Dec-16
Group 31-Dec-15
Company 31-Dec-16
Company 31-Dec-15
Balance, beginning of year 114,129 200,235 114,129 200,235 Transfer from deferred tax liability - - - - Credit to income statement 172,317 (86,106) 172,317 (86,106) Charge to asset revaluation reserve - - - - Charge to fair value reserve - - - - Tax effect of fair value changes - investment property - - - -
The movement in deferred tax liabilities account during the year was as follows:
Group 31-Dec-15
Company 31-Dec-16
Company 31-Dec-15
Balance, Beginning of year 741,772 1,153,404 556,356 945,541 Charge to asset revaluation reserve (13,798) - - (Charge) / credit to income statement 84,225 (397,834) 172,317 (389,185) Charge to fair value reserve - - - - Transfer to deferred tax asset - - - -
Net deferred tax liability is attributed to the following: Group
31-Dec-15 Company 31-Dec-16
Company 31-Dec-15
Assets Investment securities - (120,195) - 80,040 Unrecouped tax losses 2,147,065 - 2,147,065 -
Liabilities Property and equipment 268,347 281,401 171,025 296,220 Investment properties - 47,189 - 47,189 Unrealised exchange gain 2,418,265 178,856 2,418,265 178,856
Deferred income tax assets are recognized for tax loss carry-forwards to the extent that the realization of the related tax benefit through future taxable profits is probable. The Group did not recognize deferred income tax assets of N12.8billion (2015: N11.6billion ) in respect of unrecouped losses amounting to N44.5billion (2015: N38.8billion) that can be carried forward against future taxable income indefinitely. The unrecognized deferred tax and unrecouped losses are from the life business results.
(12 months)
(12 months)
(7 months)
(12 months)
(12 months)
(12 months)
(12 months) Revenue 43,137 31,262 3,589,355 2,129,529 729,662 723,805 531,649 305,798 Profit before income tax 61,639 60,530 1,512,181 889,823 (52,156) (108,764) 240,428 85,027 Income tax expense/income (13,528) (20,383) (471,618) (252,619) 46,862 31,115 (54,115) (26,559) Profit after tax 48,111 40,147 1,040,563 637,204 (5,294) (77,649) 186,313 58,469 Other comprehensive income (446) (1,036) (380) (52,768) 208,256 - - Total comprehensive income 47,665 39,111 1,040,563 636,824 (58,062) 130,667 186,313 58,468 Profit allocated to NCI Cashflows from operating activities (21,400) (228,166) 1,089,043 1,052,443 25,635 135,058 (853,292) (798,078) Cashflows from investing activities 42,776 409,184 (1,532,115) (1,088,020) (224,419) (58,294) 364,345 151,517 Cashflows from financing activities - - (408,291) - 386,277 (46,413) 442,223 430,096
Net increase/decrease) in cashand cash equivalent 21,376 181,018 (851,363) (35,577) 187,493 30,351 (46,724) (146,465)
Dividends received from subsidiaries
-
-
283,868
119,513
-
-
20,986
-
Leadway Pensure PFA became a subsidiary of Leadway Assurance Company Limited in May 2015 through a step acquisition on that date. Consequently, an extract of the 7 month financial information for 2015 have been disclosed.
Leadway Properties Leadway Pensure PFA Leadway Hotel Limited Leadway Capital & Trust Limited
Notes to the financial statementsFor the year ended 31 December 2016
Group 31-Dec-16
Group 31-Dec-16
2016 20152016 20152016 20152016 2015
-
31 December 31 December 31 December 31 December
Deferred tax assets 2,147,065 (120,195) 2,147,065 80,040
825,997
741,772
728,673
556,356
Deferred tax liabilities 2,686,612 507,446 2,589,290 522,265 Net (539,547) (627,641) (442,225) (442,225)
286,446 114,129 286,446 114,129

OVERVIEWBUSINESSREVIEW GOVERNANCE
GROUP FINANCIALSTATEMENTS APPENDIX
115www.leadway.comAnnual Report & Accounts 2016
Property and equipment 281,401 (84,225) - 197,176 Investment securities 120,195 - - 120,195 Investment properties 47,189 - - 47,189 Unrealized exchange gain 178,856 - (3,869) 174,987 Employee benefit obligation - - - - Unrecouped tax losses - - - - 627,641 (84,225) (3,869) 539,547
Group
Balance at l January
Recognized inprofit or loss
Recognized inOthercomprehensiveincome
Balance at31 December
16.1 Movements in temporary differences during the year ended 31 December 2016
296,220 (125,195) - (80,040) 80,040 - 47,189 (47,189) -
178,856 2,239,409 - - - - - (2,147,065) -
442,225 - -
Company
Recognized inOthercomprehensiveincome
Balance at l January
Recognized inprofit or loss
Balance at31 December
171,025
2,418,265
(2,147,065)442,225
--
-
Property and equipment 312,078 (12,394) (18,283) 281,401 Investment securities 120,195 - 120,195 Investment properties 276,572 (229,383) - 47,189 Unrealized exchange gain 472,383 (293,527) - 178,856 Employee benefit obligation (103,378) 103,378 - -
957,655 (311,731) (18,283) 627,641
Group
Recognized inOthercomprehensiveincome
Balance at l January
Recognized inprofit or loss
Balance at31 December
Movements in temporary differences during the year ended 31 December 2015.
299,964 (3,744) - 296,220, (200,235) 120,195 - (80,040) 276,572 (229,383) - 47,189 472,383 (293,527) - 178,856
(103,378) 103,378 - -
745,306 (303,081) - 442,225
Company
Recognized inOthercomprehensiveincome
Balance at l January
Recognized inprofit or loss
Balance at31 December
17. Intangible assets In thousands of Naira
Group Company Goodwill Software Total Software 31 December 2016 Cost Balance, beginning of year additions 3,521,668 696,968 4,218,636 557,118 Balance, end of year - 372,866 372,866 366,213 3,521,668 1,069,834 4,591,502 923,331 Accumulated amortization Balance beginning of year amortization
- 577,726 577,726 525,810
Balance. End of year 113,882 113,882 83,717 - 691,608 691,608 609,527 Carrying amount as at end of year 3,521,668 378,226 3,899,894 313,804 As at beginning of year 3,521,668 119,242 3,640,910 31,308 31 December 2015 Cost Balance, beginning of year 3,521,668 587,004 587,004 557,118 Additions - 109,964 3,631,632 - Balance, end of year 3,521,668 696,968 4,218,636 557,118 Accumulated amortization Balance, beginning of year - 441,106 441,106 426,833 Amortization - 136,620 136,620 98,977 Balance, end of year - 577,726 577,726 525,810 Carrying amount As at end of year 3,521,668 119,242 3,640,910 31,308 As at beginning of year - 145,898 145,898 130,285
Impairment test of goodwillGoodwill is reviewed annually for impairment, or more frequently when there are indications that impairment may have occurred. Impairment assessment has been performed for the period, and no losses on goodwill were recognized during the period under review as the recoverable amount of Goodwill as at 31 December 2016 was greater than its carrying amount and is thus not impaired.
Notes to the financial statementsFor the year ended 31 December 2016

RC 7588
www.leadway.comAnnual Report & Accounts 2016116
The recoverable amount of N10.759bn was determined using a value-in-use computation.
Goodwill is monitored by the Group on an entity by entity basis
The key assumption used in computing the value-in-use for goodwill in 2016 are as follows:
Group 31-Dec-16
Annual growth rateLong term growth rate (Terminal growth rate)Discount rate
15.0%3.3%
19.9%
18.0% 1.5% 16.8%
Group 31-Dec-15
Cash Flow ForecastCash flows were projected based on past experience of operating results. These cashflows are based on the expected revenue growth for the entity over a 5 year period.
Discount RatePre-tax discount rate of 15.70% was applied in determining the recoverable amounts for the entity with goodwill (Leadway Pensure PFA). This discount rate was estimated using the risk-free rate using the yield on FGN long term bond, equity risk premium and appropriate Beta.
Long-term growth rateThe key assumptions described above may change as economic and market conditions change. The Group estimates that reasonably possible changes in these assumptions are not expected to cause the recoverable amount of the subsidiaries (from which the goodwill arose) to decline below their carrying amount.Sensitivity analysis of key assumptions used
Group 31- Dec -16
Group
5% increase 5% decrease 5% increase 5% decrease Impact of change in discount rate on value-in-use computation
(519,200) 517,755 (534,512) 634,342
Impact of change in growth rate on value-in-use computation
64,675 (63,409) 29,360 (29,073)
In millions of Nigerian Naira Recoverable amount 10,759 24,234 Less: Carrying amount Goodwill (3,522) (3,522) Net assets (4,082) (6,236) Total carrying amount (7,604) Excess of recoverable amount over carrying amount 3,155 14,476
18. Statutory depositsThis represents the Company's deposit with the Central Bank of Nigeria as at 31 December 2016, in compliance with the Insurance Act, CAP 117 LFN 2004. This amount is not available for the day-to day use in the working capital of the Company and is therefore excluded from cash and cash equivalents. Analysis of statutory deposits is as shown below:
Group 31-Dec-16
Group 31-Dec-15
Company 31-Dec-16
Company 31-Dec-15
life business 300,000 300,000 300,000 300,000 Life Business 200,000 200,000 200,000 200,000
Current 500,000 500,000 500,000 500,000
Income on statutory deposit is recognized in investment income.
Non-
Non-
19. Trade payables
Group 31-Dec-16
Group 31-Dec-15
Company 31-Dec-16
Company 31-Dec-15
Reinsurance payable 332,949 333,516 332,949 333,516 Insurance payable 1,160,488 1,037,748 1,160,488 1,037,748 Deposit for claims 1,261,202 1,342,843 1,261,202 1,342,843 Current 2,754,639 2,714,107 2,754,639 2,714,107 Non-current - - - 2,754,639 2,714,107 2,754,639 2,714,107
Deposit for claims payments relates to claim amounts received from other insurance companies for payments to the insured.
Notes to the financial statementsFor the year ended 31 December 2016
31-Dec-16 31-Dec-15
(9,758)
500,000 500,000 500,000 500,000
500,000 500,000 500,000 500,000
31-Dec-15
2,754,639 2,714,107 2,754,639 2,714,107

OVERVIEWBUSINESSREVIEW GOVERNANCE
GROUP FINANCIALSTATEMENTS APPENDIX
117www.leadway.comAnnual Report & Accounts 2016
20. Current income tax liabilitiesThe movement on current income tax liabilities during the year was as follows:
Company 31-Dec-15
Balance, beginning of year 672,859 Change for the year (see note (a) below) 417,349 Acquisition of subsidiary - Payments during the year (438,210) Balance, end of year 651,998 (a) Analysis of charge for the year is as follows: Company
31-Dec-15 - Current year’s income tax provision 408,091 - Withholding tax on dividend income 9,258 - Tax paid arising from back every assessment
-
417,349 21. Other liabilities
Company 31-Dec-15
Financial liabilities: Commission payable 32,532 Sundry creditors 885,272 Due to employees 290,146 Accruals 45,114 Staff profit sharing payable 367,093 Insurance supervisory fee payable 550,348 Managed funds - Non-financial liabilities: Deferred rental income 67,573 Premium deposits Unearned income
590,592
Withholding tax payable 221,134 Other payables (see note (i) below) 670,609
Current 3,225,027 Non-Current 670,609
(i) Other payables Company
31-Dec-15 Deferred payment for equity - Premium suspense 180,597 Payment-out cheques - PAYE and other deductions 23,947 Stale cheques 436,082 Other creditors
22. Borrowings
Company 31-Dec-15
Terms loans - Other borrowings - Current -
Group 31-Dec-16
Group 31-Dec-15
Company 31-Dec-16
1,122,772 746,198 651,998 945,663 495,621 699,492
- 453,523 - (533,416) (572,570) (451,347)
1,535,019 1,122,772 900,143
Group 31-Dec-16
Group 31-Dec-15
Company 31-Dec-16
881,916 486,363 635,745 63,747 9,258 63,747
- - -
945,663 495,621 699,492
Group 31-Dec-16
Group 31-Dec-15
Company 31-Dec-16
697 32,532 697
670,766 885,272 670,766 266,982 290,146 266,982 605,615 409,645 226,448 802,767 367,093 721,438 486,394 550,348 486,394 939,059 438,242 -
55,315 67,573 55,315
3,727,194 590,592 3,727,194 184,342 175,223 184,342 134,818 221,134 134,818
1,090,256 1,327,478 622,996
6,934,890 3,563,870 6,474,394 2,029,315 1,791,408 622,996
Group 31-Dec-16
Group 31-Dec-15
Company 31-Dec-16
200,000 - 200,000 219,622 180,597 219,622
63,760 - 63,760 13,413 23,947 13,413 34,339 436,082 34,339
Group 31-Dec-16
Group 31-Dec-15
Company 31-Dec-16
204,623 118,446 - - - -
204,623 118,446 - - -
Notes to the financial statementsFor the year ended 31 December 2016
175,223
2,170,505 3,772,280 2,973,278 2,372,725
1,725,131
5,191,925 2,382,000 4,724,665 Total other liabilities 3,895,636
8,964,205 5,355,278 7,097,390
3,895,636
8,964,205 5,355,278 7,097,390
29,983 670,609
559,122 686,852 91,862 1,090,256 1,327,478 622,996
204,623 118,446 - - Non – current 204,623 118,446 - -

RC 7588
www.leadway.comAnnual Report & Accounts 2016118
(a) The term loan of N204m represents a loan obtained from a corporate investor which is not a member of the group. Movement in term loan during the year is as follows:
Balance, beginning of year 118,446 60,000 - - Additions 204,623 55,290 - - Interest capitalized - 3,156 - - Payment made during the year (118.446) - - -
23. Insurance contract liabilities
Group 31-Dec-16
Group 31-Dec-15
Company 31-Dec-16
Company 31-Dec-15
Gross Claims reported and loss adjustment payable (see note 23.1 below)
20,497,935 13,941,071 20,497,935 13,941,071
Claims incurred but not reported - IBNR (see note 23.1 below)
4,306,948 3,408,785 4,306,948 3,408,785
Unearned premium (see note 23.2 below)
9,079,644 10,034,530 9,079,644 10,034,530
Life fund (see note 23.3 below) 70,873,119 66,401,149 70,873,119 66,401,149 104,757,646 93,785,535 104,757,646 93,785,535 Reinsurance receivables Prepared reinsurance (see note 9a) 5,181,949 6,280,596 5,181,949 6,280,596 Claims reported & loss adjustment payable and IBNR (see note 9b)
6,200,302 4,653,691 6,200,302 4,653,691
Total reinsurers’ share of insurance liabilities
11,382,251 10,934,287 11,382,251 10,934,287
Net insurance contract liability 93,375,395 82,851,248 93,375,395 82,851,248 Current (Gross) 15,631,891 13,417,573 15,631,891 13,417,573 Non-current (Gross) 89,125,755 80,367,962 89,125,755 80,367,962 104,757,646 93,785,535 104,757,646 93,785,535
Outstanding claims represents the estimated cost of settling all claims arising from incidents occurring as at the reporting date. The liability adequacy test for outstanding claims liability as at 31 December 2016 and the comparative periods were done by HR Nigeria Limited (FRC/NAS/OOOOOOOO738).
23.1 Claims reported and loss adjustment payable
Claims incurred but not reported
Non-life (see note 23-ld) 18,494,855 2,003,080
12,448,179 1,492,892
18,494,855 2,003,080
12,448,179 1,492,892
Non – life 3,518,525 2,612,884 3,518,525 2,612,884 Life 788,423 795,901 788,423 795,901
(a) The aging analysis of claims reported and loss adjusted for non-life insurance contracts
Days 0-90 1,058,556 509,654 1,058,556 509,654 91-180 1,226,483 1,095,127 1,226,483 1,095,127 181-270 3,446,071 1,209,282 3,446,071 1,209,282 271-365 3,463,239 1,471,114 3,463,239 1,471,114 366 and above 9,300,506 8,163,002 9,300,506 8,163,002
Notes to the financial statementsFor the year ended 31 December 2016
Group 31-Dec-16
Group 31-Dec-15
Company 31-Dec-16
Company 31-Dec-15
204,623 118,446 - -
Group 31-Dec-16
Group 31-Dec-15
Company 31-Dec-16
Company 31-Dec-15
Life (see note 23-ld) 20,497,935 13,941,071 20,497,935 13,941,071
Group 31-Dec-16
Group 31-Dec-15
Company 31-Dec-16
Company 31-Dec-15
4,306,948 3,408,785 4,306,948 3,408,785
Group 31-Dec-16
Group 31-Dec-15
Company 31-Dec-16
Company 31-Dec-15
18,494,855 12,448,179 18,494,855 12,448,179
104,757,646 93,785,535 104,757,646 93,785,535
Total reinsurance share of Insurance liabilities 11,382,251 10,934,287 11,302,251 10,934,287
104,757,646 93,785,535 104,757,646 93,785,535

OVERVIEWBUSINESSREVIEW GOVERNANCE
GROUP FINANCIALSTATEMENTS APPENDIX
119www.leadway.comAnnual Report & Accounts 2016
(b) The aging analysis of claims reported for life insurance contracts
Group 31-Dec-16
Group 31-Dec-15
Company 31-Dec-16
Company 31-Dec-15
Days 0-90 514,930 318,364 514,930 318,364 91-180 102,937 75,283 102,937 75,283 181-270 203,270 175,333 203,270 175,333 271-365 200,961 81,247 200,961 81,247 366 and above 1,042,949 842,665 1,042,949 842,665
2,065,047 1,492,892 2,065,047 1,492,892
Included in “claims reported and loss adjustment payable" for the year is N115.5 million representing insurance claims which are subject of ongoing litigations. The provision charged is recognized in “claims and loss adjustment expense”. In the Directors' opinion, after taking appropriate legal advice, the outcome of these legal claims will not give rise to any significant loss beyond the amounts provided as at 31 December 2016.
© Movement in outstanding claims provision inclusive of IBNR
Group 31-Dec-16
Group 31-Dec-15
Company 31-Dec-16
Company 31-Dec-15
Balance, beginning of year 17,349,856 15,690,086 17,349,856 15,690,086 Less: movement - Claims incurred during the year 26,633,857 16,355,595 26,634,150 16,355,948
(19,178,830) (14,695,825) (19,179,123) (14,696,178)
(d) Group and Company analysis of claims reported and IBNR by class:
Claims reported 31-Dec-16 IBNR
Total
Non-life: Motor 483,596 492,218 975,814 Fire 1,878,405 179,128 2,057,533 General accident 458,953 503,185 962,138 Marine 1,216,016 205,816 1,421,832
Life: Group life 1,859,377 788,423 2,647,800 Individual life
Group and Company
Claims reported 31-Dec-16 IBNR
Total
Non – life Motor 451,738 334,385 786,123 Fire 1,182,207 166,552 1,348,759 General accident 661,826 159,376 821,202 Marine 921,428 96,861 1,018,289 Bond 367,577 118,970 486,547
7,455,027 1,659,770 7,455,027 1,659,770
24,804,883 17,349,856 24,804,883 17,349,856
- Claims paid during the year (see note 30)Net movement in the year Balance, end of year
Bond 357,937 63,642 421,579 512,516 (47,955) 464,561
13,587,432 2,122,491 15,709,923 18,494,855 3,518,525 22,013,380
Engineering Special risk
143,703 - 143,703
2,003,080 788,423 2,791,503 Total claims 20,497,935 4,306,948 24,804,883
Engineering 372,785 105,837 478,622 Special risk 8,490,618 1,630,903 10,121,521 12,448,179 2,612,884 15,061,063
Group life 1,492,892 795,901 2,288,793 Individual life
1,492,892 795,901 2,288,793
Life:
Total claims 13,941,071 3,408,785 17,349,856
Notes to the financial statementsFor the year ended 31 December 2016
- - -

RC 7588
www.leadway.comAnnual Report & Accounts 2016120
Non – life Motor 978,301 978,301 Fire 742,585 742,585 General accident 206,011 206,011 Marine 488,005 488,005 Bond 184,823 184,823 Engineering 197,969 197,969 Special risk 6,171,461 6,171,461 Life: Group life 1,065,375 1,065,375 10,034,530 10,034,530
23.2 Unearned premium
Group and Company analysis of unearned premium by class:
Movement in unearned premium is as follows:
Individual life Annuity (I) The movement on the life insurance liability during the year was as follows:
Individual life
Total
Balance, beginning of year 2,853,914 63,547,235 66,401,149 Movement during the year 42,413 4,429,557 4,471,970 Balance, end of year 2,896,327 67,976,792 70,873,119
Group and Company 2015
Individual life Annuity Total Balance, beginning of year 2,282,952 29,592,801 31,875,753 Movement during the year 570,962 33,954,484 34,525,396 Balance, end of year 2,853,914 63,547,235 66,401,149
(ii) The movement in annuity fund during the year was as follows:
Balance, beginning of year Premium received during the year Payments during the year Changes in actuarial valuation
1,040,174
949,928 313,466 451,673
26,652 335,568
5,441,339
520,844 9,079,644
1,040,174
949,928 313,466 451,673
26,652 335,568
5,441,339
520,844 9,079,644
2,896,327 2,853,914 2,896,327 2,853,914 67,976,792 63,547,235 67,976,792 63,547,235
70,873,119 66,401,149 70,873,119 66,401,149
Group 31-Dec-16
Group 31-Dec-15
Company 31-Dec-16
Company 31-Dec-15
63,547,235 29,592,801 63,547,235 29,592,801 28,119,043 26,767,776 28,119,043 26,767,776
(10,226,168) (6,416,504) (10,226,168) (6,416,504) (13,463,318) 13,603,162 (13,463,318) 13,603,162
Notes to the financial statementsFor the year ended 31 December 2016
Group 31-Dec-15
Company 31-Dec-15
Group 31-Dec-16
Company 31-Dec-16
Balance, beginning of the year Increase during the year Balance, end of year
23.3 Analysis of life fund is as follows:
10,034,530 14,458,184 10,034,530 14,458,184 (954,886) (4,423,654) (954,886) (4,423,654)
9,079,644 10,034,530 9,079,644 10,034,530
Group 31-Dec-16
Group 31-Dec-15
Company 31-Dec-16
Company 31-Dec-15
Group 31-Dec-16
Group 31-Dec-15
Company 31-Dec-16
Company 31-Dec-15
Group and Company 2016 Annuity
Balance as at 31 Dec 2016
67,976,792 63,547,235 67,976,792 63,547,235

OVERVIEWBUSINESSREVIEW GOVERNANCE
GROUP FINANCIALSTATEMENTS APPENDIX
121www.leadway.comAnnual Report & Accounts 2016
23.4 Claims development tablesThe claims development table provides a measure of the Group's ability to estimate the ultimate value of claims. The top half of each table below illustrates how the Group’s estimate of total claims outstanding for each year has changed at successive year-ends. The bottom half of the table reconciles the cumulative claims to the amount appearing in the consolidated statement of financial position.
MOTOR Table of claims paid excluding large claims (Attritional Table)
MOTOR Table of inflated adjusted claims paid excluding large claims (attritional Table)
MOTOR Combined results table (Attritional and Large Losses)
Accident Year Paid to date Latest Paid Large Loss
Total Ultimate Gross claims reserve
Gross Earned Premium
Ultimate Loss ratio
2007 16% 2008 93% 2009 78% 2010 60% 2011 54% 2012 55% 2013 72% 2014 59% 2015 73% 2016
565,449 3,104,122 2,612,468 2,357,142 2,124,737 2,126,894 2,138,446 1,799,515 1,831,806 1,297,137
- 102,653 71,251 60,074 35,858 40,776
142,092 129,352 174,491
91,412
565,449 3,206,799 2,683,718 2,417,889 2,165,353 2,195,612 2,335,762 2,060,192 2,150,003 1,946,009
- 24
- 673
4,758 27,942 55,224
131,325 143,706 557,460
3,459,782 3,459,782 3,459,782 4,005,126 4,005,126 3,961,399 3,248,131 3,465,694 2,954,417 2,819,910
69%
Total 19,957,716 847,959 21,726,786 921,112 34,839,149
Accident Year 1 2 3 4 5 6 7 8 9 10 2007 201,283 28,568 6,997 3,493 3,640 - - - - 2008 853,038 421,486 72,016 18,286 5,934 4,180 - - 704 - 2009 744,027 497,530 55,340 11,042 1,626 2,709 - 1,497 - - 2010 758,364 471,609 65,663 13,725 6,279 635 4,042 - - - 2011 839,901 406,306 39,577 3,506 13,070 3,193 - - - - 2012 894,025 505,792 24,724 13,153 10,034 - - - - - 2013 907,835 612,597 23,085 38,907 - - - - - - 2014 963,872 390,059 85,746 - - - - - - - 2015 1,203,606 405,774 - - - - - - - - 2016 1,297,137 - - - - - - - - -
Accident Year 1 2 3 4 5 6 7 8 9 10 2007 - 201,283 540,849 553,978 559,920 565,449 565,449 565,449 565,449 565,449 2008 2,038,146 2,922,296 3,057,421 3,088,527 3,103,418 3,103,418 3,103,418 - 2009 1,560,744 2,494,257 2,588,396 2,605,166 2,610,970 2,610,970 2,612,468 - - 2010 1,422,914 2,225,162 2,324,893 2,344,194 2,353,101 2,357,142 - - - 2011 1,428,742 2,045,850 2,101,507 2,106,060 2,124,737 - - - - 2012 1,357,867 2,069,172 2,101,277 2,116,860 - - - - - 2013 1,276,706 2,072,188 2,099,539 2,138,446 - - - - - - 2014 1,251,627 1,713,770 1,799,515 - - - - - - - 2015 1,426,032 1,831,806 - - - - - - - - 2016 1,297,137 - - - - - - - - -
Engineering Table of claims paid excluding large claims (Attritional Table)
Accident Year 1 2 3 4 5 6 7 8 9 10 2007 - 32,204 9,310 270 - - 722 - - - 2008 7,021 35,216 20,787 378 6,761 206 72 20 - - 2009 40,790 55,128 17,683 285 575 116 319 1,713 - - 2010 23,720 38,788 2,791 3,885 1,188 15 1,817 - - - 2011 20,311 56,873 43,413 7,612 3,053 - - - - - 2012 31,107 47,004 8,616 1,806 1,575 - - - - - 2013 40,346 115,740 16,278 2,690 - - - - - - 2014 85,778 52,129 36,809 - - - - - - - 2015 57,910 54,315 - - - - - - - - 2016 51,127 - - - - - - - - - Engineering Table of inflated adjusted claims paid excluding large claims (Attritional Table) Accident 1 2 3 4 5 6 7 8 9 10 2007 - 19,792 40,972 43,861 45,872 45,872 45,872 45,872 45,872 2008 16,774 90,647 129,650 130,294 140,563 140,853 140,947 140,971 140,971 - 2009 85,566 189,002 219,082 219,514 220,322 220,472 220,851 222,564 - - 2010 44,506 110,488 114,726 120,189 121,732 121,750 123,566 - - - 2011 34,550 120,931 181,983 191,867 195,484 195,484 - - - - 2012 47,246 113,349 124,537 126,677 128,252 - - - - - 2013 56,739 207,032 226,318 229,008 - - - - - - 2014 111,386 173,149 209,958 - - - - - - - 2015 68,611 122,926 - - - - - - - - 2016 51,127 - - - - - - - - -
Notes to the financial statementsFor the year ended 31 December 2016
3,097,5392,609,4532,352,3482,121,5442,126,894
3,104,122

RC 7588
www.leadway.comAnnual Report & Accounts 2016122
Engineering Combined results table (Attritional and Large Losses)
FIRE Table of claims paid excluding large claims (Attritional Table)
FIRE Table of inflated adjusted claims paid excluding large claims (Attritional Table)
FIRE Combined results table (Attritional and Large Losses)
MARINE Table of claims paid excluding large claims (Attritional Table)
Accident Year 1 2 3 4 5 6 7 8 9
2007 - 107,972 92,652 3,492 3,087 1,947 549 - - 2008 374,759 302,531 107,940 19,373 1,583 310 288 20 20 2009 138,680 163,929 36,520 7,903 619 - 54 4,180 - 2010 175,303 127,912 34,528 46,782 10,745 43 1,483 - - 2011 237,670 439,609 112,765 1,627 339 4,064 - - - 2012 141,267 278,907 18,893 6,504 4,875 - - - - 2013 304,906 174,174 21,852 37,622 - - - - - 2014 356,023 225,666 64,750 - - - - - - 2015 277,168 261,308 - - - - - - - 2016 309,003 - - - - - - - -
Accident year 1 2 3 4 5 6 7 8 9 10
2007 - 201,283 452,331 458,883 464,135 467,092 467,864 467,864 467,864 468,3272008 895,404 1,530,023 1,732,551 1,765,507
1,767,911 1,768,348 1,768,722 1,768,746 1,768,766 -
2009 290,910 598,490 660,612 672,616 673,486 673,486 673,550 677,730 - - 2010 328,920 546,509 598,951 664,741 678,694 678,745 680,228 - - - 2011 404,297 1,071,986 1,230,570 1,232,683 1,233,085 1,237,149 - - - - 2012 214,560 606,793 631,327 639,033 643,908 - - - - - 2013 428,796 654,968 680,859 718,481 - - - - - 2014 462,311 729,680 794,431 - - - - - - - 2015 328,389 589,697 - - - - - - - 2016 309,003 - - - - - - - - -
Accident Year Paid to date Latest Paid Large Loss
Total Ultimate Gross claims reserve
Gross Earned Premium
Ultimate Loss ratio
2008 1,768,766 1,840,810 3,609,575 - 1,203,372 300% 2009 677,730 89,484 767,214 - 1,203,372 64% 2010 680,228 127,207 807,547 112 1,644,687 49% 2011 1,237,149 560,752 1,806,599 8,698 1,878,292 96% 2012 643,908 396,060 1,129,024 89,055 1,967,539 57% 2013 718,481 455,342 1,290,575 116,752 2,029,174 64% 2014 794,431 842,325 1,808,657 171,901 2,021,096 89% 2015 589,697 450,093 1,267,775 227,985 1,990,048 64% 2016 309,003 1,451,165 3,227,719 1,467,551 2,326,034 139% Total 7,887,720 6,415,840 16,385,614 2,082,054 17,466,986
Accident Year 1 2 3 4 5 6 7 8 9 10
2007 - 19,792 21,180 2,889 2,010 - - - - - 2008 183,671 72,873 23,692 3,905 6,569 30 3,865 - - - 2009 90,957 107,709 28,685 4,329 929 58 54 - - - 2010 69,958 71,656 10,320 234 2,848 - - - - - 2011 89,427 83,735 9,788 3,004 147 37 - - - - 2012 143,326 114,430 6,403 450 366 - - - - - 2013 122,320 121,486 15,176 - - - - - - - 2014 165,869 107,548 36,603 - - - - - - - 2015 162,103 145,063 - - - - - - - - 2016 120,585 - - - - - - - - -
Accident Year Paid to date Latest Paid Large Loss
Total Ultimate Gross claims reserve
Gross Earned Premium
Ultimate Loss ratio
2007 97,997 - 97,997 - 593,884 17% 2008 140,971 21,817 162,788 - 593,884 27% 2009 222,564 32,923 255,487 - 593,884 43% 2010 123,566 112,382 237,148 1,200 550,249 43% 2011 195,484 136,665 334,478 2,329 550,249 61% 2012 128,252 77,692 233,815 27,872 716,219 33% 2013 229,008 102,083 342,636 11,545 687,315 50% 2014 209,958 312,333 546,562 24,270 980,992 56% 2015 122,926 61,217 348,860 164,718 817,303 43% 2016 51,127 -
318,183 267,055 799,904 40%
Total
1,521,853
857,113
2,877,954
498,989
6,883,883
10
463
-
-
-
-
-----
Notes to the financial statementsFor the year ended 31 December 2016
2007 468,327 202,602 670,929 - 1,203,372 56%

OVERVIEWBUSINESSREVIEW GOVERNANCE
GROUP FINANCIALSTATEMENTS APPENDIX
123www.leadway.comAnnual Report & Accounts 2016
MARINE Table of inflated adjusted claims paid excluding large claims (Attritional Table)
MARINE Combined results table (Attritional and Large Losses)
Accident Year Paid to date Latest Paid Large Loss
Total Ultimate Gross claims
Gross Earned Premium
Ultimate Loss ratio
2007 100,559 - 100,559 - 862,220 12%2008 657,839 21,131 678,970 - 862,220 79% 2009 449,712 72,727 522,439 - 862,220 61% 2010 272,856 - 292,424 19,568 1,005,603 29% 2011 297,179 16,644 335,573 21,751 1,026,446 33% 2012 387,826 271,138 755,983 97,020 1,083,007 70% 2013 347,756 270,989 692,807 74,063 1,000,601 69% 2014 379,414 315,613 898,605 203,578 1,262,545 71% 2015 337,123 268,105 1,073,726 468,498 1,136,917 94% 2016 120,585 9,931 647,529 517,012 621,818 104% Total 3,350,849 1,246,278 5,998,615 1,401,490 9,723,597
GENERAL ACCIDENT Combined result table (Attritional and Large Losses) Accident Year Paid to date Latest Paid
Large Loss
Total Ultimate Gross claims reserve
Gross Earned Premium
Ultimate Loss ratio
2007 555,922 62,258 618,180 - 2,322,854 27% 2008 715,648 231,033 947,181 500 2,322,854 41% 2009 464,987 175,847 640,834 - 2,322,854 28% 2010 419,843 375,106 797,060 2,110 1,824,950 44% 2011 485,100 201,389 719,149 32,660 2,021,176 36% 2012 418,049 218,812 734,710 97,848 1,367,701 54% 2013 229,799 138,183 499,221 131,239 1,196,502 42% 2014 249,328 96,084 496,663 151,251 1,143,149 43% 2015 187,182 117,519 471,070 166,369 1,183,481 40% 2016 117,173 - 475,819 358,646 1,175,191 40%
Accident Year 1 2 3 4 5 6 7 8 9 10
2007 - 201,283 91,718 97,139 100,559 100,559 100,559 100,559 100,559 100,559 2008 438,841 591,707 636,159 642,802 652,779 652,821 657,839 657,839 657,839 - 2009 190,800 392,895 441,691 448,266 449,573 449,648 449,712 449,712 - - 2010 131,261 253,154 268,828 269,158 272,856 272,856 272,856 - - - 2011 152,122 279,301 293,066 296,967 297,141 297,179 - - - - 2012 217,687 378,613 386,927 387,460 387,826 - - - - - 2013 172,021 329,775 347,756 347,756 - - - - - - 2014 215,388 342,811 379,414 - - - - - - - 2015 192,060 337,123 - - - - - - - - 2016 120,585 - - - - - - - - -
GENERAL ACCIDENT Table of claims paid excluding large claims (Attritional Table)
Accident Year 1 2 3 4 5 6 7 8 9 10
2007 - 150,727 45,126 25,010 21,267 5,632 5,118 1,769 - 2008 78,583 115,978 58,285 88,778 4,000 8,545 3,285 1,573 - - 2009 62,974 98,556 47,384 33,570 6,790 2,424 3,005 118 - - 2010 80,873 80,915 40,296 23,772 20,746 5,813 1,999 - - - 2011 99,785 129,214 58,716 18,214 8,526 2,777 - - - - 2012 116,947 115,763 38,016 11,916 14,145 - - - - - 2013 67,883 72,208 26,216 9,508 - - - - - - 2014 52,707 113,680 46,197 - - - - - - - 2015 79,920 92,493 - - - - - - - - 2016 117,173 - - - - - - - - -
GENERAL ACCIDENT Cumulative table for Attritional loses)
Accident year 1 2 3 4 5 6 7 8 9 10
2007 - 201,283 454,620 501,546 537,724 546,278 553,476 555,772 555,772 555,922 2008 187,757 431,045 540,406 691,425 697,500 709,518 713,784 715,648 715,648 - 2009 132,101 317,021 397,625 448,612 458,160 461,308 464,869 464,987 - - 2010 151,741 289,384 350,586 384,017 410,957 417,844 419,843 - - - 2011 169,742 365,995 448,569 472,221 482,322 485,100 - - - - 2012 177,621 340,421 389,786 403,904 418,049 - - - - - 2013 95,465 189,230 220,290 229,799 - - - - - - 2014 68,443 203,130 249,328 - - - - - - - 2015 94,689 187,182 - - - - - - - - 2016 117,173 - - - - - - - - -
Notes to the financial statementsFor the year ended 31 December 2016
Total 3,843,031 1,616,231 6,399,887 940,623 16,880,712

RC 7588
www.leadway.comAnnual Report & Accounts 2016124
Group Group Company Company
Ordinary shares of 50k each: Non -life business 6,279,596,000 units (2015: 6,279,596,000) Life business 3,085,304,000 units (2015: 2,500,000,000)
3,139,798 3,139,798 3,139,798 3,139,798
1,542,652 1,250,000 1,542,652 1,250,000
Expected Loss Ratio Method – Bond Claims
24. Investment Contract Liabilities Movement in investment contract liabilities is as shown below.
25. Capital and reserves a. Share capital
(I) Issued and fully paid: The issued and fully paid up capital of the company which is a composite insurer is N4.682bn (2015: N4.389bn). In line with regulations issued by the National Insurance Commission (NAICOM) issued and paid capital of the company is allocated as follows;
Accident Year Gross Earned Premium
Claims Paid till date
Total outstanding as at 31 Dec 2016
Current Incurred
Current Loss Ratio
Ultimate Loss Ratio
Ultimate Losses
2007 272,411 1,325 500 1,825 1% 1% 1,825 2008 272,411 157,894 - 157,894 58% 58% 157,894 2009 272,411 181,383 22,608 203,992 75% 75% 203,992 2010 427,458 214,013 - 214,013 50% 50% 214,013 2011 599,336 566,068 65,507 631,575 105% 105% 631,575 2012 761,353 1,094,046 - 1,094,046 144% 144% 1,094,046 2013 593,545 358,228 - 358,228 60% 60% 358,228 2014 761,845 393,033 7,076 400,109 53% 53% 400,109 2015 728,863 203,545 3,605 207,150 28% 28% 207,150 2016 740,170 477,003 257,997 735,001 99% 108% 799,285
Expected Loss Ratio Method - Oil and Gas claims
Accident Year Gross Earned Premium
Claims Paid till date
Total outstanding as at 31 Dec 2016
Current Incurred
Current Loss Ratio
Ultimate Loss Ratio
Ultimate Losses
2007 7,504,563 25,946 93,417 119,363 2% 2% 119,363 2008 11,687,862 32,749 1,854,993 1,887,742 16% 16% 1,887,742 2009 11,515,695 244,045 5,511 249,556 2% 2% 249,556 2010 6,616,535 633,208 20,407 653,615 10% 10% 653,615 2011 6,290,318 970,940 487,832 1,458,772 23% 23% 1,458,772 2012 12,863,770 2,838,469 4,459,000 7,297,469 57% 57% 7,297,469 2013 10,615,790 457,428 940,136 1,397,563 13% 13% 1,397,563 2014 11,748,608 366,302 1,044,352 1,410,654 12% 12% 1,410,654 2015 10,975,832 39,212 2,220,114 2,259,326 21% 25% 2,743,958 2016 12,006,726 102,825 2,461,670 2,564,496 21% 35% 4,202,354
Group Group Company Company 31-Dec-16 31-Dec-15 31-Dec-16 31-Dec-15 Balance, beginning of year 15,459,506 12,665,764 15,459,506 12,665,764 Deposits received 5,051,291 3,983,855 5,051,291 3,983,855 Withdrawals (3,653,975) (2,247,956) (3,653,975) (2,247,956) Guaranteed interest charged during the year 1,437,465 1,057,844 1,437,465 1,057,844
Current 1,961,010 1,657,143 1,961,010 1,657,143 Non Current 16,333,277 13,802,364 16,333,277 13,802,364
Group Group Company
(i) Authorised:
Ordinary shares of 50k each:
31-Dec-16 31-Dec-15 31-Dec-16Company
31-Dec-15
31-Dec-16 31-Dec-15 31-Dec-16 31-Dec-15
Notes to the financial statementsFor the year ended 31 December 2016
Balance, end of year 18,294,287 15,459,507 18,294,287 15,459,507
18,294,287 15,459,507 18,294,287 15,459,507
5,000,000 5,000,000 5,000,000 10,000,000,000 units
(2015: 10,000,000,000 units)
5,000,000
5,000,000
5,000,000
5,000,000
5,000,000
4,682,450 4,389,798 4,682,450 4,389,798

OVERVIEWBUSINESSREVIEW GOVERNANCE
GROUP FINANCIALSTATEMENTS APPENDIX
125www.leadway.comAnnual Report & Accounts 2016
During the year, International Finance Corporation (IFC) sold its 19% interest in Leadway to Swiss Re (Swiss Re) Investment Company Limited. Leadway further allotted new ordinary shares totaling 585,306,225 to Swiss re in the period which resulted in an increase in share capital of N292.65 million (2015: Nil).
N200million out of the total consideration was deferred to be-paid at a future date subject to Leadway Assurance Company fulfilling certain pre-agreed conditions. Consequently, this contingent consideration has not been recognized in share premium in this financial statements.
b. Share premiumShare premium comprises the amount paid over the nominal value of shares. This reserve is not ordinarily available for distribution. Share premium increased by N3.85 billion as a result of Swiss re fresh acquisition of the ordinary shares of Leadway Assurance Company Limited. The shares were acquired at a premium.
c. Retained earningsThe retained earnings is the carried forward recognized income net of expenses plus current profit attributable to shareholders. It is the amount available for dividend distribution to the equity shareholders of the company. See statement of changes in equities for movement in retained earnings
d. Other ReservesComponents of other reserves are as follows:
(i) Contingency reservesIncluded in the contingency reserve is contingency reserve from Leadway Assurance Company general and life business in line with Insurance act of 2003. And statutory reserve from Leadway Pensure PFA in hue with the Pension reform act. 2014.
In compliance with Section 21 (1) of Insurance Act 2003, the contingency reserve for non-life insurance business is credited with the greater of 3% of total premiums or 20% of the net profits (whichever is greater). This shall accumulate until it reaches the amount of greater of minimum paid-up capital or 50 percent of net premium. While for life business, the contingency reserves is credited with an amount equal to 1% of gross premium or 10% of net profit (whichever is greater) and accumulated until it reaches the amount of minimum paid up capital.
Included in the group contingency reserve is a statutory reserve from Leadway Pensure PFA in line with section 69 of Pension Reform Act, 2014. 12.5% of profit after tax has been credited to this Fund as contingency fund to meet claims for which the PFA may be liable as determined by the commission.
The distribution of contingency reserve is shown below:
(i) Asset revaluation reserveThis reserve is the accumulation of revaluation gain on the group's land and buildings. See statement of changes in equities for movement in asset revaluation reserve.
(ii) Fair value reservesFair value reserves includes the net accumulated change in the fair value of available for sale asset until the investment is derecognized or impaired. See statementof changes in equities for movement in fair value reserve.
(iii) Treasury sharesTreasury shares represent the cost of the ordinary shares of the parent held by its subsidiary, Leadway Capital and Trust Limited. During the year, 4,631,248 units(2015: 4,978,535 units) of the 709,347,300 units of ordinary shares of Leadway Assurance Company Ltd held by Leadway Capital and Trust (Treasury shares)were sold to a minority shareholder of the company. This movement in treasury shares, N528,806 (2015: 562,999) is included in the statement of changes in equityin these financial statements.
- -
Contingency reserve (see note (i) below) 8,238,232 6,790,001 7,839,002 6,481,209 Asset Revaluation reserve (see note (ii) below 1,603,053 1,561,569 1,363,442 1,294,941
Fair value reserves (see note (iii) below 1,859,503 503,437 1,875,060 518,549
Treasury shares (see note (iv) below) (79,688) (80,217) - -
Contingency reserves:Leadway assurance Companyleadway Pensure PFA
7,839,002399,230
6,481,209308,792
79,688 80,217Treasury shares
Notes to the financial statementsFor the year ended 31 December 2016
11,621,100 8,774,790 11,077,504 8,294,699
Group 31-Dec-16
31-Dec-15
Group
Group Group Company Company
31-Dec-16 31-Dec-15 31-Dec-16 31-Dec-15
8,238,232 6,790,001
Group 31-Dec-16
Group 31-Dec-15
Company 31-Dec-16
Company 31-Dec-15
- -
79,688 80,217

RC 7588
www.leadway.comAnnual Report & Accounts 2016126
(a) See statement of changes in equities for movement in non-controlling interest during the period
(b) The financial information for the three subsidiaries with non-controlling interest are disclosed in note 15 (investment in subsidiaries) of these financial statements.
27. Gross Premium Written
Gross premium written from subsidiaries of N18.3Million (2015: N8.09million) has been eliminated in the group gross written premium.
(a) The movement in unearned premium is analyzed as follows:(i) Non-life business
28. Reinsurance expenses
29. Fees and Commission Income
Leadway Capital and Trust LimitedLeadway Hotels Limited Leadway Pensure PFA
414,680 335,494 - - 1,002,734 704,560 - - 1,244,462 1,051,013 - -
Gross premium - Non -life business 15,434,045 - Life business 31,214,873
46,648,918 (Increase)/decrease - Unearned premium (see note (a) i below) 4,423,653
21,111,318 15,425,955 21,129,613 31,588,954 31,214,873 31,588,954 52,700,272 46,640,828 52,718,567 954,886 4,423,653 954,886
Motor (61,872) 4,249 (61,872) 4,249 Fire (207,343) (208,964) (207,343) (208,964) General (107,456) (42,346) (107,456) (42,346) Bond 36,332 107,428 36,332 107,428 Marine 158,171 (135,145) 158,171 (135,145) Engineering (137,599) 61,461 (137,599) 61,461 Special risk 730,122 4,292,206 730,122 4,292,206 Group life 544,531 344,764 544,531 344,764
Reinsurance premium paid 11,299,751 7,149,718 7,149,718 Increase in unexpired reinsurance cost 1,098,647 3,975,688 1,098,647 3,975,688
11,299,751
Commission earned on non-life insurance contracts 1,825,376 877,632 1,825,376 877,632 Commission earned on group life assurance contracts 28,477 28,862 28,477 28,862
Notes to the financial statementsFor the year ended 31 December 2016
Group31-Dec-16
Company31-Dec-16
Company31-Dec-15
Group31-Dec-15
1,853,853 906,494 1,853,853 906,494
12,398,398 12,398,398 11,125,406
Group31-Dec-16
Company31-Dec-16
Company31-Dec-15
Group31-Dec-15
Group31-Dec-16
Company31-Dec-16
Company31-Dec-15
Group31-Dec-15
954,886 4,423,653 954,886 4,423,653
Group31-Dec-16
Company31-Dec-16
Company31-Dec-15
Group31-Dec-15
Gross premium income 51,072,571
53,655,158 51,064,481 53,673,453
Group31-Dec-16
Company31-Dec-16
Company31-Dec-15
Group31-Dec-15
2,661,876 2,091,067 - -
11,125,406
26. Non Controlling Interest

OVERVIEWBUSINESSREVIEW GOVERNANCE
GROUP FINANCIALSTATEMENTS APPENDIX
127www.leadway.comAnnual Report & Accounts 2016
30. Claims expense
Combined Gross benefits & claims paid (see note 23.1c) 14,695,825 Claims ceded to reinsurers (2,323,485) Change in provision for outstanding claims 948,663 Proceed from salvage and subrogation 84,796 Change in recoverable on outstanding claims 958,309
Non – life business
Gross benefits & claims paid Claims ceded to reinsurers Change in provision for outstanding
31. Underwriting expenses
Underwriting expenses can be sub-divided into acquisition and other maintenance expenses. Acquisition expenses relate to commission expenses incurred in obtaining and renewing insurance contracts. They include commissions or brokerage paid to agents or brokers. Maintenance expenses are those incurred in processing costs and other incidental costs such as salaries of underwriting staff.
Acquisition expenses 2,853,575 Maintenance expenses 1,524,039
32. Investment income
Rental income 176,778 Interest on loans 160,882 Interest on Finance Lease - Interest on short term deposits 643,172 Dividend income on investment securities 819,441 (Loss)/Profit on sale of investment 33,519 Profit on disposal of associates (see i below) - Fair value gain on step acquisition (see ii below) - Interest income on debt securities 5,448,933 Interest income on statutory deposits 44,703 Other interest income 13,152
33. Net fair value gain/(loss) on assets at fair value
- Fair value gains on listed equity securities (260,571) - Fair value (losses)/gains on listed debt securities (16,730,014) 14,471,651 - Fair value (losses)/gains on investment property 545,177
Life business
14,696,178 (2,323,485)
948,663 84,796
958,309
9,058,253 (118,800)
203,691 795,901
19,178,830 (2,103,706)
7,455,025 79,095
(1,546,610)
19,179,123 (2,103,706)
7,455,025 79,095
(1,546,610)
12,563,339 9,058,253 12,563,339 (14,703) (118,800) (14,703) 502,710
203,691 502,710
(12,275) 795,901 (12,275)
3,111,672 2,853,575 3,111,672 1,929,979 1,524,039 1,929,979
171,503 178,519 178,493 154,136
24,185 31,073 1,546,374 754,438
420,863 721,582 (1,015,912) (247,786)
- - 2,273,592
8,884,352 5,448,933 55,118 44,705
497,325 236,147
291,304 227,365
- 1,332,452
739,767 (1,048,318)
- -
8,884,352 50,834 12,699
17,016 (281,788) 17,017 14,471,651 (16,730,014)
(787,006) 737,762 (702,677)(16,730,014)
Notes to the financial statementsFor the year ended 31 December 2016
7,340,580
Financial assets at fair value through profit or loss
10,762,301 9,595,339
10,490,455
Company 31-Dec-15
Group 31-Dec-16
Group 31-Dec-15
Company 31-Dec-16
(17,500,004) 14,756,257
14,927,625 (17,415,674)
4,377,614
Company 31-Dec-15
5,041,651 4,377,614 5,041,651
Group
31-Dec-16 Group
31-Dec-15 Company 31-Dec-16
Company 31-Dec-15
Group
31-Dec-16 Group
31-Dec-15 Company 31-Dec-16
Gross benefits & claims paid Claims ceded to reinsurers Change in provision for outstanding Proceed from salvage and subrogation Change in recoverable on outstanding
(a)
5,637,925 (2,119,889)
744,972 84,796
162,408 4,510,212
Company 31-Dec-15
6,615,491 5,637,572 6,615,784 (2,009,908) (2,119,889) (2,009,908)
6,952,315 744,972 6,952,315 79,095 84,796 79,095
(1,534,335) 162,408 (1,534,335) 10,102,658
4,509,859
10,102,951
Group 31-Dec-16
Group 31-Dec-15
Company 31-Dec-16
Change in recoverable on outstanding
(b) (a+b)
9,939,045
14,449,257
13,039,071 9,939,045
13,039,071
23,141,129 14,448,904 23,142,022
Group 31-Dec-15
Company 31-Dec-15
Group 31-Dec-16
Company 31-Dec-16
14,364,108 14,364,461 23,062,634 23,062,927

RC 7588
www.leadway.comAnnual Report & Accounts 2016128
Notes to the financial statementsFor the year ended 31 December 2016
34. Other operating income
Fee income on pension administration - Hotel management income - Management fee income from related parties 34,319 Profit/ (Loss) on sale of property and equipment Foreign exchange gain/(loss)
(713)
- Investment securities 31,075 - Cash and cash equivalents 447,494 - Loans and advances - Gross premium recovered 327,386 Liquidation Dividend 69,294 Other income 132,895
The increase in exchange income from prior year is as a result of an increase in exchange rate from N199/$USD in 2015 to N305/$USD in 2016.
35. Employee benefit expense
(a) Staff information:Employees earning more than 100,000 per annum, other than the executive directors, whose duties were wholly or mainly discharged in Nigeria, received emoluments in the following ranges:
Absolute Number N101,001- N500,000 - N500,001 - N750,000 - N750,000- N1,000,000 - N1,000,000 - N2,000,000 27 N2,000,000 - N3,000,000 83 Over N3,000,000 186
(b) The average number of full time persons employed during the year was as follows:
Number Executive directors 3 Management staff 82 Non management staff 214
(c) Director's remuneration (i) Remuneration paid to the directors and included in employee benefit expense is as follows:
Salaries and wages 58,054 Director’s fees 28,175 Post-employment benefits 1,750
3,431,793 1,860,822 - 729,662 723,805 -
- - 18,250
5,055 24,692 -
3,930,608 31,075 3,930,608 6,495,082 451,034 6,519,492
94,902 - 94,902 - 327,386 - - 69,294 -
198,598 129,523 173,269
Wages and salaries - staff and executive directors 1,007,650 Pension cost - Defined contribution plan 41,965 Termination benefits (see note (d) below) 162,916 Profit sharing expense 300,000
2,326,230 1,810,914 1,016,013 68,959 56,671 52,228
169,833 162,916 169,833 766,605 300,000 751,439
Number Number Number 26 29 - 86 52 - 36 10 -
191 184 27 87 103 77
255 274 184
Number Number Number 3 3 3
110 108 82 571 544 206
58,054 58,054 58,054 11,965 28,175 11,965 80,800 1,750 80,800
Chairman 7,100 Highest paid director 24,306
32,600 7,100 32,600 25,775 24,306 25,775
1,041,750
14,885,700 3.617,631 10,736,521
Company 31-Dec-15
Group 31-Dec-16
Group 31-Dec-15
Company 31-Dec-16
1,512,531
3,331,627 2,330,501 1,989,513
Company 31-Dec-15
Group
31-Dec-16 Group
31-Dec-15 Company 31-Dec-16
296
681 652 288
Company 31-Dec-15
Group
31-Dec-16 Group
31-Dec-15 Company 31-Dec-16
– 299
Company 31-Dec-15
684 655 291
Group 31-Dec-16
Group 31-Dec-15
Company 31-Dec-16
87,979
150,819 87,979 150,819
(ii) The directors' remuneration shown above includes: Company
31-Dec-15 Group
31-Dec-16 Group
31-Dec-15 Company 31-Dec-16
Company31
Group31
Group 31
Company 31 -Dec 15 -Dec 16 -Dec 15 -Dec 16 -- - -

OVERVIEWBUSINESSREVIEW GOVERNANCE
GROUP FINANCIALSTATEMENTS APPENDIX
129www.leadway.comAnnual Report & Accounts 2016
(iii) The emoluments of all other directors fell within the following range:
Number Number Above N4,800,000 6 6 N2,300,000 – N4,800,000 - - N1,500,000 – N2,300,000 1 1 N750,000 –
N1,500,000
-
Below N750,000
(d) Termination benefit relates to payments made to disengaged staff during the period.
36. Other operating expenses
Contract staff cost Asset repairs and maintenance Corporate expenses and gift items Telecommunication Advertisement Agency related expenses Property insurance expense Insurance supervisory fund Professional fees (i) Travelling and tours Auditor's remuneration Bank charges Offices rates and rent Training cost Power and Fuel charges Donations Subscription Depreciation of property and equipment Amortization of intangible assets Directors' fees and allowances Hotel management expenses Entertainment Investment expenses Passage expenses
193,510 268,509 187,782 296,733 22,349 27,800
469,897 151,346
97,738 40,000 65,906 28,341 17,478
142,877 16,438 13,103
358,251 98,977
9,270 -
6,437 25,947
421,274 259,025 Others
(i) Included in professional fees above is N8,000,000 paid to PricewaterhouseCoopers(PwC) for Non audit services performed during theyear ended 31 December 2016. The services provided includes the design of a period close checklist and timetable.
37. Finance Cost
Investment contracts (see note (a) below) (27,044) Interest expense 27,044 Interest expense on borrowings
(a) Finance cost on investment contracts represents guaranteed interest which accrues to the account of investment contract holders.
All these contracts are designated as financial liabilities and measured at amortized cost.
Company 31-Dec-15
Number Number 5 5 1 1 - - 1 1
111,207293,293 301,544 238,418 137,755 312,415 119,816 637,314 265,043 539,234 651,371 400,423 415,449 100,354 24,813 82,367
33,225 38,202 27,583 486,394 469,897 486,394 213,173 189,652 194,546 163,866 170,709 107,269 104,190 50,480 45,000
,197
122 67,363 80,563 39,064 133,583 77,085
106,516 72,493 106,516 134,308 220,372 89,278 32,780 29,541 32,780 51,271 14,917 33,364
618,157 443,335 396,878 113,883 128,407 83,718 111,992 54,137 92,765 292,994 293,036 4,853
29,791 6,442 20,691 36,367 25,947 36,367
379,428 421,274 379,428 352,791 518,478 210,172
385,716 111,207 385,716
- (27,044) - - 27,044 -
155,829 30,948
Group 31-Dec-16
Group 31-Dec-15
Company 31-Dec-16
Notes to the financial statementsFor the year ended 31 December 2016
Company 31-Dec-15
Group 31-Dec-15
Group
31-Dec-16 Company 31-Dec-16
7 78 8
3,330,195
5,628,190 4,763,710 4,286,250
Company 31-Dec-15
Group 31-Dec-15
Group
31-Dec-16 Company 31-Dec-16
-1 1 -
- -
- 155,829 30,948 -

RC 7588
www.leadway.comAnnual Report & Accounts 2016130
Notes to the financial statementsFor the year ended 31 December 2016
38. Net impairment losses
Impairment on trade receivable no longer required (see note 7c)
(230,833)
Impairment loss on other receivables (see note 11iii) 11,584 Write – off - Impairment on Premium deposit 144,723 Impairment loss on reinsurance assets - Impairment loss on investment securities - Impairment loss on commercial loans (see note 121) 120,395 Specific impairment loss on finance leases receivable - Collective impairment loss on finance leases receivable -
39. Income tax expense
Current tax on profits for the year: Company income tax 331,508 Education tax - Technology levy 67,325 Withholding tax on dividend income 9,258 Total current tax 408,091
The tax on the group and company's profit before tax differs from the theoretical amount that would arise using the weighted average tax rate applicable to profits of the consolidated entities as follows:
Profit before income tax 6,484,941 Tax calculated at domestic rate applicable in Nigeria at 30% (2015: 30%)
1,945,482
Non-deductible expenses 2,225,720 Education tax - Technology levy 64,849 Capital gains tax {99,629}Tax assessment based on minimum tax
(340,766)
WHT paid on dividend
(9,258) Capital allowance (299,242)
Reconciliation of effective tax rate
Tax calculated at domestic rate applicable in Nigeria at 30% (2015: 30%) 30.00% Effect of: Tax exempt income Non – deductive expenses Education tax Technology levy Capital gains tax Tax assessment based on minimum tax WHT paid on dividend Capital allowance
-52.15% 34.32% 0.00% 1.00%
-1.54% -5.25%
-0.14% -4.61%
Company 31-Dec-15
Company 31-Dec-15
Company 31-Dec-15
_ (230,833) _
23,288 13,877 11,617 - 144,723 -
172,867 - 172,867 - - -
23,441 156,584 18,972 76,608 58.444 74,603 30,508 - -
- -
Group 31-Dec-16
Group 31-Dec-15
Company 31-Dec-16
1,197,004 622,900 635,745
18,297 11,990 - 14,863 81,554 - 63,747 9,258 63,747
1,293,911 725,702 699,492
Group 31-Dec-16
Group 31-Dec-15
Company 31-Dec-16
8,791,606 9,301,030 7,361,449
2,637,482 2,790,309 2,208,435
6,038,280 2,037,822 5,974,367 - - -
87,916 93,010 73,614 (31,084) (99,629) (31,084)
(570,916) (340,766) (570,916) (63,747)
(9,258) (63,747)
(399,311) (487,140) (399,311)
Group 31-Dec-16
Group 31-Dec-15
Company 31-Dec-16
30.00% 30.00% 30.00%
-73.84% -38.39% -88.19% 68.68% 21.91% 81.16% 0.00% 0.00% 0.00% 1.00% 1.00% 1.00%
-0.35% -1.07% -0.42% -6.49% -3.66% -7.76% -0.73% -0.10% -0.87% -4.54% -5.24% -5.42%
Effect of: Tax exempt income (3,382,144)
(6,491,866) (3,570,374) (6,491,866)
Effective tax rate 1.62%
13.73%
4.45% 9.50%
Total income tax expense in comprehensive income 105,012
1,206,754 413,974 699,492
Deferred tax (credit)/charge (303,079) 105,012
(87,157) (311,728) - 1,206,754 413,974 699,492
Collective impairment loss on loans (see note 12i) 226,958 272,827
92,871 226,958 92,871 419,583 369,753 370,930
Company 31-Dec-15
Group 31-Dec-16
Group 31-Dec-15
Company 31-Dec-16

OVERVIEWBUSINESSREVIEW GOVERNANCE
GROUP FINANCIALSTATEMENTS APPENDIX
131www.leadway.comAnnual Report & Accounts 2016
40. Earnings Per Share The calculation of basic earnings per share as at 31 December 2016 was based on the profit attributable to ordinary shares of N9.01billion (Company: N6.68billion) and weighted average number of ordinary shares outstanding of 8.5billion (Company: 9.2billion), having excluded treasury shares held by a subsidiary, Leadway Capital and Trust Limited. The company has no delusive instruments in 2016 and 2015.
Profit from continuing operations attributable to owners of the parent.
6,379,929
Weighted average number of ordinary shares in issues before deducting treasury shares
8,779,596
Treasury shares - Weighted average number of shares I issue 8,779,596
7,143,178 8,711,508 6,661,957
9,212,561 8,779,596 9,212,561
(704,716) (709,347) -
8,507,845 8,070,249
9,212,561
41. Dividend The dividend paid in 2016 and 2015 were N1billion (11.39Kobo per share) and N850million (9.7Kobo per share) respectively. These dividends are in respect of the results of the preceding financial years. A dividend in respect of the year ended 31 December 2016 of 16.02kobo per share amounting to a total dividend of N1.5billion is to be proposed by the directors at the annual general meeting. The dividend has not been included as liability in these financial statements.
42. Related partiesLeadway Assurance Company Limited is the ultimate parent/controlling party of the group. Related parties to the Company are as follows:
(I) SubsidiaryThe Company has four subsidiaries as at 31 December 2016. Transactions between Leadway Assurance Company Limited and the subsidiaries also meet the definition of related party transactions.
(ii) Key management compensationThe Group's key management personnel, and persons connected with them, are also considered to be related parties for disclosure purposes. The definition of key management includes close members of family of key management personnel and any entity over which key management personnel exercise control. The key management personnel have been identified as the executive directors of the Group. Close members of family are those family members who may be expected to influence, or be influenced by that individual in their dealings with Leadway Assurance Company Limited. The compensation paid or payable to key management personnel for employee services is shown below:
(a) Underwriting of insurance policies - Leadway Capital and Trusts Limited Subsidiary 439 1,238 - Leadway Investment and Properties Limited Subsidiary - 1,385 - Leadway Hotels Subsidiary 5,415 4,830 - Leadway Pensure PFA Subsidiary 15,648 14,337 - Total Health Trust Limited Subsidiary - 27,232
21,502 49,022 (b) Payment of claims
- Leadway Hotels Subsidiary 214 - - Leadway Investment and Properties Limited Subsidiary - l,48l - Total Health Trust Limited Subsidiary - 2,660 - Leadway Pensure PFA Subsidiary 78 3,499
292 7,640 (c) Management fee income from technical services provided
- Leadway Capital and Trusts Limited Subsidiary - 7,136 - Leadway Hotels Subsidiary 4,500 9,000 - Leadway Pensure PFA Subsidiary 13,750 18,900 18,250 35,036
(d) Rental income - Leadway Pensure PFA Subsidiary 35,867 35,867 - Leadway Hotel Subsidiary 89,615 - - Leadway Capital and Trusts Limited Subsidiary 3,119 1,560
Salaries and other short term employer benefits. 50,848 Pension cost-defined contribution 7,207
Notes to the financial statementsFor the year ended 31 December 2016
128,601 37,427
The following transactions were carried out with related parties. All transactions and balances with subsidiaries have been eliminated on consolidation.
50,848 50,848 50,848 7,207 7,207 7,207
Company 31-Dec-15
Group 31-Dec-16
Group 31-Dec-15
Company 31-Dec-16
58,055
31-Dec-15
31-Dec-16
58,055 58,055 58,055
Earnings per share – basic and diluted (kobo) 73
84 108 72
Company 31-Dec-15
Group 31-Dec-16
Group 31-Dec-15
Company 31-Dec-16

RC 7588
www.leadway.comAnnual Report & Accounts 2016132
Notes to the financial statementsFor the year ended 31 December 2016
(e) Dividend received - Leadway Capital and Trusts Limited Subsidiary 27,982 - Leadway Pensure PFA Subsidiary 119,513 - Total Health Trust Limited Associate 10,305 157,800 (f) Dividend paid - Leadway Capital and Trusts Limited Subsidiary 61,808 (g) Interests income earned on intercompany loans - Leadway Capital and Trusts Limited Subsidiary 3,428 - Leadway Hotels Subsidiary -
31-Dec-15
(i) Receivables from related parties - Leadway Hotels Subsidiary 9,000 - Leadway Capital and Trusts Limited Subsidiary 7,136 - Leadway Pensure PFA Subsidiary 18,900
Year and balances arising from sales and purchase of services are:
The receivables from related parties arise mainly from technical service agreement and are due immediately services are rendered. The receivables are unsecured in nature and bear no interest. No provisions are held against receivables from related parties (2015: nil). The receivables from subsidiaries have been eliminated on consolidation. There were no payable to related parties as at year end (2015: nil).
Loans to related parties
Loans to subsidiaries Leadway Hotel Leadway Capital and Trust Limited 31-Dec-16
Total
As at 1 January 2016 Loans advanced during the year 264,364 395,142 659,506 - 60,000 60,000 Loans repayments received Interest charged (164,528) (153,290) (317,818) Interest received 32,609 56,680 89,289 Loans repayments received Interest charged (41,600) (57,990) (99,590) As at 31 December 2016 Other related party transactions
31-Dec-16
31-Dec-15
Borrowings from IAC investments - 55,290
No loan was advanced to key management personnel as at 31 December 2016 (2015nil).
A provision of N90,844,689 was made in 2016 (2015: N21,200,174) for the loans availed to subsidiaries based on the separate financial statements of the parent
43. Contingent liabilities, litigations and claims
During the year, the company in the ordinary course of business was involved in 75 legal cases. The directors have sought the opinion of professional legal counsels and are of the opinion that no significant liability will crystalize against the company from these cases beyond the provisions already recognized within "Provisions for outstanding claims" in these financial statements.
44. Contravention of laws and regulationsThe Company in 2016 paid fines totaling N750,000 See table below for descriptions of the fines and amount paid.
Nos Description of fines Amount
i Failure to submit board resolution on approved maximum exposure on aviation risks 250,000
ii Failure to obtain approval in principle for offshore reinsurance on an aviation policy". 500,000
31-Dec-15
20,986
283,867 -
304,853
80,795
53,390 37,481
31-Dec-16
31-Dec-16
13,500
802 18,475
90,845 300,542 391,387
N
35,036
32,777
3,428
90,871

OVERVIEWBUSINESSREVIEW GOVERNANCE
GROUP FINANCIALSTATEMENTS APPENDIX
133www.leadway.comAnnual Report & Accounts 2016
45. Events occurring after the reporting periodThere were no events that occurred subsequent to the reporting date that require adjustments or disclosures in the financial statements.
46. Reclassification of comparatives Certain items in the statement of financial position for the comparative period were reclassified in other to align with current year presentation which is deemed to provide information that is more relevant to users of the financial statements. The revised presentation is likely to continue, so that comparability is not impaired. The amounts reclassified and the affected lines in the statement of financial position are as shown below:
Company 31-Dec-15
31-Dec-15
Group
Notes to the financial statementsFor the year ended 31 December 2016
(i) Other receivables Amount as previously presented -2,014,808 Reclassified to loans and advances -(130,422) Amount as re-presented -1,884,386
(ii) Loans and advances Amount as previously presented 1,789,435 - Reclassified from other receivables 130,422 - Amount as re-presented 1,919,857 -
(iii) Investment income Amount as previously presented (12,210,264) (9,955,505) Reclassified to profit/(loss) on investment contracts 2,614,925 2,614,925 Amount as re-presented (9,595,339) (7,340,580)
(iv) Net fair value gain on assets at fair value Amount as previously presented 15,059,361 14,887,993 Reclassified to profit/loss) on investment contracts (131,736) (131,736) Amount as re-presented 14,927,625 14,756,257
(v) Underwriting expense Amount as previously presented 4,956,758 4,956,758 Reclassified to profit/(loss) on investment contracts (579,144) (579,144) Amount as re-presented 4,377,614 4,377,614
(vi) Interest expense Amount as previously presented 1,084,887 1,115,835 Reclassified to profit/(loss) on investment contracts (1,084,887) (1,084,887) Amount as re-presented - 30,948
(vii) Employee benefit expenses Amount as previously presented 2,371,883 1,553,913 Reclassified to profit/floss) on investment contracts (41,382) (41,382) Amount as re-presented 2,330,501 1,512,531
(viii) Other operating expenses Amount as previously presented 4,929,240 3,495,725 Reclassified to profit/(loss) on investment contracts (165,530) (165,530) Amount as re-presented 4,763,710 3,330,195
(ix) Profit/(loss) on investment contracts Amount as previously presented - - Reclassified from investment income (2,614,925) (2,614,925) Reclassified from Net fair value gain on assets at fair value (131,736) (131,736) Reclassified from underwriting expense 579,144 579,144 Reclassified from interest expense 1,084,887 1,084,887 Reclassified from employee benefit expense 41,382 41,382 Reclassified from other operating expense 165,530 165,530
(875,718) 875,718
Amount as re-presented


(OTHER NATIONAL DISCLOSURES)
AppendixtoFINANCIALSTATEMENTS

RC 7588
www.leadway.comAnnual Report & Accounts 2016136
Value Added Statement (All amounts in thousands of Nigerian Naira unless otherwise states)
Group 2015 %
Gross premium income (Local) 46,640,828 Investment income - Local 12,210,264 Other income 3,617,631 - Local
Reinsurance, claims, commission & operating expenses
- Local (41,918,632) - Foreign (8,450,036)
Applied to pay: Employee benefit expense 2,371,883 20% Government as tax 413,974 3% To providers of finance To lenders 30,948 0%
Retained in the business
Depreciation of Property and equipment 443,335 4%
Amortization of intangible assets 128,407 1%
To augment reserve 7,861,508 65%
To pay proposed dividend 850,000 7%
Company 2015 %
46,648,918
9,955,505
1,041,750
(40,700,055) (8,450,036)
1,553,913 19% 105,012 1%
- 0%
358,251 4% 98,977 1%
5,529,929 65% 850,000 10%
Company 2016 %
52,718,567
10,490,455
10,736,521
(55,929,087) (8,184,898)
1,989,513 19% 699,492 7%
- 0%
396,878 4% 83,718 2%
5,811,957 59% 850,000 9%
%
52,700,272
10,762,301
14,885,700
(57,593,947) (8,184,898
3,331,627 27% 1,206,754 9%
155,829 1%
618,157 5% 113,883 1%
6,293,178 50% 850,000 7%
Group 2016
Value added 12,100,055 100
(8,496,082) 100
9,831,558 100
12,569,428 100
Value added 12,100,055 100% 8,469,082 100% 9,831,558 100% 12,569,428 100%

OVERVIEWBUSINESSREVIEW GOVERNANCE
GROUP FINANCIALSTATEMENTS APPENDIX
137www.leadway.comAnnual Report & Accounts 2016
STATEMENT OF FINANCIAL POSITION
Group 2015 2014 2013 Cash and cash equivalents 17,031,040 13,681,394 Trade receivables 543,971 63,665 Investment securities 92,403,910 56,329,183 Reinsurance assets 11,405,947 15,883,296
Deferred acquisition cost 423,123 428,964
Other receivables and prepayments 2,281,698
1,191,812
Loans and advances 1,919,857 1,220,651 Property and equipment 5,977,671 5,693,635 Investment properties 9,537,000 7,800,000 Investment in associates - 1,516,753 Deferred tax assets 114,129 200,235 Intangible assets 3,640,910 145,898
2016 26,018,694
169,761 113,593,442
11,720,783
486,416
2,137,103
2,463,338 6,063,939 8,820,070
- 286,446
3,899,894
FIVE YEAR FINANCIAL SUMMARY (All amounts in thousands of Nigerian naira unless otherwise stated)
20,568,804 16,685,999
Statutory deposits 500,000 500,000
Liabilities Trade payables
2,714,107 5,761,236 17,486,929 5,466,790 Current tax liabilities 1,122,772 746,198 863,865 369,469 Other liabilities 5,355,278 3,525,484 2,960,843 3,225,299 Borrowings 118446 60,000 115,831 326,839 Insurance contract liabilities 93,785,535 62,024,023 49,665,623 35,557,630 Investment contract liabilities 15,459,507 12,665,763 11,106,336 10,293,658 Deferred tax liabilities 741,772 1,153,404 833,214 580,128
Capital and reserves Issued and paid share capital 4,389,798 4,389,798 4,389,798 4,389,798 Share premium 387,826 387,826 387,826 387,826 Contingency reserve 6,790,001 5,537,908 4,779,161 3,860,340 Retained earnings 10,838,357 4,092,358 2,988,579 1,367,448 Assets revaluation reserves 1,561,569 1,335,947 767,521 341,320 Fair value reserves 503,438 1,945,833 3,975,180 2,055,690 Other reserves (80,217) (80,780) (80,995) (80,995)
Nan controlling interest 2,091,067 1,110,488 962,748 707,915
Total equity and liabilities 145,779,256 104,655,486 101,202,459 68,849,155
Total Equity 26,481,839 18,719,378 18,169,818 13,029,342
Shareholders’ funds: 24,390,772 17,608,890 17,207,070 12,321,427
Total liabilities 119,297,417 85,936,108 83,032,641 55,819,813
Total assets 145,779,256 104,655,486 101,202,459
68,849,155
2,754,639 1,535,019 8,964,205
204,623 104,757,646 18,294,287
825,997
4,682,450 4,233,748 8,238,232
15,624,296 1,603,053 1,859,503
(79,688)
2,661,876
176,159,886
500,000
38,823,470
36,161,594
137,336,416
176,159,886

RC 7588
www.leadway.comAnnual Report & Accounts 2016138
Five Year Financial Summary (cont'd)(All amounts in thousands of Nigerian Naira unless otherwise stated)
COMPANY 2015 2014 2013 2012
Assets
Cash and cash equivalents 14,656,941 13,046,165 21,119,684 10,441,485
Trade receivables 543,971 63,665 1,060,362 822,364
Investment securities 91,511,039 56,134,365 42,899,645 27,969,458
Reinsurance assets 11,405,947 15,883,296 20,568,804 16,685,999
Deferred acquisition cost 423,123 428,964 332,237 397,319
Other receivables and prepayment
1,114,898 661,101 191,917 1,683,973 Loans and advances 1,217,079 1,129,468 1,283,430 -
Property and equipment 3,760,439 3,627,637 3,154,172 4,141,562
Investment properties 8,795,000 7,450,000 4,550,000 2,215,000
Investment in subsidiaries 3,294,467 541,258 541,258 541,258
Investment in associates - 788,209 788,209 788,209
Deferred tax assets 114,129 200,235 - -
Intangible assets 31,308 130,285 172,033 118,060
Statutory deposits 500,000 500,000 520,000
Liabilities
Trade payables 2,714,107 5,761,236 17,486,929 5,466,790
Current tax liabilities 651,998 672,859 750,533 242,534
Other liabilities 3,895,636 2,552,426 2,080,333 2,305,320
Insurance contract liabilities 93,785,535 62,024,023 49,665,623 35,557,630
Investment contract liabilities 15,459,507 12,665,763 11,106,336 10,293,658
Deferred tax liabilities 556,356 945,541 604,826 472,229
Capital and reserves
Issued and paid share capital 4,389,798 4,389,798 4,389,798 4,389,798
Share premium 387,826 387,826 387,826 387,826
Contingency reserve 6,481,209 5,537,908 4,779,161 3,860,340
Retained earnings 7,232,879 2,646,251 1,345,421 943,741
Assets revaluation reserves 1,294,941 1,041,086 584,120 341,320
Fair value reserves 518,549 1,959,931 3,980,845 2,063,501
Other reserves - - - -
500,000
2016
24,189,697
169,761
111,041,245
11,720,783
486,416
1,115,754 797,368
3,645,335
8,159,419
3,637,495
-
286,446
313,804
500,000
2,754,639
900,143
7,097,390
104,757,646
18,294,287
728,673
4,682,450
4,233,748
7,839,002
11,537,043
1,363,442
1,875,060
-
Total assets 137,368,341 100,584,648 97,161,751 66,324,687
166,063,523
Total liabilities 117,063,139 84,621,848 81,694,580 54,338,161 134,532,778
Shareholders funds: 20,305,202 15,962,800 15,467,171 11,986,526
Total equity and liabilities 137,368,341 100,584,648 97,161,751 66,324,687
31,530,745
166,063,523

OVERVIEWBUSINESSREVIEW GOVERNANCE
GROUP FINANCIALSTATEMENTS APPENDIX
139www.leadway.comAnnual Report & Accounts 2016
Five Year Financial Summary (cont'd)(All amounts in thousands of Nigerian Naira unless otherwise stated)
Group 2015 2014 2013 2012
Gross premium written 46,640,828 38,969,943 41,751,459 36,920,537 Premium earned 39,939,075 29,863,524 14,176,000 13,036,325 Profit before taxation 9,301,030 3,362,899 4,199,486 1,431,677 Taxation (413,974) (707,539) (1,164,308) (275,956) Profit for the year 8,887,056 2,655,360 3,035,17 8 1,155,721 Transfer to contingency reserve (1,031,113) (758,747) (918,820) (916,618)
2016
52,700,272
41,256,760
8,791,606 (1,206,754)
7,584,852
(1,448,231)
COMPANY 2015 2014 2013 2012
Gross premium written 46,648,918 39,008,139 41,752,673 36,920,537 Premium earned 39,947,165 29,901,721 14,177,214 13,036,325 Profit before taxation 6,484,941 3,394,793 2,732,306 826,489 Taxation (105,012) (585,215) (1,014,227) (152,920) Profit after taxation 6,379,929 2,809,578 1,718,079 673,569 Transfer to contingency reserve (943,301) (758,747) (918,820) (916,618) Earnings per share (kobo) 73 32 20 8
2016
52,718,567
41,275,055 7,361,449
(699,492 ) 6,661,957
(1,357,793)
72
Earnings per share (kobo) 108 32 36 13
84

RC 7588
www.leadway.comAnnual Report & Accounts 2016140
Non-Life Business Statement of Financial Position As at 31 December 2016(All amounts in thousands of Nigerian Naira unless otherwise stated)
Investment securities 14,994,143 Trade receivables 541,477 Reinsurance assets 11,113,773 Deferred acquisition cost 423,122 Loans and other receivables 929,676 Investment in subsidiaries 340,946 Investment properties 3,400,000 Deferred tax assets 55,493
20,417,525 164,616
11,384,279 486,416 315,791 683,974
3,134,223 198,765
Intangible assets 19,869 Property and equipment 3,312,350 Statutory deposits 300,000 Total assets 44,250,068 Liabilities Insurance contract liabilities 24,030,217 Trade payables and other liabilities Current tax liabilities 5,008,219 Deferred tax liabilities 374,781 Liabilities 453,896 Total liabilities 29,867,113 Capital and reserves Share capital 3,139,798 Share premium 387,826 Contingency reserve 5,439,709 Retained earnings 3,380,964 Asset revaluation reserve 1,213,714 Fair value reserves 820,944
Shareholders’ funds: 14,382,955 Total equity and liabilities 44,250,068
312,306 3,153,362
300,000
60,467,302
30,572,177 8,226,443
647,887 597,158
40,043,665
3,139,798 387,826
6,481,612 7,548,576 1,202,237 1,663,588
20,423,637
60,467,302
Assets
31-Dec-15
Cash and cash equivalents 8,819,219
31-Dec-16
19,916,045

OVERVIEWBUSINESSREVIEW GOVERNANCE
GROUP FINANCIALSTATEMENTS APPENDIX
141www.leadway.comAnnual Report & Accounts 2016
Non – life Business Income Statement For the year ended 31 December 2016(All amounts in thousands of Nigeria Naira unless otherwise stated)
Assets Gross premium written 15,434,045 Add: reduction in unearned premium 4,078,890 Gross insurance premium revenue 19,512,935 Reinsurance expense (10,899,216)
31-Dec-15 31-Dec-16 21,129,613
410,354 21,539,967
(12,213,623)
Claims expenses (4,425,413) Underwriting expenses (2,034,621) Net underwriting expenses (6,460,034) Total underwritten profit 3,031,317 Investment income
1,561413 Net fair value gain/floss) on assets at fair value 904,172 Other operating income 911,719 Employee benefit expenses and other operating expenses (3,618,484)
Finance cost - Net impairment gains/(losses) 199,615
Other comprehensive income: Fair value changes on available for sale financial assets (1,021,627) Net amount transferred to income statement - Revaluation gain on land & building 238,495
(241,180)
Profit before tax 2,989,752
Net insurance premium earned 8,613,719 Commission income 877,632 9,491,351
Other comprehensive income for the year, net of tax 783,132 Total comprehensive income 2,269,945
Income TaxesProfit for the Year 3,053,077
63,325
(10,023,855) (3,238,505)
(13,262,360)
2,110,641
2,100,826
(208,587) 10,086,595 (4,016,532)
-
(27,520)
872,996 (30,353) (11,477)
7,962,302
5,824,142
9,326,344
1,825,376
11,151,720
831,166
6,040,682
5,209,516(614,626)

RC 7588
www.leadway.comAnnual Report & Accounts 2016142
Non – life Business Revenue Account For the year ended 31 December 2016 (All amounts in thousands of Nigerian Naira unless otherwise stated)
MOTOR FIRE GEN. ACC MARINE BOND INCOME
Less: Increase/(decrease) in unearned premium
(61,872) (207,343) (107,456) 36,332 158,171
Gross premiums earned 2,840,012 2,393,483 1,075,825 1,187,164 872,222 Reinsurance cost (112,981) (1,484,392) (147,411) (278,740) (485,709) Net premium earned 2,727,031 909,091 928,414 908,424 386,513 Commission earned 39,351 245,385 21,100 75,113 96,207 Total underwriting income 2,766,382 1,154,476 949,514 983,537 482,720 EXPENSES Gross claims paid (2,083,473) (2,370,270) (380,462) (459,370) (587,519) Increase/(decrease) in outstanding claims provision
(189,691) (708,774) (140,936) (403,542) 64,968
Gross claims incurred (2,273,164) (3,079,044) (521,398) (862,912) (522,551)
Deduct: reinsurance claims recoveries/recoverable 192,549 1,976,878 134,013 349,411 36,383 Ne claims incurred (2,080,615) (1,102,166) (387,385) (513,501) (486,168) Add: underwriting expenses: Commission expenses (336,759) (457,917) (290,672) (192,743) (12,506) Acquisition expenses (182,289) (133,269) (105,688) (59,616) (45,124) (519,048) (591,186) (396,360) (252,359) (57,630) total expenses and claims incurred (2,599,663) (1,693,352) (783,745) (765,860) (543,798)
Gross premium written 2,901,884 2,600,826 1,183,281 1,150,832 714,051
Underwriting profit/(loss) 166,719 (538,876) 165,769 217,677 (61,078)

OVERVIEWBUSINESSREVIEW GOVERNANCE
GROUP FINANCIALSTATEMENTS APPENDIX
143www.leadway.comAnnual Report & Accounts 2016
Non – life Business Revenue Account (Cont’d) For the year ended 31 December 2016 (All amounts in thousands of Nigerian Naira unless otherwise stated)
(232,280) (502,410)
14,061 (5,588,401)
(6,615,784)
(6,952,315)
(5,637,924)
(744,971)
(218,219) (6,090,811)
38,016 816,994 (180,203) (5,273,818)
(150,367) -
(43,775)
(1,227,780)
(194,142)
(1,227,780)
(374,345)
(6,501,598)
270,053
(2,330,903)
(13,568,099)
3,544,244 (10,023,855)
(1,440,964)
(1,797,541)
(3,238,505)
(13,262,360)
(2,110,639)
(6,382,895)
1,957,482 (4,425,413)
(1,390,404)
(644,217)
(2,034,621)
(6,460,034)
3,031,316
ENGINEERING SPECIAL RISK
953,269 11,625,470
(137,599)
730,122
815,670
12,355,592
(255,484)
(9,448,906)
560,l86 2,906,686
84,212 1,264,008
644,398 4,170,694
2016 TOTAL
21,129,613
410,354
21,539,968
(12,213,623)
9,326,345
1,825,376
11,151,721
2015 TOTAL
15,434,045
4,078,890
19,512,935
(10,899,217)
8,613,718
877,632
9,491,350

RC 7588
www.leadway.comAnnual Report & Accounts 2016144
Financial PerformanceFor the year ended 31 December 2016 (All amounts in thousands of Nigerian Naira unless otherwise stated)
Gross Premium 15,434,045 37% Net Premium 8,613,719 8% Total Underwriting Income 9,491,351 17% Investment Income 1,561,413 35% Claims expenses (4,425,413) 127% Annuity Claim - 0% Underwriting expenses (2,034,621) 59% Underwriting Profit 3,031,317 -170% Operating expenses (3,618,484) 11% Profit before tax 2,989,752 95%
Using Gross Written premium Using net written premium Underwriting expenses ratio 13% 24% Claims ratio 29% 51% Operating expenses ratio 23% 42% Combined ratio 65% 117% Underwriting profit ratio 20% 35%
Performacne ratios
21,129,613 9,326,344
11,151,720 2,100,826
(10,023,855) -
(3,238,505) (2,110,641) (4,016,532) 5,824,142
15% 47% 19% 82%
-10%
35% 107% 43%
185% -23%
31-Dec-16 31-Dec-15 31-Dec-16 31-Dec-15
Earnings per share 53 kobo
53 kobo
Non Life Business
31-Dec-15 % change 31-Dec-16

OVERVIEWBUSINESSREVIEW GOVERNANCE
GROUP FINANCIALSTATEMENTS APPENDIX
145www.leadway.comAnnual Report & Accounts 2016
Life Business Statement of Financial Position As at 312 December 2016
(All amounts in thousands of Nigerian Naira unless otherwise stated)
Liabilities Insurance contract liabilities 69,755,317 Investment contract liabilities 15,459,506 Trade payables and other liabilities 2,198,276 Retirement benefit obligation - Current tax liabilities 277,218 Deferred tax liabilities 102,458
74,185,466 18,294,288 1,883,176
- 252,256 131,504
Total liabilities 87,792,775 Capital and reserves Share capital 1,250,000 Share premium - Contingency reserve 1,041,500 Retained earnings 3,851,917 Asset revaluation reserve 81,227 Fair value reserves (302,397) Shareholders’ funds 5,922,247 Total equity and liabilities 93,715,022
94,746,690
1,542,653 3,845,922 1,357,390 3,988,471
161,204 211,472
11,107,112
105,853,802
Assets 31-Dec-15 Cash and cash equivalents 5,837,723 Investment securities 76,516,894 Trade receivables 2,493 Reinsurance assets 292,175 Deferred Acquisition Cost - Loans and other receivables 1,999,050 Investment in associates - Investment in subsidiaries 2,953,521 Investment properties 5,395,000 Deferred tax assets 58,635 Intangible assets 11,440 Property and equipment 448,091 Statutory deposits 200,000 Total assets 93,715,022
31-Dec-16 4,273,651
90,623,722 5,145
336,504 -
1,854,912 -
2,953,521 5,025,196
87,682 1,498
491,971 200,000
105,853,802

RC 7588
www.leadway.comAnnual Report & Accounts 2016146
Life Business Income StatementFor the year ended 31 December 2016(All amounts in thousands of Nigerian Naira unless otherwise stated)
31-Dec-15 Gross premium written 31,214,873 Add: reduction in unearned premium Group life 344,764
Reinsurance expense (184,774) (226,190)
Commission income
Gross benefits and claims paid (12,563,339) Increase in annuity fund Increase in individual life fund (42,413) Claims ceded to reinsurance 26,978 Gross change in contract liabilities (502,710) Underwriting expenses (1,803,146)
31,588,954544,531
(4,429,557)
31-Dec-16
(184,774)
(12,563,339) (9,058,253)(33,954,433)
(42,413) (570,961)(26,978) (677,101)
(502,710) (203,691)(1,803,146) (2,922,136)
Gross insurance premium revenue 31,559,637 32,133,485
477 28,862 28,477 Total revenue 31,977,188 31,362,309
Net insurance premium earned 31,333,447
31,948,711
Net underwriting expenses (47,386,574) Total underwriting profit 12,663,000 (16,024,265) Investment income 8,393,381 Profit/(Loss) on investment contracts (355,520) 875,718 Net fair value gain/(loss) on assets at fair value 13,983,819 Other operating income 649,927 130,743 Employee benefit expenses and other operating expenses (1,431,155) Result of operating activities 21,952,506 Finance cost - (1,084,887) Net impairment gains/losses) (343,410) (472,443) Profit/(loss) before tax 1,537,310 4,370,910 Income taxes (168,337) Profit/(loss) for the year 1,452,444 4,202,573 Other comprehensive Income Fair value changes on available for sale financial assets (419,755) Foreign exchange difference on unquoted financial assets - - Revaluation gain on land and building 79,977 15,360 Other comprehensive income for the year, net of tax 593,846 (404,395) Total comprehensive income 2,046,290 3,798,178
(19,314,188)
8,389,629
(17,207,088)
(2,259,228)
(10,782,280)
(84,866)
513,868
(343,410)
(355,520)
1,537,310
79,977

OVERVIEWBUSINESSREVIEW GOVERNANCE
GROUP FINANCIALSTATEMENTS APPENDIX
147www.leadway.comAnnual Report & Accounts 2016
Life Business Revenue Accounts For the year ended 31 December 2016(All amounts in thousands of Nigerian Naira unless otherwise stated)
Income Gross premium written 1,026,879 2,443,032 28,119,043 31,214,873 Decrease in unearned income - - - Gross premium Income 1,026,879 2,443,032 28,119,043 31,214,873
Reinsurance expenses (25,578) (159,195) - (226,190)
Premium retained 1,001,301 2,283,836 28,119,043 30,988,683
Commissions earned 30 28,447 - 28,862 Investment income 114,715 272,918 7,398,939 5,407,954 Fair value gain/ (loss) on annuity bond (25,820) (61,428) (15,904,469) (15,991,717) 13,084,323 Gain/(loss) on Investment property (43,012) (102,329) (350,368) 60,715 Other income 28,582 67,999 551,115 146,197
Total income 1,075,796 2,489,442 19,814,259 49,716,734
Direct claims paid (810,248) (1,526,922) (628,421) (2,933,092) Surrenders - (85,622) Annuity payments - - (9,597,747) (6,039,540) Increase/(decrease) in outstanding claims
- - - -
Gross claims incurred (810,248) (1,526,922) (10,226,168) (12,563,338) (9,058,254)
Deduct: Reinsurance claims recoveries/recoverables
- 26,978 - (677,101)
Provision for Outstanding Claims (143,703) (317,261) (41,746) (203,691)
Net claims incurred (953,951) (1,817,205) (10,267,914) (13,039,070) (9,939,045) Provision for unexpired risk (42,413) 544,531 (4,429,557) (34,180,631) Acquisition expenses (509,192) (493,661) (1,211,246) (1,869,713) Maintenance expenses (6,250) (991) (171,131) (790,703) Operating expenses (654,787) (708,989) (306,129) (808,964)
Total expenses (2,166,593) (2,476,315) (16,385,977) (21,028,885) (47,589,056) Underwriting result (1,090,797) 13,127 3,428,282 2,127,678
31,588,954
- 31,588,954
(184,773)
31,404,181
28,477
7,786,572
(495,709) 647,696
23,379,500
(2,965,591)
- (9,597,747)
-
26,978
(502,710)
(3,927,439) (2,214,099)
(178,372) (1,669,905)
2,350,615
Individual Life
Group Life
Annuity
2015 Total
2016 Total

RC 7588
www.leadway.comAnnual Report & Accounts 2016148
Revenue Account on Deposit Administration For the year ended 31 December 2016(All amounts in thousands of Nigerian Naira unless otherwise stated)
www.leadway.comAnnual Report & Accounts 2016
31-Dec-15 Income Investment Income 1,522,814 Gains/floss) from sale of investment 1,092,111 Valuation gain on property 255,254 Unrealised gains/loss from investment (123,518)
Acquisition expenses 385,852 Maintenance cost 193,292 Interest on Deposit Administration 1,084,887 Management Expenses 206,912 1, 870,943
PROFIT/(LOSS) FROM DEPOSIT ADMINISTRATION 875,718
Other income - 2,746,661 Expenses
31-Dec-16
2,158,331 5,625
(260,404) (341,886)
256,829 30,742
1,436.673 392,041
2,116,285
(355,520)
199,099
1,760,765

OVERVIEWBUSINESSREVIEW GOVERNANCE
GROUP FINANCIALSTATEMENTS APPENDIX
149www.leadway.comAnnual Report & Accounts 2016
Financial Performance For the year ended 31 December 2016(All amounts in thousands of Nigerian Naira unless otherwise stated)
www.leadway.comAnnual Report & Accounts 2016
Life Business
31-Dec-15 % change Gross Premium 31,214,873 1% Net Premium 31,333,447 2% Total Underwriting Income 31,362,309 2% Investment Income 8,393,381 0% Claims expenses (2,933,092) 1% Annuity Claim (6,039,540) 59%Underwriting expenses (2,922,136) -38%Underwriting Profit (16,024,265) -179%Operating expenses (1,431,155) 58%Profit before tax 4,370,910 -65%
Earnings per share 1.3 kobo
Performance ratios
Using Gross Written premium et written premium
31-Dec-15 31-Dec-15
Underwriting expenses ratio 9% 9% Claims ratio 9% 9% Operating expenses ratio 5% 5% Combined ratio 23% 23% Underwriting profit ratio 9% 9%
31-Dec-16 31,588,954
31,977,188 8,389,629
(2,965,591) (9,597,747) (1,803,146) 12,663,000 (2,259,228) 1,537,310
1.3 kobo
31,948,711
31-Dec-16
6% 9% 7%
22% 6%
Using n
31-Dec-16
6% 9% 7% 22% 6%

RC 7588
www.leadway.comAnnual Report & Accounts 2016150
Life Business Annuity statement As at 31 December 2016(All amounts in thousands of Nigerian Naira unless otherwise stated)
Leadway Assurance Company
PRA Regulated Annuities 62,076,429 5,177,605 6,416,504Annuities Certain 570,806 88,045 -
Annuity Liabilities. Investment Income and Pay Out.
Title Liability As At 31st December 2016
(N’000)
Investment Income
(N’000)
Pay Out
(N’000)
Annuities' Portfolio at 31st December 2016 Annuity Business by nature, type and their operation.
Title Number of Policies Classification Operations Procedure PRA Regulated Annuities 13,502 Risk Quotation; Provisional Agreement;
NAICOM Approval; Premium Remittance By PFC; Despatch Policy Document; Administration
Annuities Certain 65 Risk Quotation; Premium Remittance: Despatch Policy Document; Administration
NOTE: The information above corresponds with the report of the Actuarial Valuation as at 31st December 2016The assets backing Annuity Funds are as follows:
S/N ASSETS TYPE ANNUITY ANNUITY CERTAIN
(N’000) % (N’000) % 1 Money Market 1,545,360 2 39,542 8 0 Quoted Shares 396,965 1 80,405 16 3 Corporate Bonds 1,867,554 3 50,838 10 4 FGN/State Bonds 55,195,498 88 324,680 66 5 Real Estate 1,967,345 3 0 - 6 Unquoted Securities 2.000,000 3 0 - 7 Loans to Policy Holders 79,047 0 - -
TOTAL 63,051,769 100 495,565 100

OVERVIEWBUSINESSREVIEW GOVERNANCE
GROUP FINANCIALSTATEMENTS APPENDIX
151www.leadway.comAnnual Report & Accounts 2016
147www.leadway.comAnnual Report & Accounts 2016
Leadway At A Glance
YEAR OF INCORPORATION: - 1970
COMMENCEMENT OF OPERATIONS: - 1971
FINANCIAL YEAR END st - 31 December
SHAREHOLDERS' FUNDS - N 31.5 Billion (as at 31 December 2016)
TOTAL ASSET BASE - N 166 Billion (as at 31 December 2016)
CLASSIFICATION: - All classes of Insurance, Managed Funds & Trusteeship
NUMBER OF BRANCHES: - 22 (excluding Registered Office & Corporate Office)
SUBSIDIARIES: - Leadway Capital and Trusts Limited Leadway Properties & Investments Ltd. Leadway Hotels Limited Leadway Pensure PFA Limited
NUMBER OF EMPLOYEES: - 291 (as at December 31, 2016)
FOUNDER: - Sir Hassan O. Odukale (1926-1999)
DIRECTORS: - Mallam Umar Yahaya – Chairman (retired w.e.f 30 March 2016) - Gen. Martin Luther Agwai – Chairman (appointed w.e.f 10 November 2016) - Mr. Oye Hassan-Odukale, MFR – Managing Director - Mr. Tunde Hassan-Odukale – Executive - Ms. Adetola Adebayi – Executive - Mr. Jeremy Rowse – Non-Executive - Dr. Konyinsola Ajayi – Non- Executive (retired w.e.f 30 March 2016) - Dr. A, B. C. Orjiako – Non- Executive (retired w.e.f 30 March 2016) - Mrs. Mowunmi Sotubo – Non-Executive - Mr. Eugene Curley - Non-Executive (appointed w.e.f 5 May 2016) - Mr. Seyi Bickersteth – Non-Executive (appointed w.e.f 1 Jan 2016) - Mr. Odein Ajumogobia – Non-Executive (appointed w.e.f 1 Jan 2016)
MANAGEMENT: - Mr. Oye Hassan-Odukale, mfr - Managing Director / CEO - Mr. Tunde Hassan-Odukale - ED - Financial Services and IT Systems - Ms. Adetola Adegbayi - ED - General Business - Mr. Tinashe Muyambo - Head of Life Business - Mr. Adebayo Okuwobi - Divisional Director / Head, Life Commercial - Mr. David A. Onilado - Divisional Director / Chief Finance Officer - Mr. Adetayo A. Adekunle - Divisional Director / Head of Technical - Mr. Temilolu Aduloju - Divisional Director / Chief Compliance Officer - Mr. Gboyega Lesi - Divisional Director / General Business Commercial - Mr. Allan Olufade – Divisional Director/ Abuja/Northern Offices - Mrs. Kunbi Adeoti - Divisional Director / Head Human Resources
COMPANY SECRETARY - Mr. Sunday Oroleke

Leadway Hotels Limited
Leadway Hotels Limited, incorporated March 2005, is a subsidiary of Leadway Assurance Company Limited and an up-and-coming player in the hospitality industry in Nigeria.It aims to become a distinctly recognized brand in the hospitality and service industry.
Leadway Hotels Limited is dedicated to quality and services and has a reputation for service efficiency and customers' reliability. For almost a decade, the Leadway Hotels Limited, has honoured its hospitality commitments and has earned its reputation of excellence in this regard. All aspects of the business are approached with discipline; the recruitment of staff, the advancement of technologies and the corporate/personal service offered to its growing clientele.
Under its umbrella are three notable and thriving businesses in Lagos and Abuja, namely, Leadway Hotel in Ikeja, Léola Suites and Panache Restaurant , both in Abuja.
One of the strengths of the group is its ability to effectively coordinate these businesses with innovative prowess which is helping it carve a niche within the hospitality industry in Nigeria. These are evident in the excellent local and international cuisine offered to its diverse guests. Its Restaurants boasts of a menu selection that is varied enough to cater for all tastes.
Where Elegance And Service Is A Priority!
Operating Address:Leadway Hotel,Ikeja1 Mugambo Close, Maryland Estate, Lagos. Nigeria.Tel:+2341 2790800/0802/0803/0806, Fax:+2341 2790801,E-mail: [email protected]
Leola Suites/Panache RestaurantLeadway House (near NNPC Towers)1061 Herbert Macaulay WayCentral Business DistrictAbuja,Nigeria.
Leadway Capital & Trusts Limited RC268,275
Leadway Capital & Trusts was incorporated as Leadway Trustees Limited in 1995 but its services became commercial in 1999. To operate within the capital market, the company registered with the Securities and Exchange Commission in year 2000 and has maintained its registration since then.
Leadway Capital & Trusts Limited is a subsidiary of Leadway Assurance Company Limited, one of the foremost insurance service providers in Nigeria. The reputation enjoyed by the Leadway Group has been attained and sustained by the pursuit of improvements to maintain competitive advantage. All aspects of the business are approached with discipline - the recruitment of staff, development of products, use of advanced technology to final service delivery.
Since incorporation, the company has provided and is still providing corporate and personal trusteeship services in diverse arrangements. Specifically, Leadway Capital & Trusts Limited provides professional services in the following areas:
· Trusts of Consortium Lending · Debenture Trusts · Unit Trusts and Mutual Funds · Mortgage Trusts · Investment Trusts · Leasing Trusts · Employee Share Ownership Trusts· Custodian Trusteeship· Nominee Shareholding Management of other Trusts as Endowments, Foundations and Co-operatives· Preparation of Wills· Living Trusts · Education Trusts · Public Trusts
Services also provided are Short Term Financing for pre-qualified transactions, Equipment Leasing to select Corporate Bodies, as well as Investing in varied transactions where management finds it expedient.Leadway Capital and Trusts Limited is able to tap into the resources and over 45-year experience of its parent company, Leadway Assurance Company Ltd.
Address: 121/123 Funso Williams Avenue, Iponri, Surulere, Lagos; P.O. Box 6437, Marina, Lagos Tel: E-mail: Website: 01-2700700 Fax: 01-2700800, [email protected], www.leadway.com
Leadway Subsidiaries
RC 7588
www.leadway.comAnnual Report & Accounts 2016152

Branch OfficesCorporate Office121/123 Funso Williams Avenue, Iponri. Lagos01-2700700
Registered OfficeOdeniyi KayodeNN28/29 Constitutional Road,Kaduna08129997127
Kaduna Life OfficeAbdulahiQQ10 Wushishi Road By Ahmadu Bello Way,Kaduna08029004779, 08162165062
Ikeja *Komaiya BamideleAdebola House 40, Opebi Road, Opebi. Lagos08129997012
AbujaIbrahim AdetonaLeadway House Plot 1061, Herbert Macaulay Way,Central Business District,Cadastral 08129997114, 08129997115
AbeokutaSalisu BabajideSeriki Fadare Plaza, Beside Nigeria Immigration office, Oke Mosan. Abeokuta 08129997096, 08129997097
CalabarDasilva Taiwo141, Ndidem Usang Iso/Marian Road,Calabar 08129997098, 08129997099
AkureChristopher UgochukwuNACRDB Building, Ado-Owo Road Alagabaka,Akure08129997104, 08129997159
Benin84 Akpakpava Street,Benin City08129997103, 08129997158
EnuguObidigbo OriyomiAkalaka House (2nd floor) 127/129 Chime Avenue New Haven,Enugu.08129997106, 08129997161
Ilorin Adedamola Adeniyi163, Ajase-Ipo.Road,Gaa-Akanbi Junction Road.Anu Oluwapo Complex Ilorin, Kwara 08129997153, 08129997157
Ibadan Akinpelu Taoreed Adekunle25, Morgaji Are Rd, Iyaganku GRA Off Moshood Abiola Way ,Ibadan8129997102, 8129997162
Jos Olowookere Timothy2A Ibrahim Taiwo Rd,GRA Jos08129997122, 08129997123
KanoShadrack BolajiFustan House 25 Zaria Road,Gyadi- Gyadi Round About.Kano08129997112, 08129997168
Makurdi Last Floor, 8 Railway bye pass,High Level, near Zenith bank,Makurdi08129997113
Osogbo Aderibigbe Abayomi2nd floor, Moye HouseKm2,Gbogan /Ibadan Road Oshogbo,Osun State08129997108, 08129997163
Port HarcourtOladele Kayode8 Igbodo Street, Old GRAPort Harcourt08129997109, 08129997110
Sagamu Sobowale Olanrewaju Tojuola136, Akarigbo Street, Opposite Mobil Filling Station Ijokun,Sagamu08129997101, 08129997156
SokotoOmotayo Abdullateef15A, Kano RoadNot Far From Central Of Nigeria,Sokoto.08129997124
UyoEffiong Daniel140, Atiku Abubakar Way,Uyo08129997100, 08129997155
WarriTelufusi OlusolaEcobank Building 60 Effurun/Sapele Road,Opposite Glo/Sterling Bank Warri08129997111, 08129997166
YenagoaImgbi Road Opp.Spring Bank,Amarata08129997105, 08129997160
ZariaOlusola SegunLast floor, UBA building by PZ Kaduna Road Zaria08129997125
Lekki *Folasade KolawoleGarnet Building, Igbo-Efonby 5th round-aboutalong Lekki-Epe Expressway. Lekki. 08129997009Festac *
Nancy RobertRoad, Festac08129997005 * Branches in Lagos, Nigeria.
OVERVIEWBUSINESSREVIEW GOVERNANCE
GROUP FINANCIALSTATEMENTS APPENDIX
153www.leadway.comAnnual Report & Accounts 2016
Corporate Addresses

AGENCY OFFICES
IKOTA agencyShop H408-409,H428-429,Ikota Shopping Complex VGC,Lagos State08055124617, 08033296670
AKURO agencyKnight Frank Building24 Campbell Street,Lagos- Island, Lagos.08033445694
APAPA agency Grace House,13, Abraham Adesanya Road,Apapa.08060650329
Festac AgencyJagundina TolaSame office with main office08033152848
Warri AgencyIlavbare AbubakarSame office with main office08056661602
IGANMU agency 10 Abebe Village road Iganmu,Surulere Lagos08033212166
ADO-EKITI agencyFolagbade ObidiyaPlot 5, Bank Road,Besides Mainstreet Bank,Ado-Ekiti, Ekiti State08061139837
UYO agencyUdoh JosephSame office with main office.08032803450
ENUGU agencyCharity OgbodoSame office with main office08023630090
PORT-HARCOURTJoseph Lawal6 Igbodo Street, Old GRA PortHarcourt08037138917
ABUJA AGENCYIdowu Akinwunmi50 Kumasi CrescentOff Aminu Kano Crescent Wuse II,Abuja.08090678517
AWKA AgencyOrchin Martins1, Ozoagwu Street, Aroma Juction,Akwa Anambra.08038069059
OWERRI AGENCYOnuoha ClementPlot C11, Onitsha Road Lay-out,Control Post. Owerri.08033216542
IKORODU AGENCY Ogunjimi Adenike225/227, Ikorodu Road, Ogolonto,Ikorodu.08023377794
SHERATON-OPEBI LINK AGENCYAdimabua MikeAFRIJET Plaza ,6 Sheraton Link Road,Opposite Western Hotel, Ikeja,Lagos.08023326788
ASABA AGENCYNo 1, Stadium Road/200 Nnebisi Road,Asaba. Delta State.
VICTORIAL ISLAND AGENCYObinna OsujiNo 1, Hopewell Adeola Street,Victoria Island,Lagos
GBOKONo. 11, J.S Tarka Way,Gboko
GOMBEDoma Plaza, 1ST Floor,Room 26, BIU Road,Gombe
YOLASabru House, 30,Mubi Road JimetaYola
KATSINAKaita Shopping Complex building,Nagogo Road,Kastina
LOKOJA AGENCYSuite 24 First floor,Lokongoma Plaza,Along Okene-Kaba Road,Opposite Mountain of Fire,Phase 2 Lokongoma,Lokoja
Corporate Addresses
RC 7588
www.leadway.comAnnual Report & Accounts 2016154


RC 7588

Design: Metrickeeps Creatives 07062173375 | Print: QuickPrintShop | All rights reserved by Leadway Assurance Company Limited