we start with yes. suggested line of text (optional
TRANSCRIPT
Suggested line of text (optional):
WE START WITH YES.
HPC-IODC AND WOPSSS 2018
UNDERSTANDING AND TUNING HPC I/O: HOW HARD CAN IT BE?
erhtjhtyhy
PHIL CARNS Mathematics and Computer Science Division Argonne National Laboratory
June 28, 2018
Frankfurt Germany

A LITTLE ABOUT MYSELF AND MY COLLEAGUES U.S. Department of Energy’s Argonne National Laboratory
2
“Argonne is a
multidisciplinary
science and
engineering
research center”
Advanced Photon
Source
(Under construction:
APS upgrade)
Argonne Leadership
Computing Facility
IBM Blue Gene/Q (Mira)
Cray XC40 (Theta)
(Under construction:
A21 exascale system)
The Mathematics
and Computer
Science department
carries out HPC
research in support
of DOE science.

THE ROLE OF DATA-INTENSIVE COMPUTER SCIENCE RESEARCH (one perspective)
3
Techniques, algorithms,
and software to bridge
the “last mile” between
scientific applications
and storage systems

THE ROLE OF DATA-INTENSIVE COMPUTER SCIENCE RESEARCH (one perspective)
4
This entails:
• Characterizing access
• Modeling architectures
• Building and optimizing
data services
• Putting new technology
into the hands of scientists

OR MORE SIMPLY:
UNDERSTANDING AND TUNING HPC I/O

UNDERSTANDING AND TUNING HPC I/O
6
Observe: instrument applications and systems
Orient: interpret performance data in context
Decide: determine how improve
Act: implement improvements
Can be expressed in
terms of the OODA loop
concept from strategy
and control theory.
Figure by Patrick Edwin Moran

UNDERSTANDING AND TUNING HPC I/O
7
The concept is simple enough, but it may
be difficult to apply to HPC I/O.
This presentation will explore implications, share experiences, and highlight
challenges in understanding and tuning HPC I/O in this conceptual framework.
Can be expressed in
terms of the OODA loop
concept from strategy
and control theory.
Figure by Patrick Edwin Moran

OBSERVE

OBSERVING HPC I/O
9
A wide variety of tools are available for this purpose
They instrument different facets of HPC I/O
– Application behavior
– System behavior
– Resource usage
– Correctness
– External data sources
Data integration frameworks are also maturing
We (as a community) have made considerable strides in scalable
data collection in the past decade, but challenges remain.

CHALLENGES IN OBSERVATION
Both figures above are generated from Darshan data
But the latter mode cannot be enabled at all times due to data collection cost
You always need more data, but sometimes not until after the fact
10
Always-on characterization tools can
routinely provide data like this.
But sometimes you need higher fidelity data to find
the cause of a complex performance problem.
This calls for dynamic
instrumentation based
on policies or triggers
Figures provided by Shane Snyder
https://www.mcs.anl.gov/research/projects/darshan

CHALLENGES IN OBSERVATION
Storage technology is a
moving target. Examples:
– Alternative data models
(not just POSIX)
– Ephemeral namespaces
and resources
– Non-volatile memory
Emerging technology
11
Consider the (excellent) PMDK package for NVM access
9 libraries, 2 utilities, 0 performance instrumentation hooks!
We can’t wrap load/store operations with interception libraries
Screenshot from
https://github.com/pmem/pmdk

CHALLENGES IN OBSERVATION
One way to mitigate this problem is through modularity in instrumentation tools
Still doesn’t (by itself) tell you how to instrument pmem or a new data model
But prevents us from re-inventing the wheel for scalable data collection
Emerging technology
12

ORIENT

ORIENTING (INTERPRETING) HPC I/O DATA
I/O performance can be misleading in isolation
Must be considered in the context of application and system capabilities
State of the art for assessing system capabilities:
– Benchmarks
• Hero runs, synthetic workloads, proxy applications
– Comparison against historical trends
• Time series data, especially from systems
– Vendor specifications
– I/O modeling
Do these things give us sufficient experience to orient our observations?
Could users apply a roofline model that incorporates I/O activity?
14
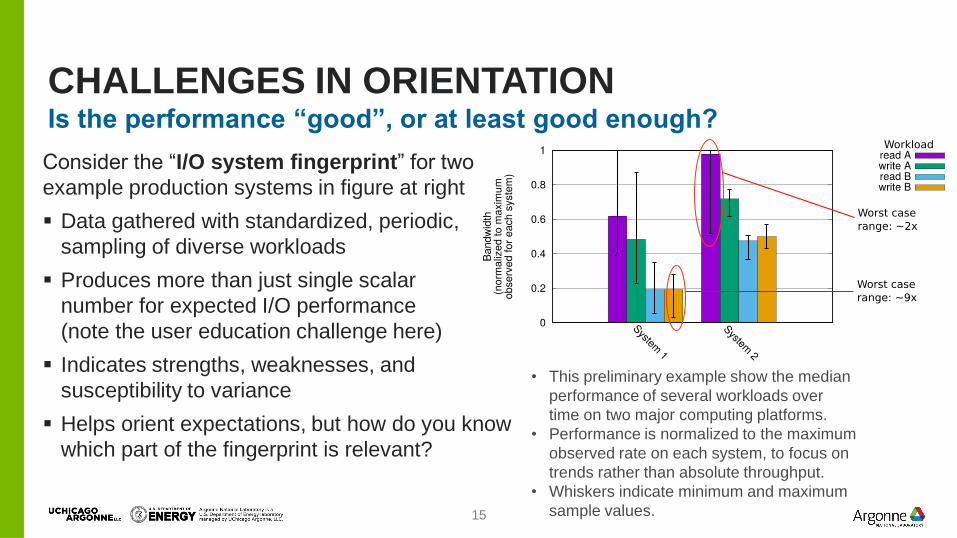
CHALLENGES IN ORIENTATION Is the performance “good”, or at least good enough?
15
Consider the “I/O system fingerprint” for two
example production systems in figure at right
Data gathered with standardized, periodic,
sampling of diverse workloads
Produces more than just single scalar
number for expected I/O performance
(note the user education challenge here)
Indicates strengths, weaknesses, and
susceptibility to variance
Helps orient expectations, but how do you know
which part of the fingerprint is relevant?
• This preliminary example show the median
performance of several workloads over
time on two major computing platforms.
• Performance is normalized to the maximum
observed rate on each system, to focus on
trends rather than absolute throughput.
• Whiskers indicate minimum and maximum
sample values.

CHALLENGES IN ORIENTATION
The above heatmap shows the relative performance of 8 benchmarks on 2
large systems for 1 year: Light=good, dark=bad, gray=N/A
Something changed in August 2017! Better at some things, worse at others
System behavior changes, even when expectations do not
16
Glenn Lockwood et al., “A year in the life
of a parallel file system”, to appear at SC18

CHALLENGES IN ORIENTATION
Implications? We must reorient if the system behavior changes.
Expectations (and more formally, models) don’t necessarily hold forever.
This example was a sudden change; gradual changes are common as well.
System behavior changes, even when expectations do not
17
Glenn Lockwood et al., “A year in the life
of a parallel file system”, to appear at SC18

DECIDE

DECIDING WHAT TO DO
Who has responsibility when we determine that behavior XYZ is bad?
1. Meet the users where they are: procure systems optimized for XYZ
2. Have the users come to you: change applications to avoid XYZ
3. Middle ground: some of both, system tuning and application tuning
There’s an interesting causality problem here: are users selecting the I/O strategy
that they want (in many cases enabled by high level libraries), or the I/O strategy
that they think the system can handle?
Decision process
– Ideally not just ad-hoc or based on expert intuition
– Follow previous successful patterns
– Even better, use I/O models to predict the impact of changes
19

CHALLENGES IN DECISION
Can we automate this?
– E.g. machine learning based
performance models
Different applications, even on the same
system, have different responses to system
and tuning parameters
Figure at right shows the relative feature
importance for 14 parameters in 4
application classes on an example system
Some sensitive to metadata, background
I/O, etc. to varying degrees
It’s not easy to project impact
20
Sandeep Madireddy et al., “Machine Learning Based
Parallel I/O Predictive Modeling: A Case Study on
Lustre File Systems”, ISC 2018.
Server CPU load System write traffic Example metrics:

CHALLENGES IN DECISION
Interactions between components are subtle
Interactions between components differ for
each application
It may be difficult to predict the impact of a
tuning change
21
Sandeep Madireddy et al., “Machine Learning Based
Parallel I/O Predictive Modeling: A Case Study on
Lustre File Systems”, ISC 2018.

ACT

ACTING ON THE DECISION
After observing, orienting, and deciding, it is time to act!
Constraints: some theoretical optimizations cannot be implemented in practice
– Application may have very good reason for their I/O strategy
– Production considerations can limit the range of practical optimizations
– Risk of compromising portability for users
How can we be agile with our I/O strategies?
– Tunable software, especially across layers
One step further: customizable data services
– Create data services that are tailored to the task at hand by composing
reusable building blocks in different ways
– This approach is easier if in-system storage resources are available
23

CHALLENGES IN ACTION
Different applications have different data models and requirements
– Interface/bindings
– Provisioning
– Semantics
– Resilience
– Coherence
Fortunately, they have many underlying building blocks in common:
– Network transport
– Local storage abstractions
– Concurrency model
– Meta services like group membership and telemetry
– Placement algorithms
How to provide storage solutions that suit the problem
24
The Mochi Project
This calls for more flexibility than is
typically offered by a parallel file system!

Mobject
“sequencer”
BAKE
SDS-
KeyVal
Client
RPC
RDMA
PMEM
LevelDB
C
API
RADOS-like distributed object store
EXAMPLE: MOBJECT
Figures provided by Matthieu Dorier

EXAMPLE: HEPNOS
Fast event-store for HEP
BAKE
SDS-
KeyVal
Client
RPC
RDMA
PMEM
LevelDB
C++
API
Figures provided by Matthieu Dorier

A TRANSIENT STORAGE SYSTEM FOR DEEP NEURAL NETWORKS
BAKE
Master
Manager
Client
RPC
RDMA
PMEM
Python
API
Worker
Manager
EXAMPLE: FLAMESTORE
Figures provided by Matthieu Dorier

CHALLENGES IN ACTION
The previous examples all used the same building blocks
– But each service was customized to accommodate different
usage models, data models, and expected workloads
The building blocks are there, but determining how to best deploy
and provision fully customized data services is still a manual
process
More generally: we can rethink what can be done in file systems,
middleware, and customized services
28

PUTTING THE
LOOP IN
OODA LOOPS

DON’T FORGET THE LOOP
There is no one point at which tuning is “done”
Must continue to observe, integrate feedback, and iterate
The UMAMI tool from the TOKIO project is one example of how to do this
30

UMAMI TOKIO Unified Measurements And Metrics Interface
31
UMAMI is a pluggable dashboard that
displays the I/O performance of an
application in context with system
telemetry and historical records
Each metric is shown
in a separate row
Historical samples (for a
given application) are
plotted over time
Box plots relate current
values to overall
variance
Glenn Lockwood et al., “Umami: a recipe for generating meaningful
metrics through holistic I/O performance analysis”, PDSW 2017

UMAMI TOKIO Unified Measurements And Metrics Interface
32
System background
load is typical
Performance for this job
is higher than usual
Server CPU load is low
after a long-term steady
climb
Corresponds to data
purge that freed up
disk blocks
Broader contextual clues simplify
interpretation of unusual performance
measurements
Glenn Lockwood et al., “Umami: a recipe for generating meaningful
metrics through holistic I/O performance analysis”, PDSW 2017

UMAMI TOKIO Unified Measurements And Metrics Interface
33
UMAMI still requires some level of expert interpretation
Can we automate the analysis?
Glenn Lockwood et al., “Umami: a recipe for generating meaningful
metrics through holistic I/O performance analysis”, PDSW 2017

WRAP UP
COMMENTARY ON UNDERSTANDING AND TUNING HPC I/O
Simply monitoring/instrumenting is hard enough by itself, but is not sufficient
– Must also interpret, decide what to do, and implement improvements
This presentation explored OODA loops as a way to frame the conversation [*]
Continuous iteration and engagement with users is crucial
Evolving platforms and applications present many opportunities!
35
How hard can it be? Pretty hard!
[*] OODA loops are sometimes taught as part of a tactical strategy to disorient your opponent. Maybe
don’t apply that aspect of the model to your HPC system?!
Or maybe this explains why your users are breaking your file systems…

RESOURCES
https://www.mcs.anl.gov/research/projects/darshan
https://www.nersc.gov/research-and-development/
storage-and-i-o-technologies/tokio/
https://www.mcs.anl.gov/research/projects/mochi
https://rapids.lbl.gov/
36
This work was supported by the U.S. Department of Energy, Office of Science,
Advanced Scientific Computing Research, under Contract DE-AC02-06CH11357.
Thank you!