we packaging for a - billerudkorsnäs · we packaging for a ... *subject to feasibility study...
TRANSCRIPT

Carnegie Pulp & Paper Seminar | March 2016
WE
PACKAGING FOR A
Susanne Lithander, CFO
2
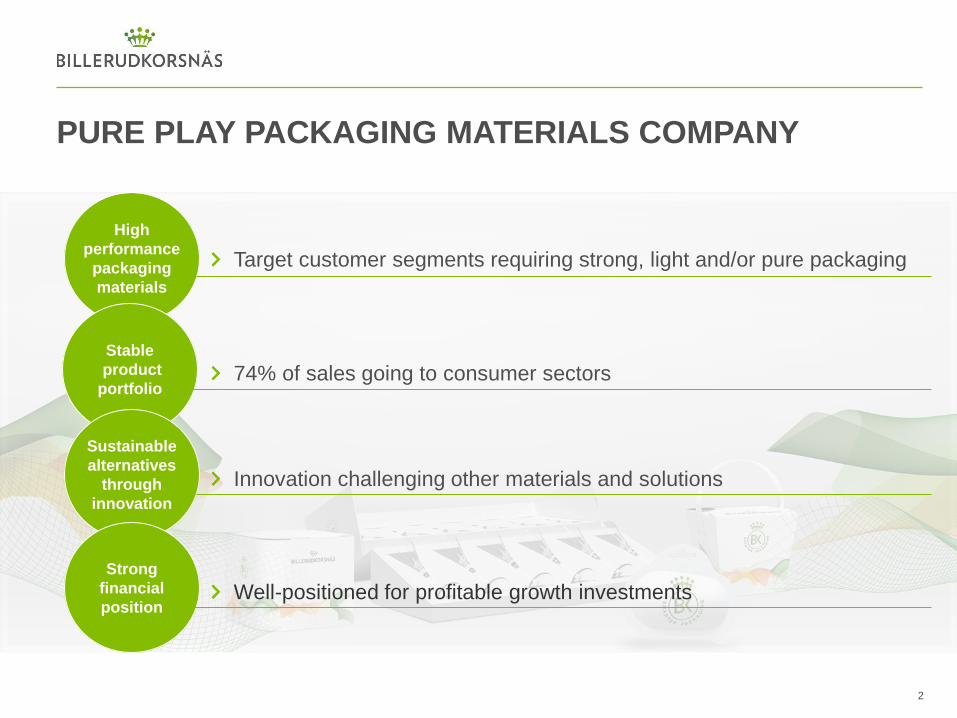
PURE PLAY PACKAGING MATERIALS COMPANY
Target customer segments requiring strong, light and/or pure packaging
Innovation challenging other materials and solutions
74% of sales going to consumer sectors
Well-positioned for profitable growth investments
High
performance
packaging
materials
Stable
product
portfolio
Sustainable
alternatives
through
innovation
Strong
financial
position

BILLERUDKORSNÄS IN BRIEF
3
NET SALES*
21.8 SEKbn
OPERATING PROFIT*
2.2 SEKbn
*Full year 2015. Excluding non-recurring items
Europe 73%
Asia 17%
Africa 4%
Middle East 3%
South America 2%
Other 1%
4 200 NUMBER OF EMPLOYEES
39%
15%
37%
9%
SHARE OF SALES
8 PRODUCTION UNITS
(SWE, FI, UK)
PACKAGING PAPER
Kraft paper
Sack paper
Market pulp
CORRUGATED SOLUTIONS
Fluting
Liner
Managed packaging
CONSUMER BOARD
Liquid packaging board
Cartonboard
OTHER
2.9 PRODUCTION CAPACITY
(MILLION TONNES)

SUSTAINABILITY CONNECTING SEVERAL SUBTRENDS
CONSUMERS AND SUPPLY CHAINS ARE CHANGING
DEMOGRAPHIC SHIFTS AND A CHANGING WORLD MAP
AIMING TO CAPTURE GROWTH FROM GLOBAL MEGATRENDS
4

Middle
East
Estimated demand CAGR 2013-2030, combined market for cartonboard, containerboard and sack paper. Source: Pöyry 2014
PACKAGING PAPER & BOARD MARKET IS GROWING BY 2.2%
0.3%
North-America
Central & South America
2.8%
3.0%
Africa
0.4%
2.7%
3.3% Asia
Australasia
1.5%
Europe
5
Middle
East
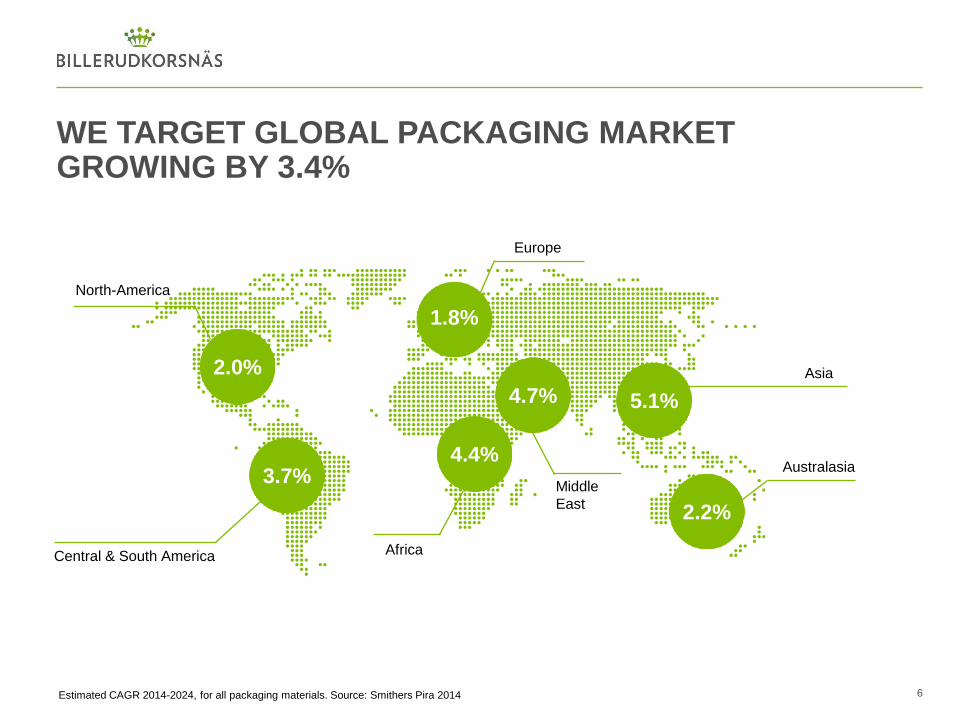
Estimated CAGR 2014-2024, for all packaging materials. Source: Smithers Pira 2014
WE TARGET GLOBAL PACKAGING MARKET GROWING BY 3.4%
2.0%
1.8%
Europe
North-America
Central & South America
4.4%
5.1%
Africa
2.2%
3.7%
4.7% Asia
Australasia
6

WE HAVE ESTABLISHED A CLEAR GROWTH STRATEGY
7

WE ARE INVESTING TO MOVE FURTHER UP THE VALUE CHAIN TOWARDS BRAND OWNERS
Brand image
Package solution
Sustainability
Shelf appearance
Price
Payment terms
Runability
Delivery terms
Packaging
material
50-85 % of
the cost
Packaging
material
2-5% of
the cost
8
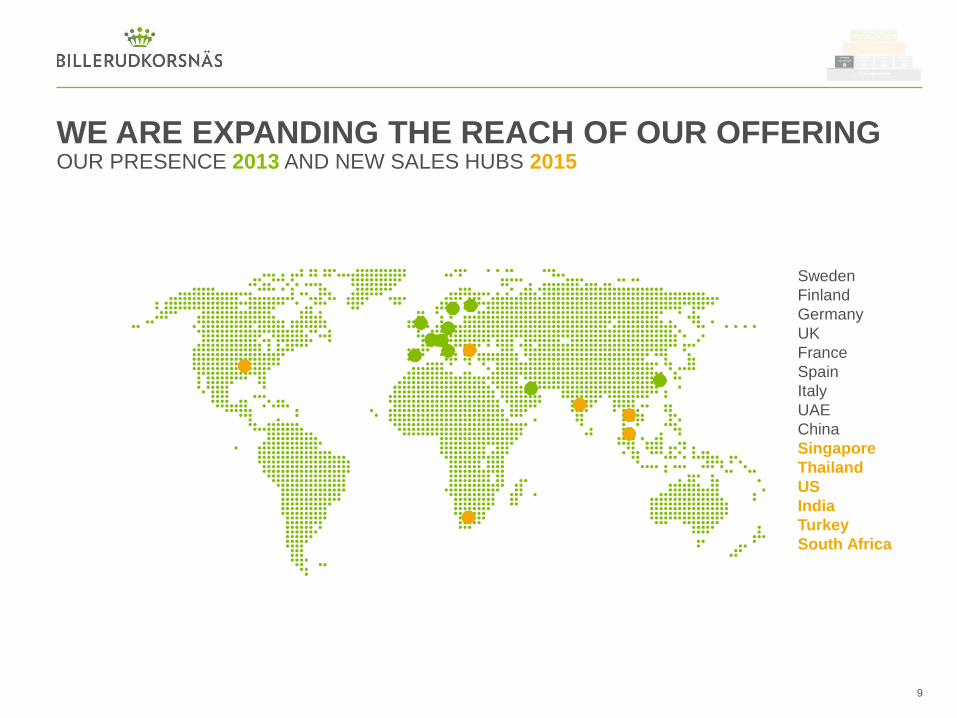
WE ARE EXPANDING THE REACH OF OUR OFFERING OUR PRESENCE 2013 AND NEW SALES HUBS 2015
Sweden
Finland
Germany
UK
France
Spain
Italy
UAE
China
Singapore
Thailand
US
India
Turkey
South Africa
9

260 SEKm
Brown sack paper
- Improved paper quality
restoring leadership
- Increased capacity by
20 000 tonnes
1600 SEKm
Liquid Packaging Board
Cartonboard
- Improved quality
- Increased capacity by
200 000 tonnes
180 SEKm
S/C fluting
- Improved quality
enhancing leadership
- Increased capacity by
40 000 tonnes
WE HAVE INVESTED SEK 2 BILLION SINCE 2012 TO INCREASE CAPACITY AND QUALITY LEAD
PACKAGING PAPER CONSUMER BOARD CORRUGATED SOLUTIONS
10

WE ARE PLANNING TO INVEST MORE THAN SEK 5 BILLION…
1 Moving unintegrated Tervasaari MG paper machine to Skärblacka and
making it integrated to the pulp production.
2
a) Building new board machine at the production unit in Gruvön with
capacity of approx. 500 000 t/a of liquid packaging board,
cartonboard, food service board and white kraftliner.
b) Closing paper mill with current capacity of approx.
300 000 t/a* of kraft paper and liner.
4 Moving production of white kraftliner from Gävle
to new board machine in Gruvön.
5 Shifting profitable kraft paper volumes from Gruvön
to Karlsborg, Skärblacka and Pietarsaari
to strengthen product mix.
1 3
4
5
5
5
3
Investing in value adding surface treatment capacity at existing MG
paper production in Skärblacka.
2
* Approximately 40% kraft paper and 60% liner.
11
Karlsborg
Pietarsaari
Tervasaari
Gävle
Frövi
Skärblacka Gruvön
Beetham

…DURING NEXT THREE YEARS…
Decision on moving
Tervasaari machine
Q2
2016
Decision on new board
machine in Gruvön
Q4
2016 2018
Possible production
start on MG machine
in Skärblacka*
2019
Possible production
start on board
machine in Gruvön*
*Subject to feasibility study results
Q3
2015
Feasibility
studies
started
12

Focusing on growth
segments growing by
2-4% per year
Decreasing volumes on
oversupplied markets
Increasing volumes on
growing Liquid Packaging
Board and Cartonboard
markets
Expanding solution based
sales to brand owners
Exiting oversupplied white
liner market
…TO IMPROVE UNDERLYING PROFITABILITY AND SECURE ORGANIC GROWTH
VOLUME GROWTH VALUE GROWTH SELECTIVE GROWTH
PACKAGING PAPER CONSUMER BOARD
Improved underlying EBITDA > 1000 SEKm when fully implemented
Continued organic growth with 3-4% per year
13
CORRUGATED SOLUTIONS

M&A MAY BOOST LONG-TERM GROWTH
We have the financial capacity to add M&A growth to organic growth
We have proven experience in merging businesses and quickly extracting
synergies
Bolt-on acquisitions with synergy potentials are currently the most interesting
candidates
14

INNOVATION WILL FURTHER BOOST TOP LINE AND MARGINS
2014 2020 Target
Proportion of sales accounted
for by new products 14% 20%
+2pp average margin improvement on new products
2015
17%
15

INVESTING IN INNOVATION – ON THREE LEVELS
2013 R&D and product
development
Innovation agenda
Challenger
products
2015
2015 vs 2013: 2x # employees
5x # projects
180 % increased spend
R&D and product
development
16

Environmental impact paper vs plastic1
50-70 %
lower CO2
INNOVATION PROVIDES WORLD LEADING SUSTAINABLE ALTERNATIVES
1 Life cycle assessment, Comparative study of virgin fibre based packaging products with competing plastic materials. IVL, 2015.
Through our products… … and through our actions
ADVANCED LEVEL
17
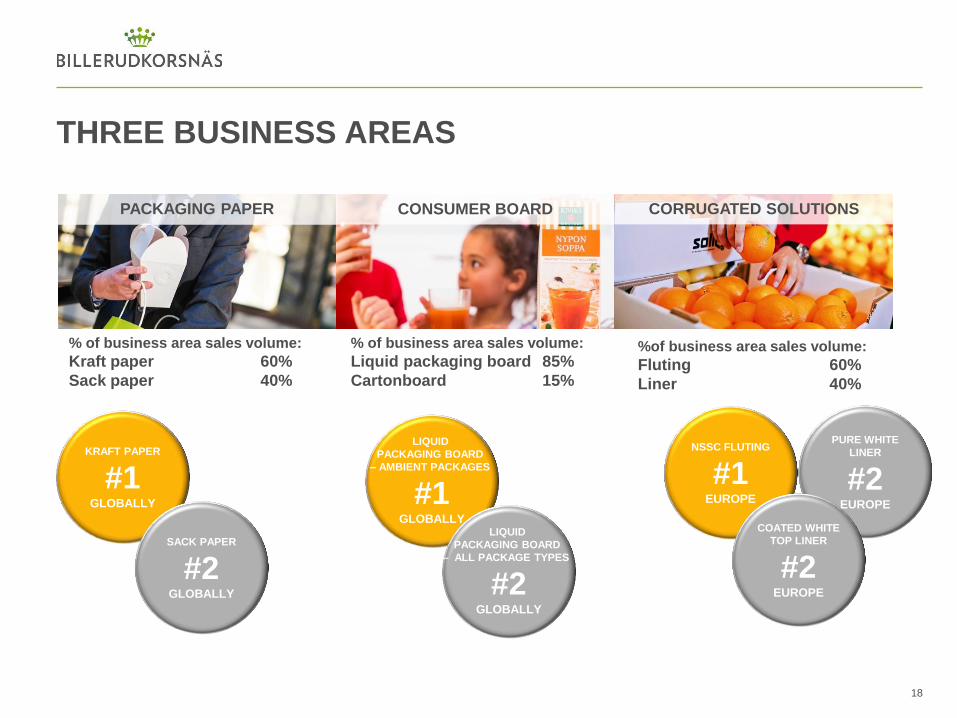
THREE BUSINESS AREAS
18
% of business area sales volume:
Kraft paper 60%
Sack paper 40%
% of business area sales volume:
Liquid packaging board 85%
Cartonboard 15%
%of business area sales volume:
Fluting 60%
Liner 40%
KRAFT PAPER
#1 GLOBALLY
SACK PAPER
#2 GLOBALLY
LIQUID
PACKAGING BOARD
– AMBIENT PACKAGES
#1 GLOBALLY
LIQUID
PACKAGING BOARD
– ALL PACKAGE TYPES
#2 GLOBALLY
NSSC FLUTING
#1 EUROPE
PURE WHITE
LINER
#2 EUROPE
COATED WHITE
TOP LINER
#2 EUROPE
PACKAGING PAPER
CONSUMER BOARD
CORRUGATED SOLUTIONS
PACKAGING PAPER
19
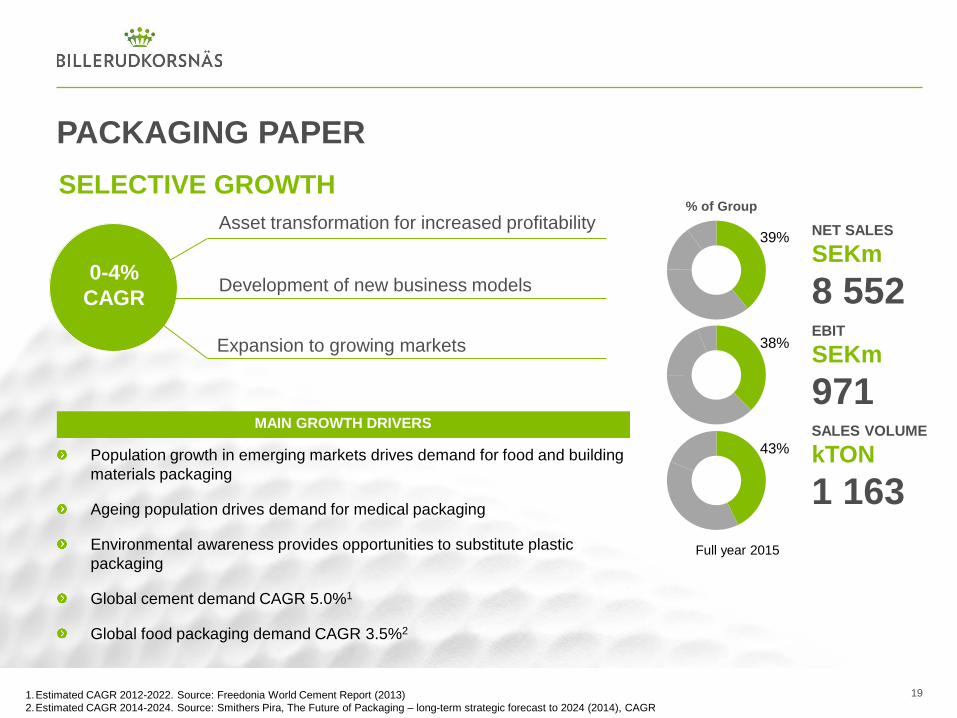
SELECTIVE GROWTH
Asset transformation for increased profitability
Development of new business models
Expansion to growing markets
0-4%
CAGR
NET SALES
SEKm
8 552 EBIT
SEKm
971 SALES VOLUME
kTON
1 163
Full year 2015
% of Group
39%
38%
43%
MAIN GROWTH DRIVERS
Population growth in emerging markets drives demand for food and building
materials packaging
Ageing population drives demand for medical packaging
Environmental awareness provides opportunities to substitute plastic
packaging
Global cement demand CAGR 5.0%1
Global food packaging demand CAGR 3.5%2
1.Estimated CAGR 2012-2022. Source: Freedonia World Cement Report (2013)
2.Estimated CAGR 2014-2024. Source: Smithers Pira, The Future of Packaging – long-term strategic forecast to 2024 (2014), CAGR
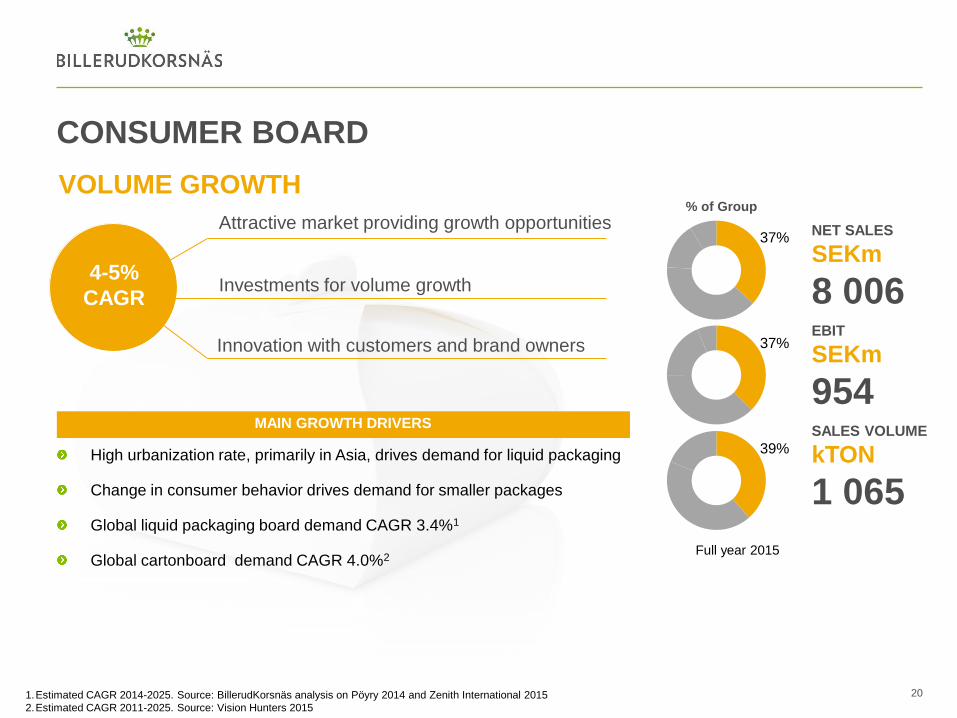
CONSUMER BOARD
% of Group
NET SALES
SEKm
8 006 EBIT
SEKm
954 SALES VOLUME
kTON
1 065
37%
37%
39%
20
VOLUME GROWTH
Attractive market providing growth opportunities
Investments for volume growth
Innovation with customers and brand owners
4-5%
CAGR
MAIN GROWTH DRIVERS
High urbanization rate, primarily in Asia, drives demand for liquid packaging
Change in consumer behavior drives demand for smaller packages
Global liquid packaging board demand CAGR 3.4%1
Global cartonboard demand CAGR 4.0%2
1.Estimated CAGR 2014-2025. Source: BillerudKorsnäs analysis on Pöyry 2014 and Zenith International 2015
2.Estimated CAGR 2011-2025. Source: Vision Hunters 2015
Full year 2015

CORRUGATED SOLUTIONS
NET SALES
SEKm
3 329 EBIT
SEKm
551 SALES VOLUME
kTON
506
15%
21%
19%
21
VALUE GROWTH % of Group
Strong product portfolio setting market standard
Integrating new business model
Increasing sales to brand owners
2-4%
CAGR
MAIN GROWTH DRIVERS
Increasing e-commerce and fresh food consumption
Package differentiation
Changing supply chains require simplification of packaging solutions
Global containerboard demand CAGR 2.6%1
1.Estimated CAGR 2013-2025. Source: Pöyry 2014
Full year 2015
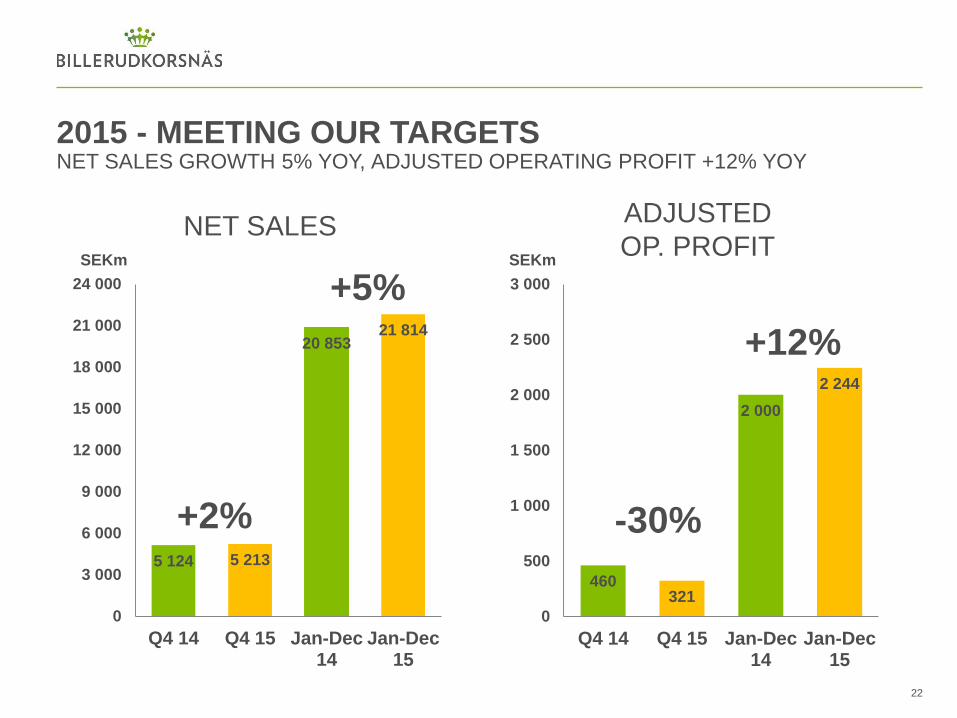
NET SALES GROWTH 5% YOY, ADJUSTED OPERATING PROFIT +12% YOY
5 124 5 213
20 853 21 814
0
3 000
6 000
9 000
12 000
15 000
18 000
21 000
24 000
Q4 14 Q4 15 Jan-Dec14
Jan-Dec15
22
460 321
2 000
2 244
0
500
1 000
1 500
2 000
2 500
3 000
Q4 14 Q4 15 Jan-Dec14
Jan-Dec15
SEKm SEKm
-30%
+12%
+2%
2015 - MEETING OUR TARGETS
NET SALES ADJUSTED
OP. PROFIT
+5%

2015 - MEETING OUR TARGETS STRONG CASH FLOW, REDUCED WORKING CAPITAL
427 360
1 739
1 957
0
400
800
1 200
1 600
2 000
2 400
Q4 14 Q4 15 Jan-Dec14
Jan-Dec15
23
SEKm
OPERATING CASH FLOW WORKING CAPITAL
13
11
10
0
3
6
9
12
15
18
2013 2014 2015
% of net sales

2015 - MEETING OUR TARGETS REACHING ROCE TARGET AND DECREASING ND/E
24
11
15
0
3
6
9
12
15
Jan-Dec 14 Jan-Dec 15
0,67
0,46
0,40
0,00
0,30
0,60
0,90
2014 Q3 15 2015
% ROCE NET DEBT/EQUITY

NEW FINANCIAL TARGETS TO SUPPORT OUR GROWTH STRATEGY*
Organic growth 3-4%
per year
ROCE > 13% Net Debt / EBITDA
< 2,5
EBITDA > 17%
Dividend policy –
distribute 50% of net profit as dividend
25 * Valid from 2016
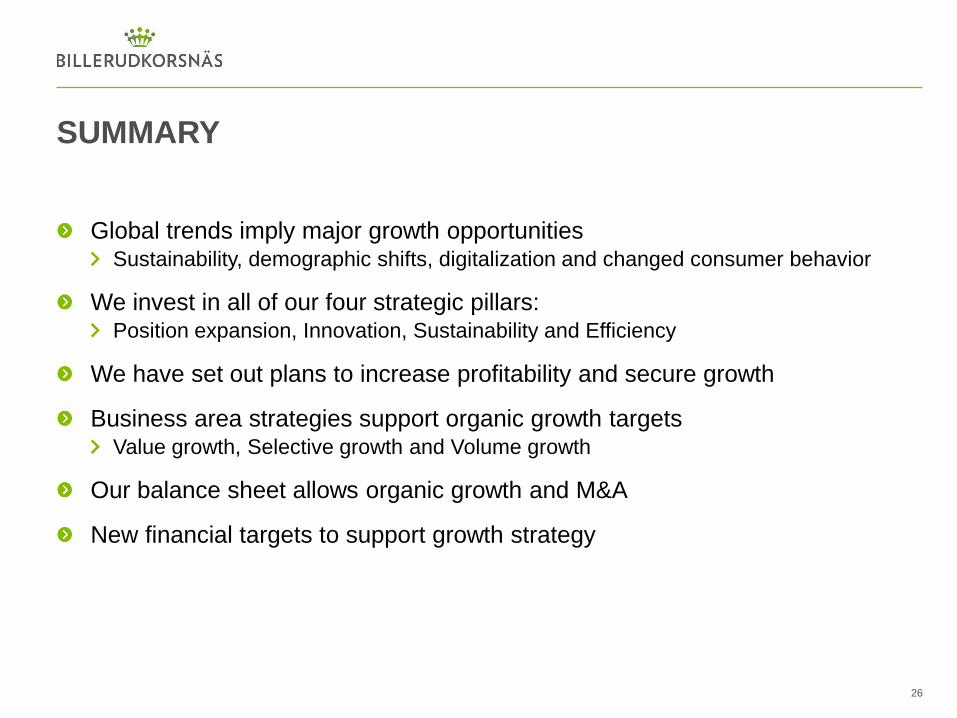
SUMMARY
Global trends imply major growth opportunities Sustainability, demographic shifts, digitalization and changed consumer behavior
We invest in all of our four strategic pillars: Position expansion, Innovation, Sustainability and Efficiency
We have set out plans to increase profitability and secure growth
Business area strategies support organic growth targets Value growth, Selective growth and Volume growth
Our balance sheet allows organic growth and M&A
New financial targets to support growth strategy
26

APPENDIX
27

SUCCESSFUL INTEGRATION HAS ENABLED A STRONG PLATFORM FOR GROWTH
28
Packaging focused materials and solutions provider
Broader product portfolio
Higher portion of sales to consumer segments
2006 2009 2012 2013 2014 2015 2016 2017 2018 2019 2020 2021 2022
Annual synergies of approximately SEK 530 million
Sharply reduced pulp market exposure
Lower relative currency exposure

GLOBAL PACKAGING MARKET
29
Asia, 38%
Europe, 27%
North America, 22%
South and Central America, 5%
Middle East, 3%
Africa, 2%
Pacific Region, 2%
Paper and board, 36%
Hard plastics, 22%
Flexible materials excl. Paper, 16%
Metals, 14%
Glass, 7%
Other, 5%
GLOBAL PACKAGING MARKET,
BY REGION1
GLOBAL PACKAGING MARKET,
BY MATERIAL1
1. Source: Smithers Pira 2014

SALES PER REGION
30
SALES PER REGION
• Europe 72%
• Asia 19%
• Africa 5%
• South America 2%
• Other 2%
PACKAGING PAPER
CONSUMER BOARD
CORRUGATED SOLUTIONS
SALES PER REGION
• Europe 69%
• Asia 22%
• Middle East 5%
• Africa 2%
• South America 2%
SALES PER REGION
• Europe 70%
• Asia 14%
• Africa 7%
• South America 4%
• Middle East 2%
• Other 3%
All figures relate to sales in 2015

COST STRUCTURE
No significant forest assets
Purchases made from handful of major
suppliers Bergvik Skog, Holmen, Mellanskog, Stora
Enso and Sveaskog
Large amount of private land owners in
Central and Northern Sweden
The majority of wood raw materials
acquired locally
About 20% of the wood requirement is
imported Majority from the Baltics
31 All figures relate to cost structure 2015
Fibre (wood and external pulp), 37%
Employee benefits expense, 16%
Chemicals, 10%
Delivery expenses, 9%
Depreciation/amortisation, 7%
Energy, 4%
Other variable costs, 4%
Other fixed costs, 13%

SENSITIVITY ANALYSIS
Variable Change SEKm
Sales volume +/- 10% +/-900
Exchange rate, SEK1 +/- 10% +/-640
Fibre prices +/- 10% -/+700
Price of electricity2 +/- 10% -/+30
Interest rate on loans3 +/- 1 percentage point -/+43
IMPACT ON PROFIT/LOSS BEFORE TAX
1 Excluding effects of currency hedging.
2 Excluding effects of electricity price hedging.
3 Excluding effects of interest hedging.
32

DEBT MATURITY
SE
Km
DEBT MATURITY PROFILE
33
0
1 000
2 000
3 000
4 000
5 000
6 000
7 000
0-1 1-2 2-3 3-4 4-5 5-6 6-
Years
Unused Credit Facility
Bank Debt
Market Debt
As per 2015-12-31
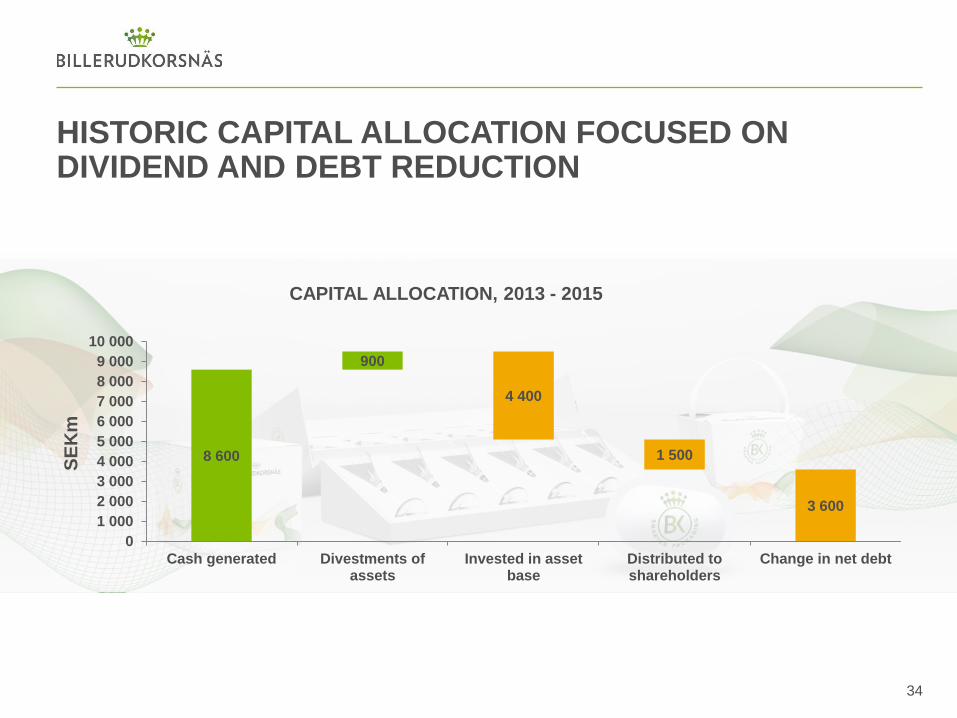
8 600
900
4 400
1 500
3 600
0
1 000
2 000
3 000
4 000
5 000
6 000
7 000
8 000
9 000
10 000
Cash generated Divestments ofassets
Invested in assetbase
Distributed toshareholders
Change in net debt
HISTORIC CAPITAL ALLOCATION FOCUSED ON DIVIDEND AND DEBT REDUCTION
CAPITAL ALLOCATION, 2013 - 2015
SE
Km
34

CAPITAL ALLOCATION FOCUSES ON GROWTH WE HAVE CLEAR PRIORITIES
Maintain a capital structure and liquidity position that secure
execution of dividend policy
Investing in organic growth based on the strategy
M&A to support strategy Excess capital return to
shareholders
1
2
3 4
35

PRODUCTION UNITS
SWEDEN
Gävle, 725 ktonnes
Gruvön, 685 ktonnes
Frövi/Rockhammar, 470 ktonnes
Skärblacka, 420 ktonnes
Karlsborg, 300 ktonnes
FINLAND
Pietarsaari, 200 ktonnes
Tervasaari, 100 ktonnes
UNITED KINGDOM
Beetham, 45 ktonnes
2 945 Thousand
tonnes
Total production
capacity
All figures relate to production capacity 2015 36

BILLERUDKORSNÄS SHARE
37
Symbol: BILL
Trading platform: Nasdaq Stockholm
IPO: November 20, 2001
0
20
40
60
80
100
120
140
160
BILL OMX Stockholm PI OMX Stockholm Forestry & Paper PI
Share performance 2004-2014 Share performance 2015
80
90
100
110
120
130
140
150
160
170
BILL OMX Stockholm PI OMX Stockholm Forestry & Paper PI

OWNERSHIP STRUCTURE
Shareholder Number of shares Percent of votes
FRAPAG Beteiligungsholding AG 31 300 000 15.1
AMF Insurance & Funds 13 603 075 6.6
Swedbank Robur Funds 8 764 343 4.2
Fourth Swedish National Pension Fund 6 199 261 3.0
Handelsbanken Funds 4 567 269 2.2
Lannebo Funds 4 443 388 2.1
Norges Bank Investment Management 4 242 873 2.1
DFA Funds (USA) 4 043 430 2.0
Alecta 4 000 000 1.9
Catella Funds 3 705 248 1.8
Total 10 largest shareholders 84 868 887 41.0
Total excluding share buy-backs 206 951 152 100.0
The company’s own bought-back shares 1 268 682 0.0
Total 208 219 834 100.0
38 Ownership structure per 2015-12-31
Foreign shareholders. 44.5%
Swedish mutual funds, 23.3%
Swedish individuals incl. closelyheld companies, 19.4%
Swedish institutions, 12.8%

39

40