wave run-up simulations on real dikes - info - …€¦ · wave run-up simulations on real dikes ....
TRANSCRIPT
1
WAVE RUN-UP SIMULATIONS ON REAL DIKES
Gosse Jan Steendam1, Jentsje van der Meer2, André van Hoven3 and Astrid Labrujere4
A new Wave Run-up Simulator has been designed, constructed, calibrated and used for testing of the seaward face of dikes. The upper part of dikes or levees often have a clay layer with a grass cover. The new device is able to test the strength of the grass cover under simulation of up-rushing waves for pre-defined storm conditions. The cumulative overload method has been developed to describe the strength of grass covers on the crest and landward side of dikes, for overtopping wave volumes. In essence there is not a lot of difference between the hydraulic load from an overtopping wave volume or from an up-rushing wave. Therefore the hypothesis has been evaluated that the cumulative overload method should also be applicable for up-rushing waves. Tests on a real dike have been used to validate this hypothesis. The main conclusions are that the new Wave Overtopping Simulator works really well, but that the results on testing till so far has not yet been sufficient for a full validation of the method. More research is required. Furthermore, a new technique has been developed to measure the strength of a grass sod on a dike: the grass pulling device. Tests with this device showed that it is possible to measure the critical velocity (= strength) of a grass cover, which is much easier than performing tests with a Wave Run-up or Overtopping Simulator.
Keywords: wave run-up; wave overtopping; hydraulic simulator; grass cover; dike; levee; breach
INTRODUCTION To increase knowledge on the strength of dikes and its failure mechanisms, the Dutch
government started a large research program “Research and Development of Flood Defence Assessment Tools (WTI2017)”. Within this program the strength of grass covers on the crest and the landward slopes of dikes have been tested in full scale and in situ with the Wave Overtopping Simulator (Van der Meer et al., 2008, 2010) and Steendam et al., 2014, 2012, 2011). From that research an erosion model or method was developed. This so called cumulative overload method for wave overtopping was first introduced in Van der Meer et al. (2010). The method was further developed during the continuous research on dike slopes in the Netherlands.
The hypothesis was that the cumulative overload method may also be used for erosion of grass during wave run-up. To validate the method for wave run-up, after a pilot test in 2012 with an adapted existing Wave Overtopping Simulator (Van der Meer et al., 2012), a new Wave Run-up Simulator was developed, designed, constructed and calibrated in 2013/2014. The development and the design as well as the validation of the method for wave run-up is part of the present paper. With this new developed Wave Run-up Simulator tests have been performed on an in situ dike in the south part of the Netherlands, from February to March 2014. The results of these tests will be used to validate the hypothesis described above.
HYDRAULIC SIMULATORS
Wave Overtopping Simulator. The Wave Overtopping Simulator has been designed and constructed in 2006 and has been used
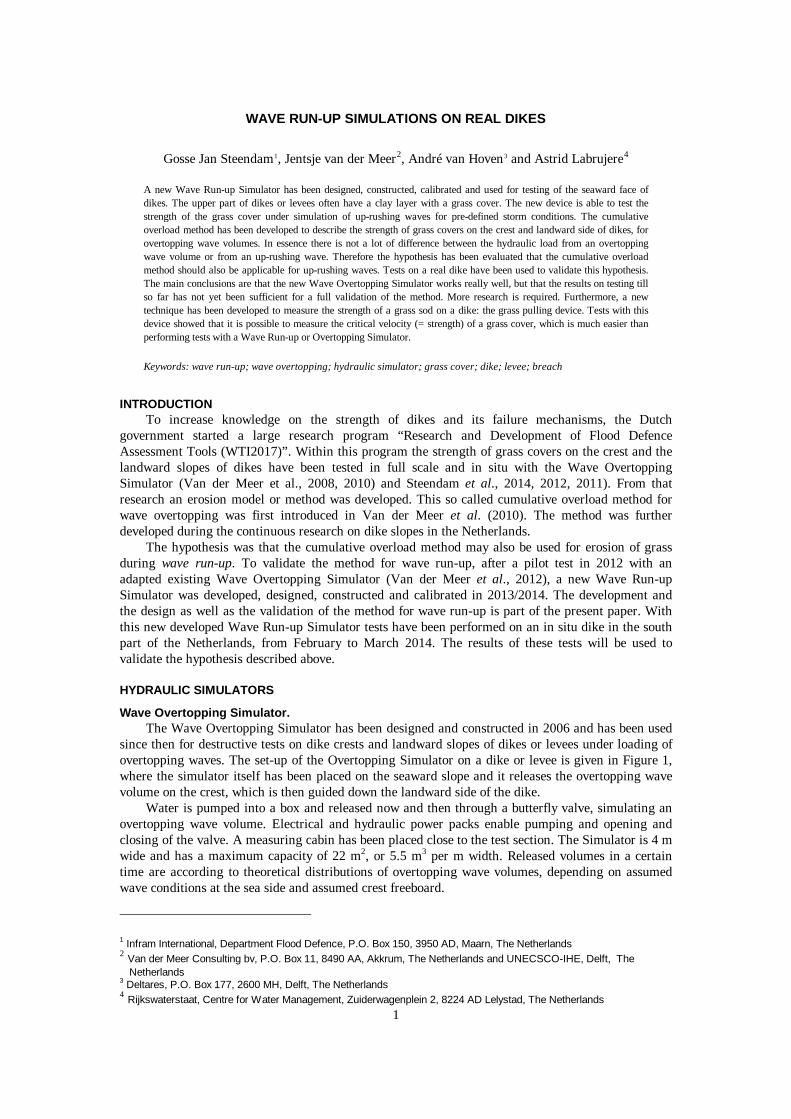
since then for destructive tests on dike crests and landward slopes of dikes or levees under loading of overtopping waves. The set-up of the Overtopping Simulator on a dike or levee is given in Figure 1, where the simulator itself has been placed on the seaward slope and it releases the overtopping wave volume on the crest, which is then guided down the landward side of the dike.
Water is pumped into a box and released now and then through a butterfly valve, simulating an overtopping wave volume. Electrical and hydraulic power packs enable pumping and opening and closing of the valve. A measuring cabin has been placed close to the test section. The Simulator is 4 m wide and has a maximum capacity of 22 m2, or 5.5 m3 per m width. Released volumes in a certain time are according to theoretical distributions of overtopping wave volumes, depending on assumed wave conditions at the sea side and assumed crest freeboard.
1 Infram International, Department Flood Defence, P.O. Box 150, 3950 AD, Maarn, The Netherlands 2 Van der Meer Consulting bv, P.O. Box 11, 8490 AA, Akkrum, The Netherlands and UNECSCO-IHE, Delft, The
Netherlands 3 Deltares, P.O. Box 177, 2600 MH, Delft, The Netherlands 4 Rijkswaterstaat, Centre for Water Management, Zuiderwagenplein 2, 8224 AD Lelystad, The Netherlands
COASTAL ENGINEERING 2016 2
Figure 1. Set-up of the Wave Overtopping Simulator close to a highway.
New Wave Run-up Simulator. The process of wave run-up was explored as well as a procedure for testing was developed, see
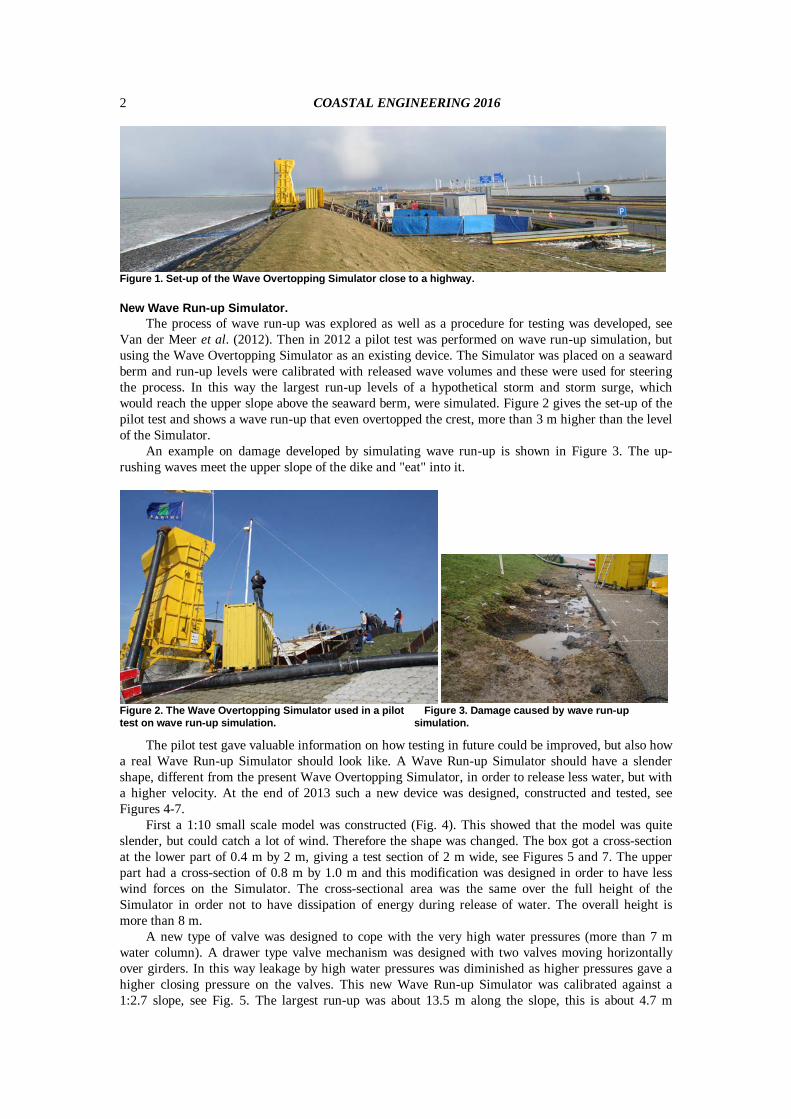
Van der Meer et al. (2012). Then in 2012 a pilot test was performed on wave run-up simulation, but using the Wave Overtopping Simulator as an existing device. The Simulator was placed on a seaward berm and run-up levels were calibrated with released wave volumes and these were used for steering the process. In this way the largest run-up levels of a hypothetical storm and storm surge, which would reach the upper slope above the seaward berm, were simulated. Figure 2 gives the set-up of the pilot test and shows a wave run-up that even overtopped the crest, more than 3 m higher than the level of the Simulator.
An example on damage developed by simulating wave run-up is shown in Figure 3. The up-rushing waves meet the upper slope of the dike and "eat" into it.
Figure 2. The Wave Overtopping Simulator used in a pilot Figure 3. Damage caused by wave run-up test on wave run-up simulation. simulation.
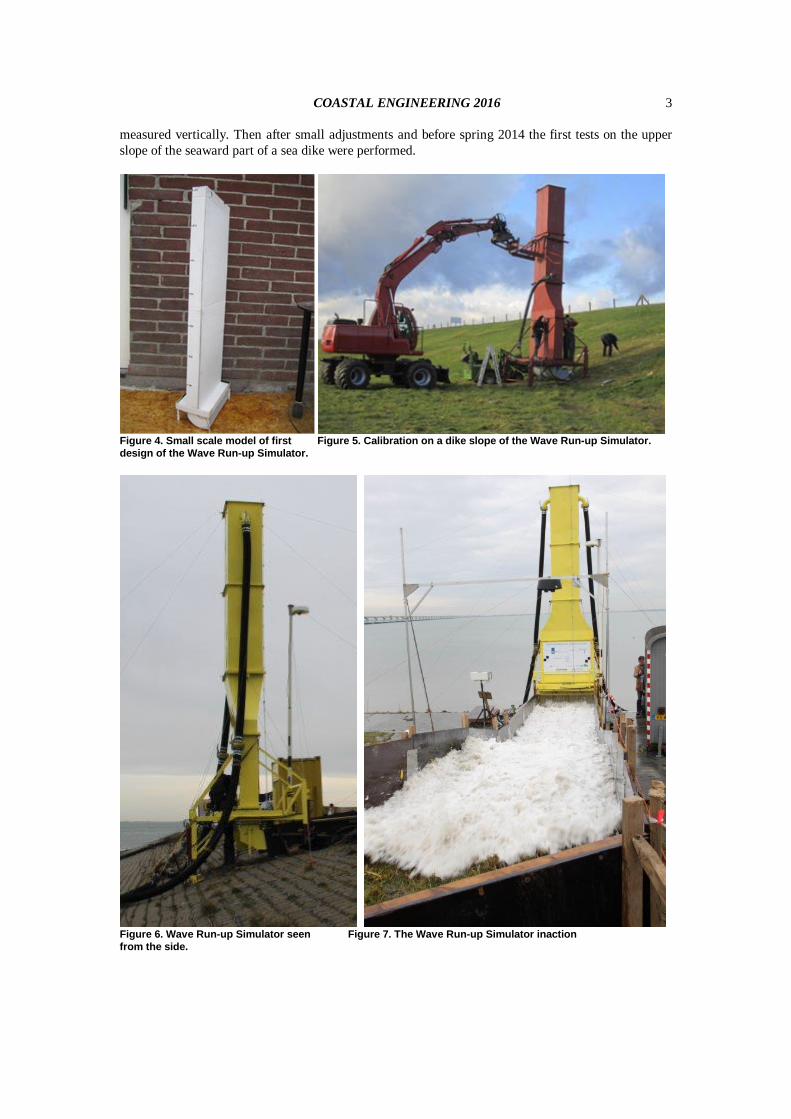
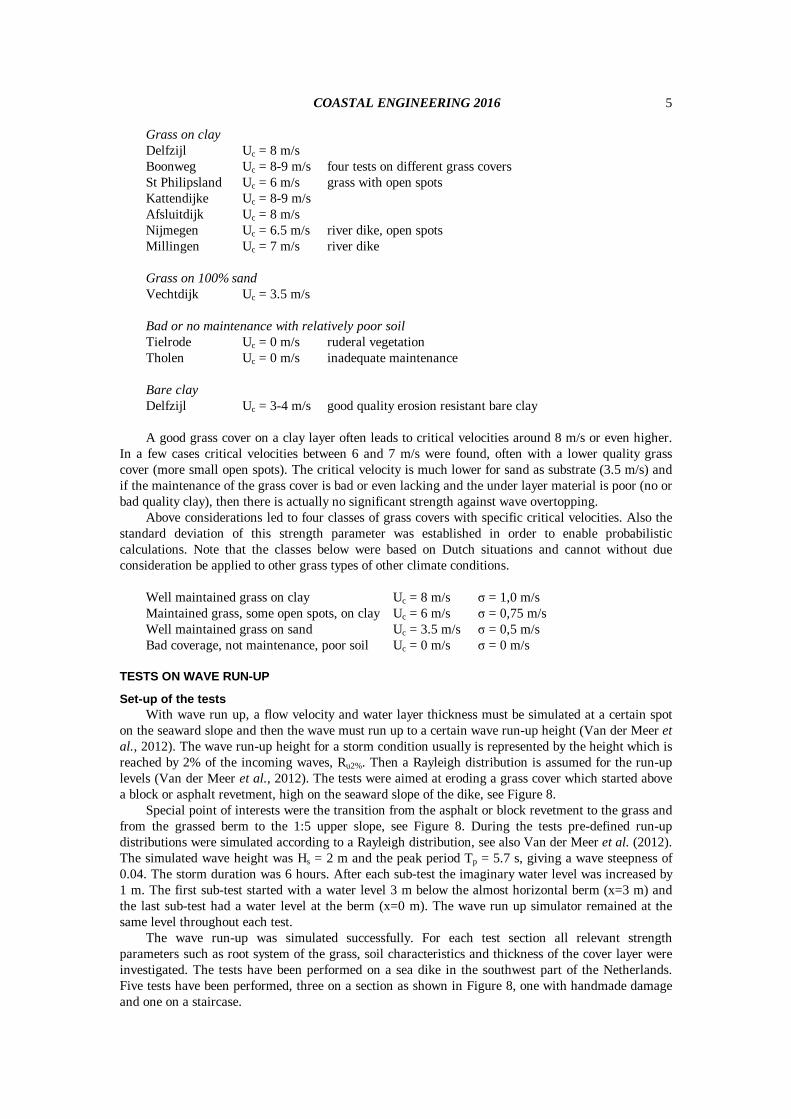
The pilot test gave valuable information on how testing in future could be improved, but also how a real Wave Run-up Simulator should look like. A Wave Run-up Simulator should have a slender shape, different from the present Wave Overtopping Simulator, in order to release less water, but with a higher velocity. At the end of 2013 such a new device was designed, constructed and tested, see Figures 4-7.
First a 1:10 small scale model was constructed (Fig. 4). This showed that the model was quite slender, but could catch a lot of wind. Therefore the shape was changed. The box got a cross-section at the lower part of 0.4 m by 2 m, giving a test section of 2 m wide, see Figures 5 and 7. The upper part had a cross-section of 0.8 m by 1.0 m and this modification was designed in order to have less wind forces on the Simulator. The cross-sectional area was the same over the full height of the Simulator in order not to have dissipation of energy during release of water. The overall height is more than 8 m.
A new type of valve was designed to cope with the very high water pressures (more than 7 m water column). A drawer type valve mechanism was designed with two valves moving horizontally over girders. In this way leakage by high water pressures was diminished as higher pressures gave a higher closing pressure on the valves. This new Wave Run-up Simulator was calibrated against a 1:2.7 slope, see Fig. 5. The largest run-up was about 13.5 m along the slope, this is about 4.7 m
COASTAL ENGINEERING 2016
3
measured vertically. Then after small adjustments and before spring 2014 the first tests on the upper slope of the seaward part of a sea dike were performed.
Figure 4. Small scale model of first Figure 5. Calibration on a dike slope of the Wave Run-up Simulator. design of the Wave Run-up Simulator.
Figure 6. Wave Run-up Simulator seen Figure 7. The Wave Run-up Simulator inaction from the side.

COASTAL ENGINEERING 2016 4
THE CUMULATIVE OVERLOAD METHOD The cumulative overload method for wave overtopping was first introduced in Van der Meer et
al. (2010) and application into transitions was given in Steendam et al. (2012). The method was further developed during the continuous research on dike slopes in the Netherlands. It is given by:
( )( )2 2
1max U ;0
N
M a i S ci
D Ua a a=
= − ∑ [m2/s2] (1)
Where: D = cumulative overload or damage number [m2/s2] N = number of overtopping waves [-] i = number of the overtopping wave [-] Ui = the maximum front velocity of the overtopping wave on the dike crest [m/s] αM = influence factor on the velocity Ui by transitions or obstacles [-] aa = acceleration factor for the front velocity depending on location at landward slope [-] Uc = critical velocity of the grass slope (=strength) [m/s] αS = influence factor on the critical velocity Uc by transitions or obstacles [-] Important in this method is the front velocity of each overtopping wave, the strength of the grass
cover that is given by a critical velocity, the influence factors on load as well as strength and finally a “damage number, D” or cumulative overload that should describe a certain state of the grass cover (initial damage, several open spots and failure). Note that the method has been developed for wave overtopping. The influences of transitions on the slope and of obstacles has more in depth been described by Steendam et al. (2014).
First damage numbers for initial damage, several open spots and for failure were developed by Van der Meer et al. (2010). These damage numbers were based on the flow velocities at the crest of a dike, as they were released by the Wave Overtopping Simulator. It was assumed that the velocities remained more or less constant along the landward slope of the dike, an assumption that was erroneously taken as most of the analysis had been concentrated on a gentle 1:5 landward slope.
New insights have shown that velocities along a fairly steep landward slope (up to slopes of 1:2.4 were tested) may increase by 50%. These velocities in Eq. 1 are used quadratic, which means that the effect of acceleration may become more than 100%. The conclusion is that the damage number D in Eq. 1 depends on the real velocity Ui at a location at the downward slope, including possible acceleration, described with acceleration factor aa. The analysis in Van der Meer et al. (2010) was repeated, but now the actual velocities at the location of damage was calculated instead of the velocities at the crest of the dike (Van der Meer et al. 2015).
Based on the re-analysis of the tests at the Vechtdike with the 1:5 landward slope, see Van der Meer et al. (2010), the critical velocity of the grass cover of the Vechtdike (landward side) is Uc = 3.5 m/s. This value could be considered as a low end strength of a well maintained closed grass cover, as the dike itself was a sand dike without cover of clay. It is noted that grass on a clay substrate will have a considerably higher strength. Based on this analysis, including the acceleration of a down-rushing overtopping wave volume on a landward slope, the following thresholds, D, for damage were established:
Initial damage Σ(U2 – Uc
2) = 1000 m2/s2 Several open spots Σ(U2 – Uc
2) = 4000 m2/s2 Failure (early due to mole holes) Σ(U2 – Uc
2) = 7000 m2/s2 By having these thresholds for D it was possible to re-analyse the results of all previously tested
dikes and to back calculate a fair estimate of critical velocities. Also the classification of critical velocities, as in Van der Meer et al. (2010), has been changed by new insights. Till now the grass cover was considered without making a difference in subsoil: clay, sand or other material. It became obvious that clay as subsoil is much more erosion resistant than a grass cover on sand (as with the Vechtdike). The new insights led to the following classification with critical velocities for the various sites that were investigated.
COASTAL ENGINEERING 2016
5
Grass on clay Delfzijl Uc = 8 m/s Boonweg Uc = 8-9 m/s four tests on different grass covers St Philipsland Uc = 6 m/s grass with open spots Kattendijke Uc = 8-9 m/s Afsluitdijk Uc = 8 m/s Nijmegen Uc = 6.5 m/s river dike, open spots Millingen Uc = 7 m/s river dike Grass on 100% sand Vechtdijk Uc = 3.5 m/s Bad or no maintenance with relatively poor soil Tielrode Uc = 0 m/s ruderal vegetation Tholen Uc = 0 m/s inadequate maintenance Bare clay Delfzijl Uc = 3-4 m/s good quality erosion resistant bare clay A good grass cover on a clay layer often leads to critical velocities around 8 m/s or even higher.
In a few cases critical velocities between 6 and 7 m/s were found, often with a lower quality grass cover (more small open spots). The critical velocity is much lower for sand as substrate (3.5 m/s) and if the maintenance of the grass cover is bad or even lacking and the under layer material is poor (no or bad quality clay), then there is actually no significant strength against wave overtopping.
Above considerations led to four classes of grass covers with specific critical velocities. Also the standard deviation of this strength parameter was established in order to enable probabilistic calculations. Note that the classes below were based on Dutch situations and cannot without due consideration be applied to other grass types of other climate conditions.
Well maintained grass on clay Uc = 8 m/s σ = 1,0 m/s Maintained grass, some open spots, on clay Uc = 6 m/s σ = 0,75 m/s Well maintained grass on sand Uc = 3.5 m/s σ = 0,5 m/s Bad coverage, not maintenance, poor soil Uc = 0 m/s σ = 0 m/s
TESTS ON WAVE RUN-UP
Set-up of the tests With wave run up, a flow velocity and water layer thickness must be simulated at a certain spot
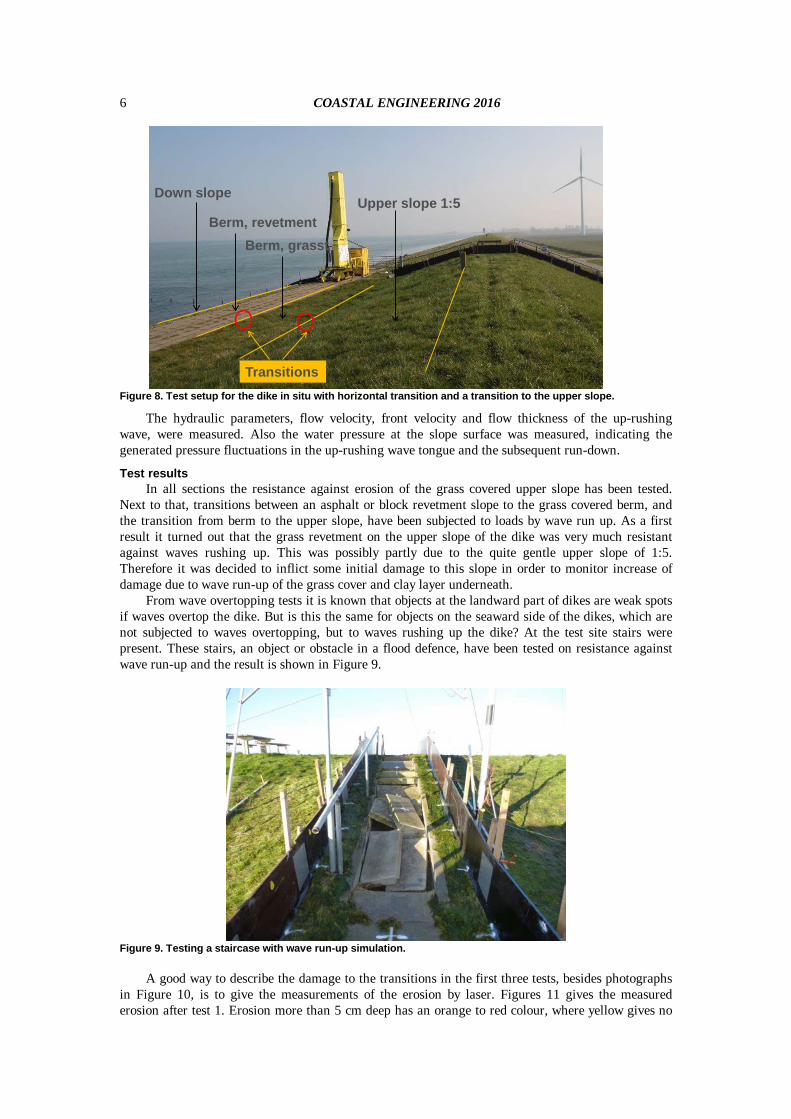
on the seaward slope and then the wave must run up to a certain wave run-up height (Van der Meer et al., 2012). The wave run-up height for a storm condition usually is represented by the height which is reached by 2% of the incoming waves, Ru2%. Then a Rayleigh distribution is assumed for the run-up levels (Van der Meer et al., 2012). The tests were aimed at eroding a grass cover which started above a block or asphalt revetment, high on the seaward slope of the dike, see Figure 8.
Special point of interests were the transition from the asphalt or block revetment to the grass and from the grassed berm to the 1:5 upper slope, see Figure 8. During the tests pre-defined run-up distributions were simulated according to a Rayleigh distribution, see also Van der Meer et al. (2012). The simulated wave height was Hs = 2 m and the peak period Tp = 5.7 s, giving a wave steepness of 0.04. The storm duration was 6 hours. After each sub-test the imaginary water level was increased by 1 m. The first sub-test started with a water level 3 m below the almost horizontal berm (x=3 m) and the last sub-test had a water level at the berm (x=0 m). The wave run up simulator remained at the same level throughout each test.
The wave run-up was simulated successfully. For each test section all relevant strength parameters such as root system of the grass, soil characteristics and thickness of the cover layer were investigated. The tests have been performed on a sea dike in the southwest part of the Netherlands. Five tests have been performed, three on a section as shown in Figure 8, one with handmade damage and one on a staircase.
COASTAL ENGINEERING 2016 6
Down slope
Berm, revetmentBerm, grasst
Upper slope 1:5
Transitions
Figure 8. Test setup for the dike in situ with horizontal transition and a transition to the upper slope.
The hydraulic parameters, flow velocity, front velocity and flow thickness of the up-rushing wave, were measured. Also the water pressure at the slope surface was measured, indicating the generated pressure fluctuations in the up-rushing wave tongue and the subsequent run-down.
Test results In all sections the resistance against erosion of the grass covered upper slope has been tested.
Next to that, transitions between an asphalt or block revetment slope to the grass covered berm, and the transition from berm to the upper slope, have been subjected to loads by wave run up. As a first result it turned out that the grass revetment on the upper slope of the dike was very much resistant against waves rushing up. This was possibly partly due to the quite gentle upper slope of 1:5. Therefore it was decided to inflict some initial damage to this slope in order to monitor increase of damage due to wave run-up of the grass cover and clay layer underneath.
From wave overtopping tests it is known that objects at the landward part of dikes are weak spots if waves overtop the dike. But is this the same for objects on the seaward side of the dikes, which are not subjected to waves overtopping, but to waves rushing up the dike? At the test site stairs were present. These stairs, an object or obstacle in a flood defence, have been tested on resistance against wave run-up and the result is shown in Figure 9.
Figure 9. Testing a staircase with wave run-up simulation.
A good way to describe the damage to the transitions in the first three tests, besides photographs in Figure 10, is to give the measurements of the erosion by laser. Figures 11 gives the measured erosion after test 1. Erosion more than 5 cm deep has an orange to red colour, where yellow gives no

COASTAL ENGINEERING 2016
7
erosion. Figure 11 shows that there is no erosion at the transition from asphalt to the grass on the berm. Apparently in this case the transition between the asphalt and grass was not that weak, compared to the rest of the tested slope. However, unfortunately, because no apparent failure occurred on the entire tested section no quantitative conclusion can be drawn to the transitions relative strength. . Limited damage, but clearly visible in Figure 11, occurred at the start of the upper slope. This damage/erosion was larger than at the remaining higher part of the upper slope. Similar results were found for the other two tests.
The overall conclusions on erosion are that the transitions from asphalt or block revetment to the grass did not give any erosion, where slight erosion was always found just at the transition from berm to upper slope. But overall the damage was small, sometimes close to “initial damage”, but certainly not more. The damage is not considered ‘failure’ of the grass cover.
Figure 10. Damage to the transitions after test 1, showing hardly damage to initial damage
asphalt-grass
grass to upperslope
crest
bermdown slope
upper slope
Figure 11. Laser scan of the tested slope of 2 m wide, after test 1. Erosion more than 5 cm is orange to red, no erosion is yellow.

COASTAL ENGINEERING 2016 8
ANALYSIS OF RESULTS AND VALIDATION OF HYPOTHESIS
Simulated front velocities during wave run-up simulation Velocities and flow thicknesses were measured during the session on hydraulic measurements
and from the records also the front velocity between pairs of paddle wheels (the device to measure velocities) were derived. The main front velocities are at the transition from asphalt to grass and just before the up-rushing wave arrives at the transition to the upper slope. These two front velocities have been used to calculate the cumulative overload for the two mentioned transitions.
Figure 12 shows the locations of the instruments during the hydraulic measurements. In total eight paddle wheels (velocity meters) were used and five surf boards (flow thickness). Three of the surfboards had a paddle wheel, which measures the velocity on top of the up-rushing layer. The other five paddle wheels were mounted in the concrete or grass in such a way that the velocity was measured 3 cm above the soil level (to avoid boundary layer effects). At three locations the velocity was measured at the soil level and on top of the layer (in the surf board).
0.0
0.5
1.0
1.5
2.0
2.5
-1 0 1 2 3 4 5 6 7 8 9 10 11 12 13 14 15 16
Eleva
tion (
m)
Horizontal distance (m)
Measurement slope by inclination/m
Measurements by x-y points
Paddle wheels
Surf boards
pw1
pw2pw4
pw3pw5
pw6
pw8
pw7
sb1sb2
sb3
sb4
sb5
Figure 12. Geometry of the tested dike and location of instruments during the hydraulic measurements.
The hydraulic measurements were performed by releasing pre-defined filling levels and each
level was repeated three times. Filling levels of 0.5 m; 1 m; 1.5 m; 2 m; 3 m; 4 m; 5 m; 6 m; 7 m; and 7.3 m were released. The performance and recording was done by two separate records, one for filling levels from 0.5 m to 4 m and one for 5 m and higher.
One detailed measurement is given in Figure 13 for flow velocities for a filling level of 5 m. In this example the wave run-up reaches the first paddle wheel at 24.5 s and the run-up finishes about between 27 and 28 s. The water that did not overtop the crest starts to run down at 28 s. The records after 28 s show the run-down velocities, however not measured correctly as the paddle wheels are meant for and calibrated for the run-up direction only. All measurements have been described in Van der Meer et al. (2015).
0
1
2
3
4
5
6
7
8
23 24 25 26 27 28 29 30 31 32 33
Velo
city
(m/s
)
Time (s)
pw1pw2+sb1pw3pw4+sb2pw5pw6pw7+sb5pw8
Filling level 5 m
Figure 13. Velocity measurements by paddle wheels for a filling level of 5 m. For location of instruments see Figure 12.
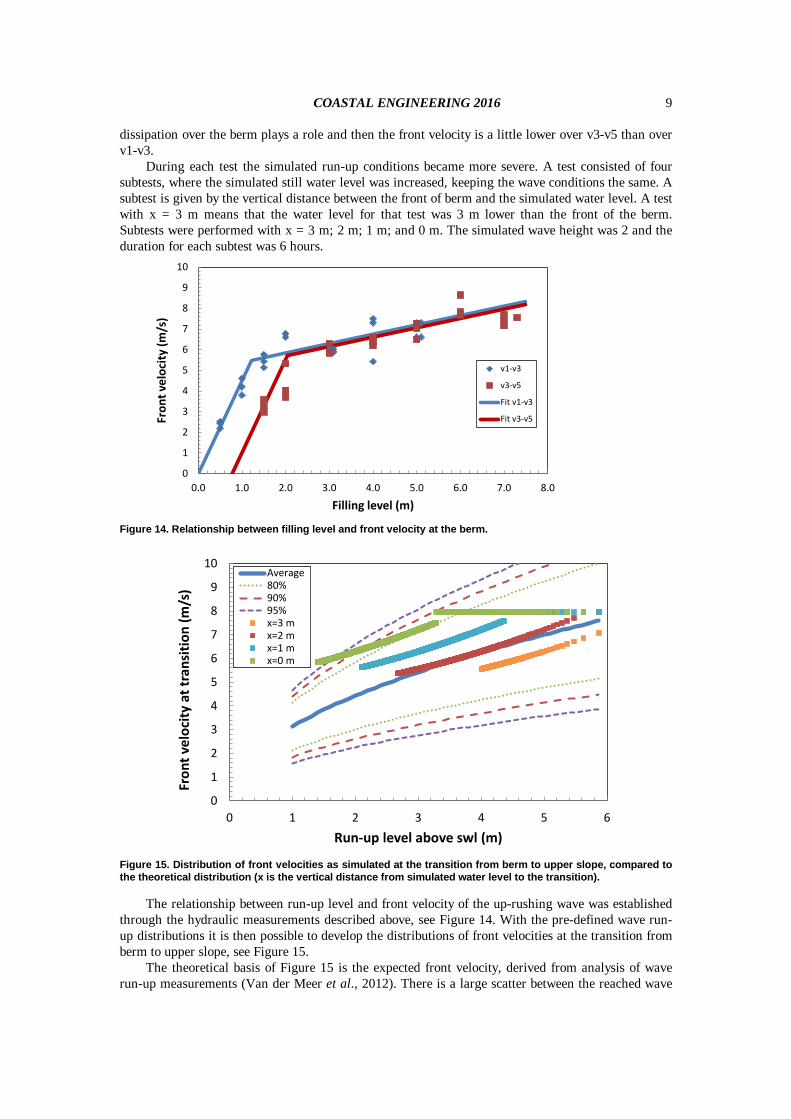
Records such as in Figure 13 were analysed to find the maximum values of each record and also
the front velocity between the measurement points. Each filling level of the run-up simulator gives a certain front velocity and the relationship is shown in Figure 14. For filling levels of 2 m and higher the front velocities over the whole berm are similar. Only for small filling levels the energy
COASTAL ENGINEERING 2016
9
dissipation over the berm plays a role and then the front velocity is a little lower over v3-v5 than over v1-v3.
During each test the simulated run-up conditions became more severe. A test consisted of four subtests, where the simulated still water level was increased, keeping the wave conditions the same. A subtest is given by the vertical distance between the front of berm and the simulated water level. A test with x = 3 m means that the water level for that test was 3 m lower than the front of the berm. Subtests were performed with x = 3 m; 2 m; 1 m; and 0 m. The simulated wave height was 2 and the duration for each subtest was 6 hours.
0
1
2
3
4
5
6
7
8
9
10
0.0 1.0 2.0 3.0 4.0 5.0 6.0 7.0 8.0
Fron
t vel
ocity
(m/s
)
Filling level (m)
v1-v3
v3-v5
Fit v1-v3
Fit v3-v5
Figure 14. Relationship between filling level and front velocity at the berm.
0
1
2
3
4
5
6
7
8
9
10
0 1 2 3 4 5 6
Fron
t vel
ocity
at t
rans
ition
(m/s
)
Run-up level above swl (m)
Average80%90%95%x=3 mx=2 mx=1 mx=0 m
Figure 15. Distribution of front velocities as simulated at the transition from berm to upper slope, compared to the theoretical distribution (x is the vertical distance from simulated water level to the transition).
The relationship between run-up level and front velocity of the up-rushing wave was established
through the hydraulic measurements described above, see Figure 14. With the pre-defined wave run-up distributions it is then possible to develop the distributions of front velocities at the transition from berm to upper slope, see Figure 15.
The theoretical basis of Figure 15 is the expected front velocity, derived from analysis of wave run-up measurements (Van der Meer et al., 2012). There is a large scatter between the reached wave
COASTAL ENGINEERING 2016 10
run-up level and the maximum front velocity. The graph gives the average line, but also the 80%, 90% and 95% exceedance lines.
The wave run-up simulator produces the same front velocity, or the same run-up level, for the same filling level. Figure 15 shows that the front velocities that were simulated were always quite high, roughly larger than 5 m/s, which is already the case for filling levels larger than 1 m. The maximum front velocity was 7.95 m/s, just below 8 m/s.
Subtest x=3 m, where the simulated water level is 3 m vertical beneath the point of interest, is a little lower than the average curve in Figure 9, where subtest x=2 m is almost equal to the average. The more severe subtests with x=1 m and 0 m gave front velocities that were higher than the expected average. In that sense it can be concluded that the simulated conditions for the last two subtests were more severe than can be expected in reality. It should be noted that for the most severe condition with x=0 m, the highest line in Figure 15, the maximum capacity of the Wave Run-up Simulator was reached (the horizontal part). In order to compensate for this, a large number of run-up levels were simulated with the maximum capacity, creating a discontinuity in the distribution of front velocities in Figure 15.
Cumulative overload by the new tests with the Wave Run-up Simulator The method of cumulative overload was developed for wave overtopping. The front velocity of
the overtopping wave accelerates down the slope and the cumulative overload is then dependent on the location of damage, as well as the steepness of the landward slope. The front velocity for an up-rushing wave does not accelerate. Over about 75% of the run-up height, the front velocity remains almost at its maximum value. Over the last 25% it drops down to zero. The cumulative damage for run-up depends also on the location on the slope. Very often the location of a transition is the most important one. For the present tests this is the transition from asphalt or revetment to grass and from berm to upper slope. From the test results it has become clear that in this case the transition to the upper slope was critical. At this transition the measured erosion was at its maximum, see Figures 10 and 11, although there was still not failure of the grass cover.
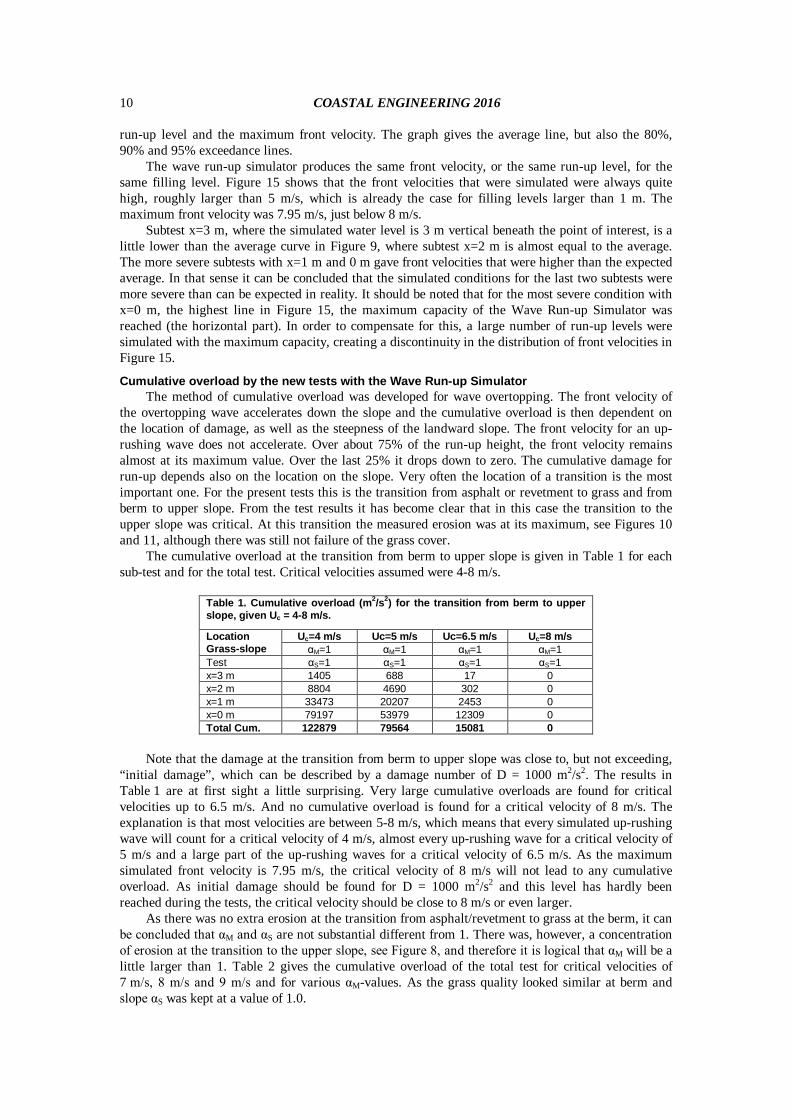
The cumulative overload at the transition from berm to upper slope is given in Table 1 for each sub-test and for the total test. Critical velocities assumed were 4-8 m/s.
Table 1. Cumulative overload (m2/s2) for the transition from berm to upper slope, given Uc = 4-8 m/s.
Location Grass-slope
Uc=4 m/s Uc=5 m/s Uc=6.5 m/s Uc=8 m/s αM=1 αM=1 αM=1 αM=1
Test αS=1 αS=1 αS=1 αS=1 x=3 m 1405 688 17 0 x=2 m 8804 4690 302 0 x=1 m 33473 20207 2453 0 x=0 m 79197 53979 12309 0 Total Cum. 122879 79564 15081 0
Note that the damage at the transition from berm to upper slope was close to, but not exceeding,
“initial damage”, which can be described by a damage number of D = 1000 m2/s2. The results in Table 1 are at first sight a little surprising. Very large cumulative overloads are found for critical velocities up to 6.5 m/s. And no cumulative overload is found for a critical velocity of 8 m/s. The explanation is that most velocities are between 5-8 m/s, which means that every simulated up-rushing wave will count for a critical velocity of 4 m/s, almost every up-rushing wave for a critical velocity of 5 m/s and a large part of the up-rushing waves for a critical velocity of 6.5 m/s. As the maximum simulated front velocity is 7.95 m/s, the critical velocity of 8 m/s will not lead to any cumulative overload. As initial damage should be found for D = 1000 m2/s2 and this level has hardly been reached during the tests, the critical velocity should be close to 8 m/s or even larger.
As there was no extra erosion at the transition from asphalt/revetment to grass at the berm, it can be concluded that αM and αS are not substantial different from 1. There was, however, a concentration of erosion at the transition to the upper slope, see Figure 8, and therefore it is logical that αM will be a little larger than 1. Table 2 gives the cumulative overload of the total test for critical velocities of 7 m/s, 8 m/s and 9 m/s and for various αM-values. As the grass quality looked similar at berm and slope αS was kept at a value of 1.0.

COASTAL ENGINEERING 2016
11
Table 2. Cumulative overload for the transition from berm to upper slope with various values for αM and critical velocities from 7-9 m/s
αM αS Uc=7m/s Uc=8 m/s Uc=9 m/s 1.00 1.00 6773 0 0 1.05 1.00 9440 869 0 1.10 1.00 12710 2034 0 1.15 1.00 16641 3228 0 1.20 1.00 21285 4658 0 1.30 1.00 32895 8558 428 1.40 1.00 47842 14097 2756 1.50 1.00 66014 21561 5317 1.60 1.00 85969 31203 8844
A cumulative overload value of 869 m2/s2, just below the value of 1000 m2/s2 for initial damage,
is found for a critical velocity of 8 m/s and αM = 1.05. If the critical velocity would be 9 m/s then αM = 1.3-1.4 would be a good value. The upper slope was quite gentle (about 1:5) and the erosion at the transition was more than at the upper slope itself, but not much more. This all leads to the conclusion that αM = 1.1 would be a fair estimate with a critical velocity of around 8 m/s. More information on transitions and obstacles is given in Steendam et al. 2014).
Cumulative overload by Pilot test in 2012 In 2011 a pilot test was performed at Tholen on run-up simulation, using the wave overtopping
simulator, see Van der Meer et al. (2012). A similar set-up was used as for the tests described above with four test conditions with increasing (assumed) water level. Initial damage and several open spots occurred quite easily, all on the berm and transition to the upper slope. The grass quality was quite bad in this area. After the test there were three quite deep holes, two at the side walls and one in the middle, see Figure 3. Damage was more than several open spots, but certainly less than failure.
From calibration and hydraulic measurements the flow velocities were known and with these the cumulative overload can be calculated. With D = 4000 m2/s2 for several open spots and 7000 m2/s2 for failure, the cumulative overload after the test should be between these two values. But the grass at the berm was worse than at the slope and there is clearly a transition to the steep 1:3 upper slope. This means that actually αM and αS both should be different from 1. Table 3 gives the cumulative overload for αS = 0.9 and various values for αM. For a critical velocity of 6.5 m/s αM should be about 1.4, which is a fairly high value. It is more plausible that the critical velocity was around 5.5 m/s or 6 m/s with an αM = 1.1-1.3. Including the worse grass slope at the berm and the transition to the upper slope, gives a critical velocity of Uc = 5.5 m/s to 6 m/s.
A similar conclusion could be drawn from wave overtopping tests at the same location, where damage occurred at a transition.
Table 3. Cumulative overload for the pilot test with αS = 0.9, various values for αM and critical velocities from 5-8 m/s
αM αS Uc=5 m/s Uc=6.5 m/s Uc=8 m/s 1.00 0.90 6226 944 0 1.05 0.90 7295 1274 33 1.10 0.90 8426 1663 93 1.15 0.90 9833 2114 157 1.20 0.90 11331 2626 237 1.30 0.90 14386 3826 476 1.40 0.90 17512 5254 838 1.50 0.90 20700 6892 1342
DETERMINING THE CRITICAL VELOCITY BY A GRASS PULLING DEVICE The strength of the grass sod is an important factor for the stability of a dike in the Netherlands
during wave overtopping conditions. Many tests have been performed the last few years with the Wave Overtopping Simulator, leading to the Cumulative Overload Method and the validation for wave run-up has been described in this paper.
The critical velocity is the a strength parameter of grass on a dike under loads induced by overtopping wave volumes, in the Cumulative Overload Method. A new method has been developed to determine this critical velocity, by measuring the force while lifting the grass sod perpendicular to the slope out of the sod. Figure 16 shows the grass pulling device. The force is rewritten into the

COASTAL ENGINEERING 2016 12
critical grass normal stress which is one of the input parameters for determining the critical velocity of a grass sod. When the critical velocity resulting from this method is compared with the determined critical velocities with the Wave Overtopping Simulator, there is good correspondence between the results for the tested locations. Therefore the sod pulling test could provide results that are reliable enough to determine the critical velocity of a dike section. More information is given in Bijlard et al. part of the present proceedings.
Figure 16. The sod pulling device (left) and the pull frame with a sod pulled from the grass cover.
CONCLUSIONS VALIDATION OF CUMULATIVE OVERLOAD METHOD FOR WAVE RUN-UP The cumulative overload describes three damage levels, initial damage, several open spots and
failure. From the extensive testing with the Wave Overtopping Simulator it is known that failure is the most important damage to establish the critical velocity of a grass slope. The least reliable damage indication is initial damage. Sometimes initial damage occurs quite soon, whilst the slope appears to be very strong, sometimes initial damage occurs just before the slope fails. In order to make a good validation of the method for cumulative overload for wave run-up it is essential that testing shows the final stage of failure. That did not happen for the pilot test at Tholen, but the stage of several open spots was reached and even a little more. The tests with the new Wave Run-up Simulator showed that the grass cover was quite strong. With respect to the grass cover the indication on erosion was that initial damage was close, but had actually not fully been reached. The validation had to be done on this criterion.
Analysis of the cumulative overload for the pilot test at Tholen showed that for wave overtopping as well as wave run-up, a critical velocity of 5.5 m/s to 6 m/s with αS = 0.9 and αM = 1.1-1.3 may apply. As the outcome for the wave overtopping as well as the wave run-up test was similar, these tests validate to some extent the method for cumulative overload for wave run-up. But it was not based on the criterion of failure.
The tests with the new Wave Run-up Simulator only showed erosion close to initial damage. Based on this criterion only, it was concluded that the critical velocity of the grass slope was Uc = 8 m/s, using α2 = 1.0 and αM = 1.05. The problem is that this critical velocity is only based on no or hardly damage.
The overall conclusion on the pilot test at Tholen and the test with the new Wave Run-up Simulator, is that results show that possibly the method of cumulative overload can also be applied for wave run-up. The analysis did not show contradictions. But the validation is far from conclusive as it could not be based on a damage criterion of failure, but only on no or slight damage.
As it is advantageous to apply a similar method for wave run-up as well as for wave overtopping, a conclusive validation is recommended. It is therefore recommended to perform more test series with the Wave Run-up Simulator. With selection of a suitable test location it is necessary to have a steeper transition to the upper slope, a grass cover that is/looks not too strong, and a location that has also objects and/or other transitions. In order to compare directly wave run-up with wave overtopping it is further recommended to do both types of tests on a similar section. To have both types of tests is very useful for a direct comparison, like at the tests at Tholen.
COASTAL ENGINEERING 2016
13
Finally, the new grass pulling device shows to be a good development to determine the critical velocity (= strength) of any grass cover in a fairly easy way.
ACKNOWLEDGEMENT The research was carried out as part of the research program “Research and Development of
Flood Defence Assessment Tools (WTI2017)”, funded by the Dutch Government and carried out by Rijkswaterstaat Water Verkeer en Leefomgeving and Deltares together with Van Der Meer Consulting, Infram and Alterra. The results became part of the probabilistic flood defence assessment tools in the Netherlands, see Slomp et al. (2016).
REFERENCES Bijlard, R., G.J. Steendam, H.J. Verhagen and J.W. van der Meer. 2016. Determining the critical
velocity of grass sods for wave overtopping by a grass pulling device. ASCE, Proc. ICCE 2016, Antalya, Turkey.
Slomp, R., H. Knoeff, A. Bizarri, M. Bottema and W. de Vries. 2016. Probabilistic flood defence assessment tools. FLOODRisk 2016.
Steendam, G.J., Van Hoven, A., Van der Meer, J.W. and Hoffmans, G. 2014. Wave overtopping simulator tests on transitions ans obstacles at grass covered slopes of dikes. ASCE, Proc. ICCE 2014, Seoul, South Korea.
Steendam, G.J., Y. Provoost and J.W. van der Meer. 2012. Destructive wave overtopping and wave run-up tests on grass covered slopes of real dikes. ASCE, Proc. ICCE 2012, Santander, Spain.
Steendam G.J., P. Peeters, J.W. van der Meer, K. van Doorslaer and K. Trouw. 2011. Destructive wave overtopping tests at Flemish dikes. Proc. Coastal Structures 2011, Yokohama, Japan.
Van der Meer, J.W., G. Hoffmans and A. van Hoven. 2015. Product 5.12 Analysis grass erosion in wave run-up and wave overtopping conditions. Report in project WTI Onderzoek en ontwikkeling landelijk toetsinstrumentarium. Deltares report 1209437-005.
Van der Meer, J.W., Y. Provoost and G.J. Steendam. 2012. The wave run-up simulator, theory and first pilot test. ASCE, Proc. ICCE 2012, Santander, Spain.
Van der Meer, J.W., B. Hardeman, G.J. Steendam, H. Schüttrumpf and H. Verheij. 2010. Flow depths and velocities at crest and inner slope of a dike, in theory and with the Wave Overtopping Simulator. ASCE, Proc. ICCE 2010, Shanghai.
Van der Meer J.W., G.J. Steendam, G. de Raat and P. Bernadini. 2008. Further developments on the wave overtopping simulator. ASCE. Proc. ICCE 2008, Hamburg, Germany.