wave loads in shallow water - waveworkshop.org · wave loads in shallow water ... increasing number...
TRANSCRIPT

Hans Fabricius HansenIris Pernille LohmannFlemming Schlütter
Wave Loads in Shallow Water 12th International Workshop on Wave Hindcasting and Forecasting, Hawaii’s Big Island, Oct. 30th – Nov. 4th 2011
Ports and Offshore Technology Department, DHI Denmark
Partially funded by the ForskEL Project 2010-1-10495, Wave loads on offshore wind turbines

Motivation• Increasing number of shallow water structures being constructed• Uncertainty in appropriate design wave loads
Wave height distribution tend to depart from Rayleigh
Decrease in maximum wave height
Wave breaking induce slamming loads• Requirement for methodology to account these opposing but interrelated
effects on design loads

Methodology Outline• Wave loads on offshore wind turbine foundation in irregular near-
breaking and breaking waves modelled in physical and numerical models• Wave load dependency on wave breaking parameter and Ursell
parameter established• Monte-Carlo method adopted to simulate sea state dependent wave
loads• Adaption of Tromans and Vanderschuren method (1995) allows for
derivation of most probable extreme wave load in historical storms• Maximum wave load with given recurrence periods estimated from
traditional extreme value analysis
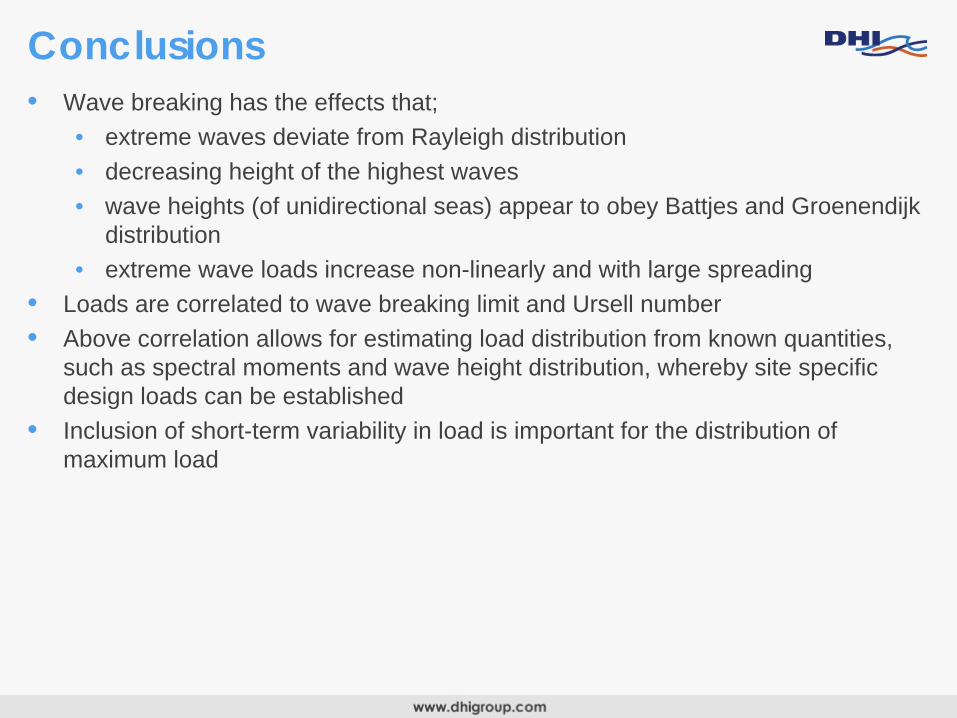
Conclusions• Wave breaking has the effects that;
• extreme waves deviate from Rayleigh distribution• decreasing height of the highest waves• wave heights (of unidirectional seas) appear to obey Battjes and Groenendijk
distribution• extreme wave loads increase non-linearly and with large spreading
• Loads are correlated to wave breaking limit and Ursell number• Above correlation allows for estimating load distribution from known quantities,
such as spectral moments and wave height distribution, whereby site specific design loads can be established
• Inclusion of short-term variability in load is important for the distribution of maximum load

Experimental Setup• Wave Conditions
• Regular• Irregular 2D• Irregular 3D
Bathymetry Cross-section
Segmented Wave maker
Model: 1 mScale 36.6: 36.6 m
Model: 9 mScale 36.6: 329 m
Model: 9 mScale 36.6: 329 m
Max WL:Model: 0.82 mScale 36.6: 30 m
Monopile Ø16.cm ~ 6m full scaleMax WL:Model: 0.54 mScale 36.6: 20.0 m
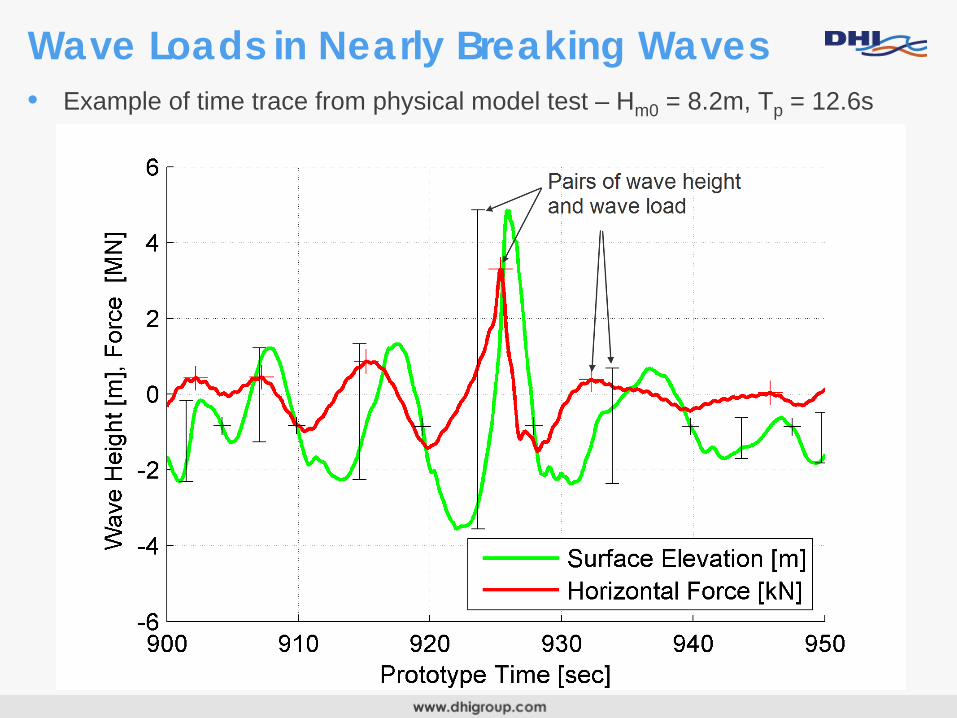
Wave Loads in Nearly Breaking Waves• Example of time trace from physical model test – Hm0 = 8.2m, Tp = 12.6s

Distribution of Wave Heights and Loads • Distributions deviate from Rayleigh

Wave Height Dependency• Significant scatter starting at ~ 8 meter wave height

Steepness and Depth Dependency
2
20
dLH

Distribution of Wave Heights and Loads
Force distribution reconstructed through random sampling from spectral moments, m0 , m1 and m2 , a ”known” wave height distribution and estimated force function

Example of Application – Wave Climate• Hindcast data at exposed shallow water site, from 31 years North Sea/Baltic Sea
model, applying the unstructured mesh code MIKE 21 SW

Example – Storm modes• Storms identified from Hm0 time series, using separation criterion• Integration over sea states of short-term wave height distribution yields most
probable individual wave height in storm• Individual waves in storm sea states are simulated by random sampling, using;
• Battjes and Groenendijk wave height distribution (2000)• Longuet-Higgins joint wave height/period density function (1983)
• Forces are calculated from estimated F(A,Ur) function and maximum is stored• Above procedure is repeated many times for each storm sea state and the
distribution of maximum force thereby obtained.
F [MN] F [MN]
most probable F

Example – Long-term distribution of modes• Derived values of most probable load (mode) in historical storms provide basis
for extreme value analysis of force on foundation• Convolution with short-term variability of load conditional on most probable load
gives long-term distribution of maximum load 1)
mpmpmp
mpmpmp dFFpFfNdFFpFfPFP
00max 1lnexpexp|
1) Tromans and Vanderschuren (1995)H [m] F [MN]

Example – Loads computed with CFD• Numerical wave tank based on DHI CFD-code NS3 applied• Irregular long-crested seas simulated on sloping foreshore• Gravity-based wind turbine foundation structure resolved in model• Loads computed from integration of surface pressure on foundation

Example – Loads computed with CFD

Conclusions• Wave breaking has the effects that;
• extreme waves deviate from Rayleigh distribution• decreasing height of the highest waves• wave heights (of unidirectional seas) appear to obey Battjes and Groenendijk
distribution• extreme wave loads increase non-linearly and with large spreading
• Loads are correlated to wave breaking limit and Ursell number• Above correlation allows for estimating load distribution from known quantities,
such as spectral moments and wave height distribution, whereby site specific design loads can be established
• Inclusion of short-term variability in load is important for the distribution of maximum load
Future improvements• Are there physical constraints on the maximum load that needs to be
considered?• Extension to directionally spread seas

References
• References• Battjes, J. A. and Groenendijk, H. W., Wave height distributions on shallow foreshores, Coastal
Engineering 40 (2000) 161-182, January 2000.• Goda, Y., Random Seas and Design of Maritime Structures, Advanced Series on Ocean
Engineering - Vol. 15 (2nd Edition)• Longuet-Higgins, On the Joint Distribution of Wave Periods and Amplitudes in a Random Wave
Field, Proc. Royal Society A, 1983, 389 (1797), p. 241• Tromans, P.S. and Vanderschuren, L., Response Based Design Conditions in the North Sea:
Application of a New Method, OTC 7683, pp. 387-397, 1995.
Thank you for your attention