watsonwyatt.com winning people practices university of south florida 2007 hr-roi conference jackie...
TRANSCRIPT

watsonwyatt.com
Winning People Practices
University of South Florida2007 HR-ROI Conference
Jackie L. Greaner, Ph.D.February 15, 2007
Copyright © Watson Wyatt Worldwide. All rights reserved
2
Our Game Plan
HCI: Background 1999/2002 HCI Results 2005 Results
– Key Findings Winning People Practices

Copyright © Watson Wyatt Worldwide. All rights reserved
3
The Human Capital Index® (1999-2006) Five iterations of WW ground-breaking Human
Capital Index® (HCI) Research demonstrated:
– Better people management is linked to superior shareholder returns
– There are ‘global truths’ of people management across North America, Europe and Asia-Pacific
– The HCI ranking can be a leading indicator of business performance
Copyright © 2002 United Feature Syndicate, Inc.

Copyright © Watson Wyatt Worldwide. All rights reserved
4
Continue to reaffirm empirically “it pays to manage people right”
Help managers and organizations assess people investments
Provide HR with framework for examining priorities and monitoring metrics
Determine whether some practices offer a “bigger bang for the buck” than others
Further explore relationships between people practices and individual employee behavior (e.g., productivity, turnover)
Why Study the Impact of People Practices?

Copyright © Watson Wyatt Worldwide. All rights reserved
5
HCI: The Business Case
FINDING:Superior HCpractices area leading indicator of financialperformance
FINDING: Companies withbest HC practices provide 3 times the shareholder returnas companies with weak HC practices
FINDING: Specific practices drive shareholder value, while othersactually diminish it
IMPLICATION: HC practices implemented now will help companies inthe future
IMPLICATION:HC outlays can be justifiedusing quantitative data
IMPLICATION:Companies can allocate resources to practices that generate the most value

Copyright © Watson Wyatt Worldwide. All rights reserved
6
First study in 1999 demonstrated link between superior HR practices and shareholder value creation
Questions on human capital practices plus a variety of financial outcome measures (TRS, Market Value)
Identified 30 people practices associated with 30% increase in market value
Five key dimensions: Recruiting Excellence, Clear Rewards and Accountability, Collegial, Flexible Workplace, Communications Integrity and Prudent Use of Resources
The First HCI Report

Copyright © Watson Wyatt Worldwide. All rights reserved
7
Process Overview
Quick Process Review

Copyright © Watson Wyatt Worldwide. All rights reserved
8
750 large, public companies Best HR practices provided 64% total return to
shareholders 3X companies with weakest HR practices
To determine the relationship between HR practices and financial performance, Watson Wyatt compared 2 different correlations using HCI scores and financial data for 51 companies that participated in 1999 and 2002 HCI studies
HCI study shows which People practices(43 specific practices) had the most impact
Significant improvement in all practices leads to a 47% increase in market value
2002 HCI Study Details

Copyright © Watson Wyatt Worldwide. All rights reserved
9
Higher HCI Companies Create More Value
5-Year Total Returnto Shareholders
5-Year TRS(1996-2001)
5-Year TRS(1994-1999)

Copyright © Watson Wyatt Worldwide. All rights reserved
10
About the 2005 HCI: Practices of High Performing Organizations
Study gathered data on budgets, programs and policies correlated with bottom-line performance
Focused on practices that could be measured objectively
Detailed picture of which People practices differentiate high performing organizations

Copyright © Watson Wyatt Worldwide. All rights reserved
11
About the 2005 HCI Research
Included more objective items based on past research indicating correlations with firm performance or with behavioral metrics, e.g. turnover Examples:– How many job applications does your
organization receive?– What is the average number of offers
extended?– Approximately what percentage of non-entry
level positions are filled by promotions from within, external new hires?
Copyright © Watson Wyatt Worldwide. All rights reserved
12
2005 HCI Metrics
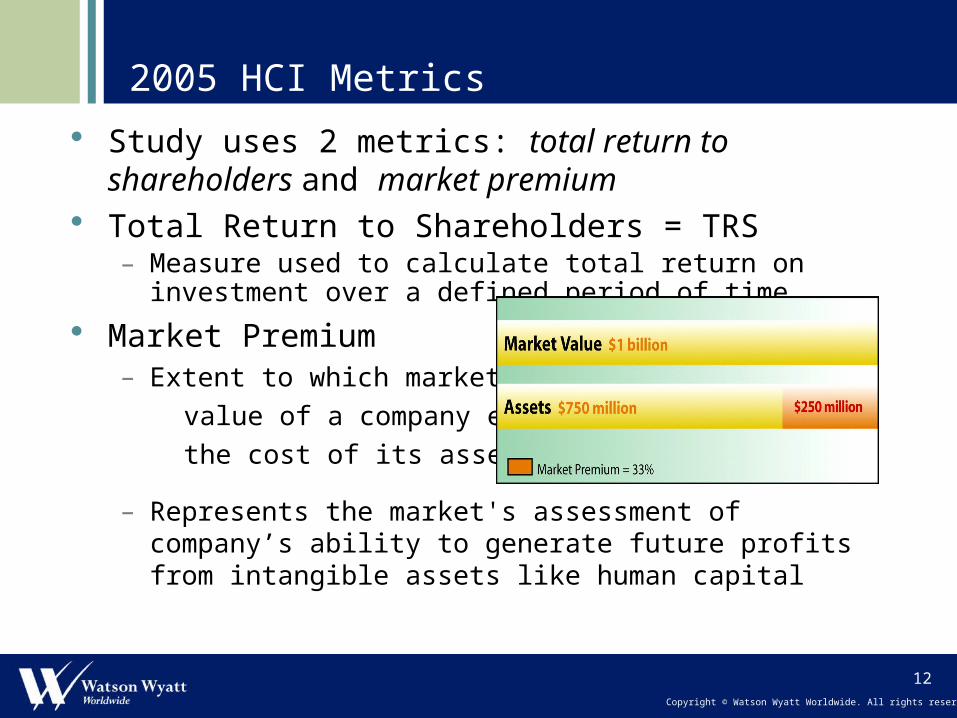
Study uses 2 metrics: total return to shareholders and market premium
Total Return to Shareholders = TRS– Measure used to calculate total return on investment over a
defined period of time
Market Premium– Extent to which market
value of a company exceeds
the cost of its assets
– Represents the market's assessment of company’s ability to generate future profits from intangible assets like human capital

Copyright © Watson Wyatt Worldwide. All rights reserved
13
150 organizations representing all major industry sectors in North America
Average company size $6.4 billion in revenue and 15,400 employees
About the Survey
Respondents by Company Size
21%
10%
17%25%
27%
> 25000 10000-25000 5000-9999
2000-4999 < 2000

Copyright © Watson Wyatt Worldwide. All rights reserved
14
HCI Key Findings – 2005
Employee Development – Best firms balanced approach to hiring non-entry level
positions and fill 1/2 of the non-entry level positions internally.
– TRS nearly 6 X greater – Maintaining Training budgets and having Flatter Organization
structures also correlate to TRS. Recruiting Excellence
– Companies that fill vacancies more quickly reduce disruption and lost productivity.
– TRS = 5X higher – Higher offer acceptance rates and Employee Referred rates
correlate to higher shareholder returns.

Copyright © Watson Wyatt Worldwide. All rights reserved
15
HCI Key Findings – 2005 (2 of 2)
Turnover Management – Firms with “optimal turnover” TRS over 10
points higher.
Total Rewards– The best organizations make sharp
distinctions based on performance and reap TRS 5X higher

Copyright © Watson Wyatt Worldwide. All rights reserved
16
Detailed Findings

Copyright © Watson Wyatt Worldwide. All rights reserved
17
People Practices: Development
Successful development practices include:
– Maintaining a Training Budget
• 3 yr TRS 5X higher
– Filling Non-Entry Level Positions by Promoting from Within and Through the External Market
– Flattening the Organizational Structure
• Creating Fewer Levels and Salary Grades
• Limiting Use of Employee Evaluations of Superiors

Copyright © Watson Wyatt Worldwide. All rights reserved
18
A balanced approach to hiring from within is needed to maximize returns
Best firms fill 1/2 of their non-entry level positions internally
Firms that fill fewer positions internally (12%) have lowest returns (-2%)
Those that fill most positions internally (80% or more) have lower performance (32%)
High Medium Low
% of non-entry level positions filled by promotion from within
80% 50% 12%
Market Premium 35% 42% 2%
3-year TRS 32% 56% -2%

Copyright © Watson Wyatt Worldwide. All rights reserved
19
Less hierarchical organizations allow for faster-paced business
Flatter organizations with fewer levels or salary grades tend to be faster paced
More employees per level or salary grade is associated with higher shareholder returns
Flatter organizations have market premium scores between 2 and 8 X greater than more hierarchical organizations
Employ/Level
# of levels (20k ees)
Market Prem.
3-year TRS
Employ./ Salary Grade
Salary Grades
(20k ees)
Market Prem.
3-year TRS
High 1323 15 38.7% 48% 467 43 30.7% 40%
Low 229 87 4.5% 33% 106 189 15.4% 31%

Copyright © Watson Wyatt Worldwide. All rights reserved
20
360°performance evaluations should be used sparingly
Employee evaluations are best used for feedback and career coaching
Improperly used, 360°evaluations can lead to less informative performance evaluations and inhibit senior managers
Low High
% of employees participating in evaluating immediate supervisors
0% 30%
Market Premium 37.9% 16.8%
3-year TRS 47% 31%

Copyright © Watson Wyatt Worldwide. All rights reserved
21
Better acceptance ratios correlate with higher market premiums
Firms that fill openings with one offer outstrip those that require two or more
One-offer firms have a roughly 3 X the market premium and 12 point higher returns
Low High
Number of offers typically made 1 2 or more
Market Premium 41.2% 14.2%
3-Year TRS 44% 32%

Copyright © Watson Wyatt Worldwide. All rights reserved
22
Employees hired through referrals have lower initial turnover rates
Using employee referrals can be faster and more efficient
Companies that hire more referrals have a market premium 3X higher than those that use fewer referrals
More Referrals Fewer Referrals
Percent of new hires from referrals
38% 9%
Market Premium 39.9% 12.8%
3-Year TRS 48% 23%

Copyright © Watson Wyatt Worldwide. All rights reserved
23
Companies that hire more quickly have higher shareholder returns
Faster recruiting reduces disruption and lost productivity
Organizations that fill positions in around 2 weeks outperform those that take 3X as long by 48 %
Faster Longer
Average Time to Fill Openings
2 weeks 7 weeks
Market Premium 18.2% -1.3%
3-year TRS 59% 11%

Copyright © Watson Wyatt Worldwide. All rights reserved
24
People Practices: Turnover Management
One key to maximizing investment in human capital is to optimize turnover
By balancing departures and arrivals, a firm can extend its earnings potential
Copyright © 1994 United Feature Syndicate, Inc.

Copyright © Watson Wyatt Worldwide. All rights reserved
25
Balanced turnover is associated with the best firm performance
Some turnover is healthy
Firms with too much (~ 43 percent) and too little turnover (~ 5 percent) had the lowest returns
Organizations with moderate turnover (~ 15 percent) had highest shareholder returns
Turnover Rate High Moderate Low
Voluntary 25% 9% 2%
Involuntary 18% 6% 3%
Total Percent (assuming 20K employees)
43%
(8,600)
15%
(3,000)
5%
(1,000)
Market Premium 14.2% 28.1% 1.1%
3-year TRS 34% 43% 31%

Copyright © Watson Wyatt Worldwide. All rights reserved
26
The Voluntary Turnover Landscape
13.7%
2003 2004 2005 2006*
Industry Benchmark
11.7%
9.6%
7.9%
Areas of Concern
Overall Customer Service Organization
New employees
Hispanic and African American
12.0%
Watson Wyatt’s Human Capital Index research suggest that companies with a 9% rate of voluntary produce the highest shareholder value
12.0%
*As of 6/30/06
11.4%
Copyright © Watson Wyatt Worldwide. All rights reserved
27
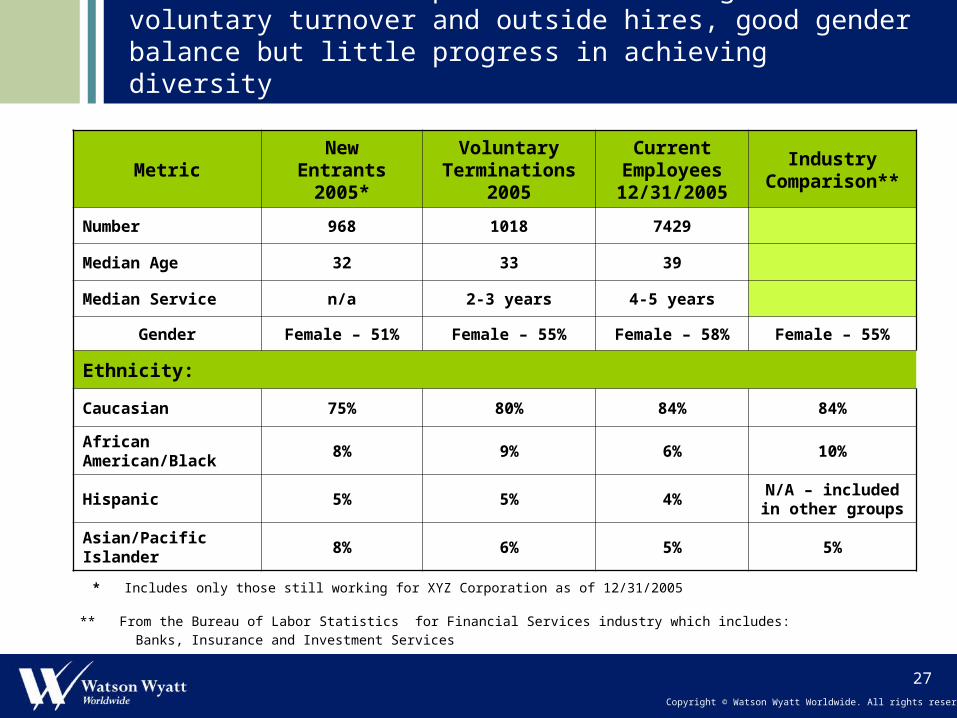
The 2005 workforce profile shows a high rate of voluntary turnover and outside hires, good gender balance but little progress in achieving diversity
MetricNew
Entrants2005*
Voluntary Terminations
2005
Current Employees12/31/2005
Industry Comparison**
Number 968 1018 7429
Median Age 32 33 39
Median Service n/a 2-3 years 4-5 years
Gender Female – 51% Female – 55% Female – 58% Female – 55%
Ethnicity:
Caucasian 75% 80% 84% 84%
African American/Black
8% 9% 6% 10%
Hispanic 5% 5% 4%N/A – included in
other groups
Asian/Pacific Islander 8% 6% 5% 5%
* Includes only those still working for XYZ Corporation as of 12/31/2005 ** From the Bureau of Labor Statistics for Financial Services industry which includes: Banks, Insurance and Investment Services

Copyright © Watson Wyatt Worldwide. All rights reserved
28
People Practices: Total Rewards Total Rewards strategies aid in
– Aligning employees with organization’s objectives– Getting employees to give discretionary effort – Encouraging employees to stay
Total Rewards strategies that offer high returns:– Finding right mix of short- and long-term incentives – Using customer satisfaction in rewarding bonuses– Maintaining a larger merit increase and promotion
budget– Making sharp merit distinctions between employees– Targeting benefit levels higher relative to the market– Maximizing executive eligibility for stock options,
restricted stock and discounted stock purchase – Making more employees eligible for discounted stock
purchase – Having a high employee stock ownership

Copyright © Watson Wyatt Worldwide. All rights reserved
29
Firms with a total rewards strategy outperform other firms
Looking at benefits and rewards holistically adds value to an organization
Firms with total rewards strategy have a market premium nearly 3X greater than those without
Do you have a total rewards strategy?
Yes No
Market Premium 36.9% -17.8%
3-year TRS 37% 33%

Copyright © Watson Wyatt Worldwide. All rights reserved
30
Incentives should figure prominently in a total rewards strategy
Previous HCI reports showed that paying top-performers significantly more associated with higher returns
True for short- and long-term incentives (STI/LTI) STI/LTI should constitute a significant portion of
rewards
High STI / LTI
High Salary
Salary as % of Total Rewards 63% 79%
STI / LTI as % of Total Rewards 13% 8%
Market Premium 48.9% -2.8%
3-year TRS 44% 25%

Copyright © Watson Wyatt Worldwide. All rights reserved
31
Firms must make hefty distinctions between high and low performers
Best organizations make substantial distinctions in short term incentives
Organizations that make largest distinctions and pay top performers more than 4½ times the payout of lower performers had a 3-year TRS 49 points higher
High Differential Companies
Low Differential Companies
Payout to higher performing ees vs. lower performing ees
4.7 2.1
Market Premium 30% 6.7%
3-year TRS 47% -2%

Copyright © Watson Wyatt Worldwide. All rights reserved
32
High-performing firms link customer satisfaction to bonus objectives
Customer satisfaction is an important bonus factor for those with direct customer contact
Firms that tie customer satisfaction to bonus objectives had a 3-year TRS more than 3X higher
High Low
% of employees with direct customer contact with bonus objectives tied to customer satisfaction
77% 0%
Market Premium 10.1% 8.6%
3-year TRS 73% 23%

Copyright © Watson Wyatt Worldwide. All rights reserved
33
Firms should use stock-based incentive compensation
Firms with widest eligibility for stock options, restricted stock plans and discounted stock purchase plans surpass those that don’t
Stock Option
Restricted Stock
Discounted Stock purchase
High Low High Low High Low
% of executive/
managers eligible
93% 5% 36% 0% 98% 0%
Market Premium 31.7%
18.7%
33.6% 26.7% 67% 0.8%
3-year TRS 38% 37% 50% 24% 57% 27%

Copyright © Watson Wyatt Worldwide. All rights reserved
34
Winning People Practices
Maximize your return on human capital by focusing on:– Recruiting Excellence
• Fill key positions quickly • Increase offer acceptance ratio• Utilize employee referrals
– Employee Development
• Maximize training
• Balance promotion from within with external hires
• Maintain fewer salary levels and grades
• Limit employee evaluations of managers
Copyright © Watson Wyatt Worldwide. All rights reserved
35
Winning People Practices (cont’d)
Total Rewards– Target benefit levels above market – Link bonus pay to customer satisfaction, when
possible– Utilize STI, stock-based and other LTI– Stringently differentiate between high and low
performers Turnover Management
– Balance turnover
Copyright © Watson Wyatt Worldwide. All rights reserved
36
For more information
www.watsonwyatt.com
THANK YOU
Copyright © Watson Wyatt Worldwide. All rights reserved
37
Appendix

Copyright © Watson Wyatt Worldwide. All rights reserved
38
HCI Leads Financial Performance
1999 FinancialOutcomes
=
=
Correlation B
1999 HCI 2002 FinancialOutcomes
2002 HCI
Correlation A
X
X

Copyright © Watson Wyatt Worldwide. All rights reserved
39
Key Links Between Human Capital and Shareholder Value (NA)
Significant Improvement 47% Increase in Market Value
Total Rewards & Accountability and Value Creation
Collegial, FlexibleWorkplace and Value Creation
Recruiting & Retention Excellence and Value Creation
Communications Integrity and Value Creation
Focused HR ServiceTechnologies and Value Creation
Expected change in market value associated with a significant (1 SD) improvement in HCI dimension