waterstructureacrylateaugust2015fk2
DESCRIPTION
ddTRANSCRIPT

Structure and Hydrogen Bonding of Water
in Polyacrylate Gels: Effects of Polymer
Hydrophilicity and Water Concentration
Sriramvignesh Mani, Fardin Khabaz, Rutvik V. Godbole,
Ronald C. Hedden and Rajesh Khare*
Department of Chemical Engineering, Texas Tech University,
Box 43121
Lubbock, TX 79409-3121
*Corresponding author: Email: [email protected]
Tel.: (806) 834-0449

Abstract
The ability to tune hydrophilicity of polyacrylate copolymers by altering their
composition makes these materials attractive candidates for membranes for separating alcohol-
water mixtures which are otherwise energy intensive to separate. The separation behavior of
these polyacrylate membranes is often counterintuitive and is governed by a complex interplay
of a number of factors such as water and alcohol concentration, water structure in the membrane,
polymer hydrophilicity and temperature. We use molecular dynamics (MD) simulations to
investigate the effect of polymer hydrophilicity and water concentration on the local structure
and dynamics of water molecules in the polymer matrix. A set of polyacrylates of varying
hydrophilicity – poly n-butyl acrylate (PBA) and poly 2-hydroxyethyl acrylate (PHEA) - as well
as copolymers of BA and HEA were studied for this purpose. Samples of PBA, PHEA and their
50-50 copolymer were synthesized in laboratory and their properties were measured. Model
structures of these systems were validated by comparing the simulated values of their glass
transition temperature (Tg) and density with the experimental data. Molecular models of
polyacrylate gels swollen with water and ethanol were also prepared. Water was found to exhibit
very different affinities towards the different (carbonyl, alkoxy and hydroxyl) functional groups
in the systems. Water molecules were well dispersed in the system at low concentrations and
predominantly formed hydrogen bonds with the polymer rather than with other water molecules.
On the other hand, water formed large clusters at high concentrations along with predominant
formation of water-water hydrogen bonds. The effects of water concentration and polymer
hydrophilicity are coupled since the amount of water in the equilibrium swollen gels increases
with an increase in polymer hydrophilicity. The results for molecular structure of water in these
1
systems can be used for elucidating the concentration dependence of water diffusivities in the
polymer membranes.
I Introduction
Water sorption and diffusion in polymers have a large impact on the efficiency of many
practical applications such as fuel cells1, 2, controlled drug release,3 and membrane based
separation processes.4, 5 Previous studies have indicated that presence of water in the polymer
matrix significantly affects its properties such as glass transition temperature6, 7 and penetrant
transport.8, 9 The properties of water molecules confined in a polymer matrix are different from
those of the bulk water.10 The system characteristics of interest such as water mobility,
clustering of water molecules and hydrogen bond distribution show a strong dependence on the
water content in the system and its interaction with the polymer matrix.
The process of separation of mixtures using polymeric membranes has been the subject
of past experimental and simulation work.11-24 These studies showed that key characteristics of
the membranes such as diffusivity, selectivity, and flux, exhibit a strong dependence on the
composition of the feed and the penetrant-polymer interactions. Simulation studies have
indicated that the interaction between polymer and water molecules is mediated by the polar
groups and the degree of solvation of the hydrophilic groups increases with increasing water
content.19-24
Several studies have also reported that increasing water concentration leads to the
formation of clusters of water molecules.22, 23, 25-29 On the other hand, MD simulation study of
ethanol and water in poly vinyl alcohol (PVA) membranes28 concluded that unlike water
molecules, ethanol molecules do not form clusters and are mostly isolated inside the network.
2
Furthermore, water aggregation was found to affect hydrogen bond (both water-water and water-
polymer) distribution in the system.25, 30-33 Dynamics of water molecules are also affected by the
water content in these systems.23, 27, 30, 32, 34 Increase in water content is found to cause a reduction
in both the rotational relaxation time of water molecules and the lifetime of hydrogen bonds
between water molecules.
A practical application of current interest where polymer membranes can be used for
separations of aqueous mixtures is the purification of biofuels by pervaporation.35, 36 Indeed, a
main obstacle in the commercialization of biofuels technologies is the high cost of separation of
the dilute alcohol-water mixture that results from the fermentation of the biomass. Polymer
membrane based pervaporation is a promising solution to this problem. Polyacrylates constitute
a class of polymers whose hydrophilicity can be systematically tuned by choosing the copolymer
composition from a large library of monomers, thus making these attractive candidate materials
for the membranes for separating alcohol-water mixtures. However, little work has been done to
characterize the performance of polyacrylate membranes for separation applications. The
separation efficiency of water – 1,1,2-trichloroethane mixtures using acrylate membranes was
experimentally studied by Hoshi et al.,15 while Matsui and Paul16 studied the separation of
toluene – iso-octane mixtures using crosslinked acrylate copolymers. Our interest is the
separation of dilute (10-100 g/L) ethanol-water mixtures that result from the sugar fermentation
during the biofuels production process. Recently, some of us demonstrated a combinatorial
method for the synthesis of a large library of polyacrylate copolymers of varying composition
and also demonstrated the utility of this approach for screening candidate materials for
pervaporation based separation of alcohol-water mixtures.37 The performance characteristics of
these membranes are governed by a complex interplay of factors such as feed composition,
3

hydrogen bonding and polymer hydrophilicity. With this motivation, we use MD simulations to
investigate the local structure and hydrogen bonding characteristics of water in polyacrylate
systems of varying degree of hydrophilicity and water content. A set of experiments are also
carried out to generate data that are used to support the molecular models.
The specific polymer systems studied in this work consisted of the homopolymers and
copolymers (in 3 different stoichiometric ratios) formed by the monomers BA and HEA. The
hydrophobic and hydrophilic nature of BA and HEA, respectively, provide the opportunity to
systematically tune the hydrophilicity of these polymers and determine the effect of polymer
composition on the water structure and hydrogen bonding characteristics of the system. We first
built models of linear homopolymers and copolymers of these monomers and validated these
against experimental data for the volumetric properties. Next, cross-linked networks of these
systems containing pentaerythritol tetraacrylate (PETA) as the cross-linking agent were
synthesized experimentally. Swelling experiments were carried out to determine the mass
fractions of water and ethanol in the equilibrium swollen gels. Atomistically detailed model
structures of swollen gels were prepared; these were used to study the effects of polymer
hydrophilicity and water concentration on the local structure and hydrogen bonding in the
swollen polyacrylate gel systems.
II. Methods
The work consisted of both simulations and experiments; important details of the simulation and
experimental methods are described below.
II. A. Simulation procedures
II.A.1. Force field and simulation details
4

Linear homopolymers and copolymers as well as networks formed by BA and HEA
monomers were studied in this work. Of these, BA is hydrophobic and HEA is hydrophilic.
Pentaerythritol tetraacrylate (PETA) was used as the cross-linking agent for creating the model
networks. The chemical structures of the monomers and the cross-linker are shown in
Supporting Information (Figure S1). Simulations were carried out using the general AMBER
force field (GAFF),38, 39 while the TIP3P model40, 41 was used for water. In addition, the SHAKE
algorithm42 was applied to constrain the bond lengths and bond angles of the water molecules.
Partial charges on the atoms were determined by AM1-BCC method.43, 44 For the polymer
simulations, van der Waals and electrostatic interactions were truncated at 9 Å, while for water-
containing systems, a longer cut-off of 12 Å was used. The long range part of the interactions
was handled by tail corrections and particle-particle particle-mesh (PPPM)45 solver for van der
Waals and electrostatic interactions, respectively. The temperature and pressure of the systems
were held constant using the Nosé Hoover thermostat and barostat.46, 47 The MD simulations
were carried out using the LAMMPS package48 with a time step of 1 fs and all structural
properties were evaluated at a pressure of 1 atm and a temperature of 300 K.
II.A.2. Structure preparation
Two types of model systems were studied in this work: linear acrylate polymers (formed
by BA and HEA) and cross-linked acrylate networks (formed by BA, HEA and the cross-linker
PETA) that are swollen with water-ethanol mixture. In both cases, the structures were built
using the simulated annealing polymerization method.49, 50 All of the model structures studied in
this work contained between 72,000 -76000 atoms.
For the linear polymer systems, the reaction mixture with appropriate stoichiometric ratio
of the BA and HEA monomers was first placed in the simulation box. Five linear polyacrylate
5

systems with HEA mole fractions of: 0 (i.e. homopolymer of BA), 0.25, 0.50, 0.75 and 1.0 (i.e.
homopolymer of HEA) were studied, these are denoted in the rest of the paper by PBA, P(BA75-
HEA25), P(BA50-HEA50), P(BA25-HEA75), and PHEA respectively. The optimum
polymerization sequence consisting of the spatially closest potential reacting pairs was
determined in the next step using the simulated annealing multivariable optimization technique.
The system was then polymerized by forming bonds between the reacting pairs so identified and
the structures were relaxed using MD simulation at a temperature of 300 K for a duration 4 ns.
The simulation box of pure linear PHEA system is shown in Supporting Information (Figure
S2).
The same procedure was followed for building models of cross-linked networks swollen
by water and ethanol with the exception that in this case, the initial reaction mixture consisted of
the BA and HEA monomers, the PETA cross-linker molecules, and water and ethanol molecules.
A well-relaxed and equilibrated structure was obtained by gradually cooling the system from T =
360 K to T = 300 K, at the rate of 4 K/ns. An initial temperature of T = 360 K was chosen for
this purpose so as to prevent the system from separating into two phases (i.e. to prevent any
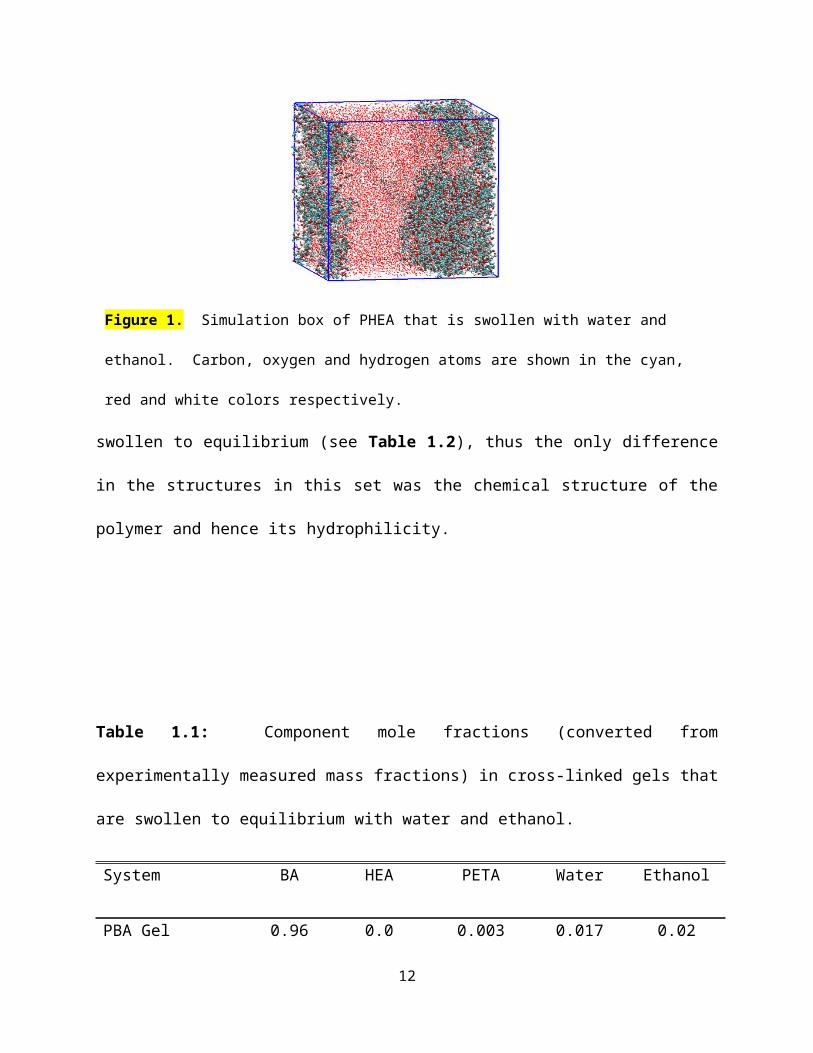
possible vaporization of water). Figure 1 shows the simulation box of PHEA gel that contains
water and ethanol. For the purposes of studying the effect of water concentration on the system
properties, two sets of model gel structures were prepared: (1) In the first set, the model gels
contained the same mass fractions of water and ethanol as that measured in experiments on the
equilibrium swollen gels (see section II.B), thus each gel had a different amount of solvent, with
PHEA gel containing the highest amount (see Table 1.1), and (2) In the second set, all of the
polyacrylate gel structures contained the same mole fraction of water as that contained in the
6

PBA gel swollen to equilibrium (see Table 1.2), thus the only difference in the structures in this
set was the chemical structure of the polymer and hence its hydrophilicity.
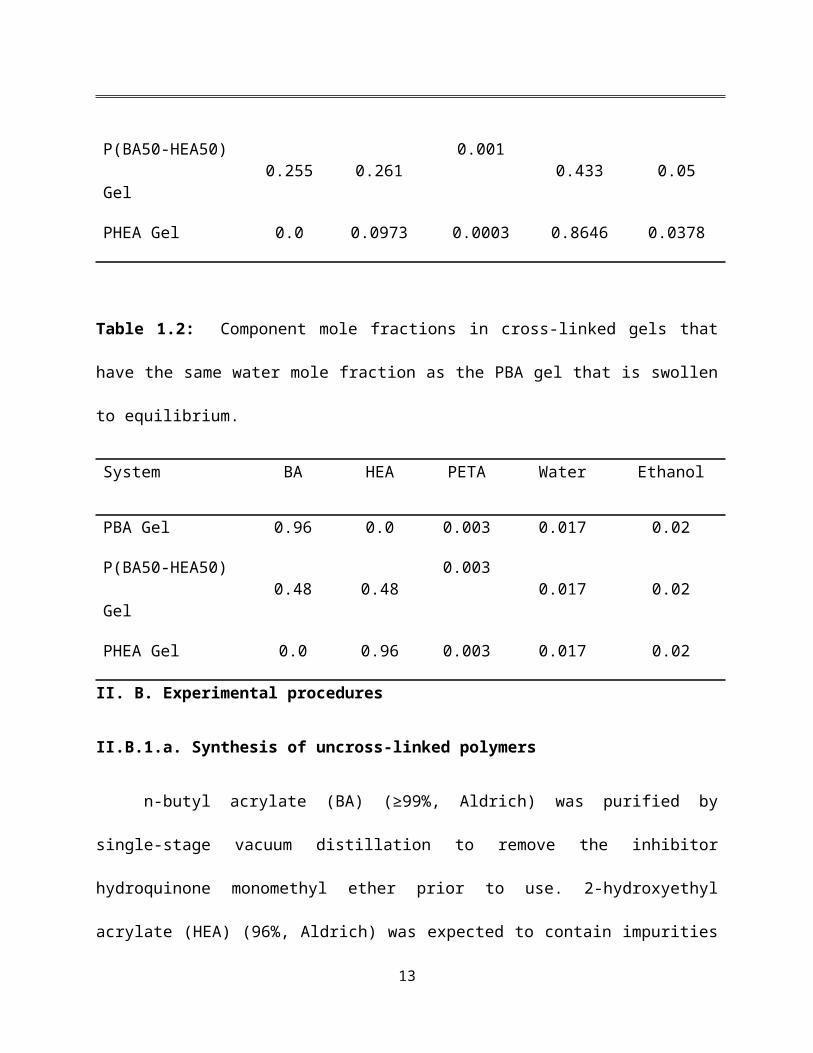
Table 1.1: Component mole fractions (converted from experimentally measured mass fractions)
in cross-linked gels that are swollen to equilibrium with water and ethanol.
System BA HEA PETA Water Ethanol
PBA Gel 0.96 0.0 0.003 0.017 0.02
P(BA50-HEA50) Gel 0.255 0.261 0.001 0.433 0.05
PHEA Gel 0.0 0.0973 0.0003 0.8646 0.0378
Table 1.2: Component mole fractions in cross-linked gels that have the same water mole
fraction as the PBA gel that is swollen to equilibrium.
7
Figure 1. Simulation box of PHEA that is swollen with water and ethanol. Carbon, oxygen and
hydrogen atoms are shown in the cyan, red and white colors respectively.

System BA HEA PETA Water Ethanol
PBA Gel 0.96 0.0 0.003 0.017 0.02
P(BA50-HEA50) Gel 0.48 0.48 0.003 0.017 0.02
PHEA Gel 0.0 0.96 0.003 0.017 0.02
II. B. Experimental procedures
II.B.1.a. Synthesis of uncross-linked polymers
n-butyl acrylate (BA) (≥99%, Aldrich) was purified by single-stage vacuum distillation to
remove the inhibitor hydroquinone monomethyl ether prior to use. 2-hydroxyethyl acrylate
(HEA) (96%, Aldrich) was expected to contain impurities such as acrylic acid51 and ethylene
glycol diacrylate (EGDA)51 that could affect the Tg of the polymers produced; the HEA was
therefore washed via the extraction procedure reported by Coca et al.52 After treatment, HEA
was further purified by single-stage vacuum distillation in a custom-built apparatus with a
cryogenic condenser cooled by acetone to approximately -60 C. Solvents tetrahydrofuran (THF)
(99.9%, Fisher Scientific), N,N-Dimethylformamide (DMF) (99.8%, Macron), deuterated
chloroform (99.8 atom % D, Aldrich), methanol (≥99.5 %, Macron), toluene (≥99.5 %, Aldrich),
hexanes (≥99 %, Macron), and diethyl ether (≥99 %, Aldrich), were used as received.
II.B.1.b. Synthesis of HEA homopolymer
Photoinitiator Irgacure 2959 (Ciba) was used to photopolymerize HEA monomer in
solution using a 100 W, broadband UV bulb (peak wavelength 365 nm) at a distance of 20 cm
with a UV exposure time of 4 h. Polymerization of HEA was conducted in aqueous solution
with a 1:5 v/v ratio of HEA in water to discourage formation of a cross-linked network via chain
transfer to polymer. The resulting polymer likely contains some degree of long-chain branching,
8

based on the fact that bulk HEA polymerizations form gels in the absence of any crosslinking
agents as reported by Bian and Cunningham.53 The concentration of Irgacure 2959 was 1.0%
w/w based on the total mass of water and monomer. Polymerization was started at ambient
temperature (22 C) and allowed to proceed in a fluoropolymer dish without stirring. The
thickness of the polymerized layer was 3 to 5 mm.
Water was removed by placing the solution under vacuum at ambient temperature (22 C)
overnight in a desiccator with excess anhydrous Ca(SO4). Residual monomer and oligomers
were removed by dissolving the polymer in DMF and precipitating using toluene-hexane
mixtures; this procedure was repeated three times. The remaining polymer (yield: 50%) was
then dried under vacuum until the mass of the sample stabilized. The product structure was
confirmed by 1H NMR in DMSO-d6 (Figure S3a in Supporting Information), and the spectrum
closely matched that reported by Coca et al.52 The details of the 1H NMR spectroscopy are given
in Supporting Information.
II.B.1.c. Synthesis of 50/50 HEA/BA copolymer
A similar procedure was employed to polymerize a 50/50 mole % HEA/BA mixture in
DMF (total concentration of monomers 50 % w/w). Polymerization was conducted under N2
atmosphere with 1.0 % w/w Irgacure 2959. The polymerization was terminated after 4 h and
the polymer was precipitated by addition of excess water. Residual HEA monomer and
oligomers were removed by re-dissolving the polymer in DMF and precipitating using water;
this procedure was repeated three times. The polymer was vacuum dried and washed three
additional times with hexane to remove any hydrophobic extractable components, then dried
again under vacuum (yield: 70%).
II.B.1.d. Synthesis of BA homopolymer
9

Thermal polymerization of BA was conducted in toluene solution with a 1:2 v/v ratio of
BA to toluene. The initial concentration of thermal initiator 2, 2’-azobisisobutyronitrile (AIBN)
was 1 % of the total mass of the solution. Polymerization was carried out under N2 at 70 C. The
reaction was terminated after 4 h and the polymer was precipitated using excess methanol. The
polymer was re-dissolved in toluene and precipitated using methanol three times. The poly(n-
butyl acrylate) was then dried under vacuum (yield: 45%). The product structure was confirmed
by 1H NMR in CDCl3 (Figure S3b in Supporting Information), and the spectrum closely
matched that reported by Farcet et al.54 Part of the polymer was dissolved in tetrahydrofuran
(THF) to determine molar mass using gel permeation chromatography (GPC). The details of the
GPC are given in Supporting Information.
II.B.2.a. Synthesis of gel networks
Homopolymer and copolymer networks were synthesized by thermally initiated, bulk
free radical polymerization of 2-hydroxyethyl acrylate (96%, Aldrich) and n-butyl acrylate
(≥99%, Aldrich) using pentaerythritol tetraacrylate (PETA, 10%-40% triester, Aldrich) as the
cross-linker and 2,2'-azobisisobutyronitrile (AIBN, 98%, Aldrich) as the initiator. Acrylate
monomers initially contained hydroquinone monomethyl ether as inhibitor, which was removed
by passing through a Sigma-Aldrich (306312-IEA) column. The concentration of AIBN in all
samples was 0.5 mass % of the total mixture. AIBN was dissolved into each monomer
immediately before mixing of the components.
Gel networks were prepared by pipetting calculated masses of monomers and cross-linker
into a 1.8 ml sealed glass vials. For copolymer, the mole fraction of acrylates belonging to both
monomers were taken to be 0.5, while the mole fraction of reactive groups belonging to cross-
linker (XC) was kept at a very low value of 0.0105 for all samples. All of the samples were cured
10

at 47 C in a temperature-controlled water bath overnight. Care was taken to prevent water from
entering the sample containers.
II.B.2.b. Swelling in mixed solvents: extraction of sol fraction
In order to extract the soluble fraction from the network, each sample was immersed in a
comparatively large volume of ethanol and swollen at room temperature until equilibrium mass
(Ms) was reached (generally 3 d to 5 d). The ethanol was replaced daily to remove any
dissolved, extractable components. Drying was accomplished by placing the gel in air for 2 d,
followed by drying under vacuum until the mass of the sample reached an equilibrium value
(Mex).
II.B.2.d. Swelling in mixed solvents: calculation of mass fractions
Mole fractions of water and ethanol were found by combining gravimetric swelling
measurements and high performance liquid chromatography (HPLC) analysis of the external
liquid phase. The details of the HPLC analysis are given in Supporting Information. If a network
is swollen to equilibrium in a mixture of alcohol and water of initial mass fractions a0 and w0
(=1-a0), and the swollen mass of the network in the mixture is Mm, then the combined masses of
water (Mwm) and alcohol (Mam) in the network phase at equilibrium are given by eqn. 1.
M wm+M am=M m−M ex (1)
In eqn. 1, Mex is the extracted mass of the (dry) network sample. The final mass fraction
of alcohol in the external solution (as) is found by HPLC analysis by comparison with the
standard sample(s). A simple mass balance on the system permits calculation of the masses of
water and ethanol inside the network, knowing the initial mass of ethanol-water mixture (M l ).
Masses of water and ethanol inside the network are given by eqns. (2a) and (2b).
11
M am=ωa0 ( Ml )−ωas (M l−(M m−M ex )) (2a)
M wm=ωw 0 ( Ml )−ωws ( M l−( M m−M ex )) (2b)
III. Results and discussion
III. A. Volumetric properties of linear polyacrylate model structures are in good agreement
with the experimental data
The linear (i.e. uncross-linked) polymer model structures without any solvent molecules
were validated by determining their volumetric properties, namely, density and glass transition
temperature (Tg), and comparing these against experimental data.
For the experimental part, samples of linear polymers - PBA, P(BA50-HEA50)
copolymer and PHEA - were prepared by free radical polymerization as described above without
mixing with water and ethanol. The precipitation and vacuum drying procedures applied to the
raw polymers were designed to remove oligomers that might plasticize the materials and lower
their measured Tg values. GPC analysis of the PBA revealed that it was essentially free of
oligomers with molar mass < 5 kg/mol. The number average molar mass for PBA was
approximately 70 kg/mol with polydispersity index (PDI) of 1.65. GPC analysis was not
performed on the HEA homopolymer and the P(BA50-HEA50) copolymer because of
insolubility in the mobile phase (THF). (The molar mass for the HEA-containing polymers
obtained from GPC would not have been quantitative, regardless, due to the tendency of the
HEA to branch extensively during polymerization53, changing the hydrodynamic volume of the
chains.) All samples could be dissolved either in DMSO or chloroform, indicating a lack of
gelation, which permitted analysis of copolymer composition by 1H NMR spectroscopy. The
12
HEA content for the P(BA50-HEA50) copolymer was determined to be 0.490.02 (mole
fraction), very close to the composition of the monomer mixture. The HEA homopolymer and
P(BA50-HEA50) copolymer were produced by polymerizing the monomers in solution because
bulk polymerization resulted in gelation via branching due to chain transfer to polymer.53
13

Glass transition temperatures were measured by differential scanning calorimetry (DSC)
using identical heating and cooling rates of 10 C/min. The details of the DSC are given in
Supporting Information. Glass transition temperatures (Tg) obtained by the Analysis 2000
software (TA instruments) are reported. Three heating cycles were conducted for each sample to
verify reproducibility, and the second and third cycles always produced the same value of T g
within 0.1 C. Following literature practice,55 we use fictive temperature (Tfg) measured with the
identical heating and cooling rates as approximation to Tg. We note that because negligible
relaxation occurs upon re-heating at the same rate, T fg is taken as a reasonable approximation for
T'f, the limiting fictive temperature; additionally, Simon et al. have noted that T'f measured on
heating approximates the value of Tg measured on cooling.56 The measured values of Tg for
PBA, PHEA, and the P(BA50-HEA50) copolymer were 228 K, 266 K, and 252 K, respectively.
14
Figure 2. Specific volume of polyacrylate systems as a function of temperature. Following
symbols are used: PBA (blue plus), P(BA75-HEA25) (green square), P(BA50-HEA50) (brown
star), P(BA25-HEA75) (black diamond) and PHEA (red circle).

For the simulations, the same protocol as employed by one of us in previous work57, 58
was followed to determine the volume-temperature behavior. In particular, the model structures
were cooled in a step-wise fashion from a high temperature of T = 600 K to T = 100 K in steps
of 20 K. At each temperature, system was subjected to constant NPT (constant number of
molecules, pressure and temperature) MD simulation for 2 ns and the specific volume was
obtained by averaging the data over the second half of the runs. Tg is obtained as the point of
intersection of linear fits to specific volume data over rubbery and glassy regions.
Figure 2 shows the specific volume of the model linear polyacrylate systems as a
function of the temperature. As expected, the Tg values for the copolymers are between those of
the homopolymers and change monotonically with composition. The variation of the quantity
(Tg – Tg PBA) i.e. increase in Tg relative to Tg of PBA, as a function of mole fraction of HEA
monomer is shown in Supporting Information (Figure S4); results obtained by simulations and
experiments are compared in the figure. As seen from the figure, the relative trend of
composition dependence of Tg obtained from simulations is in good quantitative agreement with
that measured in experiments.
15
To make further quantitative comparison between simulations and experiments, we note that the
simulated values of the Tg of pure PBA and PHEA are 290 K and 372 K, respectively, which are
about 65 K and 95 K larger than the corresponding experimental values. This observed shift in
Tg values determined in simulations compared to the experiments, is well known in literature and
is due to the high cooling rates that are used in the simulations (10 K/ns) compared to the
experiments 10K/min.59-61 The expected shift in the value (ΔTg) due to the higher cooling rates
can be estimated by the Williams-Landel-Ferry (WLF) expression as follows:
log( qexp
qsim)=−C1 ΔT g
C2+ΔT g where C1 and C2 are the parameters in the WLF expression, qexpandqsim
are the cooling rates used in experiments and simulations, respectively. Using the universal
values of C1 = 17.44 and C2 = 51.6 K,61 the shift in Tg is estimated to be in the range 77 – 84 K
(actual value depends on the cooling rate used in a particular experiment). As seen from Table
2, the simulated values of the Tg are in good agreement with the experimental values when this
shift is accounted for.
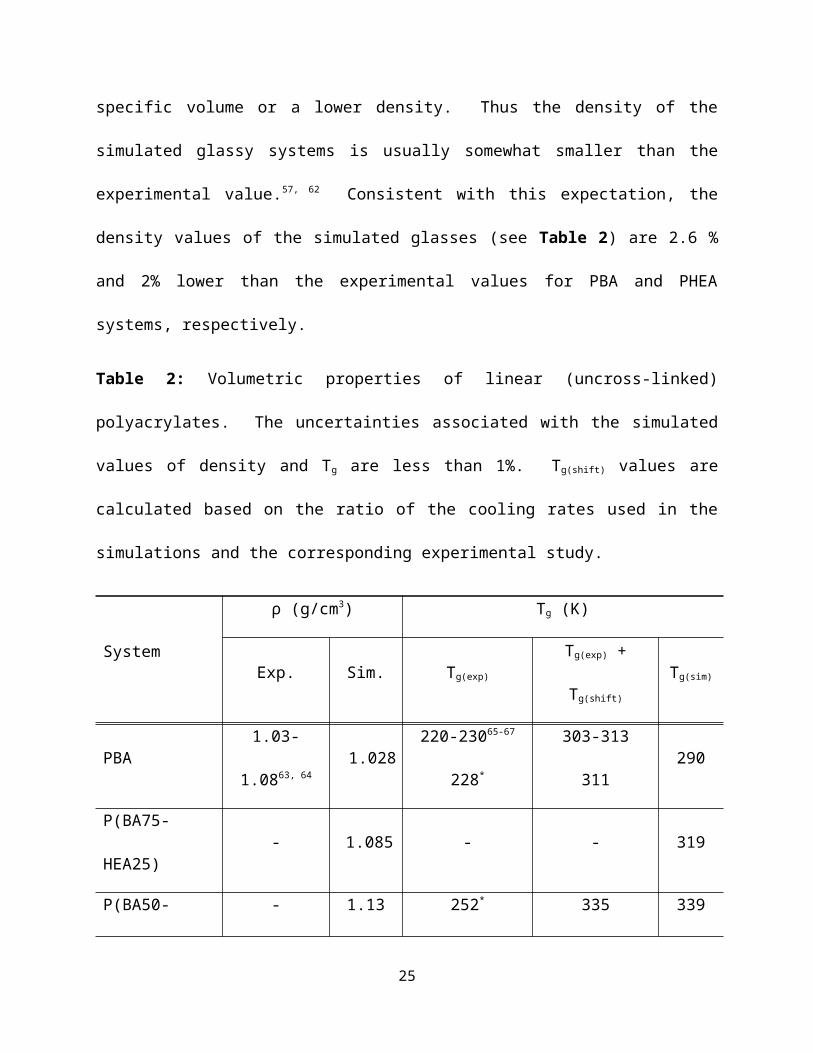
A glass formed at a higher temperature will have a higher specific volume or a lower
density. Thus the density of the simulated glassy systems is usually somewhat smaller than the
experimental value.57, 62 Consistent with this expectation, the density values of the simulated
glasses (see Table 2) are 2.6 % and 2% lower than the experimental values for PBA and PHEA
systems, respectively.
Table 2: Volumetric properties of linear (uncross-linked) polyacrylates. The uncertainties
associated with the simulated values of density and Tg are less than 1%. Tg(shift) values are
calculated based on the ratio of the cooling rates used in the simulations and the corresponding
experimental study.
16
System
ρ (g/cm3) Tg (K)
Exp. Sim. Tg(exp) Tg(exp) + Tg(shift) Tg(sim)
PBA 1.03-1.0863, 64 1.028220-23065-67
228*
303-313
311290
P(BA75-HEA25) - 1.085 - - 319
P(BA50-HEA50) - 1.13 252* 335 339
P(BA25-HEA75) - 1.21 - - 349
PHEA 1.3168 1.28528868
266*
365
349372
* Experimental values obtained in this work.
The volume-temperature data can also be used to calculate the coefficient of volume
thermal expansion (CVTE) of these systems. The CVTE (α) is calculated as the derivative of
volume with respect to the temperature normalized by the volume at that temperature:
. The variation of the CVTE as a function of temperature for all five systems
studied is shown in Supporting Information (Figure S5). As expected for the glass forming
systems, the plot shows plateau-like regions at the high and low ends of the temperature range
corresponding to the rubbery and the glassy states respectively. In the intermediate temperature
range (between 200 K and 500 K) corresponding to the glass transition region, the value of
17

CVTE shows a large reduction from the rubbery state value to the glassy state value. As noted
previously,62 the transition region is significantly wider in simulations than in experiments due to
the usage of very high cooling rates in simulations. The value of α for PBA is larger than that of
PHEA, and the values for the copolymers lie between those for the homopolymers.
III. B. Water packs differently around carbonyl, alkoxy and hydroxyl functional groups in
polyacrylates
Packing in PBA: The polyacrylate systems studied here possess three oxygen containing
functional groups – carbonyl, alkoxy and hydroxyl – each of which can form hydrogen bonds
with water. We determined the radial distribution function (RDF) of water around each of these
functional groups to assess the packing of water molecules around them. The RDF quantifies the
normalized probability of finding an atom or molecule at a distance r from another
atom/molecule. As seen from Figure 3, both water-carbonyl and water-alkoxy RDFs for PBA
system show only one peak with water packing preferentially near the carbonyl group (greater
peak height) rather than the alkoxy group.
Further insight into the packing of water molecules in the system can be obtained by
focusing on the probabilities of formation of water-water and water-polymer hydrogen bonds for
a given water molecule. For this purpose, hydrogen bonds in the system were located by using
the geometric criterion.25, 69-71 Thus, two water molecules were considered to be hydrogen bonded
if their inter-atomic oxygen distance was less than 3.5 Å, the oxygen-hydrogen distance was less
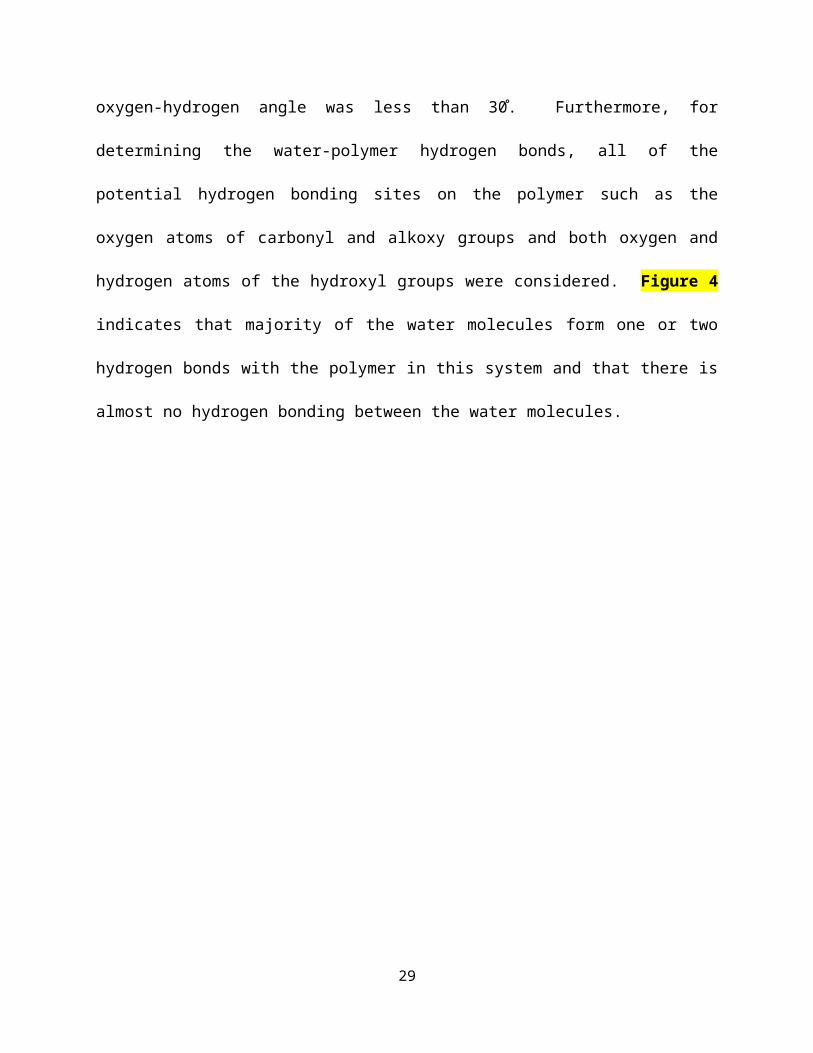
than 2.5 Å, and the oxygen-oxygen-hydrogen angle was less than 30T. Furthermore, for
determining the water-polymer hydrogen bonds, all of the potential hydrogen bonding sites on
18
the polymer such as the oxygen atoms of carbonyl and alkoxy groups and both oxygen and
hydrogen atoms of the hydroxyl groups were considered. Figure 4 indicates that majority of the
water molecules form one or two hydrogen bonds with the polymer in this system and that there
is almost no hydrogen bonding between the water molecules.
Quantitatively, from the RDF, on an average, there are 0.032 water molecules in the first
neighbor shell (defined as a region of radius 3.55 Å, which corresponds to the minimum in the
oxygen-oxygen non-bonded interaction) around each carbonyl group. Given that there are 3422
carbonyl groups in the system, we can conclude that 0.032 x 3422 = 110 water molecules reside
in the first shell around the carbonyl groups in the system. On the other hand, there are only 63
total water molecules in the system. These numbers suggest that on an average, each water
molecule resides within the first shell of 110/63 = 1.75 carbonyl groups; this number is
19
Figure 4. Hydrogen bond probability distribution in PBA gel swollen to equilibrium.
consistent with the formation of one or two hydrogen bonds by the water molecules with the
polymer (Figure 4). All of these data indicate that most of the water molecules in the PBA
system reside close to two carbonyl groups, effectively forming a bridge between carbonyl
groups of two different monomers. It is also noted that given the scarcity of water in the system,
most carbonyl groups in the system do not have any water molecules around them.
Packing in P(BA50-HEA50) copolymer:
The RDFs for packing of water around the carbonyl and alkoxy groups of BA and HEA
monomers in the copolymer gel swollen to equilibrium are shown in Figure 5. As seen, the
height of the first peak for the carbonyl RDF is higher for BA than for HEA; on the other hand,
20
Figure 5. RDFs between oxygen atoms of the functional groups and the water molecules in
P(BA50-HEA50) copolymer gel swollen to equilibrium. RDFs for specific functional groups are
shown by the following color: oxygen of carbonyl in BA monomer (solid black), oxygen of
alkoxy in BA monomer (dotted green), oxygen of carbonyl in HEA monomer (solid red) and
oxygen of alkoxy in HEA monomer (dashed dark blue).

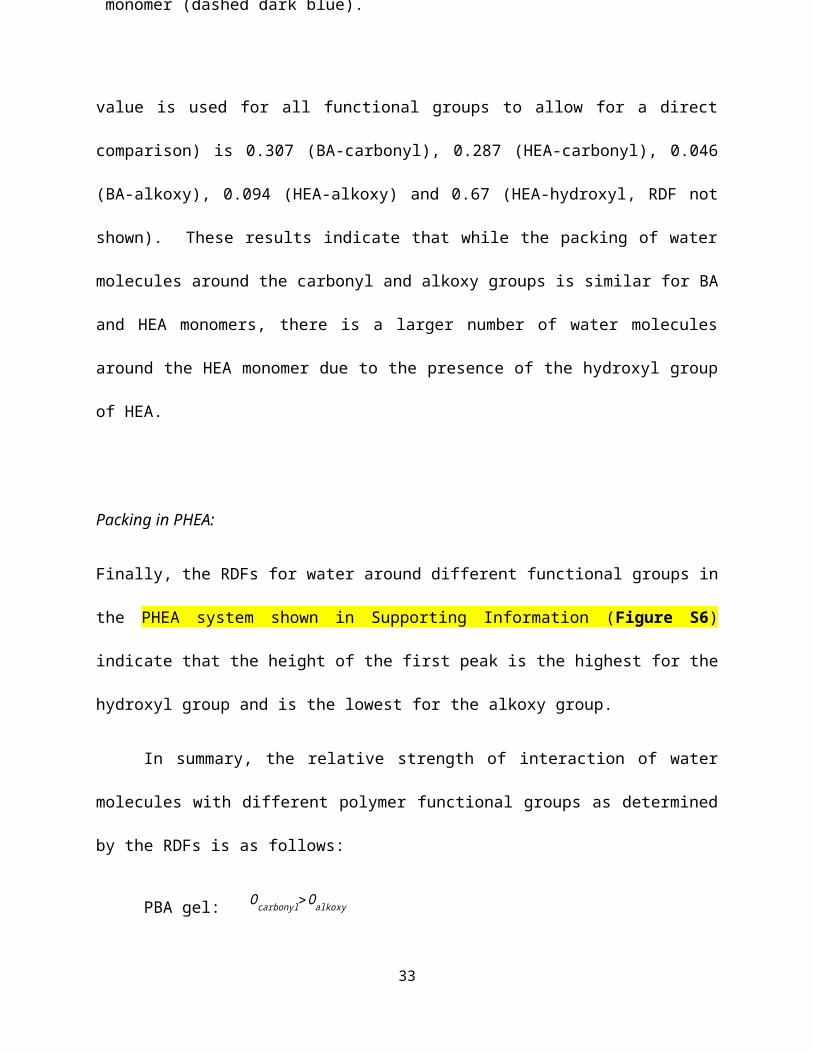
opposite is the case for the RDFs for the alkoxy groups in BA and HEA. The number of water
molecules in the first hydration shell around the functional groups (defined as a spherical region
of radius 3.55 Å for all functional groups, same value is used for all functional groups to allow
for a direct comparison) is 0.307 (BA-carbonyl), 0.287 (HEA-carbonyl), 0.046 (BA-alkoxy),
0.094 (HEA-alkoxy) and 0.67 (HEA-hydroxyl, RDF not shown). These results indicate that
while the packing of water molecules around the carbonyl and alkoxy groups is similar for BA
and HEA monomers, there is a larger number of water molecules around the HEA monomer due
to the presence of the hydroxyl group of HEA.
Packing in PHEA:
Finally, the RDFs for water around different functional groups in the PHEA system shown in
Supporting Information (Figure S6) indicate that the height of the first peak is the highest for the
hydroxyl group and is the lowest for the alkoxy group.
In summary, the relative strength of interaction of water molecules with different
polymer functional groups as determined by the RDFs is as follows:
PBA gel: Ocarbonyl>Oalkoxy
P(BA50-HEA50) gel: Ohydroxyl>O carbonyl , BA≈Ocarbonyl , HEA>Oalkoxy ,BA≈Oalkoxy , HEA
PHEA gel: Ohydroxyl>Ocarbonyl>Oalkoxy
where the symbols O x and O x , y in the relations denote the oxygen atom belonging to the ‘x’
functional group and the oxygen atom belonging to the ‘x’ functional group in the ‘y’ monomer,
21

respectively. We attribute the observed differences in water affinity to three factors: (1) The
hydroxyl group offers two possibilities for hydrogen bonding since both oxygen and hydrogen
atoms of the group can form a hydrogen bond with a water molecule (while carbonyl and alkoxy
groups offer only one possibility), (2) higher electron density around the carbonyl oxygen than
the alkoxy oxygen, and (3) steric environment of these groups, specifically, that the alkoxy group
is in a relatively crowded environment compared to the carbonyl and the hydroxyl groups.
III. C1. At low concentrations, water is well-dispersed in the polyacrylate systems and
predominantly forms hydrogen bonds with the polymer, while at high concentrations,
water forms clusters with predominance of water-water hydrogen bonding
Water-water RDF:
For studying the distribution of water molecules in the system, we first focus on the water-water
RDF (Figure S7 in Supporting Information) for polyacrylate gel systems containing identical
amounts of water (water mole fraction = 0.017 in all systems, which is the same as that measured
experimentally for the PBA gel swollen to equilibrium). The water-water RDF shows only one
peak for all systems with the peak height being the highest for PBA and the lowest for PHEA.
This observation can be explained as follows: Due to the presence of the hydroxyl group (in
addition to the carbonyl and alkoxy that are also present on BA), HEA monomer offers more
sites for hydrogen bonding than the BA monomer. Thus, water is more likely to be hydrogen
bonded to a polymer oxygen than to itself in PHEA gel. The effect also occurs to a smaller
extent in the P(BA50-HEA50) copolymer gel.
Water clustering at low water concentration:
Information about the distribution of water molecules in the system can be obtained by
quantifying the probability of water molecule cluster formation. In this analysis, two water
22

molecules were considered to be in the same cluster if the distance between their oxygen atoms
was less than the cluster cut-off distance value of 3.5 Å. This value of the cluster cut-off
distance corresponds to the location of the first minimum in the water-water RDF. Following the
approach used in the literature,22,26 the algorithm employed for this purpose consisted of picking
a water molecule at random and searching for another water molecule lying within the specified
cluster cut-off distance from it. If a molecule(s) was found, it was added to the cluster. The
process was continued until all water molecules that reside within the cluster cut-off distance of
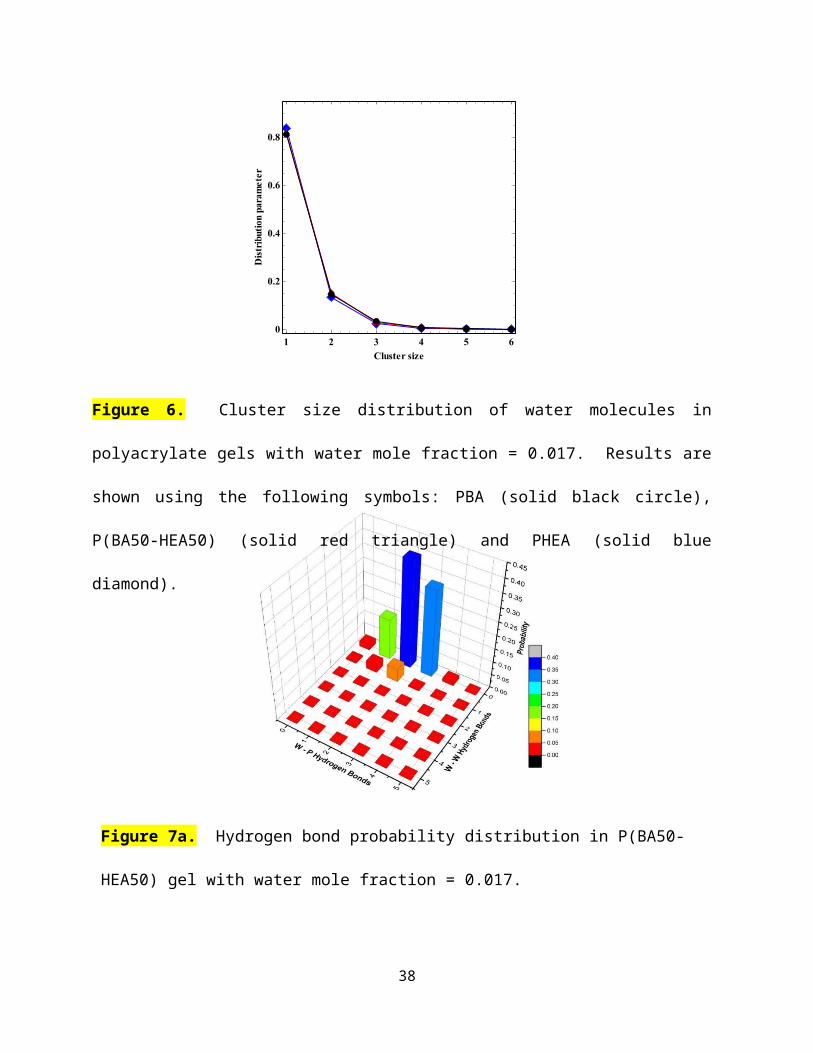
any of the molecules in the cluster were found. Figure 6 displays the cluster size probability
distribution (ordinate is the probability that a randomly chosen water molecule will belong to the
cluster of a given size) for the three polymer gel systems containing the same amount of water
(i.e. same mole fraction of water as that in the PBA gel swollen to equilibrium). As seen for this
case, the cluster size probability distribution is the same for all three polymers with most of the
water molecules
existing as single molecules in the system, and only about 15% existing in the form of pairs. We
also note that ethanol is present at low concentration in all of the systems (as seen from Tables
1.1 and 1.2) and the clustering behavior of ethanol is very similar to that of water (Figure S8 in
Supporting Information) in systems with low water content.
Figures 4 (see earlier text), 7a and 7b show the probabilities of water-water and water-
polymer hydrogen bond formation for a water molecule in the PBA, P(BA50-HEA50) and
PHEA gel systems (all with water mole fraction = 0.017) respectively. As seen from these
figures, when the water concentration in the system is low, the water molecules predominantly
form hydrogen \bonds with polymer with the probability of forming a hydrogen bond with
another water molecule being very small.
23

24
Figure 7a. Hydrogen bond probability distribution in P(BA50-HEA50) gel with water mole
fraction = 0.017.
Figure 6. Cluster size distribution of water molecules in polyacrylate gels with water mole
fraction = 0.017. Results are shown using the following symbols: PBA (solid black circle),
P(BA50-HEA50) (solid red triangle) and PHEA (solid blue diamond).
Effect of water concentration on the clustering behavior:
The effect of water concentration on the cluster formation behavior can be determined by
studying the cluster size distribution in the three gels (PBA, P(BA50-HEA50) copolymer, and
PHEA) that are swollen to equilibrium. As was seen in Table 2, there is a large difference in the
water content in the three systems, which could affect the clustering behavior of water in these
systems. Figure 8 presents a comparison of the water cluster size distribution in the three gels
that are swollen to equilibrium. The main observation from this figure is that water forms very
large clusters in the P(BA50-HEA50) copolymer and PHEA gel systems. In fact, even though
PHEA is highly hydrophilic, still almost all of the water molecules in the PHEA gel reside within
a single cluster rather than being distributed throughout the polymer matrix.
25
Figure 7b. Hydrogen bond probability distribution in PHEA gel with water mole fraction =
0.017.

The effect of water concentration on the probability of water-water and water-polymer
hydrogen bond formation can be seen by comparing the results presented in Figures 9 and
Figure S9 in Supporting Information with those presented earlier in Figures 7a and 7b.
26
Figure 9. Hydrogen bond probability distribution in PHEA gel swollen to equilibrium.
Figure 8. Cluster size distribution of water molecules in gels swollen to equilibrium. Results
are shown using the following symbols: PBA (in inset) (solid black circle), P(BA50-HEA50)
(solid red triangle) and PHEA (solid blue diamond).

A key observation from these figures is that unlike the behavior at low water
concentration (seen earlier in Figure 7a and 7b), when water concentration is high, water
predominantly forms hydrogen bonds with other water molecules rather than forming hydrogen
bonds with the polymer.
In summary, the following conclusions can be drawn for the effects of water
concentration on the distribution of water molecules in the swollen gel systems. If there is
scarcity of water, in all polymers studied, a majority of water molecules are in an unassociated
state with only a small fraction (~ 15%) forming pairs. Also, water predominantly forms
hydrogen bonds with the polymer functional groups rather than with other water molecules at
this low concentration. As water concentration increases, water begins to form clusters
accompanied by the formation of a larger number of water-water hydrogen bonds than water-
polymer hydrogen bonds. For the system with the highest water concentration (PHEA gel
swollen to equilibrium), water predominantly forms hydrogen bonds with other water molecules,
and most of the water molecules associate into a single, very large cluster.
III.D. Increase in water concentration accelerates hydrogen bond dynamics of water
molecules, whereas an increase in polymer hydrophilicity slows down hydrogen bond
dynamics of the water molecules near the polymer sites
In addition to the static properties like the probability of hydrogen bond formation and
water clustering, the hydrogen bond dynamics of water molecules are also of interest from the
point of view of pervaporation based separation using polymer membranes. As water molecules
move, the hydrogen bond network gets continuously broken and reformed over time. The
dynamics of the hydrogen bonds were quantified by calculating the time autocorrelation function
(ACF) defined as follows:30, 70, 72-74
27

C ( t )=⟨h (0 )h (t )⟩⟨h2( t )⟩ (6)
In this expression, <…> represents the ensemble average over all hydrogen bonding pairs in the
system. The function h (t ) takes a value of either one or zero as follows. If a particular tagged
(i.e. hydrogen bonded at timet=0 ) pair of molecules is hydrogen bonded at time t, h (t )=1 ;
otherwise h (t )=0 . Based on this expression, the ACF can be calculated in two ways70: (1) For a
continuous time ACF, h (t ) takes a value of 1 only if the same tagged molecules remain hydrogen
bonded continuously from time t=0 to time t , and (2) For an intermediate time autocorrelation
function, h (t ) takes a value of 1 if the same tagged molecules that were hydrogen bonded at time
t=0 are also hydrogen bonded at time t (irrespective of the hydrogen bonding state at
intermediate times). In what follows, we only report results for the continuous time
autocorrelation function; the results for the intermediate time autocorrelation function are
qualitatively similar, although the decay of the ACF is slow for that case. We note that any
motion of the water molecule – by translation, rotation or vibration – that can break an existing
hydrogen bond, will lead to a decay of the continuous time ACF.
Figure 10 shows the continuous time ACF of water-water hydrogen bonds in
polyacrylate gels that are swollen to equilibrium. The correlation function decays rapidly for
PHEA and the P(BA50-HEA50) copolymer systems, while it decays slowly for the PBA system.
Noting that there is a significant difference in the water content of these systems (Table 1.1), we
conclude that the higher water content in PHEA and the P(BA50-HEA50) copolymer systems
28
provides greater opportunities for hydrogen bond formation with other water molecules, thus
leading to frequent break-up and formation of water-water hydrogen bonds.
This effect is more clearly seen in inset of Figure 10, which presents a comparison of
water-water hydrogen bond ACF in PHEA gel systems with different water contents: the PHEA
gel swollen to equilibrium (high water content) and the PHEA gel containing the same mole
fraction of water as the PBA gel that was swollen to equilibrium (low water content). Inset of
Figure 10 clearly shows that the ACF decays very rapidly for the PHEA gel with high water
content, whereas the decay is much slower for the PHEA gel with lower water content. The
presence of a large number of water molecules in the high water content systems allows the
29
Figure 10. Dynamics of water-water hydrogen bonds as captured by the continuous ACF,
results are shown for the gels that are swollen to equilibrium. Symbols are: PBA gel – solid
black circle, P(BA50-HEA50) copolymer gel – solid red triangle and PHEA gel – solid blue
diamond. Inset: Comparison of continuous ACF of water-water hydrogen bonds in PHEA gels
containing different amounts of water. Results are shown for the PHEA gel with water mole
fraction = 0.017 (low water content, dashed line) and PHEA gel swollen to equilibrium (high
water content, solid line).

water molecules to break existing water-water hydrogen bonds and readily form new ones with
other water molecules, thus accelerating hydrogen bond dynamics in this system.
30

The effect of polymer hydrophilicity on the dynamics of hydrogen bonds is also of
interest. For this purpose, we focus on hydrogen bond dynamics in three polyacrylate gels that
have the same water mole fraction as that in the PBA gel swollen to equilibrium. We focus only
on the dynamics of the water-polymer hydrogen bonds, since as seen from Figures 4, 7a and 7b,
almost all of the hydrogen bonds in these systems are those between water and polymer. The
rate of decay of the ACFs for the PHEA and the P(BA50-HEA50) copolymer gels (see Figure
11) is about the same and is smaller than that for the PBA gel. This observation suggests that the
local mobility of water molecules is much lower near the highly hydrophilic hydroxyl group,
which is present only in the PHEA and the P(BA50-HEA50) copolymer gel systems. We note
that this observation is consistent with a previous literature report that water molecules have
smaller density fluctuations near hydrophilic surfaces than near hydrophobic surfaces.75
31
Figure 11. Continuous ACF for water-polymer hydrogen bonds in the gels with water mole
fraction = 0.017. Following symbols are used: PBA gel – solid black circle, P(BA50-HEA50)
copolymer gel – solid red triangle and PHEA gel – solid blue diamond.

Finally, an inspection of the ACF for the water-polymer hydrogen bonds in the gel
systems swollen to equilibrium (Figure S10 in Supporting Information), indicates that there are
relatively small differences in the dynamics of water-polymer hydrogen bonds in these systems.
It appears that this behavior is a result of the interplay of two opposing factors. Comparing PBA,
P(BA50-HEA50) copolymer and PHEA gels, water content in the swollen systems increases as
HEA content in the polymer increases, thus accelerating hydrogen bond dynamics. At the same
time, polymer hydrophilicity also increases, which slows down hydrogen bond dynamics.
IV. Summary and Conclusions
We carried out MD simulations to study the effect of water concentration and polymer
hydrophilicity on the structure and hydrogen bonding of water in a set of polyacrylate gel
structures. The model structures of linear polyacrylates were first prepared and validated by
comparing their thermal and volumetric properties – glass transition temperature and density –
with experimental values; good quantitative agreement was found for these properties.
Subsequently, model structures of polyacrylate gels swollen by a dilute ethanol mixture were
prepared; these were used to study the water structure and hydrogen bonding in the polymers.
Large differences were observed between the affinities of water molecules for the
hydrophilic functional groups in the polyacrylates: water had the highest affinity for the hydroxyl
groups due to their ability for the formation of two hydrogen bonds, while its affinity was the
lowest for the alkoxy group, presumably due to a combination of lower electron density around
this group and the steric effects. Water concentration was found to have a significant influence
on the structure of water in the polyacrylate gels. In particular, at low concentrations, water
molecules were well-dispersed in these gels and predominantly formed hydrogen bonds with the
polymer. On the other hand, at high concentrations, water was found to form clusters with a
32
predominance of water-water hydrogen bonding accompanied by acceleration of hydrogen bond
dynamics of water molecules. This dependence of system properties on water concentration is
coupled with the dependence on polymer hydrophilicity, since the gels formed by hydrophilic
polymers have a larger water content when swollen to equilibrium. For the gels with the same
water concentration, an increase in polymer hydrophilicity was found to retard hydrogen bond
dynamics of the water molecules near the polymer functional groups. The local mobility of
water molecules was inferred from hydrogen bond dynamics. The local mobility influences the
long length scale translational mobility that is quantified by diffusivity, which is a topic of
current interest. Finally, the distribution of alcohol molecules in the swollen gels is also of
interest from the point of view of separation processes. Alcohol is typically present at very low
concentrations in the product formed by the enzymatic hydrolysis of cellulosic biomass. At
these low concentrations, ethanol did not form clusters in the polyacrylate gel systems.
The interplay between water concentration and polymer hydrophilicity in determining the
structure and local dynamics of water molecules that is elucidated here is useful for interpreting
the results from the laboratory experiments. For example, experimentally, diffusion coefficient
values are measured either by monitoring initial water uptake in a dry gel or the initial mass loss
from a swollen gel. There is a large difference in the water content of these – dry gel and
swollen gel - experimental systems. Our simulation results suggest that the clustering of water
molecules in the high water content systems will lead to a higher diffusion coefficient (since
water will predominantly diffuse through the water cluster rather than through the polymer
matrix) than that measured from the low water content systems. Further quantitative
investigation of this phenomenon is currently underway. This work shows that, in general,
molecular simulations can be used to decipher the mechanisms underlying the concentration
33

dependence of penetrant diffusion coefficient that is commonly observed in systems containing
strongly interacting components.
Acknowledgments
This material is based on the work supported by the National Science Foundation under
the Grant number: NSF CMMI-1335082. The authors also acknowledge the computational
resources provided by the Texas Advanced Computing Center (TACC) at The University of
Texas at Austin for performing the molecular simulations.
Supporting Information
1H NMR spectrum of HEA homopolymer in DMSO-d6, 1H NMR spectrum of BA
homopolymer in CDCl3, 1H NMR spectrum of 50/50 mol% BA/HEA copolymer in CDCl3 and
DMSO-d6 are shown in Figures S1a, S1b, S1c and S1d, respectively. Cluster size distribution
of ethanol molecules in gels swollen to equilibrium is presented in Figure S2. Continuous ACF
for water-polymer hydrogen bonds in the gels swollen to equilibrium is shown in Figure S3.
34

References
1. H. Li, Y. Tang, Z. Wang, Z. Shi, S. Wu, D. Song, J. Zhang, K. Fatih, J. Zhang, H. Wang, Z. Liu, R. Abouatallah and A. Mazza, Journal of Power Sources 178 (1), 103-117 (2008).2. X. Liu, H. Guo and C. Ma, Journal of Power Sources 156 (2), 267-280 (2006).3. T. Loftsson and M. E. Brewster, International Journal of Pharmaceutics 354 (1–2), 248-254 (2008).4. B. Smitha, D. Suhanya, S. Sridhar and M. Ramakrishna, Journal of Membrane Science 241 (1), 1-21 (2004).5. C. Bellona, J. E. Drewes, P. Xu and G. Amy, Water Research 38 (12), 2795-2809 (2004).6. J. Zhou and J. P. Lucas, Polymer 40 (20), 5505-5512 (1999).7. J. Zhou and J. P. Lucas, Polymer 40 (20), 5513-5522 (1999).8. R. Gavara and R. J. Hernandez, Journal of Polymer Science Part B: Polymer Physics 32 (14), 2375-2382 (1994).9. J. Du Plessis, W. J. Pugh, A. Judefeind and J. Hadgraft, European Journal of Pharmaceutical Sciences 13 (2), 135-141 (2001).10. M. C. Bellissent‐Funel, R. Sridi‐Dorbez and L. Bosio, The Journal of Chemical Physics 104 (24), 10023-10029 (1996).11. Z. H. Ping, Q. T. Nguyen, S. M. Chen and Y. D. Ding, Journal of Membrane Science 195 (1), 23-34 (2002).12. S. J. Lue, T.-H. Yang, K.-S. Chang and K.-L. Tung, Journal of Membrane Science 415–416 (0), 635-643 (2012).13. P. Peng, B. Shi and Y. Lan, Separation Science and Technology 46 (2), 234-246 (2010).14. B. Bolto, M. Hoang and Z. Xie, Chemical Engineering and Processing: Process Intensification 50 (3), 227-235 (2011).15. M. Hoshi, T. Saitoh, C. Yoshioka, A. Higuchi and T. Nakagawa, Journal of Applied Polymer Science 74 (4), 983-994 (1999).16. S. Matsui and D. R. Paul, Journal of Membrane Science 213 (1–2), 67-83 (2003).17. W. F. Guo, T.-S. Chung and T. Matsuura, Journal of Membrane Science 245 (1–2), 199-210 (2004).18. R. Y. M. Huang, R. Pal and G. Y. Moon, Journal of Membrane Science 160 (1), 101-113 (1999).19. D. Hofmann, L. Fritz and D. Paul, Journal of Membrane Science 144 (1–2), 145-159 (1998).20. M. Rahmati, H. Modarress and R. Gooya, Polymer 53 (9), 1939-1950 (2012).21. S. G. Lee, G. F. Brunello, S. S. Jang and D. G. Bucknall, Biomaterials 30 (30), 6130-6141 (2009).22. C. V. Mahajan and V. Ganesan, The Journal of Physical Chemistry B 114 (25), 8357-8366 (2010).23. S. Urata, J. Irisawa, A. Takada, W. Shinoda, S. Tsuzuki and M. Mikami, The Journal of Physical Chemistry B 109 (9), 4269-4278 (2005).24. A. Venkatnathan, R. Devanathan and M. Dupuis, The Journal of Physical Chemistry B 111 (25), 7234-7244 (2007).25. Y. Tamai, H. Tanaka and K. Nakanishi, Macromolecules 29 (21), 6750-6760 (1996).26. N. P. Blake, M. K. Petersen, G. A. Voth and H. Metiu, The Journal of Physical Chemistry B 109 (51), 24244-24253 (2005).
35

27. Y. Tamai and H. Tanaka, Physical Review E 59 (5), 5647-5654 (1999).28. Q. G. Zhang, Q. L. Liu, Y. Chen, J. Y. Wu and A. M. Zhu, Chemical Engineering Science 64 (2), 334-340 (2009).29. T.-X. Xiang and B. Anderson, Pharmaceutical Research 22 (8), 1205-1214 (2005).30. J. Mijović and H. Zhang, The Journal of Physical Chemistry B 108 (8), 2557-2563 (2004).31. W.-J. Lee, J.-G. Chang and S.-P. Ju, Langmuir 26 (15), 12640-12647 (2010).32. O. Borodin, D. Bedrov and G. D. Smith, The Journal of Physical Chemistry B 106 (20), 5194-5199 (2002).33. Z. Li, F. Yuan, K. A. Fichthorn, S. T. Milner and R. G. Larson, Macromolecules 47 (18), 6441-6452 (2014).34. Y. Tamai, H. Tanaka and K. Nakanishi, Macromolecules 29 (21), 6761-6769 (1996).35. X. Feng and R. Y. M. Huang, Industrial & Engineering Chemistry Research 36 (4), 1048-1066 (1997).36. H.-J. Huang, S. Ramaswamy, U. W. Tschirner and B. V. Ramarao, Separation and Purification Technology 62 (1), 1-21 (2008).37. R. Godbole, M. Lan, M. Doerfert, P. Williams and R. Hedden, ACS Combinatorial Science, Submitted.38. J. Wang, W. Wang, P. A. Kollman and D. A. Case, Journal of Molecular Graphics and Modelling 25 (2), 247-260 (2006).39. J. Wang, R. M. Wolf, J. W. Caldwell, P. A. Kollman and D. A. Case, Journal of Computational Chemistry 25 (9), 1157-1174 (2004).40. W. L. Jorgensen, J. Chandrasekhar, J. D. Madura, R. W. Impey and M. L. Klein, The Journal of Chemical Physics 79 (2), 926-935 (1983).41. D. J. Price and C. L. Brooks, The Journal of Chemical Physics 121 (20), 10096-10103 (2004).42. J.-P. Ryckaert, G. Ciccotti and H. J. C. Berendsen, Journal of Computational Physics 23 (3), 327-341 (1977).43. A. Jakalian, B. L. Bush, D. B. Jack and C. I. Bayly, Journal of Computational Chemistry 21 (2), 132-146 (2000).44. A. Jakalian, D. B. Jack and C. I. Bayly, Journal of Computational Chemistry 23 (16), 1623-1641 (2002).45. Hockney. R . W and E. J. W, in Computer Simulation Using Particles (Taylor & Francis 1988, 1988), pp. 267–304.46. W. Shinoda, M. Shiga and M. Mikami, Physical Review B 69 (13), 134103 (2004).47. M. Parrinello and A. Rahman, Journal of Applied Physics 52 (12), 7182-7190 (1981).48. S. Plimpton, Journal of Computational Physics 117 (1), 1-19 (1995).49. R. Khare, M. E. Paulaitis and S. R. Lustig, Macromolecules 26 (26), 7203-7209 (1993).50. P.-H. Lin and R. Khare, Macromolecules 42 (12), 4319-4327 (2009).51. E. Vargün and A. Usanmaz, Journal of Polymer Science Part A: Polymer Chemistry 43 (17), 3957-3965 (2005).52. S. Coca, C. B. Jasieczek, K. L. Beers and K. Matyjaszewski, Journal of Polymer Science Part A: Polymer Chemistry 36 (9), 1417-1424 (1998).53. K. Bian and M. F. Cunningham, Macromolecules 38 (3), 695-701 (2005).54. C. Farcet, J. Belleney, B. Charleux and R. Pirri, Macromolecules 35 (13), 4912-4918 (2002).
36

55. D. J. Plazek and Z. N. Frund, Journal of Polymer Science Part B: Polymer Physics 28 (4), 431-448 (1990).56. P. Badrinarayanan, W. Zheng, Q. Li and S. L. Simon, Journal of Non-Crystalline Solids 353 (26), 2603-2612 (2007).57. K. S. Khare and R. Khare, Macromolecular Theory and Simulations 21 (5), 322-327 (2012).58. K. S. Khare and R. Khare, The Journal of Physical Chemistry B 117 (24), 7444-7454 (2013).59. A. Soldera and N. Metatla, Physical Review E 74 (6), 061803 (2006).60. N. J. Soni, P.-H. Lin and R. Khare, Polymer 53 (4), 1015-1019 (2012).61. J. D. Ferry, Viscoelastic Properties of Polymers. (Wiley, New York, 1980).62. T. W. Sirk, K. S. Khare, M. Karim, J. L. Lenhart, J. W. Andzelm, G. B. McKenna and R. Khare, Polymer 54 (26), 7048-7057 (2013).63. I. Barudio, G. Févotte and T. F. McKenna, European Polymer Journal 35 (5), 775-780 (1999).64. T. Yamaguchi, B.-G. Wang, E. Matsuda, S. Suzuki and S.-I. Nakao, Journal of Polymer Science Part B: Polymer Physics 41 (12), 1393-1400 (2003).65. A. I. Buzin, M. Pyda, P. Costanzo, K. Matyjaszewski and B. Wunderlich, Polymer 43 (20), 5563-5569 (2002).66. J. L. de la Fuente, M. Fernández-García and E. López Madruga, Journal of Applied Polymer Science 80 (5), 783-789 (2001).67. M. Fernández–García, R. Cuervo–Rodriguez and E. L. Madruga, Journal of Polymer Science Part B: Polymer Physics 37 (17), 2512-2520 (1999).68. J. C. R. Hernández, M. M. Pradas and J. L. G. Ribelles, Journal of Non-Crystalline Solids 354 (17), 1900-1908 (2008).69. A. Chandra, Physical Review Letters 85 (4), 768-771 (2000).70. S. Chowdhuri and A. Chandra, Physical Review E 66 (4), 041203 (2002).71. A. Luzar and D. Chandler, The Journal of Chemical Physics 98 (10), 8160-8173 (1993).72. A. Luzar and D. Chandler, Physical Review Letters 76 (6), 928-931 (1996).73. S. Indra and R. Biswas, Molecular Simulation 41 (5-6), 471-482 (2014).74. F. H. Stillinger, in Advances in Chemical Physics (John Wiley & Sons, Inc., 2007), pp. 1-101.75. R. Godawat, S. N. Jamadagni and S. Garde, Proceedings of the National Academy of Sciences 106 (36), 15119-15124 (2009).
37
For Table of Contents (TOC) Use Only
Structure and Hydrogen Bonding of Water in Polyacrylate Gels: Effects of Polymer
Hydrophilicity and Water Concentration
Sriramvignesh Mani, Fardin Khabaz, Rutvik V. Godbole,
Ronald C. Hedden and Rajesh Khare
38