waterloo region community wellbeing survey · 2019-08-16 · high level view of results: the survey...
TRANSCRIPT
Waterloo Region Community Wellbeing SurveyA prompt for discussion
June 2019

2
Purpose of this document:This document highlights some of the findings from the Waterloo Region Community Wellbeing Survey that was conducted by the Canadian Index of Wellbeing (CIW) through the University of Waterloo in the spring and summer of 2018. It includes comparisons of survey findings to other data sources, including a similar survey conducted in the region in 2013 (commissioned by the Kitchener and Waterloo Community Foundation). Comparing the results of questions that were the same in these two surveys makes it possible to see how the region’s wellbeing is changing over time. Census statistical data was also used in order to compare health outcomes to citizen perceptions.
This report is intended as a prompt for discussion to encourage further conversations with diverse voices to generate the most impactful solutions that improve wellbeing in Waterloo Region.
What is wellbeing?• Being safe, healthy and feeling connected to the people and places around us. • The quality of our neighbourhoods, parks and the natural environment. • Being able to express ourselves fully and participate in the activities that we love. • Access to food and shelter and having the necessities for daily life. • The health of our community and our relationships.
What is a general picture of Waterloo Region?
In 2016, 15% of Regional residents were over age 65
By 2041, 25% of Regional residents will be over age 65
Has lower rates of high school graduation, fewer people with a university degree than Ontario and Canada
Is a place where people work long hours and have a high level of work stress, but also have flexible work arrangements and shorter commutes
Over the last 10 years, average rents for 1 and 2 bedroom units have increased twice as fast as inflation, (37% compared to 17% for inflation).
Has high rates of employment
A high percentage of young children rated as vulnerable in their early development.
Single parent families are increasing faster than couples with children. A 9.5% increase since 2011
Has a younger population
The youth unemployment rate remains higher than the unemployment rate of the overall working age population.
11.5% of people in Waterloo Region live below the low income measure (LIM), compared to 14.3% in Ontario
Growing faster than other parts of Ontario
In 2016, 1 in 8 residents spoke a language other than English regularly at home with Mandarin replacing German as the most common.
Over 14,000 recent immigrants have arrived in Waterloo Region in the last 5 years

Waterloo Region Community Wellbeing Survey: A prompt for discussion 3
Background:In today’s increasingly complex and interconnected world how do we improve the wellbeing of the community so that no one is left behind and everyone thrives?
In 2018, a group of 16 community organizations in Waterloo Region including area municipalities, the Region of Waterloo, the Local Health Integration Network, community health centers, Kitchener Waterloo Community Foundation, the United Way, Waterloo Regional Police Service and the Crime Prevention Council, wanted to find out how Waterloo Region residents felt about their wellbeing and quality of life in this community. They also wanted to know what they could do together to make transformational change in wellbeing because they recognized that it would take a coordinated response to create solutions that make the most impact on wellbeing.
About the Wellbeing Survey:The Waterloo Region Community Wellbeing Survey asked residents about what matters most to their wellbeing and how it is connected to other factors that influence overall health. The survey gathered resident perceptions on a variety of aspects linked to eight interconnected domains of wellbeing: community vitality, healthy populations, democratic engagement, the environment, leisure and culture, education, living standards, and time use.
The following approaches were used to encourage people living in Waterloo Region (16 years and older) to take the survey:
• An online survey was advertised through a variety of traditional and social media channels.
• A personalized letter was sent to 40,000 randomly selected households across the Waterloo Region.
• Targeted outreach to specific populations was implemented in order to assist with survey completion and to ensure diverse groups participated in the survey (e.g. people living on a low income, immigrants/refugees, LGBTQ++, people living with physical or mental health challenges, the Mennonite community, youth, older adults, people with addictions and those in conflict with the law etc.).
A profile of who completed the survey:
Over 5,000people across Waterloo Region completed the survey, and the Canadian Index of Wellbeing weighted the survey results by age, sex and municipality to match the 2016 Census profile. Weighting the data allows the overall Community Wellbeing Survey results to more accurately reflect the responses of residents without under or over-representing any groups based on age, sex, or where they live in Waterloo Region.
Cambridge
1,024 21.7%
Kitchener 1,581 33.5%
Waterloo
1,452 30.8%
Wellesley 82 1.7%
Wilmot 189 4.0%
Woolwich 294 6.2%
North Dumfries
96 2.0%
*Municipality was unavailable for 311 residents.

4
High level view of results:The survey results offer useful insights about wellbeing in Waterloo Region. Overall, the results paint a picture of an engaged, diverse and complex community where many people do work that they find meaningful, feel safe and healthy, have confidence in local institutions, and are actively engaged with one another through volunteering and participation in cultural events. There is much to suggest that the average quality of life in the region is high.
However, while many people enjoy life and lead fulfilling lives, there are a number of indicators that suggest that work is becoming more complex and more demanding, consuming a disproportionate amount of our collective time and energy. The pace of life is taking a toll. Feelings of isolation and exclusion are very real for a quarter of residents, and the experience of discrimination appears to be on the rise. Substance use, mental health and financial issues and concerns are touching the lives of many people. Institutions in the region may not be listening closely enough to those who are vulnerable or excluded.
There are some early indications that the people of Waterloo Region are beginning to take notice of these issues, and get involved in addressing them. More people are volunteering, going to community meetings, and taking an interest in local politics. People are training themselves to compete in the job market on an ongoing basis. Most residents feel a personal responsibility to address environmental concerns.
Residents with below average wellbeing share some of the following characteristics:
• Women
• Younger
• More often on their own
• More often unemployed
• Living with a disability
• Spend over 30% of income on housing
Residents with above average wellbeing share some of the following characteristics:
• Men
• Older
• Married (not common-law)
• Higher incomes
• More highly educated
• Longer time residing in Waterloo Region
Characteristics of wellbeing in Waterloo RegionHow do residents with higher or lower wellbeing compare?

Waterloo Region Community Wellbeing Survey: A prompt for discussion 5
The following sections provide highlights of the key findings for each of the CIW’s eight interconnected domains of wellbeing:
Community vitality: social engagement, social support, community safety, attitudes towards others and community.
Democratic engagement: democratic process, political institutions, participation in political activities, expression of political views, relationships with governments, trust, citizen participation.
Education: social and emotional competencies, basic educational knowledge and skills, overall academic achievement, attainment and participation.
Environment: natural resources, clean air, clean water, available energy and raw materials, the amount of wilderness, diversity of species, and natural assets.
Healthy populations: personal wellbeing, physical health conditions, life expectancy/mortality, mental health, functional health, lifestyle and behaviours, public health, health care.
Leisure and culture: participation, perceptions, experiences, opportunities in social leisure, arts and culture, physical activity.
Living standards: average and median income and wealth, income and wealth distribution, income volatility, economic security.
Time use: time, timing (control over timing of one’s day), tempo (pace), temporarily (biological rhythms).
Overall, 75% of residents report that they are very satisfied with life in general.This level of satisfaction reflects the ways in which the domains are connected and influence one another.

6
0 20 40 60 80 100
• The 2018 survey provides a description of how frequently people in the region experience discrimination for various reasons. Given that about 18% of local residents are members of visible minority groups, these figures suggest about a third of these people experience discrimination frequently which has more than doubled since 2013.
• Survey respondents were most likely to trust people with whom they worked or went to school. People also trusted (to a lesser extent) people in their neighbourhoods. They were less likely to trust people they encounter but do not know, and were often mistrustful of strangers.
• 19.1% of residents agreed that they often feel isolated from others in the community. Rates of perceived isolation were highest in the three large cities.
• Over 80% of respondents feel safe from crime walking alone after dark in their neighbourhood.
In general, residents reported a moderately high degree of confidence in all institutions including the school and health care system, local merchants, the justice system and the police.
Community vitality
59.6% of residents volunteer – an over 8.6% increase since 2013.
Reports of discrimination due to ethnicity, culture, race or skin colour have more than doubled since 2013.
Almost 7% of respondents frequently experience discrimination due to ethnicity, race, or skin colour, and a similar percentage frequently experience discrimination due to age or gender.
3.5% of respondents frequently experience discrimination due to sexual orientation.
8 in 10 people feel they can trust the people they work with or go to school with. Trust of neighbours is slightly lower, at 7/10.
Almost 1 in 4 local residents feels that they lack companionship.
Waterloo Region Police Service
Confidence in institutions
The justice system and courts
Local merchants and business people
Health care system
School system
less confidence
neutral/not sure
more confidence
16.4
22.8
8.7
20.9
22
15.1
21.6
18.1
16.7
19.9
68.5
55.5
73.1
62.4
58.1
Above average wellbeing• Volunteer more • Strong sense
of belonging• Stronger social bonds• Feel help is available
if needed • Greater trust in others • More confidence
in institutions
Below average wellbeing• Less civic engagement• More socially isolated• Lower needs
fulfillment • Experience
discrimination more often
• Feel less safe walking alone after dark
Community vitality and wellbeingHow do residents with higher or lower
wellbeing compare?

Waterloo Region Community Wellbeing Survey: A prompt for discussion 7
• When the 2018 survey results are compared to the 2013 CIW survey, more people reported that they were politically engaged in 2018, although fewer said they were member of a political group. This may be partly due to the fact that there were local and provincial elections in the region in 2018, but not in 2013.
• When asked about their feelings of influence on government, people in Waterloo Region generally saw themselves as well informed about key issues. However, many people (27% of the sample) felt that they had no say in what government does, and nearly 32% felt public officials did not care what they thought.
Democratic engagement
Residents are more than twice as likely to attend a community meeting, open house, demonstration or protest than they were in 2013.
More than half of respondents felt that the programs and services of local government had not made any difference for them (54.7%).
While 2/3 of respondents see themselves as well-informed about politics and issues facing the region, between 1/4 and
1/3 of people feel government isn’t listening to them.
I feel I have a pretty good understanding of the important issues facing our region
I think I am as well-informed about politics and government as most people
I consider myself to be well-qualified to participate in politics
I feel I could do as good a job in public office as most people
I do not think public officials care much what people like me think
People like me do not have any say about what government does
Political Efficacy
disagree neutral agree
0 20 40 60 80 100
17.2
46.130.4
53.6
17.1
26.819.5
22.125.6
19.3
19.1
22.663.3
31.944
27.1
63.8
50.6
Above average wellbeing• More likely to attend local or regional council meeting• More likely to participate in local event supporting
community• Feel they have good understanding of important
issues in Waterloo Region• Feel they are well informed about politics/
government
Below average wellbeing• More likely to participate in public
demonstration or protest• More likely to join social media on local issue• Feel they have less say in
what government does• Feel they are ignored by public officials
Democratic engagement and wellbeingHow do residents with higher or lower wellbeing compare?

8
Education
Community Wellbeing Survey respondents participation in and perceptions of educational opportunities 2013 2018
Per cent who took a formal course to improve skills in current job 28.2% 31.5% Per cent who agree there are plenty of opportunities
to take formal education courses 77.2% 73.2%
Per cent who agree that they would take courses, but they are too expensive 38.2% 38.3% Per cent who agree that there are schools nearby where they can
upgrade my educational qualifications 71.9% 68.7%
Above average wellbeing• Higher perceived availability
of courses of interest• More likely to have taken courses to
improve skills or prepare for job
Below average wellbeing• Lower perceived availability of
formal education opportunities• Courses seen as offered at inconvenient times• Courses seen as too expensive
Education and wellbeingHow do residents with higher or lower wellbeing compare?
Both groups report taking a similar number of courses for interest
Overall, between 20% and 30% of respondents had taken a course in the last year that was related to their work, and about 22% had taken at least one course for interest.
Almost 40% of respondents would take courses to upgrade their skills if they were less expensive.
Profile of respondents in Waterloo Region: Highest level of education completed
Highest level of education completed % in Region
Elementary school 3.8%High school 16.9%
Post-secondary school 8.5%College diploma 20.6%
University degree 32.2%Graduate degree 17.9%
Waterloo Region Community Wellbeing Survey: A prompt for discussion 9
Environment
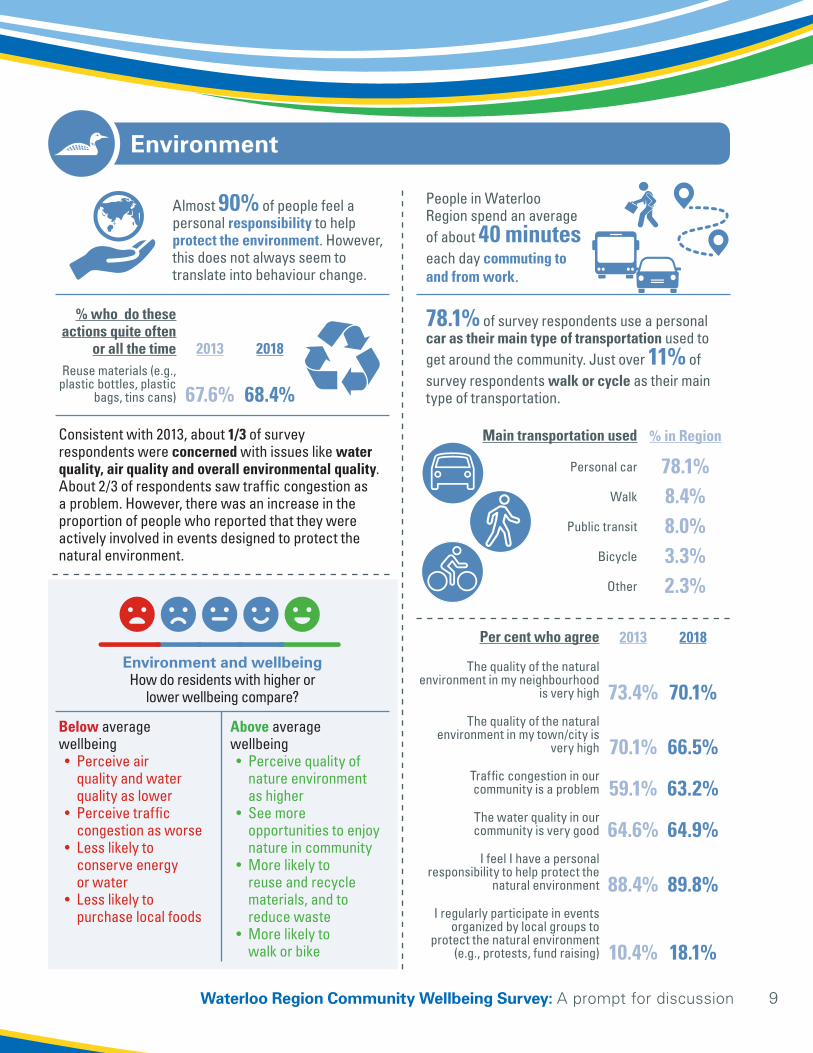
Above average wellbeing• Perceive quality of
nature environment as higher
• See more opportunities to enjoy nature in community
• More likely to reuse and recycle materials, and to reduce waste
• More likely to walk or bike
Below average wellbeing• Perceive air
quality and water quality as lower
• Perceive traffic congestion as worse
• Less likely to conserve energy or water
• Less likely to purchase local foods
Environment and wellbeingHow do residents with higher or
lower wellbeing compare?
78.1% of survey respondents use a personal car as their main type of transportation used to get around the community. Just over 11% of survey respondents walk or cycle as their main type of transportation.
People in Waterloo Region spend an average of about 40 minutes each day commuting to and from work.
Almost 90% of people feel a personal responsibility to help protect the environment. However, this does not always seem to translate into behaviour change.
Consistent with 2013, about 1/3 of survey respondents were concerned with issues like water quality, air quality and overall environmental quality. About 2/3 of respondents saw traffic congestion as a problem. However, there was an increase in the proportion of people who reported that they were actively involved in events designed to protect the natural environment.
Per cent who agree 2013 2018
The quality of the natural environment in my neighbourhood
is very high 73.4% 70.1%The quality of the natural
environment in my town/city is very high 70.1% 66.5%
Traffic congestion in our community is a problem 59.1% 63.2%The water quality in our community is very good 64.6% 64.9%
I feel I have a personal responsibility to help protect the
natural environment 88.4% 89.8%I regularly participate in events
organized by local groups to protect the natural environment
(e.g., protests, fund raising) 10.4% 18.1%
Main transportation used % in Region
Personal car 78.1%Walk 8.4%
Public transit 8.0%Bicycle 3.3%
Other 2.3%
% who do these actions quite often
or all the time 2013 2018Reuse materials (e.g.,
plastic bottles, plastic bags, tins cans) 67.6% 68.4%

10
Survey respondents experienced negative impacts in the past 12 months due to their own substance use issues (6.4%), or a family member’s substance use issues (14.5%), or someone else’s substance use issues (e.g. friend) (17.3%).
From the 2018 Centre for Addiction and Mental Health study, we know that 22.5% of adults in the Waterloo Wellington region reported psychological distress in the last 12 months, and that 6% reported fair or poor overall mental health. Although the structure of the questions was different, respondents to the 2018 wellbeing survey were much more likely to assess their own mental health as fair or poor. Findings from this survey also show that many people feel mental health issues have had a negative impact on their life in the last 12 months.
A Waterloo Region Substance Use Study (2017) found that usage of methamphetamines and fentanyl is increasing. The use of substances can have a wide range of negative health effects for people, and it can be challenging to access support.
Healthy populations
Nearly 40% of local residents have experienced negative impacts related to mental health issues in their family this year.
Percent who report negative impacts in past 12 months
Substance involved in negative impact
31.1% 36.9%39.2%
Family member’s
mental health issues
Own mental health
issues
Someone else’s
mental health issues
59.7%Alcohol
35.0%Tobacco
31.1%Cannabis
25.6%Opioids
Above average wellbeing• Better self-rated physical and mental health• Higher perceived quality of health care services• Higher perceived access to health care services• Eat healthy meals more often
Below average wellbeing• More likely to experience negative
impacts due to mental health issues• More likely to experience negative
impacts from substance use• Participate less in vigorous or light exercise
Healthy populations and wellbeingHow do residents with higher or lower wellbeing compare?
*survey respondents could select more than one substance.

Waterloo Region Community Wellbeing Survey: A prompt for discussion 11
In 2018, 45.7% of respondents reported daily use of video games. This was up from 33.5% in 2013. Similarly, the percentage who socialize with others online has increased from 69.5% in 2013 to 80.0% in 2018. However, this does not seem to have translated into people spending less time out in the community. In fact, there are slight increases in some of these kinds of community activities.
Leisure and culture: (social leisure, arts and culture, physical activity)
4 in 5 people now report that they socialize online, but people still enjoy getting out into their community to socialize as well.
Almost 1 in 4 survey respondents reported that local recreational and cultural facilities were not affordable.
More than 40% felt they were not as welcoming as they should be.
Leisure contributes to quality of life in many ways
Participation rate: 2013 2018
Socializing with Friends 90.1% 92%Going out to Movies 48.2% 48%
Going out to clubs, bars, taverns 32.6% 39% Going to a sports event as a spectator 28.2% 30.7%
Attending music concerts 60.3% 61.4% Attending live theatre 54.5% 51.2%
% agree, strongly agree or very strongly agree 2013 2018
Local park is easy to get to 87% 85.3% Recreation and culture activities are easy to get to 73% 73.3%
The recreation and cultural facilities are very welcoming to me 56% 58.2%
The cost of public recreation & culture programs prevents me from participating 24.9% 24.4%
Childcare is available at the recreation facilities if I need to use it 21.1% 20.2%
% agree, strongly agree or very strongly agree 2013 2018
my leisure helps relieve stress 86% 83.3%
my leisure provides me with opportunities for social interaction with others 70.5% 74.6%
My leisure provides opportunities to try new
things 67.7% 69.7%
Above average wellbeing• Participate more in arts
and cultural activities, and in social leisure activities
• Use community recreation centres, libraries, and arts facilities more
• Perceive better access to recreation and culture facilities (i.e., easy to get to, facilities are welcoming)
Below average wellbeing• Participate more home-
based and computer-based leisure activities
• Use parks, playgrounds, and trails less often
• Perceive recreation and culture facilities as less accessible (i.e., costly, not convenient, no child care available)
Leisure and culture and wellbeingHow do residents with higher or lower wellbeing compare?

12
Living standards
More than 20% of people are working two or more jobs
Almost 9% of people struggle to pay bills on time
According to the 2016 Stats Canada census for Waterloo Region, 39.1% of residents worked full time for a full year. The 2018 survey respondents were somewhat more likely to work full time than the population as a whole. Even so, CIW survey findings suggest that there has been a shift since 2013 towards working fewer hours at one’s primary job, and towards more people working multiple jobs. Also, hope for job promotion and perception that job matches qualifications haven’t changed since 2013.
Housing is becoming less affordable in Waterloo Region. Accordingly, it is not surprising that the proportion of survey respondents who reported inability to pay mortgage or rent on time has increased since the 2013 survey. The same is true for inability to pay bills.
2013 2018
% of residents who work for pay 71.9% 67.6%
% of residents who work one job 86.9% 78.2%
% of residents who work two jobs 8.8% 17.8%
% of residents who work three or more jobs 4.3% 4.0%
% of residents working less than 35 hours
at main job 17.3% 23.4%% of residents who agree
that they have poor job security 20.0% 18.9%
% who agree that job makes personal life
difficult 32.2% 26.2%
012345678
0
3
6
9
12
15
012345678
0
3
6
9
12
15
I could not pay my mortgage or rent on time
I could not pay my bills on time (e.g., water, hydro, phone)
at least 1x/monthat least 1x/3 monthsat least 1x/6 months
2013
1.0
4.2
1.8
4.2
1.2
3.42013
2018
2.2
5.5
1.9
5.4
1.2
3.52018
Above average wellbeing• More likely to have a regular
weekday schedule• Have better job fit• Less likely to work long hours• Have enough money to buy
things they needed and wanted
Below average wellbeing• Work at multiple jobs• Lower job security• More people could not
pay their bills on time• More people could not pay
their mortgage or rent on time• Work interferes with
personal life
Living standards and wellbeingHow do residents with higher or lower wellbeing compare?

Waterloo Region Community Wellbeing Survey: A prompt for discussion 13
Time use
1/4 of respondents felt that the supply of child care is inadequate
26% of people report that their job makes their personal life difficult, and almost 40% struggle to juggle work and non-work activities
Almost 30% of people struggle to find time to be active in the community
The number of available child care spaces in the region has increased slowly over the last three years, but that less than 20% of young children have access to a licensed Early Learning and Child Care Centres (ELCC) centre-based space (2017). When asked whether they felt the supply of child care in the region was adequate, 56.0% of respondents responded that they were not sure or did not know. This may reflect the fact that many people don’t have children of an age requiring care. 26.5% indicated that they felt the supply was not adequate.
26% of respondents reported that their job made their personal life difficult. In addition, 34.5% reported that they neglect personal needs because of work. Juggling work and non-work activities is a struggle for 37.5% of respondents. 19.4% of survey respondents felt that they did not have enough time to be with the children with whom they live. 19.7% reported insufficient time to spend with their partner or spouse, and 20.8% reported lack of time together with family. Compared to 2013, in 2018 more people reported insufficient time to spend with children.
There is sufficient time ...
% who say “not enough”
2013
% who say “not enough”
2018To participate in or be active
in the community 32.9% 28.3%To nurture your spiritual and/
or creative side 28.5% 26.9%To keep in shape 21.2% 23.5%
To get enough sleep or rest 21.6% 23.3%To socialize 23.0% 20%
To complete chores or errands 22.8% 19.5%
To prepare or eat healthy meals 14.8% 19%
To be yourself 15.8% 16.5%To form and sustain serious
relationships 21.6% 21.5% To be together with your
family 23.6% 20.8% To be with your partner or
spouse 20.8% 19.7% To be with the children you
live with 14.8% 19.4%
Above average wellbeing• More likely to
have flexible work schedules
• More time to:• Keep in shape• Nurture spiritual side• Be with children• Form/sustain
relationships• Participate in
community• Higher perceived
work-life balance
Below average wellbeing• More often
feel rushed• Have longer
commutes• Less time to:
• Get enough sleep• Prepare healthy
meals• Be with partner• Be together
with family• Socialize
• Work interferes more with personal life
Time use and wellbeingHow do residents with higher or lower
wellbeing compare?

14
POLICEPOLICEPOLICEPOLICEREGIONALREGIONALREGIONALREGIONALWATERLOOWATERLOOWATERLOOWATERLOO
What’s next?
The Waterloo Region Community Wellbeing Survey was supported by a partnership of 16 partner organizations, including:
The survey results will inform the 16 partner agency Strategic Plans. It will also help to develop a baseline of measurement for Wellbeing Waterloo Region (www.wellbeingwr.ca). WWR is a community initiative that is working across sectors to make transformational change in wellbeing of residents by taking an integrated approach to identifying and addressing collective priorities, and monitoring, tracking and responding to collective issues of wellbeing.
It is important to note that there is a great deal of useful information in the larger survey report. To access the full Waterloo Region Community Wellbeing Survey report, please visit the Wellbeing Waterloo Region website at www.wellbeingwaterloo.ca.

Waterloo Region Community Wellbeing Survey: A prompt for discussion 15
Sources
Ialomiteanu, A. R., Hamilton, H. A., Adlaf, E. M., & Mann, R. E. (2018). CAMH Monitor e-Report: Substance Use, Mental Health and Well-Being Among Ontario Adults, 1977–2017 (CAMH Research Document Series No. 48). Toronto, ON: Centre for Addiction and Mental Health. Available at: http://www.camh.ca/camh-monitor
Jackson, B. (2018). Rental housing becoming more unaffordable. Waterloo Region Record, May 15, 2018.
Region of Waterloo Children’s Services (2017). Early Learning and Child Care Profiles.
Region of Waterloo (2016) Census Bulletins.
Region of Waterloo Public Health (2017). Waterloo Region Substance Use Study. ON:Parkinson, A; Bermingham, G. and Sardella, A.
Region of Waterloo (2018). TravelWise 2018 Commuting Report.
Smale, B., Margo Hilbrecht, Robbie Shifman & Lisa Wenger (2013). Waterloo Region Community Wellbeing Survey Stage 1 Results: A Profile of the Wellbeing of the Residents of Waterloo Region. A preliminary report for The Kitchener and Waterloo Community Foundation. Canadian Index of Wellbeing: University of Waterloo
Canadian Index of Wellbeing. (2018). A Profile of Wellbeing in Waterloo Region.Waterloo, ON: Canadian Index of Wellbeing and University of Waterloo.
Smale, B., & Gao, M. (2018). Wellbeing in Waterloo Region: A Summary of Results from the CIW Community Wellbeing Survey. Waterloo, ON: Canadian Index of Wellbeing and the University of Waterloo.
TaylorNewberry Consulting (2019). Summary of Key themes from the 2018 CIW Community Wellbeing Survey Report.
