bigfiles.nhv.nubigfiles.nhv.nu/files/cho/v33 water_in_urban_areas.pdf · 3. from rainfall to sewer...
TRANSCRIPT


t 'k :$vl;a:.:>j '46 '
i j t f - > % f ? WATER IN URBAN AREAS v i:'. ,.i' ; {
iiitvr ;fhsd~r,*>bl '1 .t ;F$ h>3) ; t8VS inqA) g1. gnir~!m la~inrl-tat ?o z.dohwrirer .?swh nsdxU ar ïe?u+? .unro!nl brit t;nCbrrslkrcl) - .:Li - SJW P :wpsl-l 31ff - .is rs . . . li~slr$blaA H W ?o anoifrroirtir~tr
.CT1 on ,dnss?sS Imigr>lui~U no rrrtttirnmo'3 OMT\norj ay2119rsln dsP#
4 MBYi COPYRIGHT O BY THE NETHERLANDS ORGANIZATION mR APPLWD .a O?lf - - ,,,,,, SCIENTIFIC RESEARCH TNO, 1985 h m ,psm~*wa 1'~7&+~1f -

CIP DATA
Water
Water in Urban Areas: proceedings of technical meeting 42 (April 1985) / (ed. by J. C. Hooghart); with contributions of R. H. Aalderink . . . et al. -The Hague: TNO. - 111. -(Proceedings and Informa- tion/TNO Committee on Hydrological Research; no. 33). With references ISBN 90-6743-075-7 SISO 649 UDC 556(492-21) Subject heading: water; town/water pollution; town/hydrology; The Netherlands.

COMMISSIE VOOR HYDROLOGISCH ONDERZOEK TNO
TNO COMMITTEE ON HYDROLOGICAL RESEARCH
Verslagen en Mededelingen No. 33
Proceedings and Information No. 33
WATER IN URBAN AREAS
PROCEEDINGS OF TECHNICAL MEETING 42
APRIL, 1985
TNO COMMITTEE ON HYDROLOGICAL RESEARCH - THE HAGUE - 1985

3. FROM RAINFALL TO SEWER INFLOW; A PROCES WITH CONSEQUENCES
F.H.M. van de Ven
Abstract
1 Introduction
2 The rainfall-runoff process
3 The consequences
4 Conclusions
5 Recornendation for the design storm
References
Annex 1
4. URBAN STORMWATER RUNOFF POLLUTION
E.J.B. Uunk
Abstract
1 Introduction
2 Significance of quantifying urban stormater runoff
pollution
3 Stormwater runoff pollution
4 Control of stormwater runoff pollution
5 Conclusions
References
5. POLLUTION EMISSION FROM COMBINED SEWER SYSTEMS;
A FULL SCALE INVESTIGATION PROGRAIW
D. Vat
Abstract
1 Introduction
2 Aim and set-up of the programme
3 Results of the monitoring in Loenen and Oosterhout
4 Regression analyses results
5 Conclusions
References
6. COMBINED SEWER OVERFLOW POLLUTION ABATEMENT
A.S. Hogendoorn-Roozemond Abstract
1 Introduction and problem definition

2 In-line storage capacity
3 Combined sewer overflow devices
4 Feasibility
5 Conclusions
References
7. THE EPFECT OF STOPAGE SETTLING TmKS ON PGLLUTION
EXISSION FROM COMBINED SEWER SYSTEMS
D. ten Hove, M.A. de Ruiter and D. Vat
Abstract
1 Introduction
2 Monitoriag at the storage settlinp, tanks Fn Kerkrade
3 Monitoring at the storsge settling tank in Amersfoort
4 Conclusions
References
8. WATER QUALITY EFFECTS IN SURFACE WATERS RECEIVING STORM
WATER DISCHARGES
R.H. Aalderink and L. Lijklema
Abstract
1 Inroduction
2 The present research
3 Oxygen
4 Bacteriological quality
5 Accumulation of hcavy metals
References
9. WATER MANAGEMENT PLANNING IN URBAN AREAS
J.J. de Graeff
1 Introduction
2 Water management planning in urban areas
3 Tasks of municipalities and water-boards
10. MANAGEMENT OF WATE?. IN THE URBAN ECOSYSTEM
H.W. Kroes
Ahstract
1 Characteristics of ecosytems

2 Ecosystems and human society 179
3 Management of terrestrial and aquatic ecosystems 181
4 Management cf urban ecosystems 184
References 186
! I . MLWICIPAL 1NVC)LVEMENT IN WATER IN AN URBAN ENVIROhMENT 189
L.J. Pieterse
1 Introduction 189
2 The fucction of sewerage 190
3 The ccnstrurtinn of new urban areas and the redevelopment 191
of old areas
4 Priorities 192
5 Problem areas 193
6 Solutions 198
7 Summary 199
12. THE WATER-BOARD, ALSO IN URBAN AREAS
J.S.J. Dragr
Abstract
1 Quantitative water management in urban areas
2 Water quality mmagement in urban areas
3 Recommendation
13. GROUNDWATER MANAGEMENT. GOAL, REQUIREMENTS MID METHODS
A. J. Hebbink
Abstract
1 Introduction
2 Urban hydrological system-
3 Some elements of making the area suitable for building
h Drainage cri-teria
5 Methods to control the groundwater level
6 Subsurface drainage
7 Conclusions
References

14. MANAGEMENT OF GROUNDldATER: A DAILY JOB IN OUR OLDER CITIES
R.H.S. Kremer
Abstract
1 Introduction
2 The character of the subsoil and the groundwater
3 Groundwater managemezt - a start? 4 Groundwater control and town renovation
5 Spaarndamer district, inconveniences ca~sed by ground-
water
5 Co~plaints associated with grvundwater problezzs
7 Groundwater inconveniences in modern districts
References
1 5. GROUNDWATER CONTROL : LEGAL ASPECTS
F.J.G. Gerritsen
Abstract
1 Introduction
2 Legal scope
3 Legal consequences
References


AUTHORS
R . H . AALDERINK
T.A. BUISHAND
J . S . J . DRAGT
A . J . V A N DEN ESHOF
A . J . FRANTZEN
M.K.H. GAST
F,J.G. GERRITSEN
J .J. DE GRAEFF
A . J . HEBBINK
A g r i c u l t u r a l U n i v e r s i t y ,
Department o f Water P o l l u t i o n
C o n t r o l , Wageningen
Royal N e t h e r l a n d s
M e t e o r o l o g i c a l I n s t i t u t e ,
De B i l t
Water-board De A a ,
'S-Hertogenbosch
N a t i o n a l I n s t i t u t e f o r
P u b l i c H e a l t h and
Environmental Hygiene,
B i l t h o v e n
Royal N e t h e r l a n d s
M e t e o r o l o g i c a l I n s t i t u t e ,
D e B i l t
Sewerage and Drainage
Department o f t h e
M u n i c i p a l i t y Amsterdam
Sewerage and Drainage
Department of t h e
h n i c i p a l i t y Amsterdam
Union o f Water-boards ,
'S-Gravenhage
I J s s e l r n e e r p o l d e r s Development
A u t h o r i t y , L e l y s t a d
A.S. HOOGENDOORN-ROOZEMOND
D. TEN HOVE
R.H. J. KREMER
H.W. KROES
L . LIJKLEMA
L. J . PIETERSE
H.F.R. REIJNDERS
M.A. DE RUITER
C.J.E. SCHUURMANS
E.J.B. U U N K
Wi t t eveen + Bos, C o n s u l t i n g
E n g i n e e r s , Deventer
DHV C o n s u l t i n g E n g i n e e r s ,
Amersfoor t
S o i l Mechanics Department
o f t h e M u n i c i p a l i t y Amsterdam
M i n i s t r y o f Housing, P h y s i c a l
P lann ing and Environmental
P r o t e c t i o n , Leidschendam
A g r i c u l t u r a l U n i v e r s i t y ,
Department of Water P o l l u t i o n
C o n t r o l , Wageningen
Water Management Department
o f t h e M u n i c i p a l i t y Rotterdam
N a t i o n a l I n s t i t u t e f o r
P u b l i c H e a l t h and
Env i ronmen ta l Hygiene,
B i l t h o v e n
Department o f P u b l i c Works
i n t h e P r o v i n c e U t r e c h t ,
U t r e c h t
Royal N e t h e r l a n d s
M e t e o r o l o g i c a l I n s t i t u t e ,
De B i l t
I J s s e l m e e r p o l d e r s
Development A u t h o r i t y ,
L e l y s t a d

D. VAT
F.H.M. VAN DE VEN
H . VRIJHOF
R.C.C. WEGMAN
DHV C o n s u l t i n g Engineers ,
Amersfoor t
I J s s e l m e e r p o l d e r s Development
A u t h o r i t y , L e l y s t a d
N a t i o n a l I n s t i t u t e f o r P u b l i c
H e a l t h and Environmental
Hygiene, B i l t h o v e n
N a t i o n a l I n s t i t u t e f o r P u b l i c
Hea l th and Environmental
Hygiene, B i l t h o v e n


INRODUCTION
M.K.H. Gas t
Water i s o f g r e a t impor t ance f o r a c i t y . I n many c i t i e s i n Hol land
t h e s p h e r e is c h a r a c t e r i z e d by water. What would Amsterdam be w i t h o u t
i ts c a n a l s ? The s i g h t o f Rotterdam as a wor ld -por t i s c h a r a c t e r i z e d
by t h e e s t u a r y o f t h e r i v e r Rhine.
C o n t r o l o f t h e w a t e r i s o f v i t a l i n t e r e s t f o r l i f e i n t h e c i t y and
f o r t h e f u n c t i o n i n g o f t h e m u n i c i p a i s o c i e t y .
I n u n d a t i o n s a lways c a u s e g r e a t damage whe the r o c c u r r i n g i n Amsterdam,
i n J a k a r t a o r i n Bangkok.
Water a t t r a c t s p e o p l e . F i s h i n g , swimming and a l l k i n d s o f r e c r e a t i o n
t a k e p l a c e i n , on o r by t h e w a t e r .
T h e r e f o r e t h e q u a l i t y o f w a t e r i s o f g r e a t impor t ance .
Genera l i n t e n t i o n o f t h e s tudy-days
In 1977 t h e TNO Committee on H y d r o l o g i c a l Resea rch (CHO-TNO)
s p e n t a two-day s t u d y c o n f e r e n c e on t h i s s u b j e c t . I n t h e p e r i o d
1977-1985 d i f f e r e n t o r g a n i z a t i o n s had c a r r i e d o u t somet imes c o s t l y
r e s e a r c h programs i n t o a s p e c t s o f m u n i c i p a l w a t e r . The f i n d i n g s o f
t h e s e v a r i o u s b o d i e s and r e p o r t s remained u n c o o r d i n a t e d .
These s t u d y d a y s were s e t up t o r e v i e w t h e r e s u l t s o f t h e r e s e a r c h
e x e c u t e d d u r i n g t h e p e r i o d 1977-1985 and t o d e t e r m i n e t h e p r e s e n t
s t a t e o f e x p e r i e n c e s and o p i n i o n s .

The f o l l o w i n g main s u b j e c t s formed t h e b a s i s o f t h e program:
- q u a l i t y and q u a n t i t y o f r a i n
- t h e i n f l o w and d i s c h a r g e from t h e sewage sys t em
- c o n t r o l o f t h e w a t e r i n t h e c i t y
- c o n t r o l o f t h e g roundwate r l e v e l .
The phenomenon r a i n
The i n t e r n a t i o n a l a t t e n t i o n f o r "ac id r a i n " won ' t have e scaped
anybody 'S a t t e n t i o n . Also a l a r g e s c a l e r e g i s t r a t i o n sys t em h a s been
deve loped t o measure t h e e f f e c t o f t h e s o - c a l l e d wet and d r y
d e p o s i t i o n from t h e a i r on t h e p o l l u t i o n o f w a t e r and s o i l .
C e n t r a l measurements a r e used t o t c a l c u l a t e t h e r e s o u r c e s r e q u i r e d t o
c a t c h , d r a i n a n d , i f n e c e s s a r y , t r e a t t h e r a i n w a t e r . Should l o c a l
o r r e g i o n a l s t a t i s t i c a l v a r i a t i o n s o c c u r , t h e s e c a n form a b a s i s
f o r d e s i g n o p t i m i z a t i o n .
In f low and d i s c h a r g e from t h e sewage sys t em
Pr imary r a i n w a t e r i s c o l l e c t e d i n t h e sewerage . How much o f t h e r a i n
w a t e r w i l l r e a c h t h e sewerage? Which f a c t o r s p l a y a d e t e r m i n a t i n g
p a r t i n t h i s p r o c e s s ? What is t h e i n f l u e n c e o f t h e s e f a c t o r s on
d e s i g n i n g a sewage s y s t e m ?
The w a t e r q u a l i t y is i n f l u e n c e d by r a i n w a t e r d i s c h a r g i n g from t h e
s e p a r a t e d sys t em o r o v e r f l o w s f rom t h e combined s y s t e m .
What is t h e r a t e o f p o l l u t i o n coming from t h e s e d i s c h a r g e s ? What i s
t h e i n f l u e n c e on t h e q u a l i t y o f t h e s u r f a c e w a t e r and which p r o c e s s e s
o c c u r ?
By which methods c a n t h e d i s c h a r g e s be c o u n t e r a c t e d ?
Executed r e s e a r c h i n t h e p a s t y e a r s g i v e answers t o t h e q u e s t i o n s
posed .

C o n t r o l o f t h e w a t e r i n t h e c i t y
?he c o n t r o l o f t h e w a t e r i n t h e c i t y h a s f o r c e n t u r i e s been o f c o n c e r n
f o r t h e m u n i c i p a l i t y . Water-boards I n c h a r g e o f t h e q u a n t i t y c o n t r o l
u s u a l l y have v a s t e x p e r i e n c e s i n f u n c t i o n d e l i m i t a t i o n and l n c o o p e r a t i n g
w i t h t h e m u n i c i p a l i t i e s on t h i s s u b j e c t . Q u a l i t y c o n t r o l h a s been a
h i s t o r y o f o n l y d e c a d e s . S e v e r a l a u t h o r i t i e s a r e i n v o l v e d . E s p e c i a l l y
now t h a t l a r g e s o u r c e s o f p o l l u t i o n have been b r o u g h t t o l l g h t , t h e
teamwork between t h e s e a u t h o r i t i e s c o n t r o l l i n g t h e wa te r q u a l i t y i n t h e
c i t y is once more s e e n as a n i m p o r t a n t f a c t o r . It seems a n optimum
hasn 't been found y e t .
C o n t r o l o f t h e groundwater
The c o n t r o l o f t h e s u p e r f i c i a l g roundwate r l e v e l i s a p o i n t o f g r e a t
c o n c e r n . On t h e one hand wooden f o u n d a t i o n s may n o t be a l lowed t o d r y
o u t w h i l s t on t h e o t h e r hand a d r a i n a g e sys t em o f insufficient c a p a c i t y
w i l l c a u s e m o i s t u r e problems i n and a round t h e h o u s e s . Which p o s s i b i l -
i t ies h a s a m u n i c i p a l i t y i n b o t h t h e fo rma l and t h e t e c h n i c a l a s p e c t s
t o c o n t r o l g r o u n d w a t e r ? What is t h e r e l a t i o n s h i p between a sewage
sys t em and g r o u n d w a t e r ? Which o t h e r f a c t o r s p l a y a p a r t ? These p rob lems
a p p e a r t o be unde r u r g e n t c o n s i d e r a t i o n i n many c i t ies .
The o r g a n i z a t i o n of t h e s tudy-days
To a c h i e v e t h e g r e a t e s t p o s s i b l e combina t ion o f knowledge and e x p e r i e n c e
t h e s e s tudy-days were o r g a n i z e d by CHO-TNO i n c o o p e r a t i o n w i t h t h e
Ne the r l ands Resea rch Committee on Sewerage and Water Q u a l i t y , I J s s e l -
meerpo lde r s Development A u t h o r i t y and t h e M u n i c i p a l i t y L e l y s t a d . Th i s
new c i t y r e c e n t l y b u i l t on and r e c l a i m e d from t h e I J s s e l m e e r was a l s o
w i l l i n g t o a c t a s a h o s t f o r t h i s c o n f e r e n c e .

QUANTITATIVE ASPECTS OF PRECIPITATION IN THE NETHERLANDS
T.A. Buishand and C.J.E. Schuurmans
ABSTRACT
A selection is made of quantitative aspects of precipitation which may
be of interest for urban run-off problems. Although the country is flat
and relatively small there are marked geographical differences in mean
precipitation. The possible contribution to it by urbanization and other
human factors is still unsolved. Annual and daily variations of precipi-
tation can be understood in a general meteorological and climatological
context. Precipitation data show a large interannual variability which
makes it difficult to distinguish systematic changes from pure random
fluctuations.
Depth-duration-frequency curves, precipitation profiles and area1 reduc-
tion factors for short time-intervals are discussed in some detail. Re-
sults are compared with those in the relevant literature. Recomrnenda-
tions for use are given where appropriate.
Finally,the importance of the movement of individual rain storms for
sewer system design is dealt with and a description is given of one of
the largest single events which struck The Netherlands in recent times.

l INTRODUCTION
The precipitation intensities in The Netherlands are on average not very
large: an annual amount of approximately 750 mm is delivered in about
the same number of hours, which means an average intensity of 1 mm/h.
Urban run-off problems nevertheless exist, partly because very large
positive departures from the average intensity can occur over short
time-intervals. In order to solve such problems in an economic way de-
tailed knowledge of the precipitation climate is needed.
In the paper presented here first some general characteristics of the
distribution of precipitation in space and time are discussed in Ch. 2.
Then Ch. 3 deals with precipitation amounts over short time-intervals.
Finally, in Ch. 4 attention is paid to individual precipitation events.
In the last chapter the emphasis is on very heavy events. The study of
such events is important in view of flooding in the urban area and the
impact on receiving waters (erosion of banks, flooding and violent
pollution loadings).
2 THE PRECIPITATION CLIMATE OF THE NETHERLANDS
In this chapter characteristics of precipitation in The Netherlands are
discussed mainly on the basis of average values. There are some marked
geographical differences and there is also a pronounced annual cycle. At
inland stations showers occur more frequently in the afternoon and early
evening than on other times of the day.
Section 2.1 shows how the average annual amounts vary over the country.
Differences between monthly averages are dealt with in Section 2.2.
Daily variation is discussed in Section 2.3. In Section 2.4 attention is
paid to long-term trends in precipitation.
2.1 Geographical distribution
Fig. 1 shows the distribution of the average annual precipiation amounts
6

Figure 1 Average annual amounts Figure 2 Average annual number of
f o r the period 1951-80 days with a p rec ip i t a t ion
amount L 10 mm f o r the
period 1951-80
i n The Netherlands. There a r e some marked d i f ferences ,even though the
country i s f l a t and r e l a t i v e l y small . Four loca t ions , wel l separated
from each o the r , have an average annual amount g rea t e r than 850 mm. The
h i l l y areas (100 t o 300 m above sea l e v e l ) i n the eas t -cent ra l p a r t of
the country and i n the f a r south have the l a r g e s t annual averages.
Orographic enhancement of p r e c i p i t a t i o n i s of importance i n these areas .
The maximum i n the west of the country i s loca ted i n the so-called Rand-
s t ad area , an urbanized area containing the four c i t i e s Amsterdam, Rot-
terdam, Den Haag (The Hague) and Utrecht . I n the pas t ten years severa l
s tud ie s have been made t o r e l a t e the l a rge r p r e c i p i t a t i o n amounts i n
t h i s a rea t o urbanization and i n d u s t r i a l i z a t i o n , s ee Witter (1984) f o r a
review. Although some indica t ions a r e found t h a t c i t i e s l i k e Amsterdam
and Rotterdam might be the cause of changes i n heavy p rec ip i t a t ion

c h a r a c t e r i s t i c s i n t h e i r v i c i n i t y , t he p r e c i p i t a t i o n maximum i n t he west
of t he country i s c e r t a i n l y not of urban o r i g i n a lone . The maximum i n
t h e north-east o f t h e country i s no t r e l a t e d t o orographic f e a t u r e s o r
t o an urban e f f e c t .
The same geographical d i s t r i b u t i o n i s found f o r t he annual average num-
ber of days wi th a p r e c i p i t a t i o n amount L 10 mm, which a r e given i n
F ig . 2. Such events occur on average nea r l y twice a month and g ive a
cons iderab le c o n t r i b u t i o n t o t he annual amounts. The a p p l i c a b i l i t y of
the p a t t e r n s i n t h e F ig s . 1 and 2 f o r urban sewer des ign problems i s
d i scussed i n Sec t ion 3 .1 .
2.2 Annual v a r i a t i o n
Average monthly t o t a l s f o r f i v e s t a t i o n s , we l l - d i s t r i bu t ed over t he
count ry , a r e g iven i n Table 1.
Table 1 Average monthly t o t a l s i n mm a t De ~ i l t ( 5 2 O 0 6 ' ~ , 5 ° 1 1 1 ~ ) ,
De Kooy (5z055'N, h047'E), ~ l i s s i n g e n (51°27'N, 3 O 3 6 ' ~ ) , Eelde
(53O08'N, 6O35'E) and Beek (50°55'N, 5 ° 4 6 ' ~ ) f o r t he period
1951-1980
S t a t i o n J F M A M J J A S O N D
De B i l t 67 50 51 52 54 70 77 88 65 69 75 79
De Kooy 63 43 42 42 38 43 66 77 79 78 88 74
Vl i ss ingen 61 49 46 44 44 58 71 77 67 73 77 70
Eelde 64 45 48 48 59 62 87 83 70 66 76 73
Beek 59 53 54 52 57 71 79 85 63 57 71 69
From the t a b l e t he fol lowing conc lus ions can be drawn:
( 1 ) f o r a l l s t a t i o n s t h e period February t i l l May i s r e l a t i v e l y dryer
than t he r e s t o f t h e yea r ,
( 2 ) t he h igher summer and autumn l e v e l of p r e c i p i t a t i o n s t a r t s a l r e ady
i n May and June a t t he in land s t a t i o n s De B i l t , Eelde and Beek; f o r
the c o a s t a l s t a t i o n s De Kooy and Vl i ss ingen t h e i nc r ea se i n mean
p r e c i p i t a t i o n begins about one month l a t e r ,

( 3 ) in land s t a t i o n s have on average maximum p r e c i p i t a t i o n amounts in
Ju ly and August; c o a s t a l s t a t i o n s i n l a t e f a l l .
The p rope r t i e s of t h e annual v a r i a t i o n of p r e c i p i t a t i o n i n The Nether-
l ands f i nd t h e i r explana t ion i n a number of well-known f a c t s concerning
t he annual v a r i a t i o n of t h e genera l c i r c u l a t i o n over t he a r e a , i n s t a b i -
l i t y due t o su r f ace hea t i ng i n t h e summer season and t he s h i f t of t h e
l a t t e r t o t he autumn i n c o a s t a l a r e a s due t o t he delayed cool ing of t h e
North Sea. For a l l seasons ho lds t h a t independent of t h e p r e c i p i t a t i o n
caus ing systems t h e warmer t h e a i r a t mean su r f ace l e v e l t h e h igher
p r e c i p i t a t i o n amounts one may g e t . The mere f a c t t h a t warmer a i r con-
t a i n s more mois ture i s of importance h e r e .
From t h e foregoing i t fol lows t h a t t he annual v a r i a t i o n i s mainly a
consequence of increased p r e c i p i t a t i o n amounts and i n t e n s i t i e s a t h ighe r
temperatures. For p r e c i p i t a t i o n events of i n t e r e s t i n urban sewer des ign
t he annual v a r i a t i o n i s t h e r e f o r e much more pronounced than f o r monthly
averages.
2 . 3 Dai ly v a r i a t i o n
There i s an obvious d a i l y v a r i a t i o n i n t he occurrences of heavy showers.
Buishand and Velds (1980) analysed t h e t e n l a r g e s t 15-minute events i n
De B i l t f o r a 72 y r . per iod and found t h a t n ine of t h e s e events occurred
between 1700 and 2400 GMT.
During t h e summer ~ e r i o d t h e l a r g e s t average i n t e n s i t i e s on r e l a t i v e l y
warm days a t De B i l t a r e found i n t h e l a t e a f te rnoon and e a r l y evening.
This i s demonstrated i n Fig. 3 where hour ly averages on warm days a r e
compared wi th o v e r a l l hour ly averages . During most hours of t he day t h e
o v e r a l l averages a r e much l a r g e r than t h e warm day averages because warm
days i n summer have a low p r o b a b i l i t y of p r e c i p i t a t i o n , bu t t h e o v e r a l l
averages do no t show a pronounced d a i l y v a r i a t i o n . Note fu r t he r from
F ig . 3 t h a t hour ly averages du r ing t h e n igh t fo l lowing a warm day a r e
much l a r g e r than those dur ing preceding n i g h t s .

Average hourly amount (mm) 0.15 1 I 1 I I I 8 I
all days U
/ X l I
P m
\ I X \m
Time GMT Fig . 3 Average hour ly p r e c i p i t a t i o n a t De B i l t dur ing summer (June-
August) f o r t he per iod 1921-70. The c r o s s e s and t he dashed
l i n e r e f e r t o days wi th a maximum temperature Tx 2 22 '~ . A f t e r
I n c o a s t a l regions t h e r e i s a c l e a r d i u r n a l v a r i a t i o n i n autumn and ear -
l y win te r due t o v e r t i c a l i n s t a b i l i t y over r e l a t i v e l y warm water and
c o a s t a l convergence. Maxiinum p r e c i p i t a t i o n i s found a f t e r midnight .
2.4 In te rannual v a r i a b i l i t y and t r ends
F ig . 4 shows t h a t dur ing t h i s c en tu ry an upward t r end i n t h e order of
50 mm has been observed i n t h e 30-year average annual p r e c i p i t a t i o n
amounts a t De B i l t . P a r a l l e l w i th t h i s t rend an i nc r ea se of about 2 i s
found i n t he annual number of days on which t h e p r e c i p i t a t i o n amount
exceeded o r equa l l ed 10 mm. These changes a r e smal l i n comparison w i th
t h e geographical d i f f e r e n c e s shown i n t h e F ig s . 1 and 2 , bu t neve r the l e s s
i t i s o f t e n supposed t h a t they have p r a c t i c a l re levance . However, t h e

Annual amounts (mm) 1200 , , I I
Figure 4 Annual amounts and number of days with a p r e c i p i t a t i o n amount
2 10 mm a t De B i l t f o r t h e per iod 1906-80. The dashed l i n e
r e f e r s t o a 30-year moving average
40
reasons underlying t he se t rends a r e r a t h e r obscure , which means t h a t
ex t r apo l a t i on i s no t j u s t i f i e d .
Days with precipitation Z lomm I I t I j I
From a p r a c t i c a l p o i n t of view t h e magnitude of t h e i n t e r annua l va r i ab i -
l i t y may be of more importance than t h e unexplained smal l t r end . From
F i g . 4 i t i s seen t h a t annual p r e c i p i t a t i o n amounts may vary from year-
to-year by a f a c t o r o f 2 t o 3. For t h e annual number of days wi th a pre-
c i p i t a t i o n amount 2 10 mm t he r e l a t i v e v a r i a b i l i t y is even l a r g e r . As a
consequence t h e s tandard dev i a t i ons of a 30-year average a r e r a t h e r
l a r g e : 24 mm f o r t he average annual amounts, and 1.1 f o r t he average

annual number of days with a precipitation amount 2 10 mm. This is about
half the magnitude of the upward trend mentioned earlier. Because of
these rather large standard deviations it is difficult to discriminate
between systematic changes and random fluctuations.
From a purely theoretical point of view evidence has been presented that
the present increase of CO2-concentration of the atmosphere will cause
higher temperatures and a more intensive hydrological cycle (~anabe and
Stouffer, 1980). Sensitivity studies using three-dimensional climate
models, with realistic topography, have shown that relatively large
changes of regional precipitation patterns may take place, in case the
CO2-concentration is doubled or quadrupled (Manabe et al., 1981). A 10%
real change in either direction of the annual or seasonal precipitation
levels discussed above seems to be a realistic possibility for the next
century.
3 PRECIPITATION AMOUNTS OVER SHORT TIME-INTERVALS
In urban sewer design precipitation amounts over short time-intervals
are important. Often one is interested in the probability distribution
of precipitation amounts for durations shorter than 1 day. Information
about this probability distribution is usually presented in the form of
depth-duration-frequency curves. Another topic is the selection of a
suitable precipitation profile. Further the use of frequency information
about precipitation amounts at a point may not be appropriate for pre-
cipitation amounts over an urban catchment area.
Section 3.1 deals with depth-duration-frequency curves for commonly re-
quired durations and return periods. In Section 3.2 some notes are given
on the location of peak intensities within a precipitation event.
Questions about area1 precipitation are discussed in Section 3.3.
3.1 Depth-duration-frequency curves
To avoid confusion the idea behind depth-duration-frequency curves is
12

i l l u s t r a t e d wi th an example. F ig . 5 g ive s average i n t e n s i t i e s of a
shower i n 5-minute i n t e r v a l s . For t h i s shower t h e maximum p r e c i p i t a t i o n
amounts f o r a number of f ixed du ra t i ons D a r e determined. For i n s t a n c e ,
t h e maximum p r e c i p i t a t i o n amount f o r D = 30 min i s 16 mm i n Fig. 5 which
corresponds w i th a n average i n t e n s i t y of 0 .53 mm/min. It i s allowed t h a t
t h e r e a r e d ry ep isodes w i th in t h e du ra t i on D . For each va lue of D t h e
s e l ec t ed l oca l maxima ( o r peaks) from a p r e c i p i t a t i o n record form a so-
c a l l e d p a r t i a l du ra t i on s e r i e s o r peak over t h r e sho ld s e r i e s . A depth-
durat ion-frequency curve g ive s a percentage po in t o f t h e p r o b a b i l i t y
d i s t r i b u t i o n of t he se peaks a s a f unc t i on of du ra t i on D . The p r o b a b i l i t y
of exceedance i s u sua l l y expressed i n terms of t h e mean recur rence
i n t e r v a l o r r e t u r n period Tp. Examples of depth-duration-frequency
curves a r e given i n F ig . 6. From the f i g u r e i t i s seen t h a t the maximum
30-min amount i n Fig. 5 i s exceeded on average once i n 2 .5 y r .
I n The Netherlands t he d i scharge capac i t y of sewer systems has t o be
l a r g e enough t h a t water i n t he s t r e e t s may occur on average only about
once i n 2 y r . Return per iods of 10 y r . and longer a r e l e s s common but
can be u se fu l i f one wishes t o i n v e s t i g a t e measures t o prevent s e r i o u s
f looding . For t he se des ign o b j e c t i v e s one u sua l l y has t o work wi th
du ra t i ons l e s s than 1 hour . The p r e c i p i t a t i o n even t s of i n t e r e s t a r e a l l
h igh i n t e n s i t y storms t h a t mainly occur i n t h e summer season. Often
t he se events a r e found i n t he second h a l f o f t h e day (Sec t ion 2 .3) .
Since the c r i t i c a l du ra t i ons a r e much l e s s than one day i t i s dangerous
t o r e l a t e r eg iona l d i f f e r ences w i th r e s p e c t t o t he se des ign ob j ec t i vea to
r eg iona l d i f f e r e n c e s o f heavy d a i l y r a i n f a l l s . For i n s t ance , from t h e
l i t e r a t u r e i t i s known t h a t orography has a much sma l l e r impact on t h e
occurrence of high i n t e n s i t y s torms than on t h e d i s t r i b u t i o n of d a i l y
amounts.
Another demand on combined sewer systems i n The Netherlands i s t h a t
overflows t o wa t e r s i n t h e urban surroundings may occur only wi th a
frequency i n t he order of 5 t imes pe r year . Overflows a r e no t on ly
caused by s h o r t heavy showers bu t can a l s o occur dur ing prolonged fron-
t a l r a i n s . The d i u r n a l v a r i a t i o n i n t h e occurrence of overflows is
t h e r e f o r e much l e s s pronounced than i n f lood occur rences . For problems
concerning t he frequency of overf lows du ra t i ons of s e v e r a l hours a r e

Average intensity (mm/min)
g
'--FJ Time GMT
Figure 5 Average 5-minute intensities in a shower at De Bilt (27 July
1972). The hatched area denotes the maximum precipitation
amount for D = 30 minutes
Precipitation depth(mm1
Figure 6 Depth-duration-frequency curves for De Bilt. The maximum
30-minute amount in Fig. 5 is marked with a cross. The curves
for Tp = 2 and 10 yr. have been taken from Buishand and Velds
(1980); to construct the curve for Tp = 0.2 yr. ( 5 times per
year) use has been made of Buishand (1983) for D 2 1 hour and
KNMI (1968) for D < 1 hour

usua l l y of i n t e r e s t . Because of t he se longer du ra t i ons t h e r e i s a r a t h e r
s t r ong r e l a t i o n between t h e frequency of overflows and l a r g e d a i l y r a i n -
f a l l s . Regional v a r i a t i o n wi th r e s p e c t t o t h i s problem i s t he r e fo r e
about t he same a s i n t h e average number of days w i th a p r e c i p i t a t i o n
amount 2 10 mm ( ~ i g . 2).
The d i s cus s ion given above about r a i n f a l l - f r equency information i s f a r
from complete. Other methods e x i s t . It is however ou t s i de t he scope of
t h i s paper t o g ive f u r t h e r d e t a i l s . For more in format ion about p r ec ip i -
t a t i o n s t a t i s t i c s i n The Netherlands f o r sewer des ign the reader i s
r e f e r r e d t o Buishand (1984).
3 .2 Locat ion of peak i n t e n s i t i e s and p r e c i p i t a t i o n p r o f i l e s
Besides frequency information about p r e c i p i t a t i o n amounts f o r d i f f e r e n t
du ra t i ons knowledge i s a l s o needed about t he shape of p r e c i p i t a t i o n
p r o f i l e s i n sewer des ign . It i s n o t always j u s t i f i e d t o assume t h a t t h e
i n t e n s i t y is cons t an t dur ing t h e du rd t i on D . Although t h e depth-
durat ion-frequency curve g ives a p r o f i l e , t h i s i s however an u n r e a l i s t i c
one wi th a very sharp peak. Therefore t he s e l e c t i o n of p r e c i p i t a t i o n
p r o f i l e s r e q u i r e s a f u r t h e r s tudy of t h e o r i g i n a l p r e c i p i t a t i o n da t a .
Table 2 g ives t he p o s i t i o n of t he most i n t e n s i v e p a r t w i t h i n a du ra t i on
D f o r p r e c i p i t a t i o n d a t a of t h e Emscher and Lippe catchment a r ea (about
50 k i lomet res t o t h e e a s t o f The etherl lands). For D = 1 hour t h e r e i s a
p re fe rence i n summer of t he most i n t e n s i v e p a r t f o r t h e beginning of t h e
p r e c i p i t a t i o n event . Large l-hour amounts a r e mainly due t o showers from
cumulonimbus c louds . I n t he beginning of the shower t h e cloud i s i n i t s
mature s t age g iv ing t h e h ighes t i n t e n s i t i e s . For The Netherlands t h e
preference of peak i n t e n s i t i e s t o t h e beginning of a shower has been
confirmed by Lever t (1958) from a s tudy of a 2-year record of 5-minute
amounts and by Buishand and Velds (1980) from an a n a l y s i s of t he t e n
l a r g e s t 15-minute p r e c i p i t a t i o n even t s i n De B i l t f o r a 72 y r . pe r i od .
For longer du ra t i ons t h e p o s i t i o n of t h e peak g e t s a more random
cha rac t e r . Here heavy showers a r e l e s s dominant and sometimes t h e r e
might be two d i s t i n c t r a i n y pe r i ods w i t h i n t h e d u r a t i o n D.

Table 2 Locat ion of t h e most i n t e n s i v e p a r t w i th in t he du ra t i on D . The
q u a n t i t y p; denotes t he p r o b a b i l i t y t h a t t h e l a r g e s t p r e c i p i t a -
t i o n amount during an i n t e r v a l of l ength D/& f a l l s i n t h e i - t h
q u a r t e r o f t h e du ra t i on D . Af te r Anderl and Stalmann (1977)
summer X
winter 2 3 2 6 18 3 3
D = 6 h summer 3 3 23 29 15
win te r 2 3 23 25 30
D = 2 4 h summer
win te r
X summer = May-October; w i n t e r = November-April.
It should be noted t h a t t he maximum p r e c i p i t a t i o n amount i n a f i xed
dura t ion D does no t correspond w i th t he t o t a l amount i n a storm. This i s
f o r ins tance the ca se i n Fig. 5 . Only a few s t u d i e s on p r e c i p i t a t i o n
p r o f i l e s inc lude p r e c i p i t a t i o n o u t s i d e t h e i n t e r v a l wi th maximum in t en -
s i t y . Information about t h i s can be found i n Normand (1971) and Arne l l
e t a l . (1983).
The s e l e c t i o n of a s u i t a b l e p r o f i l e cannot be done wi thout a s e n s i t i v i t y
a n a l y s i s . A sound approach i s found i n t he UK Flood S tud i e s Report
(1975). Although t h i s work dea l s w i th r i ve r f l ow d a t a t h e approach can
a l s o be extended t o t h e des ign of sewer systems (Packman and Kidd,
1980). Addi t iona l r e s u l t s about s e n s i t i v i t y a n a l y s i s can be found i n t h e
e a r l i e r c i t e d pub l i c a t i ons of Anderl and Stalmann (1977) and Arne l l e t
a l . (1983).
3 . 3 Area1 r educ t i on f a c t o r s
The depth-duration-frequency curves i n F ig . 6 r e f e r t o t h e d i s t r i b u t i o n
of p r e c i p i t a t i o n amounts a t a p o i n t . E spec i a l l y f o r l a r g e urban a r e a s i t

may be necessary t o a d j u s t t h i s d i s t r i b u t i o n t o g i v e a n a p p r o p r i a t e
d i s t r i b u t i o n of a r e a l averages . T h i s can be done by m u l t i p l y i n g t h e
o r d i n a t e s i n Fig. 6 by t h e s t a t i s t i c a l a r e a l r e d u c t i o n f a c t o r (ARF).
The v a l u e of t h e ARF v a r i e s wi th d u r a t i o n D, s i z e of t h e a r e a A and
r e t u r n per iod Tp. For t h e 2-yr. even t ARF can be ob ta ined from t h e
r e l a t i o n (Buishand and Velds , 1980):
where A is i n km2 and D i s i n min. Table 3 shows t h a t t h i s r e l a t i o n
g i v e s good r e s u l t s f o r a r e a s i n Europe w i t h a temporate c l i m a t e .
Table 3 Comparison of a r e a l r e d u c t i o n f a c t o r s from Eq. ( 1 ) w i t h t h o s e
f o r t h e United Kingdom (NERC, 19751, Lund-Sweden (Niernczynowicz,
1982) and The Netherlands ( W i t t e r , 1984)
Area1 r e d u c t i o n f a c t o r ARF f o r Tp = 2 y r .
Durat ion D Area A
(min) ( km2 ) E q . ( l ) UK Lund Netherlands
For a 10-year even t a smal le r v a l u e f o r t h e ARF has t o be used . Calcula-
t i o n s by B e l l (1976) and W i t t e r (1984) sugges t t h a t f o r t h i s r e t u r n
per iod t h e r ight-hand s i d e o f ( 1 ) should be m u l t i p l i e d by a f a c t o r i n
t h e o r d e r of 1.1 t o 1 .4 . For Tp = 0 . 2 y r . t h e converse ho lds
( ~ i e m c z ~ n o w i c z , 1982).
It should be s t r e s s e d t h a t t h e s t a t i s t i c a l ARF h a s no o t h e r meaning t h a n
a r a t i o between t h e a r e a l average and p o i n t amount w i t h t h e same r e t u r n
per iod . It cannot be used t o c o n v e r t a p o i n t v a l u e of a n i n d i v i d u a l
s torm t o an a r e a l v a l u e . F u r t h e r i n s t u d i e s on a r e a l v a r i a t i o n of p r e c i -
p i t a t i o n it i s no t always obvious t o look a t a r e a l averages . For

i n s t ance , t h e d i f f e r e n c e s over t h e reg ion a r e of primxry i n t e r e s t i f one
wishes t o determine t he opt imal hyd rau l i c c apac i t y of a reg iona l sewage
t rea tment p l an t (Bakker e t a l . , 1983).
4 CHARACTERISTICS OF INDIVIDUAL PRECIPITATION EVENTS
This chapter s t a r t s i n Sec t ion 4 . 1 with a d i s cus s ion on storm movement.
A t t en t i on i s pa id t o t he d i s t r i b u t i o n of s torm speeds and t o t he s i gn i -
f icance of t h i s sub j ec t f o r sewer des ign . Sec t ion 4 . 2 dea l s with t h e
"Gouda storm", being one of the most spec t acu l a r p r e c i p i t a t i o n events i n
t h i s century i n The Netherlands.
4 . 1 Storm movement
The d i r e c t i o n and speed of a s torm a r e a s soc i a t ed wi th t he upper a i r
motion. The storm t r a c k can o f t e n be r e l a t e d t o t h e wind a t t he 700 hPa
l e v e l ( t h i s i s o b a r i c l e v e l has a he igh t of about 3 km). A s tudy on storm
movement near London has been made by Shearman (1977). From a network of
se l f - record ing gauges i n Surrey t h e d i r e c t i o n and speed were der ived f o r
t h e 20 l a r g e s t s torms i n every yea r . Information about t h e 700 hPa wind
could be ob ta ined from upper a i r measurements i n Crawley (Sussex).
Table 4 compares t h e frequency d i s t r i b u t i o n of s torm speeds with t h e
d i s t r i b u t i o n of t he 700 hPa wind. There i s a reasonable correspondence
between t h e two frequency d i s t r i b u t i o n s . Fu r the r , t he 700 hPa wind speed
d i s t r i b u t i o n a t Crawley dur ing heavy p r e c i p i t a t i o n corresponds n i c e l y
wi th the 700 hPa wind speed d i s t r i b u t i o n dur ing r a i n a t Trappes near
P a r i s . Therefore , i t may be assumed t h a t t he r e s u l t s i n Table 4 ho ld f o r
The Netherlands too.
Table 4 l e a r n s t h a t t he average s torm v e l o c i t y i s i n the order of 15 m/s
(50 t o 60 km/h). A t y p i c a l example of t he s p a t i a l d i s t r i b u t i o n of d a i l y
p r e c i p i t a t i o n amounts from r ap id moving heavy showers i s given i n F ig .7 .
During a period of about f i v e hours the s torms moved from Vl iss ingen i n
t h e south west o f t h e country t o Groningen i n the n o r t h e a s t . The i so -
hye t s a r e o r i e n t e d i n t h e d i r e c t i o n of t he storms which corresponds i n

Table 4 Frequency d i s t r i b u t i o n of storm speeds and wind v e l o c i t i e s i n
m/s a t the 700 hPa l e v e l . The t a b l e i s based on da t a from
Shearman (1977) and Misme (1980). The storm speed d i s t r i b u t i o n
r e f e r s t o heavy storms o f du ra t i on up t o 2 hours. The 700 hPa
wind a t Crawley has been taken a t times a s c l o s e a s pos s ib l e t o
the storms i n Surrey; measurements of t h e 700 hPa wind a t
Trappes have been considered during r a i n y per iods
P r o b a b i l i t y of non-exceedance (%)
1 5 10 20 30 40 50
Storms Surrey 2 7 8 11 14 18 -
700 hPa wind Crawley 4 5 7 10 12 14 15
700 hPa wind Trappes 3 5 7 10 13 15 17
Figure 7 S p a t i a l d i s t r i b u t i o n of 24-hour p r e c i p i t a t i o n amounts
r e g i s t r a t e d i n t h e morning of 3 August 1967. Af t e r Buishand
and Velds (1980)

t h i s case very w e l l with t h e 700 hPa wind d i r e c t i o n .
I n most occasions t h e s torm speed i s much l a r g e r than t he flow v e l o c i t y
i n t h e sewer system. As a consequence lowering o r reinforcement of peak
flows due t o s torm movement may i n genera l be d i s regarded i n sewer
des ign . This ha s been confirmed i n a d e t a i l e d s t udy by Niemczynowicz
(1984).
4.2 The "Gouda storm"
A remarkable p r e c i p i t a t i o n even t occurred on 23 June 1975. I n t h e l a t e
a f te rnoon and evening heavy showers developed over a l a r g e a r ea . I n
Gouda, a small town 20 km t o t he n o r t h e a s t of Rotterdam, a 24-hour
p r e c i p i t a t i o n amount of 145.5 mm was r e g i s t r a t e d . A t t h e moment of t he
p r e sen t t e chn i ca l meeting t h i s d a i l y va lue i s t h e 3rd l a r g e s t i n t h e
h i s t o r y of p r e c i p i t a t i o n measurements i n The Netherlands.
The synoptic s i t u a t i o n g iv ing r i s e t o t h e showers was very complex. A
low pressure a r ea over southern Germany brought warm a i r t o The Nether-
l ands . The maximum temperature i n De B i l t was 27OC. Heavy thunderstorms
occurred i n an almost s t a t i o n a r y t rough ( a r ea w i th r e l a t i v e l y low a i r
p r e s su re ) over t h e c e n t r a l p a r t o f The Netherlands. The p r e c i p i t a t i o n
amounts were cons ide r ab l e due t o t h e l a r g e humidity and long du ra t i on .
Noteworthy i s t h e f a c t t h a t t h e a i r p r e s su re was 1019 hPa dur ing t h i s
p r e c i p i t a t i o n even t . The wind i n t h e upper l a y e r s was l i g h t from t h e
eas t -nor th e a s t ; a t t he ground mainly n o r t h e r l y winds were observed.
Fig. 8 shows t h e d a i l y p r e c i p i t a t i o n amounts, a r ada r p i c t u r e and t he
hour ly amounts a t Zestienhoven otterda dam, a i r p o r t ) . A p r e c i p i t a t i o n
amount of nea r l y 40 mm was r e g i s t r a t e d between 1500 and 1600 GMT. The
mean r e t u r n per iod of t h i s v a l u e i s about 100 y r . The showers i n t h e
e a r l y a f te rnoon mainly occurred i n t h e west of t h e count ry . During t h e
second period of h igh p r e c i p i t a t i o n i n Zestienhoven t he showers were
spread over t h e whole c e n t r a l p a r t o f The Netherlands. The reg ion of
t he showers on t h e r ada r p i c t u r e corresponds roughly w i th t he a r e a
w i th in t he l O m m i sohye t s . The t o t a l 24-hour p r e c i p i t a t i o n amount a t

Precipitation amount (mm) -. rlgure 8 Heavy precipitation on 40 23-24 June 1975. The
left map gives the
measured 24-hour amounts 30
on 24 June, 0800 GMT.
The right map shows the
20 2100 GMT radar picture
from Schiphol (Amsterdam
airport). Precipitation
10 intensities in this
picture are very rough
estimates. The graph 0 gives the temporal
variation of the hourly I
8 12 16 20 jf 4 * amounts at Zestienhoven
Time GMT otterda dam airport)

Zestienhoven was 109 mm and all precipitation stations in Rotterdam
registrated more than 50 mm. People in this area experienced a very
unpleasant aspect of Water in Urban Areas.
REFERENCES
ANDERL, B. and STALMANN, V., 1977. Temporal variation of precipitation
intensities in design storms for the Emscher and Lippe area (in
erm man). Eigenverlag Emschergenossenschaft-Lippeverband, Essen,
48 + 12 p.
ARNELL, V., HARREMOES, P., JENSEN, M., JOHANSEN, N.B. and NIEMCZYNOWICZ,
J., 1983. Review of rainfall data application for design and analy-
sis. In: Rainfall as the basis for design and urban run-off analysis,
p 7-51. Preprints Specialised Seminar, Techn. Univ. of Denmark,
Copenhagen.
BAKKER, K., HARTONG, H. and WALTEK, J.J.W.M., 1983. Variations in point
precipitation and the capacity of sewage treatment works (in Dutch).
H20, 16: 17-21.
BELL, F.C., 1976. The area1 reduction factor in rainfall frequency
estimation. Rep. 35, Inst. of Hydrol., 58 p.
BUISHAND, T.A., 1983. Distribution of D-hr precipitation amounts
(D = 1, 2, 4, 6, 12, 24 or 48) in The Netherlands (in ~utch).
Wetensch. Rapp. W.R. 83-5, Kon. Ned. Meteor. Inst., De Bilt, 58 p.
BUISHAND, T.A., 1984. Precipitation data for storm sewer design (in
~utch). H20, 17: 195.
BUISHAND, T.A. and VELDS, C.A., 1980. Climate of The Netherlands 1:
Precipitation and evaporation (in Dutch). Staatsuitgeverij Den Haag,
206 p.
KNMI, 1968. Detailed analysis of records of pluviographs A. Frequency
distributions of the amounts of precipitation in periods of 5 to
660 minutes. De Bilt, 1928, 1933, 1951-1960. Publication 147,
Kon. Ned. Meteor. Inst., De Bilt.
KONNEN, G. P. , 1983. The weather in The Netherlands (in Dutch), Thieme, Zutphen, 143 p.
LEVERT, C., 1958. The morphology of a rainfall event (in Dutch). Hemel
en Dampkring, 56: 183-193.

MANABE, S. and STOUFFER, R.J., 1980. Sensitivity of a global climate
model to an increase of CO2 concentration. J. Geophys. Res., 85
(C10): 5529-5554.
MANABE, S., WETHERALD, R.T. and STOUFFER, R.J., 1981. Summer dryness due
to an increase of atmospheric CO2 concentration. Clim. Change, 3:
347-386.
MISME, P., 1980. Dimension of rainfall cells (in French). La Mkteoro-
logie, VIe skrie (20-21): 299-301.
NERC, 1975. Flood studies report (5 volumes). Natural Environment
Research Council, London.
NIEMCZYNOWICZ, J., 1982. Area1 intensity-duration-frequency curves for
short term rainfall events in Lund. Nordic Hydrol., 13: 193-204.
NIEMCZYNOWICZ, J., 1984. Investigation of the influence of rainfall
movement on runoff hydrograph. Part 1: Simulations on conceptual
catchment. Nordic Hydrol., 15: 57-70. Part 2: Simulations on real
catchments in Lund. Nordic Hydrol., 15: 71-84.
NORMAND, D., 1971. Models for the investigation of runoff in towns
(in French). La Houille Blanche, 26: 231-238.
PACKMAN, J.C. and KIDD, C.H.R., 1980. A logical approach to the design
storm concept. Water Resources Research, 16: 994-1000.
SHEARMAN, R.J., 1977. The speed and direction of movement of storm
rainfall patterns with reference to urban storm sewer design.
Hydrol. Sci. Bull., 22: 421-431.
WITTER,J.V., 1984. Heterogeneity of Dutch rainfall. Ph.D.thesis Agric.
Univ. Wageningen, 204 p.

THE CHEMICAL COMPOSITION OF RAINWATER IN THE NETHERLANDS - WET DEPOSITION OF AIR POLLUTANTS
A.J. van den Eshof, A.J. Frantzen, H.F.R. Reijnders,
H. Vrijhof and R.C.C. Wegman
ABSTRACT
The objectives of t h e National Rainwater Composition Measurement
Network a re discussed. The wet deposit ions of macrocomponents, some
t r ace elements and organic substances measured i n 1983 a r e presented.
Final ly , the composition of Dutch rainwater is evaluated.
The term rainwater qua l i ty usual ly r e f e r s to the chemical composition.
It means the condit ion measured by means of sampling and analys is , and
subsequent in t e rp re ta t ion of the data. The term qua l i ty , however, a l so
means a subject ive evaluation of the chemical composit ion, e.g., t o
judge whetnet the rainwater is su i t ab le fo r a c e r t a i n use. Such an
ambiguous concept of waterquali ty has led t o much confusion i n other
f i e l d s l i k e groundwater, drinking water and surface water. With respect
t o rainwater the term chemical composition is generally, and interna-
t i o n a l l y too, preferred to q u a l ~ t y , unless one wants t o designate the
rainwater 'S f unct i ~ n a l apt i tude .
The study of the chemical composition of rainwater is of i n t e r e s t fo r
the evaluation of many s c i e n t i f i c and p rac t i ca l problems.

Thus, a knowledge of the chemical composition makes it possible to
evaluate the degree of a i r pol lu t ion, the s ink terms i n the atmospheric
cycle of a i r pol lu tants , the corrosiveness of atmospheric waters and
the e f f e c t of rainwater on the mater ia l balance of s o i l s , waters and
vegetation. For these reasons, many rainwater analyses have been done,
mostly i n the l a s t three decades.
Figure 1 i l l u s t r a t e s the atmospheric emission, d ispers ion and ul t imate
removal of a i r pol lu tants . Deposltlon a t the zarth 's surface may lead
t o eventual e f f ec t s .
ATMOSPHERE
transport (dispersion. transformation)-removal (dry, wet)
t actlvity-rernission
l deposition --effect
EARTH
Figure 1 Atmosferic emission, d ispers ion and removal of a i r po l lu t an t s
Wet removal or p rec ip i t a t ion scavenging processes a r e associated with
precipi ta t ion . tot11 natura l and pol lu tant t r ace const i tuents i n the
atmosphere a r e scavenged by a va r i e ty of hydrometeors: cloud drople ts ,
raindrops, snowflakes, fog d rop le t s , e t c . The scavenging process
depends on a l t i t u d e (below-cloud o r in-cloud) , on p rec ip i t a t ion type
( r a in , snow), on the nature of the pol lu tant mater ia l ( p a r t i c l e , gas)
and on the ac tual physical mechanism of uptake [Whelpdale, 1982a, b].
Dry removal processes take place without the mediation of p rec ip i t a t ion
and may take place continuously. Dry removal includes sedimentation of
aerosols and d i r e c t absorption of gases. The term deposit ion commonly
r e f e r s to the f l u x of mater ia l reaching the ea r th ' s surface a s a r e s u l t
of the wet and dry removal processes.
Whereas the measurci?ent of dry deposit ions i s st i l l i n an experimental
stage, wet c i~pos i t ions may be determined r e l a t i v e l y easy by multiplying
pol lu tant concentrations i n p rec ip i t a t ion and the amount of precipita-
t i on f a l l e n a t the same time. The outcome provides a p rac t i ca l approxi-
mation to the quant i ta t ive descr ip t ion of wet deposit ion fluxes
[ Whelpdale, 1982a, McMahon and Denison, 19791 .

2 THE NATIONAL RAINWATER COMPOSITION MEASUREMENT NETWORK
The ac id i f i ca t ion of lakes i n Sweden i n the beginning of the f i f t i e s
led to rainwater monitoring networks throughout Europe. In
the Netherlands several networks were ins ta l led . Since January 1983
there is one National Rainwater Composition Measurement Network. It is
co-operated by the Royal Netherlands Meteorological I n s t i t u t e (KNMI)
and the National I n s t i t u t e of Public Health and Environmental Hygiene
(RIVM) .
The objective of the National Rainwater Composition Measurement Network
is t o monitor the chemical composition of rainwater i n the Netherlands,
i .e. ,
1 ) t o determine the s p a t i a l d i s t r i b u t i o n (over the Dutch geographical
area) ,
2) t o detect temporal trends (of the annual means over the Netherlands)
and
3) t o ver i fy a i r pol lu t ion models with respect t o wet removal.
To t h i s extent large-scale, background concentrations and depositions
a re measured every month a t 21 ' r u r a l ' sampling s t a t i o n s dis t r ibuted
over the Netherlands.
ad 1 ) .
Very recently s t a t i s t i c a l optimization techniques have been applied by
Van Egmond e t al. [l9851 i n order t o assess the re la t ionship between
the density of the Network (number of sampling s t a t ions ) and the accu-
racy of the measurements of concentrations and deposit ions of inorganic
components. A s a r e s u l t a network of 12 s t a t i o n s evenly dis t r ibuted
over the country instead of 21 would be su f f i c i en t t o describe the
s p a t i a l d i s t r ibu t ion accurately.
The re la t ive in terpola t ion e r ro r s a t a point i n between four s t a t i o n s
f o r SO4, NO3 and NH4 would be 17%, 14% and 20% respect ively f o r monthly
concentrations. For deposit ions the e r ro r s are somewhat less. The
e r r o r s for Na, K, Ca, Mg, Zn, F and C1 would be r e l a t i v e l y large (about
30%).

The standard e r ro r i n estimating the a rea l average concentration (and
deposit ion) over t h e Netherlands would be 52, 5% and 10% for monthly
values of SO4, NO3 and NHq, and 2%, 2% and 6% f o r the respective annual
values.
It may go without saying that such a reduction w i l l minimize the
personnel endeavours with respect to sampling and analysis. For t h i s
reason, the reduction of the Network w i l l be carr ied out soon. By then,
the information gained by the loca l rainwater measurement networks w i l l
become even more important. A t present loca l networks are opcrntea by
the provinces of Limburg, Noord-Holland and Drenthe , arounu L I ~ L Lcrclau
(Rijnmond area) and De l f t (one s t a t ion) : the province of Zeeland ceased
monitoring i n 1983 [KNMI and RIVL,, lrb51.
ad 2).
The s t a t i s t i c a l ae tect ion of temporal trends has been investigated i n
general by Buishand 119841, who reveals the following important points:
- The number of observations. A t e s t on annual means over a r e l a t i v e l y
short period is not recommended because then one has too few degrees
of freedom. On the other hanu no gain i n power can be expected by a
higher sampling frequency than one sample per month since e a s u r e -
ments r e fe r t o average concentrations over an interval..
- Variance reduction by using p rec ip i t a t ion amounts (o r other meteoro-
logical information) as an explanatory variable. For most components
there is a negative corre la t ion between concentration and amount of
precipi ta t ion (high concentrations when there is l i t t l e rain). The
s c a t t e r of the concentrations decreases with increasrng precipi ta t ion
amount. Depositions a re posi t ively corre la ted with p rec ip i t a t ion
amount.
- Variance reduction by using a r e a l averages of a number of s t a t ions .
This works e f fec t ive ly fo r components which have l i t t l e spa t i a l
corre la t ion.
From a number of published se r i e s of measurements Buishand 119851 made
fu r the r estimates of the magnitude of trends which can be detected i n
sequences of about 5 years (1978-1982).
Table 1 summarizes some of his r e s u l t s .

Table 1
s i n g l e s t a t i o n s yearly averages
component Van Egmond Van Egmond
Belative systematic change ( i n % per year) which can be detected
with a probabil i ty of 80% i n a s e r i e s of monthly measurements of
concentrations over 5 years (two-sided t e s t , s ignif icance l eve l
a = 0.05). The changes were calculated for every s ing le s t a t i o n and
subsequently averaged. The l a s t column r e f e r s to changes calculated
from monthly concentrations averaged over a l l s t a t ions . Adapted from
Buishand [1985], data from Van Egmond e t a l . [1985].
The table indicates that the ' de tec tab i l i ty ' d i f f e r s per component.
The columns 'Van Egmond' a re based on measurements a t 12 s t a t ions of
the National Network. lhey indicate t h a t ca lcula t ing the changes from
monthly average concentrations (over 12 s t a t ions ) instead of measure-
ments a t s ingle s t a t ions , noticeably improves the de tec tab i l i ty .
With r e s t r i c t i o n t o the components studied, t h i s holds especia l ly with
respect to H30 and F (cf . 3rd general point above). In the l a t t e r case,
t h e Netherlands can be considered a s one measurement f i e l d equipped
with 12 samplers. For t h i s reason the Network's 2nd objective r e l a t e s
t o trends of yearly averages over the whole country. It should be noted
t h a t table 1 r e f e r s s t r i c t l y speaking to concentrations.
In a l l , for the components given i n t a b l e 1, a temporal trend of about
10% per year can be detected with 80% probabi l i ty by means of a simple
regression model applied t o 5 years of measurements of a 12 s t a t i o n s

network. When 10 years of data would be avai lable , the de tec tab i l i ty of
trends would be 3 times improved. The rough estimates may be improved
by incorporation of seasonal va r i a t ion and meteorological information
(see atovrj i n to the regression model. In some cases a non-linear,
V.:;., exponrntlai regression model might tie more jus t i f i ed . In a l l it
can be concluded t h a t the detect ion of ac tual trends i n the chemical
c o ~ ~ ~ r i o s ~ t i o n of rainwater is s t i l l hampered by the shortage of the time
s e r i e s avai lable (5 years). Nonetheless, fu r the r s tudies on trend
detect ion are i n progress.
ad 3).
I n order to be t t e r ver i fy the mathematical air pol lu t ion models run by
the KNMI and RIVM together with other i n s t i t u t e s , t h e 1 2 rainwater
sampling s t a t ions remaining a f t e r optimization w i l l be integrated i f
possible with other national environmental monitoring networks for a i r ,
s o i l and groundwater.
The in tegrat ion should then contr ibute to mare accurate and r e l i a b l e
source-receptor re la t ionships .
Final ly , concentrations and deposit ions a re measured a t 21 ' ru ra l '
sampling s ta t ions . This means t h a t loca l emission sources a re avoided
i f possible, so tha t the s t a t i o n becomes representative of a larger
area. Each sampling s t a t i o n of t h e Network is equipped with an open
rainwater. co l l ec to r f o r the sampling oi inorganic main components.
Another col lec tor is fo r t race elements, where a s l i g h t amount of
perchloric acid is added to preserve the sample i n the f i e l d .
Figure 2 Open rainwater co l l ec to r used i n the National Rainwater
Composition Measurement Network

The open rainwater co l l ec to r ( f ig . 2) consis ts of a vulcathene funnel
( o r i f i c e 400 cm2) mounted on a 5 1 sample container of opaque poly-
ethylene. Ihe sample container is protected from daylight to avoid the
r i s k of loss of NH4 and a proportional increase of H30 ions, a s well a s
changes i n the K contents while the sample is standing i n the f i e l d
[Ridder, 1984 and Ridder e t a l . , 19841. A 450 um s ieve prevents insec t s
from entering the container, and nylon wires around the funnel serve to
sca r i fy birds. The col lec t ing o r i f i c e is a t 1.50 m above s t a t i o n
level . A t every s t a t i o n a standard KNMI r a i n gauge a t 0.40 m height
records the amount of f a l l e n p rec ip i t a t ion ( ra in , snow and h a i l ) .
The methods of analys is of main components a re summarized i n the
Network's annual report on 1982 [KNMI and RIVM, 19831, whilst those f o r
t r ace elements a re referred to i n the annual report on 1983 [KNMI and
RIVM, 19851.
The use of permanently open funnels is generally accepted for the
sampling of f a l l i n g precipi ta t ion, i .e . , r a in , h a i l and snow, though
the l a t t e r a re collected insuff ic ie i l t ly and less . However, an unknown
amount of dry deposit ion is col lec ted a t the same time, due to dry
removal of gases and aerosol pa r t i c l e s .
The dry contribution depends on the loca l s i t u a t i o n and may lead to an
overestimate of the wet and an underestimate of the t o t a l (wet + dry)
deposition.
The contribution of dry removal is limited by the use of 'wet-only'
co l l ec to r s , where the funnel is closed by a l i d during dry periods.
Upon the onset of an precipi ta t ion event, the l i d is automatically
turned away. Comparative s tudies using open and wet-only col lec tors
indicate tha t the dry contribution may account f o r 10-40% of the 'bulk'
deposit ion of main components determined by open col lec tors [Ridder
e t a l . , 19841. I n 'clean areas ' the differences a re r e l a t ive ly small,
e.g. 25% f o r S04, NO3 and NH4 [Ridaer and Frantzen, 1982, Ridder,
19841. The measurements by means of permanently open col lec tors should
bes t be regarded as approximations of wet concentrations and deposi-
t ions. This holds i n par t icular f o r the ' ru ra l ' s t a t i o n s of the
National Network.

Table 2
component median lowest highest
conductivity
Na
K
Ca
Mg
C 1
so4 SO4 correct
NHq
NO3
p04
H30
pH
pot. acid
Zn
F
31.3 (ms-m-l)
9 6
2.1
4.2
10.7
111
12
11.5
32
13
0.95
12
7.37 (uni ts )
65.8
0.14
1.03
Wet depositions of main components (mm~l.m-~.month-~) i n 1983 deter-
mined by the National Rainwater Composition Measurement Network
[KNMI and RIVM, 19851. Median depositions a r e r e l a t ed to the mean
monthly deposit ions calculated f o r every s ing le s t a t ion .

3 RESULTS OF THE NATIONAL RAINWATER COMPOSITION MEASUREMENT NETWORK
I n the context of t h i s 42th CHO-TNO technical meeting, the wet deposi-
t ions of a i r pollutants determined by the National Rainwater Composi-
t i o n Measurement Network can be considered as basic influxes of these
substances in to the urban sewerage system. Surface run-off and otner
discharges in to the sewers should subsequently be added to the basic
influxes in order t o calcula te the complete loading of the system, a s
w i l l be outlined i n the following papers. For t h i s reason the chemical
composition of rainwater w i l l be presented here mainly a s deposit ions.
On the other hand, it should be pointed out that concentrations may be
re la ted more d i r e c t l y t o ce r ta in e f fec t s of rainwater, e.g. on vegeta-
t ion , o r to the corrosion of materials.
3.1 Main components
Table 2 summarizes the wet depositions of main components i n
the Netherlands i n 1983. The table presents annual wa ians ot the monthly depositions, i.e. the
medians of the mean monthly depositions calculated for every s ingle
s t a t i o n i n 1983 [KNMI and RIVM, 19851.
Such a way of presentation eliminates the influence of extreme (high
and low) r e s u l t s as can be seen from the 2nd and 3rd column. The varia-
t i o n between lowest and highest deposit ions ( a t some s t a t i o n and f o r
some month) i s ra ther large, both i n space and t i m e . Factors ranging
f r o m 10 t o 100 a re not uncommon. (The database was previously purged of
outlying resu l t s caused by bird droppings, obvious procedural errors ,
e tc . ) .
For the benefit of a discussion, which is largely based on the annual
report on 1983 [KNMI and RIVM, 19851, the main components have been
arranged to four topics of in te res t . The topics are: the influence of
the sea, eutrophication, ac id i f i ca t ion ( 'acid ra in ' ) and industr ia l
a c t i v i t i e s .

The annual median depositions of Na, Mg and C 1 a r e almost en t i r e ly
brought about by wet removal of seasa l t aerosol. The deposit ions
s t rongly decrease with distance from the coast . Figure 3 i l l u s t r a t e s
the typical s p a t i a l d i s t r ibu t ion and shows the i so l ines of conductivity
t h a t is mainly determined by the NaCl content. The K and Ca depositions
or ig inate from sea-spray to a l e s s e r extent. The d i s t r ibu t ions of K and
Ca would show addi t ional enhanced depositions i n the south-east of the
country. The l a t t e r may be due t o the col lec t ion of loca l ly flown-up
marldust . A minor part of the SO4-depositions ( f ig . 4 ) or ig inates from
sea-spray, preponderantly i n winter-time. A correct ion based on the
Na-content nhich is t o t a l l y seaborn leads to corrected SOq-depositions
( f ig . 5). The corrected SO,+-distribution, e.g.. i n the south-east of the
Netherlands, corresponds t o i n d u s t r i a l SOL-emissions.
Figure 3 Spat ia l d i s t r i - Figure 4 Spa t i a l d i s t r i - Figure 5 Spa t i a l d i s t r i -
bution of conductivity bution of SO deposit ions bution of SO -depositions - 1 -2 4- 4
(mS.m ) i n 1983 (nnnol .m .month-') i n 1983 corrected f o r sea-spray -2
(mmo1.m .month-') i n 1933
The eutrophying substances NH4, NO3 and PO4 show d i f fe ren t s p a t i a l
d is t r ibut ions .

NHq-depositions ( f i g . 6 ) increase landinward and reach high values i n
regions where in t ens ive catt lebreedinr: takes place and NH3 is emitted
due to excessive dumping of na tura l I e r t i l i z e r (manure) [hi jsman
et a l . , 19851. Nog-depositions a r e r e l a t i v e l y uniformly d i s t r ibu ted a s
they o r ig ina t e p r inc ipa l ly from NO,-emissions by automobile road
t r a f f i c and space heat ing ( f i g . 7 ) . The s p a t i a l d i s t r i b u t i o n of
POq-depositions shows increased values around loca l i s ed indus t r i e s
( f i g . 8) .
Figure 6 Spa t i a l d i s t r i - Figure 7 Spa t i a l d i s t r i - Figure 8 Spa t i a l d i s t r i -
but ion of NH -deposit ions bution of NO -deposit ions but ion of PO -depositions -2 - 1 - 2 -1 -2
4 (mmo1.m .month * ) i n 1983 (mmo1.m .month ) i n 1983 (mmo1.m .month-')in 1983
The term 'acid r a i n ' r e l a t e s t o ac id and ac id i fy ing substances. The
f r e e acid content (base neu t r a l i z ing capacity) is mainly due t o the
presence of s t rong ac ids l i k e H2S04 and HNO3. The deposi t ions of f r e e
ac id (H30, f ig . 9) decrease up-country, and the pH-values increase
accordingly ( f ig . 10). This phenomenon may be explained by neu t r a l i z ing
NH3-emissions the re (see above). Upon deposit ion, however, b a c t e r i a l
oxidation of NH4 may contr ibute t o the a c i d i f i c a t i o n of surface water
and s o i l . Complete n i t r i f i c a t i o n of 1 m01 NHq l eads t o 2 m01 H30. Thus
the t o t a l po ten t i a l ac id deposi t ion reaches r e l a t i v e l y high values
up-country ( f i g . 11).

Figure 9 S p a t i a l d i s t r i - F igure 10 S p a t i a l d i s t r i - Figure 11 S p a t i a l d i s t r i -
bu t ion of H 0-deposi t ions bu t ion of pH (un i t s ) i n but ion of p o t e n t i a l a c id -2 3
(mmo1.m .month-')in 1983 1983 depos i t ions (-01 .m -2 .month-]
i n 1983
The spa t i a l d i s t r ibu t ions of Zn and F would reveal localised indus t r i a l
emissions, e.g., i n the IJmond area near Amsterdam.
3.2 Trace elements
Apart from main components, a comprehensive s e r i e s of t race elements
a r e measured by the National Rainwater Composition Measurement Network
since 1983. The se r i es includes Cd, Cu, Fe, Mn, N i , Pb and V, a s well
a s Al, Ba and Sr on an experimental basis. A t the centra l s t a t i o n of
the Network, De B i l t , As , C r , CO and Se(1V) a re measured i n addition.
Hg is not measured anymore because the sampling techniques a re inade-
quate [DU~I and LIVh, 19831 .
Table 3 summarizes the depositions of the former se r i es of t race ele-
ments, basril on tne annual report on 1983 KNMI and RIVM, 1985 . Again
annual meaian aepositions a r e presented, and the lowest and highest
values indicated. The var ia t ion is i n the order of 50 t o 500. It should
be noted tha t the detection of t race elements sometimes approximates
the analyt ical l i m i t s . In such cases, notably Cd, inaccuracies may be
large. 36

Table 3
t r ace element median lowest highest
Wet depositions of some t race elements (urn1 .m-2 .month-') i n 1983
determined by t h e National Rainwater Composition Measurement Network
[KNMI and RIVM, 19851. Median depositions a r e re la ted to the mean
monthly deposit ions calculated fo r every s ingle s t a t ion .
The spa t i a l d i s t r ibu t ions of the metal depositions mostly point to
indus t r i a l sources, e.g., i n t h e IJmond area near Amsterdam f o r Cu, Fe
and Mn (f igs . 12, 13 and 14), as is the case with Zn and F above.
The deposit ion pat terns of N i and V indicate high values near Rotterdam
t h a t can poasibly be a t t r ibu ted t o petrochemical indust r ies i n the
Botlek area ( f ig . 15). The i s o l i n e pat tern of Pb-depositions is an
exception to the above and shows a ra ther uniform d i s t r ibu t ion over
the Netherlands ( f ig . 16). The high deposit ions i n the w e s t and the
lower depositions i n the north-east nay be explained by the more o r
l e s s intensive automobile road t r a f f i c i n these par ts of the country.

Figure 12 Spatial distri- Figure 13 Spatial distri- Figure 14 Spatial distri-
bution of Cu-depositions bution of Fe-depositions bution of Mn-depositions -2 - 1 -2 - 1 (umo1.m .month )in 1983 (umo1.m .month-')in 1983 (pmol.m-2.month )in 1983
Figure 15 Spatial distri- Figure 16 Soatial distri-
bution of V-depositions bution of Pb-depositions -2
(umo1.m .month-')in 1983 (umo1.m -2 .month-')in 1983

3.3 Organic substances
Organic substances a r e preliminary measured a t 3 s t a t i o n s of the
Network, including polynuclear aromatic hydrocarbons (PAHs), polychoro-
biphenyls (PCBs) and organochlorinated restici:,.-S. Sampling takes place
i n open glass rainwater co l l ec to r s ( o r i f i c e 6: $2 cm2). The sampling of
v o l a t i l e compounds is being developed -[KlWI G,,.. n l k r . . 15851.
Sampling and analys is of PP& were o r ig ina l ly carried out i n the frame-
work of the b:it ionr.1 Loal hescarcn Program ,NOK-LUK) and has been
reported *f Van i!c,ort a c t CO-.**or;ters [1984, 19851and Den Hollander,
[I;cd]. ~.~ontilly concentrations ot individual PAHs i n 1983 were i n the
order of 10 t o 500 ng.l-l, h i l s t phenantrene and fluoranthene showed
the highest values [KNMI and RIVM, 19851.
PCBs have been investigated since 1979 using another type of g lass
col lec tor a t De B i l t . Table 4 summarizes the r e s u l t s of hexachloro-
cyclohexane (HCH) and PCBs i n 1983 [KNMI and RIVM, 19851. y-HCH is the
ag r i cu l tu ra l pes t ic ide lindane, whi ls t the a-isomer is s n impurity i n
the commercial product. The sum of PZBs was calculated by adding the
amounts of 20 individual PCBs. Annual median deposit ions a re presented
a s well as the range, but they a r e re la ted to the monthly measurements
of De B i l t only, and the unity is ug.m'2 .month-'
Table 4
component median lowest highest
C 20 PCBs 0.42 0.08
Wet depositions of some organic substances (pg-m-2.month-l) i n 1983
determined by t h e National Rainwater Composition Measurement Network
[ W 1 and RIVM,1985]. Median deposit ions a r e re la ted t o the monthly
depositions a t De B i l t .

Results from an e a r l i e r invest igat ion by Hofstee e t a l . [1984], cove-
r ing the years 1972 t o 1982, revealed t h a t from 1975 organochlorinated
pes t ic ides other than a- and Y-HCH could not be demonstrated anymore i n
rainwater. Zhese pesticides include hexachlorobenzene,B-HCH, a l d r i n ,
d ie ldr in , endrin and te lodr in , heptachlor and its epoxide, DDT, DDD and
DDE .
3.4 Natural isotopes
The geographical d i s t r ibu t ions of tbe isotopic r a t i o s 2 ~ / 1 ~ , 180/160
and radioactive t r i t ium ( 3 ~ ) a re expected to co r re la t e with meteoro-
log ica l conditions during precipi ta t ion. For t h i s reason rainwater from
a l l s t a t ions has been analysed by t h e Isotope Physics Laboratory a t
Groningen since 1980. Zhe r e s u l t s of the invest igat ion w i l l be reported
i n due time, a f t e r s u f f i c i e n t data w i l l have become available. Mean-
while the data a re avai lable fo r hydrological s tudies and they have
been reported annually [KNMI and RIVM, 19851.
4 DISCUSSION AND CONCLUSIONS
In t h i s sect ion the chemical composition of rainwater w i l l be evaluated
and some qua l i t a t ive conclusions drawn. To t h i s extent table 5 , 2nd
column summarizes the annual median ~opcenLrat_Io~s ( i n contras t t o t h e
depositions above) i n Dutch rainwater during 1983 [KNMI and RIVM,
19851. The 1st column lists volume-weighted average concentrations of
main components measured a t a remote s t a t i o n i n Alaska about 10 years
ago [Galloway e t a l . , 1982al. For P04 only a H2P04 value from Venezuela
was available [ibidem]. The concentrations of t r ace elements a r e the
median values compiled by Galloway e t a l . [1982b] of several d i f f e ren t
investigations i n the Antarctic and Arct ic . A t the remote s t a t ions most
of the precipi ta t ion was i n the form of snow. The 3rd column of t a b l e 5
represents the Dutch standard f o r surface water qua l i ty taken from the
Water Action Programme 1980-1984, i.e., the so-called basic qua l i ty f o r
surf ace water [ R i jkswaterstaat , n.d.1.

Table 5
rainwater
component remote Netherlands basic qua l i ty surf ace water
PH 4.96 4.68 6.5 - 9 (uni ts )
so4 3.6 64 1000
S04 correct 3.6 56 - NI14 1.1 101 7 0 NO3 1.9 48 700
Po4 0.6* 0.5 6
Concentrations of some main components (volume-weighted averages,
n rm~l . l -~ ) and t r ace elements (medians, pmol.1-l) i n precipi ta t ion i n
remote areas of the world [Galloway e t al. , 1982a, b] and i n
the Netherlands (annual medians from tab les 2 and 3). The l a s t
column denotes the Dutch standard f o r surface water
[Rijkswaterstaat, n.d. 1.
From table 5 it appears tha t the pH of Dutch rainwater is about t h a t i n
remote areas. The s l i g h t d i f ference is due to neu t ra l i za t ion by NH3
emissions as discussed above. The concentrations of SO4-corrected,
and NO3 higher than i n remote areas. Amazingly the concentration of PO4
i n Dutch rainwater is about t h a t i n remote areas. No explanation could
be found fo r t h i s phenomenon. It is a l s o evident t h a t rainwater i n
the Netherlands contains considerable amounts of t r ace elements. The
l a t t e r amounts may be overestimated because open co l l ec to r s were used.

Table 6
component r a i n Rhine
SO4 185.10~ 6 . 1 0 ~
S04 correct 175.10~ -
NH4 60 .10~ 60. 103
NO3 90. 103 1400 .103
P04 2.103 130. 103
Loading ( i n tons per year) of the Netherlands with pol lu tants v ia
r a i n (depositions from tab les 2 and 3) and the r i v e r Rhine (annual
mean loads a t Lobith [RIzA, n.d.1) i n 1983.

With respect t o the 2nd and 3rd columns, Dutch rainwater versus Dutch
surface water, it can be noted t h a t the concentrations i n rainwater a r e
generally less . The N& content is, however, an exception t h a t may be
explained by the f a c t tha t n i t r i f y i n g bacteriae cannot be present i n
r a in , but i n surface water they may reduce the NH4 content conside-
rably. In a l l it may be concluded tha t rainwater is cleaner ' than
surface water ( the standard), but the concentrations a r e not to be
neglected. The NHq concentrations a r e remarkably.
h uore tenta t ive way of reaching qua l i t a t ive conclusions has been
followed by tabula t ing the loading of the Netherlands geographical area
with pollutants v ia r a i n (wet deposit ions) and v ia the r i v e r Rhine
(loads) ( t ab le 6). After the r i v e r Rhine, r a in is the biggest water
supply of the Netherlands. Ihe flow of the hhine is about 70.109 m3 per
year and the annual amount of r a i n is about 750 mm, i . e . 30.10~ m3. I n
s p i t e of the enormous upgrading t h a t leads to inaccuracies i n the
values (very low concentrations i n the Ehine multiplied by enormous
flows; low deposit ions times a large area of 4 . 1 0 ~ ~ m2) both deposi-
t ions and loads of main components and t race elements a r e of the same
order of magnitude.
Thus the following general conclusion may be drawn, t h a t wet deposi-
t ions of a i r pol lu tants must be taken in to account with balance
s tudies . Ihe general conclusion should perhaps a l so be borne i n mind
whenever influxes i n t o urban sewerage systems a r e calculated.
AKNOWLEDGEMENT
The authors wish t o thank T.A. Buishand (Royal Netherlands Meteorolo-
g i c a l I n s t i t u t e ) f o r h i s s t a t i s t i c a l contribution.

REFERENCES
T.A. BUISHAND, 1984. D e t e c t i e van t r e n d s i n d e chemische s a m e n s t e l l i n g
van de n e e r s l a g . ( D e t e c t i o n o f t r e n d s i n t h e chemical composi t ion
o f p r e c i p i t a t i o n , i n Dutch-) Royal Nether lands Meteoro log ica l
I n s t i t u t e , De B i l t , memorandum FM-84-42.
T.A. BUISHAND, 1985. Ruwe s c h a t t i n g van d e g r o o t t e van t e d e t e c t e r e n
t r e n d s i n d e chemische s a m e n s t e l l i n g van d e n e e r s l a g door middel
van r e g r e s s i e - a n a l y s e . (Rough e s t i m a t e o f t h e magnitude o f t r e n d s
t h a t can be d e t e c t e d i n t h e chemical compos i t ion o f p r e c i p i t a t i o n
by means o f r e g r e s s i o n a n a l y s i s , i n Dutch.) Royal Nether lands
Meteoro log ica l I n s t i t u t e , De B i l t , memorandum FM-85-7.
E. BUIJSMAN, H. MAAS and W . ASMAN, 1985. Een g e d e t a i l l e e r d e ammoniak-
e m i s s i e k a a r t van Nederland. (A d e t a i l e d map o f ammonia emiss ions i n
t h e Nether lands , i n Dutch wi th Engl ish summary.) Government
P r i n t i n g O f f i c e , The Hague, P u b l i k a t i e r e e k s Lucht 41.
N.D. VAN EGMOND, H. KESSEBOOM and D. ONDERDELINDEN, 1985. S t a t i s t i s c h e
o p t i m a l i s a t i e Lande l i jk Meetnet Regenwatersamenstelling. ( S t a t i s -
t i c a l o p t i m i z a t i o n o f t h e Natj o n a l Rainwater Composition Measurement
Network, i n Dutch.) Nat ional I n s t i t u t e o f P u b l i c Heal th and
Environmental Hygiene, De B i l t , r e p o r t i n p rep .
J . N . GALLOWAY, G.E. LIKENS, W.D. KEENE and J.M. MILLER, 1982a. The
composi t ion o f p r e c i p i t a t i o n i n remote a r e a s o f t h e world. J o u r n a l
o f geophys ica l r e s e a r c h , 87 , 11, p. 8771-8786.
J . N . GALLOWAY, J.D. THORNTON, S.A. NORTON, H.L. VOLCHOK and
R . A . N . McLEAN, 198213. Trace m e t a l s i n a tmospher ic d e p o s i t i o n : a
review and assessment . Atmospheric Environment 16, 7 , p. 1677-1700.
A.W.M. HOFSTEE, R.C.C. WEGMAN, T.B. RIDDER and H.F.R. REIJNDERS, 1984.
Organische m i c r o v e r o n t r e i n i g i n g e n i n n a t t e d e p o s i t i e . (Organic
m i c r o p a l l u t a n t s i n wet d e p o s i t i o n , i n Dutch.) Na t iona l I n s t i t u t e
of Pub l ic Hea l th and Environmental Hygiene, B i l thoven , r e p o r t no.
21781007.
H. DEN HOLLANDER, D. VAN DE MEENT, P.C.M. VAN NOORT and E. WONDERGEM,
1985. Wet d e p o s i t i o n of p o l y c y c l i c a romat ic hydrocarbons i n t h e
Nether lands. Nat ional I n s t i t u t e of P u b l i c Hea l th and Environmental
Hygiene, B i l thoven , p u b l i c a t i o n i n prep.
KMMI and RIVM, 1983. Chemical composi t ion of p r e c i p i t a t i o n over t h e

Netherlands, Annual r e p o r t 1982. Royal Nether lands Meteoro log ica l
I n s t i t u t e , Lk B i l t and Nat ional I n s t i t u t e o f P u b l i c Hea l th and
Environmental Hygiene, B i l thoven , number o f p u b l i c a t i o n K N M I 156-5.
K N M I and R I V M , 1985. Chemical composi t ion o f p r e c i p i t a t i o n over t h e
Nether lands, Annual r e p o r t 1983. Royal Nether lands Meteoro log ica l
I n s t i t u t e , Lk B i l t and Nat iona l I n s t i t u t e o f P u b l i c Hea l th and
Environmental Hygiene, B i l thoven , number o f p u b l i c a t i o n KNMI 156-6.
T.A. McMAHON and P.J. DENISON, 1979. Empir ical a tmospher ic d e p o s i t i o n
parameters , a su rvey . Atmospheric Environment 13, p. 571-585.
D. VAN DE MEENT, J . V A N OOSTERWIJK and T. ALDENBERG, 1984. RID-VEWIN
Meetnet Regenwater 1978-1982, d e e l 1 , Samenvat t ing en s t a t i s t i s c h e
bewerking van d e m e e t r e s u l t a t e n , d e e l l a , D e meetgegevens (RID-
VEWIN Rainwater Measurement Network 1978-1982, p a r t 1 , Summary and
s t a t i s t i c a l e v a l u a t i o n of t h e measurement r e s u l t s , p a r t l a , The
measurement d a t a , i n Dutch, Engl i sh t r a n s l a t i o n a v a i l a b l e ) .
Nat ional I n s t i t u t e o f Pub l ic Hea l th and Environmental Hygiene,
B i l thoven , r e p o r t no. ECOWAD-84-01 . P.C.M. VAN NOORT and E. DE GREEF, 1984. The e f f e c t s o f in-cloud scaven-
g i n g on t h e c o n c e n t r a t i o n p r o f i l e o f o r g a n i c compounds i n r a i n ,
vo l . 1, p o l y c y c l i c a romat ic hydrocarbons. Nat ional I n s t i t u t e o f
P u b l i c Heal th and Environmental Hygiene, B i l t h o v e n , r e p o r t no. 84-4.
P.C.M. VAN NOORT and E. WONDERGEM, 1985. Scavenging o f a i r b o r n e poly-
c y c l i c a romat ic hydrocarbons by r a i n . Accepted f o r p u b l i c a t i o n i n
Environmental Sc ience and Technology.
T.B. RIDDER and A.J. FRANTZEN, 1982. Acid p r e c i p i t a t i o n over t h e
Nether lands. Proceedings CEC-workshop, c o n c e r t e d a c t i o n physico-
chemical behaviour o f a tmospher ic p o l l u t a n t s , B e r l i n , 9 September
1982, Re ide l , Dordrecht , p. 123-129.
T.B. RIDDER, J . H . BAARD and T.A. BUISHAND, 1984. De inv loed van monster-
methoden en ana lyse techn ieken op gemeten chemische c o n c e n t r a t i e s i n
regenwater . (The i n f l u e n c e of sampling and a n a l y s i s t e c h n i q u e s on
measured chemical c o n c e n t r a t i o n s i n r a i n w a t e r , i n Dutch.) Royal
Nether lands Meteoro log ica l I n s t i t u t e , De B i l t , t e c h n i c a l r e p o r t
TR-55.
T.B. RIDDER, 1984. V i j f j a a r met ingen van d e s a m e n s t e l l i n g van d e neer -
s l a g . (Five y e a r s o f measurements o f t h e chemical composi t ion o f
p r e c i p i t a t i o n . ) Proceedings symposium of a c i d r a i n , 'S-Hertogen-

bosch, 17 and 18 November 1983, Pudoc, Wageningen, p. 55-58.
RIJKSWATERSTAAT, n .d. I n d i c a t i e f Meer jarenprogramma Water 1980-1 984,
Water Action Program 1980-1 984, i n Dutch, Engl i sh summary a v a i l a -
b l e ) , Clovernment P r i n t i n g Off i c e , The Hague.
R I Z A (NATIONAL INSTITUTE OF WASTE WATER PURIFICATION), n.d.
Kwal i t e i t sonderzoek i n d e Rijkswateren, v e r s l a g e n van d e r e s u l t a t e n
van h e t l e , 2 e , 3e en 4e kwar taa l 1983. ( Q u a r t e r l y r e p o r t s 1983 on
t h e q u a l i t y of Dutch s u r f a c e w a t e r ) , Government P r i n t i n g O f f i c e ,
The Hague.
D.M. WHELPDALE, 1982a. Removal p r o c e s s e s , i n : H . Rohde, A. E l i a s s e n ,
I. I saksen , F.B. Smith and D.M. Whelpdale, Tropospheric chemis t ry
and a i r p o l l u t i o n . World Meteoro log ica l Organ iza t ion , Geneva,
t e c h n i c a l n o t e no. 176, Ch. 4 .
D.M. WHELPDALE, 1982b. Wet and d r y d e p o s i t i o n , i n : H.W. Georgi i and
W. Jaeschke ( e d s . ) , Chemistry o f t h e u n p o l l u t e d and p o l l u t e d
t roposphere . Re ide l , Dordrecht , p. 375-391 .

FROM RAINFALL TO SEWER INFLOW; A PROCESS WITH CONSEQUENCES
F . H . M . van de Ven
ABSTRACT
The conversion from rainfall to inflow is a process that can be
separated in two parts: the runoff losses and the transformation of
net rainfall to sewer inflow. The runoff losses can be separated in 4
parts. First the initial losses as the wetting loss and the loss due
to the filling of the depression storage. Secondly we have the
evaporation loss. When the pavement or roof is hot, the evaporation
is governed by the heat fluxout of the underground, but normally this
is not the case. The infiltration in semi-pervious pavement is the
third and largest loss; the infiltration-rates are high. The fou~th
loss is the runoff from paved to unpaved areas. The runoff coefficient
expresses the sum of all losses. The behaviour of this coefficient is
discussed.
The rainfall is smoothed and delayed by the runoff process before it
enters the sewer system. This transformation is quantified by the unit
hydrograph.
The consequences of these processes for the groundwater recharge, the
water balance, the design discharge for sewers, the amount of over-
flowing water and for the storm profile are shown. Sewer inflow instead
rainfall should be used as a basis for sewer design. The construction
of a design inflow storm is discussed.

1 INTRODUCTION
The sewer-system is meant to drain the ,:moff f-om the surface of an
urban area. The design standards for siic:, sever systems are normally
based on rainfall data. However, between rile falling of rain and the
inflow in the sewer system, the so-called rainfall-runoff process
converts the rainfall to sewer inflow. Now the question is: Is the con-
version so rigo~ous that one should take it into account for the design
of sewer systems? To answer that question we have to understand what
goes on during the process.
In order to understand what subprocesses are involved, the pathways of
the water in an urban environment with a separate sewer sys;en are
shown in figure 1. Paths of minor importance are not indicated.
atmosphere
storm sewer
I receiving water in rural area
Figure 1 Pathways of the S-iorm 11rtiLer in an urban ai-ea
Part of the precipitation falls on paved and covered surfaces and part

on unpaved surfaces. Most of the paved surfaces drain to the sewer
system. Runoff from the unpaved area is not expected due to the generally
high permeability of the topsoil. In extreme situatFons some runoff from
the uncovered surfaces can occur,though. Paved o? covered sue-faces t!;nt
drain to unpaved areas are taken into account as 'unpaved' because they
do not contribute runoff to the sevier system.
During the time that the paved surface is wet evaporation occurs. The
evaporation flux is strongly influenced by the temperature of the
pavement and the vapour transport in the air.
In case the runoff wzter flows over a brick or tile covered surface,
water will infiltrate through the joints and/or cracks into the subsoil.
New asphalt is fully impervious however (except porous asphalt). The
water that is stored on the surface,infiltrates and evaporates even
after the end of a aunoff event. The consequences of the infiltration ,
are groundwater recha~ge, a raise of the groundwater level, the need
for groundwater control measures and a reduced surface runoff.
The runoff enters the sewer system by the gully pots. In case of
a separate sewer system, the sewer-pipes convey the water to the
receiving surface water. When a combined sewer system is applied, the
water in principle is led to the treatment plant. In order to prevent
an exceedance of the capacity of that plant, spillways or "overflow
structures" are installed. By these structures the excess water can be
discharged.
On its way through the sewer system the flow is retained a little by
the hydraulic resistance of the pipes and the manholes and by the
storage available in the pipelines.
2 THE RAINFALL-RUNOFF PROCESS
2.1 A storm event as example
Now that we know the possible flowpaths of the water, let us look at
the results of a measurement. In figure 2 the hyetograph and the inflow
hydrograph are shown of an event that occured on July 22nd. 1973. The

event was of short duration but the precipitation intensity was high:
Within 10 minutes 5.9 mm of rainfall was recorded. The indicated inflow
is recorded in a housing area in Lelystad. In annex 1 a short description
of the basin and the inflow measurements is given.
1,4
1,3 m storm sewer inflow
1.2
1 .l
1 ,o
03
0,8
0,7
0,6
0.2
0,l
0 0 10 20 30 40 50 60
Figure 2 Hyetograph and inflow-hydrograph of an event in July 22nd, 1973
recorderd in a housing area in Lelystad,
By comparing the hyetograph with the inflow hydrograph some st~iking
differences are observed:
- The inflow starts 2 - 3 minutes later than the precipitation; - The amount of inflow is smaller than the amount of precipitation. Only 69% (4.1 mm) of the rainfall reaches the gullypots;
- The maximum inflow is much smaller than the maximum rainfall intensi-tv.

Taking the data on aone minute time-base, the peak inflow is about
56% smaller than the maximum precipitation;
- The maximum inflow occurs 1 - 2 minutes later than the maximum precipitation;
- A measurable inflow is recorded until 40 - 50 minutes after the
rainfall occured.
Although this is not so clear from figure 2, the inflow-hydrograph
is much smoother than the hyetograph. The precipitation intensity is
extremely variable when the data are taken on a time-base of one minute
or less; high intensities can be interchanged with almost dry intervals.
The difference between the amount of inflow and the amount of precipi-
tation is generally expressed in the runoff coefficient C:
inflow or runoff of a storm event (mm) C =
precipi-cation of the storm event on the covered area (mm)
So, in the runoff coefficient all the loss terms - initial loss, evaporation, infiltration, exchange with unpaved area - are summarized.
Let it be notified that the amount of inflow is equal to the amount of
runoff.The rainfall minus losses is called net rainfall.
For a better understanding of the importance of each loss termtan
analysis is made of the mechanisms that govern these losses ( 5 2.2 - 2.5). In 3 2.7 the transformation of net rainfall to sewer inflow and discharge is discussed.
2.2 Initial losses
The basic flowpaths causingrunoff losses are evaporation and infiltration,
so the term initial loss only indicates an intermediate state. In
practice two types of initial losses can be discerned. First we have
the wetting loss: water is absorbed by or adsorbed to the surface cover
in a way that it can only be removed by evaporation after the end of
the event. And secondly we have the storage in depressions. By the end
of an event that water is removed by infiltration and evaporation.

The wetting loss depends on the type of cover that is applied. Concrete
bricks and tiles absorb about 0.5 mm within 10 minutes, when the
surface remains saturated with water. A more porous brick type absorbs
0.7 mm in the first 5 minutes and 0.15 mm in the next 10, while asphalt
absorbs or adsorbs only 0.07 mm within 15 minutes (Van Dam, Schotkamp,
1983).
About the depression storage a lot of figures exist. In many cases
however, these figures do not represent only the depression storage,
but include an infiltration and evaporation loss part, so the
depression storage is overestimated. On a main road in Lelystad a
depression storage of about 2 mm was found and on a flat roof the
storage was about 4 mm (Voortman 1977 and 1984). In general the amount
of depression storage ranges between 0.5 and 1.5 mm, according to the
sources found in the literature (Pecher, 1969).
So in the initial phase of the storm event, at least 1 - 2 mm of precipitation is fixed in a position that it will only be removed from
by evaporation and infiltration after the rainstorm. The runoff to the
sewer system will start at the moment that the precipitation intensity
F.--ccsds the wetting loss demand plus the lowest infiltration capacity
on any part of the covered surface. The runoff increases when the
depression storage becomes more and more filled.
2.3 Evaporation
The evaporation from paved surfaces and roofs is a rather black spot in
the knowledge on urban hydrology. Using some general theory, only a
rough estimate of the amounts can be made.
When the surface pavement is wet, the evaporation is assumed to be equal
to the potential open water evaporation E,. Using the modified Penman
equaxion E, can be calculated as:

where L = latent heat of evaporation for water at temperature T
A = factor containing the gradient of the saturation vapour
pressure vs. temperature curve evaluated at the temperatures
of the water and air and the psychrometric constant
Rn = net incoming radiation
Hs = heat energy transferred from below the surface
B = factor indicating wind effects
e and e = saturation and actual vapour pressure at 2 m above zs
the surface.
In general H is assumed to be zero. Now suppose that on a hot summerday
a thunderstorm occurs in the afternoon. The burning-hot asphalt has a
surface temperature of 55 - 60°C at the beginning of the event, but is
cooled suddenly to about 20 - 30°C by the falling rain. The sky is
clouded by that time, so the net radiation Rn is only about 75 w/mZ .
In such a situation the heat flux from below the surface can be
estimated by assuming that the process is comparable to a sudden surface
temperature change on a theoretical layer of asphalt of infinitethichess
with an initial temperature of about 55OC at the surface and about 40° C
deeper in the asphalt. By using these estimates for H,, table 1 could
be composed. The instantaneous heat flux and evaporation flux is given
in that table at several times after the beginning of the storm event.
Moreover, the accumulated amount of evaporation is indicated.
For calculating the evaporation in table 1, the term B (ezs-e,) was
neglected, because its magnitude was about 1 - 4% of the first term of
the Penman equation.
Table 1 Surface heat flux, evaporation flux and total evaporation from
asphalt during and after a thunderstorm on a hot summerday
time H,
(h) (W/mZ
1/60 3,400
5/60 1,500
evaporation flux
(X 10-~mm/s) (mm/day)
97 87
43 37
25 22
18 15
13 l l
8.9 7.7
total evaporation
(mm)
= 0.06
0.27
0.46
0.69
1.0
1.4

The heat flux from below the surface by far exceeds the amount of net
incoming radiation and therefore Hs controls the evaporation process inthe
sketched situation.
The conclusion is, that an evaporation of about 1 mm in the first
hour of a storm event is possible, but only in rather extreme situations.
In the normal situation the evaporation flux is negligible as loss term.
In general, the pavement will not be so hot. For investigating the amunt
of evaporation from a covered surface for the water balance, a
more general approach was developed. To make estimations for the
monthly evaporation of the covered surface in two experimental basins in
Lelystad, Voortman (1983) assumed that the evaporation was equal to the
open water evaporation during the time that rainfall and/or inflow was
recorded. When a storm in summer was not followed by another storm
within 1 hour, he assumed an extra evaporation of 0.2 mm-the amount for
wetting the surface. The water of the very small rainstorms that didn't
cause any measurable runoff was assumed to evaporate up to a maximum of
0.4 mm per event.
Using these assumptions and about 12 years of data he calculated an
average evaporation from the covered surface3fahousing area (see annex
l) of about 175 mm/yr. For a parking lot he found an average of 112 mm/
yr. These amounts did fit well in the total water balances of the basins.
The difference between the two amounts is caused by the total duration
of inflow: 1445 versus 980 hours respectively.
So the yearly evaporation of the covered surface is certainly not
negligible. It would be advisable to do more research in this field,
including the heat flow in pavement and roof materials. But the
contribution to the loss of rainfall in each individual event is
limited. Only in extreme cases the loss will exceed 1 mm but in general
it is less than 0,5 mm, including the evaporation of the wetting loss.
2.4 Infiltration
Only the last decade the hydrologists started to realize that the amount
54

of water that could infiltrate on brick or tile pavement is considerable.
Amongst others Van den Berg (1978) found large amounts of runoff from
the subsurface drains on a parking lot in Lelystad (see annex 1).
According to his figures about 40 - 50% of all rainfall was discharged
through the pavement. A similar result was found by Jacobsen and
Harremoes on a parking lot in Denmark (1981).
A more extensive analysis of the data over the period 1970 - 1980
showed that about 220 mm infiltrated water/year was discharged from the
parking lot by the subsurface drains; that is 30% of the precipitation
(Voortman, 1983).
The first field-study in Holland on the permeability of pavement was done
by Bebelaar and Bakker (19811, not to investigate the infiltration losses
but to check the watersupply for trees standing in or along paved area's.
A more detailed analysis of the infiltration process was made by Van Dam
and Schotkamp (1983). In table 2 the outlines of the recorded infiltration
capacities are given for different types of pavement.
Tabel 2 The average infiltration c3pacity of different types of pavement
recorded by Bebelaar and Bakker (B.B) and Van Dam and Schotkamp
(D.S)
infiltration capacity(mm/h)
Type of pavement source median minimum maximum no. of
expgiments
concrete brick (0.22~0.11~0.08) BB 32 10 353 21
IT " (0.20x0.10x0.07) DS 14 7 24 6
I ! " (0.20~0.09~0.065) BB 34 8 300 13
bricks (0.20x0.20x0.08) DS 9 6 15 9
tiles (0.30x0.30x0.04) BB 16 1 254 15
l' (0.50x0.50x0.06) DS 10 7 16 4
asphalt DS+BB 0 0 4
The permeability of the pavement turned out to be highly dependent on
the conditions of the joints between the bricks and tiles. If the joints
were filthy, a low infiltration capacity was found; older pavement and
pavement that is used intensively are in general less permeable. The

data of Bebelaar and Bakker were collected on all types of pavement,
with various age, while Van Dam collected his data only on one parking
lot, where the pavement was about 14 years old. That explains the wide
ranges found by Bebelaar. Of course the pavement must be laid upon a
highly permeable subsoil of e.g. coarse sand. In all experiments the
subsoil had a coarse texture.
In general one must conclude that the infiltration capacity is surprising-
ly high and certainly not neglectable.
Van Dam and Schotkamp used their data to check several infiltration
formulae to describe the process. The best model they found was the
formula of Hillel and Gardner for inl'iltration in czusted soils.
Icum = \rat + b' - c Icum= cumulated infiltration; a,b,c = parameters; t = time
In the urban hydrology the Horton infiltration formula is wide-spread
used. This formula -kt
i = fe + (fo-fe) e i = infiltration rate fe= fins1 infiltration rate
k = parameter fo= initial infiltration rate
turned out to be second-best and better than the formulae of Philip,
Kostiakov,and the constant infiltration rate model.
The infiltration rate is the highest in the first part of the event.
In figure 3 both the results of the field measurement on bricks
(0.20x0.20x0.08 m) and the calculated average infiltration show the
flexure in the relation.

80, mm. infiltrated
I
2 28 experiment no measured
calculated
min.
Figure 3 Recorded cumulative infiltration on brick (0.20x0.20x0.009 m)
pavement and the calculated average modelled with the Hillel
and Gardner formula (Van Dam, Schotkamp, 1983)
Because the infiltrationrate decreases with time, it is easy to underS-md
that the initial infiltration rate depends on the antecedent moisture
conditions. But taking the average infiltration rate as a design standard
is not too bad, as can be seen from figure 3, where a linear approxima-
tion seems allowable.
The infiltration in semi-pervious pavement is an important loss factor
for the surface runoff. Most of the storm events have only a low to
moderate rainfall intensity and in such a situation the infiltration
process causes that large infiltration loss.
Now that we know the wetting loss and a?e able to simulate the
infiltration loss,the amount of water on the street surface of an experimen-
tal basin can be simulated, when evaporation is neglected and when the
non-covered surface does not contribute to the runoff. The amount of
water that is still in the basin is found by substracting the recorded
cumulative inflow from the cumulative precipitation. When the wetting
loss and the cumulative infiltration is substracted from this curve-a

picture remains of the amount of water that is stored on the surface
during the event. In figure 4 such pictures are given for two events,
recorded at the parking lot basin in Lelystad.
4 mm stored on surface
3
2
1
0 . . , . , . . . . # . , . 0 20 40 0 20 40 60 80 100 120
time (min.)
Figure 4 Amount of water stored at the covered surface of the parking
lot during two storm events
As can be seen from figure 4, the amount stored on the surface is highly
variable during the event. These variations are very important for the
water quality of the sewer inflow, both for the soluble pollutant
concentrations and the solids transport. The moments with a thick
layer are very appropriate for the transport of particulates and
adsorbed pollutants. So, for the interpretation of a pollutograph of
storm sewer runoff information on the depth of the water layer can be
useful.
2.5 Contributions from non-covered surfaces
In today's design practice in Holland generally the assumption is made
that the runoff coefficient of non-covered surfaces is zero. In practice
however this is not necessarily true in all situations. Figure 5 is takm
from a paper by Ando, Takahasi and Kuan (1984) and shows the final

infiltration rates - fe in the Horton infiltration formula - they found for different types of land use on a loamy soil.
flnal lnf~ltratlon rate (rnrnlhr)
0 1 5 10 50 100 500 1000 Land use
forest
f~eld
fru~t crop f~eld
garden
grassland
lawn area
open area in parks
open area In gardens
sports ground
cleared land for res~dence
Figure 5 The final infiltration rate versus the land use on a loamy
soil (taken from Ando, Takahasi, Kuan; 1984)
Measurements in Lelystad gave infiltration rates on lawn of about 16 mmk
and on greenbelts of 3 - 190 mm/h.
Taking in mind that the design discharge of 50 l/s/ha for storm sewers
equals 18 mm/h, some runoff' from non-covered areas can occur in the
design situation, however to a limited extent because
- most infiltration rates of non-covered areas e.g. figure 4 exceed
18 mm/h
- the initial infiltration rate is higher than the final rate - most of the non-covered surface is overgrown by grass, bushes or trees and they cause interception
- the depression storage on non-covered surfaces can be considerable. Only when the permeability of the soil surface is relatively low - e.g. in case of a heavy clay - some runoff from unpaved areas can occur if the gradient allows for it. In that case some runoff should be taken
in account, say 5 - 10 l/s/ha uncovered area (= 2-4 mm/h).
In storms, heavier than the design situation, the risk for additional
runoff from the uncovered areas increases. Especially in sloping areas
this 'unexpected' contribution can have detrimental effects. The sewer

system will get surcharged and the water searches its way downhill over
the street surface and via other depressions, often resulting in ponding
of water downhill. Damage by this type of runoff can be prevented, e.g.
by use of 'dual' drainage as in Canada. There the roads have an explicit
function for conveying the water to a discharge point. Because they are
designed for that function, preventive measures are taken to avoid
basement flooding and damage when the streets get flooded.
In the Dutch design method the effect of storms, larger than the design
storm, are not taken into consideration. Often a lot of damage could be
avoided by taking relatively simple and cheap measures. Runoff from
uncovered surfaces could be avoided in many cases by lowering the level
of the non-covered surface to below the level of the covered surface.
In case this solution is not applicable, a separation between the
covered and non-covered surface should be made in such a way, that
enough storage on the uncovered surface prevents runoff.
2.6 Runoff coefficient
Now that the processes that govern the precipitation loss are better
understood, let us take a look at the runoff coefficients found in the
experimental basins in Lelystad. All losses are incorporated in the
runoff coefficient. The coefficient is defined with respect to the
covered area so theoretically it can be larger than 1. Let it be
notified that the definition of a storm event is an artefact. The event
begins with the first measurable rainfall and ends with the last
measurable runoff. The sensitivity and accuracy of measuring devices
therefore is an important factor.
Now let us take a look at the runoff coefficients recorded in the three
Lelystad basins and consider the probability that a certain coefficient
occurs.In figure 6 the probability density function (pdf) of the coefficients
is given for the three basins. Only events with a total runoff larger
than 1 mm were taken into account. In figure 7 the same is shown for
events larger than 5 mm.

n = 926 no. of months = 184
n = 1038 no. of months = 182
1 Bastion ; n = 184
runoff coefficient %
Figure 6 P m b a b i l i ~ densiQ function of khe runoff c o e f f i c i e n t s observed
i n 3 bas ins i n Lelystad f o r s torms with more than 1 mm runoff
40 % ] Pampus-Blokkerhoek ; I / Noorderwagenplein ; Bastion
n =45
runoff coefficient %
f i g u r e 7 Probability dens i t y func t ion of t h e runoff c o e f f i c i e n t s i n
3 b a s i n s i n Lelystad f o r storms with more than 5 mm runoff

Although the basins are quite different in their characteristics,the
distribution of the coefficients is remarkably alike: in most events
20 - 60% of the rainfall on the covered surface is not discharged by the sewer-system. The runoff coefficients of the housing area Pampus-
Blokkerhoek are slightly higher than those of the parking lot, mainly
due to the smaller percentage of semi-permeable pavement. The number
of data of the Bastion housing area is considerable less than of the
other basins, so the accuracy of the pdf is less too.
An outstanding phenomenom is the smaller standard deviation (spreading)
of the Bastion pdf. An explanation is found in the extensive use of
tile pavement and the sloping roofs in the Bastion basin, so that the
initial losses are relatively small. For the small events a higher run-
off coefficient will be found, so the left tail of the pdf is 'pressed'
somewhat to the right. A smaller standard deviation is the result.
Comparing figure 6 to figure 7 an increase of the runoff coefficient is
found because 1. the initial loss is relatively less important in heavy
storms and 2. the events are in general of longer duration and the infil-
tration rate decreases with time, resulting in relatively more runoff
The median valuesof the runoff coefficients in the figures 6 and 7
differ about 10 - 15%.
To investigate the seasonal fluctuation the pdf's of the runoff
coefficients found in the summer and winter half year is shown in
figure 8.
% Pampus- Blokkerhoek 40 r-,-
Noorderwagenplein
summer ; n=415 winter ; - n=511 7 p m e r ; n-493 winter; n-545 1
runoff coefficient %

Figure 8 Probability density function of the runoff coefficients
observed in summer (April-September) and winter in two
basins in Lelystad. Storm events larger than 1 mm
The coefficients are larger in winter. For Pampus-Blokkerhoek the
median coefficient is 56% in summer and 59% in winter. For the
Noorderwagenplein basin these values are 54% and 57% respectively.
Less initial and evaporation losses and a reduced infiltration due to
the wet initial conditions and/or due to a frozen underground cause
the difference in pdf's. In summer the storms have higher intensities,
resulting in higher coefficients, but this seems not to counterweight
the effect of the reduced losses.
2.7 Rainfall to inflow transformation
Apartfrm 'che losses, the rainfall-runoff process is characterised by
another phenomenon: the delay and smoothing of the hyetograph to the
inflow hydrograph.
Assuming that the relation between the net rainfall and runoff is
linear, a unit hydrograph can be calculated for that relation. This unit
hydrograph shows how 1 unit of rainfall in 1 time unit is transformed CO
inflow. By Van de Ven, Van der Kloet and Van der Wal (1981) is shown
that a linear relation between rainfall and inflow is a justifiable
assumption and that Laguerre functions are well suited to describe the
unit hydrograph. The estimated unit hydrographs for the rainfall-inflow
relation in the basins Pampus-Blokkerhoek and Noorderwagenplein and the
rainfall-discharge relation for the basin Bastion are shown in figure 9.

q (mmlrnin.)
Figure 9 Unit hydrographs for the inflow on two basins in Lelystad
(Pampus-Blokkerhoek and Noorderwagenplein) and for the sewer
discharge from another basin (Bastion)
The unit hydrographs for both the inflow and the sewer discharge
indicate that one unit insut leads to runoff until1 more than 20 minutes
after the jnput occured. The inflow on the Noorderwagenplein parking lot
is less prolongated than the runoff from the housing area. This is
probably due to the less differentiated cover with a relatively quick
responding surface. The Pampus-Blokkerhoek area e.g. gives long response
times because of the flat roofs in the basin. Both inflow hydrograpns
are rapidly declining functions while ;;he dqscharge hydrograph of the
Bastion area is more smooth. The location of the centre of gravity of
;he curves illustrates that:
Noorderwagenplein parking lot, inflow : 3.5 min
Pampus-Blokkerhoek housing area, inflow : 3.7 min
Bastion housing area, discharge : 11.1 min
l l
\ \ I I L l l
2 Pampus-Blokkerhoek - lnflow
0.15 - :
Oslo -
I ' \
0.05 - Bastlon - d~scharge
--S__
'- --------- ---- - _ _ _ _ _ ----- 0 I l
0 10 20 30 40 50 60 tlme (mm )

There is no reason why the centre of gravity of the inflow hydrograph
of the Bastion area would not be between 3 and 4 minutes. So, the
delaying effect of the stormsewers in this 4.5 ha large basin must be
about 8 minutes. The flow in tine sewer-pipes therefore leads to a
considerable smoothing of the inflow. For medium to large sewer systems
this smoothing should certainly be taken into account for the design of
the main sewers.
The time scale of the rainfall-inflow relation is important because of
the possibility to simulate the inflow with the aid of a model and
rainfall data. As can be seen, the time interval of the rainfall data
should preferably be less than 3 minutes to get a good simulation of
the inflow. Problems with the collection of data at these time inter-
vals can be avoided by using event-sense recording.
3 THE CONSEQUENCES
Now that we have investigated the rainfall-inflow process we can try to
formulate the consequences for the output (= the runoff) and for the
design of the water management system of urban areas.
3.1 The water balance
meaverage water balance of the parking lot over 1970 - 1980 is composed
by
IN: OUT :
precipitation : 737 mm/y storm sewer runoff : 376 mm/y
vertical seepage : 101 mm/y subsurface drainage runoff : 337 mm/y
lateral seepage : 20 mm/y evaporation covered surface : 112 mm/y
evaporation trees : 27 mm/y
change of storag~ : 5mm/y
Assuming that all seepage is discharged by the subsurface drainage
system, the average groundwater recharge rate below the paved parking

lot comes to about 220 mm/y. The assumption that groundwater recharge
on a paved area is negligible is therefore questionable. The groundwater
recharge from covered surfaces can even be larger than from uncovered
surface, because the evaporation from covered surfaces is limited:
110 - 180 mm/y for the covered part versus 455 mm/y for the non-covered part. Problems with high groundwater tables are often a result of the
combination of semi-pervious pavement and a lack of subsurface drainage.
3.2 Maximum inflow and design discharge
The losses and the rainfall-inflow relation also severely influence the
maximum intensity of the inflow. In figure 10 depth-duration-frequency
curves are given for both the rainfall and the inflow recorded at the
parking lot and in the housing area in Lelystad (Van de Ven, 1984).
0 30 60 90 120 150 180 time (min.)
Figure 10 Rainfall and inflow depth-duration frequency curves from daLa
collected on a parking lot and in a housing area in Lelystad
in the period 1968 - 1980

As can be seen the inflow depths are 20 - 70% smaller than the
comparable rainfall depths. The largest differences occur at short time
intervals.
It is clear that not the rainfall but the inflow data should be used
as basis for the design discharge for storm sewers. This selection can
not be done using the depth-duration-frequency curves because they donot
represent real time series. Using a simple model and the recorded inflow
series,the storage-design discharge-frequency-curves canbe calculated for
different return periods. Based on such an analysis, Van de Ven (1984a)
comes to a design discharge of 4 - 5 m3 /s/kmZ (40 - 50 l/s/ha) for a situation as in a large part of Holland.
3.3 Overflow amounts
The amount of discharge out of the overflow structure of a combined
sewer-system is often calculated for estimating the required magnitude
of a storage basin and/or for estimating the pollutant load. This last
function is important because 86% of the Dutch overflow structures
discharge on small, semi-stagnant receiving water.
Using a 'tree' of different reservoir type elements the sewer-system of
the villages Harderwijk, Ermelo and Putten was modelled by Van de Ven
(1984) to simulate the amount of overflowing water from the main over-
flow structure. The total covered area is about 310 ha. The villages
are locazed about 30 - 40 km south of Lelystad, so the 10 years series
of both hou~ly rainfall data and inflow data from the parking lot in
Lelystad were used as input for the model. To correct for the losses
an extra calculation was made with a runoff coefficient of 0.80 on the
precipitation. The calculated averages of the overflowing amounts
depended on the input:
input average overflow 1000 m3 /yr
precipitation 212
precipitation * 0.8 112
inflow parking lot 72

The difference is considerable. Again it should be advised to use inflow
data instead of precipitation data in Lnis type of calculations.
3.4 Duration of runoff and location of peak in the storm profile
For some problems it is interestingto know how much time the street sur-
face is wet or runoff occurs. These figures can be derived from the run-
off measurements in the basins in Lelystad. The recorded total duration
of runoff in the Pampus - Blokkerhoek basin is 1445 h/yr on the average, while on the Noorderwagenplein runoff occurs during about 980 h/yr.
Because every storm event is characterised by a recession curve of the
inflow after the rain has stopped, the peak in the inflow hydrograph
will always occur relatively early in the event. In figure 11 from
Van de Ven (1984a) this is illustrated. To make this figure, the duration
of each rainfall an inflow storm was set on 1000h. Now the expected depth
of rainfall after, say 30% of the time, is 30% of the total depth. In
practice the depth deviated from the expected percentage and the proba-
bility distribution of these deviatjons are shown in figure 11. The
lines in the figure give the connection between the calculated percen-
tage point of the distribution of the deviations. So the average deviation
is indicated by the 0.5 line.
RAINFALL (n, 904) INFLOW PARKING LOT (n-406)

Figure 11 Deviation of the actual rainfall and inflow depth f?om the
expected depth after a part of the event duration (all storms
larger than 2.5 mm). In the figure the percentage points of
the probability distribution of the deviationsareshown for
the different parts of the storm duration
As can be seen from the average the most intense part of the rainfall
occurs between 25% and 75% of the storm duration, while for the inflow
the peak generally occurs between 15% and 60%. Design storms - often based upon rainfall instead of inflow data - with uniform intensity or with the peak in the middle of the storm event or even later, therefore
are less realistic. When selecting the design (inflow) storm for non-
steady flow calculations in sewers, this variation should be taken into
account.
4 CONCLUSIONS
The difference between rainfall and sewer inflow is large. The design
parameters for the sewer system therefore should be based upon the
inflow and not upon the precipitation.
The extremes in the sewer inflow are 30 - 70% smaller than comparable extremes in the precipitation, according to the depth-duration-frequency
curves. These curves cannot be used to derive a design discharge.
By means of the storage-design discharge-frequency curves based on the
inflow series a design discharge of 4 - 5 m3 /s/km2 (40 - 50 l/s/ha) is found when the return period for exceedances is set to 2 years.
Because of the permeability of the pavement, about 220 mm/yr of ground-
water recharge was found below a parking lot in Lelystad. The evaporation
from paved surfaces was about 110 - 180 mm/y. That is much less than the 450 mm/y for the non-covered areas. More research on the evaporation
from covered surfaces is required.
In a case-study the amount of overflow from a structure in a combined
sewer system was calculated wit'n a model. The amount was overestimated
with a factor 3 when rainfall data were used as input ins'cead of inflow
data.

The peak in a storm (inflow) profile tends to be situated between 15 and
60% of the total storm duration. Design storms should be adapted to that.
The process of conversion from rainfall to sewer inflow can be split up
in 1. The losses and 2. the transformation of net rainfall to inflow.
The losses are separable in three basic loss processes:
- the initial losses consist of 1. the wetting loss of say 0 - 0.8 mm which can only be removed from
the surface by evaporation
2. the depression storage of say 0,5 - 1,5 mm which is removed by both infiltration and evaporation
- the evaporation can amount up to 1 mm/h in extreme cases, the wetting loss excluded, but is negligible as loss under average conditions
- the infiltration through semi-permeable pavements as tiles and bricks ranges from 10 to 35 mm/h.
The magnitude and behaviour of the runoff coefficient can be explained
very well from the knowledge of the loss processes: For heavier rain
stormsthe coefficient increases; a smaller initial loss gives less
variable coefficients. For modeling and design at least the initial loss
plus the infiltration loss should be taken in account. In many cases the
total loss will exceed 2 - 4 mm.
Runoff from uncovered areas generally does not occur under design condi-
tions, except when e.g. the permeability of the soil is low. If that is
the case it should be taken into account. When the design conditions are
exceeded, some runoff can appear however.
To avoid problems in that situation, runoff from the uncovered to the
covered area should be avoided e.g. by making a separation.
The amount of water at the covered surface fluctuates strongly during
an event. This variation has important implications for the concentra-
tion ofthe transported pollutants and for the transport of sediments
to the sewer system.
The centre of gravityofthe unit hydrograph for inflow is located at
3 - 4 minutes. The unit hydrograph of the discharge from a 4,5 ha

housing area had its centre at about 11 minutes.The retardation of the
runoff by the storm sewer itself therefore is considerable. In the sewer
design technique the delay in both the inflow and the ouflow should be
taken into account.
By using the sewer inflow instead of the rainfall as the basis for the
sewer design, a reduction in the sizing of the system can be achieved -
and so in the costs.
5 RECOMMENDATION FOR THE DESIGN STORM
If possible, inflow instead of rainfall data should be used for deter-
mining the design storm. In many cases however, inflow data are not
available, so the engineer is forced to work with the rainfall data.
Basicly he can apply two ways to derive the design storm; an approxi-
mative one and one based upon simulation.
The firsk is based upon the rainfall depth-duration-frequency curves.
The step-wise process is as follows (also see figure 12):
1. Select a return period and design storm duration;
2. Read the rainfall amount in the depth-duration-frequency curve;
3. Assume a uniform distribution of the rainfall over the duration;
this gives the design rainstorm;
4. Substract 1 - 2 mm initial loss; 5. Substract the infiltration and evaporation loss. The evaporation loss
can be neglected. The infiltration loss can be calculated as the
weighted average infiltration capacity. The fraction of each pavement
type of the total covered area serves as a weighting factor. Roofs
are impermeable; other infiltration capacities can be derived from
table 2, by taking the average of the indicated values for each
pavement type.
6. Add the run-off contribution from the uncovered area, if necessary.
If so, substract the infiltration capacity from the design storm
intensity. The rest is stored in depressions (3 - 6 mm) and the sur- plus flows to the covered area. This flow has to be expressed in L/T
(e.g. mm/h) with respect to the covered area;

7. The result now is the net rainstorm;
8. By convolution of the net rainstorm with the inflow unit hydrograph,
the design inflow storm can be calculated. The unit hydrograph can be
derived from figure 9. The design inflow is the maximum of this
inflow storm.
area (if not 0)
Figure 12 From design rainstorm to design inflow storm
As can be seen in figure 12 the maxima of the net rainstorm and the
design inflow storm differ only when the storm duration is less than
20 - 30 minutes.
The second approach is based upon time series of rainfall and a
simulation model. The method is as follows:
1. Convert the rainfall series into inflow series by substracting the
losses and by convolution with the unit hydrograph;
2. Route the inflow through a model of the sewer-system - in many cases in Holland a simple reservoir model. By doing this, series of amounts
stored in the reservoir or a discharge by overflows can be calculated;
3. Repeat step 2 for different values of the controlling value(s), (e.g.
design discharge, pump capacity, etc.);
4. Analyse the results of the steps 2 and 3 and select the design
standards; for e.g. design discharge or pump capacity.
A prerequisit for applying this second approach is a sufficiently long

t i m e s e r i e s o f r a i n f a l l d a t a w i t h s h o r t t i m e i n t e r v a l s .
For c a l c u l a t i n g t h e r e q u i r e d amount o f ( e x t r a ) s t o r a g e i n a sys t em t h e
a p p l i c a t i o n o f dep th -dura t ion - f r equency c u r v e s is b a s i c l y wrong.
I n s t e a d , s t o r a g e - d e s i g n d i s c h a r g e - f r e q u e n c y c u r v e s s h o u l d be c a l c u l a t e d
f rom t h e r e s u l t s o f s t e p 3 . And t h e s e c u r v e s s h o u l d be used f o r s e l e c -
t i n g t h e amount o f s t o r a g e .
REFERENCES
ANDO, Y . , TAKAHASI, Y., and KUAN, M.F., 1984. R e l a t i o n between l a n d u s e
and f i n a l i n f i l t r a t i o n r a t e i n u rban a r e a s . I n : P. Balm&,
P.A. Malmquist , A. S j o r b e r g , P r o c e e d i n g s o f t h e 3 r d I n t . Conf. on
Urban Storm Dra inage , Vol. 3 P l a n n i n g and Con t ro l o f u rban s t o r m
d r a i n a g e . Chalmers U n i v e r s i t y o f Technology, ~ o t e b o r g .
BEBELAAR, J .P . , and BAKKER, J . W . , 1981. I n f i l t r a t i o n o f r a i n w a t e r
t h r o u g h r o a d pavement f o r t h e w a t e r s u p p l y o f s t r e e t - t r e e s ( i n
Dutch). Note 1247, I n s t i t u t e f o r Rural E n g i n e e r i n g and Water
mnagement , Wageningen . JACOBSEN, P - , and HARREMOES P - , 19e 1 . S i g n i f i c a n c e o f s emi -pe rv ious
s u r f a c e s i n u rban hydro logy . I n : B.C. Yen. Urban Storm Drainage;
P roceed ings o f t h e second I n t e r n a t i o n a l c o n f e r e n c e . Volume 1. Dept.
o f C i v i l E n g i n e e r i n g U n i v e r s i t y o f I l l i n o i s , Urbana-Champaign.
PECHER, R., 1969. Der A b f l u s s b e i w e r t und s e i n e ~ b h a n g i g k e i t von d e r
Regendauer . E i g e n v e r l a g d e I n s i t u t s f i i r Wasse rwi r t scha f t und
Gesundheitsingenieurwesen d e r Technischen Hochschule t&nchen.
VAN DAM, C.H., and SCHOTKAMP, P - , 1983. I n f i l t r a t i o n i n pavement ( i n
Dutch) . R.1J .P . - repor t 1983 - 38 Abw., I J s s e l m e e r p o l d e r s
Development A u t h o r i t y , L e l y s t a d .
V A N DE VEN, F.H.M., 1984a. Design i n f l o w i n t e n s i t y and d e s i g n i n f l o w
p r o f i l e s f o r s t o r m s e w e r s . I n : Water S c i e n c e Technology Vol. 16,
Copenhagen, pp. 207-218.
V A N DE VEN, F.H.M., 1984b. A model f o r e s t i m a t i n g t h e d u r a t i o n o f
sewer o v e r f l o w s and t h e amount o f o v e r f l o w w a t e r , w i t h t h e sewer-
sys t em of Harde rwi jk - Ermelo - P u t t e n as example . R.1J.P.-report
1984-22 Abw., I J s s e l m e e r p o l d e r s Development A u t h o r i t y , L e l y s t a d .
VAN DE VEN, F.H.M., V A N DER KLOET, P - , and VAN DER WAL, M - , 1981. Some
models and c a l c u l u s methods f o r t h e r e l a t i o n between p r e c i p i t a t i o n

and sewer i n f l o w ( i n Dutch). F l e v o b e r i c h t 176, p a r t A, B and C ,
I J s s e l m e e r p o l d e r s Development A u t h o r i t y , L e l y s t a d . VOORTMAN, B.R., 1977. The d r a i n a g e of some r o a d s i n Le lys tad ( i n Dutch) .
F l e v o b e r i c h t 123, I J s s e l m e e r p o l d e r s Development A u t h o r i t y , L e l y s t a d .
VOORTMAN, B.R., 1984. The monthly wa te r ba lance o f a hous ing a r e a and a
parking l o t i n Le lys tad ( i n Dutch) . R.1J .P.- report 1984 - 35 Abw.,
I J s s e l m e e r p o l d e r s Development A u t h o r i t y , Le lys tad .
Annex 1 THE M A I N FEATURES OF THE EXPERIMENTAL BASINS I N LELYSTAD
Le lys tad is a new town, s i t u a t e d a b o u t 60 km e a s t o f Amsterdam i n t h e
p o l d e r F levo land . The b u i l d i n g a c t i v i t i e s s t a r t e d i n 1967 and by now it
h a s 60.000 i n h a b i t a n t s . The town is provided w i t h a s e p a r a t e sewer-
system and c a n a l s t h a t convey t h e r u n o f f from t h e s to rm sewers t o t h e
r u r a l environment . S ince 1968 a h y d r o l o g i c a l r e s e a r c h p r o j e c t is g o i n g
on i n Le lys tad . To o b t a i n a b e t t e r unders tand ing o f t h e urban hydro logy ,
p r e c i p i t a t i o n , s t o r m water r u n o f f , s u b s u r f a c e d r a i n a g e r u n o f f , ground-
w a t e r l e v e l s and s i n c e 1982 i n one b a s i n a l s o t h e q u a l i t y o f pre-
c i p i t a t i o n , s to rm wate r r u n o f f and cana lwa te r is monitored c o n t i n u o u s l y
i n 3 b a s i n s by a c e n t r a l a u t o m a t i c d a t a l o g g i n g and c o n t r o l l i n g system.
Some c h a r a c t e r i s t i c d a t a of t h e b a s i n s a r e g i v e n i n t a b l e 1.
The Pampus-Blokkerhoek a r e a c o n t a i n s 60 s i n g l e - f a m i l y houses w i t h a
h e i g h t of 8 m and f l a t r o o f s . The sub-basins pe r g u l l y p o t r ange i n a r e a 2 . 2
from 100 - 200 m i n Pampus-Blokkerhoek and from 100 - 260 m on t h e
Noorderwagenplein. The s to rm sewers i n bo th b a s i n s c o n s i s t of c o n c r e t e
p i p e s 0 300 mm. The wa te r i n t h e sewer is dammed up by t h e V-notch we i r
used f o r t h e d i s c h a r g e measurements i n such a way, t h a t t h e bulk s t o r a g e

in the pipes is filled up completely; only a small amount of dynamic
storage is left. This allows the calculation of the sewer inflow f-om
the measured discharge by
q.= inflow s = (dynamic) storage
q = discharge h = waterlevel near the weir
while as/ah is determined by experiments. The minimum measurable dis-
charge is 0.005 m3 /s/km2 in Pampus-Blokkerhoek and 0.0066 m3 /s/km2 on
the Noorderwagenplein.
Table 1 Features of the 3 basins for hydrological research in
Lelystad
% of covered area name land area slope % of area roof asphalt brlckf water :ccording
use (ha) (%) covered &i+@es ti:e quality since
Pampus-
Blokkerhcek housing 2.0 0-2 41 30 32 38 no 1968
Noorderwa-
genplein parking 0.7 0-2 99.6 - 45 55 no 1969
Bastion housing 4.5 0-2 66 43 6 51 yes 1982
In the Bastion area 270 single family houses and appartments are
realised in 2 to 4 storey buildings. The roofs of these buildings have
an angle of about 25' with the horizontal. The diameter of the sewer-
pipes ranges from @ 300 - 500 mm. Because of the water quality
measurements the water coula not be dammed up, so the inflow cannot be
calculated. The discharge measurements are done with an electromagnetic
flowmeter. The minimum measurable discharge is 0.033 m3 /s/km2 . The precipitation is measured with 2 ground level raingsugswith an orifice
of 0.4 m'.
The data logging system is controlled by a desk top computer. The
system only registers significant changes in the values (event-sense
registration). The shortest recording interval for each instrument is
less than 20 S. Moreover, every 2 hours the values of all instruments
are recorded, to have some recordings in times that a steady state
appears.


URBAN STORMWATER RUNOFF POLLUTION
E.J.B. Uunk
ABSTRACT
In the Netherlands, until recently very little attention was paid to the
quality of stormwater runoff.
In the paper, the results of two recent Dutch research projects concer-
ning urban stormwater runoff pollution are presented.
Compared to the situation in other countries, the stormwater runoff in
both Dutch basins contained very little suspended solids and oxygen
demanding matter.
In one basin, the stormwater runoff was rather unpolluted for most con-
stituents considered. This was partly caused by the mixing with drain-
water prior to discharge. In the other basin, some pollution was found,
in particular with respect to faecal bacteria, lead and zinc, mineral
oil and certain polycyclic aromatic hydrocarbons. The nutrient concentra-
tions in the stormwater runoff from both basins were fairly high.
The necessity to control stormwater runoff pollution depends on the
degree to which receiving surface waters are affected. Control measures
to be considered are listed.
1 INTRODUCTION
In the Netherlands, two systems are used to drain urban areas:
1. a subsurface drainage system to transport infiltrated precipitation
and, in some areas, seepage;
2. a sewer system to transport stormwater runoff mainly from covered
surf aces.
77

A sewer system is always needed, a subsurface drainage system only where
groundwater control requires it.
When the stormwater sewer system is also used to transport the wastewater
produced in the urban area, it is called a combined system; if the waste-
water and the stormwater are transported by separate sewers, the system
is called a separate system. In this system, the stormwater sewers dis-
charge directly on receiving surface waters. In the combined system,
most of the storm water runoff is treated prior to discharge (figure 1);
the remainder is discharged directly following intensive precipitation,
together with a part of the wastewater produced at that time and sedi-
ment~, scoured from the sewers. Generally, the sewers discharge on small-
sized urban canals or ponds.
In addition to these two main systems, a number of modifications of both
systems exist, like the so called improved separate system. This paper
focuses on the ordinary separate system.
precipitation
I evaporation
t I covered surface
l I I
infiltration
gully pots
wastewater
I
storm sewer e combined sewer r--5
I I 1 treatment plant I
surface water
Figure 1 The transport of urban stormwater runoff by a separate and a
coribined sewer system 78

In the past, stormwater runoff was considered to be clean. Now that we
have learned that stormwater (precipitation) is polluted in many res-
pects, stormwater runoff obviously has fallen under suspicion as well.
The locations where the stormwater can become polluted after reaching
the urban ground surface are indicated in figure 2.
- watertransports - pollutional sources
+ pollutional sinks
Figure 2 Stormwater runoff: pathways and pollutional sources and sinks
Pollutional sources of the (covered) surface are:
1. motorised traffic.
This source can be subdivided in:
- exhaust emissions from fuel combustion, - fuel and lubricant spills, - particle emissions from wear of brake linings, tires and clutch, and
- corrosion. Main pollutants involved are some organic micropollutants and heavy
metals;
2. atmospheric fall-out/precipitation.
Air pollution, originating from industrial and domestic sources and
(again!) motorised traffic, appears as dust and soot particles,
aerosoles and in gaseous form. The pollutants, present in the air, 79

may reach the earth again in dry periods (dry deposition) and in wet
periods (precipitation). Precipitation and dry deposition can be a
significant source of pollutants in urban stormwater runoff. The
precipitation effects a wash-out of pollutants from the atmosphere
and, once turned into runoff, it may easily entrain the soluble
substances and small particles, emanating from dry deposition. The
main pollutants from this source in connection with stormwater run-
off are some organic micropollutants and heavy metals;
3. litter (paper, plastics, etc.).
Because of its large average size, litter is likely to be only a
minor constituent of runoff;
4. faecal deposition by animals (dogs, birds).
This can locally be a very significant source of, particularly,
bacteriological pollution;
5. corrosion.
Corrosion of gutters, fences, lampposts and such can lead to a
significant heavy metal contamination of the stormwater runoff;
6. vegetation and erosion.
The amount of material, enterins stormwater runoff from these sources
can be considerable. Qualitatively, the material is rather harmless;
7. industrial point sources.
The category is very diverse and only locally significant.
Further pollutional sources of infiltrated stormwater and stormwater
runoff are:
- illegal dumping or discharge of polluted materials like used paint or motor oil into gully pots;
- dissolution of pollutants from the soil profile (generally unimportant); - entrance of wastewater through '}false connections" or through perco- lation from wastewater sewers.
In some older separate sewer systems, up to 5 to 10% of false connec-
tions are reported. In these cases, the entrance of wastewater is the
prime source of organic and bacteriological pollution of the storm-
water runoff.
On the other hand, there are also pollutional sinks, in particular the
(already mentioned) retention by the soil profile, street sweeping, and
80

the cleansing of gully pots and sewers.
2 SIGNIFICANCE OF QUANTIFYING URBAN STORMWATER RUNOFF POLLUTION
Why do we want to know exactly how large the pollutional loads associa-
ted with urban stormwater runoff are?
Until recently, the only reason was to allow for the comparison of the
pollution, from separate and combined sewer systems (the "emission
trace"). Annual loads were established , typically only for BOD or COD, for the sake of the system choice for areas to besewered. Discussions
on the separate system focused on the number of false connections to be
taken into account.
At this moment, the "emission trace" is only considered adequate for
some toxics like mercury and DDT ("black list" substances).
More generally, the emphasis is now on the assessment of the consequences
of the discharges from sewers on the quality of receiving surface waters
(the "immission trace" ) . Starting point are the functions of the affected surface waters. On the
basis of these functions, water quality goals can be formulated for
these waters.
Urban surface waters usually play a role in urban water management and
town planning and serve as a habitat for aquatic life and asamedium for
recreational activities. As a result, they have to comply with the so
called "basic water quality" standards, with fishing water standards
and, possibly, with swimming water standards. In the future, in addi-
tion ecological goals will be formulated. Comparing actual water quality
with the relevant standards may result in a need for correctional mea-
sures. This requires quantitative insight into the factors that deter-
mine the actual water quality and into the way they influence water
quality.
In urban surface waters receiving stormwater runoff, the discharges by
the storm sewers are often the most important factor, determining water
quality. Therefore, quantification of both urban stormwater runoff
8 1

pollution and of its consequences for the receiving waters is needed.
Although this paper focuses on the former subject, some receiving
water impacts will be indicated.
3 STORMWATER RUNOFF POLLUTION
Below, the firstyear's(1983) results of two recent Dutch research
projects concerning stormwater runoff pollution are presented.
3.1 The experimental set-up
The two investigations concerned are:
1. The urban water research project Lelystad, carried out by the IJssel-
meerpolders Development Authority. Location of the project is the
experimental basin "Bastion" in the new town Lelystad. The project
is carried out to contribute to the optimization of the planning and
management of urban waters, in particular in the Lake IJsselmeer-
polders. In this project, both the quantification of stormwater run-
off pollution and the assessment of receiving water impacts are
addressed (Van de Ven, 1982).
2. An investigation,carried out by Dwars, Hederik en Verhey Consulting
Engineers in an experimental basin in the town Heerhugowaard. This
investigation formspart of the STORA-38B project that aims at deve-
loping quantitative guidelines for the set-up and planning of sewer
systems, utilizing information on emissions of pollutants. The Heer-
hugowaard project is restricted to quantification of stormwater run-
off pollution. It is sponsored by the NWRW (Netherlands National
Research Committee on Sewerage and Water Quality).
Table 1 contains some features of both basins. Both basins are residen-
tial areas; the Bastion basin has a higher population density and per-
centage covered surface than the Heerhugowaard basin. Both basins are
completely flat.
In both basins, the stormwater runoff is finally discharged on the
receiving surface water by one storm sewer outfall. In Heerhugowaard,
this sewer also serves for the transport of drainwater, whereas in 82

Lelystad the drainwater is discharged separately.
Table 1 Features of the two experimental basins
Bastion (Lelystad) Heerhugowaard
units
Surface area ha 4.5 12.5
Covered surface ha (%) 3.0 (66) 6.8 (54)
Population density inh/ha 160 90
In both basins, the stormwater runoff flow was measured continuously,
while flow proportional sampling started above a certain (low) runoff
flow (Heerhugowaard) or precipitation intensity (Bastion). Within a
certain runoff event, generally severalsamples were taken. Not all
runoff events could be sampled. When the flowmeter was not working,
no samples were taken. This situation occurred in less than 10% of
the time so that it hardly influences the reliability of the findings.
Among the measured flows, the very small flows were not sampled. Fortu-
nately it appears, both in the Bastion as in Heerhugowaard, that in
general the water quality of the runoff does not depend on the runoff
volume so that the presented results may be considered to be represen-
tative for the water quality of very smalle runoff volumes as well.
All in all, in the Bastion 143 runoff events were sampled, in Heerhuge-
waard 39.
3.2 Quantitative aspects
The year 1983 was rather wet with extreme rainfall in May and November,
while June and July were fairly dry months. In the Bastion, annual
precipitation amounted to 928 mm. The flow measurements in the storm
sewer related to 727 mm of precipitation and yielded on average runoff
coefficient of 0.61. As a result of the drainwater impact on the storm
sewer flow no runoff coefficient could be determined yet for the Heer-
hugowaard basin.

3.3 The quality of the stormwater runoff
Of the results of the water quality investigations, only (flowpropor-
tional) mean concentrationsper runoff event are presented.
3.3.1 Comparison with other stormwater quality data
To give an idea of the quality of the stormwater runoff in both basins,
in table 2 for a number of constituents mean concentrations over 1983
are presented and compared with results of similar investigations in
other countries. The project from the USA concerns the "Nationwide Ur-
ban Runoff Programm" (NURP, 19831, in which the stormwater runoff of 81
experimental basins in 22 U.S.-cities was examined. Among the experi-
mental basins were both residential and commercial areas, but no large
industrial areas. The "various investigations" involve investigations
in a number of experimental residential basins in Western Germany
(Brunner, 1975), Finland (Melanen, 1981), Norway (Lindholm, 1978),
Australia (Weeks, 1981), Switzerland (Roberts, 1979) and England
(Mance, 1978).
One of the most remarkable features of the Dutch basins is, as table 2
shows, the relatively low suspended solids content of the stormwater
runoff. Apparently, as a result of the flatness of the area and the
fairly high contribution of paved surfaces, much less particles are
picked up from the surface than elsewhere. In Heerhugowaard, the storm-
water runoff contains more - mineral - suspended solids than in the Bastion basin, possibly as a result of the lower paving percentage.
The BOD, a measure for the presence of biodegradable organic matter,
is in the Dutch basins also much lower than in the other basins, as
is the COD, a measure for the total presence of oxygendemanding matter.
Presumably this is, apart from the low solids content of the stormwater,
mainly caused by the ascertained absence in both basins of false con-
nections (which are presented in most other basins).
This absence of false connections enhancesthe suitability of both
basins for evaluating the quality of stormwater runoff.

Table 2 Water quality of stormwater runoff:
arithmetic means of a number of (flowproportional) event mean
concentrations
units: mg/l, except for faecal coliforms: counts/100 m1
Constituent Bastion Heerhugo- USA* Various
waard investigations
Total suspended solids 33 - 180 80-900
Mineral suspended solids 21 36 - 20-850
BOD 3 2.5 12 7-14
COD 20 35 82 37-120
Total P
Total Kjeldahl-N
Nitrate-N
Total lead
Total zinc
Total copper
* for "median" experimental basin ** median for summer months (April-September)
In contrast with the BOD and COD, the nutrient content of the storm-
water runoff in the Dutch basins is not significantly different from
that in other areas.
As for heavy metals, the two Dutch basins differ considerably. The
Heerhugowaard basin shows very low concentrations for all heavy metals
examined, which may partly be caused by the relatively low traffic im-
pact in the area. A more important factor appears to be the diluting
effect of the drainwater discharged with the stormwater runoff. When
compared to the other figures in table 2, the Bastion basin shows a
low copper concentration, a fairly low lead concentration and a high
zinc concentration. 85

The bacteriological contamination of the stormwater runoff in the Bas-
tion is considerable but nevertheless low, compared to the U.S. basins
where false connections often determine the bacteriological quality of
the stormwater runoff.
3.3.2 Suspended solids
The substances discharged with the stormwater runoff can be classified
in two categories:
a. a fraction, present in or bound to suspended solids, and
b. the dissolved fraction.
What is this suspended matter, present in the stormwater runoff, made
up of?
First of all, of soil particles (clay and sand) and dust particles,
present on, in between or close to the pavement, before being picked
up and washed away by the runoff. This material is predominantly inor-
ganic (mineral) by nature.
Organic by nature are leaves, grass cuttings and, more significant,
animal faeces (in particular of dogs), which also contribute to the
suspended solids in stormwater runoff.
In the Bastion basin, in 1983 about two-thir6s of the discharged sus-
pended solids were inorganic-mineral- and one-third organic by nature.
Both fractions and especially the smaller particles in these fractions
have a large binding capacity for substances that are in the first
instance entrained by the runoff in dissolved form. As a result of this,
the loading of the discharged solids with the pollutants can be much
higher than that of the original particles. As a considerable part of
the polluted solids will settle readily in the receiving surface
water, water (and sediment) quality problems associated with the solids
discharge are expected to be confined to the vicinity of the sewer out-
lets.
As was anticipated the suspended solids content of the stormwater run
off is strongly (corlrelated to the maximum precipitation intensity
occurring in the course of a runoff event. For, this intensity deter-
mines the force with which particles can be loosened from the surface
86

on which they were present before the event. Figure 3 exemplifies this
relationship for the mineral suspended solids concentrations in both
Dutch basins. The lines and correlation coefficients in figure 3 refer
to a quadratic increase of solids concentration with precipitation in-
tensity, which gave a better fit to the data set than a linear rela-
tionship.
As it turned out, the solids concentrations correlate even better with
maximum runoff intensity than with maximum precipitation intensity.
Apparently, the runoff intensity describes more closely the loosening
of particles that takes place not only on streets, sidewalks and roofs,
but also in gully pots and in sewer pipes.
As summer periods generally comprise higher precipitation and runoff
intensities than winter periods, in summer higher solids concentrations
are found. A large number of pollutants is, at least partly, bound to
solid particles. Therefore, in summer stormwater runoff is more pollu-
ted than in winter for a number of constituents: this is illustrated in
table 3. Of course, other factors than runoff intensities are also
responsible for seasonal changes. The seasonal change in water tempe-
rature for instance will influence rates of biological processes and,
as a result of that, variables like BOD and total Kjeldahl-N. Table 3
includes also chloride as a constituent which is not bound to the sus-
pended solids. Chlorids concentrations are relatively high in winter,
due to the application of raod salt for de-icing purposes (highest con-
centration determined: 740 mg/l).

CORRELATIONCOEFF.(R) NO OF MEASUREM. BASTION .854 64 HEERHUGOW. .771 38
MINERAL SUSP. SOLIDS
(MG/L)
0 2 4 6 8 1 Q
MAXIMUM PRECIPITATION INTENSITY (MM/15 MIN)
Figure 3 Mineral suspended solids in stormwater runoff and maximum
precipitation intensity

Table 3 Water quality of stormwater runoff (Bastion): seasonal fluc-
tuations and relation with suspended solids. All units: mg/l;
exceptfaecal coliforms: counts/100 m1
Constituent
Mineral suspended solids
BOD
COD
Total-P
Total Kjeldahl-N
Total lead
Total zinc
Total copper
Faecal coliforms
Chloride
average concentration
summer
31
3.7
25
0.54
2.2
0.10
0.41
0.011
8,700
24
winter
9
2.3
16
0.41
1.6
0.06
0.46
0.009
4,500
65
* correlation coefficient of linear regression with total suspended solids
3.3.3 Oxygen demanding matter
As table 3 indicates, the BOD of the stormwater runoff is fairly low
in summer too. Therefore no direct problems with respect to the oxygen
balance of receiving waters are to be expected, the more so as the
stormwater runoff generally contains a sufficient amount of oxygen.
A fairly good relation was established between BOD and COD (figure 4).
A COD/BOD ratio of5 follows from theregression equation, indicating a
fairly low biodegradability of the organic matter in the runoff. Only
a minor part of COD appears to be unrelated to BOD, this fraction
possibly concerns oxidizable inorganic matter.

COD
BASTION EQUATION: COD=5.17 BOD + 4.72 CORRELATIONCOEFFICIENT= .806 NO OF MEASUREMENTS= 135
Figure 4 Relation between BOD and COD in the stormwater runoff
(Bastion basin)
3.3.4 Nutrients
The nutrient concentrations in the stormwater runoff are rather high.
The phosphorus concentrations in particular do not meet Dutch standards,
devised to control eutrophication in receiving water. Conceivable
sources of nutrients are:
1. precipitation.
In particular for ammonium and nitrate nitrogen, the precipitation
is one of the prime sources, as the concentrations in the precipi-
tation (1.0 and 0.8 mg N/1, respectively) do not differ too much
from the concentrations in the stormwater runoff (1.15 and 1.4 mg N/1,

respectively). The organic N and total-P concentrations in the pre-
cipitation however are that low (0.05 and 0.06 mg/l respectively)
that their impact on stormwater runoff quality is negligible.
2. entrainment of particles by the runoff.
The entrainment of particles by the runoff results in an emission of
nutrients in particulate form. In the Bastion basin, two-thirds of
the phosphorus and one fourth of the nitrogen is discharged in par-
ticulate form. Particles contributing a lot of nutrients are organics,
in particular animal faeces.
In table 4, the particulate P- and N-emissions in the runoff from the
Bastion basin are compared with an estimate of the P- and N-runoff
from fertilized agricultural soils in the Netherlands. This estimate
is based on the assumptions that 1% of the manure produced and 0%
of the fertilizers applied run off. It appears that the P- and N-
runoff in urban areas like the Bastion is higher than in agricultural
areas !
Table 4 Phosporus and nitrogen runoff
Runoff (kg/ha,yr)
P N
Residential area (Bastion ) 1.2 3.1
Estimate for agricultural areas 0.6 2.2
3. mineralization/dry deposition.
In contrast with the first two processes, mineralization and dry
deposition take place in the periods in between runoff events.
They produce dissolved nutrients: orthophosphate, ammonium- and
nitrate-nitrogen. As a result, the concentrations of those consti-
tuents tend to increase with increasing dry weather period. This is
illustrated in figure 5 for ammonium nitrogen.
For orthophosphate, mineralization (in sewer pipes and, in particular
gully pots) appears to be the most significant process, while for the
nitrogen compounds dry deposition is equally important.

BASTION
N-NH4 CORRElATlONCOEFFlClENT (R)= .688
O W L ) NO OF MEASUREMENTS =l08
Figure 5 Ammonium in stormwater runoff as a function of dry weather
period (Bastion basin)
It is to be expected that the dissolved nutrients, produced by these
processes and in particular by the mineralization in gullly pots, are
discharged with the first part of the stormwater runoff following a
dry period. This "first flush" phenomenon was indeed observed in the
Bastion basin (Uunk, 1984).
3.3.5 BacterioZogicaZ contamination
That runoff of manure-like material plays a significant role is confir-
med by the bacteriological contamination of the stormwater runoff. As
9 2

mentioned before, this cannot be ascribed to wastewater entrance into
the storm sewers. For the Bastion basin, the absence of wastewater en-
tries was a.0. ascertained in a storage experiment during which no
change of water levels could be observed in the sewer system while no
stormwater entered and discharge was preented.
That the bacteriological contamination is of animal origin could be as-
certained for the Bastion basin by the high density of faecal strepto-
cocci that was found in the stormwater runoff. It is reported (Olivieri,
1977) that faecal coliform (FC)/faecal streptococci (FS) ratios below
0.7 indicate an animal origin of bacteriological contamination. In the
Bastion basin, the FC/FS ratio is generally below 0.6.
Incidentally, salmonella's could be detected in the stormwater runoff
so that real health risks are conceivable in case of intensive contact
with this water.
3.3.6 Heavy metals
In table 5, heavy metal concentrations in the runoff from both basins
are compared with Dutch heavy metal standards for surface waters and
heavy metal concentrations in precipitation (in the Bastion basin). As
discussed before, the runoff from the Heerhugowaard basin shows low
heavy metal concentratioils. The runoff from the Bastion basin shows low
copper and chromium concentrations and not too high cadmium concentra-
tions. The lead concentrations, though low when compared to the situation
abroad, are high when compared to the Dutch surface water standard for
lead. The dry deposition of lead, originating from local exhaust emis-
sions, appears to be the main source of lead in the Bastion area.
The zinc concentrations in the Bastion runoff are high. Corrosion of
zinked fences that abound in the basin is suspected to be the main source
of zinc. At the moment, experiments are carried out to quantify the
emissions from the source.
The precipitation may be the main source of copper and cadmium in the
Bastion basin and a significant source of lead and zinc.

Table 5 Heavy metal concentrations in stormwater runoff and precipita-
tion and according to surface water standards (all concentra-
tions in mg/m3 )
Metal
Lead
Zinc
Copper
Chromium
Cadmium
Nickel
Mercury
Maximum allowable
surface water
concentration
50
200
50
50
2.5
50
0.5
Average concentrations
precipitation stormwater runoff
Bastion Heerhugowaard
16 54 6
116 430 85
8 10 9
5 11 7
0.6 0.8 0.2
- 4
- - 0.1
The zinc, originating from precipitation and from corrosion, is in a
dissolved state, when transported by the stormwater runoff.
In comparison with zinc,lead is adsorbed readily onto particles. As a
result, a relatively large part of the lead in the stormwater runoff is
associated with the suspended solids and only a minor fraction is in a
dissolved state. In figure 6, the presence of lead and zinc in the storm-
water runoff from the Bastion basin is related to suspended solids con-
centrations. The slopes of the regression lines indicate the lead and
zinc contents of the suspended matter. These are that high that for in-
stance Dutch standards for the quality of sewage sludge to be applied in
agriculture are violated.

BASTION
ZINC
LEAD
CORRELATIONCOEF.(R) NO OF MEASUREM.
.715 68
.9 1 1 60
0 5 0 108 150 2 0 0 250
SUSPENDED SOLIDS (MG/L)
Figure 6 Lead and zinc in stormwater runoff in relation to suspended
solids content (Bastion basin)
3.3.7 Not (easily) biodegradabZe organics
Finally some comments on the presence of non or not easily biodegra-
dable organic compounds in the stormwater runoff.
The stormwater runoff contains a considerable amount of mineral oil.
In the stormwater runoff from the Bastion basin, an average oil concen-
tration of 1.4 mg/l was established. The oil content of the stormwater
runoff may be somewhat underestimated. Sampling took either place in

plastic containers (automatic sampling), resulting in possible losses
to the container walls, or in glass containers. Sampling in glass con-
tainers was performed by hand, generally near the end of the storm
event, when the runoff was relatively clean. It appears that oil spills
from parked cars and dumping waste motor oil in gully pots are the
main sources of mineral oil.
Polycyclic aromatic hydrocarbons have also been detected in rather high
concentrations in the runoff from the Bastion basin. The median total-
concentration of the "Borneff six" amounted to 0.5 pg/l, i.e. five
times the relevant Dutch standard for surface waters. The exhaust emis-
sions by the motorised traffic appear to be responsible for this excee-
dance. Of the remaining micropollutants examined, only pentachloorphenol
and lindane turned out to be significant. These two compounds appear to
be omnipresent in the aquatic environment through, so that possibly non-
specific sources are responsible for the concentrations observed.
All sampling for organic micropollutants and for salmonellae took place
by hand (in glass containers) near the end of the runoff events.
4 CONTROL OF STORMWATER RUNOFF POLLUTION
As it appears, stormwater runoff can be polluted to such an extent that
measures control the emission of pollutants may be advisable. As indi-
cated before, the consequences for the receiving surface water have
to determine the extent to which measures are opportune. Below, some of
the most important measures that can be considered are summarized. The
following categories can be distinguished:
1. "non-specific" measures, like the abatement of air pollution, which
may result in reduction of the emissions of heavy metals and of or-
ganic micropollutants;
2. local regulations, like regulations to oblige dog-owners to keep
their pet's faeces from certain public grounds or regulations to
penalize dumping of wastes in gully pots of storm sewers and/or in
surface water;
3. measures during the (re)construction of a sewer system like
- the prevention of false connection, a.0. by the application of 96

different materials for stormwater and wastewater sewers,
- maximizing storage and infiltration capacity in the drainage area
to reduce runoff (intensity),
- locating discharge points in such a way that negative effects on receiving water are minimized,
- using, if available, water of good quality to flush surface waters that receive stormwater runoff,
- disconnecting polluted surfaces like car-parks, markets and main
roads from storm sewers,
- the application of end-of-pipe treatment facilities like retention
and detention basins;
4. maintenance and control measures, like
- street sweeping,
- cleansing gully pots,
- other sewer maintance and control activities, - controlling whether false connections have been illegally;
5. public information and education.
5 CONCLUSIONS
1. Stormwater runoff can be polluted to some degree, in particular with
respect to faecal bacteria. lead and zinc, mineral oil and certain
polycyclic aromatic hydrocarbons.
The emission of nutrients, in particular of phosphorus, can add
significantly to the eutrophication of receiving surface waters.
2. If, and if so to what extent, measures to control the emission of
pollutants associated with the stormwater runoff are necessary,
depends on the consequences of this pollution for receiving surface
water. Investigations into these consequences are needed.
3. Significant measures to control stormwater runoff pollution are a.0.:
- the abatement of air pollution; - the prevention of false connections; - control of dumping of wastes; - reduction of runoff (quantity and intensity);
9 7

- d i s c o n n e c t i n g p o l l u t e d s u r f a c e s f rom s t o r m s e w e r s ;
- p u b l i c i n f o r m a t i o n and e d u c a t i o n .
REFERENCES
BRUNNER, P.G., 1975. Die Verschmutzung d e s Regenwasse rab f lus ses i m
T r e n n v e r f a h r e n , D i s s . , Miinchen
LINDHOLM, O., P. BALMER, 1978. P o l l u t i o n i n s t o r m r u n o f f and combined
sewer o v e r f l o w s , Proc . I n t . Conf. on u rban s t o r m d r a i n a g e ,
Southampton
MANCE, G . , M.M.J . HARMAN, 1978. The q u a l i t y o f u rban s to rmwate r r u n o f f ,
Proc . I n t . c o n f . on u r b a n s t o r m d r a i n a g e , Southampton
NELANEN, N., 1981. Q u a l i t y o f r u n o f f wa te r i n u r b a n a r e a s , Pub l . 42 o f
t h e Water Research I n s t i t u t e , H e l s i n k i
ROBERTS, P.V., L. DAUBER, B. NOVAK und J . ZOBRIST, 1979. S c h m u t z s t o f f e
i m Regenwasser e i n e r ~ t a d t i s c h e n T r e n n k a n a l i s a t i o n , i n S t u t t g a r t e r
B e r i c h t e z u r S ied lungswasserwi r t schaf t , 64 , p. 125-145
U.S. Environmental P r o t e c t i o n Agency, 1983. R e s u l t s o f t h e Nat ionwide
Urban Runoff Program, volume I - F i n a l Repor t , Washington
UUNK, E.J.B., 1983. P o l l u t i o n i n u r b a n r u n o f f , C o n t r i b u t i o n t o t h e
MAB-5 Workshop on Land u s e i m p a c t s on a q u a t i c s y s t e m s , Budapest
UUNK, E.J.B., 1984. De v u i l u i t w o r p van r e g e n w a t e r r i o l e n e n hun i n v l o e d
op h e t o p p e r v l a k t e w a t e r ; d e e e r s t e r e s u l t a t e n van e e n onde rzoek i n
L e l y s t a d , H20 (171 , p. 57-64
VEN, F.H.M. V A N DE, 1982. Moni to r ing wa te r q u a n t i t y and wa te r q u a l i t y
i n an u rban b a s i n . I n : Advances i n hydrometry ( p r o c e e d i n g s o f t h e
Exe te r symposium), IAHS-publ. no. 13Q
WEEKS, C.R., 1981. P o l l u t i o n i n u rban s to rmwate r r u n o f f , Proc . 2nd
I n t e r n Conf. on u rban s t o r m d r a i n a g e , Urbana

PCLLUTION EMISSION FROM COMBINED SEWER SYSTEMS;
A FULL SCALE INVESTIGATIOW PROGFUXNMF:
D. V a t
ABSTRACT
A full scale investigation and monitoring programme was started in 1981
to gain better insight into the processes that influence pollution emis-
sion from sewer systems.
In this paper, the first results are presented of a regression analysis
of collected data in two catchment dreas served by combined sewer sys-
tems.
The analysis shows that maximum rainfall intensity and seasonal varia-
tion in the run-off process greatly influence the amount of sewage
sludge in the stormwater discharges.
The COD, P-tot and Pb concentrations in the stormwater discharges show
a good correlation with the corresponding concentration of the dry resi-
due of the non solved constituents.
Cost-effective rehabilitation measures and maintenance programmes to
reduce pollution emission from combined sewer systems should be more
directly focused on the reduction of sewage sludge discharges.

1 INTRODUCTION
Stormwater discharges from sewer systems are a major source of surface
water pollution.
From a technical and economic point of view it is hardly possible to
eliminate these diffuse pollution sources entirely.
One of the problems involved is the difficulty in demonstrating the cost-
effectiveness of rehabilitation measures. Consequently, it is hard to
formulate a well grounded policy aimed at a responsible reduction of
such diffuse discharges. The situation sketched applies in particular to
the emission from combined sewer systems.
In the 70's attempts were made to analyse the emission problems of sewer
systems by means of mathematical simulation models (Wiggers, 1978; Vat
1978). However the lack of data from operational situations for verifi-
cation restricted the value of these models.
In 1978, the Research Organization of the Water Authorities in the
Netherlands (STORA) took the initiative to carry out a full scale inves-
tigation and monitoring programme on the emissions from combined and
separate sewer systems. The full-scale monitoring itself was commenced
in 1981. The programme is being implemented by DHV Consulting Engineers
BV. The sampling programme is being carried out by members of the STORA.
In 1983, a supplementary investigation programme was set up, in coopera-
tion with the Ministry of Housing, Planning and the Environment, to study
the effects of pollution emissions from sewer systems on the quality of
the receiving surface water.
The first results of the current investigation programme with respect to
the emission from combined sewer systems, were presented in Copenhagen
in 1984 (Bakker, 1984).
The present contribution provides a further analysis of the collected
data up to December 1984.
The monitoring programme will continue until the end of 1986.
It will be clear that the conclusions presented in this paper have a pre-
liminary character.

2 AIM AND SET-UP OF THE PROGRAMME
2.1 Aim of the programme
The aim of the investigation and monitoring programme is to gain more
insight into the relative importance of the major factors affecting pol-
lution emission from sewer systems. This will allow better quantification
of the cost-effectiveness of rehabilitation measures. Development of emis-
sion models based on monitoring of operational situations will permit the
knowledge obtained to be used for water quality management.
2.2 Set-up of the investigation programme
With respect to the pollution load of stormwater discharges various pro-
cesses and pollution sources can be distinguished. The contribution to
the final pollution emission depends on factors which are typical for
the process considered. These processes and the major pollution sources
are shown schematically in Figure 1 .
Air pollution
Surface run-off Road drainage unpaved surface
Processes in sewer system
It-- Wastesater 4
Pollution emission
FIG. 1 PROCESSES AND POLLUTION SOURCES

The processes and pollution sources can also be described by parameters.
The aim of the study is to examine the relative importance of the major
parameters. From a point of view of pollution emission these parameters
can be seen as "decisive factors". Some of these decisive factors are
presented in Table 1.
A distinction can be made between precipitation data and area data. The
area data are of particular importance for the transferability of the
investigation results to other catchment areas.
Table 1 Decisive Factors
precipitation data area data
- rainfall intensity - size of the catchment - rainfall depth area
- rainfall duration - paved surface - dry weather period - storage capacity of the
sewer system
- capacity of the sewage pumping station
- dry weather flow - average terrain slopes - slopes of sewers
In the first stage of the project the most appropriate method to analyse
the results of the monitoring programme was studied. The results of this
study made it clear that all individual process components should not be
investigated separately (STORA Workshop, 1980).
The monitoring programme implemented concentrates on the registration of
the intensity and duration of precipitation (input) and the flow, dura-
tion and pollution of stormwater discharges (output). The various pro-
cesses contributing to the pollution load are not monitored in detail
but both input and output factors are studied by regression analyses.

2 . 3 Set-up of t he monitoring programme
After a period of prepara t ion i n which a prototype of t he recording and
sampling apparatus was developed and t e s t e d , t he monitoring programme was
s t a r t e d i n 1981. I t w i l l continue till the end of 1986 and covers s i x
catchment areas i n a l l .
An overview of t h e a reas monitored, types of sewer systems, t e r r a i n
s lopes and periods of monitoring is given i n Table 2.
Table 2 Overview of Catchments Areas Monitored
area type of t e r r a i n period of
sewer s lopes monitoring*
system
Loenen (g ld . ) combined moderate 1981-1985
Oosterhout combined f l a t 1982-1986
Heerhugowaard separa te f l a t 1984-1985
Bodegraven combined f l a t 1983-1986
Kerkrade combined s t eep 1983-1984
Amsterdam sepa ra t e f l a t 1984-1985
* The length of t he period of monitoring depends on the type of sewer
system and t h e frequency of stormwater discharges i n t o open water.
3 RESULTS OF THE MONITORING I N LOENEN AND OOSTERHOUT
3 . 1 Area data
The major area da ta from the monitoring areas Loenen and Oosterhout a r e
reproduced i n Table 3 .
A d i s t i n c t i o n i s made between:
- data t h a t cha rac t e r i ze the a rea - data t h a t cha rac t e r i ze the sewer system

Table 3 Data of the Areas Monitored
Decisive Loenen Oosterhout
Factor
Size of the catchment
area [ha] 56,5 22
Paved surface [ha] 15.8 11.6
Percentage paved
area [%l 28 5 3
Population 2050 2270
Average terrain slope moderate flat
Storage capacity of
the sewer system [mm] 5.7 5.3
Pump capacity*) [mm/h] 0.88 0.97
Theoretical overflow
frequency [per year] 9 9
+c) the dry weather flow not included
The theoretical average overflow frequency given in the table was cal-
culated with the standardized "Kuiper model", using the pointplot rain
data of De Bilt (Koot, 1967).
The fact that the theoretical overflow frequency for both systems is 9
is coincidental. It does however provide the possibility to examine
whether assessment of the pollution from combined sewer systems on basis
of the theoretical overflow frequency is reasonably reliable.
3.2 Overflow frequencies and run-off coefficients
Observed overflow frequencies and run-off coefficients were established
for both monitored areas on the basis of the measured precipitation and
overflow volumes. The overflow frequencies are given in Table 4.

Table 4 Theoretical and Observed Overflow Frequencies
area theoretical observed
overflow overflow
frequency frequency
[per year1 [per year1
Loenen
Oosterhout
It is noteworthy that in both cases, observed overflow frequencies are
higher than the theoretical average overflow frequency.
No firm conclusions can be drawn on a basis of the observed overflow
frequencies. Several aspects have to be taken into consideration such
as : - the monitoring period could have been relatively "wet" - the rainfall pattern in Loenen and Oosterhout may differ from that
in De Bilt - the sewer system (including pumping stations) may not have
functioned without breakdowns
- the performance of the "Kuiper model" for calculation of the theo-
retical overflow frequency
To study these aspects a separate project was started, primarily to study
the reliability of the "Kuiper model". In this project special attention
is given to the variations in the value of the run-off coefficient and
the distribution of precipitation across the Netherlands.
Figure 2 shows the calculated run-off coefficients per storm event plot-
ted against the month of occurrence.

0 L 8
0 2 4 6 8 1 0 1 2 MONTH
FIG. 2
These figures indicate a seasonal affect. The results have been used in
the further analysis of the emission data.
3.3 Emission data
The following data have been obtained from each overflow event by means
of registration, flow sampling and sample analysis:
- the discharge into surface water as a function of time - the pollution of the stormwater discharge expressed by the para-
meters BOD, COD, dry residue of the non solved constituents, P-tot,
N-Kj , Pb and Zn. The data were filed in data-bases after careful scrutiny.
These primary data have been used to calculate some characteristic para-
meters of the pollution emission and to perform the regression analysis
of precipitation data and emission data.

One of the characteristic parameters is the mean value of the average
pollution concentration per overflow.
These values are shown in Figure 3.
BOD COD Dry residue
F I G. 3 MEAN VALUE OF THE AVERAGE CONCENTRAT I ON
The mean values of the average concentrations of BOD, COD and the dry
residue for the two areas taken into consideration differ quite markedly.
In Loenen relatively high dry residues were found while in Oosterhout
the BOD mean value is relatively high.
This indicates that different processes may dominate in the two catchment
areas. The maximum values of the average concentrations per overflow for
both areas are given in Figure 4, in which the mean values from Figure 3
are included for comparison.

mg/l
2 4 0 0 4 W ~oenen 2 s 6
0 Oosterhout
1600 1 1 1200
800
400
BOD COD Dry residue
FIG. 4 MAXIMUM VALUE OF THE AVERFlGE CONCENTRATION
I t is remarkable t h a t i n Oosterhout t he maximum values f o r BOD and COD
devia te r e l a t i v e l y g rea t ly from the r e l a t ed mean values , i . e . 1:20 and
1:10 respect ive ly ins tead of 1:3 t o 1:5 f o r t he o the r po l lu t ion para-
meters.
The d i f ferences noted above can probably be a t t r i b u t e d t o the following
l o c a l circumstances.
Loenen
The r e l a t i v e l y high value of t he dry residue concentrat ion of t h e sewage
overflow i s mainly caused by the c h a r a c t e r i s t i c s of t he area (see
Table 3 ) .
Loenen is located i n a h i l l y area and the catchment area monitored has a
r e l a t i v e l y high percentage of unpaved surface .
During heavy r a i n f a l l , anorganic ma te r i a l w i l l be washed down from the
unpaved surfaces , r e su l t i ng i n high dry residue values .

Oosterhout
The high peak values of the BOD and COD concentrations are caused by
sludge deposits in the sewer to the overflow device.
These deposits are the result of wastewater discharges from some ten
houses that are directly connected to the overflow sewer main, in which
velocities are very limited during dry weather flow. Further analysis
showed that the high concentrations occurred during two showers with
relatively high rainfall intensities.
In the monitoring programme extra attention is now being given to these
sludge deposits.
4 REGRESSION ANALYSIS RESULTS
4.1 Methodology
The aim of the regression analysis is to determine to what extent the
various decisive factors are related to the characteristic emission
parameters.
In the phase of the study under consideration, the relations between
various combinations of input and output parameters have been examined.
Two groups amongst those already studied are considered further, i.e.
relations between precipitation data and emission data and relations
between the various emission data.
4.2 Precipitation data and emission data
On the basis of the available data, a large number of relevant relations
were studied in general. It appeared from this study that there is a
clear relation between the maximum rainfall intensity and the average
concentration of some pollutants in the overflow water.
From the literature, it was to be expected that the run-off process on
paved and possibly unpaved surfaces affects the pollution emission.
As shown in 3.2, the seasonally dependent character of the run-off pro-
cess can be represented by the variation in the value of the run-off
coefficient.

MAX AVERAGE INFLOW INTENSITY (MM/30 MIN)
FIG. 5
6 0 0
4 0 0 - / -
.: zoo a .g' S - Y 0
0 2 0 0 4 0 0 6 0 0 a 0 0 I 0 0 0 1 2 0 0
U
d 5 a 0 0 - 1
600 -,
1 -/ 4 0 0 ; l
2 0 0 -j
0 8 1 , " I I ~ I I 0 ZOO 100 600 800 1000
ASERAGE DRY RESIDUE CONC (MC/L)
FIG. 7
MAX. AVERAGE INFLOW I N T E N S m (MM/30 MIN)
FIG. 6
AVERAGE DRY RESIDUE CONC (MC/L)
FIG. 8
i 0 0 , -- . L W
1 0 0 -
:oo - / 5 " /
/To. I
E
0 2 0 0 4 0 0 600 BOO 1 0 0 0 1 2 0 0
'50 - U
5 roo - U
0
ALERAGE DRY RESIDUE CONC (MG/L)
FIG. 9

To study the influence of both the maximum rainfall intensity and the
seasonal variation in the run-off coefficient on a specific emission the
concept of "the maximum value of the average inflow intensity" has been
introduced.
Haximum value of the average inflow intensity (m/30 min.) = maximum
value of the average rainfall intensity during a period of 30 minutes X
the average run-off coefficient during the storm event.
In Figures 5 and 6, the average concentrations of the COD and the dry
residue in the monitoring areas Loenen and Oosterhout have been plotted
against the corresponding maximum value of the average inflow intensity.
It appears from the calculated correlation coefficients that there is a
clear relation.
If it is assumed that the average dry residue concentration is a good
representation of the amount of sludge that is stirred up and discharged,
it is of major importance that this complicated phenomenon can evidently
be described by the maximum value of the average inflow intensity.
4.3 Comparative emission data
To increase the insight into the major processes and the relative import-
ance of the decisive factors, a search for relations between the average
concentrations of the various pollution parameters was also undertaken.
In connection with the anticipated effect of the stirring up of sewage
sludge on the pollution emission, the relation between the average dry
residue concentration and several other average concentrations were
examined.
These relations for the average concentrations of COD, P-tot, Pb for
both measuring zones are shown in Figures 7, 8, and 9.
It appears from these figures that the concentrations of COD, P-tot and
Pb show a good correlation with the average dry residue concentration.
This means that these pollution components are bound to a major extent
to the sewage sludge that is discharged during an overflow.
The remaining pollution components, particularly N-Kj and Zn, do not
have such a clear connection with the sewage sludge. These substances
are evidently better dissolved in the sewage.

5 CONCLUSIONS
5.1 Consequences for model building
The importance that had already been attached to the stirring up of the
sewage sludge was confirmed by the results of the monitoring and analyses.
There proved to be a clear correlation between the amount of overflow
sewage sludge expressed in the average dry residue concentration and the
introduced concept of the "maximum value of the average inflow intensity".
It also appeared that the sewage sludge is not of equal consequence for
all pollution components. In preparing the emission models, the sludge
bound pollution and the pollution from dissolved substances must be given
separate attention.
5.2 Perspectives for design and maintenance
The results now available provide grounds for the conclusion that it is
not only the general design of the sewer system (storage and pump capa-
city) that influences the pollution emission, but also the detailed de-
sign and the maintenance situation.
Both quantitative and qualitative aspects of the emissions appear to be
incidentally strongly influenced by pump breakdowns, extreme sludge
deposits, etc.
It may be said that current methods of evaluating sewer systems have
serious limitations.
Major decisive factors, such as maximum rainfall intensity and seasonally
varying values of run-off coefficients, are not taken into account.
Moreover, further distinctions will have to be made between the various
pollution components, such as oxygen-binding matter (BOD, COD), eutro-
phicating matter (P-tot, N-Kj) and heavy metals (Pb and Zn).
It is of great importance that more attention is given to the sewage
sludge. Besides the avoidance of sludge deposits by means of a good
detailed design, efficient sewer flushing programmes based on sewer
inspection can contribute. Allied measures, aimed at removing the
settleable sludge from the sewage overflow, can also produce a notable
improvement. Settling basins and swirl separators seem to be the most
promising devices under Dutch circumstances.

The recent development of new technologies can act as an important
stimulus in this field.
It is the task of policy makers to give these new technologies a chance.
REFERENCES
BAKKER, K. and V. WIERINGEN, H., 1984. The influence of rainfall charac-
teristics on the pollution emission. IAWPRC Wat. Sci. Techn. Vol. 16,
Copenhagen, pp. 285-295.
KOOT, A.C.J., 1967. The storage and the discharge capacities of sewerage
systems and the operating frequency of storm overflows: Dutch methods
of calculation.
Institution of Civil Engineers, Symposium on Storm Sewage Overflows,
page 135-141.
William Clowes and Sons Limited London.
VAT, D. and WIGGERS, J.B.M., 1978. Urban stormwater management: Dutch
practice in an international perspective.
Universite de Ligge Colloque International.
Traitement combin6 des eaux us6es domestiques et industrielles.
WIGGERS, J.B.M., 1978. In what way is water pollution influenced by
sewerage systems CHO/TNO.
Urbanization and water management. Proceedings of technical meeting 34.
EMISSION OF POLLUTION FROM SEWERAGE SYSTEMS.
Collected papers of the workshop held on 27 and 28 November 1980 and
published by STORA Rijswij k.


COItBINED SEWER OVERFLOW POLLUTION ABATEMENT
A.S . H o g e n d o o r n - R o o z e m o n d
ABSTRACT
The r e a l i z a t i o n o f e x t r a i n - l i n e s t o r a g e c a p a c i t y i n combined sewerage
sys tems f o r p o l l u t i o n emiss ion r e d u c t i o n purposes is d i s c u s s e d i n
r e l a t i o n t o t h e a p p l i c a t i o n of s p e c i a l combined sewer o v e r f l o w (CS01
d e v i c e s . Apart from o t h e r a d v a n t a g e s , it is e s t i m a t e d t h a t a p p l i c a t i o n
o f CSO-devices l e a d s t o more c o s t - e f f e c t i v e p o l l u t i o n aba tement . The
most promising CSO-devices f o r p r a c t i c a l a p p l i c a t i o n i n t h e Ne the r l ands
a r e b r i e f l y r ev iewed .
1 INTRODUCTION AND PROBLEM DEFINITION
I n s e v e r a l c o u n t r i e s i n Western Europe, amongst which Belgium and t h e
Ne the r l ands , t h e t h e o r e t i c a l , a v e r a g e o v e r f l o w f r e q u e n c y f i s used as
one o f t h e d e s i g n c r i t e r i a f o r combined sewer s y s t e m s . The f i s
c o n s i d e r e d a f u n c t i o n o f s t o r a g e volume i n t h e network and i n t e r c e p t o r
c a p a c i t y . Usua l ly t h e i n t e r c e p t o r c a p a c i t y is l i m i t e d on c o n s i d e r a t i o n s
o f sewage t r e a t m e n t p l a n t s i z e . Consequent ly , e x t r a i n - l i n e s t o r a g e
c a p a c i t y h a s t o be r e a l i z e d i n o r d e r t o meet t h e f c r i t e r i a , i . e .
o n l y f o r r e a s o n s o f s u r f a c e water q u a l i t y c o n t r o l .

It is doubtful, however, if extra in-line storage capacity is the most
cost-effective pollution abatement. In this paper an alternative
approach is proposed, based on the application of special CSO-devices
to reduce the overflowing pollution load where necessary. Seven types
of CSO-devices are listed, while the most promising devices for the
Dutch conditions will be briefly discussed. To illustrate some
features a hypothetical example is worked out, offering a rough
estimate of the financial consequences of these CSO-devices versus
extra in-line storage capacity.
2 IN-LINE STORAGE CAPACITY
The application of the fo as design criterion often leads to larger
diameter piping to obtain extra in-line storage capacity.
This measure, meant to reduce pollutants emission is not only costly,
but also has certain other disadvantages:
. It increases the residence time of the wastewater in the system,
thereby further degrading it 'S quality and increasing the
possibility of odour nuisance at the pumping stations or treatment
plant.
. It will occur more often that the system is partly filled when a
second rainfall event presents itself. The total storage volume is
not always available.
. During low flow conditions more sedimentation within the sewer
lines will occur.
The last mentioned factor is of great importance since the lions'
share of the pollution load caused by combined sewer overflows usually
consists of resuspended sludge deposits. This is due to the fact that
in flat area's the major part of the sewer network is situated below
the overflow level, in order to maximize storage volume. This results
in minimal sewer-line gradients and thus conditions favourable to
sedimentation.
In Table 1 the minimal shear stress necessary to prevent sedimentation
in sewers is compared with the near maximum values (sewer lines

completely filled) obtained for the indicated conditions, which are
representative for the situation in the Netherlands. It is clearly
indicated that in general self cleansing of these collection systems
is quite doubtful.
Table 1 Shear stress in completely filled sewer Lines, as compared
with the values necessary for self cleasing.
An increase in pipe diameters, with otherwise the same hydraulic
conditions, increases the probability of sedimentation. This is
markedly illustrated by Broeker (19841, who experimentally determined
the critical flow velocity needed for self cleansing of combined
sewers (Figure 1).
Figure 1
shear stress
(N/m2)
0.98-1.96
0.98-1.47
1.30
1.23
1.47
1.72
pipe
diameter
(mm)
200
300
400
500
600
700
l , , . . , , , , , , 200 600 1000 1400 fa00
SEWER DIAMETER mm)
Necessary for self cleansing 2-3.5
in combined sewerage system
gradient
1 : 500-250
1 : 750-500
1 :750
1 : 1000
1 : 1000
1 : 1000
Critical flow velocity necessary for self cleansing operation of combined sewers, as a function of sewer-line diameter (Broeker, 1984)

From the above mentioned it follows that sedimentation processes
within the sewers are favoured with increasing sewer diameters at
equal hydraulic loading. Therefore Berlamont and Smits ( 1984)
stipulate the possibility, that increased in-line storage capacity may
even have a negative effect on pollution emission.
3 COlBINED SEWER OVERFLOW DEVICES
A preliminary study on emission reducing combined sewer overflow
devices has recently been carried out within the framework of the
NORW, the Dutch National Research Programme concerning sewer system
design in relation to receiving water quality (VROM/NWRW, 1984;
Coppes, 1985).
Different types of devices were evaluated on the basis of direct
applicability under the typically Dutch conditions, as specified
earlier.
The devices considered were:
- physico chemical and biological treatment units
- special filters and (micro) strainers rewi wing, 1979)
- the helical bend separator (Sullivan, 1975)
- tea cup separator (Wilson, 1978)
- sedimentation tanks
- improved overflow chambers
- swirl concentrator.
The physico-chemical and biological treatment units as well as the
filters and strainers generally are not feasible, due to the low
overflow frequencies . The helical bend and tea cup separator are still in an initial phase
of development, while their construction is rather complicated.
Although further research is needed on many aspects of these often
newly developed devices, the swirl concentrator and the "improved
overflow chambers" were considered to offer the best perspectives,
besides the sedimentation tanks, which already are applied on a larger

scale. The improved overflow chambers have not yet outgrown their
developmental stage either, but the simplicity and low cost of these
devices make them attractive for practical application.
In the following the "improved overflow chambers" and the swirl
concentrator will briefly be reviewed. For further detailed
information the reader is referred to the publications by Coppes
(1985) and VROM/NWRW (1984). Sedimentation tanks will be discussed in
the paper presented by de Ruiter.
Four types of "improved overflow chambers" are distinguished, which
mainly have been developed in the United Kingdom:
- the stilling pond (Figure 2) (Nicoll, 1978; Halliwell, 1982;
Burrows, 1982)
- the high side weir, with longitudinal overflow weirs parallel to
the inflow (Figure 3)
- the shaft overflow, with rectangular and circular design shapes
(Figure 4) (Burrows et al., 1984)
- the vortex chamber with peripheral spill (Figure 5); the foul
outlet pipe is set in the centre of the chamber floor and the
overflow occurs over a weir formed over 50% of the peripheral wall.
A scumboard retains the floatables.
SCUM BOARD
Figure 2 Stilling pond overflow Figure 3 High side weir
These chambers all have in common that they are somewhat sensitive to
hydraulic overloading, their design capacity ranging from 40 -80
m3/m2 .h.

SCUM F L O A T ~ B L ~ S
INLET n, PIPE
PERIPHERAL
Figure 4 Shaft overflow Figure 5 Plan of the vortex chamber overflow with peripheral spill
Although no full scale experimental data are available, laboratory
experiments indicate removal efficiencies of 10 -35%, depending on the
inflow velocity, particle form, size and weight.
The stilling pond is the earliest developed device and already finds
practical application. It is, however, expected that the shaft
overflow will render higher removal efficiencies. The stilling pond
and the shaft type both have the disadvantage of a rather deep foul
outlet pipe.
The vortex chamber with peripheral spill is the latest development,
showing very promising test results, with a better performance than
the stilling ~ond of comparable volume. (Balmforth et al., 1984).
The swirl regulator-concentrator, finally, consists of a circular
shaped chamber with low tangential inflow and overflow over a central
circular weir plate. The device operates on the basis of the gentle
swirl action, which imparts liquid-solids seperation (Figure 6) (~ield
et al., 1977). The dry weather flows or the low volume foul
concentrate is diverted through a channel in the floor into a bottom
orifice discharging to an interceptor sewer.
The swirl has successfully been applied and tested in the United
States, Japan and Norway. In situ measurements during 11 overflow
events rendered a removal efficiency of 51 - 82% of the BOD load and 33 - 82% of the suspended solids. (~ield et al., 1977).

These data agree with Lygrenls (1980) findings in Norway, showing
removal efficiencies of 32 - 78% of the settleable solids at near
design capacity.
Figure 6
Isometric view of the swirl concentrator (Field et al., 1977) 1 = tangential inflow 2 = overflow 3 = foul sewer outlet 4 = flow deflector 5 = overflow weir and weir
plate 6 = floatables trap
The "improved overflow chambers" as well as the swirl concentrator
have modest space requirements, contain no moving parts, nor do they
need any external energy supply. The necessary maintance is therefore
quite limited.
4 FEASIBILITY
The differences between traditional sewer design with extra in-line
storage capacity and the alternative approach, where CSO-devices are
applied, are illustrated by an example. The following features are
considered: theoretical overflow frequencies, pollutional loads and
cost estimation.
The arbitrary situation is a catchment of 50 ha impervious area with 5
overflow sites and 10.000 inhabitants.
An effective in-line storage capacity of 3500 m3 (7 mm) is assumed for
the traditional design and 2500 m3 (5 mm) for the alternative, both
with a pumping overcapacity of 350 m3/h (0.7 mm/h).

The calculations have been made by means of a sewerage pollution
emission model (RAINY DAISY) using a sequence of 72 years of rainfall
data (weather station De Bilt) as input.
A runoff cosfficient of 1.0 is assumed, while the mixing,
sedimentation and resuspension processes are simulated. Mineralization
processes occuring within the sewer lines have not been taken into
account, although they may be quite relevant. (Hogendoorn-Roozemond,
1984). The results emanating from the simulation model should
therefore be used for comparison purposes only, and do not necessarily
represent the actual pollution loads of such a catchment area, the
more so as many factors are site specific.
First of all some features are considered of the 7 mm storage system
versus the 5 mm system without CSO-devices.
Figure 7 shows the reduction in the overflow frequency by the 2 mm
extra storage capacity. In both cases, however, a marked dispersion is
discernible. This means that the fo value relevant: to this situation
can regularly be exceeded.
Figure 7 Frequency distribution of the annual overflow frequency for the indicated catchment area, with a storage volume (S) of 5 and 7 mm respectively. I = Interceptor capacity

In Figure 8 the individual overflow events are classified according to
their pollutant load categories. It shows, that most of the extra
overflow events occur in the lower pollution-load region. At the
overflows with the higher pollution loads, the extra storage capacity
has little effect, while in reality these overflows have the most
pronounced environmental impacts.
Figure 8
Frequency distribution of individual - overflpw BOD- loads for the indicated catchment area, with a storage volume (S) of 7
KG BOD ) and 5 m respectively.
When a gradual increase in sedimentation with increasing sewer line
diameter is assumed, the average annual pollutant load as a function
of storage volume is presented in Figure 9.
STORAGE VOLUME (mm))
Figure 9
Average annual pollutant load as a function of storage volume

The difference in average annual BOD load between the 5 and 7 mm
storage alternatives amounts to a mere 20%. When this "sedimentation"
effect is omitted the difference in annual load amounts to a maximum
of 40%. This value, analogous to the findings of Wiggers (19771, is to
be considered as the fictitious maximum.
The overall effect of CSO-devices will depend on the design rainfall
intensity and the design hydraulic loading of the device.
Assuming the values summarized in Table 2, rough estimates of the
costs pertaining to the two systems have been made and are related to
overall removal efficiencies.
Table 2 Assumptions on removal efficiencies applied in feasibility
calculations
Based on rough cost estimates the financial consequences of the
traditional (extra 2 mm in-line storage capacity) and alternative
(pollution reduction by means of CSO-devices) approach are compared in
Figure 10a and b. Figure 1Oa refers to the "improved overflow
chambers", while Figure lob illustrates the situation for application
of the swirl concentrator.
All the possible combinations in CSO-device application are to be
found within the shaded area's: i.e. high and low hydraulic loading,
high and low design rainfall intensity, number of overflow devices
applied ranging from 1 - 5.
device
improved overflow
chambers
swirl concentrator
-
loading
(m3/m2.h)
40
80
60
150
removal efficiency ( % )
at design rainfall
intensity
40 l/s.ha
2 5
20
45
3 0
60 l/s.ha
3 5
30
6 0
45

REMOVAL EFFICIENCY (96))
A rooo- A 1000- - 0 0
2 I: 800- i; - a0
g eoo- 0
- 0
EXTRA
lHLINE IMPROVED
EXTRA n
400-
200-
rob
I I STORAGE
SWIRL OVERFLOW
5 0 INPERVIOUS AREA
2 n STORAGE OVERFLOW
,
REMOVAL EFFCTNCY (U))
" 800-
i; - m
g 800- 0
Figure 10 Cost estimation of indicated pollution abatement measures as a function of overall removal efficiency
W DEVICES
Although Figure 10 is based on many assumptions and is only partly
derived from actual measurements in the field, it distinctly
illustrates the promising perspectives CSO-devices offer in the
optimization of combined sewerage systems.
It is for this reason that an extensive research programme in the
Netherlands has started on this subject. Two swirl overflow devices
have already been built and a 3 year automated monitoring programme
will soon commence at the location "Goes". In addition, a thorough
study of several types of the "improved overflow chambers" is
presently being carried out (v~oM/NWRW,1985). Field studies are
included for the near future.
5 CONCLUSIONS
Besides sedimentation tanks, the improved overflow chambers and the
swirl concentrator promise to be handy tools in the optimization of
combined sewerage system design in the Netherlands. They therefore
have been selected for further research and field monitoring.
Application of these CSO-devices is estimated to be more cost
effective than the realization of extra in-line storage capacity.

Additional major advantages are:
- limited residence time of waste water in the sewerage system
- effective use of the available storage volume
- reduced sedimentation within the sewer lines
- greater design flexibility and the possibility of selective source
control.
It is believed that application of these CSO-devices enables a more
differentiated approach in sewerage system design, in which the
receiving surface water, with all it's different functions and
capacities, can play a more central role.
REFERENCES
BALMFORTH, D.J., LEA, S.J. and SARGINSON, F.J., 1984. Development of a
vortex storm sewage overflow with peripheral spill. In:
Proceedings of 3rd International Conference on Urban Drainage.
Ed: Balmer, P. et al., Giiteborg.
BERLAMONT, J. and SMITS, M., 1984. The overflow frequency as a
criterion for the design of combined sewer systems. In:
Proceedings of 3rd International Conference on Urban Drainage.
Ed. Balmer, P. et al., Gb'teborg.
BURROWS, R., ALI, K.H.M. and PATEMAN, D.R., 1984. A circular shaft
overflow chamber for large interceptor schemes. In: Proceedings
of 3rd International Conference on Urban Drainage. Ed: Balmer, P.
et al., G8teborg.
BROEKER, H.W., 1984. Impact of depositions on sewer operation. In:
Proceedings of 3rd International Conference on Urban Drainage.
Ed: Balmer, P. et al., Gb'teborg.
COPPES, J.G.A.,1985. Vuiluitworpreducerende voorzieningen en afvoer-
regulerende middelen in rioolstelsels (in ~utch). H20 No. 8.
DREHWING, F.J., et al., 1979. Disinfection/treatment of combined sewer
overflows. Cincinnati, U.S. Environmental Protection Agency,
1979. Report No. EPA-600/2-79-134.

FIELD, R.I., MOFFA, P.E. and MAC ARTHUR, D.A., 1977.
Treatability determinations for a prototype swirl combined sewer
overflow regulator/solid-seperator.
Progress in Water Technology No. 6, p. 81.
FIELD, R., 1975.
The dual functioning swirl combined sewer overflow regulator and
concentrator. Water Research (1975) No. 516, p. 507.
HALLIWELL, A.R. and SAUL, A.J., 1980. The use of hydraulic models to.
examine the performance of storm sewage overflows. Proceedings
Institution Civil Engineers (1980) Part 2. June, p. 245.
HOGENDOORN-ROOZEMOND, A.S., 1984. Sedimentation, mineralization and
resuspension of sludge in a sewerage system. In: Proceedings
IAWPRC Conference Amsterdam, September 1984, Pergamon Press, New
York.
LYGREN, E., 1980. Hvirveloverldp Avskilling ar sedimenterbart
materiale og flytestoffer i overldpsvann (in Norwegian). Norsk
institut for vannforskning, Oslo.
NICOLL, E.H. and MC.GILLIVRAY, R., 1978. Report of the working party
on Storm sewage cotla land): A review. Water Pollution Control
(1978) No. 2, p. 157.
SULLIVAN, R.H. et al., 1975. The helical bend combined sewer overflow
regulator. Cincinnati, U.S. Environmental Protection Agency,
1975. Report No. EPA-60012-75-062.
VROMINWRW, 1985. Literature review on improved overflow devices (In
~utch). BKH consulting engineers, The Hague.
VROMINWRW, 1984. Report on review and selection of emission reducing
devices for sewer systems (in Dutch) Witteveen+Bos, consulting
engineers.
WIGGERS, J.B.M., 1977. In what way is water pollution influenced by
sewerage systems? In: Urbanization and water management. CHOITNO
Proceedings and informations no. 24.
WILSON, G.E. et al., 1978. Hydraulic design of the stormwater Teacup.
Sacramento, Eutek systems, 1978.


THE E F F E C T O F S T O M G E S E T T L I N G TANKS ON POLL.UTION E E V S S I O N
FIIOM COMBINED SEWER SYSTEPIS
D. t e n H o v e , F4.A. d e R u i t e r and D. V a t
ABSTRACT
One o f t h e p o s s i b i l i t i e s f o r r e d u c i n g p o l l u t i o n o f s u r f a c e w a t e r s by
o v e r f l o w s from combined sewer s y s t e m s i s t h e u s e o f s t o r a g e s e t t l i n g
t a n k s .
These t a n k s d e t a i n sewage s l u d g e t h a t is s t i r r e d up by heavy r a i n f a l l .
I n a d d i t i o n p a r t o f t h e sewage is r e t a i n e d i n t h e t a n k s , pumped back
t o t h e sewer sys t em w i t h t h e s e t t l e d sewage s l u d g e when r a i n f a l l h a s
s t o p p e d and d i s c h a r g e d t o t h e sewage t r e a t m e n t p l a n t .
I n The N e t h e r l a n d s , s t o r a g e s e t t l i n g t a n k s have been h u i l t a t major
o v e r f l o w p o i n t s a t s e v e r a l l o c a t i o n s .
However, t h e r e h a s a lways been some doub t a b o u t t h e e x t e n t t o which
compos i t ion o f o v e r f l o w s w a s i n f l u e n c e d . T h e r e f o r e two such t a n k s were
mon i to red i n t h e p e r i o d 1983-1985. One was n e a r t h e c i t y o f Kerkrade i n
a h i l l y a r e a i n s o u t h e r n N e t h e r l a n d , t h e o t h e r n e a r Amers foor t , a town
i n a f a i r l y f l a t a r e a i n t h e c e n t r e o f t h e c o u n t r y .
From t h e measurements made, it a p p e a r e d t h a t t h e t a n k s g a v e a r e d u c t i o n
of a b o u t 50% o f t h e chemica l oxygen demand (COD) o f t h e o v e r f l o w ,
p a r t i c u l a r l y due t o s e t t l e m e n t , w h i l e t h e combined e f f e c t o f s t o r a g e
and s e t t l e m e n t g a v e an a v e r a g e r e d u c t i o n o f t h e t o t a l p o l l u t i o n o u t f a l l ,
e x p r e s s e d i n k g COD p e r o v e r f l o w o c c u r r e n c e o f 60-80%. Although it
proved t h a t t h e d e t e n t i o n e f f e c t o f t h e t a n k s d e c r e a s e d p r o p o r t i o n a t e l y
a s t h e amount o f p r e c i p i t a t i o n i n c r e a s e d , it was r emarkab le t h a t t h e
o v e r f l o w s w i t h t h e l a r g e s t w a t e r d i s c h a r g e s were n o t i d e n t i c a l w i t h t h e

o v e r f l o w s which c a r r i e d t h e g r e a t e s t p o l l u t i o n l o a d (kg C O D ) .

1 INTRODUCTION
I n The Ne the r l ands more t h a n 90% of t h e sewer sys tems a r e combined
s y s t e m s , i . e . was tewa te r and ' ra inwater a r e d i s c h a r g e d t o t h e sewage
t r e a t m e n t p l a n t by t h e same sewers . The c a p a c i t y o f t h e s e p l a n t s i s
g e n e r a l l y a b o u t f o u r t i m e s t h e d r y wea the r f l o w , e q u i v a l e n t t o
approx . 1 mm/h on a paved s u r f a c e .
A s The Ne the r l ands i s r a t h e r f l a t ( c o m p r i s i n g t h e d e l t a s o f t h e Rhine
and t h e Maas) t h e sewer sys tems have a r a t h e r l a r g e s t o r a g e c a p a c i t y
( approx . 5 t o 8 mm). Whet- t h e r e is more p r e c i p i t a t i o n t h a n can be
s t o r e d o r d i s c h a r g e d t o t h e sewage t r e a t m e n t p l a n t , t h e e x c e s s w a t e r
i s d i s c h a r g e d by o v e r f l o w t o s u r f a c e w a t e r s .
The s u r f a c e w a t e r s o f t e n c o n s i s t o f r a t h e r s m a l l o rnamenta l ponds i n
u rban a r e a s .
I n t h e p a s t i t was assuxed t h a t , because o f d i l u t i o n o f t h e was tewa te r
w i t h r a i n w a t e r , t h e s e o v e r f l o w s would have l i t t l e o r no d e l e t e r i o u s
e f f e c t on t h e q u a l i t y o f t h e r e c e i v i n g s u r f a c e w a t e r s . However, f o r
s e v e r a l decades it h a s been clear t h a t t h e r e i s a n o t i c e a b l e n e g a t i v e
e f f e c t . I n t h e s e s m a l l u rban w a t e r s , o v e r f l o w s o f t e n c a u s e f i s h
m o r t a l i t y , n e a r l y a lways due t o l a c k o f oxygen. Var ious i n v e s t i g a t i o n s
have made i t c l e a r t h a t o v e r f l o w s a r e f a r more p o l l u t e d t h a n t h e
d i l u t i o n w i t h r a i n w a t e r l e a d t o e x p e c t ( r e f . 1 , 2) .
The c h i e f e x p l a n a t i o n of t h i s phenomenon is t h e p r e s e n c e o f a
r e l a t i v e l y l a r g e amount o f s l u d g e i n t h e o v e r f l o w , s t i r r e d up and
d i s c h a r g e d from t h e sewers by t h e sudden r i s i n g rate o f f low. For some
y e a r s , r e s e a r c h on t h i s phenomenon h a s been c a r r i e d o u t i n The
Ne the r l ands a t v a r i o u s p l a c e s ( r e f . 3 ) . One o f t h e p o s s i b i l i t i e s t o
r e s t r i c t t h e e f f e c t o f o v e r f l o w is t o c o n s t r u c t s t o r a g e s e t t l i n g t a n k s
n e a r t h e o v e r f l o w l o c a t i o n s . The o v e r f l o w w a t e r is passed th rough t h e s e
t a n k s s o t h a t t h e sewage s l u d g e i s r e t a i n e d by s e t t l e m e n t . I n a d d i t i o n ,
t h e e x t r a s t o r a g e p rov ided by t h e t a n k s r e d u c e s t h e f r equency o f
ove r f low.
Fo l lowing examples from abroad ( r e f . 21, more t h a n a dozen s t o r a g e
s e t t l i n g t a n k s have been b u i l t a t ma jo r o v e r f l o w l o c a t i o n s i n The

Nethe r l ands . However, t h e r e was some r e g a r d i n g t h e u s e f u l 1 e f f e c t on t h e
p o l l u t i o n l o a d o f ove r f lows . T h e r e f o r e i n v e s t i g a t i o n s were c a r r i e d o u t
from 1983 - 1985 a t two of t h e s e t a n k s t o d e t e r m i n e t h e compos i t ion o f
t h e ove r f low w a t e r . One t a n k is i n Kerk rade , a h i l l y a r e a i n t h e s o u t h
o f The N e t h e r l a n d s , and t h e o t h e r is s i t u a t e d n e a r Amers foor t , i n
f a i r l y f l a t l a n d i n t h e c e n t r e o f t h e c o u n t r y .
2 MONITORING AT THE STORAGE SETTLING TANKS I N KERKRADE
2.1 D e s c r i p t i o n o f t h e Kerkrade s t o r a g e s e t t l i n g t a n k .
Four s t o r a g e s e t t l i n g t a n k s were b u i l t i n t h e s u r r o u n d i n g s o f Kerkrade
i n 1970, t o p r o t e c t a small r e s e r v o i r i n t h e Anse lde r s t r e a m , w i t h a
r e c r e a t i o n a l c h a r a c t e r , from p o l l u t i o n by o v e r f l o w s from combined sewer
s y s t e m s i n t h e l o c a l i t y . The a r e a is r a t h e r h i l l y .
The i n v e s t i g a t i o n took p l a c e a t t h e s t o r a g e s e t t l i n g t a n k on t h e
Vloedgraaf s t r e a m . The t a n k s were b u i l t t o r e c e i v e t h e ove r f low from a
r e s i d e n t i a l a r e a w i t h a p o p u l a t i o n o f approx . 14 ,000 . There is
p r a c t i c a l l y no i n d u s t r y . The f o l l o w i n g t a b l e p r e s e n t s t h e main d a t a on
t h e a r e a and t h e s e t t l i n g t a n k .
Tab le 1 B a s i c d a t a , Kerkrade s t o r a g e s e t t l i n g t a n k
paved s u r f a c e r e s i d e n t i a l a r e a 69 ha
s t o r a g e i n sewer s y s t e m 1 mm
s t o r a g e i n s t o r a g e s e t t l i n g t a n k 3 mm
d r y wea the r f l o w 0 - 3 mm/h
o v e r - c a p a c i t y 0 . 3 mm/h
t o t a l d i s c h a r g e t o sewage t r e a t m e n t p l a n t 0 . 6 mmlh

outlet sewer to treatment plant
8
Figure 1 Storage settling tank Kerkrade -
The t a n k s , which a r e a l l round open t a n k s o f r e i n f o r c e d c o n c r e t e , work
as f o l l o w s ( s e e F i g u r e 1 ) :
Sewage b r o u g h t i n by t h e s u p p l y sewer ( 1 ) is c o n t i n u o u s l y measured
by a v e n t u r i meter ( 2 ) . I f t h i s sewage f l o w i s more t h a n t w i c e t h e
d r y wea the r f l o w ( d . w . f . ) , which is t h e maximum c a p a c i t y o f t h e
sewage t r e a t m e n t p l a n t , t h e d i s c h a r g e is s t o p p e d at t h i s v a l u e by
a n a u t o m a t i c e l e c t r i c g a t e v a l v e ( 3 ) . The sewage f i l l s t h e s u p p l y
s e w e r , f l o w s o v e r t h e c r e s t o f t h e ove r f low w e i r ( 4 ) and p a s s e s
th rouph t h e c e n t r a l s u p p l y p i p e t o t h e t a n k .
When t h e t a n k is f i l l e d u p , t h e w a t e r a l s o f l o w s o v e r t h e c r e s t o f
a n o v e r f l o w w e i r a t t h e o u t e r w a l l o f t h e t a n k i n t o a d r a i n ( 5 ) .
The d r a i n (5 ) d i s c h a r g e s t h e w a t e r t o t h e Vloedgraa f brook.
Immediate ly t h e t a n k f i l l s u p , s c r a p e r s b e g i n t h e o p e r a t e , s c r a p i n g
t h e s e t t l e d s l u d g e t o t h e c e n t r e where i t is t r a n s p o r t e d th rough
a s p e c i a l p i p e ( 6 ) and d i s c h a r g e d t o t h e o u t l e t s ewer ( 8 ) by a
pumping s t a t i o n ( 7 ) . The pumping s t a t i o n ( 7 ) pumps o u t t h e t a n k
a f t e r r a i n h a s c e a s e d . The s l u d g e s c r a p e r s a r e f i t t e d i n a s l o w l y

r e v o l v i n g b r i d g e . T h i s a l s o h o u s e s a f l u s h i n g i n s t a l l a t i o n which
a u t o m a t i c a l l y comes i n t o o p e r a t i o n a f t e r t h e t a n k h a s been gumped
o u t and c l e a n s t h e t a n k f l o o r w i t h groundwater f o r abou t t e n
minu tes t o remove t h e r e m a i n i n g sewage s l u d g e .
Thanks t o t h i s sys tem o f a u t o m a t i c s l u d g e d i s c h a r g e and f l u s h i n g w i t h
c l e a n w a t e r , t h e ma in tenance o f t h e t a n k s h a s proved t o be minimal .
Moreover, i n s p i t e o f t h e f a c t t h a t t h e y a r e open t a n k s , s i t u a t e d o n l y
100 m from a b u i l t - u p a r e a , the1.e n a s n o t been a s i n g l e compla in t a b o u t
odour i n t h e 15 y e a r s t h a t t h e y have been i n o p e r a t i o n .
2.2 D e s c r i p t i o n o f t h e m o n i t o r i n g o f t h e Kerkrade s t o r a g e s e t t l i n g
t a n k .
For abou t a y e a r , t h e wa te r f l o w i n g i n a t ( 4 ) and f l o w i n g o u t a t ( 5 )
d u r i n g t h e o p e r a t i o n o f t h e t a n k were sampled p r o p o r t i o n a t e t o t h e
f low.
The sampl ing was done by a a u t o m a t i c sampl ing a p p a r a t u s i n s t a l l e d a t
( 4 ) and ( 5 ) . T h i s a p p a r a t u s was p u t i n t o o p e r a t i o n and a d j u s t e d by
d i s c h a r g e m o n i t o r i n g w i t h t h e a i d o f p r e s s u r e g a u g e s . The m o n i t o r i n g
and sampling a p p a r a t u s was d e s i g n e d by DHV C o n s u l t i n g E n g i n e e r s , t h i s
company a l s o c a r r i e d o u t t h e i n v e s t i g a t i o n . A s soon as t h e sampl ing
a p p a r a t u s began t o o p e r a t e , t h i s was a u t o m a t i c a l l y s i g n a l l e d t o t h e
sewage t r e a t m e n t p l a n t .
The samples , which were c o o l e d a t 4' C , were f e t c h e d w i t h i n 8 h o u r s ,
and t r a n s p o r t e d t o t h e Limburg Water Board a t Roermond where t h e y were
a n a l y s e d f o r c h e m i c a l oxygen demand, e t c .
2.3 R e s u l t s of t h e m o n i t a r i n g o f t h e Kerkrade s t o r a g e s e t t l i n g t a n k
I n t h e f o l l o w i n g t a b l e , t h e main r e s u l t s o f t h e i n v e s t i g a t i o n a r e
summarized. ,

Table 2 R e s u l t s o f t h e moni to r ing a t t h e Kerkrade s t o r a g e s e t t l i n g
t a n k .
c a l c u l a t e d measured
(1967) (1984)
number o f over f lows from tank
t o s u r f a c e wate rs ( l l y r ) 34 2 8
volume of overf low t o
s u r f a c e wate rs (mmlyr) 120 mmly 260 mmly
average COD r e d u c t i o n
due t o s e t t l i n g (%)
average COD r e d u c t i o n due
t o s t o r a g e and s e t t l i n g (%) 7 1
average COD-concentration (mgl l ) 400
The f a r l a r g e r amount o f water t h a t overf lowed i n t h e i n v e s t i g a t e d y e a r
i n comparison t o t h e c a l c u l a t e d a m o u ~ t was remarkable (260 mmly i n s t e a d
o f 120 mmly). Th is can probably be e x p l a i n e d by t h e r u n o f f from unpaved
s u r f a c e s i n t h i s h i l l y a r e a .

4 stored + set fled ~n '10 of the total amount of COD
__1 1 i
DISCHARGED 1
water flowing in fank (mm)
F~gure 2 Effect of storage settling tank Kerkrade -
m e n r a i n f a l l was heavy, t h e amount of s e t t l e m e n t was g e n e r a l l y - a s was
t o be expec ted - lower t h a n w i t h a s m a l l e r wa te r i n l e t . T h i s c a n be
s e e n from F i g u r e 2 , which shows p e r o v e r f l o w occur rence (numbered f rom 1
t o 35) what p e r c e n t a g e o f t h e t o t a l amount o f COD b rough t i n t o t h e t a n k
w i t h t h e incoming w a t e r r emains t h e r e due t o s t o r a g e and s e t t l e m e n t .
However, f u r t h e r s t u d y o f t h e o v e r f l o w d a t a shows t h a t t h e l a r g e s t
ove r f lows were n o t i d e n t i c a l i n q u a n t i t y t o t h e o v e r f l o w s which b rough t
t h e l a r g e s t amounts o f COD t o t h e t a n k .
P robab ly a h i g h p r e c i p i t a t i o n i n t e n s i t y , which stirs up t h e sewage
s l u d g e , is more c r i t i c a l t h a n t h e t o t a l amount o f p r e c i p i t a t i o n
d i s c h a r g e d .
The over f low w a t e r proved t o be r e l a t i v e l y l e s s p o l l u t e d t h a n p r e v i o u s l y
assumed on t h e b a s i s o f d a t a from i n t e r n a t i o n a l l i t e r a t u r e ; t h e a v e r a g e
COD c o n c e n t r a t i o n o f t h e w a t e r f l o w i n g i n t o t h e t a n k s was 160 mg/l
i n s t e a d o f t h e e x p e c t e d 400 m g l l . T h i s can be e x p l a i n e d by t h e d i l u t i o n

because of t h e l a r g e r over f low volume.
3 MONITORING AT THE STORAGE SETTLING TANK I N AMERSFOORT
3.1 D e s c r i p t i o n of t h e Amersfoort s e t t l i n g t a n k
I n 1976, a s t o r a g e s e t t l i n g t ank was b u i l t f o r t h e over f low from a
r e s i d e n t i a l q u a r t e r w i t h some 7 ,000 i n h a b i t a n t s i n Amersfoort , a c i t y
i n t h e c e n t r e of The Ne ther lands . There i s no i n d u s t r y i n t h e q u a r t e r ,
on ly a swimming h a l l .
Fig. #overview of storage settling tank - - I automatic
valyes (71 -. U1
storage s e t s t a n k (4) c--,
t
b Fig. 3 Section of storage settlina tank - autdmatic
vdws(7)
mre 3 Storage settling tank Amersfoort

The f o l l o w i n g t a b l e p r e s e n t s t h e main d a t a on t h e q u a r t e r and t h e
s e t t l i n g t a n k .
Table 3 Bas ic d a t a , Amersfoort s t o r a g e s e t t l i n g t a n k
paved s u r f a c e r e s i d e n t i a l q u a r t e r 26 ha
s t o r a g e i n sewer sys tem 7 .3 mm
s t o r a g e i n s t o r a g e s e t t l i n g t ank 2.5 mm
d r y weather f l o w 0.2 mmlh
over -capac i ty 0 .8 mmlh
t o t a l d i s c h a r g e t o sewage t r e a t m e n t p l a n t 1 mmlh
The q u a r t e r is i n a s l i g h t l y s l o p i n g a r e a . The major d i f f e r e n c e s t o t h e
Kerkrade t ank a r e t h e f a r g r e a t e r s t o r a g e i n t h e sewer system ( 7 . 3 mm
i n s t e a d of 1 mm) and t h e g r e a t e r c a p a c i t y of t h e d i s c h a r g e t o t h e sewage
t r e a t m e n t p l a n t ( 1 . 0 mmlh i n s t e a d o f 0 .6 mmlh). The s t o r a g e s e t t l i n g
t a n k is a r e c t a n g u l a r underground t a n k ( s e e F igure 3 ) . During d r y
wea ther , t h e wastewater p a s s e s t h e t a n k a t ( 1 ) v i a t h e chamber ( 2 ) and
i s pumped up by t h e pumping s t a t i o n ( 3 ) and d i s c h a r g e d t o t h e sewage
t r e a t m e n t p l a n t . Vhen t h e supp ly is g r e a t e r t h a n 1 mmlh, t h e chamber ( 2 )
f i l l s and d i s c h a r g e s t h e wa te r o v e r t h e c r e s t of t h e over f low weir a t
( 3 ) i n t o t h e empty t ank ( 4 ) . When t h e t ank is f i l l e d - u p , t h e wa te r a l s o
f l o w s over t h e c r e s t o f t h e o v e r f l o w wei r (5 ) and is d i s c h a r g e d th rough
t h e chamber ( 6 ) t o t h e s u r f a c e w a t e r i n t h e H e i l i g e n b e r g brook. A t t h e
end of t h e r a i n shower , when t h e w a t e r s u p p l y is l e s s t h a n 1 .0 mmlh, t h e
wa te r l e v e l i n t h e chamber ( 2 ) d r o p s and t h e w a t e r i n t h e t ank p r e s s e s
open a r e t u r n v a l v e a t ( a ) ( s e e F i g u r e 3b) . The t ank is pumped o u t by
t h e pumping s t a t i o n (31, a f t e r which a u t o m a t i c c i l i n d r i c v a l v e s a t ( 7 )
( s e e F i g u r e s 3a and 3b) a r e openend and s u r f a c e w a t e r from t h e brook
f l o w s i n t o t h e t a n k , f l u s h i n g t h e s e t t l e d sewage s l u d g e t o t h e pumping
s t a t i o n ( 3 ) , from which it i s pumped t o t h e sewage t r e a t m e n t p l a n t .
The au tomat ic f l u s h i n g system h a s f u n c t i o n e d comple te ly s a t i s f a c t o r i l y
i n t h e n i n e y e a r s s i n c e t h e t ank was b u i l t . Except f o r t h e pumping
s t a t i o n ( 3 ) , p r a c t i c a l l y no maintenance h a s been needed.

3.2 D e s c r i p t i o n of t h e m o n i t o r i n g o f t h e Amersfoort s t o r a g e s e t t l i n g
t a n k .
From January 1983 t o t h e end o f 1984 t h e wa te r f l o w i n g i n t o t h e t ank and
t h e wa te r d i s c h a r g e d from t h e t a n k t o t h e s t r eam was moni tored.
An au tomat ic d i s c h a r g e - , r ~ g i s t r a t i o n and sampling a p p a r a t u s was s e t u p
i n f r o n t of t h e weir c r e s t a t (3) t o moni to r and sample t h e wa te r
f l o w i n g i n t o t h e t a n k . A second a p p a r a t u s was p laced n e a r t h e we i r c r e s t
a t ( 5 ) f o r t h e wa te r f l o w i n g o u t . The d i s c h a r g e was a u t o m a t i c a l l y
c a l c u l a t e d from t h e r e g i s t r a t i o n c f l e v e l s measured by p r e s s u r e gauges .
The sampling a p p a r a t u s , des igned by DHV Consu l t ing Engineers who a l s o
c a r r i e d o u t t h e i n v e s t i g a t i o n , t o o k samples p r o p o r t i o n a t e t o t h e w a t e r
volume p a s s i n g t h e c r e s t of t h e over f low w e i r . The samples were coo led .
The samples were t r a n s p o r t e d t o t h e l a b o r a t o r y and a n a l y s e d f o r COD e t c .
w i t h i n s i x h o u r s .
3 .3 R e s u l t s o f m o n i t o r i n g t h e Amersfoort s t o r a g e s e t t l i n g t a n k .
The r e s u l t s a r e summarized i n t h e f o l l o w i n g t a b l e .
Table 4 R e s u l t s of moni to r ing Amersfoort s t o r a g e s e t t l i n g t a n k .
c a l c u l a t e d measured
number o f o v e r f l o w s from t a n k
t o s u r f a c e w a t e r s ( l l y r ) 5.5 8 - 8
volume of over f low d i s c h a r g e d
i n t o s u r f a c e w a t e r s (mmlyr ) 2 4 22.6
average COD d e c r e a s e by s e t t l i n g (%) 4 7
a v e r a g e COD d e c r e a s e by s t o r a g e
and s e t t l i n g (%l 8 1

I n Amersfoor t t o o , when r a i n f a l l was heavy t h e amount o f s e t t l e m e n t was
lower t h a n w i t h s m a l l e r r a i n f a l l s . T h i s a p p e a r s f rom F i ~ u r e 4 , i n which
t h e p e r c e n t a g e i s g i v e n f o r t h e measured ove r f low-occur rences (numbered
from 1 t o 1 5 ) o f t h e t o t a l amount o f t h e COD ( e n t e r i n g t h e t a n k w i t h
t h e wa te r f l o w , t h a t r ema ins i n t h e t a n k due t o s t o r a g e o r s e t t l i n g .
1 stored settled in%of the total amount of COD
I.volu me tank,; water flowing in tank (mm1
Figure 4 Effect of storage settling tank Amersfoort
A f u r t h e r a n a l y s i s showed, more c l e a r l y t h a n i n Kerk rade , t h a t t h e
l a r g e s t o v e r f l o w s a r e n o t i d e n t i c a l i n r e g a r d t o t h e volume w i t h t h e
o v e r f ~ o w s t h a t c o n t a i n t h e l a r g e s t amount o f p o l l u t i o n , measured a s COD.
T h i s is i l l u s t r a t e d i n Tab le 5 below, i n which t h e f i v e l a r g e s t o v e r f l o w s
i n r e g a r d t o w a t e r q u a n t i t y and t h e f i v e l a r g e s t o v e r f l o w s i n r e g a r d t o
COD f l o w i n g t o t h e t a n k a r e p r e s e n t e d n e x t t o e a c h o t h e r .
The o v e r f l o w number is a l s o g i v e n f o r each o v e r f l o w o c c u r r e n c e .
It a p p e a r s from t h e t a b l e t h a t t h e l a r g e s t o v e r f l o w i n r e g a r d t o w a t e r
amounts , i s n o t t h e l a r g e s t i n r e g a r d t o p o l l u t i o n l o a d .

T a b l e 5 L a r g e s t amounts o f w a t e r and l a r g e s t p o l l u t i o n l o a d p e r
ove r f low.
sequence volume o f o v e r f l o w COD o v e r f l o w
number w a t e r number ( k g ) number
Moreover, t h e t a b l e above i n d i c a t e s whe the r t h e o v e r f l o w t o o k p l a c e
d u r i n g t h e c o l d s e a s o n (Oc tobe r t o A p r i l ) o r t h e warm s e a s o n ( A p r i l
t o O c t o b e r ) . It t h e n a p p e a r s t h a t t h e o v e r f l o w s w i t h t h e l a r g e s t w a t e r
q u a n t i t i e s p a r t i c u l a r l y o c c u r i n t h e c o l d s e a s o n ( C ) f o u r o u t of t h e
f i v e , whereas t h o s e w i t h t h e l a r g e s t p o l l u t i o n l o a d p e r o c c u r r e n c e o c c u r
r e l a t i v e l y more f r e q u e n t l y i n t h e warm s e a s o n (W), t h r e e o u t o f t h e
f i v e .
An i n v e s t i g a t i o n was c a r r i e d o u t a t two s t o r a g e s e t t l i n g t a n k s i n two
d i f f e r e n t p l a c e s i n The N e t h e r l a n d s , b u i l t and o p e r a t e d unde r d i f f e r e n t
c i r c u m s t a n c e s . It a p p e a r e d t h a t due t o t h e a p p l i c a t i o n o f t h e s e t a n k s ,
t h e q u a n t i t y of o r g a n i c m a t t e r measured a s COD t h a t is d i s c h a r g e d t o
s u r f a c e w a t e r s i s reduced by an a v e r a g e o f a p p r o x . 50% by s e t t l i n g and
o f 60-80% by t h e combina t ion o f s t o r a g e and s e t t l i n g .
The ma in tenance o f t h e s e t a n k s p roved t o be v e r y p r a c t i c a l l y , because
t h e s e t t l e d sewage s l u d g e was a u t o m a t i c a l l y f l u s h e d back t o t h e sewer
a f t e r r a i n f a l l had c r e a s e d .

REFERENCES
1 . GAMESON, A.L.H., and DAVIDSON, R . H . , 1963, Storm-water I n v e s t i g a t i o n s
a t Northampton, J o u r n a l and Proceedings o f t h e I n s t i t u t e o f
Sewage P u r i f i c a t i o n
2 pp 105-135
2. DUNBAR, D.D. and HENRY, J.G.F. 1966, P o l l u t i o n c o n t r o l measures f o r
s to rmwate r s and combined sewer over f lows
J o u r n a l W.P.C.F. 38 : no 1 pp 9-26
3. VAT, D. 1985, P o l l u t i o n e m i s s i o n from combined sewer systems; a f u l l
s c a l e i n v e s t i g a t i o n programme, Proceed ings t e c h n i c a l mee t ing CHO/
TNO, A p r i l 1985

WATER QUALITY EFFECTS I N SURFACE WATERS RECEIVING STORM
WATER DISCHARGES
R.H. A a l d e r i n k and L. L i j k l e m a
ABSTRACT
A general ana lys i s of water qual i ty impacts of storm water discharges i s
presented on the b a s i s of the r a t e s of t he concomitant processes and the
s p a t i a l s ca l e s of t he e f f e c t s . The p r a c t i c a l use of t h i s ana lys i s i s
i l l u s t r a t e d f o r t h e research of thewater quali ty e f f e c t s of storm water
discharges from a combined sewer system i n a r e t e n t i o n pond i n Loenen.
Resul t s a r e presented f o r t he oxygen dynamics, t h e b a c t e r i a l die-off and
accumulation of heavy metals .
1 INTRODUCTION
The cont r ibut ion of storm water d ischarges t o t h e p o l l u t i o n of sur face
waters va r i e s wi th in wide ranges. The volume of d ischarges , t he associ -
a t ed load of p o l l u t a n t s , the frequency of events and t h e c h a r a c t e r i s t i c s
of t h e composition of t he storm water a r e obviously important f ac to r s .
Sometimes storm waters from sepa ra t e of combined sewerage systems a r e
t h e main source of po l lu t ion , but o f t e n a l s o e f f l u e n t s from waste water
t reatment p l an t s o r d i f f u s e sources con t r ibu t e t o t h e loading of
rece iv ing waters. The proport ions vary f o r t he d i f f e r e n t compounds
having environmental impacts. The i n t e n s i t y of t h e e f f e c t s i s fu r the r -
more a funct ion of t h e p rope r t i e s of t h e rece iv ing water such a s volume,
flow, hydraulic de t en t ion t i m e , water depth and o ther morphological
f a c t o r s , and of t he chemical composition.

A t l a s t a l s o t h e environmental cond i t i ons ( tempera ture , wind, i r r a d i a -
t i on ) i n t e r a c t w i th t he i np u t s and a f f e c t t h e t ransformat ions w i th in t he
water system, caus ing a sometimes wide v a r i a t i o n of impacts over t h e
seasons. The numerous pos s ib l e combinations of f a c t o r s con t r i bu t i ng t o
t h e water q u a l i t y prec lude t h e development of a s imple r e c ipe f o r t he
ana lyses of water q u a l i t y impacts of s torm water d i scharges . Yet a
c e r t a i n g e n e r a l i z a t i o n can be made on t he b a s i s of temporal and s p a t i a l
s c a l e s f o r t h e assessment of t h e e f f e c t s , both i n terms of measuring
s t r a t e g y and i n terms of d e s c r i p t i o n andlor modelling
1 . 1 S p a t i a l and temporal s c a l e s
Water q u a l i t y impacts may cover a wide range of t ime s c a l e s which a r e
con t ro l l ed by t h e r a t e s of t h e concomitant p rocesses i n t h e su r f ace
water . High r a t e processes such a s a cu t e f i s h k i l l s by t o x i c ma t t e r o r
chemical ox ida t ion- reduc t ion r e a c t i o n s a r e d i r e c t l y r e l a t e d t o t h e
dynamics of t h e d i scharge : i n t e n s i t y and du ra t i on of t h e discharged
load , t he l o c a l mixing cond i t i ons and t h e process r a t e s c o n t r o l t h e
e x t e n t of t he e f f e c t s i n space and time. The event w i l l be h igh ly
dynamic; an assessment r e q u i r e s a d e t a i l e d and f r equen t sampling o r
continuous record ing t ak ing i n account s t r ong l o c a l g r ad i en t s . On t h e
o the r hand t h e h igh r a t e s w i l l l e ad t o a speedy d e c l i n e of t he e f f e c t
and e s p e c i a l l y i n s tagnant r e c e i v i n g waters only a r e s t r i c t e d zone w i l l
be a f f ec t ed . Water q u a l i t y e f f e c t s r e l a t e d t o processes with moderate
r a t e s , f o r i n s t ance BOD-oxygen consumption o r b a c t e r i a l die-off w i l l
a f f e c t a wider a r e a bu t f o r t he assessment and d e s c r i p t i o n a l e s s
d e t a i l e d a n a l y s i s i n time and space i s requi red . For slow changes such
a s accumulation of n u t r i e n t s o r heavy metals i n sediments t he immediate
e f f e c t of a s torm water d i scharge i s of minor importance; t he t o t a l
(average) annual load ing may be s u f f i c i e n t t o judge t h e consequences of
a storm water o u t l e t . I n such s i t u a t i o n s t he eva lua t i on may be l i m i t e d
t o an assessment of t h e percentage of t h e c o n t r i b u t i o n from storm water
d i scharges t o t h e o v e r a l l load. However, f o r subs tances involved i n
processes of a h ighe r r a t e , t h e immediate e f f e c t may be t h e more ser ious.

For ins tance one oxygen dep l e t i on due t o a s torm water event i n a per iod
of one o r two yea r s may upset a r e ce iv ing water more than t h e continuous
d i scharge of an e f f l u e n t , a l though t h e l a t t e r c o n t r i b u t e s over 98% of
t h e t o t a l annual BOD-load.
F igure 1 p r e sen t s a q u a l i t a t i v e p i c t u r e of t he r e l a t i o n between t h e
r a t e s of t he processes i nd i ca t ed and t h e s p a t i a l s c a l e of t h e e f f e c t s .
time scale
I decade -
year -
month -
week -
day -
hour -
m~nute -
Local whole system
spatial scale
Figure 1 Re l a t i on between t h e r a t e s of p rocesses and t h e s p a t i a l s c a l e
of t h e e f f e c t s

Due t o i ts n a t u r e t h e e f f e c t s i n running waters w i l l tend t o a f f l i c t t h e
water q u a l i t y over longer d i s t a n c e s a s t h e s l u g of p o l l u t a n t s runs down
t h e s tream, bu t -when cons ider ing a f i x e d p o i n t i n space- t h e d u r a t i o n
w i l l be s h o r t e r i n comparison w i th s tagnant water .
For processes w i th in te rmedia te r a t e cons t an t s t h e a n a l y s i s may t ake
i n t o account t h e p r o b a b i l i t y of over lapping even t s . Espec i a l l y i n a f l a t
country with a h igh s t o r age capac i t y i n t h e sewer systems a f a i r l y long
per iod (about 10 h r s ) i s r equ i r ed t o pump t h e system u n t i l it i s empty.
Hence storms a n t i c i p a t e d by a s h o r t d ry per iod have a h igher p r o b a b i l i t y
t o cause an overf low and t h e p r o b a b i l i t y of i n t e r f e r e n c e of even t s i s
enhanced i n comparison with complete independency.
The p r a c t i c a l conc lus ion f o r our r e s ea r ch of t h e water q u a l i t y e f f e c t s
of storm water d i s cha rges from a combined sewer system, inc luding t he
measuring s t r a t e g y , w i l l be d i scussed i n a subsequent s ec t i on .
1 .2 De t e rmin i s t i c o r s t a t i s t i c a l approach?
The methodologies app l i ed i n t h e assessment of water q u a l i t y e f f e c t s of
s torm water d i scharged i n t o r e c e i v i n g waters f a l l i n t o two broad catego-
r i e s .
S t a t i s t i c a l methods a r e based on t h e p r i n c i p l e t h a t t h e p r o p e r t i e s of
t h e storm even t s ( d i s t r i b u t i o n of i n t e n s i t y , d u r a t i o n , volume and d ry
per iods , inc lud ing c o r r e l a t i o n s between t h e p r o p e r t i e s ) a r e somehow
preserved dur ing t h e t ransformat ion from pluviogram through t h e f low i n
t h e sewerage system and f i n a l l y i n t h e overf lowing quan t i t y . These
methods have t h e advantage t h a t when once t he shape of t h e d i s t r i b u t i o n
of t h e d i scharged load ha s been a s se s sed , t he frequency of exceeding a
water q u a l i t y s tandard can be ob ta ined r e a d i l y from p red i c t ed water
q u a l i t y d i s t r i b u t i o n s round an average e f f e c t . The main problems w i th
t h i s methodology a r e t h e c o r r e c t t rea tment of t h e c o r r e l a t i o n s , t h e
a v a i l a b i l i t y of r e l i a b l e and s u f f i c i e n t d a t a on water q u a l i t y of s torm
water and a c o r r e c t p r e d i c t i o n of t h e t ransformat ion from p r e c i p i t a t i o n
i n t o f low and overflow.

Determinis t ic methods use time s e r i e s of r a i n f a l l and model t h e sequence
of even t s i n t h e sewer system, a t t h e d i scharge po in t and i n t he re-
ce iv ing water . C a l i b r a t i o n can be based on measured q u a n t i t i e s dur ing
one o r more events . Ca l cu l a t i ons based on r eco rds of r a i n f a l l w i l l a l l ow
a s t a t i s t i c a l t rea tment of t h e r e s u l t i n g water q u a l i t y d a t a and y i e l d
frequency d i s t r i b u t i o n s of t h e v i o l a t i o n of s tandards . These methods
g ive i n s i g h t i n t h e i n t e r r e l a t i o n s between t h e processes and can handle
more d e t a i l . Never the less t h e c a l c u l a t i o n s o f t e n s u f f e r from a poor
r ep r e sen t a t i on of q u a l i t y , e s p e c i a l l y regard ing t he sewage and t he d i s -
charged overflow. Also t h e procedures a r e l abo r ious and consume much
computer time .
2 THE PRESENT RESEARCH
The o v e r a l l aim of t h e s tudy i s t o compare both methodologies, pa r t i cu -
l a r l y with r e spec t t o t h e r e l a t i o n between d ischarge and water q u a l i t y
i n t h e r e ce iv ing water . Only d e t e r m i n i s t i c a s p e c t s w i l l be d i scussed
he r e with emphasis on t h e sampling s t r a t e g y a s r e l a t e d t o s p a t i a l and
temporal s c a l e s , and some r e s u l t s and t h e i r i n t e r p r e t a t i o n i n s imple
models. The r e sea r ch i s a p a r t of a l a r g e s tudy by t h e NWRW (National
Working Group on Sewerage and Water Qua l i t y ) . I n t h e framework of t h i s
s tudy and i n coopera t ion with STORA ( ~ o u n d a t i o n f o r Applied Research i n
Wastewater Treatment) a l a r g e d a t a s e t on d i scharges and r a i n f a l l h a s
been c o l l e c t e d by DHV-Consultants a t s e v e r a l l o c a t i o n s i n t h e Nether-
l ands . One of t h e l o c a t i o n s is t h e r e t e n t i o n pond i n Loenen, where we
measured t he water q u a l i t y e f f e c t s and s t ud i ed i nd iv idua l p rocesses i n
1984. I n 3.5 yea r s 55 d ischarges have been samples, of which 17 occur red
i n 1984. Of t h e s e even t s l1 were sampled and recorded more o r l e s s
completely.
The v i l l a g e of Loenen ha s a combined sewerage system, d r a in ing about
16 ha of impermeable su r f ace i n a s l i g h t l y s l op ing a r e a . The average
frequency of d i scharges a s observed is 15 per yea r . F igure 2 shows t h e
dimensions of t h e pond and t h e l o c a t i o n of t h e in f low of storm water and
out f low over a wei r and t h e sampling s t a t i o n s . The pond r ece ive s perco-
l a t i n g groundwater a t a r a t e of about 10cmlday ; t he average depth i s Im.

Figure 2 Dimensions of t h e r e t e n t i o n pond and l o c a t i o n of t he sampling
l o c a t i o n s
2.1 Sampling s t r a t e g y
The input of t he overflowing mixture of sewage and storm water was
measured by an automatic sampling and r e g i s t r a t i o n system which r e s u l t s
i n a continuous flow measurement and i nd iv idua l samples f o r t h e a n a l y s i s
of water q u a l i t y v a r i a b l e s wi th a frequency p ropo r t i ona l with t h e f low.
Although t h i s sampling s t r a t e g y had been e s t a b l i s h e d long before t h e
water quality i n the receiving water became the s u b j e c t of s tudy , t he d a t a
proved t o be adequate f o r t h i s s tudy a l s o . The t o t a l load could be ca l -
cu l a t ed , but f o r d e t a i l e d s t u d i e s , e .g. of t h e mixing process i n t h e
r e ce iv ing water , t h e v a r i a t i o n s of f low and concentea t ions w i th in che
event could be assessed a s we l l . The v a r i a b l e s measured included COD,
BOD, Kjeldahl-N, P - t o t a l and suspended s o l i d s i n t h e samples a s such and
a f t e r s e t t l i n g . To t a l heavy meta l s were a l s o measured.
The q u a l i t y a s measured w i th in t h e r e c e i v i n g water and t h e frequency of
of sampling i s summarized i n t a b l e 1 . This shows c l e a r l y t h a t v a r i a b l e s
r e l a t e d t o f a s t p rocesses a r e measured e i t h e r cont inuous ly o r w i th a
high frequency .

Table 1 Water q u a l i t y sampling programme i n t h e pond
Sampling loca t ions : see f i g u r e 1
Var iab le Sampling Frequency Location Process /Effec t s tudied
Temperature Continuous P 1 Background informa-
t ion
Conductivi ty Continuous P1 P2 P3 Mixing
O2 Continuous P1 P2 P3 02 dynamics, espe-
c i a l l y a f t e r even t s
BOD, COD, NH4-N, 0.5-4 hours a f t e r P1 P2 P3
Kjeldahl-N , event
ortho-P, total-P weekly P3 mass balance
i nd i ca to r micro- d a i l y a f t e r even t s P1 P2 P3 su rv iva l a f t e r event
organisms
suspended s o l i d s 0.5-4 hours a f t e r P1 P2 P3 sedimentat ion
event
N , P, heavy meta ls monthly L1 L2 L3 Accumulation of
ash f r e e dry weight sediment and of
and i n sediments + of n u t r i e n t s and
depth of sediment heavy metals
l aye r
........................................................................ macrophytes twice a year . . . E f f e c t s u p o n
macrofauna monthly M1 M2 M3 ecosystem
Phyto- and Zoo- day a f t e r even t ; L1 L2 L3
plankton biweekly
Epiphytic diatoms t h r e e month - - -
The conduct iv i ty proved t o be a u s e f u l i nd i ca to r f o r mixing because
t h e r e was a d i f f e r ence i n conduct iv i ty of t h e seepage water and t h e
overflow. Occasional d e t a i l e d s t u d i e s were made of processes such a s
sedimentat ion wi th sediment t r a p s , r e a e r a t i o n wi th a f l o a t i n g cap purged
with n i t rogen , seepage and sediment oxygen demand. Resu l t s w i l l be pre-
sen ted f o r t he oxygen dynamics, t h e b a c t e r i a l die-off and accumulation
of heavy metals .

3 OXYGEN
The i n t e r p r e t a t i o n of t h e observed oxygen concen t r a t i on a f t e r an over-
f low has been based on t h e b a s i s of i dea l mixing i n t he pond. Th i s i s
c e r t a i n l y n o t j u s t i f i e d f o r t h e i n i t i a l s t a g e s of t h e even t . Three
per iods can be d i scerned:
- t h e per iod dur ing t h e overf low, gene ra l l y i n t h e order of hours and
occas iona l ly up t o ha l f a day. I n t h i s s t age t h e l e v e l i n t h e pond
w i l l r i s e , r e s u l t i n g i n an increased outf low a t t h e o u t l e t we i r . The
flow p a t t e r n i n t h e pond i s c o n t r o l l e d mainly be t h e impuls of t h e
d i scharge and t o a l e s s e r e x t e n t by t h e f low regime induced by t h e
o u t l e t .
- a f t e r the end of t h e overf low, t h e l e v e l i n t h e pond w i l l g r adua l l y
r e t u r n t o i ts equ i l i b r i um i n which t he i n f i l t r a t i o n r a t e i s equa l t o
t he d i scharge over t h e wei r . I n t h i s period t h e f low p a t t e r n w i l l be
cha r ac t e r i s ed by t h e flow a t t h e o u t l e t an by wind. The length of t h i s
per iod i s i n t h e range of a few hours up t o ha l f a day.
- t h e t h i r d s t a g e i s t he equ i l i b r i um condi t ion i n which wind c o n t r o l s
t h e mixing cond i t i ons and pos s ib ly dens i t y d i f f e r e n c e s between t h e
i n f i l t r a t i n g co ld groundwater and t h e water i n t h e pond.
During t he two i n i t i a l s t age s t h e assumption of i d e a l mixing i s no t
c o r r e c t because n e t advec t ive t r a n s p o r t p lays a dominant r o l e . However,
t h e length of t h i s per iod -Less t han one day- i s much s h o r t e r t han t h e
t ime s c a l e of t h e processes c o n t r o l l i n g t he oxygen concent ra t ion ; s ee
f i g u r e 3c. During t h e t h i r d pe r i od no major d i f f e r e n c e s i n concentra-
t i o n s of v a r i a b l e s a t t h e measuring p o i n t s were observed, so t h a t a t
l e a s t f o r t h e s e s i t e s i d e a l mixing could be assumed. The sensors were
loca ted a t mid-depth i n t h e pond.
The equa t ions f o r t h e BOD and 02 concen t r a t i on i n t h i s per iod can be
w r i t t e n a s :

i n which
L the u l t imate BOD concentrat ion
Lin the u l t imate BOD i n t h e i n f i l t r a t i n g water
02 the ac tua l oxygen concentrat ion
O z s t he sa tu ra t ion concentrat ion of oxygen
Kd the deoxygenation r a t e cons tant
T the hydraul ic de tent ion time
KL the mass t r a n s f e r coe f f i c i en t f o r oxygen
a t the air-water i n t e r f ace
SOD the sediment oxygen demand
D depth of t h e water
The processes considered a r e deoxygenation by decay of organic matter
(BOD) , outflow of BOD and oxygen, input of BOD by the seepage, consumption
of oxygen by the sediments and reaera t ion . BOD removal due t o s e t t l i n g
i s considered t o be minimal i n t h e t h i r d period, t he i n f i l t r a t i o n water
i s anoxic and primary production can be neglected f o r t he period under
consideration. The so lu t ion of equations 1 and 2 r equ i r e s assessment
of the correc t parameters and i n i t i l l condit ions.
The hydraulic res idence has been est imated from t h e observed conductivi-
t y a t loca t ion P I , see f igu re 3a. The i n f i l t r a t i n g water has a higher
conductivity than the mixture of storm water and pond water a f t e r an
event. The b e s t - f i t t i n g value f o r T obtained i n t h i s way is 2.8 day,
which i s much shor t e r than the value obtained from the average i n f i l -
t r a t i o n r a t e (T - 9 days). Two reasons can a t l e a s t p a r t l y explain the
discrepancy:
- t he i n f i l t r a t i o n r a t e v a r i e s , t h e observed range being 3-16 cmlday and
during heavy r a i n f a l l periods t h e higher ground water t a b l e w i l l en-
hance the i n f i l t r a t i o n r a t e
- t h e well-mixed assumption is no t v a l i d ; t h i s may be due t o the
presence of dead zones, e.g. i n t he corners of t h e r e se rvo i r o r i n
areas with growth of Potamogeton natans. Also small temperature
d i f ferences between the (cold) i n f i l t r a t i o n water and the pond water
may cause inhomogeneity during calm weather condit ions.
The BOD decay r a t e constant has been assessed from t h e da t a of f i g u r e 3b
by appl ica t ion of equation 1 . The value obtained i n t h i s way i s Kd =
0.22 day-l i s normal f o r the condi t ions .

Figure 3 Measured and simulated conductivity ( a ) , BOD concentration
and oxygen concentration (c) a t locat ion P1

Mass t r a n s f e r c o e f f i c i e n t measurements f o r oxygen ac ro s s t h e air-water
i n t e r f a c e y i e lded an average va lue of 0.185 mlday.
Although d i r e c t e s t ima t e s of t h e sediment oxygen demand were a v a i l a b l e
from column experiments i n t h e l abo ra to ry , t h e s e va lue s cannot be
considered a s r e p r e s e n t a t i v e due t o t h e absence of i n f i l t r a t i o n i n t h e s e
columns. Hence t h e SOD was es t imated by a p p l i c a t i o n of equa t ion 2 f o r
s t a t i o n a r y cond i t i ons , a = 0 , i n a per iod without primary production d t
(no d a i l y v a r i a t i o n i n 02 concen t r a t i on ) , o r :
1 SOD KL - - 02 - - - KdL + - (Ozs- 02) = 0 D D
With .c = 2.8 day, D = l , Kd = 0 . 2 2 d- l , L = 4 g/m3, KL =0 .185 m/d,
O z s = 11 g/m3 and 02 = 1 g/m3 t h i s r e s u l t s i n a SOD = 0.6 g/mZ.d. This
va lue i s t h e r e s u l t of ba lanc ing terms which a r e s u b j e c t t o experimental
e r r o r and t h e r e f o r e con t a in s a l l model and parameter u n c e r t a i n t i e s .
F igu re 3c compares measured and s imula ted 02 concen t r a t i ons f o r an event
i n october 1984 i n which 4200 m3 stormwater was d i scharged . Af t e r 4-5
days a minimum O2 concen t r a t i on i s r2ached, t h e low r e a e r a t i o n r a t e than
causes a slow i n c r e a s e t o t h e 1 g/m3 equ i l i b r i um va lue . The i n i t i a l h igh
va lue of about 6 g/m3 i s due t o t h e oxygen conten t of t h e discharged
storm water .
I n t h e sp r i ng and summer t h e primary production p r even t s t h e occurrence
of prolonged anoxic pe r i ods .
4 BACTERIOLOGICAL QUALITY
The ob j ec t i ve of t h i s p a r t of t he i n v e s t i g a t i o n s was t o a s s e s s t h e
magnitude and d u r a t i o n of b a c t e r i a l p o l l u t i o n a f t e r a n overflow.
The normal sampling frequency was biweekly, bu t a f t e r an event sampling
was i n t e n s i f i e d t o a maximum of one sample per day. The water was
analysed f o r - Feca l s t r e p t o c o c c i
- E. c o l i
- Tota l c o l i
- Feca l c o l i

Figure 4 shows d a t a on E . c o l i , o t h e r i n d i c a t o r organisms showed a
s im i l a r behaviour.
log ( n/100 rnl. )
91
weeks
Figure 4 Observed number of E . c o l i a t l o c a t i o n P1
Overflows cause a sharp i nc r ea se i n numbers, followed by a gradua l de-
c r ea se caused by - die-off and pos s ib ly graz ing
- sedimentat ion
- d i l u t i o n by t h e i n f i l t r a t i n g water
The o v e r a l l removal r a t e a s ga thered from t h e observed concent ra t ions is
about 1 day-l, which means t h a t it t akes about 2 weeks before t h e con-
c e n t r a t i o n i s reduced from 107 micro organisms pe r 100 m 1 i n i t i a l l y t o
t h e background concen t r a t i on of 10-100 micro organisms per 100 m l .
The con t r i bu t i on of d i l u t i o n t o t h e o v e r a l l removal r a t e i s about
0.35 day-l. The numbers i n sediment t r a 7 s were occa s iona l l y a l s o e s t i -
mated and compared w i th t h e concen t r a t i ons i n t h e ove r ly ing water . From
t h i s an es t imate of t h e sedimentat ion r a t e can be ob ta ined . This va lue
i s b iassed by growth andlor die-off i n the sediment t r a p and s u b j e c t t o
cons iderab le experimental e r r o r . Most r e s u l t s however i n d i c a t e t h a t
a f t e r t he two f i r s t phases of an event which a r e c o n t r o l l e d by t h e
hydrau l ic phenomena, s e t t l i n g i s of minor importance and gene ra l l y l e s s
than 0.1 day-l. Hence t he die-off r a t e i s around 0.6 day-l a t t h e envi -
ronmental cond i t i ons (Temp 2 14OC, pH = 6.5-7.0). Th i s is s i m i l a r t o
l i t e r a t u r e d a t a (Gordon e t a l . , 1978).

It i s well known t h a t t he survival of pathogens and indica tor organisms
i n sediments i s b e t t e r than i n aerobic water. Therefore we a l s o measured
the numbers in the sediment. The average numbers i n 100 m 1 sediment a r e :
Fecal c o l i to6 Total c o l i 3 . 1 0 ~
Fecal s t reptococci 1 .104
These numbers a r e considerably higher on a volumetric b a s i s than f o r the
water phase. Figure 5 shows the change i n numbers per gram of sediment
( top 10 cm of sediment sampled) i n a period with two successive events.
log ( n/g)
Figure 5 Observed number of E . c o l i i n sediment a t l oca t ion L1 ( top
10 cm of sediment samples)
Sedimentation apparently induces a marked increase i n numbers; the sub-
sequent decrease apparently i s rrmch lower than i n the water phase. A s
t h e s c a t t e r i n d a t a w i l l be high due t o loca l v a r i a t i o n s in numbers,
poor r ep roduc ib i l i t y of the sediment sampling procedures i n the f i e l d
and experimental e r r o r s i n the separa t ion of b a c t e r i a and sediment par-
t i c l e s , the survival has been measured a l s o i n the laboratory. This
would reduce t h e f i r s t two e r r o r s mentioned.

Figure 6 shows t h e r e s u l t s ; t h e die-off r a t e is s i m i l a r a s i n f i g u r e 5
and of t he o rde r of 0.1 day-l. Hence an enhanced i n i t i a l concen t r a t i on
of 1o5Igram w i l l be reduced t o t h e average observed background concen-
t r a t i o n of 1 0 ~ 1 ~ r a m i n about 2 months. As t h e recur rence of overf low
events i s of t h e o rde r of 1-2 months t h i s exp l a in s t he cont inuous ly
enhanced background concen t r a t i on i n t he sediment.
log ( n/g 1
4 l
weeks
Figure 6 Surv iva l of E . c o l i i n sediment measured i n t h e l abo ra to ry
A genera l conc lus ion i s t h a t sediments around storm water sewer o u t f a l l s
w i l l be contaminated more o r l e s s permanently with pathogens and i nd i -
c a t o r organisms and so a r e a p o t e n t i a l source of i n f e c t i o n .
5 ACCUMULATION OF HEAVY METALS
This i s a sub j ec t where t h e t o t a l load ing of t h e system i s of more
i n t e r e s t than i n i t i a l mixing and d i spe r s i on . The a n a l y s i s of sediment
around t h e o u t f a l l w i l l g ive a n i n d i c a t i o n of t h e accumulation of heavy
meta l s and of t h e d i s t r i b u t i o n of t h e contaminated sediment i n space.
For t h i s purpose i n 1984 t h e t h i cknes s of t h e s ludge over ly ing t h e o r i g -
i n a l sandy sediment ha s been measured monthly and t h e conten t of t h r e e
r e p r e s e n t a t i v e heavy metals was es t imated . F igure 7 shows t he r e s u l t s .

depth of sed~ment layer
Figu re 7 Depth of sediment l a y e r and conten t of C u , Pb and Zn a t
l oca t i ons L 1 , L2 and L3

These r e s u l t s i nd ica t e c l e a r l y gradients i n thickness and concentrations.
The stagnant charac ter of the rece iv ing water i s responsible f o r t h i s
behaviour but d e t a i l s of the mechanisms r e s u l t i n g i n the e x i s t i n g con-
d i t i o n cannot be e luc idated due t o lack of d e t a i l e d information (resus-
pension, mobi l i sa t ion of heavy metals , concentrat ion r e l a t e d t o p a r t i c l e
s i z e d i s t r i b u t i o n and s e t t l i n g r a t e s as r e l a t ed t o s i z e e t c . ) .
The rough es t imate of the t o t a l quan t i ty of heavy metals from the
avai lable da t a ( f igu re 6) has been compared with the a n a l y t i c a l d a t a of
the 55 overflows sampled during th ree years. Combined with the age of
the pond, 15 years , ex t rapola t ion of the t o t a l loading of the pond i s
possible. Assuming t h a t the heavy metals a r e mainly associa ted with the
suspended s o l i d s and taking i n t o account t h a t about 60% of the p a r t i c l e s
a re re ta ined i n the pond, the expected accumulation can be ca lcula ted;
s ee t ab le 11.
Table I1 Accumulation and input of heavy metals
Metal Tota l load Loading of Observed %
(kg) sediment (kg)
(60%), kg
Cu 35 2 1 8 38
Pb 52 3 1 15 48
Zn 107 6 4 60 9 4
The t ab le suggests t h a t the es t imate f o r Zn i s f a i r l y good, but t h a t Cu
and Pb e i t h e r a r e mobilised o r t h a t the input based on the more r ecen t
da ta has been overestimated due t o a gradual increase i n loading. Mobi-
l i z a t i o n i s not a probable explanation because Zn i s genera l ly much more
mobile than Cu and Pb. A gradual increase of Pb contamination i n the
watershed due t o t r a f f i c is c e r t a i n l y a reasonable argument but espe-
c i a l l y f o r Cu the t rend i n the percentages cannot be explained.
The l eve l of contamination of the sludge i s we l l below the standards i n
the Netherlands f o r d isposal of chemical res idues o r f o r appl ica t ion of
sewage sludge on farm land.

REFERENCES
GORDON, R.W. and FLIERMANS, C . B . , 1978. Surv iva l and v i a b i l i t y of
Escherichia c o l i i n a thermal a l t e r e d r e se rvo i r . Water Res. 12:
343-352.


WATER MANAGEMENT PLANNING IN URBAN AREAS
J.J. de Graeff
1 INTRODUCTION
The f i r s t s u b j e c t t h a t w i l l be d e a l t w i t h is w a t e r management p l a n n i n g
i n u rban a r e a s . It s h o u l d be b r i e f l y r e c a l l e d what form w a t e r management
p l a n n i n g w i l l t a k e i n t h e f u t u r e ( t h i s was t h e s u b j e c t o f t h e CHO-
c o n f e r e n c e i n Lun te ren i n s p r i n g 1984) . Second ly , t h e r o l e o f towns
and c i t i e s i n t h i s r e s p e c t w i l l be c ~ n s i d e r e d and t h e p a r t p layed
by t h e m u n i c i p a l a u t h o r i t i e s i n c o n n e c t i o n w i t h p l a n n i n g w i l l be
b r i e f l y d e s c r i b e d . T h i r d l y and f i n a l l y , i n s l i g h t l y more d e t a i l
a t t e n t i o n w i l l be p a i d t o t h e r e s p e c t i v e t a s k s o f t h e m u n i c i p a l
a u t h o r i t i e s and t h e wa te r -boa rds w i t h r e g a r d t o l o c a l w a t e r management
and n o t j u s t p l a n n i n g . A l l o f t h e s e a r e s u b j e c t s which w i l l be
t r e a t e d i n t h e o t h e r p a p e r s , s o h e r e o n l y an i n t r o d u c t i o n w i l l be
g i v e n .
2 WATER MANAGEMENT PLANNING I N URBAN AREAS
F i r s t o f a l l , t h e f u t u r e w a t e r management p l a n n i n g w i l l be c o n s i d e r e d .
The r e p o r t o f t h e las t CHO-meeting ( P r o c e e d i n g s and I n f o r m a t i o n No 3 2 )
o u t l i n e d how p l a n n i n g w i l l be o r g a n i z e d i n f u t u r e . I n a n u t s h e l l , it
may be s a i d t h a t t h e v a r i o u s e x i s t i n g p l a n n i n g a r r a n g e m e n t s w i l l be
i n t e g r a t e d w i t h e a c h o t h e r . On t h e o n e hand t h i s is d e s i r a b l e as
a means o f s t r e a m l i n i n g and s i m p l i f y i n g r e g u l a t i o n s as p a r t o f t h e
gove rnmen t ' s p o l i c y o f d e r e g u l a t i o n , w h i l e on t h e o t h e r hand it is

based on t h e c o n s i d e r a t i o n t h a t w a t e r q u a l i t y and w a t e r q u a n t i t y
a r e i n t e r r e l a t e d m a t t e r s , a s a r e t h e management o f s u r f a c e w a t e r s
and g roundwate r . The e x i s t i n g P o l i c y Document on Water Management
and I n d i c a t i v e Mul t i -year Programme f o r Water w i l l be amalgamated
i n t o a s i n g l e P o l i c y Document on Water Management;, i n d i c a t i n g t h e main
l i n e s o f t h e p o l i c y t o be pu r sued by c e n t r a l government on w a t e r
management i n t h e N e t h e r l a n d s .
A t t h e p r o v i n c i a l l e v e l , t h e w a t e r q u a l i t y p l a n s , t h e g roundwate r
p l a n s and t h e envisaged p l a n n i n g i n r e l a t i o n t o w a t e r q u a n t i t y
a r e s i m i l a r l y t o be i n c o r p o r a t e d i n t o a s i n g l e p r o v i n c i a l w a t e r
management p l a n , c o n t a i n i n g t h e main o u t l i n e s o f p r o v i n c i a l w a t e r
management p o l i c y . The main i n s t r u m e n t o f p r o v i n c i a l p l a n n i n g is
t h e d e s i g n a t i o n o f w a t e r s t o pe r fo rm p a r t i c u l a r f u n c t i o n s .
In t h i s way i t is i n t e n d e d t h a t t h e broad o u t l i n e s o f p o l i c y on
w a t e r management, p h y s i c a l p l a n n i n g and t h e env i ronmen t w i l l be
harmonized.
A t t h e management l e v e l it is e n v i s a g e d t h a t management p l a n s
s h o u l d be drawn up which i n d i c a t e i n c o n c r e t e terms what t h e manager
i n t e n d s t o do i n o r d e r t o pe r fo rm h i s d u t i e s and how h i s p l a n s
f i t i n w i t h t h e o t h e r a r e a s o f p o l i c y ment ioned b e f o r e . P r o v i s i o n
h a s n o t been made f o r comple te i n t e g r a t i o n o f management p l a n s ,
because d i f f e r e n t a u t h o r i t i e s may be r e s p o n s i b l e f o r a d m i n i s t e r i n g
q u a l i t a t i v e and q u a n t i t a t i v e a s p e c t s . Of c o u r s e , it is d e s i r a b l e
t h a t management p l a n s s h o u l d be drawn up i n c l o s e c o n s u l t a t i o n
between t h e a u t h o r i t i e s c o n c e r n e d , and d e f a c t o i n t e g r a t i o n o f
management p l a n s would be a n a t u r a l and d e s i r a b l e g o a l t o aim a t
i n c a s e s where a s i n g l e a u t h o r i t y is v e s t e d w i t h t h e v a r i o u s
r e s p o n s i b i l i t i e s . I n t e g r a t i o n o f management p l a n s h a s t h e r e f o r e
t o become a s t a t u t o r y o b l i g a t i o n i n t h e c a s e o f w a t e r s a d m i n i s t e r e d
by t h e c e n t r a l gove rnmen t .
The p l a n n i n g s t r u c t u r e d e s c r i b e d , i s t o be l a i d down i n t h e B i l l
on t h e Water Management c u r r e n t l y b e f o r e t h e Lower-House o f
P a r l i a m e n t ; i n March t h i s y e a r t h e M i n i s t e r o f T r a n s p o r t and
P u b l i c Works t a b l e d a d r a f t amendment f o r t h i s p u r p o s e d u r i n g t h e

a d v i s o r y s t a g e o f t h e B i l l . T h i s w i l l be fo l lowed by t h e memorandum
i n r e p l y , accompanied by t h e f i n a l i z e d amendment, a f t e r which t h e
P a r l i a m e n t a r y p r o c e d u r e w i l l r un i t s c o u r s e . Assuming t h a t t h e
amendment becomes l a w , t h e e x i s t i n g p l a n n i n g r e g u l a t i o n s w i l l be
d e l e t e d from t h e P o l l u t i o n o f S u r f a c e Waters Ac t , t h e Groundwater
Act and t h e c u r r e n t Water Management B i l l .
I n t h e d e s c r i p t i o n s o f a r no men t ion w a s made o f t h e r e l a t i o n s h i p
between w a t e r management p l a n s a t c e n t r a l , p r o v i n c i a l and management
l e v e l o r between w a t e r management p l a n s and e n v i r o n m e n t a l p o l i c y
p l a n s . It may be s u f f i c i e n t t o o b s e r v e on t h e one hand t h a t a
c e r t a i n h i e r a r c h y e x i s t s among t h e w a t e r management p l a n s o f t h e
v a r i o u s a u t h o r i t i e s ; p l a n n e r s a t t h e more l o c a l l e v e l must a lways
b e a r i n mind t h e c o n s t r a i n t s which s p r i n g from t h e p o l i c y l a i d down
by t h e more c e n t r a l a u t h o r i t y o r a u t h o r i t i e s . On t h e o t h e r hand
it is a l s o i m p o r t a n t t h a t e a c h a u t h o r i t y shou ld remain i n a p o s i t i o n
t o perr'orm i t s own r e s p o n s i b i l i t i e s . The f a c t t h a t a h i e r a r c h y e x i s t s
d o e s n o t mean t h a t p l a n n e r s a t a h i g h e r l e v e l o f government a r e f r e e
t o u s u r p t h e powers and r e spons ib i? . i t i e s o f t h o s e a t lower l e v e l s .
T h i s is an a r e a o f p o t e n t i a l c o n f l i c t c o n c e r n i n g on which s t r o n g
v iews a r e h e l d by some o f my c o l l e a g u e s . For t h e moment t h i s p o i n t
w i l l n o t be t a k e n : it is hoped t h a t t h e M i n i s t e r w i l l make r a p i d
p r o g r e s s i n t h e f u r t h e r p r o c e s s i n g o f t h e B i l l . I n t h e c o u n t r y a t
l a r g e , t h e v a r i o u s a u t h o r i t i e s whom it c o n c e r n s a r e a l r e a d y
implement ing t h e p l a n s f o r t h e new p l a n n i n g s t r u c t u r e . On t h e one hand ,
t h i s p r o c e s s c o u l d be promoted by p r o v i d i n g a f o r m a l b a s i s f o r i t ,
w h i l e on t h e o t h e r hand u n n e c e s s a r y and u n d e s i r a b l e d i s c r e p a n c i e s i n
form, c o n t e n t and p r o c e d u r e s c o u l d t h u s be a v o i d e d .
Municipal a u t h o r i t i e s .
The f i r s t p o i n t t o be made a b o u t t h e r o l e o f t h e m u n i c i p a l a u t h o r i t i e s
i n t h e new p l a n n i n g s t r u c t u r e is t h a t t h e m u n i c i p a l i t i e s have a
l o t o f work t o do i n c o n n e c t i o n w i t h w a t e r management, p a r t i c u l a r l y
i n u rban a r e a s . The o t h e r a r t i c l e s of t h e p r e s e n t Repor t w i l l ,
no d o u b t , p r o v i d e a c l e a r a c c o u n t o f t h e m a t t e r . Here o n l y a few
examples w i l l be g i v e n . When e x p a n s i o n p l a n s a r e implemented, l a n d
must be d r a i n e d s o as t o a c h i e v e and m a i n t a i n a n a p p r o p r i a t e

groundwate r l e v e l . Among t h e i n f r a s t r u c t u r a l components which may be
r e q u i r e d a r e pumps, w e i r s , w a t e r c o u r s e s and r e s e r v o i r s t o d r a i n
water i n t o . It i s e s s e n t i a l t o have a n a d e q u a t e d r a i n a g e sys tem i n
o r d e r t o manage w a t e r q u a l i t y p r o p e r l y , w h i l e a n o t h e r precondition
is f l o w and a d e q u a t e renewal o f u r b a n w a t e r s . The f u n c t i o n s o f s u c h
w a t e r s a r e i n t i m a t e l y l i n k e d w i t h t h e p l a n n i n g o f u rban l and-use .
The l a s t example w h i l e on t h i s s u b j e c t is a r e c e n t p u b l i c a t i o n by t h e
C i v i l Eng inee r ing P lann ing Department o f t h e D e l f t University o f
Technology c o n c e r n i n g t h e problem o f h i g h w a t e r l e v e l s i n a n u rban
a r e a . It 1s e n t i t l e d : "When it r a i n s we ho ld o u r b r e a t h f t - a
s t r i k i n g i l l u s t r a t i o n o f t h e h o r i z o n t a l l i n k s wh ich , a s I have
i n d i c a t e d , e x i s t i n t h e work o f p u b l i c a d m i n i s t r a t i o n . Th i s be ing s o ,
it is e s s e n t i a l t h a t t h e m u n i c i p a l a u t h o r i t y shou ld be c l o s e l y i n v o l v e d
i n t h e p l a n n i n g o f w a t e r c o n t r o l a t management l e v e l . The q u e s t i o n
is how t h i s i nvo lvemen t s h o u l d be e x p r e s s e d . In t h i s c o n t e x t f l r s t l y
r e f e r e n c e can be made t o s e c t i o n 12 o f t h e Water Management B i l l as
it would r e a d i f t h e M i n i s t e r ' s d r a f t amendment i s a d o p t e d .
S u b s e c t i o n 1 l a y s down t h a t whoever is r e s p o n s i b l e f o r a d m i n i s t e r i n g
s u r f a c e w a t e r s may draw up a management p l a n f o r them. For example ,
m u n i c i p a l a u t h o r i t i e s may do s o , p a r t i c u l a r l y i n c a s e s where p a r t
o f a n u rban a r e a is withdrawn f rom t h e a u t h o r i t y o f a water-board
because it i s s e p a r a t e d from a p o l d e r and i n c o r p o r a t e d i n t o t h e
t e r r i t o r y o f a m u n i c i p a l i t y f o r t h e pu rpose o f w a t e r management.
I f a n o t h e r gove rnmen ta l body is r e s p o n s i b l e f o r a d m i n i s t e r i n g
q u a n t i t y o r q u a l i t y , t h e power t o draw up management p l a n s f o r t h e
a r e a conce rned is v e s t e d i n t h e body c o n c e r n e d . I n v i r t u a l l y e v e r y c a s e
t h i s i s t h e wa te r -boa rd ; a t l e a s t , t h i s is t r u e i f we d i s r e g a r d
Groningen, F r i e s l a n d and U t r e c h t , where t h e p r o v i n c i a l a u t h o r i t i e s
a r e r e s p o n s i b l e f o r w a t e r q u a l i t y .
Thus i n many p l a c e s i t is t h e water-board which i s r e s p o n s i b l e f o r
"p lann ing" , w h i l e i n some towns b o t h t h e water-board and t h e
m u n i c i p a l a u t h o r i t i e s w i l l draw up management p l a n s . P b r e o v e r , t h e r e
is a t r e n d f o r more e n v i r o n m e n t a l powers (and i n some c a s e s powers
i n t h e s p h e r e o f w a t e r management) t o be v e s t e d i n t h e m u n i c i p a l
a u t h o r i t i e s i n t h e f o u r l a r g e s t c i t i e s , s o t h a t it i s n o t

i n c o n c e i v a b l e t h a t i n some c a s e s t h e m u n i c i p a l a u t h o r i t i e s may be
t h e o n l y o n e s t o draw up management p l a n s (on a n integrated b a s i s
o r o t h e r w i s e ) . I n view o f t h i s s i t u a t i o n , two p o i n t s w i l l be r a i s e d ,
which w i l l form t h e t h i r d and f i n a l s e c t i o n o f t h i s p a p e r .
3 TASKS OF MUNICIPALITIES A N D WATER-BOARDS
F i r s t l y , r e g a r d l e s s o f who i s r e s p o n s i b l e f o r d rawing up w a t e r
management p l a n s , c l o s e c o o p e r a t i o n between t h e m u n i c i p a l a u t h o r i t i e s
and t h e water-board w i l l be e s s e n t i a l i n u rban a r e a s a s a means o f
e n a b l i n g w a t e r management and p h y s i c a l p l a n n i n g t o be p r o p e r l y
c o o r d i n a t e d . T h i s is ve ry i m p o r t a n t , s i n c e on t h e o n e hand w a t e r
management i n u r b a n a r e a s is c l o s e l y bound up w l t h a r e a s o f p o l i c y
f o r which t h e m u n i c i p a l a u t h o r i t i e s a r e r e s p o n s i b l e and on t h e
o t h e r hand it is e v i d e n t t h a t u r b a n w a t e r management d o e s n o t s t o p
a t t h e b o u n d a r i e s o f t h e m u n i c i p a l i t y b u t i s i n d i s s o l u b l y l i n k e d t o
w a t e r management t h r o u g h o u t t h e a r e a f o r which t h e water-board i s
r e s p o n s i b l e .
In t h i s c o n n e c t i o n it is g r a t i f y i n g t h a t t h e Ac ton P h y s i c a l P lann ing
i s be ing r e v i e w e d , and t h a t it w i l l b e s t i p u l a t e d i n t h e Act t h a t
t h e burgomaster and a ldermen a r e o b l i g e d t o c o n s u l t t h e a p p r o p r i a t e
wa te r -boa rds when p r e p a r i n g a s t r u c t u r e p l a n o r development p l a n .
Conver se ly , wa te r -boa rds a r e r e q u i r e d t o c o n s u l t t h e a p p r o p r i a t e
m u n i c i p a l a u t h o r i t i e s when p r e p a r i n g management p l a n s . The model
management p l a n s drawn up by t h e A s s o c i a t i o n o f Water-Boards l i k e w i s e
recommend t h i s . The B i l l on t h e Water Management d o e s n o t l a y down
any such o b l i g a t i o n , b u t l e a v e s it t o P r o v i n c i a l C o u n c i l s t o
r e g u l a t e t h e p r e p a r a t i o n o f management p l a n s . It is t o be hoped
t h a t P r o v i n c i a l C o u n c i l s w i l l b e a r t h i s p o i n t i n mind when d rawing
up t h e i r r e g u l a t i o n s ; however, t h e q u e s t i o n a r i s e s why t h e B i l l
d o e s n o t p r o v i d e f o r t h e m a t t e r t o be r e g u l a t e d by Order i n Counc i l .
If t h i s would be d o n e , t h e a r r a n g e m e n t s f o r water management would
be s i m i l a r t o t h o s e f o r p h y s i c a l p l a n n i n g , and u n n e c e s s a r y
d i s c r e p a n c i e s between p r o c e d u r e s would be a v o i d e d .

A s a l a s t p o i n t on t h e s u b j e c t o f c o o p e r a t i o n it is wor thwhi l e t o
r e c a l l t h e G u i d e l i n e s on t h e A d m i n i s t r a t i o n o f Water Defences and
Water Q u a n t i t y Pknagement i n R e l a t i o n t o t h e C o n s t r u c t i o n o f
B u i l d i n g s by W n i c i p a l i t i e s , known f o r s h o r t a s " t h e G u i d e l i n e s
w i t h t h e l o n g name", which were p u b l i s h e d r e c e n t l y by t h e A s s o c i a t i o n
o f Water-Boards. These G u i d e l i n e s , which M r Dragt w i l l d e a l w i t h i n
h i s p a p e r c o n t a i n a number o f u s e f u l r u l e s f o r r e l a t i o n s between
m u n i c i p a l a u t h o r i t i e s and wa te r -boa rds where t h e r e a r e u rban
expans ion p l a n s .
The s u b j e c t o f t h e G u i d e l i n e s , which a r e based on t h e a s sumpt ion
t h a t t h e u rban a r e a is w i t h i n a water-board a r e a , c o n d u c t s t o t h e
ve ry l a s t s u b j e c t . The p o i n t is whe the r it is r e a l l y d e s i r a b l e
t h a t wa te r management p l a n n i n g i n u rban a r e a s s h o u l d be p a r t l y
t h e r e s p o n s i b i l i t y o f t h e m u n i c i p a l a u t h o r i t i e s and p a r t l y t h a t o f t h e
water-board . There a r e o b j e c t i o n s t o t h i s on p r a c t i c a l g r o u n d s ,
t o name b u t one a s p e c t . It means t h a t bo th must a c q u i r e e x p e r t i s e
and employ manpower i n t h e same f i e l d . T h i s is a p o i n t which h a s a l s o
been t a k e n i n t o a c c o u n t i n t h e deregulation o p e r a t i o n t o which was
r e f e r r e d e a r l i e r . Such f r a g m e n t a t i o n o f r e s p o n s i b i l i t y is c o n t r a r y
t o t h e p o l i c y o f s t r e a m l i n i n g and c l a r i f y i n g s t r u c t u r e s . But t h e
i s s u e g o e s d e e p e r t h a n t h i s . The e s s e n t i a l p o i n t is how w a t e r
management s h o u l d be o r g a n i z e d i n u r b a n a r e a s ; r e s p o n s i b i l i t y f o r
p l a n n i n g is mere ly a consequence o f t h i s . T h i s h a s been a t o p i c a l
i s s u e f o r some t i m e i n c o n n e c t i o n w i t h d i s c u s s i o n s on t h e p r o s and
c o n s o f w i thd rawing r e s p o n s i b i l i t y f o r p a r t s o f p o l d e r s f rom w a t e r -
boa rds and v e s t i n g it i n m u n i c i p a l a u t h o r i t i e s . The r e c e n t p l a n s o f
North Hol land P r o v i n c i a l Counc i l t o make t h e m u n i c i p a l i t y o f
Amsterdam e n t i r e l y r e s p o n s i b l e f o r w a t e r q u a l i t y management i n
Amsterdam, and more g e n e r a l l y t h e c u r r e n t i d e a s a b o u t t r a n s f e r r i n g
powers t o t h e m u n i c i p a l a u t h o r i t i e s i n t h e f o u r l a r g e s t c i t i e s i n
t h e Ne the r l ands (Amsterdam, Ro t t e rdam, The Hague and U t r e c h t )
c o n t r i b u t e towards t h i s t o p i c a l i t y . The s u b j e c t is a d e l i c a t e o n e ,
n o n e t h e l e s s a few words must be s a i d a b o u t it.
I n t h e a u t h o r ' s v iew t h e q u e s t i o n o f what a u t h o r i t y s h o u l d be
r e s p o n s i b l e f o r w a t e r management as a m a t t e r o f p r i n c i p l e is

fundamen ta l . The government g a v e a c l e a r acswer t o it i n i t s 1977
p o l i c y document "Towards a new management o f w a t e r - b o a r d s , i n which
it n o t e d t h a t r e s p o n s i b i l i t y f o r w a t e r management and w a t e r d e f e n c e s
s h o u l d be d e t e r m i n e d i n a c c o r d a n c e w i t h n a t u r a l g e o g r a p h i c a l
b o u n d a r i e s on g r o u n d s o f e f f i c i e n c y and c o h e s i o n o f p o l i c y . It f u r t h e r
n o t e d t h a t c e r t a i n g r o u p s a r e p a r t i c u l a r l y conce rned w i t h w a t e r
management. It was conc luded t h a t u n d e r t h e s e c i r c u m s t a n c e s t h e
water-board was b e s t s u i t e d t o t a k e r e s p o n s i b i l i t y f o r l o c a l and
r e g i o n a l wa te r management. By making wa te r -boa rds r e s p o n s i b l e f o r
w a t e r management o n e e n s u r e s t h a t t h e a u t h o r i t y and t h e s u b j e c t
f o r which it is r e s p o n s i b l e a r e s u i t e d t o e a c h o t h e r and t h a t t h o s e
p a r t i e s who a r e most c o n c e r n e d , and who t h e m s e l v e s b e a r t h e f i n a n c i a l
c o s t s , p a r t i c i p a t e i n a d m i n i s t r a t i o n .
However, t h e p o l i c y document went on t o s a y t h a t it was i m p o r t a n t t o
p r o v i d e s a f e g u a r d s f o r t h e d e s i r e d i n t e r a c t i o n between t h e s p e c i a l -
pu rpose body and t h e g e n e r a l a d m i n i s t r a t i v e body and t o a d a p t t h e
s t r u c t u r e o f t h e water-board i t s e l f , i n t e r a l i a t o t a k e a c c o u n t o f
t h e f a c t t h a t a w i d e r r a n g e o f i n t e r e s t s need t o be c o n s i d e r e d unde r
t h e h e a d i n g o f w a t e r management nowadays t h a n used t o be t h e c a s e .
The g e n e r a l t e n o r o f t h i s t h e s i s and c o n c l u s i o n was a c c e p t e d by
t h e Lower-House o f P a r l i a m e n t i n 1978. The p r e s e n t government
c o n t i n u e d p r e v i o u s p o l i c y i n t h e 1984 P o l i c y Document on Water
Management which was men t ioned .
The i d e a s quo ted remain a s v a l i d a s e v e r , and a p p l y i n t h e i r e n t i r e t y
t o r e l a t i o n s between m u n i c i p a l a u t h o r i t i e s and wa te r -boa rds .
The main d e c i s i o n i s whether a d m i n i s t r a t i v e d i s t r i c t s f o r t h e
management o f w a t e r shou ld f o l l o w m u n i c i p a l b o u n d a r i e s o r t h e
g e o g r a p h i c a l b o u n d a r i e s s u g g e s t e d by t h e r o u t e s o f w a t e r c o u r s e s
and t h e b o u n d a r i e s o f o t h e r s u r f a c e w a t e r s . The l a t t e r is p r e f e r a b l e .
The problems c a u s e d by i g n o r i n g m u n i c i p a l b o u n d a r i e s , which owe
t h e i r e x i s t e n c e t o a d m i n i s t r a t i v e c o n s i d e r a t i o n s , c a n more r e a d i l y
be s o l v e d by c o o p e r a t i o n t h a n c a n t h e problems which would be
c a u s e d by i g n o r i n g n a t u r a l g e o g r a p h i c a l b o u n d a r i e s . To c u t a c r o s s
g e o g r a p h i c a l b o u n d a r i e s would a l s o be c o n t r a r y t o t h e a im o f
i n t e g r a t i n g water management, which t h e c u r r e n t B i l l on t h e

Water Management is i n t e n d e d t o a c h i e v e . It must be r e a l i z e d t h a t
any v i o l a t i o n o f t h e p h y s i c a l g e o g r a p h i c a l u n i t which t h e t e r r i t o r y
o f a water-board forms can o n l y be t o t h e d e t r i m e n t o f w a t e r management
It may be wor th men t ion ing t h a t a working p a r t y c o m p r i s i n g
r e p r e s e n t a t i v e s o f c e n t r a l and p r o v i n c i a l government and wa te r -boa rds
was s e t up a few y e a r s ago t o d r a f t a Water-board B i l l , and t h a t it
p r e s e n t e d t h e r e s u l t s o f l ts l a b o u r s l a s t y e a r . In d o i n g s o , it
c r e a t e d t h e p r o s p e c t t h a t it may be p o s s i b l e t o e s t a b l i s h s a f e g u a r d s
f o r a modern sys t em o f w a t e r - b o a r d s , i n t e r a l i a by means o f t h e
p lanned a d m i n i s t r a t i v e a m p l i f i c a t i o n o f t h e wa te r -boa rd .
I n t h e a u t h o r ' s o p i n i o n t h e r e a r e t h e r e f o r e good r e a s o n s , and p e r h a p s
s t r o n g e r r e a s o n s t h a n previously, t o make wa te r -boa rds r e s p o n s i b l e
f o r w a t e r management - and hence p l a n n i n g - w i t h i n u r b a n a r e a s .
I n o r d e r f o r w a t e r management t o be a s e f f e c t i v e a s p o s s i b l e , t h i s
s h o u l d a t any r a t e be t h e b a s i c p r i n c i p l e , a l t h o u g h n o t an a b s o l u t e
d e c r e e : ~ f t h e r e a r e s t r o n g r e a s o n s o r v e r y s p e c i a l c i r c u m s t a n c e s
m i l i t a t i n g a g a i n s t a d h e r e n c e t o t h e p r i n c i p l e , it s h o u l d be p o s s i b l e
t o d e p a r t from i t . Th i s i n d e e d is t h e l i n e t h a t h a s s o f a r been
f o l l o w e d , a t l e a s t a s f a r a s r e s p o n s i b i l i t y f o r w a t e r q u a l i t y is
c o n c e r n e d . The r e a s o n why it h a s been fo l lowed is, a p a r t from t h e
a l r e a d y ment ioned a d m i n i s t r a t i v e and p r a c t i c a l g r o u n d s , i n o r d e r t o
b r i n g g r e a t e r f i n a n c i a l r e s o u r c e s t o b e a r on t h e problem t h a n
a m u n i c i p a l a u t h o r i t y would be a b l e t o .
I n t h e s p h e r e o f w a t e r q u a n t i t y management t h e r e e x i s t s a c e r t a i n
r e l u c t a n c e t o t r a n s f e r a u t h o r i t y o v e r any p a r t o f t h e u rban
t e r r i t o r y from wa te r -boa rds t o m u n i c i p a l a u t h o r i t i e s . I n some c a s e s
t h e p r o c e s s is now even be ing r e s e r v e d . The main r e a s o n f o r t h i s
t r e n d i s t h a t i t is f e l t t h a t a wa te r -boa rds which is s t r u c t u r e d ,
o r g a n i z e d and equ ipped a l o n g modern l i n e s s h o u l d be c a p a b l e o f
pe r fo rming i t s d u t i e s p r o p e r l y i n u rban a r e a s j u s t as e l s e w h e r e .
In t h i s c o n n e c t i o n t h e M i n i s t e r o f T r a n s p o r t and P u b l i c Works can
be quo ted i n a n s w e r i n g t o q u e s t i o n s f rom t h e Upper-House o f
P a r l i a m e n t d u r i n g r e c e n t c o n s i d e r a t i o n s o f t h e 1985 b u d g e t :
"It f o l l o w s f rom t h e views e x p r e s s e d i n t h e Government P o l i c y

"Document 'Towards a new w a t e r management o f w a t e r - b o a r d s 1
" t h a t wa te r -boa rds shou ld a l s o be r e s p o n s i b l e f o r w a t e r management
" in u rban a r e a s . N o n e t h e l e s s , c i r c u m s t a n c e s may make ~t
" imposs ib l e t o e x c l u d e t h e possibility o f wi thd rawing r e s p o n s i b i l i t y
" f o r w a t e r management from a wa te r -boa rds i n a s p e c i f i c c a s e i f
" t h i s i s v i r t u a l l y t h e o n l y way o f providing a j u s t and
" e f f e c t i v e s o l u t i o n t o a c o n f l i c t o f i n t e r e s t s . My g u i d i n g
" p r i n c i p l e h e r e is t h a t t h e a u t h o r i t y which w i s h e s t o assume
" r e s p o n s i b i l i t y f o r w a t e r management i n s t e a d o f a water-board
"should d e m o n s t r a t e t h e p rob lems t o which a c o n t i n u a t i o n o f t h e
"normal s i t u a t i o n would g l v e r i s e . "
It would a c c o r d i n g l y be a r e t r o g r a d e s t e p t o d e p a r t from t h i s l i n e ,
f o r example i n t h e c o n t e x t o f p o l i c y on t h e f o u r l a r g e c i t i e s .
To a v o i d any m i s u n d e r s t a n d i n g it must be emphasized t h a t t h e
a u t h o r i s n o t a t a l l i n f a v o u r o f p o l a r i z a t i o n between wa te r -boa rds
and m u n i c i p a l a u t h o r i t i e s . On t h e c o n t r a r y , a l t h o u g h he b e l l e v e s
i n t h e d i c tum 'Every man t o h i s t r a d e 1 a t t h e same t i m e he shou ld
l i k e t o a d v o c a t e a n e f f e c t i v e c o o p e r a t i o n between t h o s e o f different
c a l l i n g s .
Water management i n u rban a r e a s s h o u l d i n p r i n c i p l e be o r g a n i z e d a l o n g
u n i f o r m l i n e s , i n t h e form which unambiguous government s t a t e m e n t s
have r e p e a t e d l y r e f e r r e d t o . T h e r e e x i s t s a n i n t e r l o c k i n g n a t u r e o f
t h e r e s p o n s i b i l i t i e s o f m u n i c i p a l a u t h o r i t i e s and wa te r -boa rds and
a n e f f e c t i v e c o o p e r a t i o n is r e q u i r e d i n o r d e r t o e n s u r e t h a t t h e s e
r e s p o n s i b i l i t i e s a r e c a r r i e d o u t p r o p e r l y .


MANAGEMENT OF WATER IN THE URBAN ECOSYSTEM
H.W. Kroes
ABSTRACT
I n t h e N e t h e r l a n d s , c o m p e t e n t a u t h o r i t i e s f o r w a t e r m a n a g e -
m e n t a r e t h e p r o v i n c e s o r s p e c i f i c w a t e r a u t h o r i t i e s : mu-
n i c i p a l a u t h o r i t i e s p l a y n o r o l e , e x c e p t f o r t h e m a n a g e m e n t
o f s e w e r s y s t e m s . I w o u l d l i k e t o p r o p o s e t h a t , a t l e a s t i n
t h e c a s e o f c i t i e s w i t h m o r e t h a n 1 0 0 . 0 0 0 i n h a b i t a n t s , m u n i -
c i p a l a u t h o r i t i e s s h o u l d b e c o m e c o m p e t e n t i n t h e i n t e g r a t e d
m a n a g e m e n t o f t h e u r b a n w a t e r s y s t e m ( s u r f a c e w a t e r , g r o u n d
w a t e r , sewer s y s t e m ) . T h e m a i n a r g u m e n t i s t h e n e c e s s i t y o f
m a n a g i n g t h e c i t y a s a n u r b a n e c o s y s t e m , i . e . m a n a g i n g a
s y s t e m o f i n t e r c o n n e c t e d l i v i n g a n d n o n - l i v i n g c o m p o n e n t s
a n d f l o w s o f e n e r g y a n d m a t t e r .
1 CHARACTERISTICS OF ECOSYSTEMS
I w o u l d l i k e t o e x p l a i n my p o s i t i o n b y f i r s t e x a m i n i n g w h a t
a n e c o s y s t e m i s a n d a f t e r w a r d s d e s c r i b i n g how a c i t y c a n b e
t h o u g h t o f a s a n e c o s y s t e m , a n u r b a n e c o s y s t e m .
An e c o s y s t e m i s a n i n t e r a c t i n g w h o l e o f l i v i n g o r g a n i s m s a n d
a n o n - l i v i n g e n v i r o n m e n t . T h i s i s a r a t h e r a b s t r a c t d e f i n i -
t i o n a n d we may g e t a b e t t e r g r a s p o f t h e e c o s y s t e m c o n c e p t
b y h a v i n g a l o o k a t t h e v a r i o u s w a y s a n e c o s y s t e m may b e
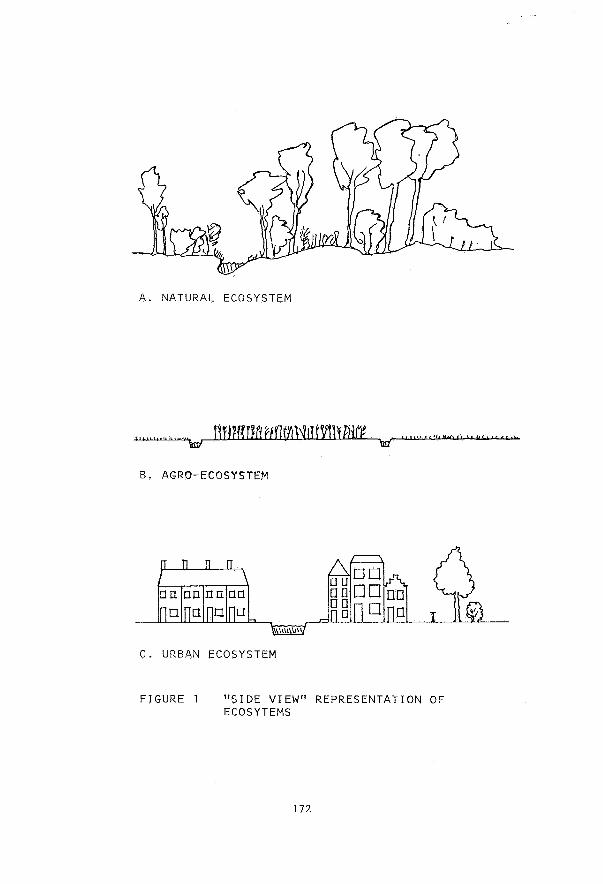
A. NATURAL ECOSYSTEM
flYjli!flfi df&4.lY i!ffslf D11 f 0 L V , . , , 8 , . S c < -1,
B. AGRO-ECOSYSTEM
C. URBAN ECOSYSTEM
FIGURE 1 " S I D E VIEW1' REPRESENTATION OF ECOSYTEMS

A. NATURAL ECOSYSTEM
B. AGRO-ECOSYSTEM
C. URBAN ECOSYSTEM
F IGURE 2 "MAP" REPRESENTATION OF ECOSYSTEMS

p i c t u r e d ( i . e . r e p r e s e n t e d o n p a p e r ) . T h e r e a r e s e v e r a l ,
r a t h e r d i f f e r e n t w a y s o f r e p r e s e n t i n g o n e e c o s y s t e m . I w i l l
g i v e a n i m p r e s s i o n o f t h e f o l l o w i n g : ( 1 ) s i d e v i e w , ( 2 ) map
( = t o p v i e w ) , ( 3 ) d i a g r a m s o f c o m p o n e n t s a n d f l o w o f e n e r g y
a n d m a t t e r , ( 4 ) l i s t s o f w o r d s a n d n u m b e r s , i . e . d e s c r i p -
t i o n s o f s p e c i e s c o m p o s i t i o n , v a l u e s o f p h y s i c o - c h e m i c a l
p a r a m e t e r s e t c . T h e o r d e r i s o n e o f i n c r e a s i n g a b s t r a c t n e s s .
A d r a w i n g o r p h o t o g r a p h o f t h e s i d e v i e w o f a n e c o s y s t e m i s
t h e m o s t r e a l i s t i c r e p r e s e n t a t i o n i n t h e s e n s e t h a t i t r e -
s e m b l e s m o s t w h a t we s e e w i t h o u r own e y e s when we l o o k a t
a r e a l e c o s y s t e m : we s e e o r g a n i s m s a n d a b i o t i c s t r u c t u r e s ,
e . g . t r e e s , h i l l s ( F i g u r e 1 A ) . I n t h e c a s e o f a q u a t i c e c o -
s y s t e m s t h e v i e w is a n i m a g i n a r y o n e - a s i t were t h r o u g h
t h e w a l l s o f a n a q u a r i u m o r t h r o u g h t h e e y e s o f a d i v e r .
One s h o u l d r e a l i s e t h a t , a l t h o u g h t h i s r e p r e s e n t a t i o n i s
t h e l e a s t a b s t r a c t o f t h e v a r i o u s w a y s o f p i c t u r i n g t h e e c o -
s y s t e m , i t i s a l r e a d y v e r y a b s t r a c t i n c o m p a r i s o n w i t h t h e
r e a l e c o s y s t e m . F o r e x a m p l e , i t d o e s n o t s h o w t h e c o m p l e t e
d i v e r s i t y o f o r g a n i s m s , b u t o n l y p a r t o f i t ( m o s t l y t h e ma-
c r o s c o p i c a l l y v i s i b l e s p e c i e s a n d t h o s e o f h i g h d e n s i t y ) .
N e i t h e r d o e s i t s h o w t h e many m o t i o n s , t h e f l o w s i n a n d o u t
o f t h e e c o s y s t e m , a n d t h e p r o c e s s e s o f g r o w t h a n d decompo-
s i t i o n .
T h e map i s a d r a w i n g o r a n a e r i a l p h o t o g r a p h g i v i n g a t o p
v i e w o f a n a r e a . I n m o s t c a s e s t h e s c a l e i s s u c h t h a t n o
i n d i v i d u a l o r g a n i s m i s v i s i b l e ( F i g u r e 2 A ) . I n t h a t s e n s e
t h e map i s m o r e a b s t r a c t t h a n t h e s i d e v i e w . T h e map, how-
e v e r , a c c e n t u a t e s a n i m p o r t a n t c h a r a c t e r i s t i c o f t h e e c o -
s y s t e m c o n c e p t : t h e s p a t i a l b o u n d a r i e s t h a t c a n b e t h o u g h t
t o e n c l o s e t h e s y s t e m , e s p e c i a l l y i n t h e h o r i z o n t a l p l a n e .

IMPORTS 0 F
1 MATTER I
HEAT > OTHER ENERGY
A. NATURAL ECOSYSTEM
OF MATTER
FERTILIZER FORAGE
FIGURE 3 "DIAGRAM" REPRESENTATION OF ECOSYSTEMS
SUN
OTHER - ENERGY
FOOD
MINERAL RESOURCES v
SUN
OTHER
> 3 ENERGY
Y I
IVE STOCK -a B. AGRO-ECOSYSTEM
WASTE
Y v
-0 C. URBAN ECOSYSTEM
> HEAT >
HEAT ? >

A n o t h e r i m p o r t a n t c h a r a c t e r i s t i c i s t h a t o n e c a n h a v e e c o -
s y s t e m s o n d i f f e r e n t s c a l e s , i n o t h e r w o r d s t h a t t h e a r e a o f
a n e c o s y s t e m c a n v a r y f r o m a f e w s q u a r e meters t o t h e s i z e
o f a c o n t i n e n t o r e v e n t o t h e s i z e o f t h e s u r f a c e o f t h e
e a r t h ( t h e b i o s p h e r e ) . I t d e p e n d s o n t h e c h o i c e o n e m a k e s
f o r s t u d y i n g e c o l o g i c a l p r o c e s s e s ; i t i s c o n v e n t i o n i n a n y
c a s e t o c h o o s e " n a t u r a l " b o u n d a r i e s , e . g . s h o r e l i n e s , v e -
g e t a t i o n l i m i t s , e t c .
T h e d i a g r a m r e p r e s e n t a t i o n i s u s e f u l t o d i s t i n g u i s h t h e m a i n
c o m p o n e n t s o f a n e c o s y s t e m ( t h e " p r i m a r y n i c h e s " : s e e K r o e s ,
1 9 7 7 ) , i . e . t h e l i v i n g o r g a n i s m s : p r o d u c e r s , c o n s u m e r s a n d
d e c o m p o s e r s , a n d t h e a b i o t i c s u b s t r a t e s : i n o r g a n i c m a t t e r
a n d o r g a n i c m a t t e r .
D i a g r a m s a r e f u r t h e r u s e d t o s h o w t h e f l o w s o f e n e r g y a n d t o r
m a t t e r t h a t e n t e r o r l e a v e a n a r e a a n d t h e f l o w s o f e n e r g y
a n d / o r m a t t e r b e t w e e n t h e c o m p o n e n t s o f t h e e c o s y s t e m . T h e y
c a n a l s o b e u s e d t o s h o w o t h e r r e l a t i o n s b e t w e e n t h e c o m p o -
n e n t s , f o r e x a m p l e c o m p e t i t i o n b e t w e e n s p e c i e s . T r a d i t i o n a l
e n e r g y - m a t t e r f l o w d i a g r a m s ( e . g . i n A n d e r s o n , 1 9 8 1 )
i l l u s t r a t e t h e i m p o r t a n t f a c t t h a t a n e c o s y s t e m a l m o s t a l -
w a y s d e p e n d s o n e n e r g y i m p o r t f r o m t h e o u t s i d e ( i n m o s t
c a s e s i n t h e f o r m o f s u n l i g h t ) a n d t h a t t r a n s p o r t o f m a t t e r
i s much m o r e a n i n t e r n a l a f f a i r . E c o s y s t e m s c a n i n p r i n c i p l e
m a i n t a i n a c l o s e d c i r c u i t o f t h e f l o w o f m a t t e r , a l t h o u g h
t h e r e i s a g r e a t v a r i a t i o n i n t h e r a t i o o f i m p o r t a n d e x p o r t
v e r s u s i n t e r n a l f l o w o f m a t t e r b e t w e e n r e a l e c o s y s t e m s .
F i g u r e 3A i s a n e x a m p l e o f a d i a g r a m w i t h m a i n e n e r g y a n d
m a t t e r f l o w s f o r n a t u r a l e c o s y s t e m s .
L i s t s o f s p e c i e s ( o r o t h e r t a x a ) o f o r g a n i s m s a r e a common

A. NATURAL ECOSYSTEM
Potamogeton pectinatus dissolved oxygen Nuphar lutea (yearly mlnlrnum) : 5 mg/liter Butomus umbellatus Limnaea stagnalis temperature ~loeon dipterum (yearly maximum) : 23 'C Rana esculents Gasterosteus aculeatus
B. AGRO-ECOSYSTEM
Secale cereale Clavlceps purpurea Centaurea cyanus Hordeurn murinum Micromys minutus Passer dornestlcus
C. URBAN ECOSYSTEM
Homo saprens Canls famlliarls Fells domestica Sturnus vulgar~s Musca dornestlca Poa annua Calendula offlcinalis
soil pH : 6.2
phosphate (P) in solutlon In soil moisture : 0.4 mg/llter
carbon monoxyde : 45 mg/m3
sulphur dloxyde : 0.8 mg/m3
FIGURE 4 "WORDS AND NUMBERS" REPRESENTATION OF ECOSYSTEMS

way o f d e s c r i b i n g t h e l i v i n g p a r t o f t h e e c o s y s t e m . S o a r e
l i s t s o f v a l u e s o f p h y s i c o - c h e m i c a l p a r a m e t e r s c h a r a c t e r i z i n g
a b i o t i c a s p e c t s o f a s p e c i f i c e c o s y s t e m . T h e y a r e , o f a l l f o u r
w a y s o f d e s c r i p t i o n , t h e m o s t a b s t r a c t b e c a u s e s e v e r a l l e v e l s
o f t r a n s l a t i o n a r e n e c e s s a r y t o b r i d g e t h e g a p b e t w e e n r e a l i -
t y a n d r e p r e s e n t a t i o n . T h e y a r e , by v i r t u e o f t h a t a b s t r a c -
t i o n , a l s o t h e m o s t e x a c t o f t h e f o u r , a n a s p e c t t h a t i s d a n -
g e r o u s b e c a u s e i t may c o n v e y t h e i m p r e s s i o n o f r e a l i t y , w h i l e ,
a s I s a i d a b o v e , t h i s way o f r e p r e s e n t a t i o n i s v e r y a b s t r a c t .
F i g u r e 4A g i v e s a n e x a m p l e .
A t t h i s p o i n t we c o u l d t r y t o r e f o r m u l a t e t h e d e f i n i t i o n o f
a n e c o s y s t e m g i v e n i n t h e b e g i n n i n g o f t h i s c h a p t e r ( s e e
K r o e s , 1 9 7 7 , f o r d e t a i l s ) :
"An e c o s y s t e m i s a p a r t o f t h e s u r f a c e o f t h e e a r t h t h a t i s r e p r e -
s e n t e d i n s u c h a w a y t h a t t h e f o l l o w i n g a s p e c t s a r e p r o m i n e n t :
- p o p u l a t i o n s o f a n i m a l s , p l a n t s , a n d l o w e r o r g a n i s r n s a r e
c o m p o n e n t s o f t h e s y s t e m ( " n i c h e s " ) ,
- t h e r e a r e t h r e e d i s t i n c t s u b s t r a t e s : s o i l , w a t e r a n d
a i r ,
- t h e s y s t e m h a s h o r i z o n t a l b o u n d a r i e s : i t i s l i m i t e d i n
s p a c e ,
- i m p o r t a n t p r o c e s s e s i n t h e s y s t e m a r e t h e f l o w s o f
e n e r g y a n d m a t t e r , b o t h i n t e r n a l a n d c r o s s - b o u n d a r y ,
- t h e s e p r o c e s s e s a r e k e p t g o i n g by t h e p o p u l a t i o n s o f
l i v i n g o r g a n i s m s w i t h s u n l i g h t a s a n u l t i m a t e s o u r c e
o f e n e r g y ; p o p u l a t i o n s c a n b e g r o u p e d i n p r o d u c e r s ,
c o n s u m e r s a n d d e c o m p o s e r s ,
- s p e c i e s c o m p o s i t i o n i s v e r y s e n s i t i v e t o e x t e r n a l i n -
f l u e n c e s s u c h a s c h a n g e s i n e n e r g y s u p p l y , c l i m a t e a n d

t h e f l o w o f m a t t e r i n t o o r o u t o f t h e s y s t e m ; t h e s e
e x t e r n a l i n f l u e n c e s t h e m s e l v e s , h o w e v e r , a r e l e s s
s e n s i t i v e t o c h a n g e s i n s p e c i e s c o m p o s j t i o n o f t h e
e c o s y s t e m ,
- t h e r e i s n o c e n t r a l s t e e r i n g m e c h a n i s m . "
I t s h o u l d b e n o t e d t h a t t h e e c o s y s t e m c o n c e p t i s v e r y
f l e x i b l e , e s p e c i a l l y i n a n s p a t i a l s e n s e . A s m a l l pond o r a
l a r g e o c e a n may b o t h b e d e s c r i b e d i n e c o s y s t e m terms. The
p r i n c i p l e o f d e s c r i p t i o n i s t h e s a m e i n b o t h c a s e s . T h i s i s
a l s o o n e o f t h e r e a s o n s t h a t t h e e c o s y s t e m c o n c e p t i s v e r y
c o n v e n i e n t f o r a p p l i c a t i o n i n t h e c a s e o f man-made s y s t e m s .
2 ECOSYSTEMS A N D H U M A N SOCIETY
S o f a r I h a v e d e s c r i b e d c h a r a c t e r i s t i c s o f n a t u r a l e c o -
s y s t e m s , i n w h l c h man p l a y s n o r o l e , o r a t m o s t a m i n o r o n e .
I n t h e p a s t 1 0 0 . 0 0 0 y e a r s , h o w e v e r , l a r g e p a r t s o f t h e w o r l d
h a v e b e e n r a d i c a l l y a l t e r e d by human a c t i v i t i e s . A t p r e s e n t ,
l a r g e a r e a s a r e b e i n g u s e d f o r a g r i c u l t u r a l p u r p o s e s ( i . e .
f o r t h e p r o d u c t i o n o f human f o o d , c l o t h i n g , e t c . ) a n d s m a l -
l e r , b u t s t i l l e x t e n s i v e , a r e a s f o r h o u s i n g , i n d u s t r y a n d
t r a n s p o r t .
I n s p i t e o f t h e f a c t t h a t a r e a s u s e d f o r human a c t i v i t i e s
d i f f e r m a r k e d l y f r o m n a t u r a l a r e a s , t h e y c a n b e d e s c r i b e d a s
e c o s y s t e m s . T h e a d v a n t a g e s o f d o i n g t h i s a r e ( 1 ) a f a c i l i t a -
t i o n o f c o m p a r i s o n b e t w e e n n a t u r a l a n d "man-made" a r e a s a n d
( 2 ) t h e i n h e r e n t p o s s i b i l i t i e s t h a t t h e e c o s y s t e m m o d e l
p r o v i d e s f o r i n c o r p o r a t i n g c o m p o n e n t s a n d p r o c e s s e s ( o r g a -
n i s m s , n o n - l i v i n g s u b s t r a t e s , f l o w s o f m a t t e r a n d e n e r g y ,
e t c . ) i n t o a s e t o f r e p r e s e n t a t i o n s a s g i v e n a b o v e .
T h e r e f o r e , i t i s c o n v e n i e n t t o d i s t i n g u i s h t h r e e b r o a d c a -
t e g o r i e s o f e c o s y s t e m s i n t h e p r e s e n t w o r l d :

- n a t u r a l e c o s y s t e m s
- a g r o - e c o s y s t e m s
- u r b a n e c o s y s t e m s .
F i g s . 1 - 4 g i v e a c o m p a r a t i v e g e n e r a l i m p r e s s i o n o f t h e
c h a r a c t e r i s t i c s o f t h e t h r e e t y p e s o f e c o s y s t e m .
I n t h e s i d e v i e w r e p r e s e n t a t i o n ( F i g u r e 1 ) t h e m o n o c u l t u r a l
a s p e c t o f t h e a g r o - e c o s y s t e m a n d t h e r e c t i l i n e a r a s p e c t o f
t h e u r b a n e c o s y s t e m v e r s u s t h e n a t u r a l e c o s y s t e m a r e e v i -
d e n t . I m p o r t a n t t o n o t e i s t h e a d d i t i o n i n t h e u r b a n e c o -
s y s t e m o f t w o s u b s t r a t e s : b u i l d i n g s a n d r o a d s ( " r o a d s " i s
t o b e t a k e n i n a b r o a d s e n s e : n o t o n l y c o n v e n t i o n a l r o a d s
o f l a n d a n d w a t e r , b u t a l s o a l l k i n d s o f p i p e l i n e s , c a b l e s ,
e t c . f o r t h e t r a n s p o r t o f m a t t e r , e n e r g y a n d i n f o r m a t i o n ) .
S o t h e u r b a n e c o s y s t e m h a s f i v e s u b s t r a t e s i n s t e a d o f
t h r e e : w a t e r , a i r , s o i l , b u i l d i n g s a n d r o a d s .
T h e map r e p r e s e n t a t i o n ( F i g u r e 2 ) s h o w s t h e r e c t i l i n e a r
f e a t u r e s o f b o t h t h e a g r o - a n d t h e u r b a n e c o s y s t e m , a s com-
p a r e d t o t h e n a t u r a l e c o s y s t e m . T h e d r a w i n g s a l s o s h o w t h e
i m p o r t a n c e o f r o a d s a n d b u i l d i n g s a s c o m p o n e n t s o f t h e u r -
b a n e c o s y s t e m .
T h e d i a g r a m s o f m a t t e r a n d e n e r g y f l o w ( F i g u r e 3 ) i l l u s t r a t e
s e v e r a l c h a r a c t e r i s t i c s o f u r b a n a n d a g r o - e c o s y s t e m s v e r s u s
n a t u r a l e c o s y s t e m s .
F i r s t , t h e s u n a s a n a l l - i m p o r t a n t d i r e c t s o u r c e o f e n e r g y
i s f o r t h e u r b a n e c o s y s t e m r e p l a c e d b y f o s s i l f u e l , n u c l e a r
e n e r g y , a n d , t o a l esser e x t e n t , w i n d a n d w a t e r e n e r g y . A l -
t h o u g h many a g r o - e c o s y s t e m s d e p e n d o n l i g h t e n e r g y f r o m t h e
s u n , m e c h a n i z a t i o n h a s b e e n m a d e p o s s i b l e t h r o u g h t h e u s e
o f f o s s i l f u e l a n d s p e c i a l i z a t i o n h a s l e d t o t h e c r e a t i o n
o f a g r o - e c o s y s t e m s t h a t u s e l i g h t e n e r g y o n l y i n a n i n d i r e c t
way ( l i v e s t o c k b r e e d i n g o n t h e b a s i s o f i m p o r t e d f o r a g e ) ,

S e c o n d , u r b a n a n d a g r o - e c o s y s t e m s a r e m o r e o p e n t o i m p o r t s
a n d e x p o r t s o f m a t t e r . T h e i n t e r d e p e n d e n c e o f b o t h t y p e s o f
e c o s y s t e m s a s r e g a r d s f o o d p r o d u c t i o n a n d c o n s u m p t i o n i s
e v i d e n t , b u t i t i s o n l y g r a d u a l l y d i f f e r e n t f r o m f l o w s o f
m a t t e r b e t w e e n n a t u r a l e c o s y s t e m s ( e . g . a f o r e s t a n d a r i v e r
s y s t e m ) . N e w i n c o m p a r i s o n w i t h n a t u r a l e c o s y s t e m s i s t h e
l a r g e f l o w o f m i n e r a l r e s o u r c e s i n t o t h e u r b a n ( a n d t o a
c e r t a i n e x t e n t a l s o t h e a g r o - ) e c o s y s t e m . I n m o d e r n s o c i e t y ,
t h i s f l o w o f m i n e r a l s s u s t a i n s t h e p r o d u c t i o n o f h o u s i n g ,
u t i l i t y b u i l d i n g , i n d u s t r i a l p l a n t s , r o a d s , t r a n s p o r t a t i o n
a n d c o m m u n i c a t i o n m e a n s , c l o t h i n g , a n d a l l k i n d s o f c o n s u m e r
g o o d s . I n a q u a l i t a t i v e a n d q u a n t i t a t i v e s e n s e i t i s
c o m p l e t e l y d i f f e r e n t f r o m t h e f l o w o f m a t t e r b e t w e e n n a t u r a l
e c o s y s t e m s . O n e o f i t ' s , s t i l l u n s o l v e d , c o n s e q u e n c e s i s t h e
p r o d u c t i o n o f l a r g e a m o u n t s o f s o l i d a n d l i q u i d w a s t e ;
s o c i e t y t r i e s t o g e t r i d o f i t b y d u m p i n g i t i n t o n a t u r a l
e c o s y s t e m s ( e . g . r i v e r s ) , t h e r e b y u n c o n t r o l l a b l y d e g r a d i n g
t h o s e s y s t e m s .
T h i r d , s p e c i e s c o m p o s i t i o n i s d i f f e r e n t f r o m t h a t i n n a t u r a l
e c o s y s t e m s . A g r o - e c o s y s t e m s a r e m a n a g e d i n t e n t i o n a l l y t o
p r o d u c e o n e o r a f e w k i n d s o f p r o d u c t ( = s p e c i e s ) . U r b a n
e c o s y s t e m s a r e b u i l t i n t e n t i o n a l l y t o h o u s e p e o p l e ( = Homo
s a p i e n s ) . T h i s i s n o t t o s a y t h a t t h o s e t y p e s o f e c o s y s t e m s
d o n o t h a r b o u r many o t h e r s p e c i e s . I n s o m e a g r o - e c o s y s t e m s
a g r e a t d i v e r s i t y o f " w i l d " s p e c i e s i s f o u n d a n d u r b a n e c o -
s y s t e m s o f t e n h a r b o u r a l a r g e v a r i e t y o f s p e c i e s ( e . g .
b i r d s , t r e e s , s h r u b s , e x o t i c s : M i i l l e r , 1 9 8 0 ) . T h e r e i s ,
h o w e v e r , a c o n t i n u i n g t r e n d o f d i m i n i s h i n g d i v e r s i t y i n
t h o s e s y s t e m s , e s p e c i a l l y i n t h e a g r o - e c o s y s t e m s , a s a c o n s e -
q u e n c e o f t h e u s e o f p e s t i c i d e s , e r o s i o n , u p s c a l i n g , e t c . S e e
a l s o t h e " w o r d s a n d n u m b e r s " r e p r e s e n t a t i o n ( F i g u r e 4 ) .
3 MANAGEMENT OF TERRESTRIAL AND AQUATIC ECOSYSTEMS
Now I w o u l d l i k e t o r e t u r n f o r a m o m e n t t o t h e c a t e g o r y o f
181

n a t u r a l e c o s y s t e m s . T h e y c a n b e d i v i d e d i n t o t w o t y p e s :
a q u a t i c a n d t e r r e s t r i a l e c o s y s t e m s . T h e s u b s t r a t e c o m b i n a -
t i o n w a t e r - s o i l - a i r ( a q u a t i c s y s t e m ) p r o d u c e s a s e t o f
a b i o t i c c o n d i t i o n s q u i t e d i f f e r e n t f r o m t h a t o f c o m b i n a t i o n
s o i l - a i r ( t e r r e s t r i a l s y s t e m ) . A s a c o n s e q u e n c e , n o t o n l y
s p e c i e s c o m p o s i t i o n , b u t a l s o f l o w s o f e n e r g y a n d m a t t e r a r e
c l e a r l y d i f f e r e n t . I n p r a c t i c e , t h e r e f o r e , t e r r e s t r i a l e c o -
l o g y a n d a q u a t i c e c o l o g y ( t h e l a s t - n a m e d i n c l u d i n g l i m n o l o g y
a n d m a r i n e e c o l o g y ) a r e s e p a r a t e d i s c i p l i n e s . Of c o u r s e ,
t h e r e a r e many i n t e r a c t i o n s b e t w e e n l a n d a n d w a t e r , a n d
i n t e g r a t e d a p p r o a c h e s , i n s c i e n c e a s w e l l a s i n e n v i r o n m e n -
t a l p o l i c y , a r e o f t e n n e c e s s a r y . N e v e r t h e l e s s , i t i s
r e a s o n a b l y p o s s i b l e i n e n v i r o n m e n t a l m a n a g e m e n t t o m a n a g e
w a t e r ( a q u a t i c e c o s y s t e m s ) a n d l a n d ( t e r r e s t r i a l e c o s y s t e m s )
a s s e p a r a t e e n t i t i e s .
T h i s g o e s f o r n a t u r a l e c o s y s t e m s . I n t h e N e t h e r l a n d s , a b o u t
65 p e r c e n t o f t h e a r e a i s u s e d f o r a g r i c u l t u r e , 25 p e r c e n t
i s f o r e s t , n a t u r e r e s e r v e s , r e c r e a t i o n a l a r e a , a n d w a t e r ,
a n d 1 0 p e r c e n t i s u r b a n a r e a ( C e n t r a a l B u r e a u v o o r d e S t a -
t i s t i e k , 1 9 8 0 ) . T h e r e f o r e , m a n a g e m e n t o f a q u a t i c e c o s y s t e m s
i s o n l y p a r t l y a m a t t e r o f m a n a g i n g n a t u r a l e c o s y s t e m s .
A l a r g e p a r t o f w a t e r m a n a g e m e n t t a k e s p l a c e i n t h e c o n t e x t
o f a g r o - e c o s y s t e m s a n d u r b a n e c o s y s t e m s . I n a g r o - e c o s y s t e m s ,
s u r f a c e w a t e r ( d i t c h e s , b r o o k s , c a n a l s , p o l d e r l a k e s , e t c . )
may - i n t h e s a m e way a s i n n a t u r a l a r e a s - b e m a n a g e d a s
s e p a r a t e s y s t e m s , b e c a u s e w a t e r s y s t e m s a r e s u f f i c i e n t l y i n -
d e p e n d e n t f r o m t h e l a n d s y s t e m s ( m a n a g e d b y i n d i v i d u a l f a r -
m e r s ) . I n t h e u r b a n e c o s y s t e m , h o w e v e r , t h e s i m p l e d i s t i n c -
t i o n b e t w e e n l a n d a n d w a t e r i s r e p l a c e d b y a much m o r e
c o m p l i c a t e d c o m b i n a t i o n o f l a n d , w a t e r , a i r , b u i l d i n g s a n d
r o a d s , i n t e r w o v e n o n a s m a l l s c a l e . T h e r e f o r e , i t i s i m -
p r a c t i c a l t o s p l i t u p m a n a g e m e n t o f t h e u r b a n e c o s y s t e m i n t o
m a n a g e m e n t o f t h e s e p a r a t e c o m p o n e n t s .
M a n a g e m e n t o f s u r f a c e w a t e r s i n t h e N e t h e r l a n d s p r e s e n t l y i s

FIG
UR
E
5 D
IAG
RA
M O
F
TH
E
UR
BA
N
EC
OS
YS
TE
M
EX
PL
AN
AT
ION
O
F
SY
MB
OLS
: X
= M
AN
AG
EM
EN
T
BY
P
UB
LIC
A
UT
HO
RIT
IES
, 0
= M
AN
AG
EM
EN
T
BY
P
RIV
AT
E
PE
RS
ON
S
OR
O
RG
AN
IZA
TIO
NS
+
= N
O
MA
NA
GE
ME
NT
FOO
D
Y
0 M
INE
RA
L
RF
SO
UR
CE
S
v
0 D
RIN
KIN
G
WA
TER
X
> H
EA
T
+
>
v
v
v " IN
OR
GA
NIC
W
AS
TE
OR
GA
N1c
1
WA
ST
E
PR
OD
UC
TS
SU
N
EN
ER
GY
FO
SS
IL,
NU
CLE
AR
> X
0
>
EN
ER
GY
PR
OD
UC
TlO
N
0
TR
AN
SP
OR
T
OX
PL
AN
TS
AN
IMA
LS
>+>D
UR
BA
N
EC
OS
YS
TE
M
BU
T L
DIN
GS
0 X
AIR
+
WA
TER
X
RO
AD
S
X
SO
IL
X

t h e c o m p e t e n c e o f t h e n a t i o n a l g o v e r n m e n t f o r t h e l a r g e wa-
t e r s o f n a t i o n a l i m p o r t a n c e , a n d o f p r o v i n c e s o r w a t e r
a u t h o r i t i e s ( m o s t l y o n e t o f i v e p e r p r o v i n c e ) f o r a l l o t h e r
w a t e r s . M u n i c i p a l a u t h o r i t i e s h a v e n o l e g a l c o m p e t e n c e i n
w a t e r m a n a g e m e n t . T h i s m e a n s t h a t u r b a n w a t e r s i n a c i t y
a r e m a n a g e d b y a p r o v i n c e o r a w a t e r a u t h o r i t y , w h i l e a l l
t h e o t h e r c o m p o n e n t s o f t h e u r b a n e c o s y s t e m a r e m a n a g e d b y
t h e m u n i c i p a l i t y . As I a n n o u n c e d i n t h e a b s t r a c t , I p r o p o s e
t h a t u r b a n w a t e r , a t l e a s t i n t h e l a r g e c i t i e s , b e m a n a g e d
by m u n i c i p a l a u t h o r i t i e s . T h e r e a s o n is t h a t , i n t h e u r b a n
e c o s y s t e m , a p a r t i t i o n o f w a t e r a n d l a n d e c o s y s t e m s ( r e a d i l y
p o s s i b l e i n n a t u r a l a n d i n a g r o - e c o s y s t e m s ) i s n o t e f f i c j e n t
i n u r b a n e c o s y s t e m s . I n t h e f o l l o w i n g , I w i l l t r y t o e x p l a i n
m o r e f u l l y why t h i s i s s o .
4 MANAGEMENT OF U R B A N ECOSYSTEMS
F i g u r e 5 s h o \ * , s a d i a g r a m l i k e t h a t i n F i g u r e 3 , b u t i n m o r e
d e t a i l . I t c o n t a i n s t h e m a i n s u b s t r a t e s , l i v i n g c o m p o n e n t s
a n d t h e f l o w s o f e n e r g y a n d m a t t e r . M o r e o v e r , t h e e l e m e n t s
o f t h e d i a g r a m a r e m a r k e d , i n d i c a t i n g w h e t h e r ( i n t h e
N e t h e r l a n d s ) p r o c e s s e s o r c o m p o n e n t s a r e m a n a g e d b y p u b l i c
a u t h o r i t i e s o r b y p r i v a t e p e r s o n s o r o r g a n i z a t i o n s , o r n o t
m a n a g e d a t a l l .
I t i s s e e n t h a t , i n t h e u r b a n e c o s y s t e m , p u b l i c a u t h o r i t i e s
m a n a g e t h e s u b s t r a t e s w a t e r , s o i l , r o a d s , b u i l d i n g s ( p a r t -
l y ) , t h e t r a n s p o r t o f g a s , d r i n k i n g w a t e r , e l e c t r i c i t y ,
i n f o r m a t i o n ( p a r t l y ) , a s w e l l a s a l a r g e p a r t o f t h e d i s p o -
s a l o f s o l i d a n d l i q u i d w a s t e ( s e w e r a g e , w a s t e w a t e r t r e a t -
m e n t ) . P r i v a t e p e r s o n s o r o r g a n i z a t i o n s m a n a g e t h e i m p o r t s
a n d d i s t r i b u t i o n o f f o o d a n d m i n e r a l r e s o u r c e s , t h e p a r t o f
t h e e n e r g y f l o w t h a t c o n s i s t s o f o i l a n d c o a l , a n d o n e o f
t h e s u b s t r a t e s ( p a r t l y ) : b u i l d i n g s . Some f l o w s a n d e c o s y s t e m
c o m p o n e n t s a r e n o t m a n a g e d i n t h e c o n v e n t i o n a l s e n s e : i n f l o w
o f s u n l i g h t , o u t f l o w o f h e a t , t h e s u b s t r a t e a i r .

I t i s c l e a r f r o m t h i s i n v e n t o r y t h a t m a n a g e m e n t o f s u r f a c e
w a t e r i n t h e c i t y i s p a r t o f t h e m a n a g e m e n t o f t h e s u b s t r a -
t e s i n t h e u r b a n e c o s y s t e m . I t i s t h e o n l y c o m p o n e n t , how-
e v e r , t h a t i s n o t m a n a g e d b y t h e m u n i c i p a l a u t h o r i t y , b u t
b y a p r o v i n c e o r a w a t e r a u t h o r i t y . T h e r e a r e s u c h c l o s e
l i n k s o f u r b a n s u r f a c e w a t e r s w i t h o t h e r c o m p o n e n t s o f t h e
u r b a n e c o s y s t e m t h a t t h e y s h o u l d b e m a n a g e d a s p a r t o f t h a t
s y s t e m , i . e . b y t h e m u n i c i p a l i t y . T h e r e a r e m o r e r e a s o n s t o
d o s o :
- u r b a n w a t e r s a r e m o s t l y m a n - m a d e : t h e a q u a t i c s y s t e m
i s o f a g e n e r a l i z e d k i n d , r e q u i r i n g n o s p e c i f i c e c o -
l o g i c a l e x p e r t i s e o r p r o t e c t i o n o f s p e c i f i c s p e c i e s o r
c o m m u n i t i e s ,
- u r b a n w a t e r s a r e c l o s e t o t h e p l a c e s w h e r e we l i v e
a n d w o r k : d a i l y c o n t a c t o f m o s t p e o p l e w i t h w a t e r i s
u r b a n w a t e r , t h e r e f o r e i t s h o u l d b e m a n a g e d b y a
p u b l i c a u t h o r i t y a s n e a r a s p o s s i b l e t o t h e p u b l i c ,
- u r b a n w a t e r s h a v e many l i n k s w i t h t h e s e w e r a g e s y s t e m
( d i r e c t d i s c h a r g e s , o v e r f l o w s ) : t h e a u t h o r i t y m a n a g i n g
t h e sewer s y s t e m ( t h e m u n i c i p a l i t y ) s h o u l d m a n a g e t h e
u r b a n w a t e r s t o o ,
- i n p r a c t i c e , t h e l e g a l l y c o m p e t e n t a u t h o r i t i e s ( p r o -
v i n c e s , w a t e r a u t h o r i t i e s ) h a v e , i n t h e p a s t 1 5 y e a r s ,
s h o w e d l i t t l e i n t e r e s t i n m a n a g e m e n t o f t h e s e w a t e r s ,
p e r h a p s b e c a u s e o t h e r t a s k s t o o k p r i o r i t y .
I b e l i e v e t h a t m o s t c i t i e s o f 1 0 0 . 0 0 0 i n h a b i t a n t s o r m o r e ,
c o n s i s t i n g o f t y p i c a l u r b a n e c o s y s t e m s , a r e s u f f i c i e n t l y
e q u i p p e d t o m a n a g e u r b a n s u r f a c e w a t e r s . S p e c i f i c a l l y , t h i s
w o u l d i m p l y t h e f o l l o w i n g t a s k s a n d p o w e r s :
- p l a n n i n g o f i n t e g r a t e d m a n a g e m e n t o f s e w e r a g e s y s t e m s
a n d s u r f a c e w a t e r s ( p o s s i b l y i n t h e s t i l l w i d e r f r a m e -

w o r k o f e n v i r o n m e n t a l p l a n n i n g f o r t h e c i t y ) ,
- m a i n t e n a n c e a n d c l e a n i n g o f s e w e r s a n d s u r f a c e w a t e r s ,
- w a t e r q u a l i t y s u r v e y i n g , m o n i t o r i n g , a n d r e p o r t i n g ,
- t h e p o w e r ( i n t h e f r a m e w o r k o f t h e W a t e r p o l l u t i o n
c o n t r o l a c t ) t o g r a n t p e r m i t s f o r d i s c h a r g e s o f w a s t e
w a t e r i n t o s e w e r s o r u r b a n s u r f a c e w a t e r s ,
- o p e r a t i n g a c l o s e d f i n a n c i a l s y s t e m f o r a b a t i n g t h e
c o s t s o f m a n a g e m e n t o f s e w e r a g e s y s t e m s a n d s u r f a c e wa-
t e r s o n t h e b a s i s o f l e v i e s i n t h e f r a m e w o r k o f t h e
W a t e r p o l l u t i o n c o n t r o l a c t , r e p l a c i n g c u r r e n t l e v i e s
by p r o v i n c e s a n d w a t e r a u t h o r i t i e s o n t h e o n e h a n d ,
a n d m u n i c i p a l s e w e r a g e t a x o n t h e o t h e r ,
- p o s s i b l y - i n some c a s e s - o p e r a t i n g s e w a g e t r e a t m e n t
p l a n t s .
REFERENCES
ANDERSON, 3.M., 1 9 8 1 . E c o l o g y f o r e n v i r o n m e n t a l s c i e n c e s :
b i o s p h e r e , e c o s y s t e m s a n d man. E d w a r d A r n o l d ( P u b l i s h -
e r s ) , L o n d o n , 1 7 5 p p . IBSN 0 7 1 3 1 2 8 1 4 3 .
CENTRAAL BUREAU V O O R DE STATISTIEK, 1 9 8 0 . A l g e m e n e m i l i e u -
s t a t i s t i e k 1 9 7 7 - 1 9 7 8 . S t a a t s u i t g e v e r i j , ' s - G r a v e n h a g e ,
2 7 6 p p .
KROES, H . W . , 1 9 7 7 . The n i c h e s t r u c t u r e o f e c o s y s t e m s . 3 .
t h e o r . b i o l . 6 5 : 3 1 7 - 3 2 6 .
M ~ L L E R , P . , 1 9 8 0 , B i o g e o g r a p h i e . V e r l a g E u g e n U l m e r , S t u t t -
g a r t , 4 1 4 p p . IBSN 3 8 0 0 1 2 4 5 9 9.

O D U M , E .P. , 1 9 7 1 . F u n d a m e n t a l s o f e c o l o g y . W.B. S a u n d e r s
Company , P h i l a d e l p h i a , 574 p p . IBSN 0 7 2 1 6 6 9 4 1 7 .


MUNICIPAL INVOLVEMENT I N WATER I N AN URBAN ENVIRONMENT
L . J. Pieterse
1 INTRODUCTION
M u n i c i p a l i t i e s , i n t h i s c o n t e x t s e e n as c e n t r e s o f p o p u l a t i o n o f some
considerable s i z e w i t h a r e a s o n a b l y deve loped l e v e l o f a c t i v i t y ,
had f o r many c e n t u r i e s an i m p o r t a n t r e l a t i o n s h i p w i t h t h e s u r f a c e
w a t e r w i t h i n t h e i r b o u n d a r i e s . T h i s r e l a t i o n s h i p was o r i g i n a l l y
f o c u s s e d on t h e q u a l i t a t i v e a s p e c t and was gove rned ma in ly by
economic c o n s i d e r a t i o n s . Most i n d u s t r i e s i n t h e s e c e n t r e s were
dependen t on w a t e r a s a raw m a t e r i a l , bo th f o r t h e food i n d u s t r y
( b r e w e r i e s ) and f o r t h e t e x t i l e i n d u s t r y , t o name j u s t a c o u p l e .
It i s h a r d l y s u r p r i s i n g t h a t t h i s s i t u a t i o n f r e q u e n t l y l e d t o
c o n f l i c t s between t h e towns and t h e wa te r -boa rds i n which t h e y were
s i t u a t e d . A ve ry i n t e r e s t i n g p i e c e o f h i s t o r y w i t h j u s t s u c h a
background was t h e c o n f l i c t between t h e De l f l and wa te r -boa rd and t h e
town o f D e l f t , t h a t l a s t e d f o r a b o u t as l o n g a s t h e E i g h t y Years
War. You can r e a d a summary o f t h i s i n t h e c a t a l o g u e o f " H e t
P r i n s e n h o f " museum i n D e l f t which accompan ies t h e e x h i b i t i o n on
'The town o f D e l f t , 1572-1667' . The c o n f l i c t was, it seems , f i n a l l y
s e t t l e d by t h e ' S t a t e s o f Ho l l and1 i n 1632, a f t e r f i v e c o u r t s e s s i o n s
p r o c e e d i n g s between t h e two d i s p u t i n g f a c t i o n s . So c o n f l i c t s i n
w a t e r management a r e n o t a r e c e n t f e a t u r e , and n e i t h e r a r e
s h o r t a g e s o f good q u a l i t y w a t e r c o n f i n e d t o t h e p r e s e n t d a y .
lhis i n s p i t e o f t h e f a c t t h a t t h e i n t e r e s t s and c r i t e r i a a r e now
q u i t e d i f f e r e n t and t h a t t h e s y s t e m s a r e o f a d i f f e r e n t s t r u c t u r e .

Two deve lopmen t s have changed t h e s i t u a t i o n :
F i r s t l y : t h e n e c e s s i t y t o remove t h e s u r f a c e w a t e r from t h e c e n t r e s
o f p o p u l a t i o n which g rew r a p i d l y i n t h e n i n e t e e n t h c e n t u r y , and where
heavy p o l l u t i o n o c c u r r e d . That c o u l d be done by two methods:
e i t h e r by f l u s h i n g it away o r by c a t c h i n g i t i n s e p a r a t e s y s t e m s :
t h e sewerage s y s t e m s . Both methods were employed, s e p a r a t e l y and
t o g e t h e r .
Second ly : t h e need o f towns t o expand , even i n a r e a s which, on a c c o u n t
o f t h e i r l ow- ly ing a l t i t u d e , seemed l e s s s u i t a b l e . T h i s l e d t o r a i s i n g
t h e ground o r t o l o w e r i n g t h e l e v e l of t h e s u r f a c e w a t e r . Here t o o ,
bo th a l t e r n a t i v e s were employed, e i t h e r s e p a r a t e l y o r combined.
Anyone examining t h e r e l a t i o n s h i p o f t h e m u n i c i p a l i t i e s w i t h w a t e r
i n a n u rban env i ronmen t c a n n o t , t h e r e f o r e , r e s t r i c t h i m s e l f t o
s u r f a c e w a t e r , b u t must a l s o d e v o t e a t t e n t i o n t o t h e sewerage sys t em
and shou ld s t u d y t h e e f f e c t s o f u r b a n expans ion .
2 THE FUNCTION OF SEWERAGE
The pr imary r o l e , i n my o p i n i o n , o f m u n i c i p a l i t i e s i n w a t e r q u a l i t y
management h a s r a t h e r r eceded i n t o t h e background. The same t h i n g
h a s happened as w i t h many o t h e r a s p e c t s o f p u b l i c h e a l t h . Once a
t h r e a t h a s been a p p a r e n t l y b e a t e n , it is t r e a t e d a s i f it h a s been
e l i m i n a t e d f o r a l l t i m e , even though c o n s t a n t v i g i l a n c e is c a l l e d
f o r .
What is t h i s p r imary r o l e t h e n ?
I n s h o r t : The p o t e n t i a l l y dangerous w a s t e w a t e r produced i n c e n t r e s
o f p o p u l a t i o n s h o u l d e i t h e r be r e n d e r e d non-hazardous o r shou ld be
removed from t h e s e c e n t r e s . The la t ter method is t h e cus tomary o n e .
The sewerage s y s t e m , a s it h a s deve loped d u r i n g t h e last hundred y e a r s ,
h a s proved i t s e l f t h e i d e a l means o f d o i n g t h i s . However, i n s e r v i n g

t h i s f u n c t i o n , t h e r u l e obse rved u n t i l r e c e n t l y was t h a t was te
w a t e r shou ld be g o t r i d o f a s q u i c k l y a s p o s s i b l e , o n c e i t h a s been
c o l l e c t e d . No hold-ups were a l l o w e d . Th i s f r e e d t h e s u r f a c e wa te r i n
t h e c e n t r e s o f p o p u l a t i o n from a s i g n i f i c a n t s o u r c e o f p o l l u t i o n
and d e l i v e r e d t h e p o p u l a t i o n f rom a t h r e a t . Th i s was n o t , i n c i d e n t a l l y
done w i t h o u t l a r g e i n v e s t m e n t s . But t h e problem was i n t h i s way
t r a n s f e r r e d t o t h e w a t e r c o u r s e s o u t s i d e t h e p o p u l a t i o n c e n t r e s .
The problems t h a t a r o s e t h e r e have been domina t ing w a t e r management
i n r e c e n t d e c a d e s .
F i n a l l y , pos t -war i n d u s t r i a l i z a t i o n h a s added numerous p o t e n t i a l
h a z a r d s t o was te w a t e r , which a r e n o t s o much r e l a t e d t o h y g i e n e .
Here a s w e l l , t h e same c r i t e r i o n a p p l i e s : t h e r a p i d removal o f was te
w a t e r from c e n t r e s o f p o p u l a t i o n is , i n my o p i n i o n , o f t h e h i g h e s t
p r i o r i t y .
3 THE CONSTRUCTION OF NEW URBAN AREAS AND THE REDEVELOPMENT
OF OLD AREAS
While o r i g i n a l l y o n l y t h o s e a r e a s were b u i l t upon which were
s u f f i c i e n t l y h i g h , t h e c e n t r e s o f p o p u l a t i o n expanded d u r i n g t h e
l a s t c e n t u r y i n t o low- ly ing wa te r logged a r e a s which i n t h e i r
o r i g i n a l s t a t e were c o n s i d e r e d as b e i n g u n s u i t a b l e . I n t h e p r o c e s s ,
w a t e r l e v e l s were a l t e r e d and c a n a l s were e x c a v a t e d t o c o n t r o l
t h e w a t e r r eg ime . In g e n e r a l , t h i s expans ion r e s u l t e d i n a l o s s o f
s u r f a c e w a t e r a r e a . The e l i m i n a t i o n o f t h i s w a t e r a r e a was
accompanied by t h e l o s s o f t h e i r d i s p o s a l f u n c t i o n , w h i l e i n
a d d i t i o n t h e n a t u r e o f t h e s u r f a c e a l s o changed . In o r d e r t o s o l v e
t h i s problem t h e d i s c h a r g e o f r a i n w a t e r was combined w i t h t h e d i s c h a r g e
o f w a s t e w a t e r . These were , however , minor e f f e c t s . By f a r t h e
g r e a t e s t e f f e c t o f t h i s s o r t o f e x p a n s i o n was t h e change i n ground-
w a t e r l e v e l .
In a d d i t i o n t o u r b a n e x p a n s i o n , u r b a n redevelopment was a l s o
u n d e r t a k e n . A l a r g e number o f w a t e r c o u r s e s (whose p r imary u rban
f u n c t i o n had meanwhile been l o s t ) were q u i t e s i m p l y f i l l e d i n ,

u s u a l l y f o r t h e pu rpose o f c o n s t r u c t i n g a r t e r i a l r o a d s . The a r e a
o f s u r f a c e w a t e r w i t h i n m u n i c i p a l b o u n d a r i e s h a s d e c r e a s e d s h a r p l y
i n t h e c o u r s e o f t i m e , e s p e c i a l l y as a r e s u l t o f it l o s i n g i ts
t r a d i t i o n a l f u n c t i o n s and due t o t h e t h r e a t e n i n g c h a r a c t e r i t
p o s s e s s e d .
Only i n r e c e n t y e a r s h a s a n a p p r e c i a t i o n o f i ts v a l u e deve loped
and h a s a n a e s t h e t i c and r e c r e a t i o n a l f u n c t i o n been a s s i g n e d t o
w a t e r i n towns.
4 PRIORITIES
T h i s h a s been a v e r y s h o r t summary o f t h e r e l a t i o n s h i p which i n t h e
c o u r s e o f t i m e h a s deve loped between m u n i c i p a l i t i e s and w a t e r
management.
What a r e t h e p r i o r i t i e s o f m u n i c i p a l i t i e s ?
A s r e g a r d s t h e sewerage f u n c t i o n , t h e removal a s r a p i d l y - and
s a f e l y a s p o s s i b l e o f w a s t e w a t e r from t h e p o p u l a t i o n c e n t r e s .
In a d d i t i o n , t h e most e f f e c t i v e management o f t h e sewerage s y s t e m ,
by which n u i s a n c e f rom w a t e r f o r t h e p o p u l a t i o n is a v o i d e d . L a s t l y
t h e ma in tenance , aimed a t p r e v e n t i n g and removing s t o p p a g e s i n t h e
was te wa te r c o u r s e s .
A s t o t h e u rban development , a h i g h p r i o r i t y was a s s i g n e d t o s u r f a c e w a t e r
s a t i s f y i n g t h e r e n u i r e m e n t s o f h y g i e n e and a e s t h e t i c s and t h a t a l s o
l e n d i n g i t s e l f t o modest fo rms o f r e c r e a t i o n . In a d d i t i o n , a good
management o f s u r f a c e w a t e r and g roundwate r l e v e l s .
These p r i o r i t i e s a r e , o f c o u r s e , s e t o u t from a r a t h e r one-s ided
p o i n t of v i ew. I t d e o e n d s t o a l a r g e d e g r e e on t h e o r g a n i z a t i o n
o f w a t e r management w i t h i n t h e m u n i c i p a l b o u n d a r i e s , b o t h
q u a l i t a t i v e l y and q u a n t i t a t i v e l y as t o whether t h e m u n i c i p a l i t y
s h o u l d i t s e l f weigh up i t s p r i o r i t i e s a g a i n s t o t h e r p r i o r i t i e s
o r whether c o n s u l t a t i o n w i t h o t h e r management b o d i e s is n e c e s s a r y

i n o r d e r t o r e a c h agreement on t h e o r d e r o f p r i o r i t i e s . However, no
m u n i c i p a l i t y is a b l e t o e s t a b l i s h i t s own p r i o r i t i e s , whe the r
o r n o t m o d i f i e d . So t h a t g i v e s r i s e t o problems. I have t r i e d t o
i n v e n t o r i z e t h e s e a s g e n e r a l l y a s p o s s i b l e . The r e l a t i v e g r a v i t y o f
t h e problems w i l l v a r y from p l a c e t o p l a c e . I can a l s o n o t r u l e
o u t t h e p o s s i b i l i t y t h a t I may have mis sed s p e c i f i c p rob lems .
5 PROBLEM AREAS
5.1 P r e s e n t s i t u a t i o n
The r e q u i r e m e n t t h a t was te w a t e r be removed a s r a p i d l y a s p o s s i b l e
f rom p o p u l a t i o n c e n t r e s h a s been g r e a t l y i n f l u e n c e d by p r i n c i p l e s
o f modern q u a l i t y c o n t r o l . The means o f d i s c h a r g e f rom t h e systiem
h a s been g r e a t l y changed , bo th q u a l i t a t i v e l y and q u a n t i t a t i v e l y .
The f i r s t problem t h a t a r i s e s is t h a t f o r some m y s t e r i o u s r e a s o n
t h e c r i t e r i a l a i d down by t h e b o d i e s r e s p o n s i b l e f o r q u a l i t y c o n t r o l
d i f f e r g r e a t l y . A town s u c h a s Rot terdam, which h a s t o d e a l w i t h
f o u r q u a l i t y management b o d i e s is c o n f r o n t e d w i t h f o u r d i f f e r e n t
s o r t s o f l i m i t i n g c o n d i t i o n s . T h i s fo rms a n o b s t a c l e t o a unlform
management o f t h e sewerage s y s t e m . But t h a t i s n o t a l l : it a l s o c r e a t e s
a form o f i n e q u a l i t y t h a t m a n i f e s t s i t s e l f p r i m a r i l y i n t h e c o s t
s p h e r e .
A s r e g a r d s t h e c r i t e r i a t h e m s e l v e s , t h e somet imes l o n g e r r e s i d e n c e
t i m e o f t h e w a t e r i n t h e sys t em c a n l e a d t o p r o c e s s e s which c o u l d
p o s s i b l y a c c e l e r a t e c o r r o s i o n . But n o t enough i s y e t known a b o u t
c o r r o s i o n o f c o n c r e t e p i p e s f i l l e d - u s u a l l y p a r t l y - w i t h was te
w a t e r f o r a n y t i n g f u r t h e r t o be s a i d on t h e s u b j e c t .
It is n e v e r t h e l e s s wor th n o t i n g t h a t t h e s e d i m e n t a t i o n i n t h e
sewerage sys t em is c e r t a i n l y n o t g o i n g t o d i m i n i s h , i f a n y t h i n g it
i s more l i k e l y t o i n c r e a s e . Th i s sewage s l u d g e h a s r e c e n t l y s t a r t e d
t o become a problem. In a number o f c a s e s , it d o e s n o t s a t i s f y t h e
c r i t e r i a which would p e r m i t it t o be dumped. T h i s w i l l g i v e r i s e
t o problems i n t h e f u t u r e , p a r t i c u l a r l y i n a r e a s w i t h s m a l l - s c a l e
i n d u s t r y . It is t o be hoped t h a t t h i s problem w i l l become a t h i n g

o f t h e p a s t when t h e s e s m a l l e r i n d u s t r i e s a r e a l s o made s u b j e c t t o
l i c e n s i n g and c o n t r o l .
Another c r i t e r i o n , t h a t o f t h e p e r m i s s i b l e o v e r f l o w f r e q u e n c y , fo rms
a second problem a r e a . The a e s t h e t i c and h y g i e n i c c h a r a c t e r i s t i c s
o f urban s u r f a c e w a t e r mean t h a t even a s i n g l e o v e r f l o w i s i n f a c t
u n d e s i r a b l e . Even t h e d i s c h a r g e o f r a i n w a t e r from paved a r e a s o f t e n
p roduces a d i s t a s t e f u l p i c t u r e .
Avoiding s u c h a n o c c u r r e n c e e n t i r e l y i s , o f c o u r s e , i m p r a c t i c a b l e .
In Rot terdam, a t a i r l y s t r i n g e n t c r i t e r i o n i s , however , obse rved
i n t h i s r e s p e c t , based on t h e o l d pumped s i t u a t i o n . With t h e t h e n
ve ry h i g h o v e r c a p a c i t i e s , an o v e r f l o w f r e q u e n c y o f n o t more t h a n 3 t o
4 t i m e s p e r y e a r was o b s e r v e d . Compensation f o r t h i s e x t r e m e l y s t r i c t
c r i t e r i o n h a s been found n o t by h i g h e r i n v e s t m e n t i n d i s p o s a l means
o r o v e r c a p a c i t y , b u t i n a pumped o v e r f l o w i n t o t h e r i v e r .
F i n a l l y , t h e r a t h e r r i g i d a p p l i c a t i o n o f t h e c u r r e n t computa t ion
methods , i n which t h e most u n f a v o u r a b l e s i t u a t i o n s f o r a l l
connec ted s y s t e m s a r e s imply a 1 1 added t o g e t h e r g i v e s rise t o a t
l e a s t a s u s p i c i o n o f o v e r d i m e n s i o n i n g . Compensatory e f f e c t s which
c a n a r i s e t h r o u g h d i f f e r e n c e s i n t h e s i t u a t i o n f o r l a r g e - s c a l e
a r e a s were n o t made u s e o f and c o u l d n o t be u t i l i z e d , s i n c e t h e
c a p a c i t i e s d e r i v e d from t h e c a l c u l a t i o n were f i x e d .
The q u a l i t a t i v e a s p e c t o f t h e d i s c h a r g e o f m u n i c i p a l w a s t e w a t e r
is a l s o r a t h e r s t r a n g e . Both t h e c o n n e c t i o n p e r m i t and t h e o v e r f l o w
p e r m i t p r e s e n t e d t o t h e m u n i c i p a l i t i e s a s model impose p r e t t y
s t r i n g e n t r e q u i r e m e n t s - a t least i n t h e p r o v i n c e o f South Hol land - a s r e g a r d s t h e q u a l i t y o f t h e w a s t e w a t e r f o r d i s p o s a l . T h i s is
s t r a n g e , s i n c e t h e o r g a n i z a t i o n o f t a s k s i s i n g e n e r a l f o r m u l a t e d
by t h e q u a l i t y - c o n t r o l b o d i e s s u c h t h a t t h e m u n i c i p a l i t i e s a p p l y a
Di scha rge Order s o l e l y t o p r o t e c t t h e sewerage s y s t e m . The model
Di scha rge Order d o e s n o t r u l e o u t f a r - r e a c h i n g r e q u i r e m e n t s
( s e e A r t i c l e 101, b u t q u i t e a commotion is s t i r r e d up i f a
m u n i c i p a l i t y s t i c k s t o o c l o s e l y t o i t .

B e s i d e s t h e f a c t t h a t m u n i c i p a l i t i e s a r e h i n d e r e d i n f u l f i l l i n g t h e
c o n d i t i o n s i n t h e above-mentioned p e r m i t s , t h i s a l s o means t h a t
m u n i c i p a l i t y p o l i c y is dependen t on t h e p r i o r i t i e s set by o t h e r s .
But t h e q u a l i t y c o n t r o l body w i l l n o t be v e r y r e c e p t i v e t o anyone
w i t h a b a t c h o f s l u d g e whose c o m p o s i t i o n and p o l l u t i o n f a l l s
o u t s i d e t h e c r i t e r i a set by t h e Law on Chemical Waste D i s p o s a l .
F i n a l l y , t h e s u r f a c e w a t e r i t s e l f . The problem h e r e is d i r e c t l y
r e l a t e d w i t h t h e a s y e t u n d e f i n e d f u n c t i o n o f u rban s u r f a c e wa te r
and t h e r e q u i r e m e n t s a r i s i n g from t h i s . I have p r e v i o u s l y s a i d
someth ing a b o u t t h i s and Mr Kroes h a s a l r e a d y d e a l t w i t h t h e s e
problems i n g r e a t e r d e t a i l .
5 - 2 The n e a r f u t u r e
Is t h e problem f u l l y d e s c r i b e d ?
By no means. Up t o now we have j u s t made o b s e r v a t i o n s on t h e c u r r e n t
s i t u a t i o n .
In t h e meantime, o t h e r problems a r e looming i n t o s i g h t . Some o f them
have a l r e a d y been men t ioned , bu t t h e i r e x t e n t is st i l l n o t e n t i r e l y
e v i d e n t .
Some w i l l be men t ioned .
The problem o f d i f f u s e d i s c h a r g e s , o f which t h e r e a r e two c a t e g o r i e s .
The f i r s t we t h i n k we can do someth ing a b o u t . They f a l l d i r e c t l y
unde r t h e S u r f a c e Water P o l l u t i o n Act. It is o n l y t h e c h e c k i n g t h a t i s
p h y s i c a l l y i m p o s s i b l e . It ma in ly c o n c e r n s d i s c h a r g e s o f r e s i d u e s
o f consumption g o o d s , s u c h a s o i l , c h e m i c a l s and t h e l i k e . What is
q u i t e c l e a r h e r e i s t h a t t h e c o l l e c t i o n o f many o f t h e s e m a t e r i a l s
i s s u b j e c t t o a h i g h b a r r i e r . C o l l e c t i o n campaigns o n l y succeed
i f t h i s b a r r i e r c a n be lowered o r i f t h e r e is someth ing t o be had
f o r t h e t r o u b l e . ,
The second c a t e g o r y is more p r o b l e m a t i c a l . It i n c l u d e s m a t e r i a l s
which a r e r e l e a s e d d i f f u s e l y from road s u r f a c e s o r from b u i l d i n g
s i t e s , o r mere ly from t h e n o t s o c l e a r s k y . I n b o t h c a s e s t h e
m u n i c i p a l i t y w i l l become i n v o l v e d i n combat ing them.

Another problem is t h e ma in tenance o f sewerage s y s t e m s . There a r e
some very f a r - f e t c h e d s t o r i e s a b o u t t h i s s u b j e c t . But one o f t h e
problems i n t h i s a r e a is t h a t up t o now t h e r e is no method which
can p r e d i c t ma in tenance needs t o a r e a s o n a b l e d e g r e e o f a c c u r a c y .
So f o r t h e p r e s e n t t h e age c r i t e r i o n is u s e d . It h a s been found i n
Rotterdam t h a t t h i s is n o t a r e l i a b l e c r i t e r i o n .
We a r e c u r r e n t l y s e a r c h i n g f o r a r e l a t i o n s h i p between a g e on t h e o n e
hand and c o r r o s i v e a t t a c k a s a f u n c t i o n o f t h e s e t t l i n g o f t h e
sys t em on t h e o t h e r hand . Th i s is n o t s i m p l e . There is a l o t o f
r e s e a r c h t o be done .
T h i r d l y , t h e r e i s t h e a p p l i c a t i o n o f t h e c u r r e n t l y employed
ma themat i ca l models f o r complex s y s t e m s . I have a l r e a d y ment ioned t h a t
sys t ems a r e be ing d e s i g n e d by s i m p l e s u p e r p o s i t i o n o f t h e l e a s t
f a v o u r a b l e s i t u a t i o n s . The c o n c e p t ' c e n t r a l c o n t r o l ' h a s meanwhile
e n t e r e d t h e s c e n e . But i t s h o u l d be r e a l i z e d t h a t t h e a d v a n t a g e t o
be g a i n e d w i t h f i x e d pumping c a p a c i t i e s is o n l y l i m i t e d . F l e x i b l e
c a p a c i t i e s a r e p o s s i b l e and even - c o n t r a r y t o what i s g e n e r a l l y
assumed - a t c o r l p e t i t i v e c o s t s r e l a t i v e t o t h e o l d and f a m i l i a r
f i x e d c a p a c i t y s y s t e m s .
F o u r t h l y , t h e r e a r e t h e problems o f g roundwate r .
The s i t u a t i o n is f a r more c o m p l i c a t e d h e r e , a s t h e r e i s a g a p i n
t h e l e g i s l a t i o n . On t h e one hand t h e r e may be a d r a i n a g e problem,
a s a r e s u l t o f which t h e ground becomes marshy and c e l l a r s f l o o d
a t h i g h g roundwate r l e v e l s . From a t e c h n i c a l p o i n t o f v iew, t h e r e
i s b u t one s o l u t i o n f o r t h i s : improved d r a i n a g e . What is n o t c l e a r
is who b e a r s t h e o b l i g a t i o n t o p r o v i d e t h i s . M r H .H .A . Teeuwen h a s
w r i t t e n an i n t e r e s t i n g a r t i c l e on t h i s s u b j e c t i n 'De I n g e n i e u r '
o f Oc tobe r , 1984. No 10. page 43. The o t h e r s i d e o f t h e c o i n is less
e a s y t o r e g u l a t e f rom a t e c h n i c a l p o i n t o f view. It is t h e problem
o f e x c e s s i v e d r a i n a g e c a u s i n g t h e g roundwate r l e v e l t o f a l l and
endanger ( e s p e c i a l l y wooden) f o u n d a t i o n s . T h i s i s , o f c o u r s e , a
problem which o c c u r s i n s p e c i f i c a r e a s w i t h e q u a l l y s p e c i f i c
s o i l c o n d i t i o n and c o m p o s i t i o n . The c a u s e s may a l s o be s p e c i f i c and
l o c a l i n n a t u r e , b u t may a l s o be q u i t e g e n e r a l . A c h a r a c t e r i s t i c
i s , however, t h a t i n t h e a r e a s c o n c e r n e d , s u b s t a n t i a l s e t t l i n g is

q u i t e common.
A c o u p l e o f r e a s o n s f o r t h i s can be i d e n t i f i e d :
- The s t r e e t s i n t h e a r e a s conce rned a r e l a i d on l a y e r s o f s a n d .
A f t e r s e t t l i n g h a s o c c u r r e d , t h e s e a r e r a i s e d . I n t h i s way
t r e n c h e s a r e formed w i t h a d r a i n i n g e f f e c t on t h e g roundwate r l e v e l ,
e s p e c i a l l y l f c o n n e c t i o n s a r e t h e r e b y formed w i t h a r e a s whose w a t e r
l e v e l is m a i n t a i n e d a t a l ower e l e v a t i o n .
- A s t h e s t r e e t s u b s i d e s , s o do t h e sewer p i p e s . The house
c o n n e c t i o n s b r e a k o f f and t h e n t a k e g r o u n d w a t e r f rom t h e s u r r o u n d i n g
s o i l .
- Uneven s e t t l i n g c a n c a u s e t h e sewer p i p e s t o b r e a k o r deve lop
c r a c k s and i n t h i s way remove w a t e r from t h e s a n d c u n e t t e - Th i s h a s
a comparable e f f e c t a s t h e above-mentioned l i n k w i t h a r e a s pumped
t o a lower w a t e r l e v e l .
I have r e s t r i c t e d myse l f t o c a u s e s n o t a r i s i n g from a n y o n e ' s f a u l t .
There a r e , o f c o u r s e a l s o c a s e s where someone e l s e is t o blame.
It is t h e s e e f f e c t s i n p a r t i c u l a r which s t a n d i n t h e way o f t h e
e f f i c i e n t approach f o r w h i c h M r Teeuwen makes a c a s e i n h i s a r t i c l e .
F i n a l l y t h e r e is t h e problem t h a t i s be ing e x t e n s i v e l y s t u d i e d a t t h e
p r e s e n t t i m e : t h e r e l a t i o n s h i p between sewerage and w a t e r q u a l i t y .
T h i s s u b j e c t h a s a l s o been broached p r e v i o u s l y , h e r e and e l s e w h e r e .
A q u e s t i o n t h a t h a s n o t been v o i c e d up t o now, however , is t h e
f o l l o w i n g :
If t h e r e s u l t s o f t h e i n v e s t i g a t i o n s l e a d t o a d i f f e r e n t p o l i c y ,
and if t h i s p o l i c y i n t u r n r e q u i r e s new f a c i l i t i e s - l i k e a s s o c i a t e d
f a c i l i t i e s f o r t h e sewerage sys t em - t o which c a t e g o r y would t h e y t h e n
be long? To sewerage o r p u r i f i c a t i o n s works? It is c l e a r t o me t h a t
what we a r e h e r e f a c e d w i t h is a f i n a n c i a l problem. T h i s ,
i n c i d e n t a l l y , is t h e c a s e w i t h a l l problems. The f i n a n c i a l a s p e c t s
o f t h e problem a r e a s , a r e beyond t h e s c o p e o f t h e s u b j e c t o f t h i s
l e c t u r e .

N e i t h e r t h e problems a s s o c i a t e d w i t h p r e p a r i n g s i t e s f o r t h e
b u i l d i n g o f u rban expans ion p r o j e c t s w i l l be d e a l t h w i t h . In t h e
n e x t pape r it i s proposed t o examine t h i s s u b j e c t , r e f e r r i n g t o a
r e c e n t p u b l i c a t i o n o f t h e Union o f Water-boards . T h i s ' g u i d e l i n e ' g i v e s a n e x c e l l e n t expos6 o f t h e problems i n t h i s f i e l d and even
p r o p o s e s s o l u t i o n s f o r them.
6 SOLUTIONS
P l e a s e do n o t e x p e c t now a list o f ready-made a n s w e r s t o t h e
p rob lems t h a t have been r a i s e d . Many o f them w i l l have t o be
s o l v e d by a p r o c e s s o f c o n s u l t a t i o n , i n which t h i s e x p o s 6 w i l l
h o p e f u l l y c o n t r i b u t e t o t h e d i s c u s s i o n , if o n l y by c r e a t i n g an
u n d e r s t a n d i n g o f t h e innumerab le problems f a c i n g m u n i c i p a l i t i e s .
There is one i m p o r t a n t f a c t o r m i s s i n g i n t h i s c o n s u l t a t i o n
p r o c e s s , namely, a s o r t o f fo rum i n which m u n i c i p a l i t i e s c o u l d g e t t o
g r i p e w i t h t h e i r technical p rob lems . T h i s l a c k r e s u l t s i n t h e
wa te r -boa rds which are approached by t h e m u n i c i p a l i t i e s i n
r e s p e c t o f t e c h n i c a l p rob lems are f a c e d w i t h a s many d i f f e r e n t
manners o f a p p r o a c h as t h e r e a r e m u n i c i p a l i t i e s . There are
d i f f e r e n c e s b e t w e e n g r o u p s o f m u n i c i p a l i t i e s a s r e g a r d s t h e i r s i z e ,
b u t some d e g r e e o f o r d e r would seem d e s i r a b l e .
Moreover, t h e l a c k o f s u c h a forum is a l s o t h e r e a s o n why i n many
c a s e s each m u n i c i p a l i t y h a s t o r e d i s c o v e r s o l u t i o n s t o problems
which have a l r e a d y been s o l v e d e l s e w h e r e . T h i s i n t u r n means
t h a t even a f t e r problems have been i d e n t i f i e d , it t a k e s a l o n g
t i m e b e f o r e t h e y a r e e l i m i n a t e d , which is h a r d l y b e n e f i c i a l t o
good w a t e r management.
S o l u t i o n s w i l l p r o b a b l y r e q u i r e g r e a t e f f o r t and c o n s u l t a t i o n and
w i l l c e r t a i n l y a l s o have f i n a n c i a l consequences . For some o f t h e
problem a r e a s men t ioned , one a l r e a d y h e a r s rumours o f v a s t sums
which a r e s a i d t o be r e q u i r e d f o r t h e i r s o l u t i o n .
C l a r i t y can o n l y be o b t a i n e d by t h o r o u g h s t u d y . The m u n i c i p a l i t i e s

have n o t done much i n t h i s d i r e c t i o n . However, t h e M i n i s t r y o f Housing,
P h y s i c a l P lann ing and Environmental P r o t e c t i o n (and b e f o r e t h a t t h e
M i n i s t r y o f P u b l i c H e a l t h and Env i ronmen ta l Hygiene) and a l s o t h e
I J s s e l m e e r p o l d e r s Development A u t h o r i t y have made g r e a t e f f o r t s
t o f i l l t h i s g a p and still do s o .
It might t h e r e f o r e be a rgued t h a t t h e t a s k t o a c e r t a i n e x t e n t i s
f u l f i l l e d . However, it is done i n a manner whereby t h e p r i o r i t i e s
and t h e l i m i t i n g c o n d i t i o n s f o r t h e s t u d i e s a r e d e t e r m i n e d by o t h e r s
i n s t e a d o f by t h e m u n i c i p a l i t i e s ,
I n t h e whole p r o c e s s o f r e o r g a n i z a t i o n , t h e r u l e s and s o l u t i o n s t h a t
sometimes emerge may r a i s e t h e q u e s t i o n i f t h i s is r e a l l y what
we have been w a i t i n g f o r .
But u n t i l t h e m u n i c i p a l i t i e s t h e m s e l v e s t a k e t h e i n i t i a t i v e , t h e r e
w i l l be no change i n t h e s i t u a t i o n and t h e y w i l l j u s t f o l l o w
meekly .
7 SUMMARY
T h e m u n i c i p a l i t i e s n a v e l o n g been c l o s e l y i n v o l v e d i n w a t e r management
w i t h i n t h e i r b o u n d a r i e s . T h e i r r e q u i r e m e n t s a r e s p e c i f i c and
d i r e c t e d p a r t i c u l a r l y t o t h e u r b a n p o p u l a t i o n and t h e i r w e l f a r e .
There a r e t h r e e a s p e c t s by which t h i s involvement m a n i f e s t s
i t s e l f i n modern w a t e r management:
- t h e sewerage f u n c t i o n
- d r a i n a g e o f a r e a s earmarked f o r e x p a n s i o n
- t h e s u r f a c e w a t e r i t s e l f .
There s t i l l rema in a l a r g e number o f problems t o be s o l v e d i n t h e
p r e s e n t s i t u a t i o n . These r e l a t e p a r t i c u l a r l y t o t h e r e l a t i o n s h i p
between m u n i c i p a l i t i e s and t h e b o d i e s r e s p o n s i b l e f o r q u a l i t y
c o n t r o l . In some c a s e s t h e p rob lems a r e s p e c i f i c t o i n d i v i d u a l
m u n i c i p a l i t i e s .

New problems a r e p r e s e n t i n g t h e m s e l v e s , o r have a l r e a d y made
themse lves known. They i n c l u d e many s p e c i f i c a l l y m u n i c i p a l i t y -
r e l a t e d a s p e c t s , h a l f a dozen o f which have been e l u c i d a t e d i n t h e
f o r e g o i n g .
I f t h e m u n i c i p a l i t i e s , p o s s i b l y i n c o - o p e r a t i o n w i t h o t h e r s , a r e
t o f i n d a s o l u t i o n t o t h e s e p r o b l e m s , t h e f i r s t and f o r e m o s t
p r e c o n d i t i o n w i l l be t h a t t h e y combine t h e i r f o r c e s and t h e m s e l v e s
d e f i n e a p o l i c y f o r s t u d i e s i n t o f i n d i n g s o l u t i o n s .

THE WATER-BOARD, ALSO I N URBAN AREAS
J .S .J . Dragt
ABSTRACT
I n h i s l e c t u r e M r De G r a e f f e x p l a i n e d t h e r e s p o n s i b i l i t y and p o s i t i o n
o f t h e water-boards w i t h r e g a r d t o t h e w a t e r management o f The
N e t h e r l a n d s . These b o d i e s a r e d e s i g n a t e d by v a r i o u s names, depend ing on
t h e i r s p e c i f i c t a s k s s u c h a s : p o l d e r - b o a r d , j o i n t c o l l e g e o f wa te r -
b o a r d s , p o l d e r d ~ s t r i c t , sewerage p u r i f i c a t i o n a u t h o r i t y e t c .
I n t h e f o l l o w i n g t h e g e n e r a l d e s i g n a t i o n "water-board" w i l l be used
a l s o because b o t h i n t h e e x p l a n a t o r y memorandum t o t h e d r a f t b i l l on t h e
water-boards and i n d e r e v i s e d C o n s t i t u t i o n o f t h e N e t h e r l a n d s it is
t a k e n t h a t t h e c o n c e p t o f "water-board" a s s u c h n e e d s no d e f i n i t i o n , I'no
more t h a n i n c o n c e p t s o f m u n i c i p a l i t y and p r o v i n c e do".
1 QUANTITATIVE WATER MANAGEMENT I N URBAN AREAS
The main t a s k o f a water-board c o n s i s t s o f t h e conse rvancy o f d e f e n c e
works o f waterways and a p p u r t e n a n t s t r u c t u r e s i n t h e i n t e r e s t o f w a t e r
c o n t r o l and n a v i g a t i o n . The j u r i s d i c t i o n may compr i se t h e t e r r i t o r i e s o f
s e v e r a l m u n i c i p a l i t i e s . A s a r e s u l t t h e m u n i c i p a l i t i e s and t h e wa te r -
b o a r d s o f t e n "run a c r o s s " e a c h o t h e r i n pe r fo rming t h e i r t a s k s . I n t h i s
e n c o u n t e r , " runn ing a c r o s s " means a mutua l a t t u n i n g o f t h e i n t e r e s t s t o
be looked a f t e r by t h e two a g e n c i e s i n o r g a n i z i n g and managing t h e w a t e r
e l emen t i n a n u rban a r e a . T h i s is p r e c i s e l y t h e s u b j e c t o f t h i s symposium.
I n p a r e n t h e s i s i t s h o u l d be ment ioned t h a t t h e m u n i c i p a l i t y and t h e

water-board a l s o r u n a c r o s s e a c h o t h e r o u t s i d e t h e u rban a r e a ; i . e . i n
t h e r u r a l a r e a s where bo th a g e n c i e s a r e d e a l i n g w i t h p h y s i c a l p l a n n i n g .
By means o f a number o f p r a c t i c a l examples it w i l l be shown how a good
co -ope ra t ion between a m u n i c i p a l i t y and a water-board r e s u l t e d i n w e l l -
i n t e g r a t e d s o l u t i o n s o f p rob lems o f u rban e x t e n s i o n , b u t a l s o where t h i s
co -ope ra t ion jogged a l o n g .
Below i t w i l l be o u t l i n e d i n which way t h e w a t e r - b o a r d s c a n , w i l l and
must be a c t i v e w i t h i n urban a r e a s .
Where d i f f e r e n t gove rnmen ta l b o d i e s s i t a t t h e t a b l e t o c o n s u l t how i n a
c e r t a i n s i t u a t i o n t h e w a t e r management shou ld be e f f e c t e d t h e s t a r t i n g
p o i n t o f t h e i n d i v i d u a l p a r t i e s t o t h e d i s c u s s i o n is o f t e n t o keep t h e
c o s t s f o r t h e m s e l v e s a s low a s p o s s i b l e .
I n p o l i t i c s , t h e c o n c e p t o f s e g r e g a t i o n h a s been i n t r o d u c e d t o i n d i c a t e
t h i s way o f o p e r a t i n g o n l y w i t h i n o n e ' s own f i e l d o f i n t e r e s t . T e c h n i c i a n s
a l s o a r e g u i l t y o f t h i s p r a c t i c e .
It needs l i t t l e argument t h a t t h i s is n o t a v e r y e f f i c i e n t way o f
s t a r t i n g t h e s o l u t i o n o f t h e p rob lems . Le t a l o n e t h a t a n e f f i c i e n t
s o l u t i o n w i l l r e s u l t from i t . The s t a r t i n g p o i n t must be c o - o p e r a t i o n a n d
n o t o n l y c o n s u l t a t i o n . Only t h e n a n optimum s o l u t i o n can be a t t a i n e d i n
t h e f i e l d o f p o l i c y a s w e l l a s i n t h e t e c h n i c a l and f i n a n c i a l f i e l d s . I f
t h e s t a r t i n g p o i n t is c o - o p e r a t i o n , a r e a s o n a b l e s o l u t i o n f o r t h e d i s -
t r i b u t i o n o f t h e c o s t s w i l l a l w a y s be found.
A second remark c o n c e r n s t h e p o i n t o f t ime a t which t h e co -ope ra t ion
shou ld s t a r t . We11 t h e n , t h a t c a n n o t be t o o soon . Development o f
u r b a n i z a t i o n p r o j e c t s r e q u i r e s t h e c o l l e c t i o n o f a l l k i n d s o f i n f o r m a t i o n .
Consequen t ly , f o r a f e r t i l e c o - o p e r a t i o n between water-board and munici -
p a l i t y t o be p o s s i b l e , t h e s t a r t o f t h i s c o - o p e r a t i o n s h o u l d be as e a r l y
a s p o s s i b l e . O t h e r w i s e , t h e r e is a g r e a t r i s k o f p o s i t i o n s h a v i n g been
t a k e n up and s e g r e g a t i o n h a v i n g s e t t l e d - we p e o p l e a r e j u s t made t h a t
way. For t h a t m a t t e r , e a r l y c o - o p e r a t i o n a l s o a p p l i e s t o o t h e r b o d i e s
i n v o l v e d i n t h e development o f p r o j e c t s .
1 . l G u i d e l i n e
The problems s i g n a l i z e d above have g i v e n r i s e f o r t h e Union o f Water-
Boards t o c o n s i d e r how t h e wa te r -boa rds have t o c a r r y o u t t h e i r t a s k s

when b u i l d i n g o v e r o f an a r e a is r e a l i z e d under t h e r e s p o n s i b i l i t y o f a
m u n i c i p a l i t y . R e c e n t l y f o r t h a t p u r p o s e t h e p u b l i c a t i o n "Guide l ine on t h e
d e f e n c e a g a i n s t t h e w a t e r and t h e w a t e r q u a n t l t y management by wa te r -
b o a r d s i n r e l a t i o n t o t h e r e a l i z a t i o n o f t h e b u i l d i n g o v e r o f an a r e a
by m u n i c i p a l i t i e s " h a s been i s s u e d .
It would c a r r y t o o f a r t o d i s c u s s t h i s g u i d e l i n e I n d e t a i l , b u t some
main items s h o u l d be ment ioned.
The problem is how t h e t a s k o f a water-board a s l a i d down i n t h e r e g u l a -
t i o n s w i t h i ts m a n a g e r i a l , t e c h n i c a l and f i n a n c i a l r e s p o n s i b i l i t i e s c a n
be execu ted when a m u n i c i p a l i t y wan t s t o b u i l d o v e r an a r e a .
The g u i d e l i n e d i s t i n g u i s h e s s i t e development f rom t h e w a t e r management.
The fo rmer is a m u n i c i p a l t a s k , t h e l a t t e r t h e t a s k o f t h e water-board.
It i s c l e a r , however , t h a t s i t e development and management a r e two
m a t t e r s t h a t c a n n o t be c o n s i d e r e d i n d e p e n d e n t l y f rom e a c h o t h e r . The
g u i d e l i n e assumes t h a t s i t e development is e x c l u s i v e l y a mun ic ipa l t a s k .
Based on t h i s a s sumpt ion a l l k i n d s o f p h y s i c a l p l a n n i n g d e c i s i o n s w i l l
have t o be t a k e n t h a t w i l l be a f f e c t e d by t h e management o f w a t e r o r t h a t
t hemse lves a f f e c t t h e management o f w a t e r . I n t h e fo rmer c a s e t h e i n -
f l u e n c e can be s u c h t h a t f i n a l l y even t h e l ay -ou t changes . I n t h e l a t t e r
c a s e a d a p t a t i o n o f t h e w a t e r management sys t em may be n e c e s s a r y . Once
t h e new lay-out ( b u i l d i n g o v e r o f an a r e a ) h a s been r e a l i z e d , t h e w a t e r -
board h a s t o a d j u s t i ts management sys t em t o t h e new s i t u a t i o n .
A s examples t h a t mus t be c l a s s i f i e d unde r s i t e development may be
ment ioned: f i l l i n g i n , d r a i n a g e , s ewerage , e x c a v a t i o n o f c a s a l s a n d m o a t s
and t h e l i k e and t h e i r d r a i n i n g by means o f pumps.
Water management a f t e r s i t e development i n c l u d e s t h e e v a c u a t i o n o f e x c e s s
w a t e r from r a i n f a l l which i s d r a i n i n g o f f r a p i d l y .
N a t i o n a l l y a p p l i c a b l e d e f i n i t i o n s o f t h e r e s p o n s i b i l i t i e s c a n n o t be
g i v e n because t h e t a s k s o f t h e wa te r -boa rd , i n a c c o r d a n c e w i t h t h e
r e g u l a t i o n s , have been commissioned t o d i f f e r t o o muchin t h e N e t h e r l a n d s .
Consequen t ly , it i s r i s k y t o g i v e examples o f s o l u t i o n s as t h e y soon a r e
g o i n g t o l e a d a l i f e o f t h e i r own. Some p r a c t i c a l s i t u a t i o n s may c l a r i f y
how i n s p e c i f i c c a s e s t h e s e t a s k s a r e i n t e r p r e t e d .
1.2 An example o f t h e water-board De Aa
Wi th in t h e s c o p e o f t h e n e c e s s a r y c o n s u l t a t i o n p u r s u a n t t o A r t i c l e 8 o f

MODEL AA wave
Figure 1 The situation of the present Figure 2 The outflow hydrogram
and future overflows of one of the overflows
is indicated by a dotted
line
J K L M
Figure 3 Levels as a consequence of overflows

t h e Decree P h y s i c a l P l a n n i n g , m u n i c i p a l i t y X b r i n g s t o t h e n o t i c e o f t h e
water-board ( s e e F i g u r e 1 ) t h e d r a f t o f an r e l a t i v e l y l a r g e zon ing p l a n .
The p l a n forms p a r t o f t h r e e l a r g e town p l a n s and t o g e t h e r t h e y form a
s t r u c t u r a l i n t e r v e n t i o n i n t h e w a t e r management o f t h e r e g i o n . I n an
e a r l i e r s t a g e t h e water-board had a l r e a d y a rgued f o r t h e e s t a b l i s h m e n t
o f a working g roup a d hoc t o c o n s i d e r i n which way a d a p t i o n o f t h e
w a t e r management c o u l d be made. The above zon ing p l a n i n t h e meantime
had s t r u c k o u t a l i n e f o r i t s e l f , w h l l e t h e I n v e s t i g a t i o n o f t h e working
g r o u p t h a t had indeed been e s t a b l i s h e d was s t i l l g o l n g on . The answer o f
t h e water-board t o t h e A r t i c l e 8 p r o c e d u r e can e a s i l y be guessed :
O b j e c t i o n s !
It is more i n t e r e s t i n g , however, t o know what were t h e r e s u l t s o f t h e
working g roup . F i r s t and f o r e m o s t , however, we must ment lon t h e s t a n d -
p o i n t o f o u r wa te r -boa rd a s t o t h e d i s c h a r g e o f u rban w a t e r .
I n g e n e r a l , i t means t h a t upon d r a i n i n g t o w a t e r c o u r s e s - mos t ly v i a
o v e r f l o w s - a c a p a c i t y o f 50% o f t h e d e s i g n d i s c h a r g e f o r t h e w a t e r
c o u r s e must be p r o v i d e d , s o t h a t t h e 50% of t h e d e s i g n d i s c h a r g e is
a v a i l a b l e f o r t h e d i s c h a r g e o f t h e u rban r a i n w a t e r t h a t w i l l d r a i n o f f
r a p i d l y . The r ema inde r must b e s t o r e d . A l s o , t h e wa te r -boa rd a lways
p l e a d s t o e s t a b l i s h t h e n e c e s s a r y s t o r a ~ e a c c o r d i n g t o t h e P h y s i c a l
P l a n n i n g r u l e s .
The above zon ing p l a n p r o v i d e d f o r t h e d i s c h a r g e o f t h e o v e r f l o w w a t e r
t o t h e Zuid-Willems-canal, which w i l l be d i v e r t e d i n t h e f u t u r e . No
a t t e n t i o n was p a i d t o t h e n e c e s s i t y o f d i s c h a r g i n g f o r many y e a r s t h e
a d d i t i o n a l o v e r f l o w w a t e r - h a v i n g a maximum i n t e n s i t y o f a b o u t 5m3/sec. - v i a t h e Aa.
N e i t h e r was it c l e a r whether t h i s magni tude o f d i s c h a r g e s would p roduce
an u n a c c e p t a b l e q u a l i t y o f t h e w a t e r o f t h e r i v e r Aa.
A l l i n a l l t h e water-board f o r e s a w g r e a t p rob lems , t h e more s o as t h e
above-mentioned g e n e r a l p r a c t i c e on t h e c a p a c i t y o f 50% o f t h e d e s i g n
d i s c h a r g e c o u l d n o t be a p p l i e d h e r e ; f o r t h i s pu rpose a b o u t 10 w e i r s i n
t h e A a would have t o be au tomated . The r e s u l t s o f t h e i n v e s t i g a t i o n is
summarized i n F i g u r e 1 , 2 and 3.
F i g u r e 1 g i v e s t h e s i t u a t i o n o f t h e p r e s e n t and f u t u r e o v e r f l o w s .
205

I n F i g u r e 2 t h e o u t f l o w hydrogram o f one o f t h e o v e r f l o w s is i n d i c a t e d
by a d o t t e d l i n e .
For a l l o v e r f l o w s s u c h a n o v e r f l o w d iag ram h a s been made and i n t r o d u c e d
i n t o t h e c a l c u l a t i o n .
The o t h e r c u r v e s a r e hydrographs a t v a r i o u s n o d a l p o i n t s i n t h e Aa. The
computer c a l c u l a t i o n g a v e a s r e s u l t maximal ly o c c u r r i n g l e v e l s as a con-
sequence o f o v e r f l o w s , p a r t l y shown i n F i g u r e 3. From t h i s it c o u l d be
concluded t h a t , a p a r t from s t o r a g e s e c t i o n J - K , t h e l e v e l s o c c u r r i n g i n
t h e Aa would nowhere g i v e r i s e t o i n u n d a t i o n s . For s t o r a g e l e v e l , w h i c h i s
j u s t i f i e d , because t h e a g r i c u l t u r a l s i g n i f i c a n c e o f t h e a r e a c o n c e r n e d a s
minimized by u rban development . A s t h e water-board a t f i r s t f e a r e d t h a t
s t o r a g e ponds had t o b e i n c l u d e d i n t h e expans ion p l a n s , t h i s d i d n o t
a p p e a r t o be n e c e s s a r y a f t e r t h e i n v e s t i g a t i o n p r o v i d e d t h e wa te r -boa rd
would be p r e p a r e d t o a c c e p t e x c e e d a n c e s o f s h o r t d u r a t i o n o f t h e t a r g e t
l e v e l s . Consequen t ly , i t was n o t n e c e s s a r y t o s t r i c t l y s t i c k t o t h e a-
bove b a s i c s t a n d a r d . A s t h e s e m a t t e r s d i d n o t form a n y problem, a n
enormous s a v i n g i n t h e zon ing p l a n c o u l d be o b t a i n e d .
1 .3 An example o f t h e wa te r -boa rd De Dommel
A t y p i c a l example o f a water-board h a v i n g t a k e n o v e r t h e r e s p o n s i b i l i t y
is p rov ided by t h e c a s e o f t h e wa te r -boa rd De Dommel. For many y e a r s a l -
r e a d y t h e r e had been t h e d i s c u s s i o n whether o r n o t De Dommel between
Eindhoven and B o x t e l had t o be improved.
C a l c u l a t i o n s o f t h e d e s i r a b l e h i g h w a t e r l i n e had been c a r r i e d o u t i n
t h e n i n e t e e n s i x t i e s . Sewerage p l a n s and d e s i g n l e v e l s o f new z o n i n g
p l a n s were tuned t o t h e lowered h i g h w a t e r l i n e t o be e x p e c t e d . Whenthe
water-board f i n a l l y d e c i d e d n o t t o improve t h e Dommel between Eindhoven
and B o x t e l , i t was a l s o d e c i d e d t h a t t h i s might n o t be a t t h e expense o f
a worsen ing o f t h e d r a i n a g e and d e w a t e r i n g s i t u a t i o n o f t h e a d j a c e n t
u rban a r e a s . The r e s u l t o f t h i s d e c i s i o n was t h a t i n p a r t i c u l a r S t .
Oedenrode was p r o v i d e d w i t h a s y s t e m o f pumped o v e r f l o w which g u a r a n t e e d
s u f f i c i e n t d r a i n a g e at h i g h Dommel l e v e l s .
The g u i d e l i n e s o f t h e Union, a s s t a t e d above , g i v e c l e a r recommenda-
t i o n s f o r t h e r e s p o n s i b i l i t y o f t h e water-board i f u rban deve lopmen t s
from p a r t o f t h e a s s i g n m e n t o f t h e water-board. I f , however, it is a

d e p o l d e r e d a r e a * ) which depends on t h e d i s c h a r g e o f i t s o v e r f l o w on t h e
a d j a c e n t d i s t r i c t o f t h e wa te r -boa rd , an e n t i r e d i f f e r e n t s i t u a t i o n a -
r i s e s . Then t h e water-board d o e s n o t have a s t a t u t o r y r e s p o n s i b i l i t y i n
such an a r e a . I n most c a s e s t h e water-board w i l l impose e n t i r e l y
u n i l a t e r a l l y p e r l i c e n c e t h e c o n d i t i o n s f o r d i s c h a r g e t o t h e wa te r
management sys t em under i ts c o n t r o l .
Tha t i s a bad t h i n g , because a l s o i n t h i s c a s e by means o f an examina t ion
o f t h e p o s s i b i l i t i e s t h e r e mav be a n a l t e r n a t i v e s o l u t i o n I n v o l v i n g
lower c o s t s f o r t h e s o c i e t y . H e r e , t o o , a c o n d i t i o n i s t h a t t h e wa te r -
boa rd w i l l be i n v o l v e d i n t h e p l a n s a t a n e a r l y s t a g e . N a t u r a l l y , a l l
f i n a n c i a l consequences a r e i n t h e s e c a s e s f o r a c c o u n t o f t h e munici -
p a l i t y , t h e c o s t s o f o f f i c i a l a s s i s t a n c e b e i n g i n c l u d e d .
These a r e t h e d i s a d v a n t a g e s o f d e p o l d e r i n g !
1 . Q Summary
The above examples make it c l e a r , and t h e g u i d e l i n e p o i n t s t o t h a t t o o ,
t h a t e a r l y and s t r u c t u r i z e d c o n s u l t a t i o n i s n e c e s s a r y i n p r e p a r i n g t h e
zon ing p l a n s . Also i n 1977, i n a l e c t u r e on a s i m i l a r s u b j e c t t o t h a t o f t h i s
symposium, t h e w r i t e r o f t h i s r e p o r t p l eaded a l r e a d y f o r t h e i n c l u s i o n
o f a c h a p t e r " w e t - s t r u c t u r e p l a n " i n t h e zon ing p l a n s . The e x p e r i e n c e
h a s been t h a t n o t y e t e v e r y town-planning e x p e r t is aware o f t h i s
n e c e s s i t y .
I n an a p p e a l p r o c e d u r e even a p r o v i n c i a l government was o f t h e o p i n i o n
t h a t such a "wet s t r u c t u r e p l a n " - from which " d e s t i n a t i o n s " r e s u l t - n e e d s n o t form p a r t o f t h e zon ing p l a n .
2 WATER QUALITY MANAGEMENT I N URBAN AREAS
I n t h e N e t h e r l a n d s t h e w a t e r q u a l i t y management f o r t h e w a t e r c o u r s e s
which a r e n o t non-Governmental w a t e r s h a s been e n t r u s t e d t o t h e p r o v i n c e s ,
who i n most c a s e s have i n t u r n d e l e g a t e d t h i s management t o wa te r -boa rds
* ) A "depoldered a r e a 1 ' i s a n a r e a which h a s been wi thdrawn from t h e
j u r i s d i c t i o n o f a water-board b e c a u s e o f p h y s i c a l r e s h a p i n g o f t h e
a r e a and a d m i n i s t r a t i v e r e a s o n s .

s p e c i a l i z e d i n i t , o r sewerage p u r i f i c a t i o n authorities e s p e c i a l l y
b rough t i n t o e x i s t e n c e f o r i t .
These b o d i e s have t o t a k e c a r e o f t h e r e a l i z a t i o n and maintenance o f a
good q u a l i t y o f t h e s u r f a c e w a t e r . The b a s i s f o r t h i s a s s i g n m e n t h a s b e e n
t h e f a c t t h a t w a t e r q u a n t i t y and w a t e r q u a l i t y and t h e i r management a r e
i n t i m a t e l y r e l a t e d . S i n c e a judge pronounced a s e n t e n c e on i t , i t i s a l -
s o an e s t a b l i s h e d f a c t what h a s t o be unde r s tood by s u r f a c e w a t e r ;
"each wa te r t h a t a t any moment o f t h e y e a r is v i s i b l e and communicates
w i t h o t h e r w a t e r o u g h t t o be c o n s i d e r e d s u r f a c e w a t e r i n t h e l e g a l ~ e n s e ' ~ .
Consequen t ly , i t is c l e a r t h a t t h e w a t e r q u a l i t y management o f t h e
water-board a l s o e x t e n d s t o t h e u rban w a t e r s , b o t h t h e c a n a l s o f Leiden
o r D e l f t , and t h o s e a t Almelo o r B a a r l e Nassau, which d r y up t e m p o r a r i l y
Now i n which way m a n i f e s t s t h e water-board i t s e l f a s t o t h e w a t e r
q u a l i t y management o f t h e s u r f a c e w a t e r i n a n urban a r e a ? A s s t a t e d
e a r l i e r t h e s e w a t e r s form p a r t o f a u n i t o f w a t e r management: t h e y run
o f f t o t h e w a t e r o u t s i d e t h e town o r t h e w a t e r s f rom o u t s i d e t h e town
f low th rough them. By means o f t h e sys t em o f w a t e r q u a l i t y p l a n s
f u n c t i o n s a r e c o n f e r r e d t o t h e s u r f a c e wa te r . It is c l e a r t h a t t h e s e
f u n c t i o n s , a p a r t from depend ing on t h e p o s s i b i l i t i e s , a l s o depend on t h e
d e s t i n a t i o n a c e r t a i n s u r f a c e w a t e r h a s . T h i s d e m o n s t r a t e s t h e c o h e r e n c e
o f t h e q u a l l t y management i n s i d e and o u t s i d e t h e town.
It i s t h e t a s k o f t h e water-board t o p u r s u e a s much a s p o s s i b l e t h e
f u n c t i o n s t h a t once have been e s t a b l i s h e d , and t h a t c a n n o t be done
s e p e r a t e l y w i t h i n t h e b o u n d a r i e s o f t h e b u i l t - u p a r e a . T h e r e f o r e ,
M r Kroes ' s u g g e s t i o n t o s e t t h e m u n i c i p a l i t y a n independen t t a s k a s t o
t h e management o f t h e urban w a t e r s , i n t h e s e n s e o f t h e P o l l u t i o n o f
S u r f a c e Water Act s h o u l d be r e j e c t e d f o r t h i s ve ry r e a s o n .
I n which way t h e n s h o u l d t h e w a t e r q u a l i t y manager s e e h i s t a s k i n u rban
a r e a s ?
Even more t h a n i n t h e r u r a l a r e a , t h e r e shou ld be a b e t t e r t u n i n g i n t h e
urban a r e a between t h e zon ing p l a n w i t h i n t h e s c o p e o f t h e P h y s i c a l
P l a n n i n g A c t and t h e f u n c t i o n a l a s s ignmen t o f t h e s u r f a c e w a t e r w i t h i n
t h e scope o f t h e P o l l u t i o n o f S u r f a c e Water Act . The re a r e no l e g a l Co-
o r d i n a t i n g commi t t ees . The Repor t on Water Management, which is now
under d i s c u s s i o n i n t h e Lower House, a l s o e s t a b l i s h e s t h i s sho r t coming .
On lyan e a r l y c o - o p e r a t i o n between t h e q u a l i t y manager and t h e munici -
p a l i t y , s i m i l a r t o t h e one on w a t e r q u a n t i t y management, can p r o v i d e a

c l e a r t u n i n g , t h e more s o a s t h e u rban w a t e r s c l e a r l y a f f e c t t h e s u r f a c e
w a t e r s i n t h e r u r a l a r e a . Kroes and P i e t e r s e have o u t l i n e d t h e f u n c t i o n s
o f t h e urban w a t e r s . I n t h e d r a f t r e p o r t by working g roup V - subgroup
1 - o f t h e CUWVO ( Implemen ta t ion Committee P o l l u t i o n o f S u r f a c e Water
A c t ) " E c o l o g i c a l q u a l i t y o b j e c t i v e s f o r t h e N e t h e r l a n d s s u r f a c e w a t e r s "
some e x t e n s i v e p a r t i c u l a r s can be r e a d on t h e f u n c t i o n s o f urban w a t e r s .
It i s c l e a r , and eve ryone working i n p r a c t i c e w i l l know, t h a t c o n s i d e -
r i n g t h e v e r y f u n c t i o n s o f urban w a t e r s , one s h o u l d n o t n o u r i s h g r e a t
e x p e c t a t i o n o f t h e q u a l i t y o f t h o s e w a t e r s . I n t h i s c o n n e c t i o n i t s h o u l d
a l s o be o b s e r v e d , t h a t i n l a r g e p a r t s o f t h e N e t h e r l a n d s t h e w a t e r
management i n t h e b u i l t - u p a r e a s t a k e s p l a c e a round and i n a sys t em o f
c a n a l s , d i t c h e s and l a k e s which i n some c a s e s may be d r y f o r a p a r t o f
t h e y e a r . Then w a t e r q u a l i t y management assumes a p a r t i c u l a r
s i g n i f i c a n c e !
Now i n which way d o e s t h e water-board t r y t o i n t e g r a t e t h e wa te r q u a l i t y
management i n t h e u rban a r e a s i n t o t h e o v e r a l l w a t e r q u a l i t y management
i n i ts j u r i s d i c t i o n ?
C o n s i d e r i n g t h e l a r g e d i f f e r e n c e s i n a r e a 1 s i z e o f t h e wa te r -boa rds and
a l s o c o n s i d e r i n g t h e d i f f e r e n c e s w i t h i n a g iven a r e a , o n l y a g e n e r a l
approach can be f o r m u l a t e d . F u r t h e r m o r e , o n l y t h e i n f l u e n c e o f combined
sewer sys t ems on t h e q u a l i t y o f t h e u rban w a t e r s is c o n s i d e r e d . The
most i m p o r t a n t key o f water-board i n managing t h e u rban w a t e r q u a l i t y is
t h e d r a i n i n g l i c e n c e based on t h e P o l l u t i o n o f S u r f a c e Water Act .
F l u s h i n g and r i n s i n g a r e among t h e e s s e n t i a l t o o l s o f qua l i tymanagemen t .
The d r a i n i n g l i c e n c e i s known t o eve ryone . I n p a r t i c u l a r j t i s r e q u i r e d
where a combined sewer sys t em h a s been i n s t a l l e d and o v e r f l o w s a r e un-
a v o i d a b l e . T h e r e f o r e , t h e wa te r -boa rds c a r e i n t e n s i v e l y i n v o l v e d i n t h e
m u n i c i p a l sewerage p l a n s . I n d e e d , t h e e f f e c t s o f t h e u n a v o i d a b l e o v e r -
f l o w shou ld be r e s t r i c t e d a s much a s p o s s i b l e and n o t e v e r y o u t f a l l on
t h e s u r f a c e w a t e r i s a c c e p t a b l e . N e v e r t h e l e s s t h e n e g a t i v e e f f e c t s o f an
o v e r f l o w canno t a lways be p r e v e n t e d .
Then sometimes l i t t l e r ema ins o f t h e w a t e r q u a l i t y d e s i r e d f o r u rban
w a t e r s a s d e s c r i b e d i n t h e CUWVO ( Implemen ta t ion Committee P o l l u t i o n o f
S u r f a c e Water A c t ) : t h e c i t y pond s t i n k s and even i f t h e r e were f i s h i n
i t , it would d i e ; t h e o v e r f l o w d i t c h d o e s n o t e x a c t l y p r e s e n t a n
e s t h e t i c appea rance .
Exper i ence h a s t a u g h t t h a t a g r e a t number o f c a s e s t h e poor q u a l i t y o f

t h e u rban w a t e r s c o u l d have been p r e v e n t e d i f a z o n i n g p l a n had been s e t
up i n which b o t h p h y s i c a l p l a n n i n g and w a t e r management had been i n t e -
g r a t e d .
C u r r e n t p r a c t i c e is t h a t i n many c a s e s a f t e r a r a i n y p e r i o d t h e q u a l i t y
o f urban w a t e r s is bad. I n p a r t s o f t h e N e t h e r l a n d s t h i s problem can be
a l l e v i a t e d by means o f f l u s h i n g o f t h e w a t e r c o u r s e s .
I n many c a s e s , however , o n l y a d e c r e a s e i n t h e e m i s s i o n o f p o l l u t a n t s o f
an o v e r f l o w may l e a d t o improvement o f t h e w a t e r q u a l i t y , i n town and
a l s o i n r u r a l a r e a s , b u t one s h o u l d n o t e x p e c t wonders from it.
I n t h i s r e s p e c t Mrs Hoogendoorn i n d i c a t e d some p o s s i b i l i t i e s i n h e r
l e c t u r e . T h i s is one o f t h e most i m p o r t a n t f i e l d s o f r e s e a r c h o f t h e
N e t h e r l a n d s Resea rch Committee on Sewerage and Water Q u a l i t y .
2.1 Water q u a l i t y management
Now what is t h e p o s i t i o n o f t h e w a t e r q u a l i t y manager i n managing t h e
urban w a t e r s ? It is t h e t a s k o f t h e water-board t o s e e t o i t t h a t t h e
o b j e c t f o r which t h e s u r f a c e w a t e r i s i n t e n d e d , w i t h t h e p e r t i n e n t
s t a n d a r d s , i s r e a l i z e d a l s o i n town. I n t h i s r e s p e c t t h e water-board may
conduc t e i t h e r a p a s s i v e o r a n a c t i v e management.
I n c a s e o f a p a s s i v e management one r e s t r i c t s o n e s e l f e i t h e r t o making
c o n d i t i o n s o r t o supp lemen ta ry c o n d i t i o n s t o t h e d r a i n i n g l i c e n c e . T h i s
means i n c a s e o f new u rban e x p a n s i o n s t h a t l o c a t i o n and e x t e n t o f t h e
o v e r f l o w must be weighed a g a i n s t t h e r e c e i v i n g c a p a c i t y o f t h e s u r f a c e
w a t e r . Then f i r s t and fo remos t t h e r e must be a we l l -des igned sewer
sys t em, i n g e n e r a l h a v i n g a 7 mm s t a n d a r d s t o r a g e c a p a c i t y and 0.7 mm/h
pump c a p a c i t y . A s t h e s e u n i t s a r e r e a s o n a b l y w e l l c o n t r q l l a b l e and I
p r e f e r t h e s e t o t h e c r i t e r i o n o f t h e o v e r f l o w f r e q u e n c y which c a n n e v e r
be w e l l c o n t r o l l e d .
Demands t h a t g o beyond t h e above might be s e t t o new sewer sys t ems - f o r
i n s t a n c e s p e c i f i c o v e r f l o w s t r u c t u r e s - i f t h e water-board can unambi-
g u o u s l y show t h a t t h i s is n e c e s s a r y f rom t h e v i e w p o i n t o f p r o p e r w a t e r
q u a l i t y management. It can be j u s t i f i e d t h a t t h e l i c e n s e e t h e n a l s o s e e s
t o t h e expenses .
It becomes more p r o b l e m a t i c i f two d i f f e r e n t a p p l i c a n t s f o r a l i c e n c e
w i l l make u s e o f t h e same s u r f a c e w a t e r , i n which s i t u a t i o n it can be
j u s t i f i e d t h a t one d i r e c t o v e r f l o w d i s c h a r g e is a c c e p t a b l e , p r o v i d e d

t h a t a t t h e o t h e r o v e r f l o w p r o v i s i o n s a r e made. Whc t h e n h a s t o c a r r y
t h e c a n ? Probab ly bo th ! For s h o r t l y t h e o v e r f l o w p r o v i s i o n becomes
s t a n d a r d c o n d i t i o n i n t h e l i c e n c e , " f o r s a f e t y ' s sake" .
I n e x i s t i n g s i t u a t i o n s t h e a d a p t a t i o n o f t h e c o n d i t i o n s f o r t h e l i c e n c e
is a l e g a l p o s s i b i l i t y . I n most c a s e s i n t r o d u c t i o n o f supp lementa ry p ro -
v i s i o n s proved t o be u n f e a s i b l e because o f f i n a n c i a l c o n s t r a i n t s . There-
f o r e , it is recommendable, t h a t t h e water-boards p l a y a more a c t i v e r o l e
i n combat ing n e g a t i v e e f f e c t s o f o v e r f l o w on s u r f a c e wa te r . Know-how
and f i n a n c i a l o p p o r t u n i t i e s have a l s o been t h e r e a s o n s t o t h e implemen-
t a t i o n o f t e c h n i c a l p u r i f i c a t i o n works t o t h e water-boards . I n t h a t c a s e
t h e w a t e r q u a l i t y management p l a n w i l l s e r v e a s a f o u n d a t i o n .
I n t h i s way t h e p r a c t i c a l implementa t ion o f t h e management w i l l r un
p a r a l l e l t o t h e above-mentioned w a t e r q u a n t i t y management o f t h e wa te r -
board i n town. For t h e wa te r q u a l i t y managers t o be c a p a b l e o f develop-
i n g any a c t i o n i n r e s p e c t o f t h e above, t h e c e n t r a l government w i l l have
t o e x t e n d t h e h e l p i n g hand t o them. The h i g h n e s s o f t h e c u r r e n t l e v i e s ,
which a l r e a d y n e c e s s i t a t e s a t e m p o r i z a t i o n h e r e and t h e r e i n r e a l i z i n g
t h e pr imary p u r i f i c a t i o n works, d o e s n o t a l l o w a l s o a d d i t i o n a l sewerage
p r o v i s i o n s t o be c a r r i e d o u t s h o r t l y . Th i s i s even l e s s p o s s i b l e i n t h e
munic ipa l s p h e r e .
Consequent ly , M r Kroes ' s u g g e s t i o n t o a s s i g n t o t h e m u n i c i p a l i t i e s a n
independen t t a s k i n t h e q u a l i t y management - i n t h e s e n s e o f t h e P o l l u -
t i o n o f S u r f a c e Water Act - o f t h e urban w a t e r s s y s t e m , i s n o t c o n s i d e r e d
t o make much s e n s e .
If t h e M i n i s t r y who is r e p r e s e n t e d by M r Kroes would g i v e a f i n a n c i a l
i n j e c t i o n t o t h e wa te r q u a l i t y managers , as h a s been done t o t h e munici -
p a l i t i e s i n c o n n e c t i o n w i t h t h e a r rangement f o r e x p e n s i v e sewerage
works, one may be convinced t h a t p a r t i c u l a r l y good r e s u l t s w i l l be ob-
t a i n e d i n improving t h e a q u a t i c u rban environment . A c t u a l l y , such a
f i n a n c i a l a r rangement would have t o be a l o g i c a l s e q u a l t o t h e enormous
f i n a n c i a l c o n t r i b u t i o n from t h e M i n i s t r y o f Housing, P h y s i c a l P lann ing
and Environmental P r o t e c t i o n t o t h e r e s e a r c h programme o f t h e Nether-
l a n d s Na t iona l Resea rch Commitee on Sewerage and Water Q u a l i t y .
A s t o t h i s view t h e i s s u e is n o t who on fo rmal P o l l u t i o n o f S u r f a c e
Water Act g rounds w i l l have " t o c a r r y t h e can1' o f t h e s a i d over f low, b u t
i n which way an e f f i c i e n t approach can be ach ieved o f t h e wa te r p o l l u -
t i o n by a n o v e r f l o w ; f o r t h a t m a t t e r t h i s o v e r f l o w be longs t o a we l l -

dimensioned sewer sys tem.
I n t h e s e n s e o f t h e g u i d e l i n e f o r t h e q u a n t i t y management a g u i d e l i n e
might a l s o be drawn up f o r t h e management q u a l i t y . Then i n t h e d i f f u s e
b o r d e r a r e a between sewerage and s u r f a c e wa te r q u a l i t y t h e s e g r e g a t i o n ,
o r i n o t h e r words , t h e w a s t i n g o f money, c o u l d be p r e v e n t e d .
F i n a l l y , an example o f t h e i n f l u e n c e o f z o n i n g p l a n s on t h e w a t e r
q u a l i t y w i l l be g i v e n .
2 .2 An example o f t h e water-board D e Aa
The q u a l i t a t i v e a s p e c t was a l s o i n v e s t i g a t e d i n t h e above-mentioned
zon ing p l a n s i n which d r a i n a g e t o t h e Aa was f o r e s e e n .
I HELMOND
F i g u r e 4 Proceeds o f BOD and 0 a f t e r an e m i s s i o n o f p o l l u t a n t s 2

I n t h i s i n v e s t i g a t i o n o n l y t h e p a r a m e t e r s o f B iochemica l Oxygen Demand
and Oxygen were i n v o l v e d . I n F i g u r e 4 b o t h p a r a m e t e r s a r e g i v e n i n
r e l a t i o n t o e i t h e r t ime o r downstream d i s t a n c e . It c o n c e r n s t h e r e s u l -
t i n g p o l l u t i o n bung produced a t t h e las t ove r f low. It can be d e r i v e d
from t h e F i g u r e how t h e p o l l u t i o n bung, w h i l e t r a v e l l i n g downstream,
d e c r e a s e s i n c o n c e n t r a t i o n .
The re is someth ing p e c u l i a r w i t h t h e oxygen c o n t e n t . A t t h e moment t h a t
t h i s oxygen c o n t e n t r e a c h e s a c r i t i c a l v a l u e , t h e a e r a t i n g e f f e c t o f
t h e w e i r s p r e s e n t a g a i n p r o v i d e s a s u b s t a n t i a l oxygen s u p p l y . Conse-
q u e n t l y , t h e oxygen c o n t e n t nowhere f a l l s below 2 mg/ l d u r i n g t h e p a s s i n g
o f t h e p o l l u t i o n bung, which was c o n s i d e r e d a c c e p t a b l e f o r s h o r t p e r i o d s .
T h e r e f o r e , on a c c o u n t o f t h e s e c a l c u l a t i o n s it is c o n s i d e r e d j u s t i f i e d
t o l e a v e o u t supp lemen ta ry measures f o r t h e r e d u c t i o n o f t h e e m i s s i o n o f
p o l l u t i o n s .
The more s o a s t h e s i t u a t i o n i n r e s p e c t o f t h e d i v e r s i o n o f t h e Zuid-
Wi l l emsvaa r t w i l l be e n t i r e l y d i f f e r e n t a f t e r 10 y e a r s . Based on t h e a -
bove, t h e water-board cou ld a f t e r a l l a g r e e w i t h t h e zon ing p l a n s . A
f a v o u r a b l e t h i n g was t h a t i n t h i s c a s e t h e problem o f c o s t a l l o c a t i o n
d i t n o t a r i s e .
3 RECOMMENDATION
I n s o f a r t h i s h a s n o t been done y e t , w a t e r b o a r d s and m u n i c i p a l i t i e s
ough t t o make a p p r o a c h e s towards e a c h o t h e r i n an e a r l y s t a g e upon
r e a l i z a t i o n o f t h e p l a n s . Only i n t h i s way p l a n s can be a c h i e v e d t h a t
a r e a c c e p t a b l e f o r s o c i e t y a t a c c e p t a b l e c o s t s . I n d o i n g s o , t h e t a s k o f
t h e water-board h a s t o begin where t h e w a t e r r e a c h e s t h e s u r f a c e f rom
t h e b u i l t - u p a r e a . F i n a n c i a l s u p p o r t f o r s u c h a p o l i c y from t h e p u b l i c
means is n e c e s s a r y .
By means o f a number o f t e s t s t h e e f f e c t i v i t y c o u l d b e t e s t e d o f a n
u rban wa te r q u a l i t y programme t o be implemented by t h e water-boards .


GROUNDWATER MANAGEMENT: GOAL, REQUIREMENTS AND METHODS
A . J . Hebbink
ABSTRACT
In the Netherlands the new residential areas mostly are concentrated in
areas where the groundwater levels are too high. But not only in the new
housing estates, also in the old residential quarters inconvenience may
be experienced from shallow groundwater. To prevent disadvantages of
high groundwater levels, a good groundwater management is necessary. In
this article a description is given of the urban hydrological system.
Secondly the drainage criteria are mentioned which are necessary to
control the groundwater level. A brief impression is given of some
measures which can be taken to lower the groundwater level. More
detailed attention is paid to one of the possible measures, namely
subsurface drainage. Different types of subsurface drainage systems are
applied. Each system is described with its advantages and disadvantages.
The experiences with subsurface drainage, applied in Lelystad and
Almere, are indicated.
1 INTRODUCTION
There are statutory regulations stating who is to control the open water.
But there are no regulations stating who is to control the groundwater.
In the case of groundwater the well-known saying seems to hold: "What
the eye does not see the hart does not grieve over".
Yet the groundwater management is very important. To prevent incon-
venience of high groundwater levels, a good groundwater management is

necessary. During building activities a high groundwater level can cause
some problems. For example by a bad load-bearing capacity of the buil-
ding site. Besides inconvenience can be found in installing cables and
conduit pipes. After the building activities a high groundwater level
can be disadvantageous to buildings and houses. Just imagine damage to
walls, carpets, parquet floors and gas-pipes. Also the road-construction
can be damaged by a high groundwater level. Finally the height of the
groundwater level influences the growing possibilities of plants and
trees.
It is also possible that there are some problems with groundwater levels,
which are too low. For example, this can result in whithering and dying
of plants and trees or in damaging of the foundation (rotten wooden
piles). However, no attention is paid to problems with low groundwater
levels.
In this article first an impression will be given of the urban hydrolo-
gical system. Of great importance are the requirements which the ground-
water management in urban areas has to meet. In brief attention is paid
to some measures which can be taken to lower the groundwater level. More
detailed an impression is given of one of the possible measures, namely
subsurface drainage. A description will be given of drainage materials,
subsurface drainage systems, design criteria, installation and mainte-
nance of subsurface drainage. Finally some problems are mentioned which
can occur at the application of subsurface drainage.
2 URBAN HYDROLOGICAL SYSTEM
In general the precipitation which falls on an unpaved area, infiltrates
into the ground. In dry circumstances the infiltration capacity of a
sandy soil varies from 40-80 mm/hour and of a clay-soil from 30-50 mm/
hour. In wet circumstances the infiltration capacity varies respectively
from 20-50 mm/hour and from 0-10 mm/hour. It appears that under wet cir-
cumstances the infiltration capacity of a clay-soil can be zero.
Partially the infiltrated water can be stored in the ground. But the
2 16

greatest part has to be discharged to open water.
An important part of the precipitation which falls on a paved area,
flows over the paved area to sewers. However, from several researches it
appears that there can be an important infiltration through some paved
areas, such as tiles and bricks. Infiltration capacities are found
varying from 5-15 mm/hour.
The amount of water which has to be discharged, is fixed by the surplus
of precipitation. To design a drainage system especially the surplus of
precipitation during the winter period (October to March) is important.
From measurements of the station Lelystad-Haven it appeared that once in
the 10 years, the surplus of precipitation during the winter period can
be more than 400 mm. This means that on an average about 2 to 2.5 mm/day
have to be discharged.
Established in 1968 an ungoing urban hydrological research project is
being conducted in Lelystad at several catchments. One of these catch-
ments has a surface of 2 ha and 44% of the surface is paved. From this
research project it appeared that about 40-50% of the annual precipita-
tion is discharged by subsurface drains and only 20-25% in storm water
sewers.
3 SOME ELEMENTS OF MAKING THE AREA SUITABLE FOR BUILDING
Every year many areas are withdrawed from their original destination in
behalf of house-building. Till the year 2000 still about 1 million
houses will be built. When we assume a density of 30-40 houses per ha at
least 25.000 ha will be zoned for building houses.
Before building operations, first the area has to be made suitable for
it. This can enclose the following elements: choice of the street level,
raising the building site with sand, prognosis of the subsidence, and
the installation of drainage and sewerage systems. In the next pages
attention is paid to the drainage systems. First the drainage criteria
are mentioned which a properly drained area has to meet.

4 DRAINAGE CRITERIA
The drainage criterion is defined by the distance between the soil sur-
face and the highest admissible groundwater level.
On a building site it must be possible to use the appropriate transport
vehicles and to store building materials, all this without excessive
inconvenience from groundwater. In general the excavations have a depth
of 0.5 m below the soil surface. It is taken as criterion that the
groundwater level has to be lower than 0.2 m below the bottom of the ex-
cavation. So the drainage criterion for the building of houses is 0.7 m
below the soil surface.
The cables and conduit pipes have to be installed or repaired without
inconvenience from groundwater. In table 1 the minimum depth of several
cables and conduit pipes is given. From this table it appears that the
drainage criterion is about 0.6 to 1.0 m below the soil surface.
Table 1. Minimum depths of several cables and conduit pipes in m (NEN
1739)
low tension cable ((10 kV)
high tension cable (> l0 kV)
telephone cable
gas pipe
conduit pipe
sewer
town-heating
Also the construction of roads may not experience inconvenience from
groundwater. For arterial roads the drainage criterion is 1.0 m below
the soil surface. When the rush of traffic is less or it concerns small
roads, a drainage criterion of 0.6 m below the soil surface is
sufficient. In the case of (pub1ic)gardens it is not possible to give
prevalent criteria because just variation in the drained situation is
one of the possibilities to get a varying natural environment. In
general the groundwater level may not rise higher than 0.4 to 0.5 m
below the soil surface.

5 METHODS TO CONTROL THE GROUNDWATER LEVEL
To meet the drainage criteria mentioned before, in urban areas the
following methods are possible:
- lowering the groundwater level by the installation of a drainage sys- tem (canals, ditches, subsurface drainage);
- raising the area with a layer of sand; - lowering the groundwater level by lowering the open water level;
- a combination of these methods.
The mentioned methods will have different effects on the groundwater
level. Where the area is raised with sand, there may well be settlement
owing to the groundwater being pressed out of the semi-permeable layers.
A lowering of the groundwater level in areas with seepage, may well
result in an increase of seepage. In areas with infiltration, the infil-
tration will decrease and may well change to seepage.
Owing to the vulnerable geohydrological situation, a lowering of the
groundwater level will lead to a fall in the groundwater levels in the
surrounding area. Since in these areas, changes in the geohydrological
system can have far-reaching consequences, especially for the vegetation,
falls in groundwater levels are as a rule unacceptable.
In the next pages more detailed attention is paid to the subsurface
drainage.
6 SUBSURFACE DRAINAGE
At present subsurface drainage systems mainly consist of corrugated
plastic drain pipes. To prevent inflow of soil particles and to improve
the entrance resistance envelope materials are used. In the case of
homogeneous clay and heavy loamy soils there is no risk of soil
particles being washed into the drain pipes. For this reason pipes can
be laid without covering or envelope material. In the case of light
loamy and sandy soils, however, there is a risk of silting up and the
pipes are covered by or enveloped with a filter material. In order to
avoid disappointing results first of all the materials are tested in the

laboratory or/and in the field. The research is primarily concerned with
the entrance resistance of the materials, as well as with filtering
operation and durability. In recent years coconut fibre and polypropy-
lene fibre envelopes are mainly used. A good deal of silting up with
sand, when using coconut fibre envelopes, tended to occur in fine sandy
soils. Besides coconut fibre can decay fairly quickly in certain circum-
stances. When using polypropylene fibre envelopes there is no silting up
in fine sand and the material is unlikely to decay. On the other hand,
polypropylene fibre is more expensive than coconut fibre.
In special cases gravel is used as cover material.
The main functions of the subsurface drainage systems are:
- acceleration of soil subsidence; - control of the groundwater level during building activities;
- improvement of the load-bearing capacity of the building site;
- control of the groundwater level after the building activities have been completed.
6.1 Subsurface drainage systems
First of all a distinction can be made in horizontal and vertical
drainage systems. At vertical drainage the groundwater is discharged by
way of sand or gravel piles to deeper lying well permeable sand layers.
At horizontal drainage we can distinguish the following systems: single
drainage system, composite drainage system, crosswise drainage system,
block drainage system and road body drainage system.
6. I. .l The s i n g l e drainage sys tem
The single drainage system consists of drains laid parallel to each
other, at distances which are dependent on the permeability of the
ground. The drains discharge their water directly into ditches or
canals. The single drainage system is temporarely used before and during
building activities. This system is also used for sport fields and
recreational areas. In figure 1 the principle of the single drainage

system is given.
l2iTIz m canal - drain
Figure 1 The single drainage system
The installation and maintenance of the single drainage system is very
cheap. The disadvantage is that this system is easy to disturb by sewers,
conduit pipes and pile driving.
6.1.2 The composite drainage system
In the urban areas there are mostly too few ditches and canals or too
many obstacles to suffice to lay only a single drainage system. In that
case a composite drainage system can be applied, by which the drains are
connected to main-drains. The drains discharge their water into sewers
or canals by way of the main-drains. The drains can be maintained from
canals, cleaning entrances or junction boxes. The theoretical set up of
the composite drainage system is shown in figure 2.

-T7'r -T;T;T canal -- - drain
main drain
-z- junction box . cleaning entrance
Figure 2 The composite drainage system
The installation of the composite drainage system is relatively cheap.
A disadvantage of this system is, that by damage of a maindrain the
system is easily disturbed and consequently the drainage of a relative
great area functions not sufficiently. Besides, when the distance
between the canals becomes greater, the composite drainage system
becomes more complicated and more vulnerable.
6 . 1 . 3 The crosswise drainage system
To avoid disruptions ofdrains as much as possible a crosswise drainage
system can be applied. Two single drainage systems are laid perpendicul-
arly to each other. The upper system is laid abo~t 0.15 m above the
lower system with a view to avoid disruption of the lower system by the
installation of the upper system. As it is very important that water can
flow from one system to the other, the drains have to be covered with
proper cover material, for example gravel. In principle the drains only
can be maintained from ditches or canals. The dimensions of the crosswise

drainage system, as installed in Almere-Stad, are shown in figure 3
ground surface
situation cross section
Figure 3 The crosswise drainage system
Should disruptions occur the crosswise drainage system keeps a possibi-
lity to discharge the water by way of the intersections. A disadvantage
of this system is that the installation is relatively expensive, as a
consequence of the usage of gravel as cover material.
6.1.4 The bzock drainage system
In view of the fact that the building pits have to be dry, drains can be
laid around buildings or houses. The drains mostly are installed
previous to the building activities The drains are laid almost directly
against the front. In behalf of the proper functioning of the block
drainage system, it is very important that there is at least 0.3 m well-
permeable sand under the building or the house and that there is a
connection between the sand in the building pit and the sand in the
drain trench. The drains discharge their water in the sewers or main-
drains and sometimes directly into the open water. The drains are mostly
maintained from cleaning entrances. The principle of block drainage is
shown in figure 4.

L
drain i, !
0
---- - I-- \
cleaning entrance
ground surface - - ';;- - - - - --- - ........... ........... ...,........... . ................
. . . . . . . . . . . . . . . . . , . . . . . . . . . . . . . . . . , , . . . . . . . . . . . . . . . . . . . . . . . . . . . . . . . . . . ............... ......................................... .......... . . .................,. ....,.. ................................... . .... . :::::::::::::::::::\,::::::sand . . . . . . . . . . . . . . . . . . . . . . . . . . . . . . . . . . . . . . . . . . . . . . . . . . . . . . . . . . . . . . . . . . . . . . . . . . . . . . . . . . . . . . . .
........................ ............................................ .. ......................... ........................................... .. -- - -p---
'drain
Figure 4 The block drainage system
Instead of laying drains around buildings or houses, it is also possible
to lay the drains under the building or the house. In this case the
drains are installed after the excavation and pile-driving. The drains
are connected to the storm discharge. The block drainage is a more or
less reliable drainage system. The drains can hardly be disturbed. On
the other hand, the installation of block drainage is expensive.
6.1.5 The road body drainage s y s t e m
When the soils have not a sufficient load-bearing capacity, the road can
be constructed on a sandfill of 1 to 1.5 m dependent on the soil type
and the admissible traffic load. If the bottom of the road body exists
of badly permeable ground a subsurface drainage system is necessary to
control the groundwater level and to improve the load-bearing capacity.
The drains mostly are installed in a little trench at both sides of the
road. At mutual distances of about 200 m uncorrugated drains are laid
perpendiculary out of the road body drains to ditches or canals. The
drains are maintained from cleaning entrances or directly from the open
water. The principle of the road body drainage system is given in figure
5.

road coatina
Figure 5 The road body drainage system
6.2 Design of a subsurface drainage system
To meet the earlier mentioned drainage criteria, some design criteria
have been developed on account of the subsurface drainage systems. The
design criterion is a relationship between the groundwater level and the
drain discharge. It means that with a certain amount of drain discharge,
the groundwater level may not rise above a certain level. The design
criteria are based on a frequency once a year. In table 2 the design
criteria are given for several destinations in an urban area.
Table 2 Design criteria
Destination Groundwater level in m Drain discharge
below soil surface in mm/day
Building site 0.60 10
Residential areas 0.70 5
Sport fields etc. 0.50 15
Recreational and green areas 0.50 7
Cemeteries 0.35" 10
*(in m below the bottom of the coffin)
To meet these criteria the drains must have a certain distance between
each other. To calculate the spacing of drains several formulas have
been developed. In practise mostly the Hooghoudt's formula is used:

Q = drain discharge in m3/sec
C = spacing in m
kl = hydraulic conductivity under drain level in m/sec
k2 = hydraulic conductivity above drain level in m/sec
d = thickness of equivalent layer in m
h = difference between drain level and highest admissible groundwater
level in m
6.3 Depth of the subsurface drains
In practice there is a great variety in drain depths. A mostly made
distinction is: shallow subsurface drainage (till 1.5 m below soil sur-
face) and deep subsurface drainage (deeper than 1.5 m).
Owing to the building activities (excavations, pile driving, installa-
tion of sewers and conduit pipes) a previously laid subsurface drainage
system will be disturbed more or less. As the drains are laying deeper,
there is less change that the drains are disturbed. On the other hand
the repair cf these drains is more expensive.
Practically mostly the drainage criteria and the maximum depth of the
drain are given, for instance the wish to discharge the drains above the
open water level. Inside this range several drain depths are possible.
Which drain depth you have to choose is hard to say. It depends on
various factors:
- Drainage machines. At present the drainage machines are capable to in- stall the drains at great depths. In general this need not be a re-
strictive factor.
- Sewerage. When the drains discharge their water into the sewerage sys-
tem, the depth of the sewers is determinant for the depth of the
drains. On the other hand, if the drains may not be disturbed by the
sewerage system the drains have to be laid at great depths; in general
more than 2 m below soil surface.
- Upper limit. In connection with the frost-limit a ground cover of at least 0.6 m is necessary.
- Cables and conduit pipes. To avoid disruptions of cables and conduit-
pipes the drains have to be installed deeper than 1.2 to 1.4 m below

soil surface
6.4 The installation of the subsurface drains
When there are no obstacles the drains generally are installed with a
drainage machine. At present these machines can install the drains to
depths of 2 to 4 m below soil surface. The drain depth is usually
regulated by a laser plane. When the drains are laid under wet circum-
stances, it could happen that the draintrenches are filled with badly
permeable material or that there is a great variation in the drain depth.
Both are disadvantageous for a well-functioning of the drainage system.
In urban areas much additional drainage has to be laid (collector-drains,
main-drains, block drainage). Since at the moment that the additional
drainage is laid other activities are often taking place, the drains
have to be laid with a hydraulic crane. It is self-evident that this
way of installation is much more expensive than having the drains laid
with a drainage machine.
6.5 Control and maintenance of the subsurface drains
To find defects in the drainage system it is necessary to control the
drains directly after installation. An indication of the functioning of
the drainage system can be obtained by measuring the groundwater level
at several places. When the groundwater level is high during long
periods the drainage system does not function very well. The drains have
to be cleaned. At present drains can be cleaned up to 200 to 300 m from
the outlet. When the drains are longer, cleaning entrances have to be
installed (figure 6). In main-drains of collector-drains junction boxes
are placed to have the possibility to clean these drains. From a clean-
ing entrance or a junction box the drains can be cleaned over a distance
of 100 to 150 m.

protection cover J ground surface
+.. uncorrugated drain
corrugated drain /
P///
Figure 7 A cleaning entrance
Maintenance of the drains is mostly carried out with special "flushing
machines". Water is pumped into the drain through a reinforced hose with
a special nozzle, which then passes the entire drain. The operation can
be done under high,middle or low pressure. Experience has shown that low
pressure flushing ( C 2 5 atmosphere) and middle pressure flushing (+ 35
atmosphere) are usually preferred to high pressure flushing (>80 atmos-
phere).
The frequency at which maintenance of the drains has to be done is depen-
dent on the measure of pollution, but also on the use of the drained
area. The deposition of iron in and directly around the drains results
in a poor functioning of the drainage system. So regular maitenance is
necessary. In areas with little or even no iron at all a maintenance of
the drains once in the 5 to 10 years is sufficient. The drains of sport
fields and cemeteries generally are cleaned every year, because the
repair of these drains is very expensive and sometimes not possible at
all.
6.6 Problems with subsurface drainage
The installation of a subsurface drainage system is a more or less ex-
pensive affair. So a drainage system is carefully prepared and installed.

And we may expect that the system functions well. Nevertheless there
could be already made some mistakes at the installation. Besides some
disruptions could occur sooner or later after installation.
Defects which can occur during the installation of the drainage system
are :
- The drains are not connected to each other. It is possible that wrong connection-pieces have been used.
- Broken drains. The drains can already be broken at the moment that
they are laid in the ground. It is also possible that the drainage
machine shoves away and disturbes the drain.
- The drains are not laid level. When the drains are not installed level
or straight, the reinforced hose cannot enter the drains sufficiently
resulting in only a part of the drainage system being maintained.
Defects which can occur sooner or later after installation are:
- Silting up with soil particles. The danger of silting up with soil
particles is the greatest directly after installation of the drains,
when the surrounding of the drain has an instable structure. A good
deal of silting up with sand occurs in fine-sandy soils.
- Clogging by iron. The deposition of iron takes place in the drain-
trenches, the envelope or cover materials or the drains, especially at
the outlets. This results in an increase of the entrance resistance
and so the drains do not function sufficiently.
- Growth of roots in the drains. The materials in the draintrench often
has a good structure for the growing of roots. When the roots reach
the drain they will clog the drain and the drain will not function
sufficiently any more and sooner or later there will be no discharge
at all.
- Broken drains at the outlet. This problem arises when mowing the slope of canals and ditches. The drains are disturbed and the drain dis-
charge decreases or even ends.
- Disturbance by building activities. In many cases the drains are dis- turbed by pile driving, the construction of sewers or the installation
of cables and conduit pipes.

7 CONCLUSIONS
- When t h e d r a i n s a r e l y i n g deeper t h e c o s t s o f i n s t a l l a t i o n and r e p a i r
a r e i n c r e a s i n g .
- To prevent d i s r u p t i o n by c a b l e s and coundui t p i p e s t h e d r a i n s have t o
be l a i d deeper t h a n 1 .2 t o 1 .4 m below t h e s o i l s u r f a c e .
- To g e t an optimum f u n c t i o n i n g o f t h e d r a i n s , t h e d r a i n t r e n c h e s have t o
b e f i l l e d wi th well-permeable m a t e r i a l , f o r i n s t a n c e sand.
- When t h e c a n a l s o r d i t c h e s a r e n o t widely spaced and consequently t h e
sewers a r e n o t l y i n g a t g r e a t d e p t h s it is p o s s i b l e t o l a y on ly a
c rosswise d r a i n a g e system. P r a c t i c a l l y t h i s system can on ly be d i s -
tu rbed by p i l e d r i v i n g . I n view o f t h e g r e a t e r p o s s i b i l i t i e s o f d i s -
charge by way o f i n t e r s e c t i o n s , t h e c rosswise d r a i n a g e system h a s a
good change t o s u r v i v e . I t is necessary t h a t t h e space between t h e
upper and t h e lower system is f i l l e d up wi th g r a v e l .
- To keep a wel l - func t ion ing d r a i n a g e system r e g u l a r maintenance o f t h e
d r a i n s is n e c e s s a r y . I n o t h e r words t h e dra inage system must have
c a p a b i l i t y f o r be ing maintained.
- U n t i l now t h e r e is made no al lowance f o r j u r i d i c a l a s p e c t s wi th r e g a r d
t o t h e s u b s u r f a c e dra inage . A p o s s i b i l i t y t o make al lowance f o r t h e s e
a s p e c t s is t o d r a i n p u b l i c a r e a s as f a r a s p o s s i b l e independent on
p r i v a t e a r e a s . i
REFERENCES
DAM, C.H. VAN AND J . SCHOTKAMP. I n f i l t r a t i e i n b e s t r a t i n g e n . R.1J.P.-
r e p o r t 1983-Abw; I Jsse lmeerpolders Development Author i ty , Le lys tad .
DIJK, W. V A N , H . HENGEVELD AND A . OVERWATER. Onderzoek naar de w i j z e
van bouwrijp maken i n twaa l f p l a a t s e n i n Nederland. F levober ich t
no 135; I J sse lmeerpolders Development Author i ty , Lelystad 1978.
HEBBINK, A . J . , a .0 . isvaluat ie d r a i n a g e i n Le lys taa en Almere. Flevobe-
r i c h t no 240; I J sse lmeerpolders Development Author i ty , Lelystad . HEBBINK, A.J. AND H. DE ROOS. Drainage van s t e d e l i j k e en r e c r e a t i e v e
gebieden i n d e Flevopolders . R.1J.P.-report 1984-34abw;
I j s s e l m e e r p o l d e r s Development Author i ty , Le lys tad .

KREMER, R . H . J . and E. SCHULTZ. 1978. Urban g roundwate r : Usage
impediments and a d m i n i s t r a t i o n . P roceed ings and i n f o r m a t i o n
no 2 4 . Committee f o r H y d r o l o g i c a l Research TNO, The Hague.
SCHOLTEN, J . and G.A. VEN. Drainage m a t e r i a l * oul .vey I n t h e I j s s e l -
m e e r p o l d e r s . R.1J .P . - repor t , 1984-28abw; I J s s e l m e e r p o l d e r s
Development A u t h o r i t y , L e l y s t a d .
SEGEREN, W.A. AND H . HENGEVELD. Bouwri jp maken van t e r r e i n e n .
S t i c h t i n g Bouwresearch 99; The Hague 1984.
VOORTMAN, B.R. De m a a n d e l i j k s e w a t e r b a l a n s van e e n woonwijk e n een
p a r k e e r t e r r e i n i n L e l y s t a d . R.1J .P-repor t 1984-35abw; I J s s e l m e e r -
p o l d e r s Development A u t h o r i t y , L e l y s t a d . WERKGROEP BOUWRIJP MAKEN. Bouwri jp maken i n d e F levopo lde r s .R .1J .P . -
r e p o r t , 1981-labwlad; I J s s e l m e e r p o l d e r s Development A u t h o r i t y ,
L e l y s t a d .


MANAGEMENT OF GROUNDWATER; A DAILY JOB IN OUR OLDER CITIES
R.H. J. K r e m e r
ABSTRACT
The lowering of the groundwater table caused by the leakage of sewer
mains may cause damage to existing buildings. In Amsterdam a ground-
water monitoring system has been installed to avert this damage.
The information acquired from this system is also very valuable
pertaining to problems caused by excessive groundwater. In recent years
Amsterdam has been frequently confronted with these problems and a
number of cases have been investigated. The individual solution that
has been applied in each circumstance is dependent upon the particular
source of the problem. From the cases described in this paper, the
conclusion may be drawn that groundwater problems may arise in old city
centres as well as in new districts. Eliminating the crawl space would
mean a better guarantee for dry houses.
1 INTRODUCTION
The management of groundwater is poorly regulated, this in contrast
to the management of surface water. A series of laws, regulations
and by-laws is available, which has been developed by successive
generations. Particularly, the recent Pollution of Surface Waters
Act has to an important degree contributed to the solution of the
problems concerning groundwater in the deeper aquifers in Amsterdam.
In the sixties local industries withdrew about 25 million m3 ground-
water from deep wells at a depth varying from 60 to 100 m.

The lowering of the piezometric level of the third sandlayer (fig.1)
seemed likely to cause damage to building in course of time. In 1983,
even before the enactment of the Groundwater Bill this amount was
reduced to about 7 million m3, which as a result has greatly reduced
the probability of damage.
This paper will discuss the subject of phreatic groundwater. The
Groundwater Actwhich has been in force for more than one year now,
does not deal with this subject. Drainage and dewatering of land has
been excluded from this law, which implies an exclusion of the
management of phreatic groundwater as well. This stems from a lack of
insight in the behaviour of this groundwater as well as a lack of
experience for its management with respect to technology, costs and
quality. However, during the last few years Amsterdam has been so
frequently confronted with problems caused by groundwater, that the
need to investigate the causes and to find solutions became very
pressing.
A study of some of these cases may possibly contribute to a better
understanding of the behaviour of groundwater and eventually even to
the prevention of groundwater problems in the future.
2 THE CHARACTER OF THE SUBSOIL AND THE GROUNDWATER
The Amsterdam subsoil shows a greatly stratified profile in which
water bearing sandlayers and impermeable clay- and peatlayers
alternate. The first, second and third sandlayers are separated from
each other by clayey sand (AllerBd) and clay (Eemien) and were all
deposited during the Pleistocene. The height of the piezometric level
that is found in these confined aquifers is some meters below the
phreatic groundwater table. This is the result of the drainage works
of several low lying polders in the neighbourhood of the city.
However, a rise has been noticed following a considerable decrease of
deep water extraction in the last few years.
Above the sandlayers, lying at a depth of about NAP - 12 m (40 feet), holocene clay- and peatlayers with extensive sandy marine deposits at
places are encountered. From the founding of this city these layers
have been gradually covered with a fill in order to elevate the build-
ing sites to a higher level than that needed for agricultural workand
to an elevation greater than the flood level of the former Zuiderzee.

Figure 1 1. Timber p i l e foundation i n so-called f i r s t sandlayer
Average foundation l eve l NAP - 13 m
Load capacity between 50 and 80 kN
2. Concrete p i l e foundation i n second sandlayer
Foundation l eve l between NAP - 17 m and - 24 m
Load capacity 200 t o 1000 kN
3. Well points t o ex t rac t groundwater from t h i r d sandlayer
(e.g. f o r cooling)
Depths up t o 120 m
4. Stand pipe piezometer f o r regular observation of ground-
water l eve l s
5. Sewage system
6. Underground railway founded d i r e c t l y on f i r s t sandlayer
7. Average c i t y water t a b l e NAP - 0,4 m

The phreatic groundwater regime includes both the holocene layers
and the sand f i l l . On account of t h e i r small permeability the holo-
cene layers a re of l i t t l e importance t o the drainage of groundwater.
Both the composition and the thickness of the sand f i l l show great
var ia t ions .
In a number of d i s t r i c t s man has b u i l t on 4 5 5 m well draining sand
brought i n from the moorlands, but i n many cases peat and clay
or iginat ing from canals and covered with a t h i n sandlayer were used.
Especially i n the l a s t case the groundwater flow i s influenced by the
type and extent of the buildings, because the foundation level
extends i n t o the "mudWlayers. If such i s the case where a number of
apartment blocks enclose a cen t ra l area, a kind of "bathtub" e f f e c t
occurs i n the inner court area. I n a number of a reas only the s t r e e t
l eve l s have been ra ised with f i l l while the gardens have been main-
tained a t the polder level . The water table i n these areas is main-
tained by means of separate polder drainage sewers, which have
replaced the o r ig ina l ditches.
With the preparation of building s i t e s the s t r e e t elevation was
chosen a t a l eve l of about 1,10 m above the surface water l eve l , i n
both the o ld inner c i t y centre and the expansion areas. These average
water levels were considered t o be the standardgroundwaterelevations
i n connection with the construction of timber foundations.
The Amsterdam Building By-Law f ixes the p i l e bu t t l eve l a t 0,20 m
below the standard groundwater l eve l . However, foundation inspections
show t h a t foundation wood i s found of ten a t a higher l e v e l , even
above the surface water table .
An investigation i n t o the va r ia t ions of the groundwater level t h a t
occur i n some of the d i s t r i c t s has shown t h a t r e l a t i v e l y large
seasonal f luctuat ions of 1,O B 1,2 m a re not uncomnon. These
f luctuat ions a r e barely influenced by the surface water of canals.
Safety margins i n the bu t t l eve l s of timber foundations (top of p i l e )
a re therefore small o r nonexistent so t h a t the p o s s i b i l i t y of wetting
and drying of the p i l e head due t o the f luctuat ion i n the level of
the groundwater i s very rea l .
To drain building s i t e s i n Amsterdam no drains have been applied.
Drains a re usually placed only i n spor t f i e l d s and the play grounds
of parks. Since 1970, horizontal prefab drains a t 2 m depth have been

used instead of the ditches and trenches usually applied for the
reclamation of sites. This type of drainage is only meant for use
during the construction phase and is not maintained after the con-
struction. It is assumed that after the construction of sewers and
roads a sufficiently low groundwater level will be established. In
connection with construction of the suburbs of south and west
Amsterdam this method performed as expected. There were but seldom
complaints of problems due to excessive groundwater. In 5 7 the fact will be discussed that under certain circumstances problems do arise.
Whenever in the older districts main and secondary sewers are renew-
ed, nowadays a drain is often placed adjacent to the new sewer in the
excavation trench in order to replace the drainage function of the
old and often leaky sewer.
3 GROUNDWATER MANAGEMENT - A START? Two elements associated with the city infrastructure can bring about
an acute disturbance in the normal groundwater level, namely water
conduit pipes and sewers. I will go into the matter of water pipes in
5 6. Sewers will cause drainage of the surrounding areas in the cases where pipes and connections are not constructed completely water-
proof. The leakage of deep lying sewers, usually the trunk and main
sewers, can lower the groundwater table substantially and as a result
may cause damage to timber foundations (fig.2).
- W
a n P
groundwater extruction
Figure 2 Groundwater extraction as a result of sewer leakage
In Amsterdam a groundwater monitoring system has been installed along
side the sewer system. In about 2000 stand pipe piezometers along the

trunk and main sewers the piezometric head is registered. The
measurements are compared with a warning level and excessively low
groundwater levels are detected. The major lowerings are selected and
they make the basis for a program of inspection. Regularly the
measurements are so low that the inspection indicates that repair of
the sewer is necessary. It has been proved that the effects of repair
can be checked by means of the piezometers very well. The primary
function of the monitoring system is to prevent damage since detect-
ion and repair of the leakage can be carried out very quickly. At the
same time the efficiency of the sewage system is improved since the
transportation and the purification of a considerable amount of
groundwater is prevented. Moreover the understanding of the ground-
water regime is improved by the monitoring system. Much data is
acquired concerning the different groundwater levels in various areas
as well as the seasonal fluctuations in these areas. This gives the
opportunity to predict changes in the groundwater regime.
Although this monitoring system contributes to groundwatermanagement,
it has not been installed for this reason, it has been primarily
installed to prevent damage that may be caused by the malfunctioning
of a municipal construction. This distinction becomes quite clear
from the fact that a proposal for a general groundwater observation
system distributed over the city has failed to get the approval of
the municipal board.
4 GROUNDWATER CONTROL AND TOWN RENOVATION
In the Amsterdam district "Indische buurt" which was built around
1925, many houses are being renovated while other houses are being
replaced. A quality survey on structural aspects shows that in the
larger building blocks settlements have occurred in the order of
0,2 m to 0,6 m during these last 60 years. Nevertheless the decision
was made to renovate these houses as no large differential settlements
are expected to occur within the next 25 years. The renewal of the
district also comprises the reconstruction of services and roads,
including the raising of the latter to the original design level.
The data from the sewer monitoring system showed lowered groundwater
levels in several streets varying from 0,75 m to 1,50 m. A large
number of leaks was found during the inspection of the sewers making

a prompt and extensive repair and renewal p ro jec t necessary.
situation as
surf ace elevation + 0,7 m - J
.- builf 1924
crawl space ventilation L ---
possible renovation defects
cra W / space *I
7% leakage
after renovation
before renovation
Figure 3 Foundation as-bui l t , before and a f t e r renovation
From the above mentioned f a c t s t h e following may be inferred ( f i g . 3 ) :
a . the ground f loor level is now f a r below s t r e e t design level ;
b. the crawl space has s e t t l e d under the "normal" groundwater t a b l e
i n some places;
c. the p i l e head l eve l of t h e timber foundation is only 0,1 m under
"normal" groundwater i n some places.
AS a consequence of the renewal of the sewers the average groundwater
t ab le w i l l r i s e t o an average l eve l of NAP - 0,4 m. For t h a t reason
the groundwater w i l l inundate a number of crawl spaces. I f these
spaces would be kept dry by means of horizontal dra ins , the r e s u l t
would be the drying out and r o t t i n g of the timber foundations. On
similar occasions a solution has been found by making connections i n
the crawl spaces and the i n s t a l l a t i o n of a waterpump i n a col lector
basin a t the lowest p a r t of the crawl space.
The ra i s ing of t h e s t r e e t l eve l t o the o r ig ina l design l eve l i s no t

desirable in these circumstances. If the streets were raised, the
ground floors would be below street level and furthermore the
ventilation shaft of the crawl spaces would disappear under the pave-
ment. The blockage of the ventilation opening would lead toan extreme
relative humidity which will cause a process of wood rot in floors
and dampness in the walls.
It is essential for the process of town renovations that a detailed
survey of existing and future groundwater tables is available as well
as data concerning foundation and crawl space levels. On this basis
the necessary provisions can be made and the new design levels for
the pavement determined.
5 SPAARNDAMMER DISTRICT, INCONVENIENCES CAUSED BY GROUNDWATER
It was October 1979 when the first complaints of serious problems in
connection with groundwater were registered. Specifically a number of
apartment buildings in Zaanstreet and Spaarndammersquare were involv-
ed. In recently renovated houses, plaster work was damaged by excess-
ive moisture and dampness, possibly as a consequence of groundwater
that had been absorbed from the foundation. Measurements of the
groundwater level showed a remarkable raise to about 0,5 m below
surface.
The Spaarndammer district is situated north-west of the city centre
(fig.4). The railway Amsterdam-Zaandam, the Spaarrldammerdike and
Spaarndammerroad form the boundaries of this district, the latter
being part of the high water dike along the river IJ. In this area,
which was built around 1910, in most cases town renovation implies
renovation of the old buildings.
Drainage
There are no canals or other surface waters in the district itself.
As a result the area drains to the river IJ and to some city canals
outside the district at rather large distances. The phreatic ground-
water flow is hampered by the high water dike. The average water
table of the canals is NAP - 0,4 m. South of the railway a polder area still exists where the water table is maintained at NAP - 2,15m. The sandfill of about 2 m thick, placed during the reclamationperiod,
determines the flow directions of the phreatic groundwater.

1977-1978 1 S 1973-1975 11930 I 1 I 1920
cross-section railway embankmenf
Figure 4 Plan Spaarndammer district
As shown in fig.5 remarkable raises in piezometric head have occurred
in the years 1974/1975 and 1977/1978.
Possible origins of the problems
Firstly for the investigation of the origins of the problems,
associated with excessive groundwater, the data on precipitation
and evaporation have been collected. The period of measurement showed
notable differences. The poor correspondence between the net
infiltration and the groundwater level could not provide an
explanation. Moreover these climatic effects had not caused any
significant changes in groundwater levels in other quarters of the
city.
During the period 1969 to 1980 a great number of sewers was renewed.
In Zaanstreet and the surrounding area the most important renewals
took place in 1969 and 1972. The graph of changes in the piezometric
head with time (fig.5) shows no effects of the sewer construction

work as the piezometric head remains reasonably stable until the
winter of 1973/1974.
20
Figure 5 Changes in piezometric head with time
Finally the possible influences of the railway embankment were
investigated. Changes in the flow pattern of groundwater became
evident. The maximum rise had been effected in the western part of
the area near the embankment and in addition the direction of flow
was completely reversed.
Up until 1977 the groundwater flow was directed to the railroad, but
after the strong rise of the water table during the winter of 1977/
1978 the groundwater drained from the embankment into the housing
area. In 1977 the railway yard was extended and during the period
1977-1980 the "Hemrailroad" was constructed. As a result the width
of the embankment was enlarged from 8 0 m to 260 m.
Another consequence was the increase in distance between the housing

area and the deeper lying polder south of the railroad.
The combination of enlargement of the embankment and the increase in
drainage distance had important hydrological consequences for the
area. In the new situation large quantities of groundwater drained
into the housing area.
canal water Level
130 m - wrdth orembankment - 130111
, water table 40 m X 1;0 m - width of embankment --c
Figure 6 Groundwater flow railway embankment 1977 compared to 1973
Remedial measures
As soon as the hydrological analysis indicated that the groundwater
problems originated in the enlargement of the railway embankment, it
was decided to install drainage facilities along the railroad.
The first section was installed in January 1981. It soon proved to be
effective and consequently additional sections have been installed.
The groundwater table was lowered to the normal level of approxi-
mately NAP - 0,4 m (fig.5). Clogging of the drain reduced the dis-
charge capacity relatively quickly and effected a new rise of the
groundwater. Flushing by a high pressure water jet was carried out in
November 1983 (fig.5) and proved to be effective.

Although the groundwater l eve l was lowered, the amount of moisture
and dampness i n the basement and ground f loor walls remained
excessive.
New consultations and inspections brought t o l i g h t t h a t the ven t i l a t -
ion of the crawl spaces was so poor t h a t the r e l a t i v e humidity was
about 95%. A reduction t o approximately 60% was obtained by the
construction of extra ven t i l a t ion apertures. In addition a non-
renovated house proved t o be dry while i n the neighbouring one the
renewed p l a s t e r was wet and mouldy. Specific measurements i n the
p las te r and the brick work showed the p l a s t e r i t s e l f t o be the o r i g i n
of the trouble. The p las te r was hygroscopic. The solution was found
by removal of the damp p las te r work on the ground f loor . This meant
a great r e l i e f f o r the res idents and fo r the housing association a s
well. I f the problem had or iginated i n the capillalry absorption of
groundwater by the brick work, it would have been necessary t o cu t
the walls and put an i so la t ing layer i n the cuts . Such an operation
would have been very cost ly and would have been a r e a l nuisance.
6 COMPLAINTS ASSOCIATED WITH GROUNDWATER PROBLEMS
Nowadays complaints associated with groundwater problems can be
noted in the newspapers more and more frequently. In most of the
cases the au thor i t i e s a re blamed fo r lack of a t t e n t t i o n t o the
s i tuat ion. In some cases the municipality has been sued for damage by
residents. The c i t y of Amsterdam a l s o receives complaints more
frequently nowadays.
A summary of the complaints i n recent years i s given below, including
t h e i r causes and the solutions selected. Most of the complaints
concern problems i n houses ranging from damp and mouldy walls, s tu f fy
rooms, foul smell and some water i n the crawl space, t o basements
with water pouring i n a s i f a l l taps were open.
The complaints a re received by the following municipal services:
- The Municipal Water Board which has a specia l crew f o r leakage
investigation and repair
- Public Works, Department fo r Sewerage and Water Management t h a t has
a s p e c i a l i z e d s t a f f f o r cleaning and repair of sewers, o r the
Department f o r So i l Mechanics and Hydrology t h a t has a large number
of piezometers f o r groundwater monitoring and t h a t can a s s i s t i n

the investigations by making chemical analysis
- Building and Housing Department that assists tenants with all kinds of problems with respect to their houses
To prevent citizens from being treated like a rubber ball bouncing
from one office to the other is not easy. Close cooperation of the
municipal departments involved is necessary in order to resolve the
problem. Often the investigation takes a lot of time and effort since
frequently the source of the trouble cannot be found in the house of
the person complaining.
excess prscipiiulion
Figure 7 Complaints associated with excess groundwater
The 1982 review on groundwater problems shows that 30% of the cases
were caused by leaks in de water distribution system (fig.7).
The leak investigation crew of the Water Board detects most of the
leaks, but sometimes this method fails as illustrated below.
In May 1981 a number of basements were inundated and gardens were
flooded in the Van Breestreet. Initially, the source of the problem
was expected to be found in the special drainage sewer for this
district. The area is still part of a former polder with a separate
pumping station. As no piezometers were available in this area the
sewer itself had to be checked. In the meantime water analyses were
made, the result of which indicated leakage of tap water.
Since a leak detection investigation had already been carried out
with no result in the houses of the tenants who initially complained
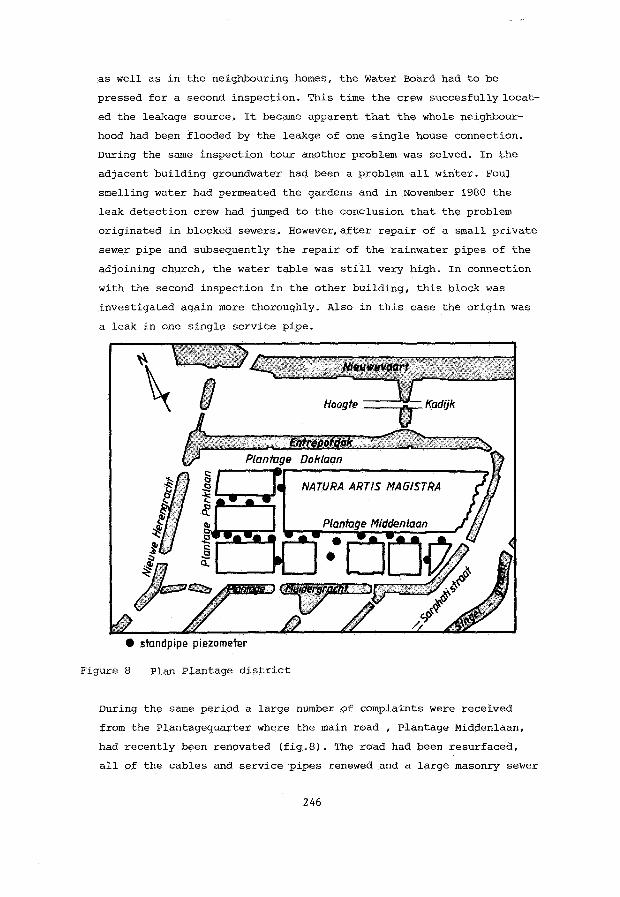
a s well as i n the neighbouring homes, the Water Board had t o be
pressed fo r a second inspection. This time the crew succesful lylocat-
ed the leakage source. I t became apparent t h a t t h e whole neighbour-
hood had been flooded by the leakge of one s ing le house connection.
During the same inspection tour another problem was solved. I n the
adjacent building groundwater had been a problem a l l winter. Foul
smelling water had permeated the gardens and i n November 1980 t h e
leak detection crew had jumped t o the conclusion t h a t the problem
originated i n blocked sewers. However,after repair of a small p r iva te
sewer pipe and subsequently the repair of the rainwater pipes of the
adjoining church, the water t ab le was st i l l very high. In connection
with the second inspection i n the other building, t h i s block was
investigated again more thoroughly. Also i n t h i s case the or igin was
a leak i n one s ingle service pipe.
.gure 8 Plan Plantage d i s t r i c t
During the same period a large number of complaints were received
from the Plantagequarter where the main road , Plantage Middenlaan,
had recently been renovated ( f ig .8 ) . The road had been resurfaced,
a l l of the cables and service pipes renewed and a large masonry sewer

replaced. Many inspections and measurements were performed by the
Sewerage Department as well as by the Water Board, but without any
result. The piezometers indicated a high groundwater table in some
areas, but the water analyses gave no information on the possible
origin. In many cases the chlorine content gives a good indication
of the source, but this time values ranging from 10 to 1300 mg/cl-
per litre were measured and furthermore during a period of several
months large variations in different piezometers were noted.
Gradually the investigation revealed that the groundwater situation
had been a real concern during the road reconstruction, but also that
it had not been much better for years. The residents had finally
stopped complaining because the source of the trouble could not be
found. Several tenants had already installed a small pump in the
basement of their houses.
In this case the trouble was basically caused by the applied system
of land reclamation. About 1682 the area was developed as pleasure
ground and for that reason peat and clay were deemed suitable as fill
materials. When house building was permitted in 1858, the area was
filled with approximately 0,s m sand. Even though the distances to
the canals are relatively small, this thin sandlayer does not permit
adequate groundwater drainage. Moreover the former pleasure ground
surface at approximately NAP level isalmost impervious and prevents
the groundwater from draining below this level.
To obtain practical information on the effectiveness of drains an in
situ test was performed. At three locations a drainage pit filled
with gravel was constructed in the road and connected with the sewer.
In the pits the water table was lowered to the mean level of
NAP - 0,4 m, but the radius of influence was only 1,5 m to 2,5 m.
From this is was quite clear that installation of drains along the
road would not result in drainage at the houses and gardens. The
only way to keep the houses dry is by waterproofing or pumping them
individually.
7 GROUNDWATER INCONVENIENCES IN MODERN DISTRICTS
As mentioned in 2, no drains are installed in new housing areas
and in the modern outlying districts of Amsterdam hardly any ground-
water inconveniences are encountered.

In the Geerdinkhof district of the Bijlmermeer some problems have
occurred. The municipality is in somewhat of a dilemma in this case
as the high groundwater level was not caused by any municipal
activities (railway construction, sewer renovation etcetera) and the
situation does not give cause for the Building and Housing Depart-
ment to step in.
I crawl space
wafer iuble - $50 0.75
surface elevation - 2,80
1 "U-
I - m
11 level -3,615
floor level - 2,68
r
ground water level polder water table - 4'20
i
Figure 9 Plan-view and cross-section at ground level Geerdinkhof
Geerdinkhof is a small district with family houses situated on the
outskirts of the Bijlmermeer (fig.9). This deep polder was reclaimed
by a hydraulic fill with a sandlayer 2 m in thickness varying to a
minimum of 1,70 m at the periphery of the polder. The water table has
been maintained at the original level of NAP - 4,20 m and the roads were constructed at NAP - 2,80 m. The difference in height of 1,40 m is a little more than normal. Geerdinkhof is surrounded by newly
dug canals on three sides, so that drainage should not be a problem.

In 1977 however, shortly after completion of the housing project, the
residents complained of problems due to high groundwater particularly
in the crawl spaces. They asserted that the high groundwater level
was caused by some fault in the process of landfill. That is why they
demand an improvement of the drainage facilities.
The municipality maintains that the high water table will be lowered
in due time as a consequence of the construction of roads and sewers.
Moreover the municipality has stated that basically the origin of the
problem is to be found in the construction of the houses. In other
words the work has been carried out without taking into account the
natural groundwater situation. From an investigation into the ground-
water level in the Bijlmemeer it has been found that in many places
the water table is 0,50 m to 0,75 m higher than the adjacent canal
level. A possible cause for the higher water table could be due to
seepage from the first sandlayer as the water table in the polder is
approximately 2 m below the piezometric head in this layer. From the
technical point of view no design errors have been made in the land
reclamation work or in the construction of roads and sewers. If this
is the case with the construction of the houses remains to be seen.
The construction has been carried out in accordance with the building
regulations as the ground floor is considerably more above the normal
groundwater table than the required 0,45 m. In case of a timber floor
the construction of the crawl spaces would have to meet several
specifications on leakage and ventilation, but with concrete floors
the specification does not apply. Even the usual concrete slab to
cover the subsoil was abandoned for economic reasons. Nevertheless
this omitment is undesirable as the corrosion of service pipes may
be accelerated and the water will attract vermin to the crawl space.
Generally speaking drainage is the appropriate measure for lowering
groundwater. When applied in this case the drains would have to be
installed at NAP - 3,90 m to result in dry basements, taking into
account 0,20 m capillary rise in the sand fill (lit.1). It is
evident that the drains have to be situated adjacent to the houses.
If the drains would be placed in the roads, the groundwater will not
be lowered enough at the houses which is unacceptable. One may quest-
ion the application of a traditional crawl space in this case. The
use of a crawl space originates with the need for ventilation of

timber floors. The secondary use of the crawl space was for the
installation of service pipes and cables. As timber floors are used
infrequently in modern housing, the application of crawl spaces should
be reconsidered both from the technical and the economical point of
view.
In the Geerdinkhof case the crawl spaces are constructed in such a
way that as a consequence the drainage facilities should meet very
high standards. For that purpose large investments are necessary for
the installation and maintainance of the drains.
In consultations between the Building and Housing Department an the
public Works Department some new projects have been reviewed to
determine what the consequences will be with respect to the
installation of pipes and cables in case of building without crawl
spaces. It has been concluded that proper solutions without extra
costs are available.
In addition it should be mentioned that in the report "Crawl spaces,
yes or no?" edited by the Ministery of Building (lit.2) it is con-
cluded that abandoning crawl spaces leads to cost saving solutions as
the thickness of the insulation layer on the ground floor can be
reduced.
According to this case history of a housing district on newly
reclaimed ground and according to the recent report "When it rains,
what will happen?" (lit.3) Geerdinkhof is not an isolated case, so
that the conclusion may be drawn:
Building without a crawl space .... a better guarantee for dry feet!
REFERENCES
1 SEGEREN, W.A. and HENGEVELD, H., 1984. Preparation of building
sites. Report nr. 99 Building Research Foundation,
Kluwer Technische Boeken B.V., Deventer.
2 "Kruipruimte, we1 of niet?", 1983. Report Ministery for Building.
3 BORREMAN, N. and GEERTSE, N., 1984. Als het regent houden wij ons
hart vast. Report nr. 7 Series on civil town planning,
Technical University, Delft.

GROUNDWATER CONTROL: LEGAL ASPECTS
F . J . G . G e r r i t s e n
ABSTRACT
The array of legal instruments regarding groundwater management has
been split up. The existing regulations allow the municipality
sufficient freedom to draw up regulations as to phreatic groundwater
level control.
The municipality is free to include active groundwater management into
its "househould". There is no corporate duty, however, for the munici-
pality as to manage and control of the groundwater level as such.
If the municipality will proceed to an active groundwater level con-
trol, private persons suffering damage as a result of that active
management may successfully appeal to a court of civil judicature so as
to obtain indemnification.
1 INTRODUCTION
In the last few years, also by an increasing number of complaints from
the citizens, the attention of the municipalities for the problems con-
cerning the groundwater levels has highly increased. As a consequence,
pressure to achieve some kind of municipal groundwater management has
increased, too.

The aFray of legal instruments as to groundwater management has been
split up. In the following it will be investigated in a nutshell how
much room the existing legal regulations leave for a municipal ground-
water management. Successively will be dealt with:
- the Groundwater Act;
- the Provincial Groundwater By-Law;
- the Bill on the Water Management;
- the Building By-Law;
- the Local Government Act.
Furthermore, also by analyzing some jurisprudence, the legal conse-
quences will be further entered into of an active municipal groundwater
management in the form of phreatic groundwater level control by means
of horizontal draining systems.
2 LEGAL SCOPE
2.1 The Groundwater Act
The Groundwater Act (hereinafter: GWA) from 22nd May, 1981, is meant as
a substitute for the Groundwater Act Waterworks. On 1st June, 1982 and
1st November 1983 a restricted number of articles of the GWA came into
force. The GWA is operative as a whole from 1st September, 1984.
According to the preamble, the purpose of the GWA is to promote a
proper management of the groundwater. It is considered necessary "to
make rules as to the groundwater withdrawal as well as to the ground-
water recharge for that purpose".
Already in Article 1 of this Act we read that the Act does not apply to
the extraction of groundwater as a consequence of de-watering or
draining of grounds. Extraction of groundwater is defined in Article 1
as "extraction of groundwater by means of a device".
Article 1, Paragraph 3, opening lines and sub a GWA
This Act does not apply to the extraction of groundwater: by drainage.
An exception is made here for the extraction of phreatic groundwater.

In the Explanatory Memorandum (EM) this exception is further entered
into:
"Actions (...) that do not have the withdrawal of groundwater for their
purpose but do affect also the groundwater level, such as the pumping
for level control will be outside the scope of this Act. This does not
exclude that based on other considerations derived from local interests
there may be a need for regulations as to these actions. The regulating
competence of the lower authority continues to be maintained as to this
point." (EM, - the Lower House 1975-1976, 13705, No. 3, page 33).
So, the autonomous freedom of the local authority to draw up regula-
tions as to groundwater level control is left intact.
A recording and licence duty applies to the non-excluded groundwater
withdrawal or recharge.
Article 14, Paragraph 1 GWA
"It is forbidden to withdraw groundwater or to infiltrate water, unless
the County Aldermen granted a license for this purpose."
So the County Aldermen are the authorizing body. In pursuance of
Article 15 GWA Provincial States can designate by by-law exceptions to
the provision in Article 14 GWA.
Article 15, Paragraph 1 GWA
"The prohibition described in Article 14, first paragraph, does not
apply to the withdrawal of groundwater in the cases in By-Law desig-
nated under Our approval by the Provinciale States."
In pursuance of Article 19 GWA, for the municipality (Mayor and Alder-
men) only an administrative and advising task has been reserved.
2.2 The Provincial Groundwater By-Law
A Provincial Groundwater By-Law clearly bears the character of a
supplement to the GWA. Because a by-law shall not adopt articles that
have already been incorporated in the law, it should be read in con-
nection with the GWA.

Within this scope the contents of the various provincial (draft)
groundwater regulations will not further be entered into.
As anticipated the provincial regulations will not provide any further
nuances of the exceptive clause mentioned in Article 3 of the GWA
regarding the withdrawal of groundwater for draining.
This leaves open the question which technical measures affecting the
groundwater levels, such as draining, pumping and infiltration systems
(active groundwater management) still are within the concepts of
draining. In many cases the GWA will not apply to a horizontal drainage
device, in contrast with a vertical standpipe drainage. Within this
category, too, a distinction could be made between:
- drainage by gravity; - drainage via pumped surface water; - drainage via a pumped sewage system of a pumped well;
- drainage with direct pump suction.
It is not clear whether the provinces will use such a distinction in
drainage concepts.
For their interpretation at any rate the objective of the GWA, the
exceptive clause in Article 1 , paragraph 3 of the GWA and the relation
between the GWA and the Housing Act Building Regulation have to be
taken into account.
2 . 3 The Bill on the Water Management
On 29th March, 1982 in the Lower House a Bill on the Eater Management
has been introduced (hereinafter to be called Bill-WM). The Bill-WM has
a twofold objective. On the one hand the Bill provides instruments for
a coherent and efficient policy and management in the field of the
water management as a whole. On the other hand, it provides rules for
the quantity management of surface waters. So, the Bill-WM is both a
general Bill to coordinate the water management and a specific Bill for
the quantity management of the surface water.

The Bill introduces, in combination with plans introduced by the
Pollution of Surface Water Act (PSWA) and GWA, a planning system for
the entire field of the water management. At Governmental level a
Policy Document on Water Management will. in addition to the Indicative
Multi-year Programme for water quality and soil protection, function as
a testing frame for the provincial plans that have to be implemented in
phases, and for managing instruments.
The Province should draw up three different plans:
- the provincial water management plan, in which has also have to be
included the main lines of the quantity management to be conducted
in the plan area (with the exception of the National Waters);
- the provincial groundwater management plan;
- the provincial water quality plan.
In addition, the quality manager draws up a quality management plan and
the quantity manager - voluntarily or assigned by the County Aldermen - a quantity management plan.
There is an indirect relation between the quantity management plan and
the provincial groundwater management plan, as both plans should be
effected within the rough scopes of the provincial water management
plan. If a municipality is the quantity manager, as e.g. Amsterdam, it
will be able to or will have to draw up a quantity management plan in
observance of the water management plan and - indirectly - of the
groundwater management plan.
For practising quantity management, the Bill-WM provides the array in
the form of a system of licences, the "water agreement" and a duty to
register. A duty to license only applies in cases assigned for the
purpose of drainage of extraction of water on or at the water surface,
respectively. The assignment for National waters will be given by
General Administrative Order and for other waters by a provincial
by-law that has to be approved of by the Crown. To what extent the
system of licences of the Bill-WM will affect groundwater level control
by means of quantity management of the surface water, is still unclear.
Maybe the assignment will clarify this.

2.4 The Building By-Law
Most municipalities based their Building By-Law on the model-Building
By-Law of the Vereniging van Nederlandse Gemeenten (= Association of
Netherlands Municipal Corporations). A number of paragraphes of this
model By-Law concerns the groundwater level. In most cases they contain
provisions to be made (e.g. soil enclosure) or requirements that for
buildings, yards and sites the groundwater level has to be taken into
account.
From Article 383 of the model Building By-Law "Safety measures in
building, maintaining and demolishing of buildings" it can be derived
that the municipality is involved in the maintaining of the groundwater
level: "When building trenches are pumped, water must not be extracted
from the ground in such a way that the groundwater level in the sur-
roundings is lowered, so that building foundations might be damaged."
This article stresses that a certain way of groundwater extraction is
forbidden; a fine is imposed on offences. In this respect the Amsterdam
Building By-Law has been formulated even more stringently. The clause:
"When building trenches . . . . . is lowered, so that", is there replaced by "Water must not be extracted form the ground in such a way, that,
11 ......... .
On account of articles in the Building By-Law the municipality can only
act as a guardian of groundwater levels by making writs on the pro-
visions of Article 25 of the Housing Act, to the owners of the buil-
dings or sites concerned to take measures against infringements of
these rules.
This way of approaching may, however, not be expedient since costs
involved in enforcing administatively what could be considered as a
private offence, could come to the municipality's expense. As appears
from the jurisprudence, integral redress of costs is undesirable, when
the writ is not only due to the condition of the dwelling or the way of
habitation but concerns also a matter of public interest (Department of
Jurisdiction "Council of State", 23-08-1983, Gemeentestem (a Trade
Journal), No. 6763, page 77). This would apply when there is ground-

water nuisance over a larger surface area (e.g. a residential dis-
trict). Here lies a question of public interest, making other measures
probably preferable above those on the strength of the Building By-Law.
2.5 The Local Government Act
In the Local Government Act groundwater is not mentioned. Yet within
this scope a number of articles are of importance.
On the strength of Article 168 of the Local Government Act the town
council is authorized to make rules: "The town council makes the
By-Laws that are required in the interest of public order, morality and
health, and others relating to the municipal housekeeping."
Basically, a municipal groundwater by-law (passive groundwater manage-
ment) would be among the possibilities on the strength of Article 168,
on the understanding that this has already partially been provided for
by law and h~gher By-Law (GWA, provincial By-Law). Article 193, para-
graph 1 of the Local Government Act ordains that local By-Laws must not
step into matters that are of general governmental or provincial
interest.
In Article 3 the GWA declares not to apply to "other types of with-
drawal for drainage". There would be no conflict with Article 193,
paragraph 1 of the Local Government Act, if the council would make a
by-law that would lay down rules for the said groundwater extraction
(e.g. drainages). Taken for granted, of course, that this by-law would
meet the criteria of Article 168 of the Local Government Act.
The above does not yet solve the question whether the groundwater
management falls under the municipal housekeeping, i.e. to what extent
the municipality is bound to undertake the active or passive management
of the groundwater.
The Local Government Act does not answer this question. The customary
conception is that as long as a higher authority has not assumed a
certain matter, the municipality is free to include it into its house-
keeping. So, there is no obligation to conduct a groundwater manage-
ment. 25 7

If the municipality should include in its housekeeping an active
groundwater management, e.g. in the form of controlling the groundwater
level by means of drainage systems, this would be based on Article 175
of the Local Government Act: "It (the town council) commands the con-
struction or improvement of municipal roads, water conduits. streets,
squares, canals, buildings, works and plants."
2.6 Summary
Municipal groundwater management will have to remain within the legal
scopes. In the following a summary will be given of the regulations
that have to be taken into account, if active groundwater level manage-
ment will be practised by means of horizontal drainage systems.
The Local Governmental Act leaves sufficient room for active management
of municipal groundwaters. The municipality is free to include the
active groundwater management into its housekeeping. Neither will the
GWA and the provincial by-laws present many problems as, in general,
horizontal drainage systems will not come under the rggime of these
by-laws. The Building By-Law seems to be an improper instrument for a
total approach of preventing high groundwater levels, because it leaves
basically the solution of this question to private persons.
A question that has not been mentioned previously, is the discharge of
drainage water. If drainage water is discharged on the municipal
sewerage, either a licence or an exemption can be required on the
strength of a drainage by-law on sewerage. Because groundwater is
either a carrier of polluting substances, or it has to be considered as
a waste water because of an oxygen deficiency or too high temperature,
a license may be required on the basis of the Pollution of Surface
Water Act for discharge of drainage to surface water.
In case of discharge to surface waters, whose quantity management is
not in municipal hands, requirements can be made by the surface water
quantity manager, on the strength of the future Water Management Act
(W).

3 LEGAL CONSEQUENCES
From the above it may be concluded t h a t the munic ipal i ty does not have
any corporate duty a s t o the management and the con t ro l of the ground-
water l e v e l a s such. Consequently, t he municipali ty cannot be re-
proached f o r negligence i n r e spec t of damage a s a r e s u l t of f luc-
tua t ions of the n a t u r a l groundwater l eve l . Moreover, i t seems tha t i n
p rac t i ce the groundwater l e v e l cannot be e f f e c t i v e l y cont ro l led . This
v i s ion is supported by a sentence of t he Pres ident of the Rotterdam
Court, given on 15th August, 1969, NJ 1972 No. 265, i n which i t has
been judged t h a t a subjec t ive r i g h t t o a c e r t a i n groundwater l e v e l
cannot be granted and public a u t h o r i t i e s have no duty t o regula te t h e
groundwater l eve l .
Also t h e sentence of t he Pres ident of The Hague Court i n a summary
ju r i sd i c t ion between a number of i nhab i t an t s of dwellings i n a loca t ion
of newly bui ld houses and t h e munic ipal i ty of Alphen aan den Rijn
(municipality i n t h e Province of South-Holland) is i n t e r e s t i n g i n t h i s
respect .
In November and December 1979 a number of newly b u i l t dwellings i n t h e
building loca t ion "Riddemeld 11" i n Alphen aan den Ri jn have been
troubled by a too high groundwater l eve l . Only p a r t of the houses i n
Riddemeld I1 was a t t h a t time inhabited. I n e i g h t of t he dwellings
t h a t had already been occupied, t h e groundwater rose i n the crawl
spaces a s f a r a s the groundlevel f l oo r . In one house the so-called
" leefkui l" ( recess i n the livingroom) f i l l e d , so t h a t t he f loor ing was
damaged. In another dwelling t h e hot -a i r system t h a t recessed i n t h e
f l o o r was damaged. The inhab i t an t s required from the municipali ty t o
lower the groundwater l eve l , because t h e ground bought by them did no t
meet the d e f i n i t i o n of "building ground", a t t h a t time. F inal ly , pro-
ceedings f o r a condi t ional in junct ion were taken. The arguments of t h e
municipali ty w e r e among o the r s t h a t ho r i zon ta l dra in ing pipes could
only be e f f e c t i v e a f t e r a c e r t a i n t i m e during which t h e ground of t h e
s i t e could s e t t l e . When during t h i s period dra in ing appears t o be not
e f f e c t i v e , t h e bu i lde r should be kept responsib le f o r keeping dry h i s
bui ld ing trench. Water nuisance, i f any, had been of a temporary
nature , because t h e f u t u r e water management system d i d not ye t funct ion
f u l l y ; a l s o not a l l roof-gutters had a s ye t been connected t o the sewer
system.

The President of the Court met the arguments of the municipality.
Accordingly the municipality was not bound to take measures to lower
the groundwater level (in building ground during the building phase)
such that the crawl space under the groundlevel floor of the plain-
tiffs' dwellings would become and/or remain (practically) dry. For the
time being the President did not see either that such measures would
fall under the corporate duty of the defendant.
In this case the method according to which the site was prepared for
building was really tested for its lawfulness. The court decided that
the municipality had to demonstrate that it "prepared the building area
normally, i.e. in accordance with the standards considered technically
justified by experts".
Can the municipality be held liable for damage as a result of an active
groundwater level control by means of horizontal draining systems?
This question cannot easily be answered. Here a distinction should be
made between damage resulting from an illegal (local) governmental
action and that resulting from a legitimate (local) governmental
action. In general it can be put that the municipal liability for the
carrying out of works, among which draining systems, essentially does
not differ from private persons' liabilities.
The general requirements for liability on the strength of Article 1401
of the civil code are: illegitimacy, fault and causality. The illegi-
timacy of a certain activity or of its ommittance is in practice mostly
determined by the question whether the damage could have been foreseen
and prevented. This is being judged by following criteria:
- the nature of the activity;
- the extent of the probability of the damage;
- the seriousness of the concequences;
- the extent of the difficulty of taking precautionary measures.
In a situation as mentioned this means that before the municipality
starts installing the horizontal draining systems it has the duty to:
- make an investigation into the possible consequences;
- to warn those concerned as to the consequences to be expected;
- to take precautionary measures.

Also when the draining is being executed by a building contractor, the
municipality remains, as the principal, liable to third parties as to
the duty to warn them and take precautionary measures. This may be
illustrated by means of a verdict of the Amsterdam Court, dated 15th
April, 1977 (BR, 1978, page 81). The draining of a building trench for
the installation of a culvert caused the subsidence of a campshed and a
garden partition. Both the implementation and the management were
commissioned to third parties by the Principal, a Union of Inland
Polders. Nevertheless, also the Union of Inland Polders was held liable
and sentenced to indemnify.
Before liability is assumed, there should also exist a causual con-
nection between the damage sustained and the illegitimate activity;
therefore it is necessary to show that the damage would not have been
caused, if the activity should not have taken place and that it is
proved satisfactorily that the damage is the result that may be
reasonably expected from the activity.
But what will happen when an active control of the groundwater level
can stand the lawfullness test and nevertheless there is damage as a
result of this legitimate (local) governmental action?
This comes under the so-called domain of the "administrative compen-
sation". The government takes action in the public interest. These
action can adversely affect some citizens. Must the government make
good this incidental damage? The judge can only sentence the government
to indemnification, if the damage results from an illegitimate action.
Already in 1944 the Supreme Court found a solution to this problem in
the so-called Dune drinking-water judgement (SC 18-02-1944, NJ 1944,
Nr. 226): For the drinking-water supply the municipality of The Hague
extracted water from a dune area. As a result a number of market-
gardeners sustained damage, because the soil dried up. They success-
fully conducted an indemnification action on the strength of Article
1401 of the Civil Code. The Supreme Court judged the water catchment in
itself admissible, but the non-simultaneous presenting of indemnifi-
cation illegitimate.

If the municipality proceeds to an active groundwater level control,
private persons who may sustain damage as a result of that active
management may successfully appeal to a court of civil judicature to
obtain indenmnification, regardless whether this damage results from
either legitimate of illegitimate governmental activities.
REFERENCES
BORREMAN, N., GEERTSE, N. 1984. When it is raining we hold our breath
. . . . . , the issues of a high groundwater level in urban areas, a stock-taking (in Dutch) Publicatiereeks Civiele Planologie No.7,
Department Civil Physical Planning, Delft , University of
Technology.
GEMEENTE ZAANSTAD, 1981. Groundwater levels part 2 - managerial aspects and liability (in Dutch), Zaanstad.
SCHIPPER, G.M. de, 1984. Administrative Compensation (in Dutch). Tijd-
schrift voor Overheidsadministratie, 12.

TNO COMMITTEE ON HYDROLOGICAL RESEARCH
PROCEEDINGS AND INFORMATION
No. 1 Proceedings of Technical Meetings 1-6 (with summaries in
~nglish), 1952.
1. Investigations into the water balance of the
Rottegatspolder
2. The water supply for crops I
3. Observations of groundwater levels
4. Investigations by drain gauges in The Netherlands
5. The water supply for crops I1
6. The problem of the increasing salinity of ground
and surface water in The Netherlands
IJo. 2 Proceedings of Technical Meetings 7-10, and
Report on the evaporation research in the Rottegatspolder
1947-1952 (with summaries in English), 1955.
7. The study of precipitation data
8. Model research on groundwater flows
9. Measurements and improvement works in basin of brooks
10. Geo-electrical research
No. 3 Proceedings of Technical Meetings 11-12 (with summaries in
~nglish), and
Report on the Lysimeters in The Netherlands I (in English), 1955.
11. The water supply of sandy soils
12. Quality requirements for surface waters
No. 4 Evaporation Symposium and
Report on the Lysimeters in The Netherlands I1 (with summaries
in English), 1959.

No. 5 Proceed ings of T e c h n i c a l Meet ings 13-14 ( w i t h summaries i n
E n g l i s h ) , 1960.
13. Groundwater l e v e l s and groundwater movement i n t h e sandy
a r e a s of The Ne ther lands
14. Water i n u n s a t u r a t e d s o i l
No. 6 Proceed ings of T e c h n i c a l Meeting 15 ( w i t h summaries i n E n g l i s h
and F r e n c h ) , 1961.
The regime of t h e Rhine, t h e Ysselmeer and Zeeland Lake
No. 7 Proceed ings of T e c h n i c a l Meet ing 16 ( w i t h summaries i n E n g l i s h ) ,
1962.
The d r y y e a r 1959
No. 8 Proceed ings of T e c h n i c a l Meet ing 17 ( w i t h summaries i n E n g l i s h ) ,
1963.
The laws o f groundwater f low and t h e i r a p p l i c a t i o n i n p r a c t i c e
No. 9 Proceed ings o f TechnicalMeet ing 18 ( w i t h summaries i n E n g l i s h ) ,
1963.
Water n u i s a n c e
No. 10 Steady f l o w of groundwater towards w e l l s ; coqail-ed by t h e
Hydrologisch Colloquium ( i n E n g l i s h ) , 1964.
No. 11 Proceed ings of T e c h n i c a l Meet ing 19 ( w i t h summaries i n French
and German), 1964.
Geohydro log ica l c a r t o g r a p h y
No. 12 Proceed ings o f T e c h n i c a l Meet ing 20 ( i n E n g l i s h ) , 1966.
Water b a l a n c e s t u d i e s
No. 13 Proceed ings o f T e c h n i c a l Meet ing 21 ( i n E n g l i s h ) , 1966.
Recent t r e n d s i n hydrograph s y n t h e s i s

No. 14 Proceedings of Technical Meeting 22, 1968.
Precipitation data (11) and
Report on the Lysimeters in The Netherlands (111) (both with
summaries in English)
No. 15 Proceedings and Information no. 15 (in English), 1969.
Soil - water - plant
Proceedings of Technical Meeting 23, 1968.
Seepage
(Will not be published).
Proceedings of Technical Meeting 24, 1970.
Flow in the unsaturated zone
(Will not be published).
No. 16 Proceedings of Technical Meeting 29 (with summaries in English),
1975.
Hydrological investigations for masterplan for the future
watersupply in The Netherlands
No. 17 Proceedings of Technical Meeting 25 (in English), 1973.
Automatic processing of hydrological data
No. 18 Proceedings of Technical Meeting 26 (in English), 1974.
Hydraulic research for water management
No. 19 Proceedings of Technical Meeting 27 (in English), 1974.
The hydrological investigation programme in Salland (The
Netherlands)
Proceedings of Technical Meeting 28, 1973.
Water quality of Dutch rivers with respect to water management
(Will not be published)

No. 20 Proceedings of Technical Meeting 30 ( i n E n g l i s h ) , 1976.
S a l t d i s t r i b u t i o n i n e s t u a r i e s
No. 21 Proceedings of Technical Meeting 31 ( i n E n g l i s h ) , 1976.
Groundwater p o l l u t i o n
No. 22 Proceedings of Technica l Meeting 32 (wi th summaries i n E n g l i s h ) ,
1976.
Systems approach t o t h e management of water r e s o u r c e s
No. 23 Proceedings of Technica l Meeting 33 ( i n E n g l i s h ) , 1977
P r e c i p i t a t i o n and measurements of p r e c i p i t a t i o n
No. 24 Proceedings of Technica l Meeting 34 ( i n E n g l i s h ) , 1978.
Urbaniza t ion and water management
No. 25 Proceedings of Technica l Meeting 35 ( i n E n g l i s h ) , 1979.
The r e l a t i o n between wate r q u a n t i t y and wate r q u a l i t y i n
s t u d i e s o f s u r f a c e w a t e r s
No. 26 Proceedings of Technica l Meeting 36 ( i n E n g l i s h ) , 1980.
Research on p o s s i b l e changes i n t h e d i s t r i b u t i o n o f s a l i n e
seepage i n The Netherlands
No. 27 Proceedings of t e c h n i c a l Meeting 37 ( i n E n g l i s h ) , 1981.
Water r e s o u r c e s management on a r e g i o n a l s c a l e
No. 28 Proceedings of Technica l Meeting 38 ( i n E n g l i s h ) , 1981.
Evaporat ion i n r e l a t i o n t o hydrology
No. 29a Background papers f o r Technica l Meeting 39 ( i n E n g l i s h ) , 1982.
(Nether lands c o n t r i b u t i o n s , r e l a t e d t o t h e PAWN-study, f o r t h e
ECE-seminar-1980).
Po l icy a n a l y s i s f o r t h e n a t i o n a l water management of The
Netherlands

No. 29b Netherlands contributions, not related to the PAWN-study, for
the ECE-seminar-1982 (in English), 1982.
Economic instruments for rational utilization of water
resources
No. 30 Proceedings of Technical Meeting 40 (in English), 1983.
The role of hydrology in the United Nations Water Decade
No. 31 Proceedings of International Symposium (in English, with
summaries in French), 1983.
Methods and instrumentation for the investigation of
groundwater systems
No. 32 Proceedings of Technical Meeting 41 (with Preface in English),
1985.
Planning of Water Resources Management on a Regional Scale
No. 33 Proceedings of Technical Meeting 42 (in English), 1985.
Water in urban areas
All Reports are written in English except Reports Nos.:
1 - 9, 11, 14, 16, 22, 32. The price of each Report amounts to US $ 15.- (No. 31: US $ 30.-).
The prices include postal charge.
Send your order to: CHO-TNO
P.O. Box 297
2501 BD THE HAGUE
THE NETHERLANDS
