waterbury, ct freight street district market analysis · pdf filefreight street district...
TRANSCRIPT

Freight Street District Market Analysis
City of Waterbury, CT
October 2017
Prepared for:
City of Waterbury, CT
235 Grand St.
Waterbury, CT 06702
120 West Avenue, Suite 303
Saratoga Springs, NY 12866
518.899.2608
www.camoinassociates.com
Appendix D:

About Camoin Associates Camoin Associates has provided economic development consulting services
to municipalities, economic development agencies, and private enterprises
since 1999. Through the services offered, Camoin Associates has had the
opportunity to serve EDOs and local and state governments from Maine to
California; corporations and organizations that include Lowes Home
Improvement, FedEx, Volvo (Nova Bus) and the New York Islanders; as well as
private developers proposing projects more than $600 million. Our reputation
for detailed, place-specific, and accurate analysis has led to projects in 30
states and garnered attention from national media outlets including
Marketplace (NPR), Forbes magazine, and The Wall Street Journal.
Additionally, our marketing strategies have helped our clients gain both
national and local media coverage for their projects to build public support
and leverage additional funding. We are based in Saratoga Springs, NY, with
regional offices in Portland, ME; Boston, MA; Richmond, VA; and Brattleboro,
VT. To learn more about our experience and projects in all of our service lines,
please visit our website at www.camoinassociates.com. You can also find us
on Twitter @camoinassociate and on Facebook.
The Project Team Rob Camoin, CEcD
President & CEO, Project Principal
Christa O. Franzi, CEcD
Senior Economic Development Specialist, Project Manager
Bethany Meys
Economic Development Analyst, Project Staff

Camoin Associates | Waterbury, CT Freight Street District Market Analysis i
Table of Contents Table of Contents .................................................................................................................................................................................................... i
Summary Report ..................................................................................................................................................................................................... 1
A | Real Estate Market Trends Analysis ...................................................................................................................................................... 13
B | Competitive Analysis SWOT .................................................................................................................................................................... 61
C | Supplemental Maps ................................................................................................................................................................................... 63
D | Data Sources ................................................................................................................................................................................................ 64
E | Tapestry Segmentation ............................................................................................................................................................................. 65
F | Stakeholder Interviews............................................................................................................................................................................... 67

Camoin Associates | Waterbury, CT Freight Street District Market Analysis 1
Summary Report
Introduction This report presents the results of a market analysis to determine redevelopment opportunities for the Freight Street
District, which is a 60-acre area located on the western edge of the City of Waterbury’s downtown central business
district. The City of Waterbury retained the team of Milone & MacBroom and Camoin Associates for assistance
crafting a redevelopment strategy for the Freight Street District. Camoin’s role included:
Analysis of local and regional real estate markets, including residential, office and retail
A market summary of the strengths, weaknesses, opportunities, and threats (SWOT) facing Waterbury
A look towards future trends in downtown redevelopment
A financial feasibility analysis of the redevelopment concept (future phase)
Our objective is to provide the City, its partners, and potential developers, information needed to make sound
decisions regarding future development of the Freight Street District. This plan is grounded in information and
analysis around market conditions, financial viability, site realities, and – through a planned public engagement
process – will have the support from the City and community leaders. This analysis builds from previous planning
efforts in the city, such as the Waterbury Innovation Places Strategy and The W.A.T.E.R. Project, among others.
Figure 1: Freight Street District Site Location Map
Freight Street District Site Location Map

Camoin Associates | Waterbury, CT Freight Street District Market Analysis 2
Process & Methods Our analysis seeks to identify market trends at the regional level that are impacting real estate development, as well
as trends at the local and even site level that may impact development opportunities for the Freight Street District
and Downtown Waterbury. The market analysis provides a snapshot of the real estate market realities today and,
more importantly, identify emerging trends on the horizon that will affect future development opportunities 5-10
years into the future.
Like any market analysis, this process began with a thorough assessment of supply and demand of potential uses.
General uses for consideration included residential housing, office/commercial space, retail and services, and light
industrial uses. Camoin Associates conducted a detailed market assessment of these uses, which includes a close
examination of the demographic and economic trends affecting demand and the capacity for new space to be
absorbed. The complete Real Estate Market Trends Analysis is provided in Attachment A.
In addition to the data analysis, Camoin conducted in-person and telephone interviews with commercial and mixed-
use property developers, economic development professionals, and licensed real estate professionals to further
understand the current economic and real estate environment. Interviews focused on the projected demand for
different types of space (commercial, residential, retail, mixed-use, etc.), price points, recent developments, and
amenities. Key economic development officials and business leaders were also interviewed to gauge on-the-ground
perspectives of the true opportunities for real estate development and redevelopment. A list of individuals
interviewed for this project is provided in Attachment F.
As the research and analysis advanced, Camoin Associates prepared a SWOT Analysis (strengths, weaknesses,
opportunities, threats) to inventory unique assets and understand the competitive advantages offered by those
assets. The SWOT analysis is provided in Attachment B.
Notable Market Trends When considering potential opportunities for mixed-use development, it is critical to understand trends within
general use categories: residential, retail, office, etc. While the Freight Street District will likely include many unique
offerings within the City of Waterbury and therefore not solely reliant on the larger real estate market, it is still
important to recognize the role of the real estate market in driving development opportunities. The following
section summarizes trends driving residential, retail, and office markets in the City of Waterbury and surrounding
regional trade areas.
Residential Market Trends
Lack of activity is creating pent-up demand for modern urban housing options.
As with most urban areas, the City of Waterbury has a relatively high proportion of rental units compared to its
more suburban and rural neighbors; 47% of all occupied housing units in the city are renter-occupied. The city’s
housing stock is quite old; over 32% of Waterbury’s housing was built prior to 1940 compared to 22% in the state.
The median home value in Waterbury is just above $150,000, which is significantly lower than the median home
value in the state at nearly $284,000.
Overall, the residential housing market in Waterbury has a relatively high vacancy rate at 10.9% compared to 8.5% in
Connecticut. However, multifamily properties with 20 units or greater in Waterbury have an extremely low vacancy
rate of 2.9%.
Despite the strong re-urbanization trend occurring in many cities across the country, most suburban empty-nesters
in western Connecticut are not selling their single-family houses and moving to urban areas in droves. Reasons for
this include difficulty selling single-family houses, downtown revitalization in Connecticut lagging that of other
northeast cities, and a negative perception of Connecticut overall.

Camoin Associates | Waterbury, CT Freight Street District Market Analysis 3
Young professionals are the other cohort driving urbanization trends nationally. Connecticut cities like New Haven,
New Britain, and Middletown are starting to see young people move back to their urban cores. However,
Waterbury’s lack of modern housing downtown limits its ability to compete for this market. In recent years there
have been three market rate multi-family residential projects in Downtown Waterbury that cater towards young
professionals and students:
68-70 Bank Street Apartments
o Completed in 2012
o 17 Unit Apartment Building
o Vacancy: 5.9% (1 Unit)
o Rent Comparable: $706 per unit, $1 per square foot
Apothecary Hall (63 Bank Street)
o Completed in 2012
o 12 Luxury Apartments
o Unit Price: $1195
Brown Building (20 East Main Street)
o Ongoing renovation into a 26-unit student housing complex
o $11,400 per school year for single ($11,400 / 10 months = $1,140 per month)
The lack of new development in this market is creating some pent-up demand for modern, middle- and upper-
market rate rental units. Total demand for this type of product is currently about 160 units per year. However, due to
its high property tax rates and challenges with crime and poverty, most developers today are overlooking Waterbury
as a place to invest. Potential downtown residents are forced to find alternative, less desirable housing options
and/or choose to reside in other communities that offer the type of housing they seek. Several local employers in
Waterbury noted this as a significant challenge they face when trying to attract talent to the area.
Retail & Services Market
Limited opportunity for large-scale retail. High-density, mixed-use development can generate localized market demand that doesn’t exist today.
Waterbury’s Regional Retail Trade Area extends to the towns of Prospect, Cheshire, Wolcott, Plymouth, Thomaston,
Morris, Washington, Roxbury, Southbury, Oxford, and Naugatuck. The area encompasses over 200,000 residents and
77,000 households. The population within the trade area is primarily young and middle-aged adults with a median
age of 41. Median household income is approximately $56,000 and projected to increase to $60,000 by 2022.
Consumers within the Regional Retail Trade area include a mix of young adults with low to moderate incomes and
older, more established residents with high incomes. Consumer trends in this market include preferences toward
visiting museums, outdoor gardening, and participating in sports or other active recreation (running, swimming,
etc.). Those with more disposable income invest heavily in sports equipment in support of their hobbies.
There are 21,000 residents and 8,300 households within a 1-mile radius of the Freight Street District. Consumers
within this local market area are considerably younger, with a median age of 34, and have much less spending
power, with a median household income is $27,000. Nearly half of the residents within 1-mile of the Freight Street
District are of Hispanic ethnicity, and they have a unique market profile. This is a fast-growing market segment in
the city that, despite the lower spending power currently, is becoming more dominant over time and is an
opportunity for retail and services businesses.
Overall the Waterbury region is well-served by the existing mix of retail and service businesses. However, there is
significant unmet demand for restaurants and other eating places. Recapturing 25% of the existing sales leakage (i.e.
the spending by Regional Trade Area residents who travel outside of the trade area to eat at non-local restaurants)

Camoin Associates | Waterbury, CT Freight Street District Market Analysis 4
would support 10 new restaurants or over 19,000 square feet of space in Waterbury. Most interviewees suggested
that there is an opportunity to expand the restaurant market downtown, and representatives from the UConn
Waterbury campus noted that restaurants that offer sushi and other quality-foods are something students travel
out-of-town for.
Due to its location in Waterbury’s urban core, and associated accessibility issues, the Freight Street District cannot
compete with the ongoing retail development occurring just a few miles away along Interstate 84 at Exit 25A.
However, in a mixed-use setting that creates consumer density and increases demand for local goods and services,
there are opportunities for smaller-scale retail and service businesses in the Freight Street District, particularly in the
food and beverage sectors as well as business support services and businesses that offer an experience beyond
shopping (Example: A specialty food shop, like an olive oil company, that allows customers to sample the products
and provides detailed recipes and education around use of the products. A brewery or winery with a tasting room
would be another example.)

Camoin Associates | Waterbury, CT Freight Street District Market Analysis 5
Office Market
Weak office real estate market projected to remain stagnant.
Office utilizing industries in the region are projected to grow by only 1% over the next 10-years through 2026. This
equates to about 43,000 square feet of office space demand. There is over 807,000 square feet of office space
available in the regional market today, which can easily absorb the limited growth projected in the coming years.
Medical office space, however, is a unique segment of the office market that has experienced high demand coupled
with low vacancy rates across the country and in the Waterbury market. Employment within ambulatory care or
outpatient care services is anticipated to increase by over 800 workers within the next decade. This increase in
employment is indicative of an increase in demand for medical office buildings. In fact, 800 new workers would
result in a demand of nearly 162,000 square feet of new medical office space in the region.
The Freight Street District is not the most ideal location for larger medical offices, like an urgent care facility, as
these types of uses are typically located in high-visibility, highly accessible areas. However, as the industry continues
to transition to more on-demand, walk-in services, there may be opportunities for smaller medial office spaces for
specialists who want to be in close proximity to the city’s hospitals.
Freight Street District Redevelopment Opportunities As detailed in the accompanying report by Milone & MacBroom, there are several large-scale multi-year
infrastructure and remediation projects planned and underway that must be completed prior to any real estate
development in the Freight Street District.
The market analysis creates a picture of what is happening in various real estate markets now, and what is projected
over the next few years, assuming no major transformational events occur that disrupt current trends. Most market
studies, including this one, begin with a thorough data trends analysis using past trends to project future demand.
Historic data can be an excellent predictor when past trends are expected to persist. However, when there are other
unpredictable factors affecting change, past trends do not always reflect future demand, especially when the
timeframe is extended over a long-period.
This is the case in Waterbury’s Freight Street District. The past data is helpful for providing context and may in fact
be relevant for understanding some of the future economic potential, but understanding the transformative nature
of disruptive events and trends over the long-term is also important in exploring future potential.
Several simultaneous events are beginning to transition and transform the character of the city and the region.
Some of the ‘disruptions’ are national or statewide, affecting many communities, and others are local affecting only
the city itself. Examples of these events include:
Dramatic increase in demand for Transit Oriented Development (TOD) nationally and regionally
State’s Innovative Places Initiative
New Tax Increment Financing (TIF) legislation in Connecticut
Inactivity leading to pent-up demand locally for residential uses
Large-scale infrastructure and remediation projects in and around the Freight Street District
Together, these events along with others, are affecting Waterbury’s economy in ways that historic data cannot fully
project. When markets undergo transition and transformation like this, the development community will work to
lead the market to where they want it to go instead of responding to market demand. To do this, developers will act
on “early” or “weak” signals that are difficult to see in the traditional analysis of supply and demand, because the
market is just beginning to emerge. By building products that are completely different from anything currently
available, developers capitalize on emerging market opportunities. They create products that the consumer did not

Camoin Associates | Waterbury, CT Freight Street District Market Analysis 6
even know they wanted, creating demand where it did not exist before. A familiar example of this phenome is the
Apple iPhone.
We believe that Waterbury is at the cusp of transformation.
Waterbury is at a pivot-point where uncertain outcomes and emerging market opportunities are increasingly
difficult to predict. What this means for the Freight Street District is that the City and its partners must be willing to
work with the uncertainty, and not let it hamper action. This will require an adaptive approach to planning and
development. Redevelopment must be broken down into small components that evolve incrementally, allowing
ultimate flexibility in directing the course of redevelopment.
Plan. Do. Learn. Adjust. Repeat.
The purpose of this project is not to set a single path toward one redevelopment objective, but to create a
framework to guide action toward achieving the City’s desired outcomes. Recommendations are grouped into
short-term projects that can be initiated immediately and longer-term redevelopment opportunities that should be
refined based on what emerges in the future.
Short Term, Immediate Opportunity: Activate the Space, Make it a Place.
Vacant dilapidated mills and a towering pile of rubble dominate the Freight Street District’s landscape. Weeds and
relics from the site’s industrial past block any aesthetic view of the river. This area is not a place that most people
visit unless they work at one of the few businesses operating there. But, just because any significant real estate
redevelopment is unlikely to occur here in the next few years, does not mean it cannot be reactivated to become a
meaningful place in the city in the short-term. In fact, taking steps now to draw attention to this area will support
larger-scale projects in the future. And, as identified through recent planning processes taken on by the City and its
partners, there is an immediate need to better connect certain communities. The Freight Street District can be the
place that fosters these connections.
Connect with the local makers, innovators, and disruptors.
Waterbury recently completed an innovation-based strategy as part of a highly-competitive planning process
through the State’s CT Next program, Innovation Places. Along with Downtown, the Freight Street District was
identified as a central node for proposed innovation-based projects. While the City was not ultimately selected for
one of the top implementation funding awards, the effort that went into developing the plan has sparked an
ongoing conversation in the city among both public and private sector leaders about how to better cultivate a
culture of innovation and entrepreneurship in Waterbury and throughout the region.
One of the challenges identified during the IP process was the lack of a local entrepreneurial network. The IP
steering committee had a challenging time finding even just a few entrepreneurs and small business owners to sit
on the implementation committee. Connecting the entrepreneurial network in a community is a critical first step,
and arguably the most important step, when working to grow and entrepreneurial ecosystem. This is something that
Waterbury’s ecosystem builders need to begin addressing immediately, connecting entrepreneurs with:
Other entrepreneurs
Innovation-based companies like Macdermid
Educational opportunities
Financing institutions and other funding sources
Other assets and resources available to inspire new ideas, help them realize their vision, and grow their
businesses.

Camoin Associates | Waterbury, CT Freight Street District Market Analysis 7
How does the Freight Street District play a role in growing the regional innovation ecosystem?
Waterbury’s IP strategy identifies the Freight Street District as a place that can be used to foster these connections.
Starting this process does not require a building or large investment. It requires using the available open space to
host events and other programming that will attract the entrepreneurial community, artists, business leaders,
community leaders, and others. The IP strategy includes several projects that would foster this type of engagement,
including:
Wine garden along the river
Food truck mash up
Farmers market at the train station plaza
The biggest lift for these ideas is finding a champion to lead them.
Other ways to activate the space in the short-term might include picnic tables combined with public Wifi where local
employees and others can work outside on a laptop or meet in small groups. This could be combined with any of
the other ideas noted above, or simply be an open space that can be used for programming networking “pop-up”
events. The City’s W.A.T.E.R. Project and associated TIGER Grant Application also contains plans to create a bike path
and park; elements of which would help activate this area.
Macdermid, one of the companies leading innovation, research, and development in the area, currently hosts some
outdoor events for employees on occasion at their site. It would be great to partner with Macdermind and host
events that allow casual interaction and conversations among Macdermid employees and other entrepreneurs,
business leaders, and others working in the area.
The goal is to create opportunities for people to interact and exchange ideas. This might be through formal
programming and networking or in more casual settings - we’d suggest a combination of both. The benefits are
two-fold:
1. Grow, connect, and strengthen the local network of entrepreneurs and other stakeholders. By participating
in this network, the City and its partners will gain a better understanding of what the needs are of the local
entrepreneurial community, which will likely include future development opportunities for the District.
2. Change the perception of the Freight Street District from a littered landscape with a complex industrial past
to a place where people can go to connect and meet with others working to create Waterbury’s role in the
future economy.
Engage the Hispanic community.
Another community that should be more engaged by the City and its partners to understand their needs and
identify future potential market opportunities is the growing Hispanic community. Nearly 36% of the city’s
population is of Hispanic ethnicity and the majority of this population resides within a few miles of the Freight Street
District. Not only do immigrant and first-generation communities have much higher rates of entrepreneurial activity
compared to their non-Hispanic counterparts; but, they are also gaining consumer-market power as families work to
strengthen their financial standing.
Individuals of Hispanic origin might come from one of over 20 different countries with vastly different cultural
backgrounds and, therefore, different consumer needs and preferences. By working to strengthen these
relationships now, the City can learn more about emerging needs and opportunities to help businesses and other
entities better serve the Hispanic market, which could also result in potential development opportunities in the
Freight Street District.

Camoin Associates | Waterbury, CT Freight Street District Market Analysis 8
Create active recreational amenities to support quality of life assets.
Activation of the Freight Street District should not be restricted solely to the entrepreneurial and startup community.
It should be a place that anyone can come to recreate whether they are students, residents, or employees in the city.
The need for more active recreation amenities in the downtown area was a theme that ran through the interviews as
well as the market tapestry segmentation analysis. It was also a significant issue identified in the IP strategy. Active-
recreation uses could include:
Paint ball
Laser tag
Obstacle course
Running/walking path
Ultimate frisbee
Escape rooms
All of these uses are temporary in nature and can be worked into the District’s existing landscape as a way to draw
people to the area.
Long-Term Opportunity: Grow the Innovation Ecosystem with TOD
One of the Freight Street District’s unique assets is the train station; the presence of which sets the area apart from
any other site in the local real estate market and sets Waterbury apart from many other cities in the northeast. Even
with its existing capacity limitations, which are summarized in the Milone & Macbroom report, the train station
allows the potential for transit oriented development (TOD) in the future.
It is also a way for the Freight Street District to be an extension of the downtown, yet differentiate itself in a way that
it complements Waterbury’s existing urban fabric without competing or distracting from it.
What is TOD?
Transit Oriented Development (TOD) involves the creation of a dense, central location for a mix of uses with
immediate proximity to a transit station. TOD is becoming a highly sought-after style of development as people and
businesses have become increasingly attracted to places that are walkable and bikable, in close proximity to transit
options, incorporate different building/land uses, and are more densely developed. Studies have found that transit-
accessible properties are able to demand a higher rent/purchase price, due to this increased demand.
These dense centers allow residents to commute to work, run errands, and participate in social activities, without
ever getting into a car or with limited vehicular travel.
TODs have the potential to solve many problems currently faced by communities, such as pollution, congestion,
income constraints, and access to a quality workforce. While TODs can be extraordinarily helpful in revitalizing an
area, the planning process for TOD is complex, and there are many aspects to consider. Guidelines created by the
Metropolitan Atlanta Rapid Transit Authority identified four core elements that are essential for TOD:
Dense station area relative to surroundings
Variety of uses that create a “24/7” place
Safe, attractive, and walkable public realm
Unconventional approach to parking design

Camoin Associates | Waterbury, CT Freight Street District Market Analysis 9
TOD Opportunities for the Freight Street District
The need for modern rental housing in downtown Waterbury is one of the
strongest market opportunities today and this demand is projected to continue.
TODs create a terrific opportunity for a mix of housing types, as they appeal to a
wide range of residents, from highly-paid workers, to senior citizens, to the
disabled.
TOD in the Freight Street District must be for everyone who needs or wants it. It
will require public-investment to achieve and, therefore, all segments of the
community should share in the benefits. Waterbury has a large transit-dependent
population of low-income families and the elderly, who need affordable housing
within walking distance of transit. As such, TOD in the Freight Street should strive
to offer both high-end “market leading” and affordable housing options that
appeal to people looking within a wide range of price points. In addition to
allowing access to a greater range of financial programs and incentives, this will
also create a diverse yet concentrated consumer base in terms of designing the
landscape of amenities and retail offerings. Types of uses and businesses to target
include:
Multifamily residential at a variety of price points
Small boutique shops and retail under 20,000 square feet
Grocery store offering high-quality specialty and ethnic foods as well as
ready-to-eat options
Multi-purpose movie theater that combine movie with other amenities (pub, lounge, etc.) and or specialty
programming
Restaurants, a mix of full-service and partial-service, offer outdoor seating
Offices of medical practitioners who require space in proximity to the city’s hospitals
Business services such as a print and copy center
Child care centers
Live-work space attractive for artists and makers
Entertainment and cultural space
Civic or community meeting space
Bed and breakfasts and lodging options
Public Wi-Fi
Though TODs revolve largely around the creation of density, it is also important to create a sense of place by
incorporating pocket parks, outdoor seating and visiting areas, and shelters for those awaiting transit. These
developments are pedestrian-oriented, as they are designed to alleviate the need for residents to own a car or
significantly reduce the need for travel by car. A mix of the above amenities coupled with well-designed
streetscaping and open-space planning will create walkability that attracts pedestrian traffic and encourages
spending.
“In recent years, a rising number
of innovative firms and talented
workers are choosing to
congregate and co-locate in
compact, amenity-rich enclaves
in the cores of central cities.
Rather than building on green-
field sites, marquee companies
in knowledge-intensive sectors
are locating key facilities close to
other firms, research labs, and
universities to promote idea-
sharing and practice “open
innovation.”
- The Rise of Innovation Districts:
A New Geography of Innovation
in America by Bruce Katz and
Julie Wagner
Camoin Associates | Waterbury, CT Freight Street District Market Analysis 10
Trends in TOD
Trends driving successful TOD projects including:
Quality transit service
density
availability of amenities
high degree of walkability
authenticity
telecommunications infrastructure
When considering how the Freight Street District can stand out among other options for businesses and residents, it
will be important to integrate amenities that ensure a high quality of life and work.
People and companies want to be in densely developed places. Between 2000 and 2015, the Smart Growth
America advocacy group found that of businesses that are adding jobs, more than half were moving their
operations from the suburbs into denser places while others were moving between downtown locations or
expanding within an existing downtown location. Connecticut is all too familiar with the negative side of this trend
with recent exits of several large employers. These growing companies were looking to be closer to other amenities
in areas that are dense and accessible. Particularly when working to attract and retain the millennial worker, it is
integral to have a workplace with access to walkable neighborhoods, transit, and recreational amenities.
Fewer people are moving for jobs and more jobs are moving to where the talent is.
When considering amenities, it is important that TODs are real, authentic, and vital places. The Urban Land
Institute’s research on what attracts creative and innovative people to regions suggests that attractive places don’t
need to be big cities, but need to be a place where you can sense the “interplay of culture and ideas, where
outsiders can quickly become insiders and anyone can find a peer group to be comfortable with and groups to be
stimulated by.” 1
The types of businesses and workers that would be a good fit for a TOD in Waterbury will be trending towards
modern, young establishments that are tech-forward, and attract a culturally diverse audience. Coffee shops/cafes,
brew pubs, co-working locations, business support operations, fitness studios, art and cultural venues,
neighborhood specialty groceries, and unique retail offerings will meet the needs of the employees, residents, and
other users of the TOD.
Gig infrastructure refers to super-fast, high-capacity broadband networks that deliver speeds measured in gigabits
as opposed to megabits. This type of infrastructure will allow all the residents and businesses to be able to realize
full function and interconnectivity of their tech tools but also support technological advances. Having the highest
speed internet available is in line with the city’s goal of making the Freight Street District play a critical role in
Waterbury’s Innovation Places strategy and could encourage people and businesses to locate in the District and to
be a part of the its future.
1 Source: (Florida, 2012)

Camoin Associates | Waterbury, CT Freight Street District Market Analysis 11
Benefits of TOD
Though the planning and implementation process for TODs may seem costly from both a financial perspective and a
often a political perspective, TODs have many long-term benefits for communities:
Increased Disposable Income | Relieving residents of the expense of owning and operating a vehicle
generates availability of disposable income, which is then spent in the TOD center.
Little Impact to Public School System | Despite the fact that dense residential developments would
seemingly put strain on public school systems, those that choose to live in TODs are usually smaller
household sizes; thus having little to no impact on cost to public schools.
Lower Infrastructure Costs | TOD lessens costs of infrastructure by eliminating the need for expansive
utilities that would be required for sprawling suburban development.
Environmental Sustainability | TOD reduces land area needed for development and, because it generates
less traffic than other development types, has a positive effect on air quality.
Creates Market Demand | Economic productivity is heightened by increased concentration of residents,
businesses, and workers due to greater market concentration and intensified competition.
Attract Talent and Innovative Firms | Companies looking for top-talent are increasingly seeking areas
with strong TOD assets and amenities.
While increasing service at the train station may seem like a momentous task, it is Waterbury’s greatest opportunity
to differentiate itself in the market and catalyst economic revitalization for the urban core, the city, and the western
Connecticut region as a whole.

Camoin Associates | Waterbury, CT Freight Street District Market Analysis 12
Additional Recommendations
Recognize the import role of small entrepreneurial developers.
Much of Waterbury’s recent success in securing private investment for redevelopment has been to market to large-
scale developers working in the northeast’s large metros such as New York and Baltimore and entice them with
comparatively lower construction and operating costs. Waterbury’s success with this approach will likely continue as
more developers are getting priced out of the region’s dominating metro’s and seek places they can have a larger,
more recognizable, impact.
However, in the context of large-scale redevelopment projects such as the Freight Street District, it is just as
important to recognize the role of smaller developers. This is because smaller firms tend to be more entrepreneurial
and innovative, allowing them to more easily address a range of immediate needs such as affordability, infill, and
attention to smaller market opportunities that larger firms are less interested in exploring.2
The biggest challenge is that capital can be harder to come by for smaller-scale projects. Webster Bank is a great
partner for smaller projects as they are intimately familiar with the local market conditions a well the City’s vision for
the future. Even so, private-sector funding alone is often not enough to make a small to mid-sized project financially
feasible and creative public-private partnerships are required.
Take advantage of the State’s new TIF legislation.
The State of Connecticut recently overhauled its Tax Increment Financing (TIF) legislation to make it more nimble
and easier to use (Connecticut Public Act No. 15-57). TIF creates a financing mechanism to support public and
private investment for economic growth. It uses anticipated future increases in property tax revenues to generate
incremental tax revenues from a specific development project or several projects across a designated district to help
pay for current costs associated with development. These costs can be public and/or private. When integrated
within a community’s economic development strategy, the community, region, and state all benefit.
Several municipalities throughout the State, like New Britain and Windsor Locks, have already approved TIF Districts
to spur economic development. Several more are working through the process currently, including the Town of
Groton, which is considering up to three TIF Districts. As TIF becomes more widely used in the State, the
development community will become more familiar with its use and begin to seek out communities willing to work
with them through TIF. If Waterbury is going to compete in the future, it should consider creating a TIF District at
the Freight Street District to catalyze development.
For additional information about what TIF is and how it can be used, refer to the Tax Increment Financing Guidebook:
A Beginner’s Guide to Using TIF in Connecticut’s Downtowns and Main Streets, issued by the Connecticut Main Street
Center.3
2 Source: Emerging Trends in Real Estate: US and Canada, 2017 https://www.pwc.com/us/en/asset-management/real-
estate/assets/pwc-emerging-trends-in-real-estate-2017.pdf 3 Tax Increment Financing Guidebook: A Beginner’s Guide to Using TIF in Connecticut Downtowns and Main Streets, June 2017.
http://ctmainstreet.org/wp-content/uploads/2017/06/TIF-Guidebook-FINAL-1.pdf
Camoin Associates | Waterbury, CT Freight Street District Market Analysis 13
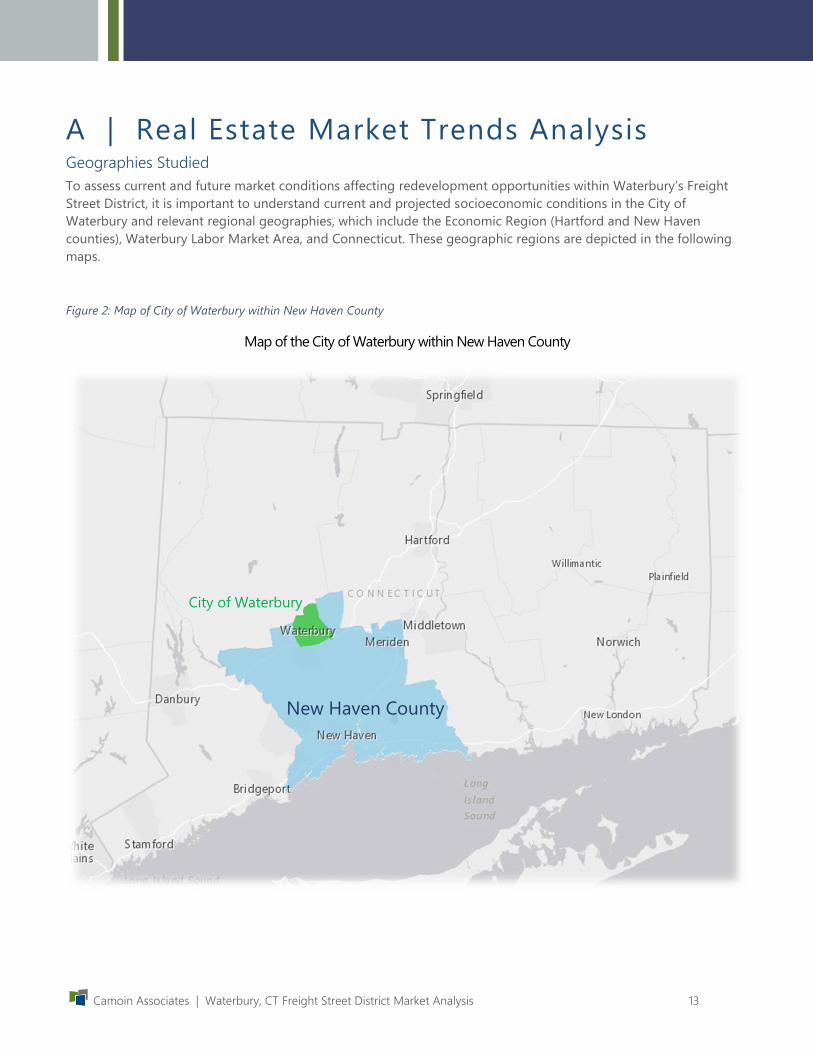
A | Real Estate Market Trends Analysis Geographies Studied
To assess current and future market conditions affecting redevelopment opportunities within Waterbury’s Freight
Street District, it is important to understand current and projected socioeconomic conditions in the City of
Waterbury and relevant regional geographies, which include the Economic Region (Hartford and New Haven
counties), Waterbury Labor Market Area, and Connecticut. These geographic regions are depicted in the following
maps.
Figure 2: Map of City of Waterbury within New Haven County
Map of the City of Waterbury within New Haven County
New Haven County
City of Waterbury

Camoin Associates | Waterbury, CT Freight Street District Market Analysis 14
The map below illustrates the City of Waterbury in relation to the Economic Region and Labor Market Area.
Figure 3: Map of City of Waterbury, Economic Region, and Waterbury Labor Market Area
Map of City of Waterbury, Economic Region, and Waterbury Labor Market Area
Economic Region Waterbury Labor Market Area

Camoin Associates | Waterbury, CT Freight Street District Market Analysis 15
Socioeconomic Profile Demographic data for the four geographies, the City of Waterbury, Waterbury Labor Market Area, Economic Region,
and State of Connecticut, provides context for the demographic and socioeconomic characteristics of the local
consumer and residential market.
Demographic Snapshot
On average, Waterbury residents earn significantly less than residents of the Labor Market Area, Economic Region,
and State of Connecticut. The average household size is similar in all four regions, ranging from 2.49 to 2.59. The
median age in Waterbury of 35.9 is lower than the other geographies.
Table 1: Demographic Profile, 2016
Population Trends
Population growth trends in the City and its benchmark geographies is relatively flat. Except for the city, all
geographies experienced slight population growth from 2010 to 2016, with 5-year growth rates ranging from 0.6%
to 1.6%. In that timeframe, Waterbury’s population decreased by 145 residents or 0.1%. All four geographies are
expected to remain relatively stable through 2021, with population growth ranging from 0.2% to 1.6%.
Table 2: Population Change
City of
Waterbury
Waterbury
Labor
Market Area
Economic
RegionConnecticut
Population 110,221 210,602 1,776,484 3,641,078
Households 42,160 80,162 689,091 1,388,422
Average Household Size 2.57 2.59 2.49 2.54
Median Age 35.9 39.7 40.5 41.0
Median Household Income $ 40,544 $ 54,557 $ 62,292 $ 69,694
Demographic Profile, 2016
Source: Esri
2010 2016 2021 (proj.) # Change % Change # Change % Change
City of Waterbury 110,366 110,221 110,414 -145 -0.1% 193 0.2%
Waterbury Labor
Market Area209,323 210,602 211,576 1,279 0.6% 974 0.5%
Economic Region 1,756,491 1,776,484 1,793,190 19,993 1.1% 16,706 0.9%
Connecticut 3,574,097 3,641,078 3,698,375 66,981 1.9% 57,297 1.6%
Population Change
Source: Esri
2011 - 2016 2016 - 2021

Camoin Associates | Waterbury, CT Freight Street District Market Analysis 16
Waterbury has a proportionately younger population than the other geographies, with proportionately more
residents ages 0 to 44 years old, and proportionately less 45 and older residents. The city’s population distribution
demonstrates that Waterbury is home to more young families and fewer retirees compared to other geographies.
Figure 4: Age Distribution, 2016
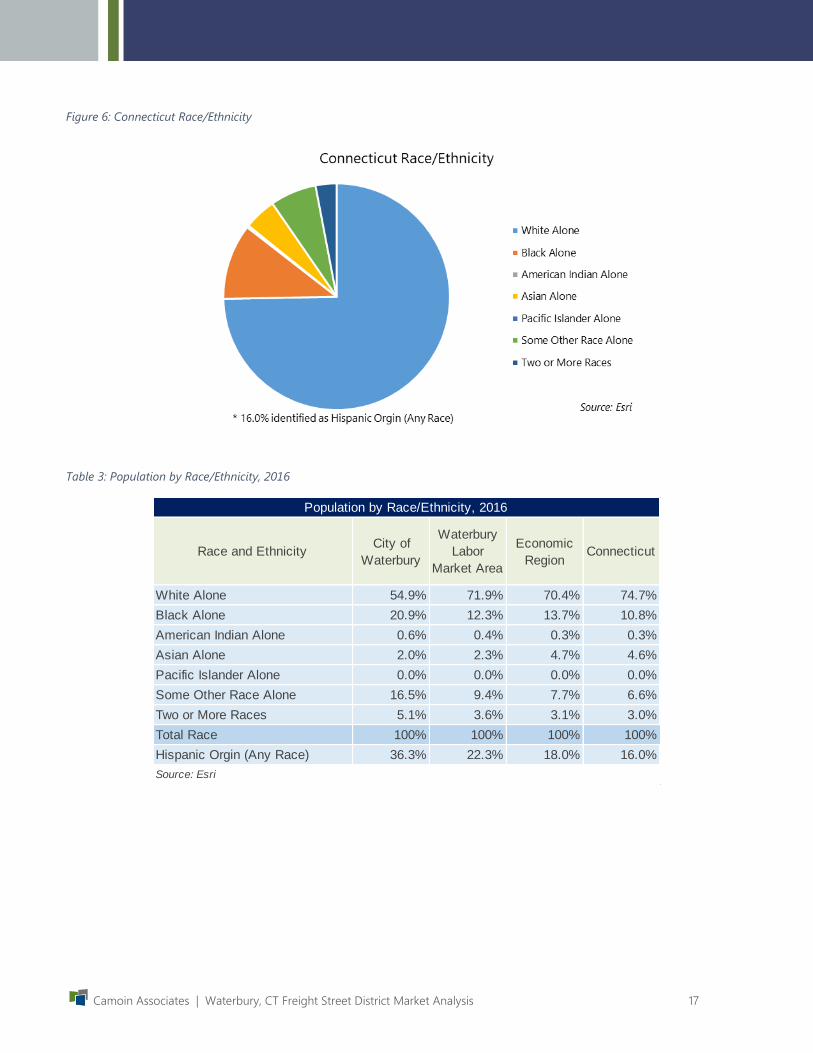
Waterbury is rich with racial and ethnic diversity. About 55% of the population is white, 21% is black and 16%
identifies as “some other race” not included in the broad categories on the Census. Additionally, over 36% of the
city’s population is Hispanic (ethnicity, includes all races), which will reach over 40% of the population by 2021. The
city’s diverse market can have implications for consumer preferences and needs for both retail/services and housing.
Figure 5: City of Waterbury Race/Ethnicity
Camoin Associates | Waterbury, CT Freight Street District Market Analysis 17
Figure 6: Connecticut Race/Ethnicity
Table 3: Population by Race/Ethnicity, 2016
Race and EthnicityCity of
Waterbury
Waterbury
Labor
Market Area
Economic
RegionConnecticut
White Alone 54.9% 71.9% 70.4% 74.7%
Black Alone 20.9% 12.3% 13.7% 10.8%
American Indian Alone 0.6% 0.4% 0.3% 0.3%
Asian Alone 2.0% 2.3% 4.7% 4.6%
Pacific Islander Alone 0.0% 0.0% 0.0% 0.0%
Some Other Race Alone 16.5% 9.4% 7.7% 6.6%
Two or More Races 5.1% 3.6% 3.1% 3.0%
Total Race 100% 100% 100% 100%
Hispanic Orgin (Any Race) 36.3% 22.3% 18.0% 16.0%
Source: Esri
Population by Race/Ethnicity, 2016

Camoin Associates | Waterbury, CT Freight Street District Market Analysis 18
Household Income
Household incomes in the City are considerably lower than the comparison geographies. Waterbury’s largest
income bracket is <$15,000, which accounts for 18.4% of households. Nearly 59% of Waterbury households have a
household income of less than $50,000.
Table 4: Household Income Distribution, 2016
Resident Education
In general, Waterbury has a lower educational attainment than the other geographies. Only 17% of Waterbury
residents 25 years or older have a bachelor’s degree or higher, compared to nearly 26% of the Labor Market Area,
37% of the economic region and 38% of the state.
Table 5: Population 25+ Educational Attainment, 2016
Income RangeCity of Waterbury
HouseholdsCity of Waterbury
Waterbury Labor
Market AreaEconomic Region Connecticut
<$15,000 7,757 18.4% 12.9% 10.8% 9.3%
$15,000 - $24,999 5,144 12.2% 9.3% 8.8% 7.8%
$25,000 - $34,999 5,257 12.5% 9.8% 9.0% 8.2%
$35,000 - $49,999 6,484 15.4% 14.0% 12.4% 11.8%
$50,000 - $74,999 7,452 17.7% 16.6% 15.6% 15.3%
$75,000 - $99,999 4,275 10.1% 12.6% 12.5% 12.6%
$100,000 - $149,999 3,871 9.2% 14.3% 15.8% 16.6%
$150,000 - $199,999 1,184 2.8% 6.3% 7.5% 8.2%
$200,000+ 736 1.7% 4.3% 7.5% 10.1%
Median Household Income $ 54,557 $ 62,292 $ 69,694 $ 40,544
Source: Esri
Household Income Distribution, 2016
City of
Waterbury
Waterbury
Labor Market
Area
Economic
RegionConnecticut
Less than 9th Grade 8.8% 6.0% 4.4% 4.1%
9th - 12th Grade, No Diploma 10.6% 7.7% 6.2% 5.7%
High School Graduate 30.9% 28.8% 25.3% 24.2%
GED/Alternative Credential 5.6% 4.3% 3.7% 3.3%
Some College, No Degree 18.6% 18.2% 17.1% 16.8%
Associate Degree 8.5% 9.1% 7.6% 7.5%
Bachelor's Degree 10.4% 14.9% 20.0% 21.5%
Graduate/Professional Degree 6.6% 10.9% 15.9% 16.9%
High School or Higher 75.0% 81.9% 85.9% 86.9%
Bachelor's Degree of Higher 17.0% 25.8% 35.9% 38.4%
Graduate/Professional Degree 6.6% 10.9% 15.9% 16.9%
Source: Esri
Summary
Population 25+ Educational Attainment, 2016

Camoin Associates | Waterbury, CT Freight Street District Market Analysis 19
UConn Waterbury campus has a total student body of approximately 900 undergraduate and graduate students,
many of which live in the city and surrounding communities.4 Another UConn campus, UConn Torrington, closed in
spring of 2016 and a small number of students transferred from the Torrington campus to Waterbury.
Crime Rates
We heard during the stakeholder interviews that existing and perceived crime is a significant issue, and this
perception is well-supported by the data. Of the 10 largest cities in Connecticut, Waterbury has the third highest
crime rate overall (including violent and property crimes). With a crime index of 8, Waterbury is safer than only 8%
of cities in the U.S. as a whole.
Table 6: Crime Rates of 10 Largest Cities in CT, 2015
4 http://today.uconn.edu/2016/04/uconn-torrington-to-close-due-to-low-enrollment/
Violent Property Total
City of Hartford 4 11.46 44.12 55.58 124,000
City of New Haven 6 9.12 41.70 50.82 130,000
City of Waterbury 8 4.29 41.58 45.87 110,000
City of New Britain 16 3.79 28.99 32.78 73,000
City of Bridgeport 19 6.75 23.68 30.43 148,000
City of Meriden 23 3.28 24.00 27.29 60,000
City of Bristol 33 1.29 20.15 21.44 60,000
City of Norwalk 34 2.70 18.39 21.09 88,000
City of Danbury 41 1.85 16.43 18.29 85,000
City of Stamford 45 2.21 14.50 16.71 129,000
State of Connecticut N/A 2.18 18.12 20.30 3.6 M
Crime
Index*
Annual Crimes per 1,000 ResidentsCommunity
Source: Neighborhood Scout Crime Data based on Federal Bureau of Investigation (FBI) and local
police agency reports.
*Crime Index: 100 is safest. A rate of 25% means the community is safer than 25% of U.S. cities.
Population
Crime Rates of 10 Largest Cities in CT, 2015

Camoin Associates | Waterbury, CT Freight Street District Market Analysis 20
Commuting Patterns & Labor Shed
Waterbury
In 2014, the most recent release date for OnTheMap Census data, there were about 38,500 primary jobs in the City
of Waterbury. About 26,000 workers commute to Waterbury for their primary employment from geographies
outside of the city such as Watertown (5.6%), Naugatuck (4.3%), Wolcott (4.1%) and various other towns/cities. This
group makes up most of the labor pool (69%). About 31% (12,981) of Waterbury workers live within the city limits.
Approximately 29,000 Waterbury residents commute out of Waterbury for their primary job. Residents commute to
Cheshire (4.5%), Watertown (4.1%), Naugatuck (3.1%) and various other towns/cities.
The local labor shed is relatively small; over half of Waterbury residents commute less than 10 miles to their jobs.
Approximately 30% travel 10 – 24 miles to work, nearly 11% travel 25-50 miles, and a slightly over 7% travel over 50
miles to work. Those traveling over 50 miles are traveling northeast and southeast.
Figure 7: Waterbury Primary Jobs, 2014
Waterbury Primary Jobs, 2014
Source: U.S. Census OnTheMap

Camoin Associates | Waterbury, CT Freight Street District Market Analysis 21
Table 7: Where Waterbury Workers Live, 2014
Table 8: Where Waterbury Residents Work, 2014
City or Town Count Share
Waterbury Town 12,821 33.3%
Watertown Town 2,173 5.6%
Naugatuck Town 1,655 4.3%
Wolcott Town 1,573 4.1%
Bristol Town 873 2.3%
Southington Town 844 2.2%
Prospect Town 803 2.1%
Meriden Town 790 2.1%
Cheshire Town 695 1.8%
Torrington Town 656 1.7%
All Other Locations 15,636 40.6%
Total 38,519 100.0%
Top 10 Cities and Towns Where Waterbury Workers
Live, 2014
Source: U.S. Census OnTheMap
City or Town Count Share
Waterbury Town 12,821 30.9%
Cheshire Town 1,845 4.5%
Watertown Town 1,694 4.1%
Naugatuck Town 1,278 3.1%
Hartford Town 1,121 2.7%
New Haven Town 966 2.3%
Danbury Town 878 2.1%
Manhattan Borough 871 2.1%
Southington Town 818 2.0%
Wallingford Town 737 1.8%
All Other Locations 18,408 44.4%
Total 41,437 100.0%
Top 10 Cities and Towns Where Waterbury
Residents Work, 2014
Source: U.S. Census OnTheMap

Camoin Associates | Waterbury, CT Freight Street District Market Analysis 22
Figure 8: Job Counts by Distance/Direction in 2014, All Workers
Freight Street District
Commuting patterns of the Freight Street District were examined using a one-mile radius from the center of Freight
Street. Out of the 19,204 workers employed within a one-mile radius of Freight Street, 1,120 (6%) both lived and
worked within this area and 18,084 (94%) lived outside the area. Approximately, 6,445 individuals with primary jobs
live and work within the one-mile radius. Of those residents 5,325 (83%) individuals living within this radius but are
employed outside the region.
Figure 9: Freight Street District Primary Jobs, 2014
Freight Street District Primary Jobs, 2014
Source: U.S. Census OnTheMap

Camoin Associates | Waterbury, CT Freight Street District Market Analysis 23
Industry Growth Overview
The table below provides an overview of the City of Waterbury’s job growth by 2-digit industry sector over the 2010
to 2016-time period, sorted by 2010-2016 job growth. Educational Services added the most jobs during this time
period (1,285 jobs), followed by Health Care and Social Assistance (640 jobs). Average earnings in Educational
Services and Health Care and Social Assistance industries are significantly above average for the city at
approximately $72,300 and $66,000 respectively. 5
Other industries with notable growth include Accommodation and Food Services (300 jobs), Finance and Insurance
(200 jobs), Administrative and Support and Waste Management Services (180 jobs), and Arts, Entertainment, and
Recreation (140 jobs).
Industries experiencing job decline from 2010 to 2016 include Information, Mining, Quarrying, and Oil and Gas
Extraction, Government, Wholesale Trade, and Professional, Scientific, and Technical Services.
Table 9: Growth in Waterbury Industries, 2-Digit NAICS, 2010 – 2016
5 Note that average earnings per job in Waterbury are significantly higher than median household income due to well-paying
employees living outside the city and commuting in for work. This represents an opportunity for Waterbury to capture some of
these commuters who prefer to live in a more urban setting but the residential options don’t exist yet.
NAICS Description 2010 Jobs 2016 Jobs2010 - 2016
Change
2010 - 2016
% Change
Average
Earnings
per Job
61 Educational Services 6,365 7,650 1,285 20% $ 72,342
62 Health Care and Social Assistance 12,775 13,414 639 5% $ 65,947
72 Accommodation and Food Services 2,480 2,794 314 13% $ 21,890
52 Finance and Insurance 578 780 202 35% $ 83,209
56Administrative and Support and Waste Management
and Remediation Services1,576 1,758 182 12% $ 42,417
71 Arts, Entertainment, and Recreation 431 570 139 32% $ 23,229
48 Transportation and Warehousing 546 645 99 18% $ 58,639
31 Manufacturing 3,700 3,798 98 3% $ 72,555
22 Utilities 147 211 64 44% $ 145,102
81 Other Services (except Public Administration) 1,752 1,797 45 3% $ 31,832
44 Retail Trade 6,136 6,168 32 1% $ 34,891
23 Construction 1,007 1,037 30 3% $ 62,374
53 Real Estate and Rental and Leasing 411 426 15 4% $ 49,038
55 Management of Companies and Enterprises 57 66 9 16% $ 232,544
21 Mining, Quarrying, and Oil and Gas Extraction 18 17 (1) (6%) $ 112,327
54 Professional, Scientific, and Technical Services 1,211 1,196 (15) (1%) $ 85,042
42 Wholesale Trade 735 711 (24) (3%) $ 80,751
51 Information 673 469 (204) (30%) $ 62,918
90 Government 7,120 6,869 (251) (4%) $ 80,881
11 Crop and Animal Production 13 <10 Insf. Data Insf. Data Insf. Data
99 Unclassified Industry <10 <10 Insf. Data Insf. Data Insf. Data
47,736 50,388 2,652 6.0% $ 61,836 Total
Job Growth in Waterbury Industries, 2-Digit NAICS, 2010 - 2016
Source: EMSI

Camoin Associates | Waterbury, CT Freight Street District Market Analysis 24
The table below shows the top 25, 6-digit industry sectors by number of jobs added from 2010 to 2016. The top
sub-sectors align with the growing 2-digit sectors around health, education, and finance. Additionally, at the 6-digit
level, job growth in restaurant and food manufacturing industries rises among the strongest sectors.
Table 10: Growth in Waterbury Industries, Top 25 6-Digit NAICS, 2010 - 2016
NAICS Description 2010 Jobs 2016 Jobs2010 - 2016
Change
2010 - 2016
% Change
Average
Earnings
per Job
611310 Colleges, Universities, and Professional Schools 5859 7,091 1232 21% $ 74,201
624120 Services for the Elderly and Persons with Disabilities 492 722 230 47% $ 26,422
623220Residential Mental Health and Substance Abuse
Facilities325 535 210 65% $ 46,121
311999 All Other Miscellaneous Food Manufacturing 91 245 154 169% $ 48,763
522110 Commercial Banking 166 300 134 81% $ 87,930
621910 Ambulance Services 159 291 132 83% $ 47,218
722513 Limited-Service Restaurants 897 1,025 128 14% $ 18,384
722511 Full-Service Restaurants 925 1,040 115 12% $ 23,620
561110 Office Administrative Services 63 178 115 183% $ 105,567
713940 Fitness and Recreational Sports Centers 222 324 102 46% $ 20,038
485999All Other Transit and Ground Passenger
Transportation16 114 98 613% $ 47,279
561320 Temporary Help Services 806 899 93 12% $ 30,756
332119Metal Crown, Closure, and Other Metal Stamping
(except Automotive)588 676 88 15% $ 70,783
903611Elementary and Secondary Schools (Local
Government)2785 2,867 82 3% $ 77,382
452990 All Other General Merchandise Stores 97 176 79 81% $ 23,386
902622 Hospitals (State Government) 0 77 77 Insf. Data $ 122,547
621420Outpatient Mental Health and Substance Abuse
Centers239 312 73 31% $ 58,590
522390 Other Activities Related to Credit Intermediation 21 92 71 338% $ 62,995
452112 Discount Department Stores 697 767 70 10% $ 24,578
445110Supermarkets and Other Grocery (except
Convenience) Stores910 970 60 7% $ 32,058
814110 Private Households 91 145 54 59% $ 14,435
452910 Warehouse Clubs and Supercenters 206 259 53 26% $ 38,625
621210 Offices of Dentists 419 470 51 12% $ 68,999
611110 Elementary and Secondary Schools 330 379 49 15% $ 57,424
623210Residential Intellectual and Developmental Disability
Facilities255 301 46 18% $ 33,174
Job Growth in Waterbury Industries, Top 25 6-Digit NAICS, 2010 - 2016
Source: EMSI
Camoin Associates | Waterbury, CT Freight Street District Market Analysis 25
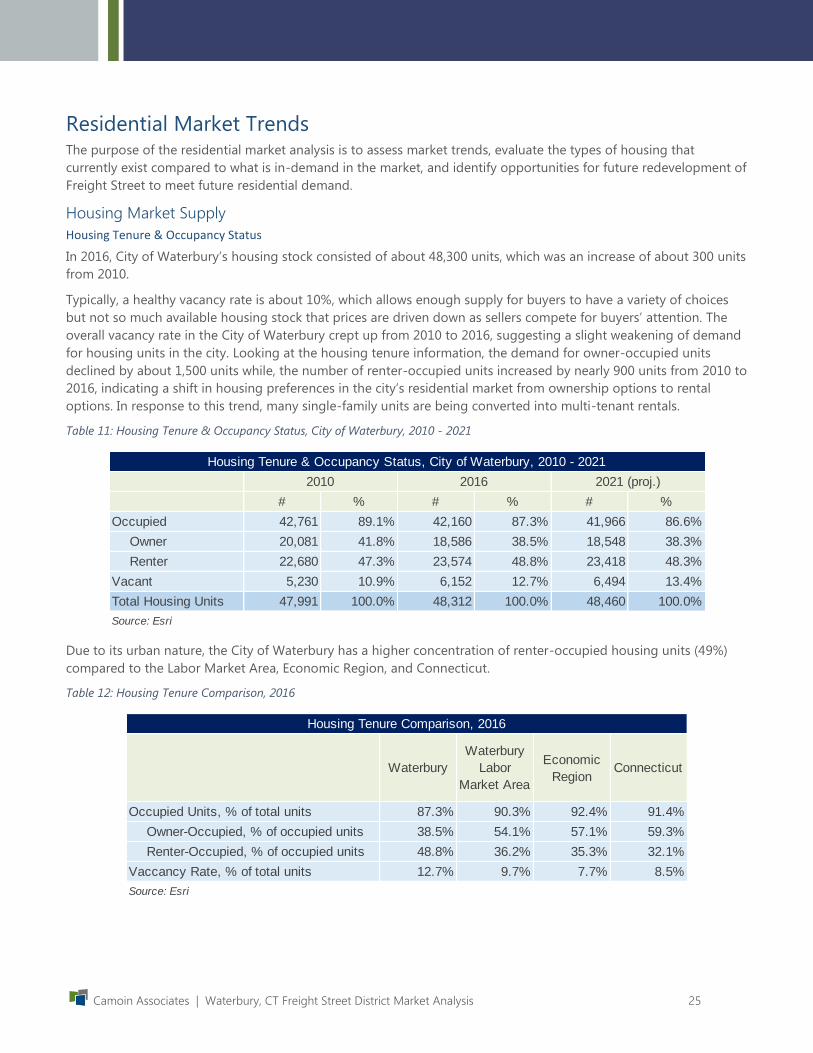
Residential Market Trends The purpose of the residential market analysis is to assess market trends, evaluate the types of housing that
currently exist compared to what is in-demand in the market, and identify opportunities for future redevelopment of
Freight Street to meet future residential demand.
Housing Market Supply
Housing Tenure & Occupancy Status
In 2016, City of Waterbury’s housing stock consisted of about 48,300 units, which was an increase of about 300 units
from 2010.
Typically, a healthy vacancy rate is about 10%, which allows enough supply for buyers to have a variety of choices
but not so much available housing stock that prices are driven down as sellers compete for buyers’ attention. The
overall vacancy rate in the City of Waterbury crept up from 2010 to 2016, suggesting a slight weakening of demand
for housing units in the city. Looking at the housing tenure information, the demand for owner-occupied units
declined by about 1,500 units while, the number of renter-occupied units increased by nearly 900 units from 2010 to
2016, indicating a shift in housing preferences in the city’s residential market from ownership options to rental
options. In response to this trend, many single-family units are being converted into multi-tenant rentals.
Table 11: Housing Tenure & Occupancy Status, City of Waterbury, 2010 - 2021
Due to its urban nature, the City of Waterbury has a higher concentration of renter-occupied housing units (49%)
compared to the Labor Market Area, Economic Region, and Connecticut.
Table 12: Housing Tenure Comparison, 2016
# % # % # %
Occupied 42,761 89.1% 42,160 87.3% 41,966 86.6%
Owner 20,081 41.8% 18,586 38.5% 18,548 38.3%
Renter 22,680 47.3% 23,574 48.8% 23,418 48.3%
Vacant 5,230 10.9% 6,152 12.7% 6,494 13.4%
Total Housing Units 47,991 100.0% 48,312 100.0% 48,460 100.0%
Source: Esri
Housing Tenure & Occupancy Status, City of Waterbury, 2010 - 2021
2010 2016 2021 (proj.)
Waterbury
Waterbury
Labor
Market Area
Economic
RegionConnecticut
Occupied Units, % of total units 87.3% 90.3% 92.4% 91.4%
Owner-Occupied, % of occupied units 38.5% 54.1% 57.1% 59.3%
Renter-Occupied, % of occupied units 48.8% 36.2% 35.3% 32.1%
Vaccancy Rate, % of total units 12.7% 9.7% 7.7% 8.5%
Housing Tenure Comparison, 2016
Source: Esri

Camoin Associates | Waterbury, CT Freight Street District Market Analysis 26
Structure & Age
Most of the city’s housing stock consists of single-family detached units (36%, 17,250 units) and 3 or 4 unit
structures (21%, 10,200 units). Overall, approximately 60% of Waterbury’s housing stock consists of multifamily
homes. Waterbury offers a different mix of housing units compared to the other geographies, which are dominated
by single-family homes in more suburban settings.
Table 13: Housing by Units in Structure, 2014
Waterbury’s housing stock is quite old. Over 32% of Waterbury’s housing stock was built in 1939 or earlier,
compared to 25% in the Labor Market Area, 23% in the Economic Region, and 22% in the State. There has been very
little new residential construction in the city over the last 20 years, which suggests a lack of modern housing options
for potential buyers in the market.
Table 14: Housing by Year Built
Waterbury Labor
Market AreaEconomic Region Connecticut
Count % % % %
1, detached 17,250 36.0% 53.5% 54.3% 59.2%
1, attached 1,868 3.9% 4.3% 5.6% 5.4%
2 5,214 10.9% 9.1% 8.7% 8.1%
3 or 4 10,211 21.3% 13.6% 10.6% 9.0%
5 to 9 4,882 10.2% 7.6% 6.2% 5.5%
10 to 19 3,042 6.3% 4.5% 4.3% 3.7%
20 to 49 2,077 4.3% 2.7% 4.2% 3.5%
50 or more 3,353 7.0% 4.1% 5.5% 4.9%
Mobile home 73 0.2% 0.7% 0.6% 0.8%
Boat, RV, van, etc. 13 0.0% 0.0% 0.0% 0.0%
Total 47,983 100.0% 100.0% 100.0% 100.0%
Source: ACS, 2014 5 year estimates
WaterburyNumber of Units in
Structure
Housing by Units in Structure, 2014
Waterbury Labor
Market AreaEconomic Region Connecticut
Count % % % %
Built 2010 or later 21 0.0% 0.3% 0.4% 0.5%
Built 2000 to 2009 1,346 2.8% 5.7% 5.9% 7.0%
Built 1990 to 1999 2,734 5.7% 7.6% 7.1% 7.6%
Built 1980 to 1989 6,545 13.6% 13.6% 12.9% 13.0%
Built 1970 to 1979 5,714 11.9% 13.1% 13.0% 13.4%
Built 1960 to 1969 4,964 10.3% 11.4% 13.4% 13.4%
Built 1950 to 1959 7,557 15.7% 16.1% 16.6% 15.6%
Built 1940 to 1949 3,709 7.7% 7.3% 7.8% 7.0%
Built 1939 or earlier 15,393 32.1% 24.9% 22.9% 22.4%
Total 47,983 100.0% 100% 100% 100%
Median Year Structure Built 1961 1962 1964
Source: ACS, 2014 5 year estimates
1956
Housing by Year Built
Number of Units in StructureWaterbury

Camoin Associates | Waterbury, CT Freight Street District Market Analysis 27
Price Points
Waterbury’s owner-occupied home values are relatively low compared to the benchmark geographies. The median
home value in the city is $150,000 compared to $284,000 in the state.
Table 15: Home Values of Owner-Occupied Units, 2016
Waterbury’s low home values don’t necessarily equate to affordability. When considering owner-occupied housing
costs, property taxes must be considered as part of that cost. The City of Waterbury has among the highest property
tax rates in the state, second only to Hartford. This has implications for not only residential ownership but drives up
costs for new construction and business expansion.
Waterbury Labor
Market AreaEconomic Region Connecticut
Count % % % %
<$50,000 984 5.3% 4.8% 3.7% 3.5%
$50,000 - $99,999 2,210 11.9% 6.3% 3.5% 3.1%
$100,000 - $149,999 6,092 32.8% 18.1% 10.4% 8.1%
$150,000 - $199,999 5,070 27.3% 18.7% 16.8% 13.4%
$200,000 - $249,999 2,452 13.2% 13.9% 16.2% 13.6%
$250,000 - $299,999 929 5.0% 10.7% 13.9% 12.3%
$300,000 - $399,999 464 2.5% 13.5% 17.2% 17.3%
$400,000 - $499,999 186 1.0% 7.5% 8.6% 9.9%
$500,000 - $749,999 93 0.5% 4.3% 6.3% 9.3%
$750,000 - $999,999 37 0.2% 1.2% 1.9% 4.4%
$1,000,000 + 56 0.3% 1.0% 1.4% 5.2%
Median Home Value $ 208,600 $ 247,752 $ 283,972
Average Home Value $ 251,641 $ 293,380 $ 367,818
Waterbury
Home Values of Owner-Occupied Units, 2016
Home Value
$ 150,034
Source: Esri
$ 163,930
Municipality FY 2017 Mill Rate
Hartford 74.29
Waterbury 60.21
Bridgeport 54.37
Norwich, City of (Paid Fire) (CCD) 49.06
Naugatuck 47.67
East Hartford 45.86
Torrington 45.75
Manchester - Special 45.51
Hamden 45.36
Norwich City (Vol Fire)(Town)(TCD) 41.69
Municipalities with Highest Mill Rates in Connecticut
Source: CT Office of Policy & Management,
http://www.ct.gov/opm/cwp/view.asp?a=2987&q=385976
Camoin Associates | Waterbury, CT Freight Street District Market Analysis 28
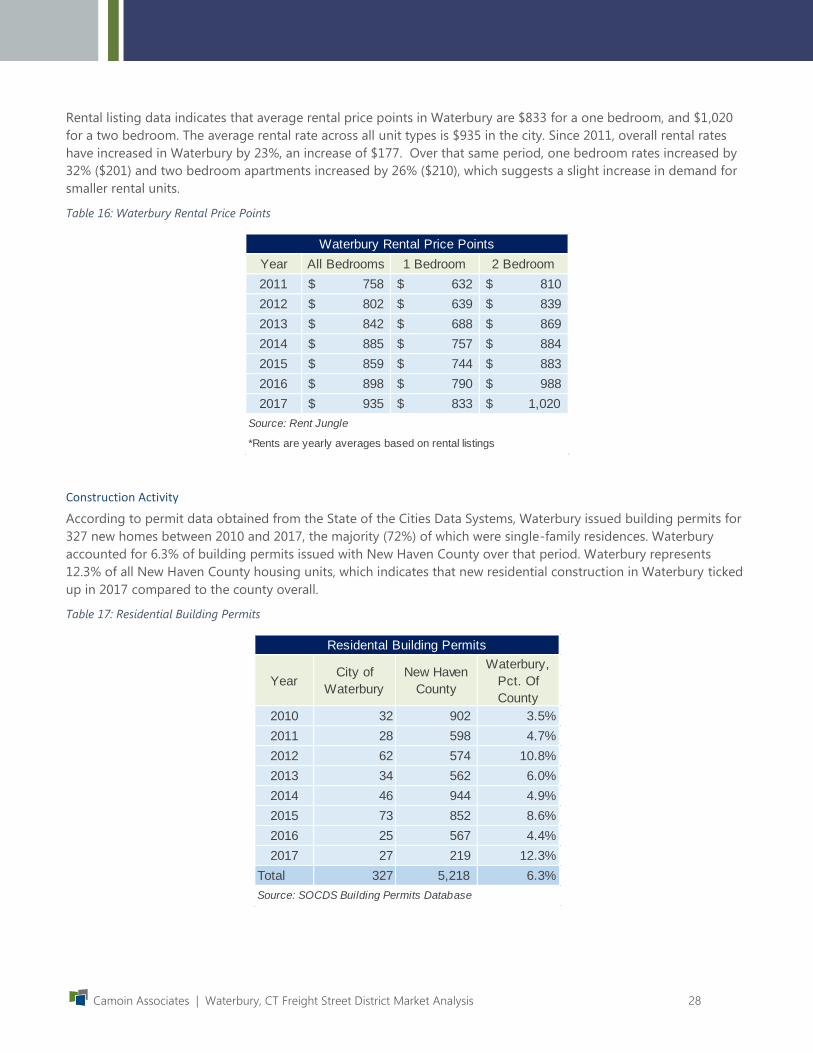
Rental listing data indicates that average rental price points in Waterbury are $833 for a one bedroom, and $1,020
for a two bedroom. The average rental rate across all unit types is $935 in the city. Since 2011, overall rental rates
have increased in Waterbury by 23%, an increase of $177. Over that same period, one bedroom rates increased by
32% ($201) and two bedroom apartments increased by 26% ($210), which suggests a slight increase in demand for
smaller rental units.
Table 16: Waterbury Rental Price Points
Construction Activity
According to permit data obtained from the State of the Cities Data Systems, Waterbury issued building permits for
327 new homes between 2010 and 2017, the majority (72%) of which were single-family residences. Waterbury
accounted for 6.3% of building permits issued with New Haven County over that period. Waterbury represents
12.3% of all New Haven County housing units, which indicates that new residential construction in Waterbury ticked
up in 2017 compared to the county overall.
Table 17: Residential Building Permits
Year All Bedrooms 1 Bedroom 2 Bedroom
2011 $ 758 $ 632 $ 810
2012 $ 802 $ 639 $ 839
2013 $ 842 $ 688 $ 869
2014 $ 885 $ 757 $ 884
2015 $ 859 $ 744 $ 883
2016 $ 898 $ 790 $ 988
2017 $ 935 $ 833 $ 1,020
Waterbury Rental Price Points
Source: Rent Jungle
*Rents are yearly averages based on rental listings
YearCity of
Waterbury
New Haven
County
Waterbury,
Pct. Of
County
2010 32 902 3.5%
2011 28 598 4.7%
2012 62 574 10.8%
2013 34 562 6.0%
2014 46 944 4.9%
2015 73 852 8.6%
2016 25 567 4.4%
2017 27 219 12.3%
Total 327 5,218 6.3%
Residental Building Permits
Source: SOCDS Building Permits Database

Camoin Associates | Waterbury, CT Freight Street District Market Analysis 29
Multifamily Properties
CoStar was used to identify market conditions for multifamily properties, classified as properties with at least 20
units, in the City of Waterbury. Currently there are 7,460 multifamily units within the City of Waterbury, of those 205
are vacant for a vacancy rate of 2.9%.
Absorption of units over the past 12-months was over 100 units, compared to the 5-year average of 16. This uptick
in absorption is primarily related to the newly renovated Brown Building, which offers off-campus housing for the
college student market.6
Asking rents for these larger multi-unit properties are slightly higher than the rents noted above for the overall
market. This suggests that the city’s larger, 20+ unit structures are more attractive in the market. This could be due
to better quality, location, or other differentiating characteristics of these properties that allow them to command
higher rents. In a market of this size, even one relatively large project, like the Brown Building, can positively affect
the data.
According to the CoStar data, there is little activity in the Waterbury market for large multi-unit projects. No new
20+ unit multifamily properties have been delivered within the last 12 months and there is only one project under
construction – a 48-unit complex called Oak Hill Woods.
Table 18: City of Waterbury Multifamily Properties
City of Waterbury Multifamily Properties
Source: CoStar
6 The Brown Building Student Living; http://brownbuildingliving.com/
Camoin Associates | Waterbury, CT Freight Street District Market Analysis 30
Projection of Residential Demand
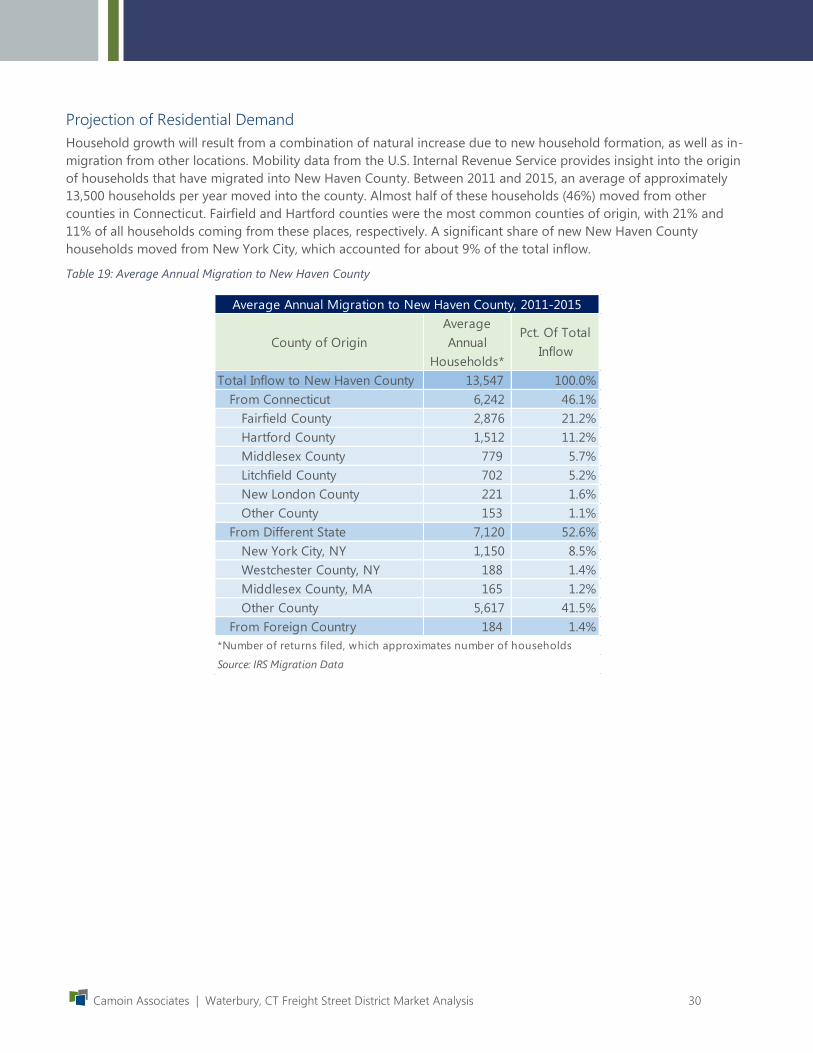
Household growth will result from a combination of natural increase due to new household formation, as well as in-
migration from other locations. Mobility data from the U.S. Internal Revenue Service provides insight into the origin
of households that have migrated into New Haven County. Between 2011 and 2015, an average of approximately
13,500 households per year moved into the county. Almost half of these households (46%) moved from other
counties in Connecticut. Fairfield and Hartford counties were the most common counties of origin, with 21% and
11% of all households coming from these places, respectively. A significant share of new New Haven County
households moved from New York City, which accounted for about 9% of the total inflow.
Table 19: Average Annual Migration to New Haven County
County of Origin
Average
Annual
Households*
Pct. Of Total
Inflow
Total Inflow to New Haven County 13,547 100.0%
From Connecticut 6,242 46.1%
Fairfield County 2,876 21.2%
Hartford County 1,512 11.2%
Middlesex County 779 5.7%
Litchfield County 702 5.2%
New London County 221 1.6%
Other County 153 1.1%
From Different State 7,120 52.6%
New York City, NY 1,150 8.5%
Westchester County, NY 188 1.4%
Middlesex County, MA 165 1.2%
Other County 5,617 41.5%
From Foreign Country 184 1.4%
Average Annual Migration to New Haven County, 2011-2015
Source: IRS Migration Data
*Number of returns filed, which approximates number of households

Camoin Associates | Waterbury, CT Freight Street District Market Analysis 31
This analysis projects demand for residential units in the study area and focuses on demand for market-rate units.
As such, we examine the projected change in all households, and households with an income of at least $50,000, a
reasonable minimum income required for a household to afford to rent or purchase a market-rate unit. The
standard rule for lenders is that a monthly housing payment (principal, interest, taxes, and insurance or rent
payments) should not take up more than 28% of household income before taxes. Applying this rule, we estimated
housing expenditures that each income bracket can afford, shown in the green columns in the tables below.
According to population projections from Esri, by 2022 the City of Waterbury is expected to lose on net about 70
households. However, most of this loss is in the lower household income ranges and the city is expected to gain on
net nearly 1,000 households with incomes of at least $50,000, with the highest growth in number of households in
the $100,000 to $149,000 income group. In terms of age, high growth cohorts will be the 25-34, 35-44, and 65-74
cohorts. The 55-64 and 75+ household cohorts will also see a notable expansion.
Table 20: Projected Change in Households, City of Waterbury, 2017-2022
Household Income
Range / Age of
Householder
<25 25-34 35-44 45-54 55-64 65-74 75+ Total
Affordable
Housing
Expenditures*
Affordable
Monthly Housing
Expenditures
$15,000-$24,999 (50) (18) (56) (111) (52) 22 44 (221) $4,200 $350
$25,000-$34,999 (57) (52) (58) (133) (68) 20 (8) (356) $7,000 $583
$35,000-$49,999 (35) (51) (100) (188) (116) 22 (4) (472) $9,800 $817
$50,000-$74,999 (31) (92) (114) (308) (152) 14 (14) (697) $14,000 $1,167
$75,000-$99,999 10 26 21 (77) (18) 49 34 45 $21,000 $1,750
$100,000-$149,999 6 166 234 128 181 137 54 906 $28,000 $2,333
$150,000-$199,999 0 75 107 82 90 58 19 431 $42,000 $3,500
$200,000+ 0 38 73 56 62 52 12 293 $56,000 $4,667
Total (157) 92 107 (551) (73) 374 137 (71) - -
$50,000+ Market (15) 213 321 (119) 163 310 105 978 - -
* Assumed industry standard of 28% of household income dedicated to housing costs (low-end of income range)
Source: Esri
Projected Change in Households, City of Waterbury, 2017-2022

Camoin Associates | Waterbury, CT Freight Street District Market Analysis 32
The Waterbury Labor Market Area is projected to experience a net loss of about 200 households by 2022; however,
the number of households with incomes of $50,000 and above are expected to experience a net gain of about 1,800
households. This growth will be driven by high-income households making above $100,000. Increase in these high-
earning households are expected to more than compensate for the projected decrease in households in the $75,000
to $99,000 range. The highest growth in households will be in the 65-74 and 35-44 age cohorts. The 45-54 cohort
will see the most significant contraction.
Table 21: Projected Change in Households, Waterbury Labor Market Area, 2017-2022
Household Income
Range / Age of
Householder
<25 25-34 35-44 45-54 55-64 65-74 75+ Total
Affordable
Housing
Expenditures*
Affordable
Monthly Housing
Expenditures
$15,000-$24,999 (57) (25) (98) (197) (135) 8 123 (381) $4,200 $350
$25,000-$34,999 (76) (80) (103) (250) (146) 14 36 (605) $7,000 $583
$35,000-$49,999 (52) (114) (209) (401) (275) 9 68 (974) $9,800 $817
$50,000-$74,999 (67) (190) (268) (703) (400) (26) 11 (1,643) $14,000 $1,167
$75,000-$99,999 17 15 (52) (382) (141) 109 92 (342) $21,000 $1,750
$100,000-$149,999 6 269 353 (131) 225 315 179 1,216 $28,000 $2,333
$150,000-$199,999 (1) 183 330 166 360 287 90 1,415 $42,000 $3,500
$200,000+ 1 103 261 115 264 272 99 1,115 $56,000 $4,667
Total (229) 161 214 (1,783) (248) 988 698 (199) - -
$50,000+ Market (44) 380 624 (935) 308 957 471 1,761 - - Source: Esri
Projected Change in Households, Waterbury Labor Market Area, 2017-2022
* Assumed industry standard of 28% of household income dedicated to housing costs (low-end of income range)

Camoin Associates | Waterbury, CT Freight Street District Market Analysis 33
The most logical use for the study site in terms of residential use would be mid to high-rise multifamily housing
units, given the site’s proximity to downtown and strategic location for potential transit-oriented development.
Therefore, the target demographic for future residents should be narrowed to those who prefer a relatively high
density, mixed-use, walkable environment; those with a preference for single-family homes in a suburban setting
would not be a good fit.
Camoin Associates employed Esri Tapestry Segmentation to identify targeted demographic groups that would be
likely to choose higher-density housing. Tapestry segmentation provides an accurate, detailed description of
America's neighborhoods. U.S. residential areas are divided into 67 distinctive segments based on their
socioeconomic and demographic composition and then further classified into LifeMode and Urbanization Groups.
LifeMode groups represent markets that share a common experience—born in the same generation or immigration
from another country—or a significant demographic trait, like affluence. Urbanization groups are based on
geographic locale, from rural to urban.
The primary target group who would seek the sort of housing that the study area would support includes tapestry
segments that fall within the Principal Urban Center urbanization group. Secondary segments are those that fall
within the urbanization groups: Urban Periphery and Metro Cities.7
Households in the primary target groups tend to be successful and/or upwardly mobile singles and married couples
with a penchant for urban living – either in the urban core or city neighborhoods. Secondary segments include
groups with similar living preferences, but in less-dense city neighborhoods outside of the urban core or “main
street”.
To project future demand for high-
density housing, we determined the
future growth in households in the
$50,000+ income range, falling within the
primary and secondary target groups in
the City of Waterbury, the Waterbury
Labor Market Area (excluding the city),
and the 3-county region that includes
Fairfield, Hartford, and New Haven
counties (excludes the City and Labor
Market Area). These geographic areas
were determined to be the primary origin
of Waterbury households based on
demographic trends and mobility
patterns data.
It was assumed that new household
growth would be consistent with the
current tapestry segmentation
breakdown for each geography.
7 For a comprehensive list of tapestry segments within each urbanization group, refer to 2017 Demographic Profile by
Urbanization Group: http://downloads.esri.com/esri_content_doc/dbl/us/2017_Tapestry_Urbanization_Group_Summary_Tables.pdf
Figure 10: Total Inbound Migration Flows for New Haven County, CT, 2011-2015
Source: Census Flows Mapper
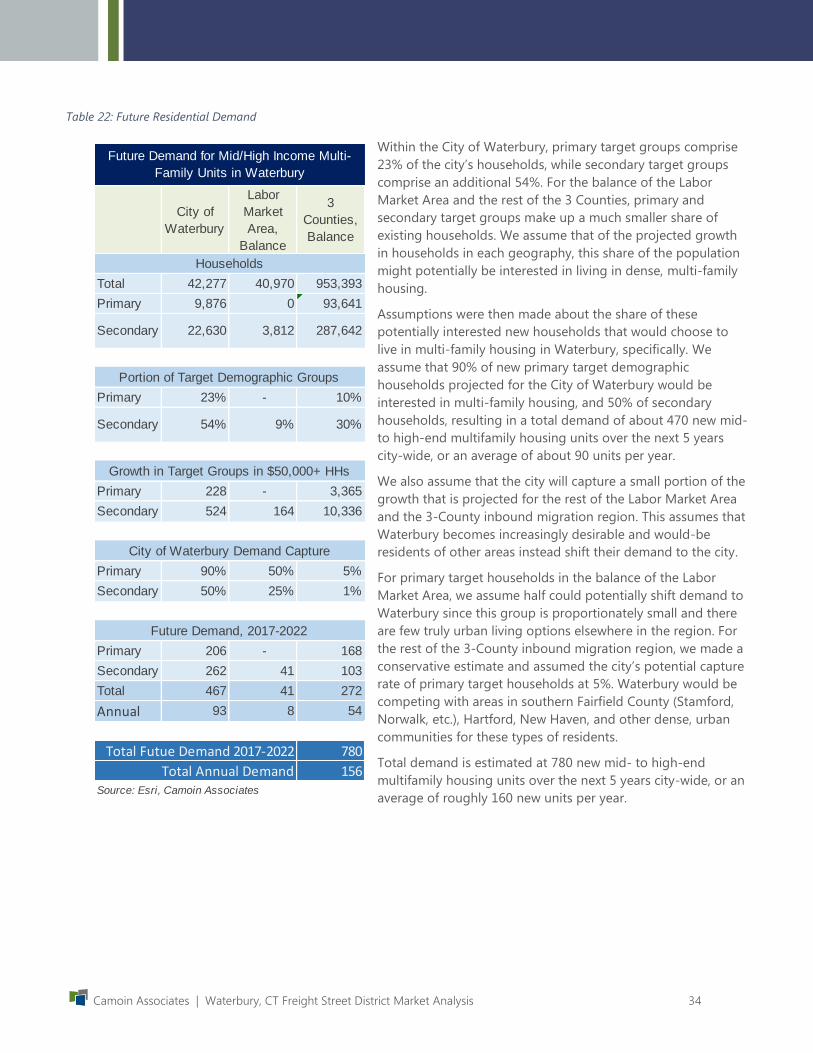
Camoin Associates | Waterbury, CT Freight Street District Market Analysis 34
Table 22: Future Residential Demand
Within the City of Waterbury, primary target groups comprise
23% of the city’s households, while secondary target groups
comprise an additional 54%. For the balance of the Labor
Market Area and the rest of the 3 Counties, primary and
secondary target groups make up a much smaller share of
existing households. We assume that of the projected growth
in households in each geography, this share of the population
might potentially be interested in living in dense, multi-family
housing.
Assumptions were then made about the share of these
potentially interested new households that would choose to
live in multi-family housing in Waterbury, specifically. We
assume that 90% of new primary target demographic
households projected for the City of Waterbury would be
interested in multi-family housing, and 50% of secondary
households, resulting in a total demand of about 470 new mid-
to high-end multifamily housing units over the next 5 years
city-wide, or an average of about 90 units per year.
We also assume that the city will capture a small portion of the
growth that is projected for the rest of the Labor Market Area
and the 3-County inbound migration region. This assumes that
Waterbury becomes increasingly desirable and would-be
residents of other areas instead shift their demand to the city.
For primary target households in the balance of the Labor
Market Area, we assume half could potentially shift demand to
Waterbury since this group is proportionately small and there
are few truly urban living options elsewhere in the region. For
the rest of the 3-County inbound migration region, we made a
conservative estimate and assumed the city’s potential capture
rate of primary target households at 5%. Waterbury would be
competing with areas in southern Fairfield County (Stamford,
Norwalk, etc.), Hartford, New Haven, and other dense, urban
communities for these types of residents.
Total demand is estimated at 780 new mid- to high-end
multifamily housing units over the next 5 years city-wide, or an
average of roughly 160 new units per year.
City of
Waterbury
Labor
Market
Area,
Balance
3
Counties,
Balance
Total 42,277 40,970 953,393
Primary 9,876 0 93,641
Secondary 22,630 3,812 287,642
Primary 23% - 10%
Secondary 54% 9% 30%
Primary 228 - 3,365
Secondary 524 164 10,336
Primary 90% 50% 5%
Secondary 50% 25% 1%
Primary 206 - 168
Secondary 262 41 103
Total 467 41 272
Annual 93 8 54
780
156
Growth in Target Groups in $50,000+ HHs
Portion of Target Demographic Groups
Households
Future Demand for Mid/High Income Multi-
Family Units in Waterbury
Total Annual Demand
Total Futue Demand 2017-2022
Source: Esri, Camoin Associates
City of Waterbury Demand Capture
Future Demand, 2017-2022

Camoin Associates | Waterbury, CT Freight Street District Market Analysis 35
Retail and Services Market Trends Retail market analysis examines the supply and demand for goods and services within a region. Demand for new
services can translate to growth opportunities in the retail real estate market well as present opportunities for
existing businesses to expand.
Trade Area Delineation & Sociodemographic Profile
A retail trade area is the geographic region from which retail and services businesses in the city generate most of
their customers (about 60%-80%, depending on the business). For this analysis, we delineated two trade areas. The
regional trade area is examined to identify unmet needs of the regional consumer market and the local trade area
provides insight into existing consumer trends and preferences in immediate proximity of the Freight Street area.
Regional Trade Area
To delineate the Regional Retail Trade Area, locations of existing businesses were mapped, including regional
shopping centers, local service businesses such as pharmacies, and convenience stores. Traffic patterns and
physiographic characteristics of the region that influence where consumers choose to shop were also considered.
As illustrated below, the Regional Retail Trade Area encompasses the entire City of Waterbury as well as Middlebury,
Woodbury, Bethlehem and Watertown. The retail trade area also extends into portions the towns of Prospect,
Cheshire, Wolcott, Plymouth, Thomaston, Northfield, Morris, Washington, Roxbury, Southbury, Oxford, and
Naugatuck. Consumers that reside outside of this area would typically travel to a different location to find similar
services and goods.
Figure 11: Regional Retail Trade Area
Regional Retail Trade Area
Source: Esri
Regional Retail Trade Area
Freight Street Trade Area

Camoin Associates | Waterbury, CT Freight Street District Market Analysis 36
There are approximately 200,000 residents and 77,000 households in the trade area. The population is expected to
decrease slightly over the next 5 years. The median age for the trade area is 41.1 and expected to rise slightly to 41.6
by 2022.
Table 23: Demographic Profile, Regional Retail Trade Area
The population in the Regional Retail Trade Area is expected to experience a decline in school-aged children as well
as those aged 45 to 54-year-old. Conversely, an increase in young adults aged 25 to 44, and 55 to 84-year-old
adults is expected.
Figure 12: Age Distribution, Regional Retail Trade Area
2010 2017 2022 (Proj.)
Annual
Growth Rate
2010 - 17
Annual
Growth Rate
2017 - 22
Population 200,281 200,148 199,918 -0.03% -0.02%
Households 78,114 77,133 76,649 -0.27% -0.13%
Average Household Size 2.53 2.56 2.57 0.23% 0.08%
Median Age 39.9 41.1 41.6 0.61% 0.24%
Demographic Profile, Regional Retail Trade Area
Source: Esri

Camoin Associates | Waterbury, CT Freight Street District Market Analysis 37
Median household income in the Regional Retail Trade Area is expected to increase at an annual growth rate of
1.57% from $56,087 in 2017 to $60,498 in 2022.
Table 24: Median Household Income, Regional Retail Trade Area
Figure 13: Income Distribution, Regional Retail Trade Area
2017 2022Annual Growth
Rate 2017 - 22
$ 56,087 $ 60,498 1.57%
Note: Income values are in current dollars, not adjusted for inflation
Source: Esri
Median Household Income, Regional Retail Trade Area

Camoin Associates | Waterbury, CT Freight Street District Market Analysis 38
Freight Street Trade Area
In addition to the Regional Retail Trade Area, a local retail trade area was delineated at a 1-mile radius around
Freight Street to assess local consumer trends and preferences in close proximity to the study area. The Freight
Street Trade Area is transected by major road ways such as I-84, James H. Darcey Memorial Highway (Route 8), and
West and East Main Street. This area encompasses most of the city’s urban core, which includes many major
employers and anchors, which will be important assets for supporting future development along Freight Street.
Figure 14: Freight Street Trade Area
Freight Street Trade Area
Source: Esri

Camoin Associates | Waterbury, CT Freight Street District Market Analysis 39
There are approximately 21,000 residents and 8,300 households within the Freight Street Trade Area. The population
in this area is projected to decrease over the next five years into 2022, faster than that in the Regional Retail Trade
Area. The median age for the Freight Street Trade Area is much younger than regional trade area, with a median age
of 34.3 compared to 41.1. The median age is projected to rise by 1-year to 35.3 by 2022.
Table 25: Demographic Profile, Freight Street Trade Area
The population in the Freight Street Trade Area displays similar trends as the Regional Retail Trade Area. Meaning
the area is expected to experience a decline in school-aged children as well as those aged 45 to 54 years old and an
increase in young adults aged 25 to 44 and 55 to 84-year-old adults.
Figure 15: Age Distribution, Freight Street Trade Area
2010 2017 2022 (Proj.)
Annual
Growth Rate
2010 - 17
Annual
Growth Rate
2017 - 22
Population 21,601 21,176 21,022 -0.38% -0.15%
Households 8,586 8,260 8,145 -0.73% -0.28%
Average Household Size 2.44 2.48 2.5 0.35% 0.16%
Median Age 33.6 34.3 35.3 0.72% 0.58%
Demographic Profile, Freight Street Trade Area
Source: Esri

Camoin Associates | Waterbury, CT Freight Street District Market Analysis 40
Median household income in the Freight Street Trade Area is very low, and significantly less than that of the regional
trade area, with Freight Street at $26,686 and Waterbury at $56,087. The median household income in the Freight
Street Trade Area is expected to increase at an annual growth rate of 0.64% to $27,534 in 2022. The Freight Street
Trade Area has a much higher proportion of households making under $15,000 compared to the Regional Retail
Trade Area. The low household income levels in this area is partially attributed to the increasing number of college
students living in the city’s urban core as well as much cheaper housing options compared with the surrounding
market. Overall spending potential of residents in close proximity to the study area is low.
Table 26: Median Household Income, Freight Street Trade Area
Figure 16: Income Distribution, Freight Street Trade Area
Consumer Preferences
Market segmentation is a tool used by retail site selectors and decision makers to understand the consumer
characteristics of a trade area. Market segmentation classifies consumers according to demographic, socioeconomic,
housing and lifestyle characteristics. Retailers and site selectors use market segmentation to compare consumer
trends across trade areas when considering many site locations.
Market segmentation is based on the concept that people with similar demographic characteristics, purchasing
habits, and media preferences naturally gravitate toward each other and into the same neighborhoods. Businesses
utilize market segmentation to understand their customers’ lifestyle choices, purchasing preferences, and how they
spend their free time. Market segmentation data for Waterbury’s trade area were obtained from Esri’s Tapestry
2017 2022Annual Growth
Rate 2017 - 22
$ 26,686 $ 27,534 0.64%
Median Household Income, Freight Street Trade Area
Note: Income values are in current dollars, not adjusted for inflation
Source: Esri
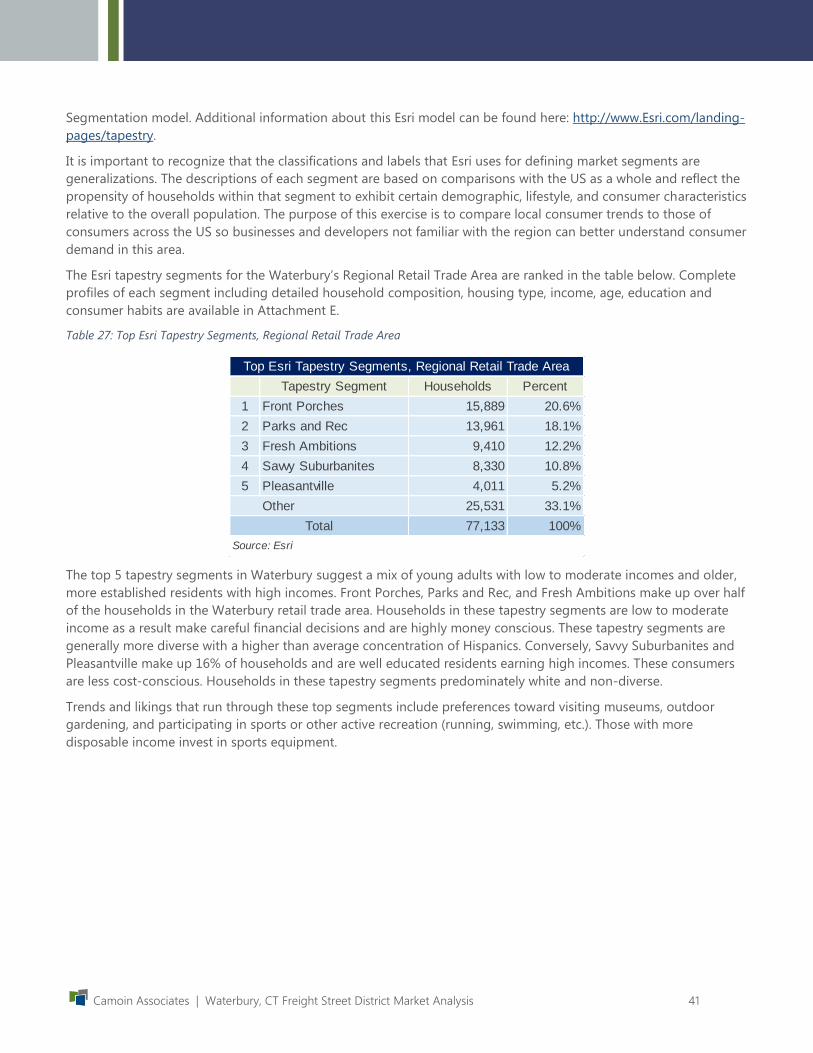
Camoin Associates | Waterbury, CT Freight Street District Market Analysis 41
Segmentation model. Additional information about this Esri model can be found here: http://www.Esri.com/landing-
pages/tapestry.
It is important to recognize that the classifications and labels that Esri uses for defining market segments are
generalizations. The descriptions of each segment are based on comparisons with the US as a whole and reflect the
propensity of households within that segment to exhibit certain demographic, lifestyle, and consumer characteristics
relative to the overall population. The purpose of this exercise is to compare local consumer trends to those of
consumers across the US so businesses and developers not familiar with the region can better understand consumer
demand in this area.
The Esri tapestry segments for the Waterbury’s Regional Retail Trade Area are ranked in the table below. Complete
profiles of each segment including detailed household composition, housing type, income, age, education and
consumer habits are available in Attachment E.
Table 27: Top Esri Tapestry Segments, Regional Retail Trade Area
The top 5 tapestry segments in Waterbury suggest a mix of young adults with low to moderate incomes and older,
more established residents with high incomes. Front Porches, Parks and Rec, and Fresh Ambitions make up over half
of the households in the Waterbury retail trade area. Households in these tapestry segments are low to moderate
income as a result make careful financial decisions and are highly money conscious. These tapestry segments are
generally more diverse with a higher than average concentration of Hispanics. Conversely, Savvy Suburbanites and
Pleasantville make up 16% of households and are well educated residents earning high incomes. These consumers
are less cost-conscious. Households in these tapestry segments predominately white and non-diverse.
Trends and likings that run through these top segments include preferences toward visiting museums, outdoor
gardening, and participating in sports or other active recreation (running, swimming, etc.). Those with more
disposable income invest in sports equipment.
Tapestry Segment Households Percent
1 Front Porches 15,889 20.6%
2 Parks and Rec 13,961 18.1%
3 Fresh Ambitions 9,410 12.2%
4 Savvy Suburbanites 8,330 10.8%
5 Pleasantville 4,011 5.2%
Other 25,531 33.1%
77,133 100%
Top Esri Tapestry Segments, Regional Retail Trade Area
Source: Esri
Total

Camoin Associates | Waterbury, CT Freight Street District Market Analysis 42
Table 28: Top Esri Tapestry Segments, Freight Street Trade Area
The Freight Street Trade Area tapestry segments show a similar composition to Waterbury. The composition of
tapestry segments further illustrates highly money conscious, low to moderate income households who are likely to
rent. The neighborhoods described by these segments are likely to be older homes within smaller metropolitan
markets. The presence of Social Security Set and Midlife Constants in the Freight District trade area indicate
households with a slightly older demographic and lower income. These two tapestry segments favor living alone
and a growing share of singles.
Nearly have of the Freight Street Trade Area households fall within the Fresh Abolitions tapestry segment. As noted
above, many of these households are Hispanic and have a unique market profile: 8
Newly established residents, often Spanish speaking
Young families that budget for baby food and other goods for young children
When budget permits, they wire money back home
Spend more on weekly groceries than the general U.S. market, with upward purchase on organic
More likely to purchase a car in the next 2-years
Very digitally connected with higher than average use of social media
Becoming more politically active
Expected to be better off than their parents financially
This is a fast-growing market segment in the city that, despite the lower spending power currently, is becoming
more dominate over time and should be seen as an opportunity.
8 Hispanic/Latino Market Profile: http://www.hispanicartscouncilstl.org/Hispanic%20Latino%20Market%20Profile.pdf
Tapestry Segment Households Percent
1 Fresh Ambitions 3,808 46.1%
2 Social Security Set 1,809 21.9%
3 Front Porches 1,602 19.4%
4 Parks and Rec 611 7.4%
5 Midlife Constants 248 3.0%
Other 182 2.2%
8,260 100%
Top Esri Tapestry Segments, Freight Street Trade Area
Total
Source: Esri

Camoin Associates | Waterbury, CT Freight Street District Market Analysis 43
Retail Demand
In a retail gap analysis, the existing retail sales (“supply”) of trade area businesses are compared to the retail
spending of trade area residents (“demand”). The difference between supply and demand is referred to as the “retail
gap.”9
When the demand (total spending by trade area residents) for goods and services is greater than sales at trade area
businesses, sales are said to “leak out” of the trade area, creating a positive retail gap (i.e. sales leakage). Conversely,
if the supply of goods sold (local trade area sales) exceeds trade area demand (spending by trade area residents), it
is assumed that non-residents are coming into the trade area and spending money and/or online sales, creating a
negative retail gap (i.e. sales surplus).
Sales leakage and sales surplus carry different consequences. In many cases, sales leakage presents an opportunity
to capture unmet demand in a trade area since a percentage of residential spending occurs outside the retail trade
area. This demand can be met within the trade area by opening new businesses or expanding existing businesses
within retail sectors that show sales leakage. However, not all retail categories that exhibit sales leakage within a
particular trade area are a good fit for the region.
A sales surplus might exist for several reasons. For example, the region might be a popular shopping destination for
tourists and other out-of-towners, or a cluster of competing businesses offering a similar product or service may be
located within the trade area, creating a specialty cluster that draws in spending by households from outside the
trade area. Alternatively, a sales surplus could be an indicator of market saturation.
The following Retail Gap Analysis table contains a list of industry groups sorted by 3- and 4-digit NAICS codes
including figures for sales demand (estimated spending by local trade area residents), sales supply (existing retail
sales within the trade area), and retail gap (demand minus supply). Retail categories with sales leakage are in green
representing a potential opportunity, and those with sales surplus are in red.
Industries experiencing the greatest sales leakage include:
Other Motor Vehicle Dealers
Book, Periodical and Music Stores
Shoe Stores
Lawn and Garden Equipment and Supply Stores
Sporting Goods/Hobby/Musical Instrument Stores
Jewelry, Luggage and Leather Goods Stores
Industries with a large sales surplus include:
Used Merchandise Stores
Other General Merchandise Stores
Drinking Places – Alcoholic Beverages
Health and Personal Care Stores
The high level of retail leakage indicates that residents leave the trade area for the purchases in those industries,
meaning there may be opportunities for the industries with leakage to recapture some consumer demand. However,
9 Note that existing retail sales are specific to the defined trade area whereas retail spending is an estimate of gross spending by
residents living in the trade area regardless of where the retail spending occurs and could include internet sales.

Camoin Associates | Waterbury, CT Freight Street District Market Analysis 44
this does not necessarily indicate that new businesses would succeed in Waterbury. The Business Potential Analysis
following the Retail Gap Analysis provides further insight into opportunities for and feasibility of investments.
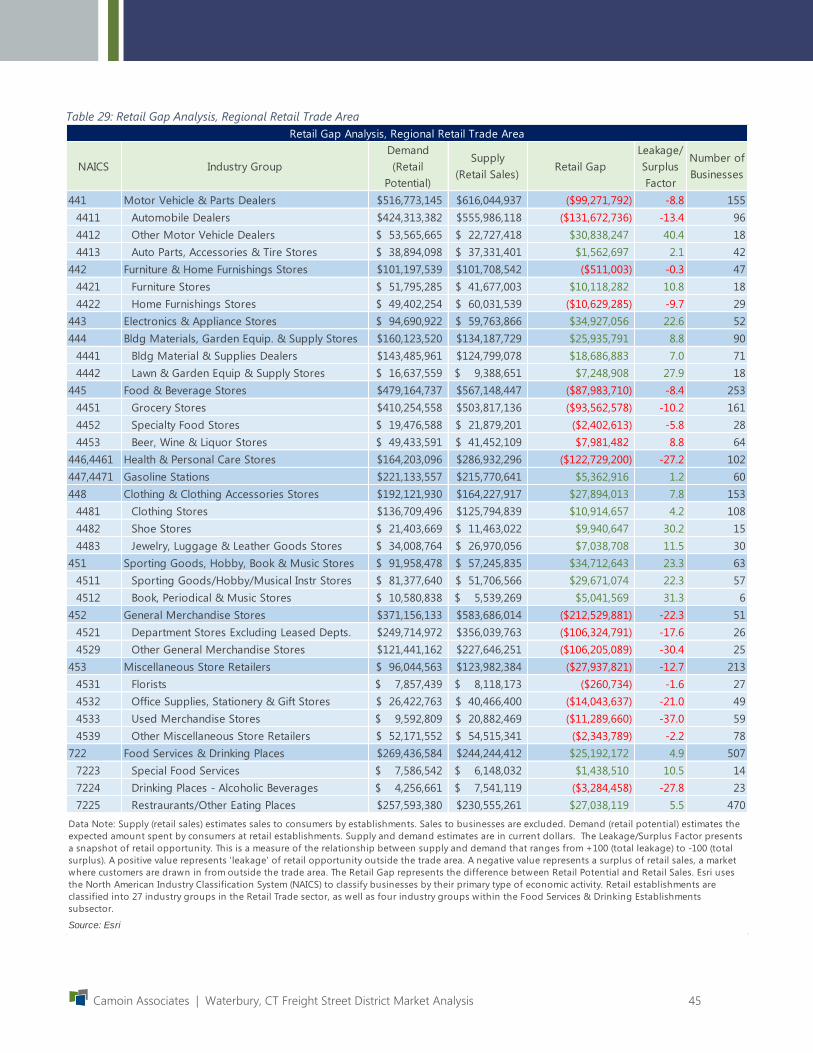
Camoin Associates | Waterbury, CT Freight Street District Market Analysis 45
Table 29: Retail Gap Analysis, Regional Retail Trade Area
NAICS Industry Group
Demand
(Retail
Potential)
Supply
(Retail Sales)Retail Gap
Leakage/
Surplus
Factor
Number of
Businesses
441 Motor Vehicle & Parts Dealers 516,773,145$ 616,044,937$ ($99,271,792) -8.8 155
4411 Automobile Dealers 424,313,382$ 555,986,118$ ($131,672,736) -13.4 96
4412 Other Motor Vehicle Dealers 53,565,665$ 22,727,418$ $30,838,247 40.4 18
4413 Auto Parts, Accessories & Tire Stores 38,894,098$ 37,331,401$ $1,562,697 2.1 42
442 Furniture & Home Furnishings Stores 101,197,539$ 101,708,542$ ($511,003) -0.3 47
4421 Furniture Stores 51,795,285$ 41,677,003$ $10,118,282 10.8 18
4422 Home Furnishings Stores 49,402,254$ 60,031,539$ ($10,629,285) -9.7 29
443 Electronics & Appliance Stores 94,690,922$ 59,763,866$ $34,927,056 22.6 52
444 Bldg Materials, Garden Equip. & Supply Stores 160,123,520$ 134,187,729$ $25,935,791 8.8 90
4441 Bldg Material & Supplies Dealers 143,485,961$ 124,799,078$ $18,686,883 7.0 71
4442 Lawn & Garden Equip & Supply Stores 16,637,559$ 9,388,651$ $7,248,908 27.9 18
445 Food & Beverage Stores 479,164,737$ 567,148,447$ ($87,983,710) -8.4 253
4451 Grocery Stores 410,254,558$ 503,817,136$ ($93,562,578) -10.2 161
4452 Specialty Food Stores 19,476,588$ 21,879,201$ ($2,402,613) -5.8 28
4453 Beer, Wine & Liquor Stores 49,433,591$ 41,452,109$ $7,981,482 8.8 64
446,4461 Health & Personal Care Stores 164,203,096$ 286,932,296$ ($122,729,200) -27.2 102
447,4471 Gasoline Stations 221,133,557$ 215,770,641$ $5,362,916 1.2 60
448 Clothing & Clothing Accessories Stores 192,121,930$ 164,227,917$ $27,894,013 7.8 153
4481 Clothing Stores 136,709,496$ 125,794,839$ $10,914,657 4.2 108
4482 Shoe Stores 21,403,669$ 11,463,022$ $9,940,647 30.2 15
4483 Jewelry, Luggage & Leather Goods Stores 34,008,764$ 26,970,056$ $7,038,708 11.5 30
451 Sporting Goods, Hobby, Book & Music Stores 91,958,478$ 57,245,835$ $34,712,643 23.3 63
4511 Sporting Goods/Hobby/Musical Instr Stores 81,377,640$ 51,706,566$ $29,671,074 22.3 57
4512 Book, Periodical & Music Stores 10,580,838$ 5,539,269$ $5,041,569 31.3 6
452 General Merchandise Stores 371,156,133$ 583,686,014$ ($212,529,881) -22.3 51
4521 Department Stores Excluding Leased Depts. 249,714,972$ 356,039,763$ ($106,324,791) -17.6 26
4529 Other General Merchandise Stores 121,441,162$ 227,646,251$ ($106,205,089) -30.4 25
453 Miscellaneous Store Retailers 96,044,563$ 123,982,384$ ($27,937,821) -12.7 213
4531 Florists 7,857,439$ 8,118,173$ ($260,734) -1.6 27
4532 Office Supplies, Stationery & Gift Stores 26,422,763$ 40,466,400$ ($14,043,637) -21.0 49
4533 Used Merchandise Stores 9,592,809$ 20,882,469$ ($11,289,660) -37.0 59
4539 Other Miscellaneous Store Retailers 52,171,552$ 54,515,341$ ($2,343,789) -2.2 78
722 Food Services & Drinking Places 269,436,584$ 244,244,412$ $25,192,172 4.9 507
7223 Special Food Services 7,586,542$ 6,148,032$ $1,438,510 10.5 14
7224 Drinking Places - Alcoholic Beverages 4,256,661$ 7,541,119$ ($3,284,458) -27.8 23
7225 Restraurants/Other Eating Places 257,593,380$ 230,555,261$ $27,038,119 5.5 470
Retail Gap Analysis, Regional Retail Trade Area
Data Note: Supply (retail sales) estimates sales to consumers by establishments. Sales to businesses are excluded. Demand (retail potential) estimates the
expected amount spent by consumers at retail establishments. Supply and demand estimates are in current dollars. The Leakage/Surplus Factor presents
a snapshot of retail opportunity. This is a measure of the relationship between supply and demand that ranges from +100 (total leakage) to -100 (total
surplus). A positive value represents 'leakage' of retail opportunity outside the trade area. A negative value represents a surplus of retail sales, a market
where customers are drawn in from outside the trade area. The Retail Gap represents the difference between Retail Potential and Retail Sales. Esri uses
the North American Industry Classification System (NAICS) to classify businesses by their primary type of economic activity. Retail establishments are
classified into 27 industry groups in the Retail Trade sector, as well as four industry groups within the Food Services & Drinking Establishments
subsector.
Source: Esri
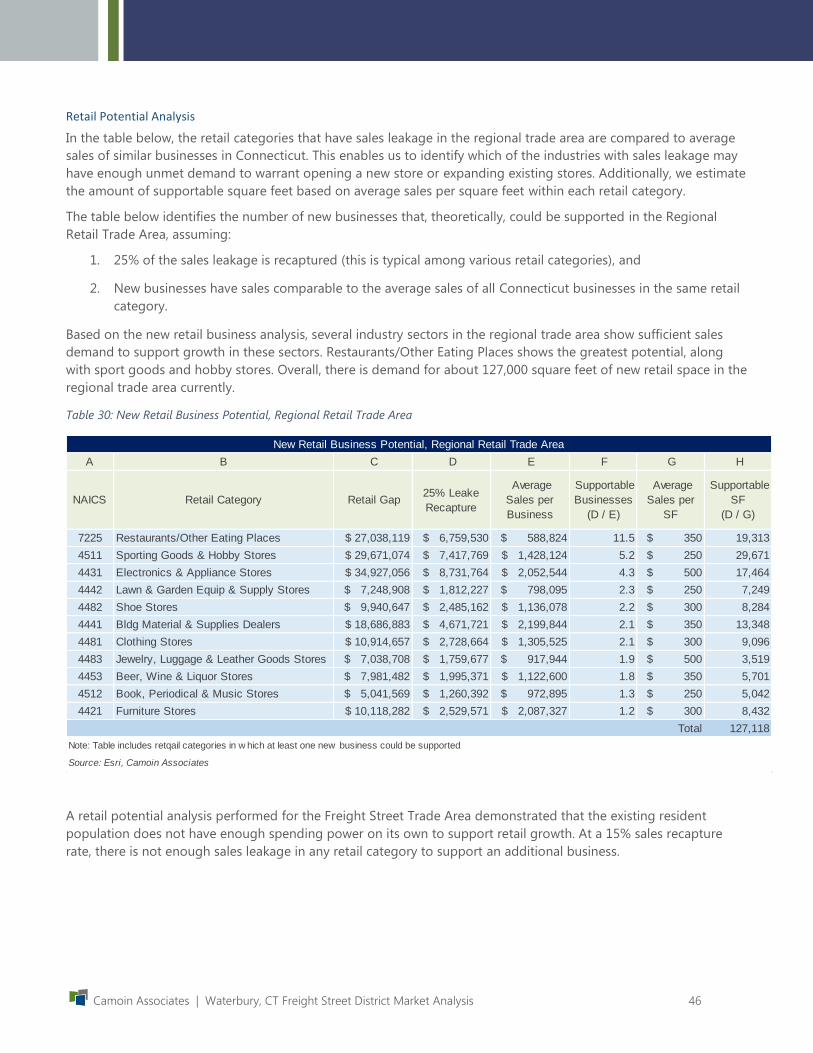
Camoin Associates | Waterbury, CT Freight Street District Market Analysis 46
Retail Potential Analysis
In the table below, the retail categories that have sales leakage in the regional trade area are compared to average
sales of similar businesses in Connecticut. This enables us to identify which of the industries with sales leakage may
have enough unmet demand to warrant opening a new store or expanding existing stores. Additionally, we estimate
the amount of supportable square feet based on average sales per square feet within each retail category.
The table below identifies the number of new businesses that, theoretically, could be supported in the Regional
Retail Trade Area, assuming:
1. 25% of the sales leakage is recaptured (this is typical among various retail categories), and
2. New businesses have sales comparable to the average sales of all Connecticut businesses in the same retail
category.
Based on the new retail business analysis, several industry sectors in the regional trade area show sufficient sales
demand to support growth in these sectors. Restaurants/Other Eating Places shows the greatest potential, along
with sport goods and hobby stores. Overall, there is demand for about 127,000 square feet of new retail space in the
regional trade area currently.
Table 30: New Retail Business Potential, Regional Retail Trade Area
A retail potential analysis performed for the Freight Street Trade Area demonstrated that the existing resident
population does not have enough spending power on its own to support retail growth. At a 15% sales recapture
rate, there is not enough sales leakage in any retail category to support an additional business.
A B C D E F G H
NAICS Retail Category Retail Gap 25% Leake
Recapture
Average
Sales per
Business
Supportable
Businesses
(D / E)
Average
Sales per
SF
Supportable
SF
(D / G)
7225 Restaurants/Other Eating Places $ 27,038,119 $ 6,759,530 $ 588,824 11.5 $ 350 19,313
4511 Sporting Goods & Hobby Stores $ 29,671,074 $ 7,417,769 $ 1,428,124 5.2 $ 250 29,671
4431 Electronics & Appliance Stores $ 34,927,056 $ 8,731,764 $ 2,052,544 4.3 $ 500 17,464
4442 Lawn & Garden Equip & Supply Stores $ 7,248,908 $ 1,812,227 $ 798,095 2.3 $ 250 7,249
4482 Shoe Stores $ 9,940,647 $ 2,485,162 $ 1,136,078 2.2 $ 300 8,284
4441 Bldg Material & Supplies Dealers $ 18,686,883 $ 4,671,721 $ 2,199,844 2.1 $ 350 13,348
4481 Clothing Stores $ 10,914,657 $ 2,728,664 $ 1,305,525 2.1 $ 300 9,096
4483 Jewelry, Luggage & Leather Goods Stores $ 7,038,708 $ 1,759,677 $ 917,944 1.9 $ 500 3,519
4453 Beer, Wine & Liquor Stores $ 7,981,482 $ 1,995,371 $ 1,122,600 1.8 $ 350 5,701
4512 Book, Periodical & Music Stores $ 5,041,569 $ 1,260,392 $ 972,895 1.3 $ 250 5,042
4421 Furniture Stores $ 10,118,282 $ 2,529,571 $ 2,087,327 1.2 $ 300 8,432
Total 127,118
Source: Esri, Camoin Associates
New Retail Business Potential, Regional Retail Trade Area
Note: Table includes retqail categories in w hich at least one new business could be supported

Camoin Associates | Waterbury, CT Freight Street District Market Analysis 47
Retail Supply
An assessment of CoStar data provided information about the existing supply of retail space in the City of
Waterbury, the Waterbury submarket, which is illustrated in the map on the following page, and New Haven County.
Market Summary
Figure 17: Retail Market Summary, 2017
The adjacent table provides a summary of retail
real estate market trends for the City of
Waterbury, Waterbury Submarket, and New
Haven County.
The City of Waterbury retail market consists of
about 760 buildings and 8.36 million square feet
of available space. About 40,000 square feet of
retail space is currently under construction and
over 20,000 square feet of space was added over
the past year.
Vacancy rates represent unoccupied space and
availability rates represent space available for
rent, whether the space is occupied or not.
Vacancy rates in all three markets are low,
especially in the city at 4.8%. There is currently
about 727,000 square feet of retail space available
for rent or lease in the city and 1.1 million square
feet available in the Waterbury submarket, which
pushes availability rates closer to 9-10%.
Despite the tight market, months-on-market for
the city, Waterbury submarket, and the county are
high, suggesting that potential buyers are not
finding the type of space they are looking for.
This postulation is supported by the discrepancy
between the sale price and asking price in the city
and Waterbury submarket.
The higher cap rates in the city and Waterbury submarket indicate that in order for investors to take on a project in
these markets, they expect to achieve a greater return on their investment compared to the New Haven County
market as a whole.
City of
Waterbury
Waterbury
Submarket
New Haven
County
NNN Rent per SF $11.66 $11.90 $13.08
Vacancy Rate 4.8% 6.2% 5.3%
Vacant SF 399,843 720,898 2,630,744
Availability Rate 8.7% 9.7% 8.5%
Available SF 727,722 1,129,206 4,224,995
Months on Market 20 14 12
12 Mo. Absorption SF 182,539 130,351 465,000
12 Mo. Leasing SF 143,546 255,412 915,632
Existing Buildings 760 1,090 4,295
Existing SF 8,360,072 11,560,249 49,770,977
12 Mo. Construction
Starts SF57,225 84,359 97,734
Under Construction SF 40,000 69,134 161,074
12 Mo. Deliveries SF 21,225 36,225 222,210
Sale Price Per SF $34 $42 $137
Asking price Per SF $122 $124 $180
Sales Volume (mil) $3 $8 $96
Cap Rate 10.9% 10.9% 7.2%
Retail Market Summary, 2017
Source: CoStar
Availability
Demand
Inventory
Sales

Camoin Associates | Waterbury, CT Freight Street District Market Analysis 48
Vacancy by Building
Vacancy rates within individual retail buildings are mapped below, which shows that there is some available retail
space along State Route 844, East Main Street, North Main Street, South Main Street, Meriden Road and Chase
Avenue. The area surrounding the Freight Street District has very low retail vacancy.
Figure 18: Waterbury Submarket Retail Buildings by Vacancy
Waterbury Submarket Retail Buildings by Vacancy
Source: CoStar

Camoin Associates | Waterbury, CT Freight Street District Market Analysis 49
Retail Construction Activity
The map below displays the construction activity within the CoStar Waterbury submarket. There is one retail
building under construction around the Freight Street District with an additional small project recently completed
nearby. Additionally, there is ongoing retail development occurring east of Waterbury along Interstate 84, within 2
miles of the Freight Street District (Exit 25 A). However, this retail development is intended to accommodate large,
regional “big box” retail stores, such as Costco a new Restaurant Depot, whereas any retail development in the
Freight Street area is better suited as a neighborhood center with convenience retail offering a broad range of
services and an experience beyond just shopping.
Figure 19: Waterbury Submarket Construction Activity
Waterbury Submarket Construction Activity
Source: CoStar

Camoin Associates | Waterbury, CT Freight Street District Market Analysis 50
Office Market Trends The office space market analysis provides an overview of current trends and projections within regional office-
utilizing industries to identify potential opportunities for office space development in Waterbury, the demand for
office space, and uses CoStar data to understand the current supply of office-space.
Demand for Office Space
Future demand for office space can be determined by analyzing projections of employment growth in office-
utilizing industries, which are highlighted in orange in the table below. Government; Other Services; Administrative
and Support and Waste Management and Remediation Services; and Management of Companies and Enterprises in
the Waterbury Labor Market Area are expected to add jobs over the next 10 years. Other office-utilizing sectors such
as Information and Finance and Insurance are projected to decline. Collectively office-utilizing industries are
anticipated to add 245 jobs over the next 10 years.
Table 31: Growth in Office-Utilizing Industries, Waterbury Labor Market Area, 2016 - 2026
NAICS Description 2016 Jobs 2026 Jobs2016 - 2026
Change
2016 - 2026
% Change
11 Crop and Animal Production 115 119 4 3%
21Mining, Quarrying, and Oil and Gas
Extraction59 52 (7) (12%)
22 Utilities 403 413 10 2%
23 Construction 4,090 4,201 111 3%
31 Manufacturing 7,805 6,685 (1,120) (14%)
42 Wholesale Trade 1,669 1,550 (119) (7%)
44 Retail Trade 9,378 9,421 43 0%
48 Transportation and Warehousing 2,131 2,347 216 10%
51 Information 732 424 (308) (42%)
52 Finance and Insurance 1,578 1,402 (176) (11%)
53 Real Estate and Rental and Leasing 706 701 (5) (1%)
54Professional, Scientific, and Technical
Services2,319 2,301 (18) (1%)
55 Management of Companies and Enterprises 608 667 59 10%
56Administrative and Support and Waste
Management and Remediation Services3,081 3,143 62 2%
61 Educational Services 8,577 11,005 2,428 28%
62 Health Care and Social Assistance 17,525 19,788 2,263 13%
71 Arts, Entertainment, and Recreation 1,091 1,092 1 0%
72 Accommodation and Food Services 4,941 5,239 298 6%
81Other Services (except Public
Administration)3,609 3,917 308 9%
90 Government 12,509 12,828 319 3%
99 Unclassified Industry <10 12 Insf. Data Insf. Data
82,937 87,307 4,370 5.3%
24,437 24,683 245 1.0%
Growth in Office-Utilizing Industries, Waterbury Labor Market Area, 2016 -2026
Source: EMSI
Total, All Sectors
Office-Utilizing Industries

Camoin Associates | Waterbury, CT Freight Street District Market Analysis 51
Using a standard assumption of 175 rentable square feet (RSF) per worker, the employment growth in the
Waterbury Labor Market Area will lead to the assumption of approximately 43,000 RSF of office space by 2025.
Table 32: New Demand for Office Space in Waterbury, CT Labor Market Area by 2026
Supply of Office Space
CoStar was used to gather information on the Waterbury Submarket office space supply. Currently, there are 457
office buildings in the Waterbury Submarket totaling over 6 million square feet of office space. There is a 13.4%
vacancy rate with over 807,000 square feet of vacant office space and a negative absorption of about 139,000
square feet over the past 12-months. Despite the high vacancy rate and negative absorption, 30,000 square feet has
been delivered within the last 12 months with an additional 26,700 square feet under construction.
Table 33: Waterbury Submarket Office Space
Waterbury Submarket Office Space
Source: CoStar
2016 Office-
Utilizing Jobs
New Office-
Utilizing Jobs,
2016-2026
Rentable SF per
Worker
New demand for
Office Space
(RSF)
24,437 245 175 42,926
Source: EMSI, Camoin Associates
New Demand for Office Space in Waterbury Labor Market Area by 2026

Camoin Associates | Waterbury, CT Freight Street District Market Analysis 52
The map below displays the distribution of vacant office buildings within the Waterbury Submarket. There is a heavy
concentration of available space in and around the Freight Street District.
Figure 20: Waterbury Submarket Buildings by Vacancy
Waterbury Submarket Buildings by Vacancy
Source: CoStar

Camoin Associates | Waterbury, CT Freight Street District Market Analysis 53
The map below displays the office space construction activity within the CoStar Waterbury submarket. Along State
Route 84 there is 19,698 – 28,000 square feet of office space construction proposed. Less than 11,400 square feet of
office space retail recently delivered near the conjunction of Routes 8 and 84. Near the Freight Street District,
approximately 20,000 – 28,000 square feet of office space was recently delivered.
Figure 21: Waterbury Submarket Construction Activity
Waterbury Submarket Construction Activity
Source: CoStar
Lending Environment
Local lending institutions are very soft on financing office projects right now. With little change in rental rates over
the past several years and continued rise in taxes and other costs, it is very difficult for a developer to attain a
reasonable return to cover their debt service. Medical office space is the one exception, which is discussed in the
next section.
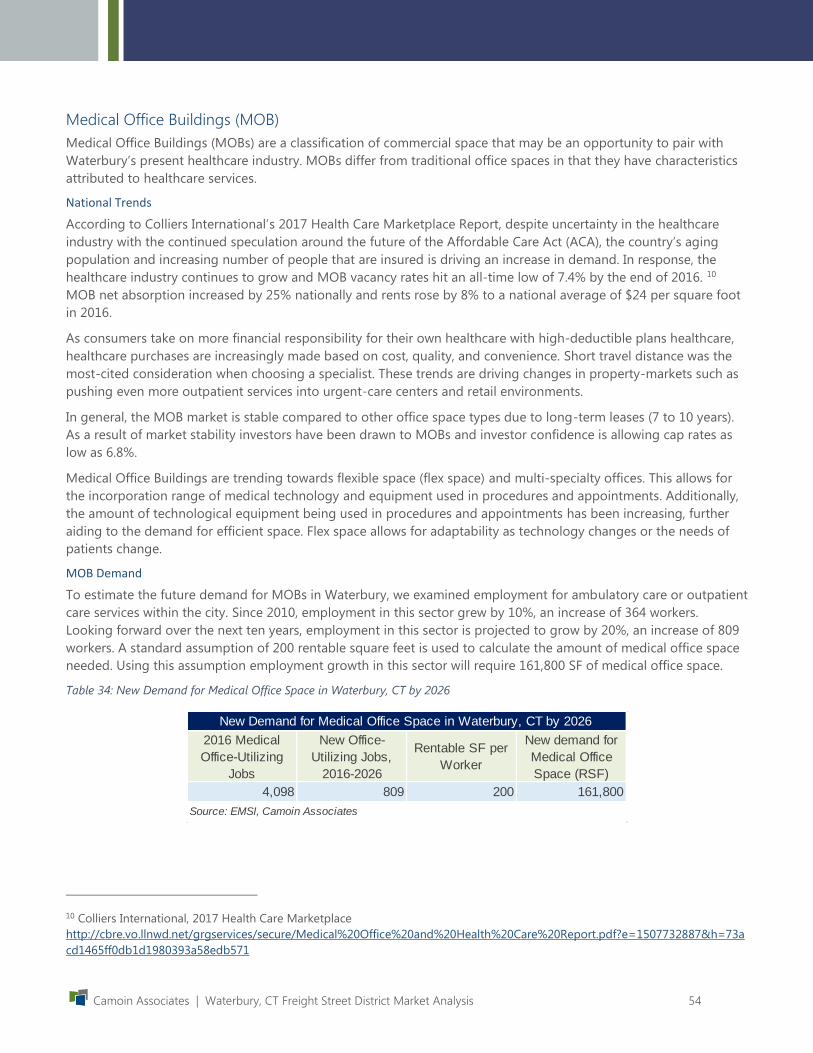
Camoin Associates | Waterbury, CT Freight Street District Market Analysis 54
Medical Office Buildings (MOB)
Medical Office Buildings (MOBs) are a classification of commercial space that may be an opportunity to pair with
Waterbury’s present healthcare industry. MOBs differ from traditional office spaces in that they have characteristics
attributed to healthcare services.
National Trends
According to Colliers International’s 2017 Health Care Marketplace Report, despite uncertainty in the healthcare
industry with the continued speculation around the future of the Affordable Care Act (ACA), the country’s aging
population and increasing number of people that are insured is driving an increase in demand. In response, the
healthcare industry continues to grow and MOB vacancy rates hit an all-time low of 7.4% by the end of 2016. 10
MOB net absorption increased by 25% nationally and rents rose by 8% to a national average of $24 per square foot
in 2016.
As consumers take on more financial responsibility for their own healthcare with high-deductible plans healthcare,
healthcare purchases are increasingly made based on cost, quality, and convenience. Short travel distance was the
most-cited consideration when choosing a specialist. These trends are driving changes in property-markets such as
pushing even more outpatient services into urgent-care centers and retail environments.
In general, the MOB market is stable compared to other office space types due to long-term leases (7 to 10 years).
As a result of market stability investors have been drawn to MOBs and investor confidence is allowing cap rates as
low as 6.8%.
Medical Office Buildings are trending towards flexible space (flex space) and multi-specialty offices. This allows for
the incorporation range of medical technology and equipment used in procedures and appointments. Additionally,
the amount of technological equipment being used in procedures and appointments has been increasing, further
aiding to the demand for efficient space. Flex space allows for adaptability as technology changes or the needs of
patients change.
MOB Demand
To estimate the future demand for MOBs in Waterbury, we examined employment for ambulatory care or outpatient
care services within the city. Since 2010, employment in this sector grew by 10%, an increase of 364 workers.
Looking forward over the next ten years, employment in this sector is projected to grow by 20%, an increase of 809
workers. A standard assumption of 200 rentable square feet is used to calculate the amount of medical office space
needed. Using this assumption employment growth in this sector will require 161,800 SF of medical office space.
Table 34: New Demand for Medical Office Space in Waterbury, CT by 2026
10 Colliers International, 2017 Health Care Marketplace
http://cbre.vo.llnwd.net/grgservices/secure/Medical%20Office%20and%20Health%20Care%20Report.pdf?e=1507732887&h=73a
cd1465ff0db1d1980393a58edb571
2016 Medical
Office-Utilizing
Jobs
New Office-
Utilizing Jobs,
2016-2026
Rentable SF per
Worker
New demand for
Medical Office
Space (RSF)
4,098 809 200 161,800
New Demand for Medical Office Space in Waterbury, CT by 2026
Source: EMSI, Camoin Associates

Camoin Associates | Waterbury, CT Freight Street District Market Analysis 55
Local Perspective
An interview with several representatives from Saint Mary’s Hospital in Waterbury provided additional insight into
local market trends in the healthcare sector. Saint Mary’s Hospital is the flagship hospital for Trinity Health of New
England. It primarily serves Waterbury and the surrounding 10-town region with about 2,500 employees (1,800 full
time equivalent FTE). They boast a large urban campus located right in Downtown Waterbury, about 1-mile from the
Freight Street District.
With the ongoing growth in the healthcare industry, Saint Mary’s is constantly re-investing in its campus to replace
aging facilities and create a more efficient footprint. They are currently building a pavilion to enhance their
outpatient services. This pivot toward more outpatient services is a result of significant advances in medical
technology and other practices reducing the space required for inpatient services.
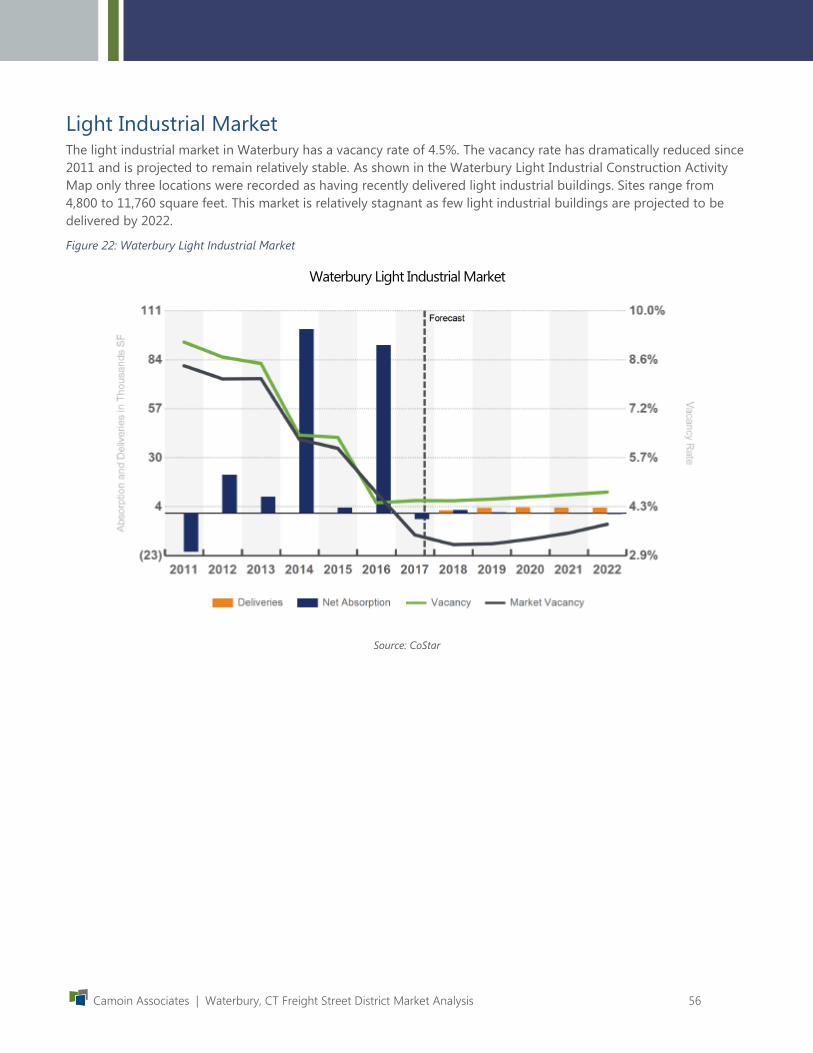
Camoin Associates | Waterbury, CT Freight Street District Market Analysis 56
Light Industrial Market The light industrial market in Waterbury has a vacancy rate of 4.5%. The vacancy rate has dramatically reduced since
2011 and is projected to remain relatively stable. As shown in the Waterbury Light Industrial Construction Activity
Map only three locations were recorded as having recently delivered light industrial buildings. Sites range from
4,800 to 11,760 square feet. This market is relatively stagnant as few light industrial buildings are projected to be
delivered by 2022.
Figure 22: Waterbury Light Industrial Market
Waterbury Light Industrial Market
Source: CoStar

Camoin Associates | Waterbury, CT Freight Street District Market Analysis 57
Figure 23: Waterbury Light Industrial Construction Activity
Waterbury Light Industrial Construction Activity
Source: CoStar
Industrial rental rates have stayed relatively consistent for the last 20+ years at $3.5-$4.00 per square foot.
Real estate developers and brokers interviewed for this project generally agreed that the Freight Street District is not
an ideal location for large-scale industrial development. Some felt that there is an opportunity for smaller-scale
projects that would complement a mixed-use setting.

Camoin Associates | Waterbury, CT Freight Street District Market Analysis 58
Trends in Transit Oriented Development (TOD) While the real estate market analysis does not identify robust demand for any single use type, the Freight Street
District has several unique assets that make it a unique area for future development. One of its unique assets is the
train station; the presence of which sets the Freight Street District apart from any other site in the local real estate
market and sets Waterbury apart from many other cities in the northeast. Even with its existing capacity limitations,
which are summarized in the Milone & MacBroom report, the train station allows the potential for transit oriented
development (TOD) in the future.
What is TOD?
Transit Oriented Development (TOD) involves the creation of a dense, central location for a mix of uses, including
residential as well as office and retail spaces, with immediate proximity to a transit station. TOD is becoming a highly
sought after style of development as people and businesses have become increasingly attracted to places that are
walkable and bikable, in close proximity to transit options, incorporate different building/land uses, and are more
densely developed. Studies have found that transit-accessible properties are able to demand a higher rent/purchase
price than those that are not close to transit options, due to the increased demand from consumers.
These dense centers allow residents to commute to work, run errands, and participate in social activities, without
ever getting into a car or with limited vehicular travel.
TODs have the potential to solve many problems currently faced by communities, such as pollution, congestion,
income constraints, and access to a quality workforce. While TODs can be extraordinarily helpful in revitalizing an
area, the planning process for TOD is complex, and there are many aspects to consider. Guidelines created by the
Metropolitan Atlanta Rapid Transit Authority identified four core elements that are essential to TOD, including:
Dense station area relative to surroundings
Variety of uses that create a “24/7” place
Safe, attractive, and walkable public realm
Unconventional approach to parking design
TODs create a great opportunity for a mix of housing types, as they appeal to a wide
range of residents, from highly-paid workers, to senior citizens, to the disabled.
Thus, TODs should strive to offer both luxury and affordable housing options in their
developments and appeal to people looking within all price points. This also creates
a diverse consumer base in terms of designing the landscape of amenities and retail
offerings. Types of businesses to target for TOD include:
Small boutique shops and retail under 20,000 square feet
Grocery stores
Movie theatres
Banks
Restaurants
Offices
Business services
Child care centers
Multifamily residential
“In recent years, a rising number
of innovative firms and talented
workers are choosing to
congregate and co-locate in
compact, amenity-rich enclaves
in the cores of central cities.
Rather than building on green-
field sites, marquee companies
in knowledge-intensive sectors
are locating key facilities close to
other firms, research labs, and
universities to promote idea-
sharing and practice “open
innovation.”
- The Rise of Innovation Districts:
A New Geography of Innovation
in America by Bruce Katz and
Julie Wagner
Camoin Associates | Waterbury, CT Freight Street District Market Analysis 59
Live-work space
Entertainment and cultural space
Civic or community meeting space
Bed and breakfasts and lodging options
Though TODs revolve largely around the creation of density, it is also important to create a sense of place by
incorporating pocket parks, outdoor seating and visiting areas, and shelters for those awaiting transit. These
developments are pedestrian-oriented, as they are designed to alleviate the need for residents to own a car or
significantly reduce the need for travel by car. A mix of the above amenities coupled with proper streetscaping and
open-space planning will create walkability that attracts pedestrian traffic which encourages spending.
Trends in TOD
When guiding development around the TOD, there are a few trends that are driving successful projects including:
density
availability of amenities
high degree of walkability
authenticity
telecommunications infrastructure
When considering how the Freight Street District can stand out among other options for businesses and residents, it
will be important to integrate amenities that ensure a high quality of life and work.
People and companies want to be in densely developed places. Between 2000 and 2015, the Smart Growth
America advocacy group found that of businesses that are adding jobs, more than half were moving their
operations from the suburbs into denser places while others were moving between downtown locations or
expanding within an existing downtown location. Connecticut is all too familiar with the negative side of this trend
with recent exits of several large employers. These growing companies were looking to be closer to other amenities
in areas that are dense and accessible. Particularly when working to attract and retain the millennial worker, it is
integral to have an office with access to walkable neighborhoods, transit, and recreational amenities.
Fewer people are moving for jobs and more jobs are moving to where the talent is.
When considering amenities, it is important that the TODs are real, authentic, and vital places. The Urban Land
Institute’s research on what attracts creative and innovative people to regions suggests that attractive places don’t
need to be big cities, but need to be a place where you can sense the “interplay of culture and ideas, where
outsiders can quickly become insiders and anyone can find a peer group to be comfortable with and groups to be
stimulated by.” 11
The types of businesses and workers that would be a good fit for a TOD in Waterbury will be trending towards hip,
young establishments that are tech-forward, and attract a culturally diverse audience. Coffee shops/cafes, brew
pubs, co-working locations, business support operations, fitness studios, art and cultural venues, neighborhood
groceries, and unique retail offerings will meet the needs of the employees and residents of the TOD.
Gig infrastructure refers to super-fast, high-capacity broadband networks that deliver speeds measured in gigabits
as opposed to megabits. This type of infrastructure will allow all the residents and businesses to be able to realize
full function and interconnectivity of their tech tools but also support technological advances. Having the highest
11 Source: (Florida, 2012)
Camoin Associates | Waterbury, CT Freight Street District Market Analysis 60
speed internet available is in line with the city’s goal of making the Freight Street District play a critical role in
Waterbury’s Innovation Places strategy and could encourage people and businesses to locate to be a part of the
future of the internet and computing.
Benefits of TOD
Though the planning and implementation process for TODs may seem costly from both a financial perspective and a
sometimes a political perspective, TODs have many long-term benefits for communities:
Increased Disposable Income | Relieving residents of the expense of owning and operating a vehicle
generates availability of disposable income, which is then spent in the TOD center.
Little Impact to Public School System | Despite the fact that dense residential developments would
seemingly put strain on public school systems, those that choose to live in TODs are usually smaller
household sizes; thus having little to no impact on cost to public schools.
Lower Infrastructure Costs | TOD lessens costs of infrastructure by eliminating the need for expansive
utilities that would be required for sprawling suburban development.
Environmental Sustainability | TOD reduces land area needed for development and, because it generates
less traffic than other development types, has a positive affect on air quality and other types of pollution.
Creates Market Demand | Economic productivity is heightened by increased concentration of residents,
businesses, and workers due to greater market concentration and intensified competition.

Camoin Associates | Waterbury, CT Freight Street District Market Analysis 61
B | Competitive Analysis SWOT As the research and analysis advanced, the research team prepared a SWOT Analysis (strengths, weaknesses,
opportunities, threats) to inventory unique assets and understand the competitive advantages offered by those
assets. This is not meant to be an exhaustive list, simply a summary of the greatest issues and opportunities.
Waterbury SWOT Analysis
Strengths
Unique urban setting
Midway between two hospitals, each within a mile, both
committed to Waterbury
Major employer located within the district who is
committed to continue investing in the area, which can
drive local spending and bring vibrancy to area
Waterfront along Naugatuck River
Highway reconstruction will make site easily accessible
from 84
Close to train station and public transit
Culturally diverse community
City’s lead on this project and willingness to take on next
steps
Weaknesses
Few amenities in the Freight Street District to serve
existing occupants, especially restaurants/meeting spaces
Low foot traffic
Contaminated from previous industrial use must be
remediated, likely at a significant cost
Perception of environmental contamination, especially
when it comes to housing
Taxes are high compared to neighboring areas
Relatively low household incomes (median household
income is $41k compared to $70k in the state) equates to
low spending power currently
Relatively low educational attainment (17% with bachelor
degrees or higher compared to 38% in the state)
Crime rates among highest in the state
Highway construction debris onsite currently is unsightly,
gives a negative perception of area
Difficulties attracting talent and, once a company is able to
attract an employee, difficulties finding housing in the area
Limited service at the train station today
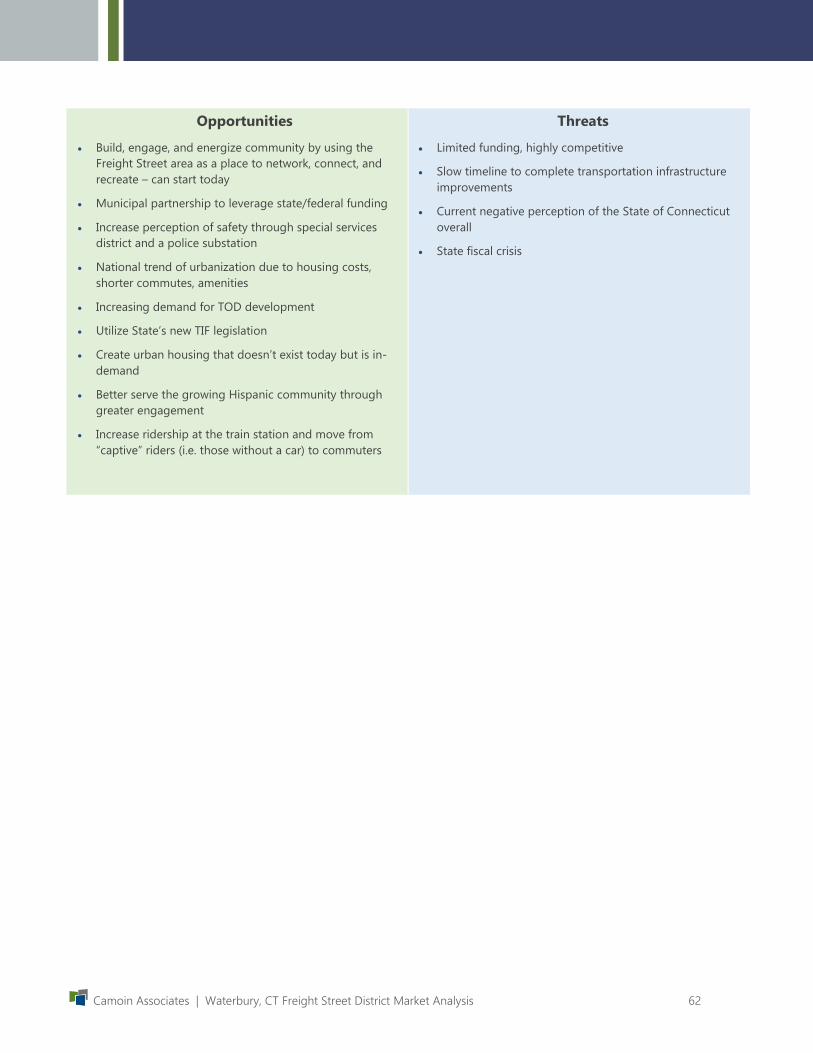
Camoin Associates | Waterbury, CT Freight Street District Market Analysis 62
Opportunities
Build, engage, and energize community by using the
Freight Street area as a place to network, connect, and
recreate – can start today
Municipal partnership to leverage state/federal funding
Increase perception of safety through special services
district and a police substation
National trend of urbanization due to housing costs,
shorter commutes, amenities
Increasing demand for TOD development
Utilize State’s new TIF legislation
Create urban housing that doesn’t exist today but is in-
demand
Better serve the growing Hispanic community through
greater engagement
Increase ridership at the train station and move from
“captive” riders (i.e. those without a car) to commuters
Threats
Limited funding, highly competitive
Slow timeline to complete transportation infrastructure
improvements
Current negative perception of the State of Connecticut
overall
State fiscal crisis

Camoin Associates | Waterbury, CT Freight Street District Market Analysis 63
C | Supplemental Maps
Figure 24: Trade Area in Comparison to Region’s Walmarts
Regional Retail Trade Area in Comparison to Region's Walmarts
Source: Esri
Walmart Store Site
Regional Retail Trade Area
15-minute drive time from Walmart store site
Camoin Associates | Waterbury, CT Freight Street District Market Analysis 64
D | Data Sources Proprietary Data Sources
Economic Modeling Specialists International (EMSI)
To analyze the industrial makeup of a study area, industry data organized by the North American Industrial
Classification System (NAICS) is assessed. Camoin Associates subscribes to Economic Modeling Specialists Intl.
(EMSI), a proprietary data provider that aggregates economic data from approximately 90 sources. EMSI industry
data, in our experience, is more complete than most or perhaps all local data sources (for more information on
EMSI, please see www.economicmodeling.com). This is because local data sources typically miss significant
employment counts by industry because data on sole proprietorships and contractual employment (i.e. 1099
contractor positions) is not included and because certain employment counts are suppressed from BLS/BEA figures
for confidentiality reasons when too few establishments exist within a single NAICS code.
Esri Business Analyst Online (BAO)
Esri is the leading provider of location-driven market insights. It combines demographic, lifestyle, and spending data
with map-based analytics to provide market intelligence for strategic decision-making. Esri uses proprietary
statistical models and data from the U.S. Census Bureau, the U.S. Postal Service, and various other sources to present
current conditions and project future trends. Esri data are used by developers to maximize their portfolio, retailers to
understand growth opportunities, and by economic developers to attract business that fit their community. For
more information, visit www.Esri.com.
CoStar Group, Inc.
CoStar is the leading source of commercial real estate intelligence in the U.S. It provides a full market inventory of
properties and spaces—available as well as fully leased—by market and submarket. Details on vacancy, absorption,
lease rates, inventory, and other real estate market data are provided, as well as property-specific information
including photos and floor plans. CoStar covers office, retail, industrial, and multifamily markets. CoStar data is
researched and verified by the industry’s largest professional research team. With 1,200 researchers and 130 field
research vehicles, CoStar’s team makes calls to property managers; reviews court filings, tax assessor records and
deeds; visits construction sites; and scans the web to uncover nearly real-time market changes. More at
www.costar.com.
Public Data Sources
American Community Survey (ACS), U.S. Census
The American Community Survey (ACS) is an ongoing statistical survey by the U.S. Census Bureau that gathers
demographic and socioeconomic information on age, sex, race, family and relationships, income and benefits, health
insurance, education, veteran status, disabilities, commute patterns, and other topics. The survey is mandatory to fill
out, but the survey is only sent to a small sample of the population on a rotating basis. The survey is crucial to major
planning decisions, like vital services and infrastructure investments, made by municipalities and cities. The
questions on the ACS are different than those asked on the decennial census and provide ongoing demographic
updates of the nation down to the block group level. For more information on the ACS, visit
http://www.census.gov/programs-surveys/acs/
OnTheMap, U.S. Census
OnTheMap is a tool developed through the U.S. Census Longitudinal Employer-Household Dynamics (LEHD)
program that helps to visualize Local Employment Dynamics (LED) data about where workers are employed and
where they live. There are also visual mapping capabilities for data on age, earnings, industry distributions, race,
ethnicity, educational attainment, and sex. The OnTheMap tool can be found here, along with links to documentation: http://onthemap.ces.census.gov/

Camoin Associates | Waterbury, CT Freight Street District Market Analysis 65
E | Tapestry Segmentation Note that the number is parentheses following each tapestry segment is the percent of households in the Waterbury
retail trade area that fall into that segment. Demographic information for each segment is reflective of the U.S. as a
whole and is not specific to Waterbury.
Front Porches (20.6%)
Average Household Size: 2.55
Median Age: 34.2
Median Household Income: $39,000
Front Porches blends household types, with more young families with children or single households than average.
This group is also more diverse than the US. Half of householders are renters, and many of the homes are older
town homes or duplexes. Friends and family are central to Front Porches residents and help to influence household
buying decisions. Residents enjoy their automobiles and like cars that are fun to drive. Income and net worth are
well below the US average, and many families have taken out loans to make ends meet. Read more>>
Parks and Rec (18.1%)
Average Household Size: 2.49
Median Age: 40.3
Median Household Income: $55,000
These practical suburbanites have achieved the dream of home ownership. They have purchased homes that are
within their means. Their homes are older, and town homes and duplexes are not uncommon. Many of these
families are two-income married couples approaching retirement age; they are comfortable in their jobs and their
homes, budget wisely, but do not plan on retiring anytime soon or moving. Neighborhoods are well established, as
are the amenities and programs that supported their now independent children through school and college. The
appeal of these kid-friendly neighborhoods is now attracting a new generation of young couples. Read more>>
Fresh Ambitions (12.2%)
Average Household Size: 3.13
Median Age: 28.0
Median Household Income: $26,000
These young families, many of whom are recent immigrants, focus their life and work around their children. Fresh
Ambitions residents are not highly educated, but many have overcome the language barrier and earned a high
school diploma. They work overtime in service, in skilled and unskilled occupations, and spend what little they can
save on their children. Multigenerational families and close ties to their culture support many families living in
poverty; income is often supplemented with public assistance and Social Security. Residents spend more than one-
third of their income on rent, though they can only afford to live in older row houses or multiunit buildings. They
budget wisely not only to make ends meet but also to save for a trip back home. Read more>>
Savvy Suburbanites (10.8%)
Average Household Size: 2.83
Median Age: 44.1

Camoin Associates | Waterbury, CT Freight Street District Market Analysis 66
Median Household Income: $104,000
Savvy Suburbanites residents are well educated, well read, and well capitalized. Families include empty nesters and
empty nester wannabes, who still have adult children at home. Located in older neighborhoods outside the urban
core, their suburban lifestyle includes home remodeling and gardening plus the active pursuit of sports and exercise.
They enjoy good food and wine, plus the amenities of the city’s cultural events. Read more>>
Pleasantville (5.2%)
Average Household Size: 2.86
Median Age: 41.9
Median Household Income: $48,000
Prosperous domesticity best describes the settled denizens of Pleasantville. Situated principally in older housing in
suburban areas in the Northeast (especially in New York and New Jersey) and secondarily in the West (especially in
California), these slightly older couples move less than any other market. Many couples have already transitioned to
empty nesters; many are still home to adult children. Families own older, single-family homes and maintain their
standard of living with dual incomes. These consumers have higher incomes and home values and much higher net
worth (Index 400). Older homes require upkeep; home improvement and remodeling projects are a priority—
preferably done by contractors. Residents spend their spare time participating in a variety of sports or watching
movies. They shop online and in a variety of stores, from upscale to discount, and use the Internet largely for
financial purposes. Read more>>
Social Security Set (0.8%)
Average Household Size: 1.72
Median Age: 44.2
Median Household Income: $16,000
Social Security Set is an older market located in metropolitan cities across the country. Over one-third of
householders here are aged 65 or older and dependent on low, fixed incomes, primarily Social Security. In the
aftermath of the Great Recession, early retirement is now a dream for many approaching the retirement age; wages
and salary income in this market are still earned. Residents live alone in low-rent, high-rise buildings, located in or
close to business districts that attract heavy daytime traffic. But they enjoy the hustle and bustle of life in the heart
of the city, with the added benefit of access to hospitals, community centers, and public transportation. Read more>
>
Midlife Constants (2.5%)
Average Household Size: 2.30
Median Age: 44.9
Median Household Income: $48,000
Midlife Constants residents are seniors, at or approaching retirement, with below average labor force participation
and above average net worth. Although located in predominantly metropolitan areas, they live outside the central
cities, in smaller communities. Their lifestyle is more country than urban. They are generous, but not spendthrifts.
Read more> >
Camoin Associates | Waterbury, CT Freight Street District Market Analysis 67
F | Stakeholder Interviews Thank you to the following individuals for donating your time and offering insight to this project:
Gerry Matthews – Matthews Commercial Prosperities, LLC
Michael O’Connor – Corporate Real Estate Webster Bank
Dom Giglio – Giglio Commercial Real Estate
Frank Monterio – MacDermid, Inc.
John McGrath – City Economic Development
James Sequin – City of Waterbury, Planner
Gary O’Connor – Pullman & Comley Attorneys
Matthew Edvardsen – Spinnaker Real Estate Partners
Kyle Richards – Metro Reality Group
Kathleen McNamara – Grant Administrator
Tom Hill – Tom Hill Realty and Investment
Saint Mary’s Hospital

Camoin Associates | Waterbury, CT Freight Street District Market Analysis 68
Camoin Associates, Inc.
120 West Avenue, Suite 303
Saratoga Springs, NY 12866
518.899.2608
www.camoinassociates.com
@camoinassociate