water vapour permeability of poly(lactic acid) nanocomposites · loughborough university...
TRANSCRIPT
Loughborough UniversityInstitutional Repository
Water vapour permeabilityof poly(lactic acid)nanocomposites
This item was submitted to Loughborough University's Institutional Repositoryby the/an author.
Citation: DUAN, Z., THOMAS, N.L. and HUANG, W., 2013. Water vapourpermeability of poly(lactic acid) nanocomposites. Journal of Membrane Science,445, pp. 112 - 118.
Additional Information:
• This article was accepted for publication in the Journal of Mem-brane Science [ c© Elsevier]. The definitive version is available at:http://dx.doi.org/10.1016/j.memsci.2013.06.008
Metadata Record: https://dspace.lboro.ac.uk/2134/17975
Version: Accepted for publication
Publisher: c© Elsevier B.V.
Rights: This work is made available according to the conditions of the Cre-ative Commons Attribution-NonCommercial-NoDerivatives 4.0 International(CC BY-NC-ND 4.0) licence. Full details of this licence are available at:https://creativecommons.org/licenses/by-nc-nd/4.0/
Please cite the published version.
1
Water Vapour Permeability of Poly(Lactic Acid) Nanocomposites
Z. Duan, N. L. Thomas* and W. Huang
Department of Materials, Loughborough University, Ashby Road,
Loughborough, Leicestershire, LE11 3TU, UK *[email protected], Tel. +44(0)1509223334
ABSTRACT
A series of poly(lactic acid) (PLA) nanocomposites containing from 1 up to 6 weight % of montmorillonite layered silicate were prepared by melt compounding followed by compression moulding. The morphology of the nanocomposites was investigated using transmission electron microscopy (TEM) and wide-angle X-ray diffraction (WAXD) and it was confirmed that the nanocomposite structures were intercalated. The average aspect ratio of the compounded nanoclay was found to be 50. Water vapour transmission rates (WVTR) through the films were measured at 38°C and at a relative humidity of 90%. It was found that the measured values of WVTR decreased with increasing nanoclay content up to a value of 5 weight % and the results gave good agreement with predictions from the Nielsen ‘tortuous path’ model. Key Words: poly(lactic acid); polylactide; montmorillonite; water vapour permeability; nanocomposite; INTRODUCTION
Poly(lactic acid) (PLA) is a compostable thermoplastic that is synthesised from lactic acid, which is derived from renewable resources. It is one of the most commercially successful of the bio-derived polymers and is widely used in biomedical applications because of its biocompatibility and also in packaging and other short-life disposable products [1]. Lactic acid is first produced by fermentation of a carbohydrate feedstock, such as maize sugar, and is then extracted and polymerised. PLA, also known as poly(lactide), is produced commercially by ring-opening polymerization of the lactide, which is a cyclic dimer composed of two lactic acid units [1,2]. Lactic acid contains an asymmetric carbon atom and therefore exists in two optically active isomers (D and L). Hence three optically isomeric forms of lactide are possible: L-lactide (a dimer of L-lactic acid), D-lactide (a dimer of D-lactic acid) and meso-lactide (a dimer of L- and D-lactic acid). The crystallisable content of PLA is determined by the ratio of L-, D- and meso- lactide in the polymer: higher
2
crystallinities are obtained with the more optically pure polymers because of their higher chain symmetry. Although compostable polymers provide added advantages in terms of end-of-life disposal and would seem to be ideal for food packaging and disposable items, they often have poor technical performance in terms of both mechanical and barrier properties compared with conventional thermoplastics. It is unsurprising that compostable/biodegradable polymers have relatively high water vapour permeabilities given that they are polar polymers with relatively high values of water vapour solubility, and water permeability in polymer films is usually dominated by the solubility of water in the polymer. For example, Shogren [3] has measured the water vapour transmission rates (WVTR) of a number of biodegradable polymers and demonstrated a correlation between WVTR and water solubility, together with crystallinity and the effect of the glass transition temperature (Tg). Hydrolysis reactions should also be considered because this is essentially the mechanism by which degradation takes place. PLA is well established in biomedical applications by virtue of its biocompatibility and biodegradability. It is a polyester and undergoes hydrolysis reactions in which the ester bonds are cleaved and molecular weight is reduced. This process can take place in the presence of water alone but it is greatly accelerated by catalysts such as enzymes. Siparsky et al [4] investigated hydrolysis in PLA films at 90% relative humidity and at temperatures between 20 and 50ºC and demonstrated that hydrolysis in PLA films is a very slow process compared with water vapour diffusion. Improvement in barrier properties is one of the most notable successes of polymer/clay nanocomposites. Some quite dramatic reductions in permeability with relatively low additions of nanoclay have been reported. For example, Yano et al [5] synthesized polyimide-clay nanocomposites with four different sizes of clay mineral to examine the effect of the size of the filler particles on the barrier properties. The minerals investigated were hectorite, saponite, montmorillonite and synthetic mica. It was found that the longer the length of clay mineral, the greater the improvement in barrier properties. In the case of the polyimide-mica composite, an addition of only 2 wt % of synthetic mica reduced the permeability coefficient of water vapour to a value less than one-tenth of that of the unfilled polyimide. It is generally accepted that the reason for the observed improvements in barrier properties (to both water vapour and gases) is the so-called ‘tortuous path’ model in which gas or liquid molecules have a greatly increased diffusion path length due to the obstacle imposed by the impervious clay
3
f
f
m
c
VDL
V
P
P
.2
1
1
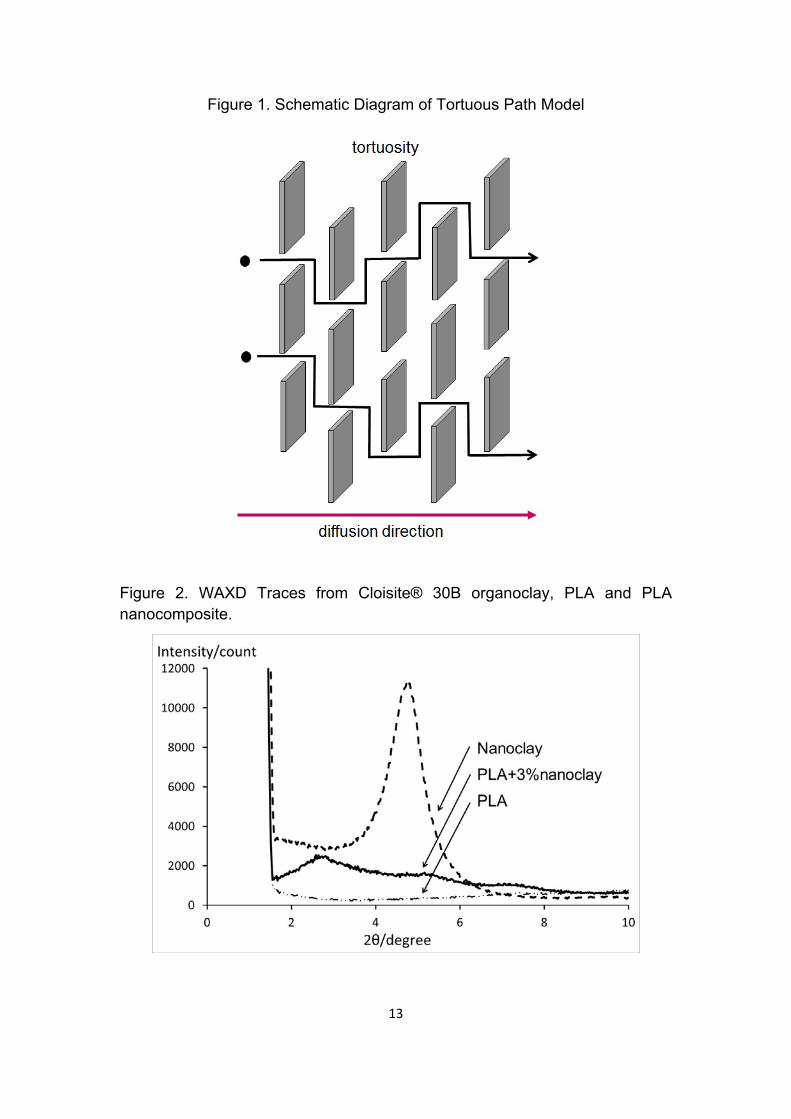
platelets. This is illustrated in Figure 1. It is assumed that rectangular clay platelets are aligned perpendicular to the diffusion direction. This model was first proposed and quantified by Nielsen [6]. The Nielsen equation is given in equation 1, where Pc is the permeability of the polymer composite, Pm is the permeability of the unfilled polymer matrix, Vf is the volume fraction of filler and L/D is the aspect ratio (length/thickness) of the filler.
……………………………………………………….. (1)
Choudalakis and Gotsis [7] have reviewed a large number of studies on the gaseous permeability of polymer nanocomposites, including a number of other models proposed to predict permeability. A common feature of the various models is that the relative permeability depends on the volume fraction of the nanofiller, the aspect ratio of the platelets and their orientation. The relative permeability seems to be independent of both the gas species and the polymer type in the matrix. It is concluded that where the geometric parameters of the polymer nanocomposite system are known, then the Nielsen model, which is the simplest, is reasonably successful in predicting permeability. PLA nanocomposites have been reported to give improvements in mechanical properties, barrier properties and biodegradability [8, 9]. For example, Ray et al [10] have found significant improvements in storage modulus with increasing nanoclay loadings in dynamic mechanical analysis (DMA) tests carried out over a wide temperature range. The enhancement of modulus is due to the reinforcing effect of incorporating a high modulus platy filler to a lower modulus polymer. The improvement in modulus was not found to hinder biodegradability. In fact a significant improvement in biodegradability after nanoclay preparation has been observed [11]. The gas barrier properties of PLA nanocomposites have been reported by a number of workers [10, 12 – 15]. In particular oxygen barrier is highly relevant for food packaging applications. Oxygen permeability is reported to be reduced by values of around 25% [12, 13], 48% [15], 55% [14] and up to 80% [10] depending on the type and amount of nanoclay added, as well as its dispersion and aspect ratio in the PLA composite film. There are a limited number of studies on the water vapour permeability of PLA nanocomposites. Thellen et al [15] have reported a 50% improvement in water vapour barrier compared with neat PLA when a loading of 5 weight % nanoclay was used to make PLA nanocomposites that were prepared by twin-
4
screw extrusion and converted to blown films. Zenkiewicz and Richert [14] found the best result was a 60% decrease water vapour permeability of a PLA nanocomposite containing 5 weight % nanoclay to which 20 weight % PMMA had been added. Rhim et al [16] prepared PLA nanocomposites with increasing amounts of Cloisite 20A by solvent casting. It was found that with a high clay loading of 13 weight %, the improvement in water vapour barrier was around 67%. The purpose of this study is to investigate whether water permeation through PLA/clay nanocomposites can be quantified in terms of a tortuous path model. PLA nanocomposites containing from 1 up to 6 weight % of montmorillonite layered silicate are prepared by melt compounding followed by compression moulding. The morphology, thermal properties and water vapour transmission rates of these nanocomposites are investigated. The study examines how nanoclay concentration and dispersion affect the water vapour barrier properties of poly(lactic acid). Transmission electron microscopy is used to examine the alignment of the clay platelets and measure their aspect ratio. The results are then interpreted in terms of a tortuous path model. EXPERIMENTAL
Materials
Two grades of polylactide (PLA) polymer (IngeoTM 4060D and 4032D) were supplied by Natureworks LLC (Minetonka, MN, USA). 4060D is an amorphous polymer with an average D-lactide content of 12 weight % and a glass transition temperature (Tg) of 55-60ºC, whereas 4032D is semi-crystalline with an average D-lactide content of 1.4 weight % and a melting point in the range 155-170ºC. The weight average molecular weights (Mw) of the two polymers as determined by gel permeation chromatography (GPC) were found to be 89,000 g/mol and 94,000 g/mol respectively. The specific gravity is 1.24 g/cm3.
The nanoclay used in this study was Cloisite® 30B obtained from Southern Clay Products (Gonzales, TX, USA). It is a montmorillonite layered silicate that has been organically modified with an alkyl quaternary ammonium salt. This has the effect of lowering the surface energy of the clay and thereby improving its compatibility with the polymer matrix. It has a specific gravity of 1.98 g/cm3.
Preparation and Processing of the PLA Nanocomposites
Before processing, the PLA granules were dried at 60°C for 24 hours in a vacuum oven to remove excess moisture. The PLA was then melt blended with 20 weight% of the Cloisite® 30B organoclay to make a masterbatch. Melt
5
blending was carried out in a counter-rotating mixer (Haake Rheomix OS) to promote dispersive and distributive mixing. The total sample weight added to the mixer was 58g and mixing was carried out at 170°C for 10 minutes with a constant rotor speed of 60 rpm. The masterbatch was then diluted by adding dried PLA to form further compositions ranging from 1% - 6% clay, based on the weight, and then mixed in the mixer at 170°C and 60 rpm for a further 10 minutes. Due to the limited production capacity of the Haake mixer, batch production was employed to produce sufficient material for each percentage composition of clay. The control PLA material was processed in the same way, so that it had the same thermal history as the PLA nanocomposites.
Samples for water vapour permeability measurements were then prepared by compression moulding in a 20 ton hydraulic press. The materials were hot pressed at 180°C and the melt compressed for three minutes at 15 tons pressure, followed by cooling to room temperature over a period of three minutes at a pressure of 5 tons. The average thickness of the samples produced was 0.6 mm.
Characterisation Techniques
X-Ray Diffraction
PLA nanocomposite samples were examined by wide-angle X-ray diffraction (WAXD) in order to investigate the extent of intercalation or exfoliation of the montmorillonite clay. X-Ray diffraction data were collected on a Brucker D8 Diffractometer using graphite-filtered Cu-Kα radiation (λ = 1.542nm). The diffractometer was controlled using Diffrac Plus XRD Commander and the raw data was manipulated using EVA software. The PLA/organoclay nanocomposite sheets were laid flat on an aluminium block, the height of which was adjusted so that the sample surface was the reference plane of the instrument.
Transmission Electron Microscopy
Samples for transmission electron microscopy (TEM) were prepared by first cutting the compression moulded sheets into a pencil-like point and then shaving off thin slices (approximately 100 nm thick) at room temperature using a Cambridge Instruments ultra-microtome fitted with a diamond edge blade. A reservoir of de-ionised water was used to contain the pieces of sample. The samples were then scooped onto a copper mesh and left to dry before being observed in a JEOL, JEM – 2000FX transmission electron microscope operated at an accelerating voltage of 100kV.
The aspect ratios of the nanoclay filler particles within the PLA matrix were measured from the TEM micrographs using Image J® software.
6
Differential Scanning Calorimetry (DSC)
The melting and crystallisation behaviour of the composites was investigated using differential scanning calorimetry (DSC). Measurements were performed using a DSC Q200 (TA Instruments, USA) fitted with an auto-sampler and mechanical cooler. Samples of approximately 10~16 mg in mass were put into sealed aluminium pans and loaded into the auto-sampler. The samples were heated from 20°C to 200° C at 10°C/min in a nitrogen atmosphere. Data was analysed using the TA universal analysis software package. All the values represent the average of 3 samples.
The amount of overall crystallinity was calculated using Equation 2.
%100**1.93
%
w
HHityCrystallin cm
------------- (2)
In Equation 2, Hm (j/g), is the measured heat of fusion (melting enthalpy),
Hc (j/g) is the enthalpy of cold crystallization and 93.1 (j/g) is the enthalpy of fusion for 100 % crystalline PLA. For composites of PLA, the weight fraction of the PLA (w) needs to be considered in calculating the percentage crystallinity.
Water Vapour Permeability Measurements
Water vapour transmission rates (WVTR) through the various PLA sheets were measured using a MOCON (Modern Controls Inc., USA) Permatran-W@398 operated at 38°C and a relative humidity of 90%. Four samples were measured for each filler concentration.
RESULTS AND DISCUSSION
X-Ray Diffraction
The wide-angle X-ray diffraction (WAXD) traces from Cloisite® 30B organoclay, PLA and PLA nanocomposite containing 3 weight% of nanoclay are shown in Figure 2. The signal due to C30B has a 2θ value of 4.8º, which corresponds to an interlayer spacing of 18.4 Å. In the trace from the PLA nanocomposite, it is seen that the peak has shifted to give a 2θ value of 2.6º. This corresponds to an interlayer spacing of 34 Å and thus demonstrates a widening of the clay interplanar spacing, showing that intercalation has occurred.
This result is in agreement with other published WAXD data for PLA nanocomposites. For example, Thellen et al [15] reported that the interplanar spacing in montmorillonite layered silicates was 18.7 Å and this increased to 32 Å in PLA nanocomposites produced by blown film extrusion. McLauchlin
7
and Thomas [17] have reported that Cloisite® 30B organoclay has an interplanar spacing of 18.1 Å and this increased to 34.8 Å in intercalated PLA nanocomposites produced by solvent casting.
Transmission Electron Microscopy
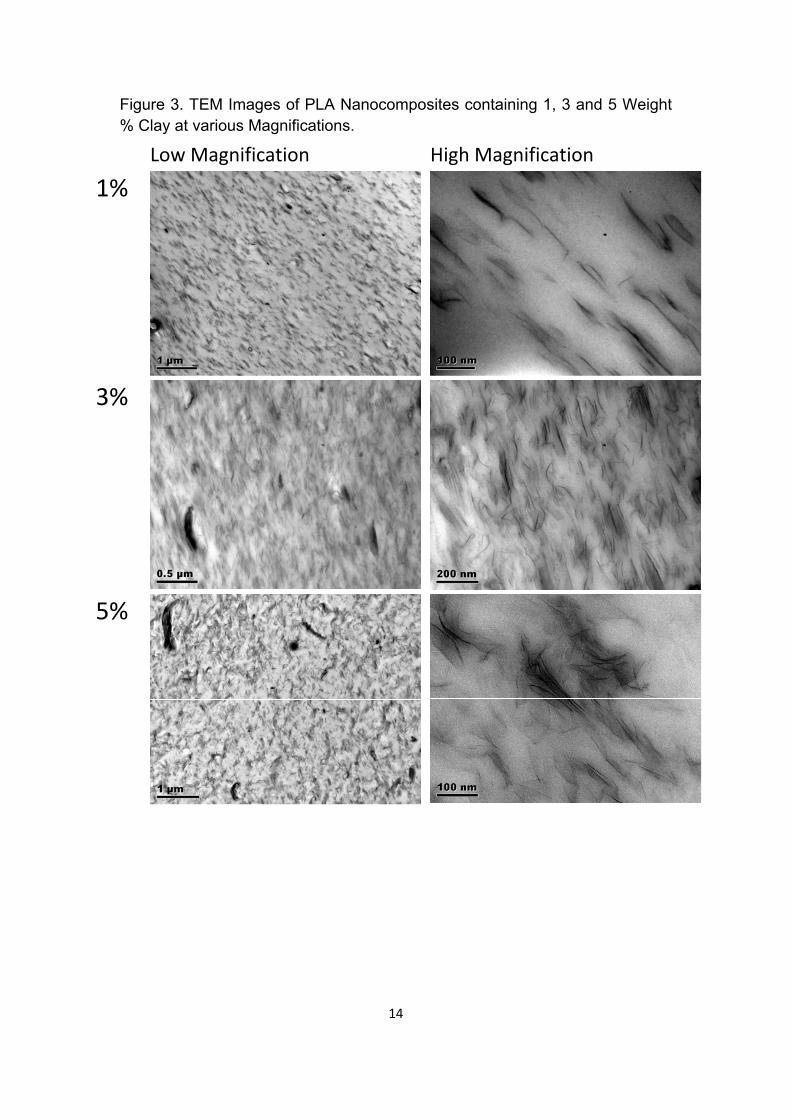
Transmission electron micrographs of PLA nanocomposites containing 1, 3 and 5 weight % clay at various magnifications are shown in Figure 3. These micrographs indicate that the clay particles are well dispersed and have become aligned in the flow direction when the polymer melt was sheared between the two rotors in the torque rheometer, and that the orientation is maintained when the melt is pressed into the sheet samples.
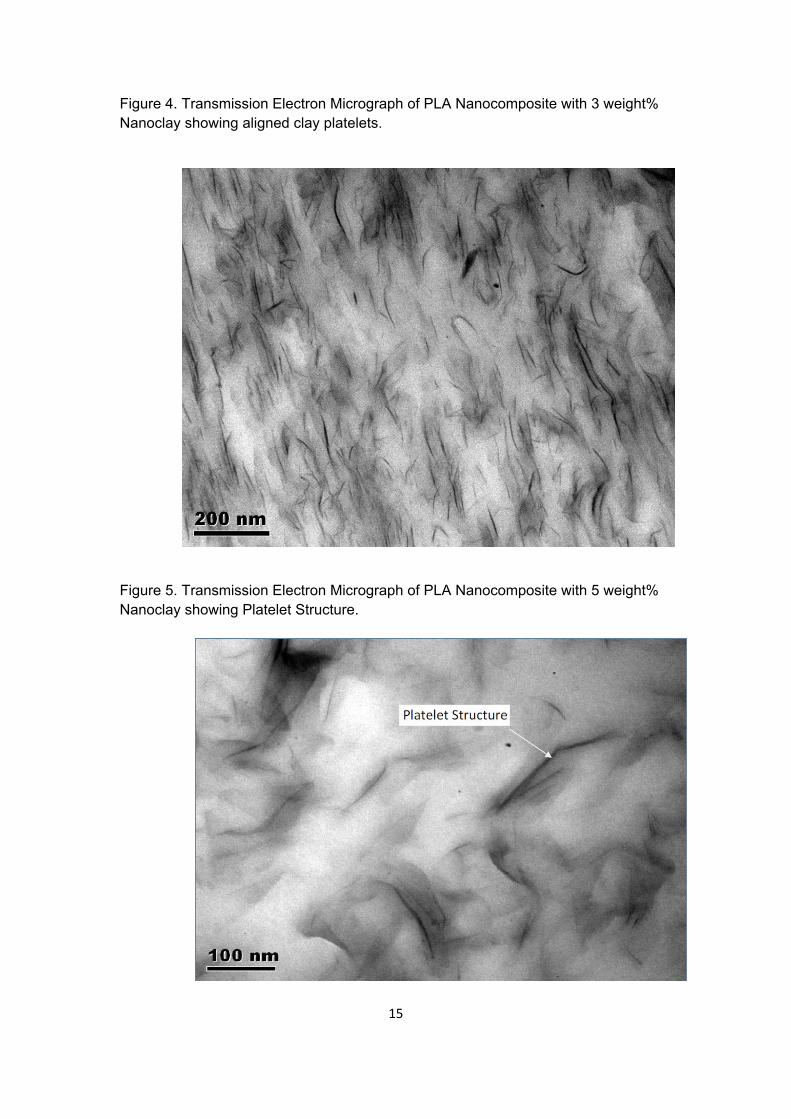
The intercalated nanocomposite structure is shown in more detail in Figure 4, which is a micrograph of a 3 weight % nanoclay sample at 100k magnification. The lines in the micrograph are the edges of the clay platelets.
A more detailed view of the clay platelet structure can be seen in Figure 5. This shows a 5 weight % nanoclay sample at 200k magnification. The corner and edges of the clay platelet structure are clearly visible. Image processing software was used to determine that the thickness of a single clay platelet was 1.6 nm.
The average length of the nanoclay platelets within the PLA matrix was measured from the TEM micrographs using Image J® software. The average value of the length for concentrations of clay of 3 weight % was found to be 80 nm. Hence the average aspect ratio (length/thickness) was taken as 50 and this was the value used in subsequent tortuosity calculations.
Differential Scanning Calorimetry (DSC)
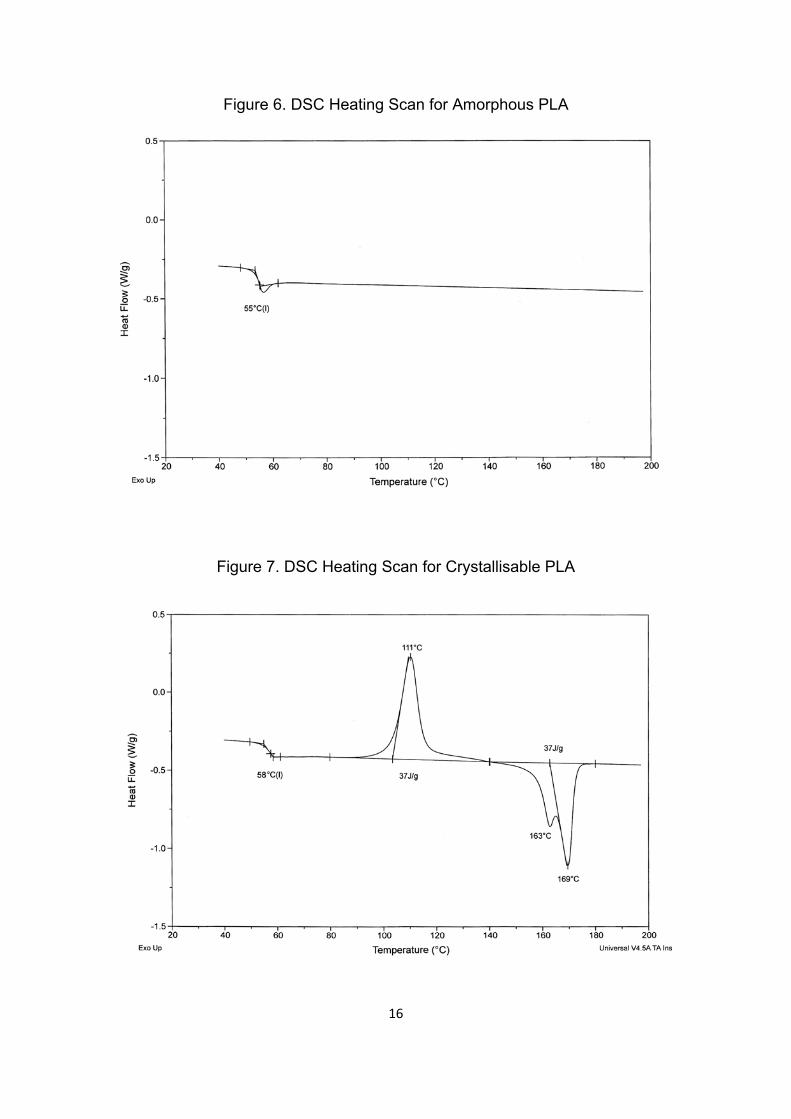
Figure 6 shows the DSC first heating scan for amorphous PLA, grade 4060D. The step change at 55ºC corresponds to the glass transition temperature (Tg) of the polymer. The peak just after the step change represents an enthalpic relaxation peak. This has been reported for PLA by other workers [13, 15, 18] and is ascribed to relaxation of non-equilibrium structure. It is clear from Figure 6 that there is no cold crystallisation temperature (Tc) and neither is there any melting point (Tm), thus confirming the amorphous nature of the samples.
The DSC scans for all the PLA 4060D nanocomposites were the same as Figure 6, with an average Tg in the range 55 ± 1ºC. It was concluded that there was no significant change in glass transition temperature due to the presence of the nanoclay. Again this is in agreement with the findings on PLA nanocomposites of some previous studies [11, 13, 15, 18].

8
Figure 7 shows the DSC trace (first heating scan) for the crystallisable PLA, grade 4032D. In this case the Tg is 58ºC and there is no enthalpic relaxation peak. The exothermic peak at 111 ºC corresponds to cold crystallisation i.e. crystallisation on heating above the Tg. There is a double melting peak at temperatures of 163 and 169 ºC. The lower peak corresponds to melting of the α’ phase, which is the disordered crystalline form [19], whereas the higher temperature peak corresponds to melting of the α phase, which is the ordered crystalline form.
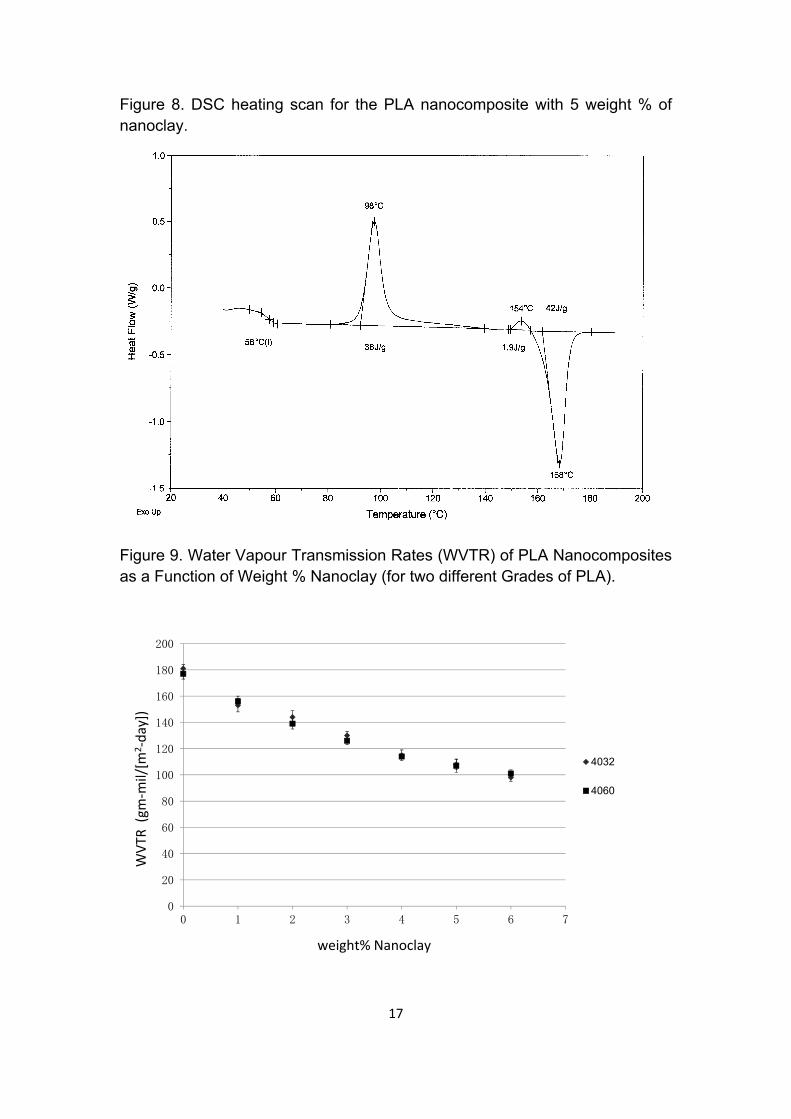
Nanocomposites made from the crystallisable grade of PLA were found to have slightly different DSC heating scans from the virgin polymer, as shown in Figure 8, which is the DSC heating scan for the PLA nanocomposite with 5 weight % of nanoclay. Here it can be seen that although the Tg is still at 58ºC, the temperature of the cold crystallisation peak has reduced to 98ºC. Also the double melting peak has largely disappeared being replaced by one peak at the higher melting temperature, corresponding to the ordered crystalline form. However, there is a small exothermic peak at 154°C corresponding to a change of crystal morphology before melting. These small peaks were found in the DSC traces of all the PLA 4032D nanocomposites at temperatures of 155±1°C.
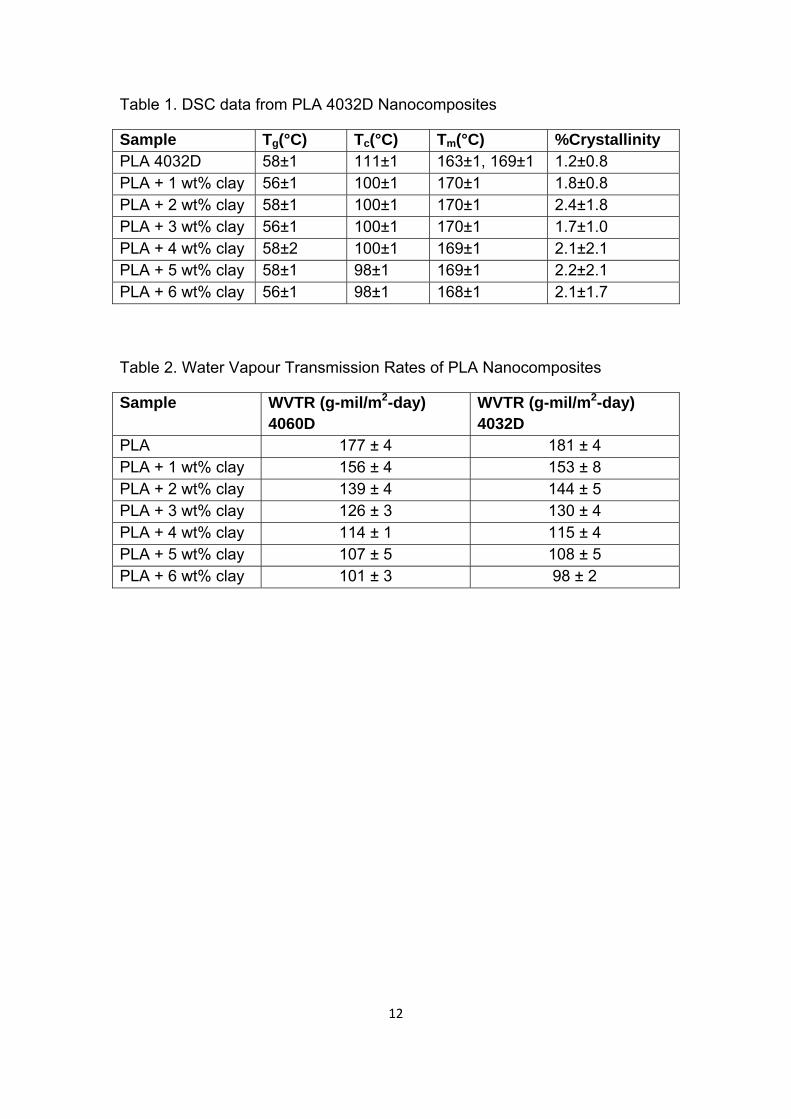
Table 1 summarizes the DSC data from the PLA 4032D nanocomposites. It can be seen that there is no significant change in glass transition temperature (Tg) with addition of nanoclay, as found for the amorphous PLA. There is, however, a significant reduction in the cold crystallisation temperature (Tc). This indicates that the nanoclay platelets can facilitate nucleation of PLA crystallites. Furthermore, the disappearance of the lower temperature melting point (Tm) with addition of nanoclay indicates that the nanoclay particles promote formation of the ordered crystalline phase.
Water Vapour Permeability Measurements Water vapour transmission rates (WVTR) as measured through the PLA sheets processed from the amorphous polymer, 4060D, and those from the crystallisable PLA, 4032D, are shown in Table 2. Four samples were measured for each data point. It is found from both data sets that there is a significant reduction in WVTR with increasing clay content, which starts to level off at clay additions above 5 weight %. Both data sets are plotted in Figure 9, where it is seen that there is good reproducibility between the two polymers. As discussed above, although 4032D is a crystallisable grade of PLA, samples were cooled quickly in the compression moulding machine and so significant crystallisation did not take place. Hence the reduction in permeability is due to the effect of the nanoclay.
9
For a 5 wt% addition of nanoclay, there was found to be a reduction in WVTR of 40%. This result compares with data reported by Thellen et al [15], who incorporated 5 wt% of organically modified montmorillonite into plasticised PLA blown films and reported a 50% improvement in water vapour barrier. The effect of nanoclay on the barrier properties of polymers can be quantified by the ‘tortuous path’ theory due to Nielsen [6], which, as previously discussed is the generally accepted explanation of observed reductions in permeability due to platey fillers. The Nielsen equation is given in equation 1, which was used to predict the water vapour permeability of the PLA composites given that the aspect ratio is 50, the density of PLA is 1.24 g/cm3 and the density of the montmorillonite is 1.98 g/cm3. The values predicted from the Nielsen model are compared with the measured values in the plot of permeability versus clay volume fraction in Figure 10. The trend line predicted by the Nielsen model lies just below that of the experimental data. Hence the experimental data give a reasonably good fit to the Nielsen model, which predicts the maximum improvement in barrier properties, assuming that the clay platelets are 100% intercalated or exfoliated and perfectly aligned. CONCLUSIONS PLA nanocomposites containing from 1 up to 6 weight % of montmorillonite layered silicate have been prepared by melt compounding followed by compression moulding. It was confirmed that the nanocomposite structures were intercalated using both transmission electron microscopy (TEM) and wide-angle X-ray diffraction (WAXD). Results from WAXD analysis showed that the clay interlayer spacing increased from 1.84 to 3.4 nm. TEM micrographs indicated that the clay particles were well dispersed and aligned in the flow direction of the polymer melt. Using image processing software it was used found that the thickness of a single clay platelet was 1.6 nm. The average length of the nanoclay platelets within the PLA matrix was measured from the TEM micrographs and found to be 80 nm, thus giving an average aspect ratio (length/thickness) of 50.
The DSC data showed that addition of nanoclay had no effect on the glass transition temperature (Tg) of either amorphous or crystallisable PLA. However, there was a significant reduction in the cold crystallisation temperature (Tc), indicating that the nanoclay platelets facilitated nucleation of PLA crystallites. The disappearance of the lower temperature melting point (Tm) with addition of nanoclay also showed that the nanoclay particles promoted formation of the ordered crystalline phase.
10
Measured values of water vapour permeability of the PLA nanocomposites were compared with values from the Nielsen tortuosity model. The trend line predicted by the Nielsen model lay just below that of the experimental data, showing a reasonably good fit given that the model assumes that the clay platelets are 100% intercalated or exfoliated and perfectly aligned.
ACKNOWLEDGEMENTS
The authors would like to acknowledge technical assistance from Dr Zhaoxia Zhou and Mr Keith Yendall, Department of Materials, Loughborough University, for transmission electron microscopy (TEM) and wide-angle X-ray diffraction (WAXD) respectively. The authors are also grateful for funding for this work from the Engineering & Physical Sciences Research Council (EPSRC) and PepsiCo International Ltd. REFERENCES
1. R. Auras, B. Harte and S. Selke, An overview of polylactides as packaging materials, Macromol Biosci, 4 (2004), 835-864
2. D. Garlotta, A Literature Review of Poly(Lactic Acid), J Polym Environ, 9 (2001), 63-84.
3. R. Shogren, Water Vapor Permeability of Biodegradable Polymers, J Environ Polym Degr, 5 (1997), 91-95.
4. G. L. Siparsky, K. J. Voorhees, J. R. Dorgan and K. Schilling, Water Transport in Polylactic Acid (PLA), PLA/Polycaprolactone Copolymers, and LA/Polyethylene Glycol Blends, J Environ Polym Degr, 5 (1997), 125-136.
5. K. Yano, A. Usuki and A. Okada, Synthesis and properties of polyimide-clay hybrid films, J Polym Sci A: Polym Chem 35 (1997), 2289–2294,.
6. L. E. Nielsen, Models for the Permeability of Filled Polymer Systems, J. Macromol. Sci. (Chem.), A1 (1967), 929-942
7. G. Choudalakis and A.D. Gotsis, Permeability of polymer/clay nanocomposites: A review, Eur Polymer J, 45(2009), 967-984,
8. SS Ray, K Yamada, A Ogami, M Okamoto, K Ueda, New Polylactide/Layered Silicate Nanocomposite: Nanoscale Control Over Multiple Properties, Macromol Rapid Commun, 23 (2003), 943-947.
9. A. R. McLauchlin and N. L. Thomas, Biodegradable Nanocomposites, Chapter 13, in Advances in Polymer Nanocomposites, Ed F. Gao, Woodhead Publishing, Cambridge, UK, 2012, pp. 398 – 430,.
11
10. S. S. Ray, K. Yamada, M. Okamoto, A. Ogami and K. Ueda, New polylactide/layered silicate nanocomposites. 3. High-performance biodegradable materials, Chem. Mater., 15(2003), 1456 – 1465.
11. S. S. Ray, K. Yamada, M. Okamoto and K. Ueda, New polylactide-layered silicate nanocomposites. 2. Concurrent improvements of material properties, biodegradability and melt rheology, Polymer, 44 (2003), 857 – 866.
12. S. S. Ray, K. Yamada, M. Okamoto and K. Ueda, Biodegradable Polylactide/Montmorillonite Nanocomposites, J. Nanosci. Nanotechnol., 3(2003), 503 – 510.
13. E. Picard, E. Espuche and R. Fulchiron, Effect of an organo-modified montmorillonite on PLA crystallization and gas barrier properties , Appl. Clay Sci., 53(2011), 58-65,.
14. M. Zenkiewicz and J. Richert, Permeability of polylactide nanocomposite films for water vapour, oxygen and carbon dioxide, Polym. Test., 27 (2008), 835-840,.
15. C. Thellen, C. Orroth, D. Froio, D. Ziegler, J. Lucciarini, R. Farrell, N. A. D’Souza, J. A. Ratto, Influence of montmorillonite layered silicate on plasticized poly(L-lactide) blown films, Polymer, 46(2005), 11716–11727,
16. J. W. Rhim, S. I. Hong and C. S. Ha, Tensile, water vapor barrier and antimicrobial properties of PLA/nanoclay composite films , LWT-Food Sci. Technol., 42(2009), 612–617.
17. A. R. McLauchlin and N. L. Thomas, Preparation and thermal characterisation of poly(lactic acid) nanocomposites prepared from organoclays based on an amphoteric surfactant, Polym Degrad Stabil, 94(2009), 868-872.
18. M. Pluta, Morphology and properties of polylactide modified by thermal treatment, filling with layered silicates and plasticization, Polymer, 45 (2004), 8239–8251.
19. P. Pan, B. Zhu, W. Kai, T. Dong, Y. Inoue, Polymorphic Transition in Disordered Poly(l-lactide) Crystals Induced by Annealing at Elevated Temperatures, Macromolecules, 41(2008), 4296–4304.
12
Table 1. DSC data from PLA 4032D Nanocomposites
Sample Tg(°C) Tc(°C) Tm(°C) %Crystallinity PLA 4032D 58±1 111±1 163±1, 169±1 1.2±0.8 PLA + 1 wt% clay 56±1 100±1 170±1 1.8±0.8 PLA + 2 wt% clay 58±1 100±1 170±1 2.4±1.8 PLA + 3 wt% clay 56±1 100±1 170±1 1.7±1.0 PLA + 4 wt% clay 58±2 100±1 169±1 2.1±2.1 PLA + 5 wt% clay 58±1 98±1 169±1 2.2±2.1 PLA + 6 wt% clay 56±1 98±1 168±1 2.1±1.7
Table 2. Water Vapour Transmission Rates of PLA Nanocomposites
Sample WVTR (g-mil/m2-day) 4060D
WVTR (g-mil/m2-day) 4032D
PLA 177 ± 4 181 ± 4 PLA + 1 wt% clay 156 ± 4 153 ± 8 PLA + 2 wt% clay 139 ± 4 144 ± 5 PLA + 3 wt% clay 126 ± 3 130 ± 4 PLA + 4 wt% clay 114 ± 1 115 ± 4 PLA + 5 wt% clay 107 ± 5 108 ± 5 PLA + 6 wt% clay 101 ± 3 98 ± 2
13
Figure 1. Schematic Diagram of Tortuous Path Model
Figure 2. WAXD Traces from Cloisite® 30B organoclay, PLA and PLA nanocomposite.
14
Figure 3. TEM Images of PLA Nanocomposites containing 1, 3 and 5 Weight % Clay at various Magnifications.
Low Magnification High Magnification
1%
3%
5%
15
Figure 4. Transmission Electron Micrograph of PLA Nanocomposite with 3 weight% Nanoclay showing aligned clay platelets.
Figure 5. Transmission Electron Micrograph of PLA Nanocomposite with 5 weight% Nanoclay showing Platelet Structure.
16
Figure 6. DSC Heating Scan for Amorphous PLA
Figure 7. DSC Heating Scan for Crystallisable PLA
17
Figure 8. DSC heating scan for the PLA nanocomposite with 5 weight % of nanoclay.
Figure 9. Water Vapour Transmission Rates (WVTR) of PLA Nanocomposites as a Function of Weight % Nanoclay (for two different Grades of PLA).
0
20
40
60
80
100
120
140
160
180
200
0 1 2 3 4 5 6 7
4032
4060
weight% Nanoclay
WVTR
(gm
‐mil/[m
2‐day])

18
Figure 10. Comparison of Measured Values with those predicted from the Nielsen Model.
0
20
40
60
80
100
120
140
160
180
200
0 0.5 1 1.5 2 2.5 3 3.5 4
4032
4060
Nielson modelwhen L/D=50
WVTR
(gm
‐mil/[m
2‐day])
vol.% Nanoclay