water-use data collection techniques in the southeastern ... · water-use data collection...
TRANSCRIPT

WATER-USE DATA COLLECTION TECHNIQUES IN THE SOUTHEASTERN
UNITED STATES, PUERTO RICO, AND THE U.S. VIRGIN ISLANDS
By Terrance W. Holland
U.S. GEOLOGICAL SURVEY
Water-Resources Investigations Report 92-4028
Little Rock, Arkansas
1992
U.S. DEPARTMENT OF THE INTERIOR MANUEL LUJAN, JR., Secretary
U.S. GEOLOGICAL SURVEY Dallas L. Peck, Director
For additional information Copies of this report can bewrite to: purchased from:
District Chief U.S. Geological SurveyU.S. Geological Survey Books and Open-File Reports Section2301 Federal Office Bldg. Federal Center700 West Capitol Avenue Box 25425Little Rock, Arkansas 72201 Denver, Colorado 80225

CONTENTS
Page
Abstract..................................................................................................................................... 1Introduction............................................................................................................................... 1
Background......................................................................................................................... 1Purpose and scope .............................................................................................................. 2Terminology........................................................................................................................ 4Report format...................................................................................................................... 6Acknowledgments............................................................................................................... 6
Data collection techniques in Alabama.................................................................................... 6Public-supply water use..................................................................................................... 6Domestic water use ............................................................................................................ 8Industrial water use........................................................................................................... 8Commercial water use........................................................................................................ 8Mining water use................................................................................................................ 9Livestock water use............................................................................................................ 9Irrigation water use............................................................................................................ 10Power generation water use............................................................................................... 10Sewage-treatment water use............................................................................................. 10Navigation water use ......................................................................................................... 10Recreation and preservation water use............................................................................. 11
Data collection techniques in Arkansas................................................................................... 11Public-supply water use..................................................................................................... 11Domestic water use ............................................................................................................ 13Industrial water use........................................................................................................... 13Commercial water use........................................................................................................ 14Mining water use................................................................................................................ 14Livestock water use............................................................................................................ 15Irrigation water use............................................................................................................ 16Power generation water use............................................................................................... 16Sewage-treatment water use............................................................................................. 16
Data collection techniques in Florida...................................................................................... 17Public-supply water use..................................................................................................... 17Domestic water use ............................................................................................................ 17Industrial water use........................................................................................................... 20Commercial water use........................................................................................................ 20Mining water use................................................................................................................ 20Livestock water use............................................................................................................ 20Irrigation water use............................................................................................................ 21Power generation water use............................................................................................... 21Sewage-treatment water use............................................................................................. 22Miscellaneous water use .................................................................................................... 22
Data collection techniques in Georgia..................................................................................... 22Public-supply water use..................................................................................................... 22Domestic water use ............................................................................................................ 24Industrial water use........................................................................................................... 24Commercial water use........................................................................................................ 25Mining water use................................................................................................................ 25Livestock water use............................................................................................................ 25Irrigation water use............................................................................................................ 26
in

CONTENTS-Continued
Power generation water use............................................Thermoelectric...........................................................Hydroelectric.............................................................
Sewage-treatment water use..........................................Data collection techniques in Kentucky ...............................
Public-supply water use..................................................Domestic water use .........................................................Industrial water use........................................................Commercial water use.....................................................Mining water use.............................................................Livestock water use.........................................................Irrigation water use.........................................................Power generation water use............................................
Thermoelectric...........................................................Hydroelectric.............................................................
Sewage-treatment water use..........................................Data collection techniques in Louisiana...............................
Public-supply water use..................................................Domestic water use .........................................................Industrial water use........................................................Commercial water use.....................................................Mining water use.............................................................Livestock water use.........................................................Irrigation water use........................................................Power generation water use............................................Sewage-treatment water use.........................................
Data collection techniques in Mississippi............................Public-supply water use.................................................Domestic water use ........................................................Industrial water use.......................................................Mining water use............................................................Livestock water use........................................................Irrigation water use.........................................................Power generation water use............................................Sewage-treatment water use..........................................
Data collection techniques in North Carolina.....................Public-supply water use.................................................Domestic water use ...........................................................j................Industrial water use......................................................... J................Commercial water use........................................................................Mining water use................................................................................Livestock water use............................................................................Irrigation water use.......................................................... H ................Power generation water use...............................................................Sewage-treatment water use.............................................................
Data collection techniques in Puerto Rico and the U.S. Virgin Islands.Public-supply water use.....................................................................
Puerto Rico...................................................................................U.S. Virgin Islands.......................................................................
Page
27272727272829293030303031313131313133333333343435353637373838383940404040424343444445464646484849
IV

CONTENTS-Continued
Page
Domestic water use ............................................................................................................ 49Puerto Rico................................................................................................................... 49U.S. Virgin Islands....................................................................................................... 50
Industrial water use........................................................................................................... 50Puerto Rico................................................................................................................... 50U.S. Virgin Islands....................................................................................................... 51
Commercial water use........................................................................................................ 51Puerto Rico................................................................................................................... 51U.S. Virgin Islands....................................................................................................... 51
Mining water use................................................................................................................ 51Puerto Rico................................................................................................................... 51U.S. Virgin Islands....................................................................................................... 51
Livestock water use............................................................................................................ 52Puerto Rico................................................................................................................... 52U.S. Virgin Islands....................................................................................................... 52
Irrigation water use............................................................................................................ 52Puerto Rico................................................................................................................... 52U.S. Virgin Islands....................................................................................................... 53
Power generation water use (thermoelectric)................................................................... 53Puerto Rico................................................................................................................... 53U.S. Virgin Islands....................................................................................................... 53
Power generation water use (hydroelectric)...................................................................... 53Puerto Rico................................................................................................................... 53U.S. Virgin Islands....................................................................................................... 54
Sewage-treatment water use............................................................................................. 54Puerto Rico................................................................................................................... 54U.S. Virgin Islands....................................................................................................... 54
Data collection techniques in South Carolina......................................................................... 54Public-supply water use..................................................................................................... 54Domestic water use ............................................................................................................ 56Industrial water use........................................................................................................... 56Commercial water use........................................................................................................ 56Mining water use................................................................................................................ 56Livestock water use............................................................................................................ 57Irrigation water use............................................................................................................ 57Power generation water use............................................................................................... 58Sewage-treatment water use............................................................................................. 58
Data collection techniques in Tennessee................................................................................. 58Public-supply water use..................................................................................................... 58Domestic water use ............................................................................................................ 60Industrial water use........................................................................................................... 60Commercial water use........................................................................................................ 60Mining water use................................................................................................................ 61Livestock water use............................................................................................................ 61Irrigation water use............................................................................................................ 62
Method I........................................................................................................................ 62Method II...................................................................................................................... 62Method III..................................................................................................................... 63
Power generation water use............................................................................................... 63Sewage-treatment water use............................................................................................. 63
CONTENTS-Continued
Summary................Selected references. Glossary..................
water-use category..... estimating water
Appendix I Tables representing the sources of information by Appendix 2--Tables representing coefficients and formulas used for
use by water-use category................................................Appendix 3--Water-use data collection forms used in the southeastern United States,
Puerto Rico, and the U.S. Virgin Islands........................
Page
646572
1-1
2-1
3-1
Figure 1.2.
ILLUSTRATIONS
Map showing southeastern states in study area. Diagram showing example of possible water conveyance routes for
offstream water use......................................
Page
3
TABLES
Table 1. Alabama: Categories of water use and sources of information..............2. Arkansas: Categories of water use and sources of information.............3. Mined water-use coefficients in Arkansas...............................................4. Florida: Categories of water use and sources of information.................5. Georgia: Categories of water use and sources of information................6. Kentucky: Categories of water use and sources of information.............7. Louisiana: Categories of water use and sources of information............8. Mississippi: Categories of water use and sources of information..........9. North Carolina: Categories of water use and sources of information...
10. Average irrigation application rates used for calculation of water use in North Carolina...................................................................................
11. Puerto Rico and the U.S. Virgin Islands: Categories of water use and sources of information............................................................................
12. South Carolina: Categories of water use and sources of information ...13. Tennessee: Categories of water use and sources of information ...........
Page
71214182328323641
45
475559
VI
CONVERSION FACTORS
Multiply By To obtain
inch (in.) 25.4 millimeterfoot (ft) 0.3048 meterfoot squared per day (ft2/d) 0.0929 meter squared per dayacre 4,047 square meteracre-foot (acre-ft) 1,233 cubic metergallon (gal) 0.9464 litergallon per day (gal/d) 0.003785 cubic meter per daymillion gallons per day (Mgal/d) 0.0438 cubic meter per secondton 0.9072 megagram
Vll

WATER-USE DATA COLLECTION TECHNIQUES IN THESOUTHEASTERN UNITED STATES, PUERTO
RICO, AND THE U.S. VIRGIN ISLANDS
By Terrance W. Holland
ABSTRACT
This report describes the techniques and methods used by the U.S. Geological Survey, State, and local cooperators to collect water-use data from 1985-90 in the following Southeastern States, Commonwealth, or Territory: Alabama, Arkansas, Florida, Georgia, Kentucky, Louisiana, Mississippi, North Carolina, Puerto Rico and the U.S. Virgin Islands, South Carolina, and Tennessee. In 1977, the Congress of the United States directed the U.S. Geological Survey to establish a National Water-Use Information Program to complement the Survey's data on availability and quality of the Nation's water resources. Water-use data are collected in as many as 11 categories as part of this national water-use information program. The water-use categories that are addressed in this report include:public-supply, domestic, industrial, commercial, mining, livestock, irrigation, power generation, and sewage- treatment (Solley and others, 1988). In addition to the previously mentioned categories of water use, Alabama collects water-use information pertaining to navigation and preservation, and Florida collects miscellaneous water-use data. The information in this report is displayed by State or political unit and by water-use category.
Each State section includes the following information: a definition of each category of use, the source of information, a description of how the data are collected, the technique used for estimating water use for the category, a listing of the data components necessary for estimating water use for each category, and a description of how the water-use information is aggregated.
INTRODUCTION
During the last 40 years there have been numerous reports published on the subject of water use. Primarily, these reports described a particular category of water use or geographical area for which data on the various categories of water use are given. Since 1950, the U.S. Geological Survey (USGS) has published national estimates of water use in the United States at 5-year intervals (MacKichan, 1951, 1957; MacKichan and Kammerer, 1961; Murray, 1968, 1977; Murray and Reeves, 1972; and Solley and others, 1983, 1988). These estimates were derived from a variety of sources and ranged widely in accuracy. In most States, the State cooperator defines the categories of water use that are of interest to them and collects water-use data for those categories. In many cases, the definitions and collection techniques used by the cooperators are unique. This situation makes it difficult to standardize terminology and definitions across State boundaries and creates confusion for new and inexperienced water-use personnel. In some cases, water-use data for a particular category may not be directly collected or reported, but rather must be estimated by the best possible method available. It is important to understand the estimation techniques being used in each State or political unit.
Background
In 1977, the U.S. Congress recognized the need for uniform, current, and reliable information on water use and directed the USGS to establish a National Water-Use Information Program to complement the Survey's data on the availability and quality of the Nation's water resources. The USGS, as directed, has established national guidelines and standards to meet regional and national
needs. Prior to 1977, the national 5-year water-use compilations were virtually unfunded, and the accuracy of the estimates varied for each State or political unit. As of 1988, 49 States and Puerto Rico were participating in the cooperative program to varying degrees (Solley and others, 1988).
States now (1992) have personnel specifically funded by and assigned to the water-use program. These water-use specialists become familiar with the availability and reliability of water-use information in their State, and work closely with cooperatorfe in obtaining reliable estimates of water use at the State level. Water-use information can be electronically stored in databases developed and maintained by the USGS. Many states in the southeastern United States store their data in the Site- Specific Water Use Data System (SSWUDS). Estimates of water use are aggregated by State, county, and Hydrologic Cataloging Unit in the Aggregate Water Usie Data System (AWUDS). AWUDS is a USGS database and supporting software designed to store and manipulate water-use information. Every 5 years aggregate data are published in a USGS circular (Solley and others, 1988); work is currently underway for the 1990 compilation. Aggregate information included in these circulars illustrates ground- and surface-water withdrawals and deliveries for all categories summarized by hydrologic region and by State. Although water-use data aggregated by hydrologic cataloging unit are published at the hydrologic region level, all data are compilled and stored in AWUDS by hydrologic cataloging unit and by county." Software available through AWUDS can be useful to redistribute and output the data at the hydrologic region or subregion level.
Puraose and Scop|<
During the national aggregate water-use data collection was required to document the sources of information, and th data. These sources and techniques were updated for collecting 1990.
effort in 1985, each State or political unit techniques used for compilation of these
water-use data between 1985 and
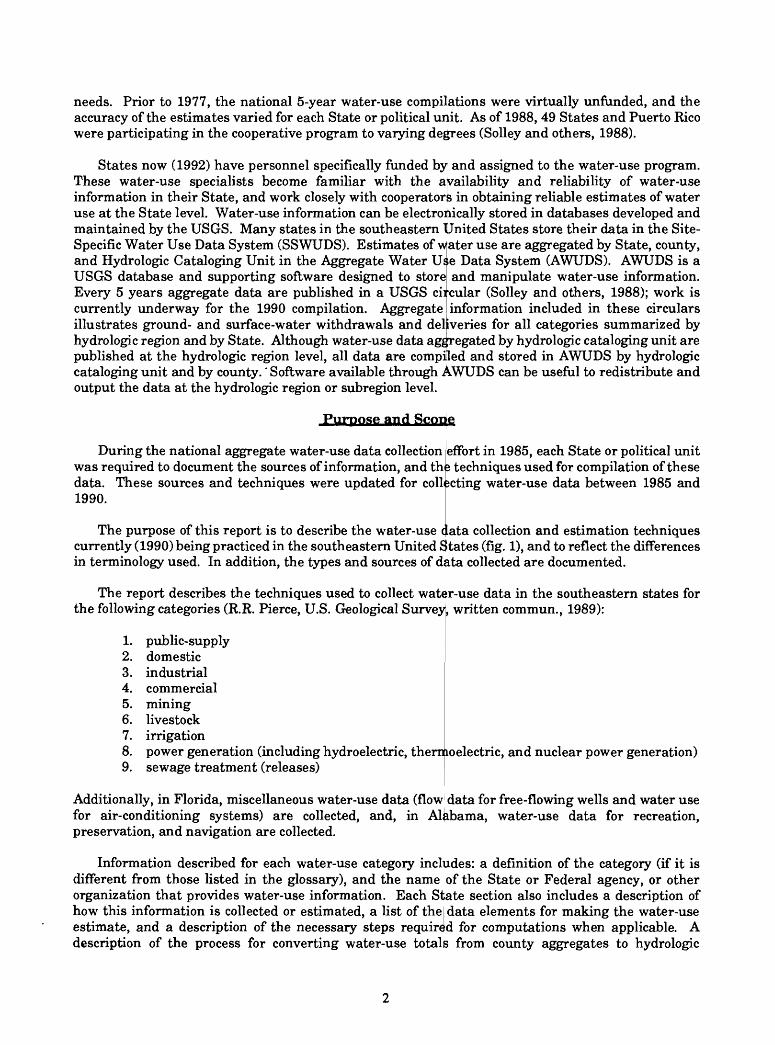
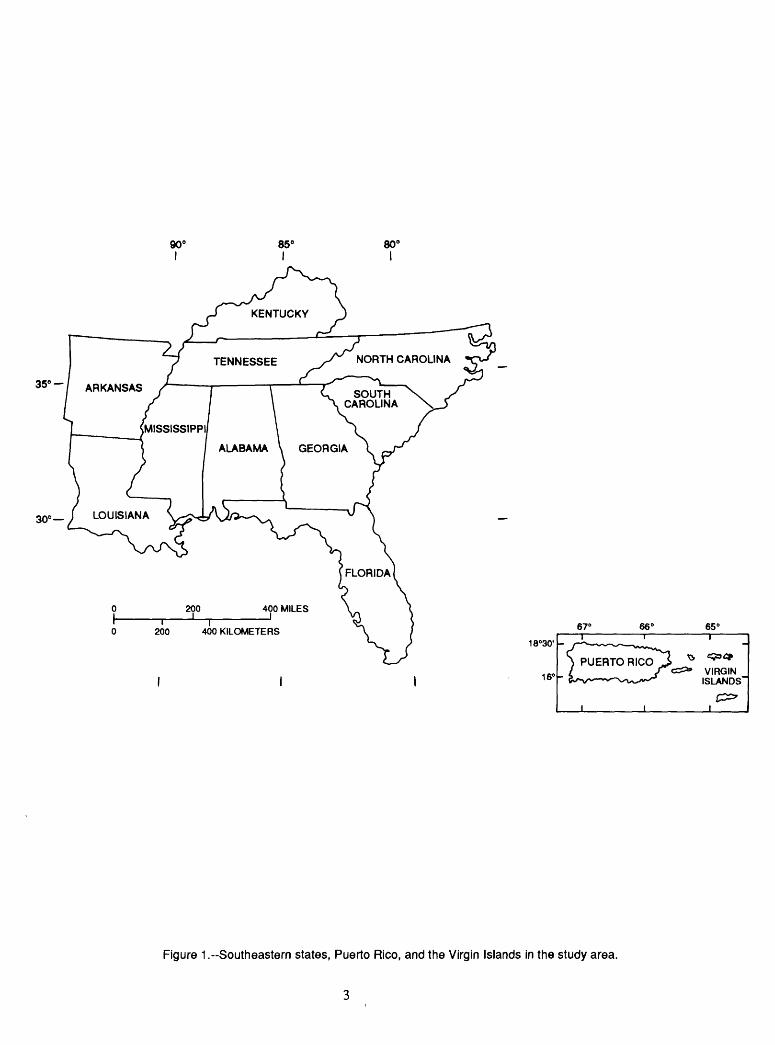
The purpose of this report is to describe the water-use data collection and estimation techniques currently (1990) being practiced in the southeastern United States (fig. 1), and to reflect the differences in terminology used. In addition, the types and sources of data collected are documented.
The report describes the techniques used to collect water-use data in the southeastern states for the following categories (R.R. Pierce, U.S. Geological Survey, written commun., 1989):
1. public-supply2. domestic3. industrial4. commercial5. mining6. livestock7. irrigation8. power generation (including hydroelectric, thermoelectric, and nuclear power generation)9. sewage treatment (releases)
Additionally, in Florida, miscellaneous water-use data (flow data for free-flowing wells and water use for air-conditioning systems) are collected, and, in Alabama, water-use data for recreation, preservation, and navigation are collected.
Information described for each water-use category includes: a definition of the category (if it is different from those listed in the glossary), and the name of the State or Federal agency, or other organization that provides water-use information. Each State section also includes a description of how this information is collected or estimated, a list of the I data elements for making the water-use estimate, and a description of the necessary steps required for computations when applicable. A description of the process for converting water-use totals from county aggregates to hydrologic
35°-
30°
ALABAMA \ GEORGIA
20067" 66"
18030'
16e
65°
VIRGIN ISLANDS"
Figure 1.-Southeastern states, Puerto Rico, and the Virgin Islands in the study area.

cataloging units (Seaber and others, 1984) also is discussed. Unless otherwise indicated, water-use totals for each category are compiled for each hydrologic cataloging unit by aggregation of the site- specific data located within each cataloging unit.
TerminoloEfv
A general knowledge of the following terms will enhan types of data collected and the methods used to collect this i water-use information are the two types of data collection te
:e the reader's ability to understand the information. Aggregated and site-specific
ihniques discussed in this report.
Site-specific water-use data refer to information. obtained about an individual withdrawal,transfer, or release point. Site-specific data generally are composed of measured values, or calculationsbased on specific information about the site (pump capacity, duration of pumping, and amount of water withdrawn), and are used when a high degree of accuracy is important. Site-specific data usually require substantial resources to collect and maintain; howej/er, these data are essential elements in many hydrologic investigations. For example, site-specific d^ta are necessary for determining ground- and surface-water rates of depletion and recharge, and for predicting the availability of future supplies (Baker, 1990).
Aggregated water-use data, as used in this report, refer to a group of sites for each of 11 categories of use. Water-use data can be aggregated by county, hydrologic cataloging unit, water-use category, or any other useful groupings. Aggregated data can be composed of site-specific data that have been grouped or summed, or can be indirectly derived from estimations or calculations based on general information (such as population, total crop acreages, and water-application rates). Estimations and calculations based on general information often are used when existing resources are limited or when a high degree of accuracy is not critical.
Offstream water use describes water that is diverted or withdrawn from a ground- or surface-water source and conveyed to the place of use. To determine the quantity of water used and by whom the water was used, it is necessary to understand the possible routes of conveyance (fig. 2).
1.
2.
Withdrawal-the quantity of water diverted or withdrawn from a ground- or surface-water source (A in fig. 2).
Delivery/release~the quantity of water deliver public-supply) and the quantity released after volumes, in some instances, will be the consumptive not returned directly to any water source.
3. Return flow-the quantity of water that is discharged from the point of use and thus becomes availabl
\d at the point of use (B) (self-supply or use (C). The differences between these
use, or the quantity of water that is
to a stream or well (D) after release for further use.
Instream use describes water uses that are not dependent on diversion or withdrawal from ground- or surface-water sources. They are usually classified as flow uses or onsite uses. Examples of instream uses, which depend on water running freely in a channel, are hydroelectric power generation, freshwater dilution of saline estuaries, maintenance of minimum streamflow to support fish propagation, and the dilution of wastewater.

Well
Self Supply
s
Ci if\f%K/
elf Supply »
\» L_
4 B B
f*^Water User
WeH
UE_Discharge
Wastewater Treatment
Figure 2.-Example of possible water conveyance routes for offstream water use (Soltey and others, 1985).
Hydrologic unit code refers to an 8-digit code identifying the facility's location with reference to the areal breakdown shown of State hydrologic unit maps. The format is (RRSSAACC) where:
RR is the 2-digit code for the Water Resources Council Region, SS is the 2-digit code for the Water Resources Council subregion, AA is the 2-digit code for the National Water Data Network Accounting Unit, and CC is the 2-digit code for the cataloging unit of the catalog of information on water data
maintained by the Office of Water Data Coordination.
Hydrologic unit codes are given in the U.S. Geological Survey Map Series "State Basic Hydrologic Unit Maps." The series provides a uniform, nationally consistent set of maps showing drainage, cultural features, hydrographs, and hydrologic boundaries. Water-use data are collected and compiled at the hydrologic cataloging unit level.

Report Format
The first 11 sections of the report describe water-use data collection techniques used in the Southeastern United States, Puerto Rico, and the U.S. Virgin Islands. These 11 sections are divided by State or political unit and by water-use category. Each section includes the following information:
1. a definition of each category of use,2. the source of information,3. a description of how the data are collected,4. the technique used for estimating water use for the category,5. a listing of the data components necessary for estimating water use for each category, and6. a description of how the water-use information is aggregated.
The next three sections of the report include a general summary, selected references, and a glossary, respectively. The final three sections of the report are appendices. The first appendix contains tables that represent sources of water-use informa|tion by water-use category. The second appendix contains tables representing the coefficients and formulas used for estimating water use by water-use category. The last appendix contains a variety of waiter-use data collection forms used in the Southeastern United States, the Commonwealth of Puerto Rico, and territory of the Virgin Islands of the United States.
Acknowledgment^
We would like to acknowledge the water-use project personnel in the USGS Southeastern Region and each State cooperator for their assistance in the compilation of information for this report. State water-use project personnel provided water-use information by several methods including: a mail survey, telephone interviews, and in some instances personal interviews.
DATA COLLECTION TECHNIQUES IN ALABAMA
Water-use data in Alabama are collected by the Geological Survey of Alabama (GSA) in cooperation with the USGS. The nine national water-use categories lifted in the Introduction are collected in Alabama. Information on navigation, recreation, and preservation water use also are collected. Public-supply, industrial, commercial, mining, power generation, and sewage treatment water-use data are collected by contacting the appropriate agency or facility. Domestic, livestock, and irrigation water use are estimated using population or acreage estimates and water application rates. The categories of water-use data collected in Alabama and the associated sources of information are given in table 1.
Public-Suonlv Water 1 Jse
Public-supply systems in Alabama are classified as faciliti es that serve either more than 25 people,other public water-supply systems, industrial customers, or commercial customers. There areapproximately 680 public-supply facilities in Alabama. Information about public-supply systems is solicited by the GSA by questionnaire. Data collected on thejse questionnaires include the amount of water withdrawn by month, location of the withdrawal site, source of the withdrawal (ground or surface water), number of connections, population served, and identification of any customer receiving more than 2,000 gal/d. Public-supply water is estimated in Alabama to be 7 percent consumed (Solley and others, 1983). Public-supply water-use totals for each hydrologic cataloging unit within the State are determined by aggregation of site-specific data located within these hydrologic cataloging units.

Table I. Alabama: Categories of water use and sources of in formation
Water-use category Data sources
Public supply
Domestic supply
Industrial
Commercial
Mining
Livestock
Irrigation
Power generation thermoelectric
hydroelectric
Geological Survey of Alabama(withdrawal/delivery questionnaires)
U.S. Department of Commerce, Bureau of the Census
Geological Survey of AlabamaTennessee Valley AuthorityU.S. Department of Commerce, Bureau of the Census
Alabama Department of Economicand Community Affairs
Alabama Department of EnvironmentalManagement (computer files)
Alabama Department of Environmental Management (files)
Alabama Department of Industrial Relations Alabama Department of Economic
and Community Affairs Alabama Department of Environmental
Management (files)Alabama Oil and Gas Board (permit files) Geological Survey of Alabama (telephone survey)
Alabama Cooperative Extension Service,Auburn University
Alabama Crop and Livestock Reporting Service U.S. Department of Agriculture
Alabama Cooperative Extension Service,Auburn University
Geological Survey of Alabama
Alabama Power Company Alabama Electric Cooperative Southeastern Power Administration U.S. Department of Energy Tennessee Valley Authority
Alabama Power Company Alabama Electric Cooperative Southeastern Power Administration U.S. Army Corps of Engineers

Table I. Alabama: Categories of water use and sources of information-Continued
Water-use category Data sources
Sewage treatment Alabama Department of EnvironmentalManagement (computer files)
Navigation U.S. Army Cd>rps of EngineersTennessee Valley Authority
Recreation/Preservation Alabama Department of Conservation(Parks and Recreation)
Tennessee Valley Authority U.S. Army Ctyrps of Engineers
Domestic Water Ujse
Water withdrawals for domestic purposes are determined by subtracting the population served by public-supply facilities (from the GSA questionnaire) from the total population of the county or hydrologic unit, then multiplying this number by the water-use coefficient of 75 gal/d per person (Wentz and Baker, 1986). The population served by public-supply facilities is provided by the GSA questionnaires (used to solicit public-supply information). County populations are provided by the U.S. Department of Commerce, Bureau of the Census (1986). Domestic water is considered to be 100 percent consumed. Self-supplied domestic water-use totals for each hydrologic cataloging unit are determined by disaggregation of county data based on the percentage of the population located within each hydrologic cataloging unit.
Industrial Water usei
Industrial water use is determined by collection of individual facility data obtained from the Alabama Department of Environmental Management (ADEM) computer files. These files provide data about the number of employees, source and type of water used, amount of water purchased, amount ofwater withdrawn (in gal/d), mailing address, and telephonmanufacturers is obtained from the Alabama Department of Economic and Community Affairs (ADECA) (Alabama Development Office, 1985). From this updated list, GSA conducted a mail survey (appendix 3, page 3-2 and 3-3) of self-supplied industrial users. Consumptive water use is estimated by multiplying the industrial water-use total by county by i-he national average consumptive use rate of 22 percent (Solley and others, 1983). Industrial water-use totals for each hydrologic cataloging unitwithin the State are determined by aggregation of site-spcataloging unit.
Commercial Water Qse
number. In addition, an updated list of
cific data located within each hydrologic
Commercial water-use information is obtained froiri AD EM computer files. In these files commercial users are classified as "noncommunity system^". Data included in the ADEM files about these commercial users are similar to those for public-supply and industrial water users. Consumptive water-use estimates for commercial water users are determined to be the same as for industrial water users, 22 percent (Solley and others, 1983). Commercial water-use totals for each hydrologic cataloging unit are compiled by aggregation of the site-specific data located within each hydrologic cataloging unit.

Mining Water Use
In Alabama, mining water use is primarily associated with coal extraction, and oil and gas wells. The GSA obtains water-use data by a telephone survey of the larger mining companies in Alabama. The Alabama Development Office provides a master list that contains names, addresses, and telephone numbers of mining operations in Alabama. The survey collects information regarding the location of the mining operation, source of the withdrawal, and amount of water used. Identical information concerning withdrawals from oil and gas wells are provided by the Alabama Oil and Gas Board from its permit files. Consumptive use for mining is considered to be negligible because essentially all the water used is returned to streams. Mining water-use totals for each hydrologic cataloging unit are compiled by aggregation of the site-specific data located within each hydrologic cataloging unit.
Livestock Water Use
The livestock water-use category includes water that is used for aquaculture and livestock operations. Estimates for aquaculture water use are made by multiplying the total pond acreage (used for catfish farming) by the average water-use application rate for catfish (4 ft of water per acre). In Alabama, 75 percent of the water used for aquaculture is estimated to be from ground-water sources and 25 percent is estimated to be from surface-water sources. These aquacultural water-use data (acreage, application rate, and source) are supplied by Curtis and Tyson (1986) and the U.S. Department of Agriculture. The estimated consumptive use rate for aquaculture is 27 percent. This consumptive use estimate is provided through personal consultation with the State Conservationist (Alabama Cooperative Extension Service, oral commun., 1985).
Livestock water use for livestock (animal) operations is estimated based on the number of livestock in each county and the average daily water consumption (in gal/d) for each type of stock. The numbers and types of livestock within the State are provided by the Alabama Crop and Livestock Reporting Service (1985). The rates of use for livestock are as follows:
Average daily consumption
Type of livestock (gallons per day)
Dairy cattle 35 Other cattle 12 Hogs 5 Poultry______________.05
In addition, water-use values for a given livestock type are divided by water source based on the following percentages (R.M. Baker, Geological Survey of Alabama, oral commun., 1985):
1. Dairy cattle - 90 percent ground water and 10 percent surface water,2. Other cattle - 40 percent ground water and 60 percent surface water,3. Hogs - 40 percent ground water and 60 percent surface water, and4. Poultry - 90 percent ground water and 10 percent surface water.
Livestock water use is considered to be 100 percent consumed (R.M. Baker, Geological Survey of Alabama, oral commun., 1985). Livestock water-use totals for each hydrologic cataloging unit are determined by disaggregation of county data, based on the percentage of the county area located within each hydrologic cataloging unit.

Irrigation Water Use
Irrigation water use is determined by multiplying the number of irrigated acres per crop type (within a county) by the appropriate application rate. Irrigation water-use estimates are based on information reported by Curtis and Tyson (1986) and from the GSA files. Data reported by these sources include: the number of acres irrigated by county, the type of crops grown, the source of water, and average application rate for each crop. The water-use application rate for the primary crops (corn, soybeans, peanuts, and plant nurseries) is 6 in. per acre. Bee ause most irrigation systems in Alabamaare center pivot, it is assumed that there are no conveyancefor irrigation water is 75 percent (Baker and Mooty, 198 7). Irrigation water-use totals for each hydrologic cataloging unit are determined by disaggregation of county data based on the percentage of the county area located within each hydrologic cataloging unit.
Power Generation Water Use
Power generation water-use data are collected for both Water is used and consumed differently at these two types power generation facilities such as fossil-fuel and nuclear
losses. The estimated consumptive rate
thermoelectric and hydroelectric plants, of generation plants. At thermoelectric power plants, water is used for cooling
purposes and boiler make-up water. At hydroelectric power generation facilities, water is used to turn the turbines that generate electricity.
There are currently (1990) 11 coal-fired and 3 nuclear power plants licensed in Alabama. The largest generation companies or power utility companies in the State-Alabama Power Company, Alabama Electric Cooperative, Southeastern Power Administration of the U.S. Department of Energy, and the Tennessee Valley Authority (TVA)--furnished wate:'-use figures related to power generation. These companies provided the following information: a list of their power generating facilities, facility location, facility type, annual power produced, water withdrawn, and a consumptive water-use estimate. For thermoelectric power generation it is estimated that less than 2 percent of the water withdrawn is consumed.
In Alabama, there are 21 operating hydroelectric faci hydroelectric power generating facilities as for thermoe
ities. Similar data are collected for the ectric. Hydroelectric power generation
requires large volumes of water to produce power, but not water is consumed as the water passes through the turbines. Power generation water-use totals for each hydrologic cataloging unit are determined by aggregation of site-specific data located within each hydrologic cataloging unit.
Sewage-Treatment Wa1 ;er Use
Data for sewage-treatment facilities are obtained from ,\DEM computer files. These files contain the location of the facility, the name and type of wastewa ter-treatment facility, and the permitted maximum volume of water to be discharged or released. Sewage-treatment release totals for each hydrologic cataloging unit within the State are determined by aggregation of site-specific data located within each hydrologic cataloging unit.
Navigation Water fose
Navigation water use occurs in stream channels and reservoirs where surface water is utilized as a means of commercial transportation. There are currently (1990) 4 lock-and-dam or slackwater navigation systems with a total of 14 locks in operation in Alabama. Water use for navigation is determined by multiplying water requirements for the individual locks by the number of lockages per lock per year. To determine the water requirement for each lock, the inside area of the lock is multiplied by the lift range of the lock. The lift range is the amount of water required to lift a vessel within the lock to the appropriate level of water outside the lock. The lock water requirement
10
multiplied by the number of lockages equals the volume of water per lock for navigation use. The lock dimensions (inside area of the lock), lift ranges, and the number of lockages are provided by the U.S. Army Corps of Engineers and the TVA.
Recreation and Preservation Water Use
Recreation and preservation water use occurs at facilities where bodies of water are used for recreational activities or for preservation, maintenance, or enhancement of a natural resource, including wildlife preserves and wetlands. Recreation use generally is measured in terms of the number of annual site visits per person per facility. The number of site visits is then multiplied by a per capita water-use coefficient. The sum of the per capita water-use coefficient is equal to the amount of water used by visitors for sanitary purposes, drinking, and bathing at various recreational facilities. Preservation area usage is the amount of surface water used for fish and wildlife preserves and wetlands. Data for these categories are provided by the following agencies: the Alabama Department of Conservation (Parks and Recreation), the TVA, and the U.S. Army Corps of Engineers.
DATA COLLECTION TECHNIQUES IN ARKANSAS
Water-use data in Arkansas are monitored by the Arkansas Soil and Water Conservation Commission (ASWCC) in cooperation with USGS. All nine national water-use categories listed in the Introduction are collected in Arkansas (table 2).
Water users that withdraw more than 50,000 gal/d from ground water or divert more than 325,900 gal (1 acre-ft) of surface water per water year must report their water use to ASWCC by completing a water-use registration form (appendix 3, pages 3-4 to 3-7). There are two types of registration forms: (1) the General Water Use Registration Form, which is used for reporting public-supply, industrial, commercial, mining, and power generation (hydroelectric and thermoelectric) water use, and (2) the Agricultural Water Use Registration Form, which is used for irrigation and agricultural (livestock and aquaculture) uses. Domestic withdrawals and sewage-treatment water use are excluded from these registration forms, but water use for these categories is collected or estimated by other methods.
Public-Supply Water Use
Public-supply facilities furnish water for drinking, general domestic, commercial, and industrial use in incorporated municipalities or unincorporated communities consisting of 10 or more connections or of 25 or more people for a period of 60 days or more each year. Water-use information is collected for the public-supply water-use category by a mail survey conducted by ASWCC (appendix 3, pages 3- 5 to 3-7). The approximately 700 public-supply facilities in the State on the master list of the Arkansas Department of Health (1989) are mailed General Water Use Registration Forms to be completed by public-supply system operators. A section of the General Water Use Registration Form is designed to obtain the appropriate information for the public-supply water-use category, in addition to withdrawal amounts, such as the amount cf water purchased from other facilities, the amount of water sold to other facilities, the domestic population served, the amount of water delivered to various types of users, and the number of connections for each type of user. The format of these forms is designed to match the data-entry requirements of the USGS Site-Specific Water Use Data System to aid in the data entry process.
Consumptive use totals are not collected on water use registration forms. Consumptive use coefficients are determined by previous municipal surveys to be 20 percent of the total amount withdrawn (Holland, 1987). Consumptive use was assumed to be 100 percent of withdrawals for those communities that have no sewage systems. Information on communities having sewage systems is obtained from the Arkansas Department of Pollution Control and Ecology. Public-supply water-use totals for each hydrologic cataloging unit within the State are determined by aggregation of site- specific data located within each hydrologic cataloging unit.
11

Table 2.--Arkansas: Categories of water use and sources of information
Water-use category Data sources
Public supply
Domestic
Industrial
Commercial
Mining
Livestock
Irrigation
Power generation
Arkansas Soil and Water Conservation Commission (General Waiter Use Registration Forms)
Arkansas Department of Health, Division of Engineering (Arkansas Community Public Water System List)
Arkansas Soil and Water Conservation Commission(General Water Use Registration Forms)
U.S. Department of Commerce, Bureau of the Census
Arkansas Soi^ and Water Conservation Commission (General Waiter Use Registration Forms)
Arkansas Industrial Development Foundation (Arkansas Directory of Manufacturers)
Arkansas Soil and Water Conservation Commission(General Wjater Use Registration Forms)
U.S. Army Colrps of Engineers U.S. Department of Agriculture, Forest Service Arkansas Department of Parks and Tourism
Arkansas Geological CommissionU.S. Department of the Interior, Bureau of MinesU.S. Department of EnergyArkansas Oil and Gas Commission
Arkansas Soil and Water Conservation Commission(Agricultural Water Use Registration Forms)
U.S. Department of the Interior, Fish and WildlifeService, Fis h Farming Experimental Laboratory
Arkansas Game and Fish Commission University of Arkansas, Cooperative Extension
Service U.S. Department of Agriculture, Crop Reporting
Service
Arkansas Soijl and Water Conservation Commission (Agricultural Water Use Registration Form)
Arkansas Soil and Water Conservation Commission (General Wfater Use Registration Forms)
Arkansas Power and Light CompanyArkansas Electric CooperativeU.S. Department of Energy, Southwest Power
AdministrationU.S. Army Corps of Engineers
12

Table 2.~Arkansas: Categories of water use and sources of information-Continued
Water-use category Data sources
Sewage treatment Arkansas Department of Pollution Control andEcology
National Pollution Discharge Elimination System (computer files)
Domestic Water Use
Domestic water users are defined as individual families and small communities not served by a public-supply system. Domestic water use is determined by subtracting the population served by public-supply facilities within a county or hydrologic unit area from the total population of the county or hydrologic unit area, then multiplying this number by a per capita use of 89 gal/d. The per capita use is derived by averaging the per capita use in 20 small public-supply systems, minus an estimated 15 percent transmission loss associated with public-water systems. The number of people served by public-supply facilities is estimated from responses to the general registration forms sent to water supply facilities in the State. The county populations are provided by the U.S. Department of Commerce, Bureau of the Census (U.S. Department of Commerce, written commun., 1986). An estimated 95 percent (Holland, 1987) of the rural residents in Arkansas have indoor plumbing in their homes. A water-use coefficient of 20 gal/d per person is applied to the remaining 5 percent of the rural residents. Data on water provided by public-supply facilities for domestic uses are included on the general registration form provided by ASWCC.
In Arkansas, water used for domestic purposes is considered to be 100 percent consumed. Domestic water-use totals for each hydrologic cataloging unit are determined by disaggregation of county data using the percentage of the population located within the hydrologic cataloging unit. These hydrologic cataloging unit subtotals for each county are then regrouped for the State and totaled.
Industrial Water Use
Only self-supplied industrial establishments are included in the industrial water-use category. The industries that make up the majority of this category include the primary metals industry, chemical and allied products industry, paper and allied products, and the petroleum and coal products industry. Industrial water-use information is collected by a mail survey conducted by the ASWCC (appendix 3, pages 3-5 to 3-7). A master list of industrial facilities is obtained from the latest edition of the Arkansas Directory of Manufacturers (Harrington, 1990). This directory lists the industries and manufacturers in the State and contains the following information: location of the facility, mailing address, telephone number, the name of a contact person, the number of employees, type of products produced, and their associated SIC (Standard Industrial Classification) codes. These industries are grouped by the city in which they are located. Periodically, a telephone survey of public-supply facilities is conducted to determine the number of industries that are self supplied within their local area. General Water Use Registration Forms are mailed to approximately 150 self-supplied industrial facilities in the State. Industrial consumptive use is estimated to be 12 percent of the total water withdrawn (Solley and others, 1988). Industrial water-use totals for each hydrologic cataloging unit are determined by aggregation of site-specific data with these specific areas.
13

Commercial Water Use
Only self-supplied commercial establishments are categorized as commercial water users. In addition to the type of establishments generally listed in the commercial category, in Arkansas, private hunting clubs are included in the commercial category. The; ASWCC collects commercial water-usedata from a mail survey of selected commercial operations inThese data are reported on General Water Use Registration Forms. The following commercial facilities report their water use to ASWCC: private duck hunting clubs, parks operated by the U.S. Department of Agriculture, Forest Service, several State parks, and several self-supplied military facilities located in the State. Deliveries to commercial fs.cilities from public-supply systems areestimated from information reported on the General Water I. public-supply facilities.
the State (appendix 3, pages 3-5 to 3-7).
se Registration Forms completed by the
Water use is estimated for many commercial facilities in the State. These commercial facilities include parks operated by the U.S. Army Corps of Engineers, State parks, national parks, and recreation areas that are not required to report to the ASWCO. Commercial water use is estimated by multiplying a water-use coefficient of 30 gal/d per person (Ej Fugate, Arkansas Department of Parks and Tourism, written commun.,1980) by the monthly or yearly park attendance figures obtained directly from the managing agency (table 2). Commercial consumptive use is estimated to be 70 percent of the total water withdrawn (Holland, 1987). Commercial water-use totals for each hydrologic cataloging unit area are determined by aggregation of site-specific data located within these specificareas.
Mining Water Use
Water used by Arkansas mining operations includes naturally occurring solids, such as coal, and ores; liquids, natural gas. This category also includes water used for screening, washing, floatation and other processing customa the mining operation). Mining water use is estimated by mu pumped by the water-use coefficient for that type of prod uct determined during a 1982 telephone survey (table 3).
water used for the extraction of minerals; as crude petroleum; and gases, such as
quarrying, dewatering, and milling (crushing, ily performed at a mine site, or as part of tiplying the quantity of product mined or
These water-use coefficients were
Table 3.~Mined water-use coefficient.
[gallons/ton, gallons per ton; gallons/barrel
s in Arkansas
, gallons per barrel]
Mined productWater use
(peri unit mined or pumped)
Abrasives (oil stone and whet stones)BauxiteBromine brineCementClaysGem stonesGypsumLimeQuartzSand and gravelStone (crushed and dimension)SulphurTalcTripoli
Negligible 140 gallons/ton 7.5 gallons/barrel 220 gallons/ton 30 gallons/ton Negligible Negligible 10 gallons/ton Negligible 150 gallons/ton 30 gallons/ton Negligible Negligible Negligible
14

Information on the quantities of products mined is obtained from several sources. The quantities of nonfuel products mined is estimated by the Arkansas Geological Commission in cooperation with the U.S. Department of the Interior, Bureau of Mines (White and Bush, 1988). Information in this report includes the type of nonfuel mineral commodity produced, the name and address of the company, type of activity, and the county in which the operation is located. Similar information concerning coal and other fuel product mining operations is obtained from the U.S. Department of Energy (A. Perry, U.S. Department of Energy, written commun., 1986). Information pertaining to the number of oil and gas wells drilled and the per well water-use coefficient are provided by the Arkansas Oil and Gas Commission (B. Wright, Arkansas Oil and Gas Commission, written commun., 1988). Consumptive use for mining is considered to be 100 percent of the total water withdrawn (Holland, 1987). Mining water-use totals for each hydrologic cataloging unit area are determined by aggregation of site-specific data located within these specific areas.
Livestock Water Use
Livestock water use includes water used for stock watering, feed lots, dairy operations, aquaculture (fish farming), and other on-farm needs. A large part of the water-use information for aquaculture is provided from responses to the Agricultural Water Use Registration Form distributed by ASWCC (appendix 3, page 3-8). Due to the lack of responses in some counties, it is necessary to estimate the water use for aquaculture in some areas. Most fish are raised in large levee ponds. Water withdrawals for aquaculture are used to maintain appropriate pond levels and to provide aeration. Water used for livestock is estimated.
Aquaculture uses the largest amount of water in this category. Water-use estimates for aquaculture by county are calculated by multiplying the acreage used for aquaculture by a water-use application rate. This volume of water is multiplied by the duration of pumping, and the result is an estimate of the total water use for aquaculture in that county. For intensive aquacultural operations the total acreage used for aquaculture by county and the type offish stocked in each pond is provided by the U.S. Fish and Wildlife Service, Fish Fanning Experimental Laboratory, Stuttgart, Arkansas (B. Collins and D. Sample, U.S. Fish and Wildlife Service, written commun., 1989), and the University of Arkansas Cooperative Extension Service (L.W. Dorman, University of Arkansas Cooperative Extension Service, written commun., 1989). For nonintensive (rough fish ponds and fishing lakes) aquacultural operations acreage figures are provided by the Arkansas Game and Fish Commission (J. Farwick, Arkansas Game and Fish Commission, oral commun., 1988).
Application rate estimates are based on water-use studies by the USGS on selected aquacultural operations in the State. These aquacultural operations are monitored to collect well pumpage and duration of pumping information. Well pumpage is measured using one of the following instruments or methods: a noninvasive flow meter, the Trajectory method, or an in-line flow meter. The duration of pumping is recorded by electric meter, a digital vibration time totalizer, or a digital inductive time totalizer attached to the pump. The duration of pumping is multiplied by an average measured pump discharge to calculate a total withdrawal for the well. This withdrawal is then divided by the pond acreage in order to determine the application rate. This process is duplicated for all sites in the study network. Upon completion of these studies, a mean application rate is determined. Consumptive use for aquaculture is estimated to equal approximately 38 percent of the water withdrawn (J.A. Callahan, U.S. Geological Survey, oral commun., 1988).
The livestock category also includes the use of water for the production of livestock (animals). Data components required for the estimation of water use for livestock include county livestock population and the appropriate water-use coefficient for each type of livestock produced within the State. Livestock population values for Arkansas are published by county by the U.S. Department of Agriculture Crop Reporting Service (U.S. Department of Agriculture, 1989). Water-use coefficients for livestock are listed on the next page.
15
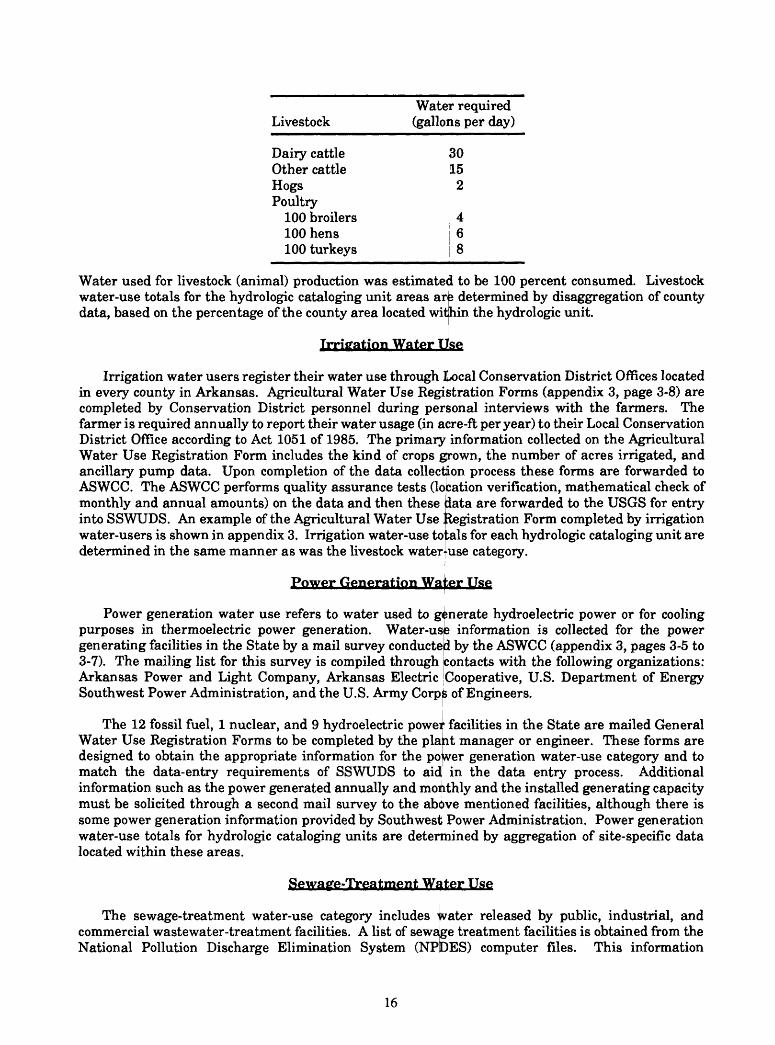
LivestockWater required (gallons per day)
Dairy cattle 30Other cattle 15Hogs 2Poultry
100 broilers100 hens100 turkeys
468
Water used for livestock (animal) production was estimated water-use totals for the hydrologic cataloging unit areas aro data, based on the percentage of the county area located within
Irrigation Water Use
to be 100 percent consumed. Livestock 13 determined by disaggregation of county
the hydrologic unit.
Irrigation water users register their water use through Local Conservation District Offices located in every county in Arkansas. Agricultural Water Use Registration Forms (appendix 3, page 3-8) are completed by Conservation District personnel during personal interviews with the farmers. The farmer is required annually to report their water usage (in acre-ft per year) to their Local Conservation District Office according to Act 1051 of 1985. The primary information collected on the Agricultural Water Use Registration Form includes the kind of crops grown, the number of acres irrigated, and ancillary pump data. Upon completion of the data collection process these forms are forwarded to ASWCC. The ASWCC performs quality assurance tests (location verification, mathematical check of monthly and annual amounts) on the data and then these lata are forwarded to the USGS for entry into SSWUDS. An example of the Agricultural Water Use '. legislation Form completed by irrigation water-users is shown in appendix 3. Irrigation water-use to ;als for each hydrologic cataloging unit are determined in the same manner as was the livestock water use category.
Power Generation Wafrer Use
Power generation water use refers to water used to generate hydroelectric power or for cooling purposes in thermoelectric power generation. Water-usB information is collected for the power generating facilities in the State by a mail survey conducted by the ASWCC (appendix 3, pages 3-5 to 3-7). The mailing list for this survey is compiled through contacts with the following organizations: Arkansas Power and Light Company, Arkansas Electric Cooperative, U.S. Department of Energy Southwest Power Administration, and the U.S. Army Corpfe of Engineers.
The 12 fossil fuel, 1 nuclear, and 9 hydroelectric power facilities in the State are mailed General Water Use Registration Forms to be completed by the plant manager or engineer. These forms are designed to obtain the appropriate information for the power generation water-use category and to match the data-entry requirements of SSWUDS to aidj in the data entry process. Additional information such as the power generated annually and monthly and the installed generating capacity must be solicited through a second mail survey to the above mentioned facilities, although there is some power generation information provided by Southwest Power Administration. Power generation water-use totals for hydrologic cataloging units are determined by aggregation of site-specific data located within these areas.
Sewage-Treatment W^ter Use
The sewage-treatment water-use category includes water released by public, industrial, and commercial wastewater-treatment facilities. A list of sewajge treatment facilities is obtained from the National Pollution Discharge Elimination System (NPDES) computer files. This information
16
originally is collected by Arkansas Department of Pollution Control and Ecology. Other data contained in these computer files include the location (latitude and longitude) of the release point of the treated wastewater and the amount of wastewater treated and released. These release values are compared with public-supply, industrial, and commercial withdrawal values to determine the accuracy of the release discharge numbers. Sewage-treatment release totals for each hydrologic cataloging unit are determined by aggregation of site-specific data located within these areas.
DATA COLLECTION TECHNIQUES IN FLORIDA
Water-use data in Florida are collected by the Florida Department of Environmental Regulation (FDER), Northwest Florida Water Management District, St. Johns River Water Management District, South Florida Water Management District, Southwest Florida Water Management District, and the Suwannee River Water Management District in cooperation with the USGS. Data collection forms used by the water management districts are provided in appendix 3, pages 3-9 to 3-18. The nine national water-use categories listed in the Introduction are collected in Florida, in addition to miscellaneous water use. Public-supply, industrial, commercial, mining, power generation, sewage- treatment, and miscellaneous water-use data are collected by contacting the appropriate agency or facility. Domestic, livestock, and irrigation water use are estimated using population or acreage estimates and water application rates. The categories of water-use data collected in Florida and the associated sources of information are given in table 4.
Public-Supply Water Use
The public-supply category includes water used by both public and private water suppliers. Those facilities that serve 400 or more people, or withdraw more than 0.01 Mgal/d are inventoried. Public- supplied water is utilized for all of the major use categories in Florida including: domestic (less than 400 residents), commercial, industrial, irrigation, and thermoelectric power generation. In addition to these five categories, public-supply water use also is reported for utility use, which includes water used in firefighting, system maintenance (system flushing), and water lost to leakage.
Data are collected by each of the five water management districts in Florida using information from their Consumptive Use Permit (CUP) files, mail or telephone contact, and supplied by the FDER monthly operating reports (appendix 3, pages 3-10 and 3-16). The information concerning each user obtained from these sources includes the mailing address, facility location, source of water withdrawn (ground or surface), monthly pumpage, and number of connections or population served.
Consumptive use is calculated by subtracting returns from the public wastewater facilities from withdrawal values for these facilities with the difference representing the amount of water (33 percent, 1985) consumed by public-supplied facilities. The residential component of public-supply consumptive use is estimated to be 21 percent (Solley and others, 1988). Values for return flows are supplied by the FDER, Domestic Wastewater Section. Public-supply water-use totals for each hydrologic subregion unit within the State are determined by aggregation of site-specific data located within these specific areas.
Domestic Water Use
Domestic water use is defined as water provided by individual domestic wells or by small utility companies (serving fewer than 400 residents). The total population served by domestic supplies is calculated by subtracting the number of residents served by public-supplied systems from the total county populations (University of Florida, 1986). The domestic water use for a county is calculated by multiplying the county per capita use (in gal/d) by the domestic self-supplied population for each county. The individual county per capita use value is determined by dividing the public-supplied withdrawal figure for each county by the population served by public-supply facilities in that county. Generally, self-supplied domestic per capita water use is lower than that for public-supply domestic
17

Table 4.--Florida: Categories of water use and sources of information
Water-use category Data sources
Public supply
Domestic
Industrial
Commercial
Mining
Florida DepartmentDrinking ^
St. Johns Riv Suwannee Ri Southwest South Florid Northwest F
of Environmental Regulation, ater Sectioner Water Management District ver Water Management District
Water Management District Water Management District
orida Water Management District
F Drida
Florida Department of Environmental Regulation(population data)
St. Johns River Water Management District Suwannee River Water Management District Southwest Florida Water Management District South Florida Water Management District Northwest Florida Water Management District University of Florida, College of Business
Administration, Bureau of Economic and Business Research (population program)
St. Johns River Water Management DistrictSuwannee RSouthwest F orida Water Management District South Floric a Water Management DistrictNorthwest F
Consumptrecords, an d questionnaire and telephone surveys
Florida DepsDrinking Water Section, Monthly OperatingReport for tfoncommunity Systems
St. Johns Ri Suwannee Southwest South Florid a Northwest F
Consumptrecords,
Florida Depand
ver Water Management District
orida Water Management District, ve Use Permit files and Compliance
rtment of Environmental Regulation,
er Water Management District River Water Management District Florida Water Management District
Water Management District orida Water Management District, ve Use Permit files and Compliance
questionnaire and telephone surveys rtment of Environmental Regulation,
Drinking Water Section, Monthly Operating Report for ^oncommunity Systems
St. Johns Ri|ver Water Management District Suwannee River Water Management District Southwest Florida Water Management District South Florida Water Management District Northwest Florida Water Management District,
Consumptive Use Permit files and Compliancerecords, and questionnaire and telephone surveys
Florida Department of Environmental RegulationDrinking Water Section, Monthly OperatingReport for Noncommunity Systems
18

Table ^.--Florida: Categories of water use and sources of information Continued
Water-use category Data sources
Agriculture
Irrigation
Power generation
Sewage treatment
Miscellaneous
St. Johns River Water Management District Southwest Florida Water Management District South Florida Water Management District Suwannee River Water Management District Northwest Florida Water Management District,
Consumptive Use Permit and Compliance files Florida Crop and Livestock Reporting Service,
Florida Agricultural Statistics University of Florida, Institute of Food and
Agricultural Science, main office and CountyExtension Service
St. Johns River Water Management District Southwest Florida Water Management District South Florida Water Management District Suwannee River Water Management District Northwest Florida Water Management District
Consumptive Use Permit and Compliance files Soil Conservation Service: Crop Requirement
Needs Manual Florida Institute of Food and Agriculture,
County Extension agents Florida Crop and Livestock Reporting Service U.S. Geological Survey Report: Benchmark
Farms Program-A Method for EstimatingIrrigation Water Use in Florida
St. Johns River Water Management District Suwannee River Water Management District Southwest Florida Water Management District South Florida Water Management District Northwest Florida Water Management District,
Consumptive Use Permit and Compliancefiles and mail survey
Florida Department of Environmental Regulation Domestic Wastewater Section, monthly operation report files
St. Johns River Water Management District Suwannee River Water Management District Southwest Florida Water Management District South Florida Water Management District Northwest Florida Water Management District,
Consumptive Use Permit files and Compliancerecords
19
use. However, in Florida, the individual county per capita water use is used because it accounts for small commercial and industrial users that are not included under the commercial or industrial categories in the following sections. Domestic water-use totals for hydrologic subregion unit areas are determined by disaggregation of county data using the percentage of the population located within the hydrologic unit. These hydrologic unit subtotals for each county are then regrouped for the State and totaled.
Industrial Water Uise
Industrial water use includes water that is used for production in the following industries: pulp and paper, chemical, food processing, and miscellaneous manufacturing operations. Each water management district collects information about the industr es in the district, including the location, withdrawal sources, and other unique facility information The amount of water withdrawn and deliveries from public supply are obtained by each water management district through their CUP file, telephone or mail contact (appendix 3, pages 3-9 and 3-17), or from FDER monthly reports. Consumptive use for the industrial use category is estimated to be 33 percent of the amount of waterwithdrawn and delivered from public-supply facilities (Mare la, 1988). Industrial water-use totals foreach hydrologic subregion unit within the State are determined by aggregation of site-specific data located within these specific areas.
Commercial Water Use
Each water management district collects information about the commercial facilities in the district, including the location, withdrawal sources, and other unique facility information. Water withdrawal and delivery information are obtained by each water management district through their CUP file, telephone or mail contact (appendix 3, pages 3-9 imd 3-17), or by going through the FDER monthly reports. Consumptive use for the commercial water-use category is estimated to be 33 percent of the amount of water withdrawn or delivered by public-supplied facilities (Marella, 1988). Commercial water-use totals for each hydrologic subregion unit within the State are determined by aggregation of site-specific data located within these specific areas.
Mining Water Uso
Mining water use refers to water that is used in the dewatering or washdown process in a mining operation. The primary users of water for mining purposes in Florida include companies mining sand,limestone, phosphates, and other commodities. Each water management district collects information(appendix 3, page 3-10) about the mining operations in a district, including the location, withdrawal sources, and other unique facility information. Water withdrawal and delivery information are obtained by each water management district through their CUP file, telephone, or mail contact. Mining water-use totals for each hydrologic subregion unit within the State are determined by aggregation of site-specific data located within these specific areas.
Livestock Water Use
Livestock water use includes water used for livestock (animal), both drinking and washdown, and surface-water augmentation for aquaculture. Water-use withdrawals for livestock and aquaculture are estimated from district CUP files and data provided by the Florida Crop and Livestock Reporting Service. These data include the permitted water-use value or the type and number of livestock in each county. The livestock population values are then multiplied by a published water-use coefficient. The coefficients for livestock in Florida (St. Johns River Water Management District, 1984) are shown on the next page.
20

Water required Livestock (gallons per day)
Beef cattle 12Chickens .10Dairy cattle 15Dogs .10Goats 2Hogs 2Horses 12Rabbits .05Sheep 2Turkeys 1
Water used for livestock (animal) is estimated to be 100 percent consumed. Livestock water-use totals for each hydrologic subregion unit were determined by disaggregation of county data using the percentage of the livestock population located within the hydrologic unit. These hydrologic subregion subtotals for each county are then regrouped for the State and totaled.
Irrigation Water Use
Irrigation water use refers to water used to supplement rainfall for the growth of vegetables, fruit, field crops, ornamental plants, and grasses. Data are collected for 29 individual crops within these crop categories: vegetable, fruit, field, ornamental, and grasses. Irrigation acreage also is delineated by the method of irrigation, such as flood, low pressure, and sprinkler.
Withdrawals are calculated for irrigation water use by multiplying the supplemental irrigation requirement by the number of acres irrigated for each county. First, the number of acres irrigated and method of irrigation are collected for each of the 29 crops inventoried for each county. These data are supplied by each water management district (appendix 3, pages 3-11 to 3-14) and by the University of Florida, Institute of Food and Agricultural Science agricultural extension agent in each county. Other sources of data on the number of acres irrigated include water management district CUP files and the Florida Crop and Livestock Reporting Service. The amount of supplemental irrigation water needed to grow each crop, and the water necessary to overcome the inefficiency of the irrigation system is determined. These determinations are made by each water management district utilizing a variety of methods and information services (U.S. Soil Conservation Service, 1970, 1982; and Smajstrla, 1986). The amount of water consumed by the plant or crop is derived by using the evapotranspiration rates generated by computer models for each crop.
Irrigation water-use totals for hydrologic subregion units are determined by manual assignment of crop acreage on a county to county basis. The county information is then regrouped by hydrologic cataloging unit areas at the discretion of the water-use specialist according to the topography of the area being assigned.
Power Generation Water Use
Withdrawal and power-generation data are collected for 50 self-supplied thermoelectric powerplants and 2 hydroelectric plants. More than 99.8 percent of the total water withdrawn is used for cooling purposes. This water may be used for one-time cooling or recirculated several times before being returned to its surface-water source. The remaining 0.2 percent of water, which is primarily ground water, is used for boiler make-up or domestic purposes throughout the plant and is almost 100 percent consumed. Data are collected by the water management districts (appendix 3, page 3-16) and the USGS through CUP files, by mail, or telephone contact. Withdrawal data (for ground and surface water, from fresh and saline sources), deliveries from public suppliers and power generation
21

information are collected through these files or contacts. Power generation water-use totals for each hydrologic subregion units within the State are determined by aggregation of site-specific data located within these specific areas.
Sewage-Treatment Water Use
Release data from the sewage-treatment (public Domestic Wastewater Section. Wastewater discharge data private) sewage-treatment facilities and 125 industrial facili each hydrologic subregion units within the State are located within these specific areas.
wastewater) facilities are provided by the FDER, are collected for 774 municipal (public or ,ies. Sewage-treatment release totals for
determined by aggregation of site-specific data
Miscellaneous Water Use
Miscellaneous water use in Florida includes water not supplied by public systems used for residential lawn irrigation and residential heat pump and air conditioning units. The information pertaining to this category is collected by the water management districts (appendix 3, page 3-15), and is stored in their CUP and compliance files. These miscellaneous uses are not included in other categories because they fail to fit in any one category. A total of 34 counties have withdrawal data in this category. Consumptive use for this category is not estimated due to the lack of data.
Residential lawn irrigation refers to withdrawals (primarily from wells) for the sole purpose of irrigating a residential lawn with no domestic or other use involved. This category is not included under grass in irrigation primarily because grass included only commercial irrigation and not residential. Data are estimated for only 17 of 67 counties.
Residential heat pumps and air conditioning units use water (from wells) for heat exchange. Many of these withdrawals also serve as lawn irrigation when the; unit is operating. Many heat pump and air conditioning units have discharge pipes connected to ;heir sprinkler system. This allows the released water to be used in the sprinkler system. Restrictions on new systems require that they discharge used water to wells, but existing systems continue to discharge to the surface. Data for these withdrawals are available in only 4 of 67 counties.
Unused discharge from free-flowing wells is included in flowing wells exist in the State (Healy, 1978), and many of water management district programs. Data are
this category. An estimated 15,000 free- of these wells have been plugged as a result
available: for 19 of the 67 counties.
DATA COLLECTION TECHNIQUES IN GEORGIA
Water-use data in Georgia are collected through the Georgia Water-Use Program, a cooperative effort between the Georgia Geologic Survey and the USGS. Water-use data are collected for the principal water users in the State each year. Public-supply (appendix 3, page 3-19), industrial, commercial, mining, power generation, and sewage-treatment water-use data are collected by contacting the appropriate agency or facility. Domestic, livestock, mining, commercial, and irrigation water use are estimated using various methods and coefficients. The categories of water-use data collected in Georgia and the associated sources of information are given in table 5.
Public-Supply Watey Use
Small communities and subdivisions that furnish water to at least 25 people, or that have a minimum of 15 hookups are considered to be public-supply systems. Public-supply water-use data collected for the State include the amount of ground or surface water withdrawn. In 1990, a survey of the 74 largest public supply systems was conducted and produced information, such as population
22
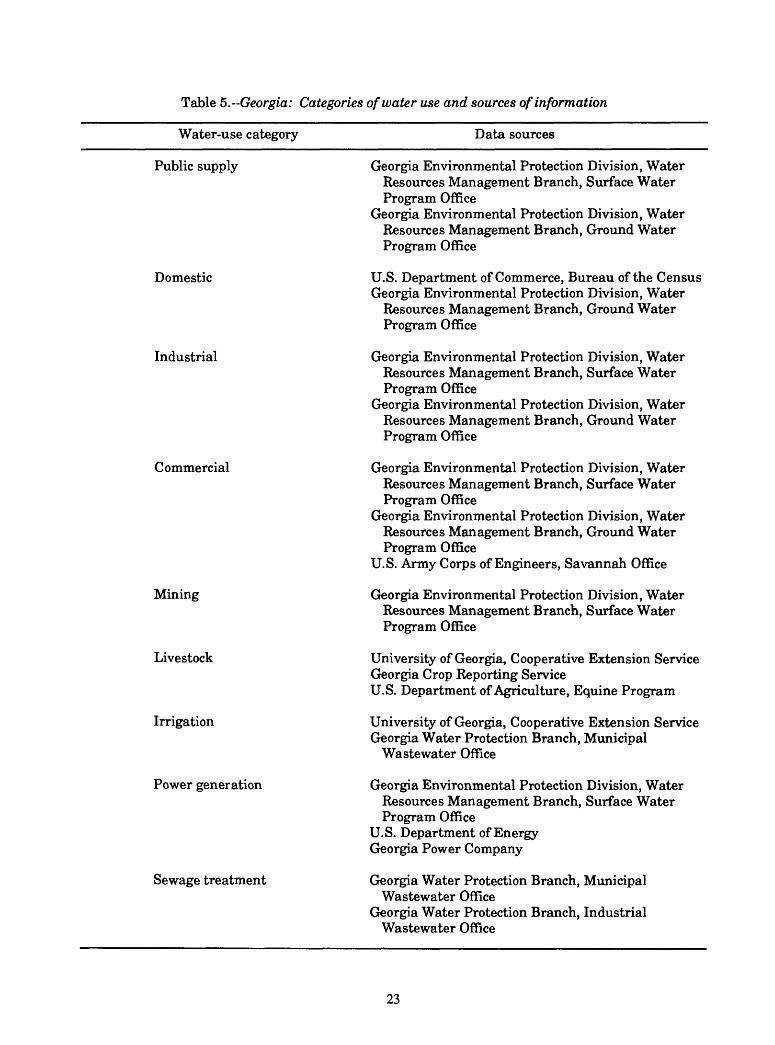
Table ^.--Georgia: Categories of water use and sources of information
Water-use category Data sources
Public supply
Domestic
Industrial
Commercial
Mining
Livestock
Irrigation
Power generation
Sewage treatment
Georgia Environmental Protection Division, WaterResources Management Branch, Surface WaterProgram Office
Georgia Environmental Protection Division, WaterResources Management Branch, Ground WaterProgram Office
U.S. Department of Commerce, Bureau of the Census Georgia Environmental Protection Division, Water
Resources Management Branch, Ground WaterProgram Office
Georgia Environmental Protection Division, WaterResources Management Branch, Surface WaterProgram Office
Georgia Environmental Protection Division, WaterResources Management Branch, Ground WaterProgram Office
Georgia Environmental Protection Division, WaterResources Management Branch, Surface WaterProgram Office
Georgia Environmental Protection Division, WaterResources Management Branch, Ground WaterProgram Office
U.S. Army Corps of Engineers, Savannah Office
Georgia Environmental Protection Division, Water Resources Management Branch, Surface Water Program Office
University of Georgia, Cooperative Extension ServiceGeorgia Crop Reporting ServiceU.S. Department of Agriculture, Equine Program
University of Georgia, Cooperative Extension Service Georgia Water Protection Branch, Municipal
Wastewater Office
Georgia Environmental Protection Division, Water Resources Management Branch, Surface Water Program Office
U.S. Department of EnergyGeorgia Power Company
Georgia Water Protection Branch, MunicipalWastewater Office
Georgia Water Protection Branch, IndustrialWastewater Office
23
served or the number of domestic connections, as well as the percent deliveries to domestic, industrial, and commercial customers. Water-use information for the water-supply category is obtained by various methods and from several sources.
The Georgia Environmental Protection Division (EPD). Water Resources Management Branch (WRMB) provides permitted ground- and surface-water wit] idrawal information (appendix 3, page 3- 19). The WRMB, Surface Water Program Office provides a list of distribution systems for the entire State that is used to determine the status of the major water suppliers. Population served information and public-supply deliveries were obtained from a 1985 mail survey of the largest public-supply systems in Georgia (74 systems). This survey represents 8Ji percent of the total public-supply water use in the State. Population and the number of connections served by mobile home parks, trailer parks, and housing subdivisions are obtained from the WRN B, Ground Water Permits Office. Water- use estimates for mobile home parks, trailer parks, and housing subdivisions are made by multiplying the number of connections by a water-use coefficient of 75 jjal/d per person. Telephone surveys are conducted to contact city and plant managers in order to supplement withdrawal information not collected by the State offices. Public-supply water-use totals for each hydrologic cataloging unit within the State are determined by aggregation of site-specific datal located within these specific areas.
Domestic Water U$e
Domestic water use is defined as water used for normal household purposes, and includes both public-supplied and self-supplied users. Self-supplied domestic water users are comprised of two user groups, rural self-supplied households, and small cities not classified as public-supplied systems. Domestic water use is estimated (appendix 2, page 2-4) using; a coefficient of 75 gal/d per person (Trent and others, 1990) along with county populations and population served values from public-supply facilities (1987 estimate, U.S. Department of Commerce, Bureau of the Census).
Water delivered from public-supply facilities for domestic survey of the 74 largest public-supply systems. Deliveries estimated at 85 percent for domestic use. Small towns without to have 100 percent domestic use. Information pertaining subdivisions is collected by WRMB, Ground Water Program
purposes is determined by a 1985 mail from small public supply systems were
public supply systems are considered to mobile home parks, trailer parks, and Office.
A domestic consumptive use coefficient of 18 percent (appendix 2, page 2-4) is used to determine consumptive use (R.R. Pierce, U.S. Geological Survey, written commun., 1989). Domestic water use within each hydrologic cataloging unit is determined by disiaggregation of county data, based on the percentage of the county area within each hydrologic cataloging unit and multiplying that percentage by the county water-use value. These hydrologic unit subtotals for each county are then regrouped for the State and totaled.
Industrial Water Use
Water is withdrawn for various self-supplied industrial systems throughout Georgia. Paper, textile, and chemical industries are some of the largest in the State. Industrial water-use data are collected from the WRMB, Ground Water and Surface Water permit and program files. The current manufacturing directory (Georgia Department of Industry and Trade and Tourism, 1983) is used as a reference for telephone numbers, SIC codes, and the county location of these industries.
Information contained in the public-supply mail survey includes a percentage of water delivered by public-supply systems to industrial users. This survey also includes the name of the facilities, location, and the amount of water purchased by the larger industrial users. It was estimated that 5 percent of the total water use is considered to be delivered from water supply facilities.
24

The consumptive use for self-supplied industries varies by the type of industry. The percentages are determined by comparing percentages from the United States, South Atlantic, and actual consumptive use figures from some Georgia industries. Industrial water-use totals for each hydrologic cataloging unit within the State are determined by aggregation of site-specific data located within these specific areas.
Commercial Water Use
Withdrawals for commercial users (greater than 100,000 gal/d) are obtained from WRMP. Water- use estimates are compared to other businesses of similar size and type. Other commercial use information is provided by the Regional EPD offices and a 1986 inventory of population served by commercial users.
Commercial deliveries from public-supply facilities are provided by a survey of the largest water suppliers in Georgia. This survey provides the percentage of water delivered for commercial use. Small public systems are considered to deliver 10 percent of the water withdrawn for commercial purposes.
Consumptive use is estimated to be 18 percent of the total water use (withdrawals + deliveries). Although the coefficient is calculated for domestic use, it is used because commercial consumptive use is estimated to be similar to domestic consumptive use. Withdrawal and discharge data for some military bases support this 18 percent estimate. Commercial water-use totals for each hydrologic cataloging unit within the State are determined by aggregation of site-specific data located within these specific areas.
Mining Water Use
Mining water use is primarily mining and mineral processing in the State. The source of water- use information for all permitted mining facilities is the WRMB permits files. Additional water-use data are obtained by telephone surveys, and the "Mining Directory of Georgia" (Steele and O'Connor, 1986). The directory is used to produce a master list of the mining operations in the State. Data in this publication include type of product mined, location of facility, and contact person. Information obtained by the telephone contact includes water used as part of the mining operation, location of the diversion, and the amount of tons of product mined. The consumptive use coefficient for mining is 12 percent. Mining water-use totals for each hydrologic cataloging unit within the State are determined by aggregation of site-specific data located within these specific areas.
Livestock Water Use
Water use for livestock (animal) is estimated by multiplying a water-use coefficient (varies by type of livestock) by the population of each type of livestock produced. Rates per capita (water-use coefficient) are obtained from county agents of the University of Georgia, Cooperative Extension Service (CES). These coefficients vary by type of livestock and by county.
25

LivestockWater required (gallons per day)
Beef cattle Dairy cattle Sheep and lambs Hogs and pigs Poultry
7.9 28.7
.3 2.9
.05
Livestock populations in Georgia are obtained from several publications. Population values for the poultry industry are subdivided by type (layers, broilers, pu lets, broiler/breeder, and turkeys) and by county (Strong and Wildey, 1986). The number of cattle, hoj js and pigs by county are provided by the U.S. Department of Agriculture Crop Reporting Service (1980). Water-use data for aquaculture (catfish farms) are provided by the Georgia Cooperative Extension Service (Lewis, 1984). Consumptive use for livestock is estimated to be 100 percent of the amount withdrawn or diverted. Livestock water- use totals for hydrologic cataloging unit areas are determined by disaggregation of county data using the percentage of the county land area located within the hydrologic cataloging unit. The resulting hydrologic cataloging unit subtotals for each county are then regrouped for the State and totaled.
Irrigation Water Ujse
Irrigation water use is defined as water that is used for crops, large nurseries, athletic fields, and golf courses. Irrigation water-use information is provided by the CES. Every 3 years county agents determine the water application rate by crop type for each kind of irrigation system for each county in the State. This information, along with the acres irrigated by crop type, location of withdrawal site, and the kind of irrigation systems used within each county, is summarized within a report published by the CES (Harrison and Tyson, 1987). These data along with the following formula are used to make water-use estimates for crop irrigation:
(acres/crop) x (inches of water applied) =* (acre-inch/crop)When the amount of water applied is not reported for a county, an estimated application rate of 3 to 6 in. per acre is used, depending on the average crop production values for that area or adjacent county. Water applied by drip irrigation systems is not included.
Water use for athletic fields and golf courses is estimated using an application rate of 26.9 in. of water per year for each acre of land in use. This coefficient was determined during a sample survey conducted from 1979 to 1980.
The amount of reclaimed sewage used for irrigation Protection Branch Municipal Wastewater Office. They provide Georgia, in addition to system flow amounts, operating status
purposes is provided by the Georgia Water a list of all land application systems in
, and location.
Consumptive water use for irrigation is estimated to be 100 percent of the amount of waterwithdrawn. Irrigation water-use totals for hydrologic cataloging unit areas were determined by disaggregation of county data using the percentage of the county land area located within the hydrologic cataloging unit. The resulting hydrologic cataloging unit subtotals for each county are then regrouped for the State and totaled.
26
Power Generation Water Use
Thermoelectric
Water use for thermoelectric power generation includes water that is used for potable uses, cooling purposes, and boiler makeup. Water-use data for thermoelectric power generation include the following information: annual and monthly amounts withdrawn, annual and monthly power generated, installed generating capacity, and location of facility. These data are obtained from several sources.
Thermoelectric withdrawal information is obtained from the WRMB, Ground Water permit files, including nuclear facilities. The Georgia Power Company provides withdrawal information through a mail and telephone survey of their facilities. Power generation information is provided by the Department of Energy (EIA-759) data from monthly powerplant reports. Consumptive use varies from plant to plant, and this information is supplied by the power plant owners. There are no deliveries from public-supplied facilities for thermoelectric power generation. Power generation water-use totals for each hydrologic cataloging unit within the State are determined by aggregation of site-specific data located within these specific areas.
Hydroelectric
Water-use data for hydroelectric power generation include the following information: annual and monthly amount of water diversion, annual and monthly power generated, installed generating capacity, and location of facility and diversion. A mail survey is used to collect water-use information for hydroelectric power generating facilities. Power generation information is provided by the Department of Energy (EIA-759) data from monthly powerplant reports. Each hydroelectric plant provides the number of gallons used by each plant to generate 1 megawatt hour of electricity, which is used to determine monthly water-use figures in million gallons per day. A report on hydroelectric power (Westinghouse Hanford Laboratories, written commun., 1988) is used to verify the accuracy of the data. Power generation water-use totals for each hydrologic cataloging unit within the State are determined by aggregation of site-specific data located within these specific areas.
Sewage-Treatment Water Use
The sewage-treatment water-use category includes water released by public, industrial, and commercial wastewater-treatment facilities. The Georgia Water Protection Branch Municipal Wastewater Office provides release amounts and location information for municipal sewage-treatment facilities. These data are collected by personnel in the four regional offices located in Atlanta, Brunswick, Macon, and Albany. The Georgia Water Protection Branch Industrial Wastewater Office provides information pertaining to release amounts and location information for industrial and other types of sewage-treatment facilities for Georgia. Sewage-treatment release totals for each hydrologic cataloging unit within the State are determined by aggregation of site-specific data located within these specific areas.
DATA COLLECTION TECHNIQUES IN KENTUCKY
Water-use data in Kentucky are collected by the Kentucky Natural Resources and Environmental Protection Cabinet (KNREPC), Division of Water, in cooperation with the USGS. The nine national water-use categories listed in the Introduction are collected in Kentucky. Public-supply, industrial, commercial, mining, power generation, and sewage-treatment water-use data are collected by contacting the appropriate agency or facility. Domestic, livestock, and irrigation water use are estimated using population or acreage estimates and water application rates. The categories of water- use data collected in Kentucky and the associated sources of information are given in table 6.
27
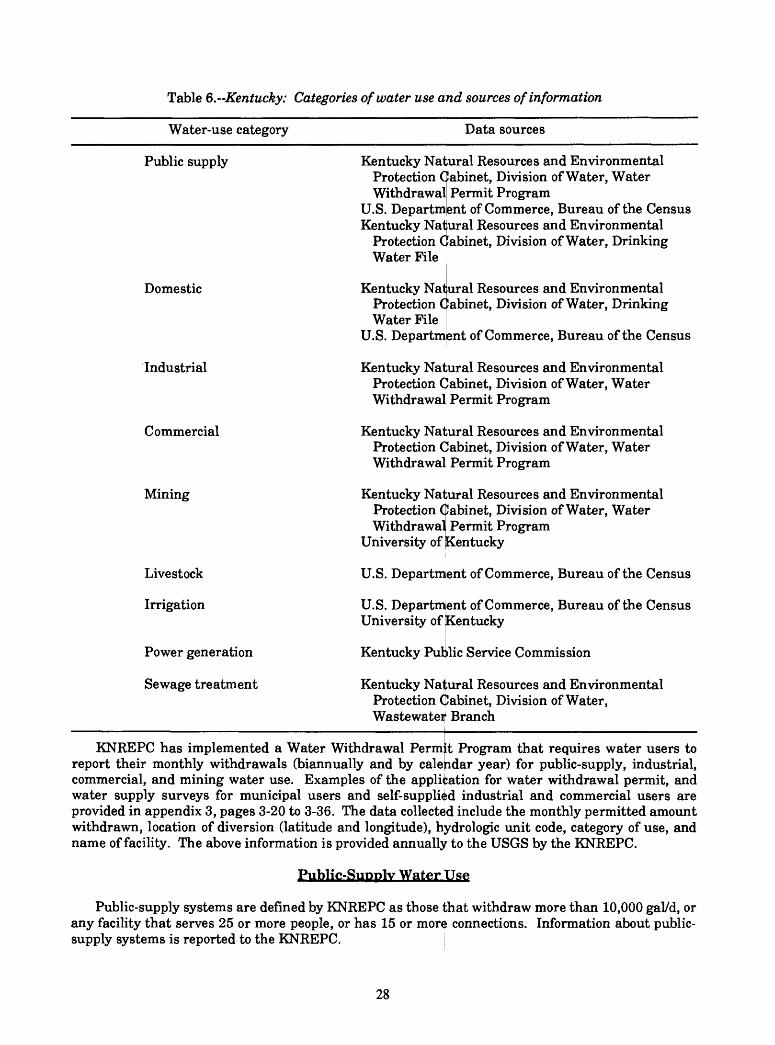
Table 6.-Kentucky: Categories of water use and sources of information
Water-use category Data sources
Public supply
Domestic
Industrial
Commercial
Mining
Livestock
Irrigation
Power generation
Sewage treatment
Kentucky Natural Resources and EnvironmentalProtection Cabinet, Division of Water, WaterWithdrawal Permit Program
U.S. Department of Commerce, Bureau of the Census Kentucky Natural Resources and Environmental
Protection Cabinet, Division of Water, DrinkingWater File
Kentucky Natural Resources and Environmental Protection Cabinet, Division of Water, Drinking Water File
U.S. Department of Commerce, Bureau of the Census
Kentucky Natural Resources and Environmental Protection Cabinet, Division of Water, Water Withdrawal Permit Program
Kentucky Natural Resources and Environmental Protection Cabinet, Division of Water, Water Withdrawal Permit Program
Kentucky Natural Resources and Environmental Protection (jJabinet, Division of Water, Water Withdrawal Permit Program
University of (Kentucky
U.S. Department of Commerce, Bureau of the Census
U.S. Department of Commerce, Bureau of the Census University of Kentucky
Kentucky Public Service Commission
Kentucky Natural Resources and Environmental Protection (pabinet, Division of Water, Wastewater! Branch
KNREPC has implemented a Water Withdrawal Permit Program that requires water users to report their monthly withdrawals (biannually and by calendar year) for public-supply, industrial, commercial, and mining water use. Examples of the application for water withdrawal permit, and water supply surveys for municipal users and self-supplied industrial and commercial users are provided in appendix 3, pages 3-20 to 3-36. The data collected include the monthly permitted amount withdrawn, location of diversion (latitude and longitude), hydrologic unit code, category of use, and name of facility. The above information is provided annually to the USGS by the KNREPC.
Public-Supply Water Use
Public-supply systems are defined by KNREPC as those that withdraw more than 10,000 gal/d, or any facility that serves 25 or more people, or has 15 or more connections. Information about public- supply systems is reported to the KNREPC.
28

Water withdrawal permit forms (appendix 3, pages 3-29 to 3-32) are provided to the individual public-supply facilities throughout Kentucky. These forms request the following information about the public-supply systems: county name, system name, source of water (ground or surface water), intake location, and storage capacity. These data are collected biannually and by calendar year. Population values for persons serviced by public-supply systems are provided by the U.S. Department of Commerce, Bureau of the Census (1984), supplementing the population values that are provided by KNREPC.
Deliveries from public-supply systems to commercial, industrial, domestic, and public use, in addition to losses and transfers, are obtained by questionnaires sent by the KNREPC to public-supply facilities requesting information about deliveries to various water users within a 27-county study area in western Kentucky (Sholar and Wood, 1986). Public-supply facilities outside the study area are estimated based on an average percentage of the amount of water delivered to commercial, industrial, domestic, and public uses within the 27-county study area of the report. Public-supply water-use totals for each hydrologic cataloging unit within the State are determined by aggregation of site-specific data located within these specific areas.
Domestic Water Use
Domestic use also is referred to as residential water use. The water may be obtained from a public- supply facility or may be self-supplied. The KNREPC provides population serviced values by facility. These values are aggregated by county and totaled. County population values are provided by the U.S. Department of Commerce, Bureau of the Census (1984).
Water used for domestic (self-supplied) purposes is determined by multiplying a 50 gal/d per person coefficient by the population not serviced by public-supplied facilities within a county.
(County population) - (population served by public-supply systems) x (50 gal/d per person)
There is a 70 gal/d per person coefficient used to estimate domestic use by those customers that are furnished by public-supply systems. This coefficient is determined by dividing the population serviced by the public-supply system by the amount of water billed for domestic purposes within a specified area. Consumptive use for domestic purposes is estimated by adding the amount of water withdrawn for domestic purposes plus the volume of water delivered by public suppliers for domestic uses, and this total is multiplied by a coefficient of 0.57. All of the previously mentioned coefficients are determined by KNREPC from previous studies or from data on file. Domestic water-use totals for hydrologic cataloging unit areas are determined by disaggregation of county data using the percentage of the county land area located within the hydrologic cataloging unit. These percentages are multiplied by the county water-use totals. The resulting hydrologic cataloging unit subtotals for each county are then regrouped for the State and totaled.
Industrial Water Use
Industrial water use is defined as water that is used to manufacture or produce food, textiles, pulp and paper products, chemicals, metals, and distillery products. The water may be obtained from a public-supply facility or it may be self-supplied. Industries that withdraw more than 10,000 gal/d are required to report their water use to the KNREPC Water Withdrawal Permit Program (appendix 3, pages 3-33 to 3-36). Consumptive use is considered to be 4 percent, based on estimates from the western Kentucky inventory results (Sholar and Wood, 1986). Industrial water-use totals for each hydrologic cataloging unit within the State are determined by aggregation of site-specific data located within these specific areas.
29

Commercial Water Use
Water used for commercial purposes may be obtained from a public-supply facility or be self- supplied. Commercial water users not supplied from public water systems, that withdraw more than 10,000 gal/d, report their water usage to the KNREPC Water Withdrawal Permit Program (appendix 3, pages 3-33 to 3-36). Approximately 4 percent of all Water withdrawn for commercial use is considered to be consumed. The consumptive use estimate is based on the western Kentucky inventory results (Sholar and Wood, 1986). Commercial water-use tptals for each hydrologic cataloging unit within the State are determined by aggregation of the site-sjpecific data located within these specific areas.
Mining Water Use
The primary uses of water for mining are in conjunction \vith dewatering deep mine operations andfor coal washing. Mining data for permitted users are obtain id from the KNREPC Water WithdrawalPermit Program (appendix 3, pages 3-33 to 3-36). Permittee users are those that use at least 10,000 gal/d. Consumptive use for mining is estimated to be 3 percent of the amount withdrawn (Dr. Joe Leon, University of Kentucky, oral commun., 1985). Mining waters-use totals for each hydrologic cataloging unit within the State are determined by aggregation of the site-specific data located within these specific areas.
Livestock Water Ui
Water used for livestock (animal) purposes is estimated gallons per day by the county livestock population. A report Commerce, Bureau of the Census (1984) contains populati county, and water requirements for livestock. Data indicate in Kentucky. The water requirements for livestock in Kentucky
by multiplying a per capita water use in published by the U.S. Department of
on figures for livestock and poultry by ,hat there are no aquacultural operations
are as follows:
LivestockWater required (galloiis per day)
Poultry HogsDairy cattle Beef cattle Horses Sheep
0.1 6
(15 2 2 2
Consumptive use for livestock purposes is estimated to be 1QO percent. Livestock water-use totals for hydrologic cataloging unit areas are determined by disaggregation of county data using the percentage of the county land area located within the hydrologic cataloging unit. The resulting hydrologic cataloging unit subtotals for each county are then regrouped for the State and totaled.
Irrigation Water U^e
Water use for irrigation is estimated by multiplying the number of irrigated acres (within a county) by an application rate (0.4 ft per year). Irrigated acreage is provided by the U.S. Department of Commerce, Bureau of the Census (1984). These acreage values are reported by county and by crop. Kentucky's primary crops are tobacco, corn, wheat, and soybeans. The application rate of 0.4 ft per acre per year is determined by the State Irrigation Specialist at the University of Kentucky (University of Kentucky, written commun., 1985). Consumptive use for irrigation is estimated to be 95 percent of the amount withdrawn, with the remaining 5 percent accounting for conveyance losses. Irrigation
30
water-use totals for hydrologic cataloging unit areas were determined by disaggregation of county data using the percentage of the county land area located within the hydrologic cataloging unit. The resulting hydrologic cataloging units for each county are then regrouped for the State and totaled.
Power Generation Water Use
Thermoelectric
The primary use of water in thermoelectric power generating facilities is for cooling purposes. Thermoelectric power data are provided for 22 fossil-fuel plants by the Kentucky Public Service Commission. Site-specific data received from the Public Service Commission contain information about the location of the diversion (latitude and longitude), address of the plant, amount of water withdrawn, ground- or surface-water delineation, installed generating capacity of the facility, and the amount of power produced monthly and annually. Power generation water-use totals for each hydrologic cataloging unit within the State are determined by aggregation of site-specific data located within these specific areas.
Hydroelectric
Hydroelectric power generation information for seven hydroelectric plants is provided by the Kentucky Public Service Commission. Site-specific data received from the Public Service Commission contain information about the location of the diversion, address of the plant, amount of water that flows through the turbines, source of water (stream, river, or lake), installed generating capacity of the facility, and amount of power produced monthly and annually. Power generation water-use totals for each hydrologic cataloging unit within the State are determined by aggregation of site-specific data located within these specific areas.
Sewage-Treatment Water Use
Information about sewage-treatment facility releases is obtained from the Kentucky Pollutant Discharge Elimination System Branch of the KNREPC. The Wastewater Branch provides the following data: the number of public, industrial, and other sewage-treatment facilities, locations for these facilities, locations for the release point, and the amount of water released. Sewage-treatment release totals for each hydrologic cataloging unit within the State are determined by aggregation of site-specific data located within these specific areas.
DATA COLLECTION TECHNIQUES IN LOUISIANA
Water-use data in Louisiana are collected by the Louisiana Department of Transportation and Development, Office of Flood Control and Water Management, in cooperation with the USGS. The nine national water-use categories listed in the Introduction are collected in Louisiana. Public-supply, industrial, commercial, mining, power generation, and sewage-treatment water-use data are collected by contacting the appropriate agency or facility. Examples of data collection forms are provided in appendix 3, pages 3-37 to 3-43. Domestic, livestock, and irrigation water use are estimated using population or acreage estimates and water application rates. The categories of water-use data collected in Louisiana and the associated sources of information are given in table 7.
Public-Supply Water Use
A public-supply facility is defined as a water system that provides water to 250 or more people during the year. The public-supply water-use category is made up of the following user groups: municipal, private water systems, rural water systems, and parish water districts. A master list of public-supply systems was compiled from information received from the following sources: the Louisiana Department of Health and Hospitals (municipal systems and private water systems), the
31

Table 7 . Louisiana: Categories of water use and sources of information
Water-use category Data sources
Public supply
Domestic
Industrial
Commercial
Mining
Livestock
Irrigation
Power generation
Sewage treatment
Louisiana Department of Transportation andDevelopment
Louisiana Department Farmers Home Louisiana Rural Capital Area Ground Water
of Health and Hospitals Administration Water Association
Conservation Commission
U.S. Department of Commerce, Bureau of the CensusLouisiana Department of Health and HospitalsFarmers Home AdministrationLouisiana Rural Water AssociationCapital Area Ground Water Conservation Commission
Louisiana Department of Transportation andDevelopment
Louisiana Department of CommerceCapital Area Ground Water Conservation Commission
Louisiana Department of Transportation andDevelopmeht
Louisiana Department of Health and Hospitals Capital Area Ground Water Conservation Commission
Louisiana Development
Department of Transportation and merit
Capital Area Ground Water Conservation Commission
Louisiana Department of Transportation andDevelopment
Louisiana State University Extension Service U.S. Agricultural Stabilization and Conservation
Service
Louisiana Department of Transportation andDevelopment
Louisiana State University Extension Service U.S. Agricultural Stabilization and Conservation
Service
Louisiana Department of Transportation andDevelopment
Sabine River Compact Commission
Louisiana Department of Transportation andDevelopment
Louisiana Department of Health and Hospitals
32

Farmers Home Administration, and the Louisiana Rural Water Association (rural systems and parish water districts). Water-use data in the public-supply category are provided by information received from a mail survey (appendix 3, pages 3-37 to 3-40, 3-43). Additionally, the Capital Area Ground Water Conservation Commission provides pumpage information for the major users located within the five parishes under their jurisdiction (appendix 3). Public-supply water-use totals for each hydrologic cataloging unit within the State are determined by aggregation of site-specific data located within these specific areas.
Domestic Water Use
Domestic water use is defined as water that is used by residents of a parish for household purposes that are not being served by public-supply systems. Domestic water use in Louisiana is estimated by multiplying a water-use coefficient by the population served by domestic self-supplied systems. The population value for domestic (self-supplied) users is determined by subtracting the number of persons served by municipal, private, rural water systems, or parish water districts within a parish from the parish population total, with the remaining population being domestic (self-supplied). The parish population totals are provided by the U.S. Department of Commerce, Bureau of the Census (1982a). The domestic water-use coefficient was 80 gal/d. Domestic water use is considered to be 100 percent consumed.
Domestic water use within the hydrologic cataloging unit areas is computed by disaggregation of parish water-use information based on the percentage of the population located within the hydrologic cataloging unit. This percentage is then multiplied by the water-use value for the parish. The resulting hydrologic cataloging unit subtotals for each parish are then regrouped for the State and totaled.
Industrial Water Use
Data collected in the industrial category include self-supplied water and water delivered from public-supply systems. A mail survey (appendix 3, pages 3-37 to 3-40, 3-43) is the primary source of industrial water-use information (same questionnaire that is used for public-supply water use category). A listing of industrial users is obtained from the Louisiana Department of Commerce (1986). In addition to the data provided by the survey, the Capital Area Ground Water Conservation Commission provides pumpage information for the major users located within the five parishes under their jurisdiction. Industrial water-use totals for each hydrologic cataloging unit within the State are determined by aggregation of site-specific data located within these specific areas.
Commercial Water Use
The majority of the data collected in the commercial category are obtained by a mail survey (same questionnaire that is used for public-supply water-use category). The Department of Health and Hospitals provides a list of large and small commercial establishments. The smaller commercial establishments listed include service stations, truck stops, and bars. In addition to the data provided by the survey, the Capital Area Ground Water Conservation Commission provides pumpage information for the major users located within the five parishes under their jurisdiction. Commercial water-use totals for each hydrologic cataloging unit within the State are determined by aggregation of site-specific data located within these specific areas.
Mining Water Use
Water used in Louisiana mining operations is for solution mining of salt and sulfur. A mail survey is the primary source of water-use information for mining (same questionnaire that is used for public- supply water-use category). A listing of these mining operations was obtained from the U.S. Department of Commerce, Bureau of the Census (1982c). In addition to the data provided by the
33

survey, the Capital Area Ground Water Conservation Commission provides pumpage information for the major users located within the five parishes under its jurisdiction. Mining water-use totals for each hydrologic cataloging unit within the State are determined by aggregation of site-specific data located within these specific areas.
Livestock Water Uue
res by
Livestock water use in Louisiana includes water used horses, hogs, sheep, chickens, and turkeys) and aquacultu and fish hatcheries). Water use for livestock is estimated parish by a water-use coefficient. Water use for aquaculturo of acres of ponds in each parish by an produced.
for the propagation of livestock (cattle, (primarily catfish and crawfish farming multiplying the livestock population by is estimated by multiplying the number
appropriate application rate for the type of aquacultural products
Estimates of livestock populations and associated Wiiter requirements are provided by the Louisiana State University Extension Service. The Extensi on Service also provides estimates of the amount of water supplied by ground- and surface-water sources. In addition, the Extension Service provides estimates of pond acreage used for aquacultural purposes in each parish, and the application rate for each type of aquacultural product produced (appendix 3, pages 3-41 and 3-42). The following table lists the livestock water users in Louisiana and their a ssociated water requirements:
Stock typeWater requirements
(gallons per day) Fis leriesApplication rates
(feet of water per acre)
Dairy cattle Other cattleHorses, mulesHogsSheep, goatsChickensTurkeys
20 Catfish average 4.5, range 3 - 6 10 Crawfish average 2.5, range 1-410 Ha32
.04
;cheries average 5.0, range 3-15
.06
Consumptive use for livestock is considered to be 100 percent of the amount of water withdrawn. Livestock water-use estimates are determined for hydrologic cataloging unit areas by disaggregation of parish data based on the percentage of the parish land ansa located within the hydrologic cataloging unit. The resulting hydrologic cataloging unit subtotals for each parish are then regrouped for the State and totaled.
Irrigation Water L se
Water use for irrigation in Louisiana is estimated by multiplying the number of irrigated acres (by crop type) by the appropriate water application rate. The U.S. Agricultural Stabilization and Conservation Service and Louisiana State University Extension Service provide the number of acres irrigated by crop and delineate the source of water withdrawal (ground or surface water) within each parish, as well as the appropriate water application rate for each crop (appendix 3, pages 3-41 and 3- 42). The primary crops in Louisiana and their associated application rates are shown on the next page.
34

ApplicationGround water
Crop
RiceCottonSoybeansStrawberriesTruck cropsCornSorghumPeachesNurseries
(feet/acre)
averageaverageaverageaverage
averageaverage
300011112
.5
.5
.5
.0
.5
.3
.5
.0
ratesSurface water
(feet/acre)
rangerange
range
50.0.
0.
25-25-
15-
1 .251.00
1..66rarely irrigatedrarely irrigatedrarely irrigated
Consumptive use for general irrigation is considered to be 100 percent of the amount of water withdrawn. However, consumptive use for rice irrigation is estimated to be from 30 to 50 percent.
Irrigation water-use estimates are determined for hydrologic cataloging unit areas by disaggregation of parish data based on the percentage of the parish land area located within the hydrologic cataloging unit. This percentage is multiplied by the parish water-use total, with the total representing the water-use value of the hydrologic cataloging unit. These hydrologic cataloging unit subtotals for each parish are then regrouped for the State and totaled.
Power Generation Water Use
Water-use data collected for 18 fossil-fuel, two nuclear, and one hydroelectric power generation include: monthly and annual water used, installed generating capacity, and annual and monthly power produced. In addition to the above mentioned data collected for all power generation facilities, the amount of water delivered by public-supply facilities, and consumptive use are collected for thermoelectric facilities.
Information pertaining to fossil-fuel power generation is provided by a mail survey (appendix 3, pages 3-39 and 3-40). The only hydroelectric plant using water from Louisiana is located on the Toledo Bend Reservoir. Water from the Sabine River is impounded in the Toledo Bend Reservoir and released to turn turbines at the powerhouse near Burkeville, Texas. Because the Sabine River forms the Louisiana-Texas boundary, one-half of the water flowing through the power plant is counted in Louisiana's water withdrawal inventory. This water body is governed by the Sabine River Compact Administration. Therefore, all data relevant to hydroelectric power generation at this facility are provided by this organization. Power generation water-use totals for each hydrologic cataloging unit within the State are determined by aggregation of site-specific data located within these specific areas.
Sewage-Treatment Water Use
The Louisiana Department of Health and Hospitals provides return flow information from sewage- treatment facilities located within the State. This information is acquired from a complete inventory of these facilities.
Information concerning the number of municipal, industrial, and other wastewater-treatment facilities and their associated locations and releases also is provided by the Louisiana Department of Health and Hospitals. Sewage-treatment release totals for each hydrologic cataloging unit within the State are determined by aggregation of site-specific data located within these specific areas.
35

DATA COLLECTION TECHNIQUES IN MISSISSIPPI
Water-use data in Mississippi are collected by the Mississippi Department of Natural Resources, Bureau of Land and Water Resources in cooperation with the USGS. Eight national water-use categories are inventoried in Mississippi. Public-supply, industrial, mining, power generation, and sewage-treatment water-use data are collected by contacting the appropriate agency or facility. Domestic, livestock, and irrigation water use are estimated using population or acreage and water application rates. The categories of water-use data collected :n Mississippi and the associated sources of information are given in table 8.
Table S.--Mississippi: Categories of water use and sources of information
Water-use category Data sources
Public supply
Domestic
Commercial
Industrial
Mining
Irrigation
Agriculture Aquaculture
Livestock
Power generation
Sewage treatment
U.S. Geological SurveyMississippi Department of Environmental Quality,
Bureau of Land and Water Resources Mississippi State Department of Health, Division of
Water Supply
U.S. Department of Commerce, Bureau of the Census Mississippi Department of Environmental Quality,
Bureau of Natural Resources
Mississippi Stjate Department of Health, Division of Water Supply
Mississippi Department of Economic and Community Development
Mississippi Stjate Geological Survey
Mississippi Department of Agriculture and Commerce National Agricultural Statistics Service Mississippi Slate University, Cooperative Extension
Service, Agricultural Engineering Extension
Mississippi State University, Wildlife and Fisheries Extension
Mississippi Department of Agriculture and Commerce National Agricultural Statistics Service Mississippi State University, Cooperative Extension
Service, Agricultural Engineering Extension
Mississippi Power and Light Company Southern Mississippi Electric Association Mississippi Power Company Clarksdale Municipal Power Company Greenwood Municipal Power Company
Mississippi Department of Environmental Quality, Bureau of Pollution Control
36

Public-Supply Water Use
Public-supply water use is defined as a municipal or rural supply system, whether publicly or privately owned, that furnishes water to cities, towns, and villages. The Directory of Mississippi Municipalities provides a list of municipal supply systems (Mississippi Municipal Association, 1981). A large percentage of the approximately 1,400 municipal supply systems report their data, some by well or point of withdrawal. These site-specific data are reported monthly to the USGS through a mail survey solicited by the Mississippi Department of Environmental Quality, Bureau of Land and Water Resources or by a telephone survey. Primarily, water-use information collected for public-supply systems is based on discharge measurements at these facilities, readings from systems with master meters, and by monthly billing records. In addition to water-use values, the monthly billing records reflect the population served (either by the number of connections served or number of persons served).
Many of the rural systems do not report the water withdrawals or population served. Therefore, the values are estimated. The source of this water is primarily ground water. Withdrawals for rural systems and unmetered municipal systems are estimated from population served (estimated from billing records). A per capita use estimate of 60 gal/d per person is used for rural systems, and for municipal systems that do not report their usage. An additional 20 percent is added to the per capita estimate where withdrawal data are not available (to account for internal use and loss by the systems). A value of 3.2 people per water meter is used to estimate the population served by rural systems that did not maintain population serviced records and that could furnish only the number of metered connections. These estimates are based on a survey of billing records for a number of rural water associations distributed throughout the State.
The following percentages are used to estimate domestic, commercial, and industrial water deliveries from public-supply systems where billing records are not available:
Population Domestic Commercial Industrial
Small towns Larger towns
3,000-15,000 15,000-50,000
80 percent 65 percent
7 percent 15 percent
3 percent 10 percent
System losses account for the remaining 10 percent not accounted for in the billing records. Public- supply water-use totals for each hydrologic cataloging unit within the State are determined by aggregation of site-specific data located within these specific areas.
Domestic Water Use
The domestic water-use category reflects those persons not serviced by public-supply systems within the State. Water use for this category is determined by multiplying a water-use coefficient by the self-supplied domestic population. The self-supplied domestic population is determined by subtracting the number of persons served by municipal supply and rural water systems within a county from the county population total (U.S. Department of Commerce, Bureau of the Census, 1981), with the remaining population representing those persons that are domestic (self-supplied). The domestic water-use coefficient used is 50 gal/d (appendix 2, page 2-4) for households with indoor plumbing, and 10 gal/d for those households without plumbing. These population data for households with indoor plumbing are obtained from the U.S. Department of Commerce, Bureau of the Census (1981) and these figures are adjusted to recent Bureau of the Census data.
Domestic water-use totals for hydrologic cataloging unit areas were determined by disaggregation of county data using the percentage of the county land area located within the hydrologic cataloging unit. These percentages are then multiplied by the county water-use totals. The resulting hydrologic cataloging unit subtotals for each county are then regrouped for the State and totaled.
37
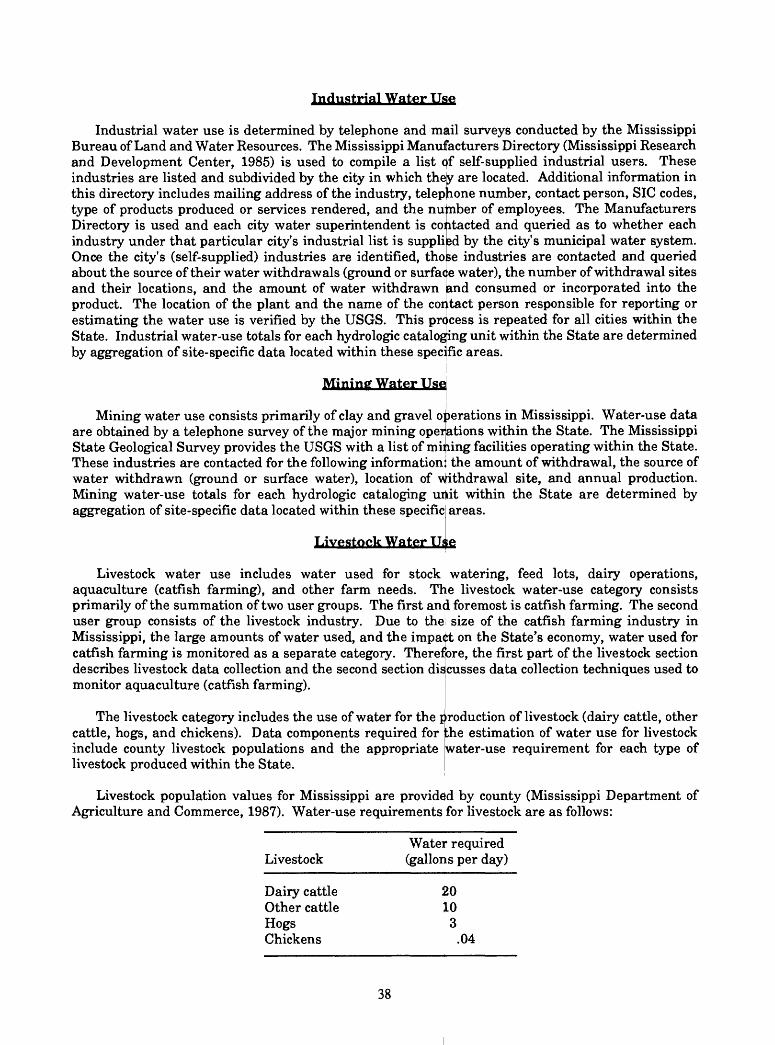
Industrial Water Use
Industrial water use is determined by telephone and mail surveys conducted by the Mississippi Bureau of Land and Water Resources. The Mississippi Manufacturers Directory (Mississippi Research and Development Center, 1985) is used to compile a list of self-supplied industrial users. These industries are listed and subdivided by the city in which they are located. Additional information in this directory includes mailing address of the industry, telephone number, contact person, SIC codes, type of products produced or services rendered, and the number of employees. The Manufacturers Directory is used and each city water superintendent is contacted and queried as to whether each industry under that particular city's industrial list is supplied by the city's municipal water system. Once the city's (self-supplied) industries are identified, those industries are contacted and queried about the source of their water withdrawals (ground or surface water), the number of withdrawal sites and their locations, and the amount of water withdrawn and consumed or incorporated into the product. The location of the plant and the name of the contact person responsible for reporting or estimating the water use is verified by the USGS. This process is repeated for all cities within the State. Industrial water-use totals for each hydrologic cataloging unit within the State are determined by aggregation of site-specific data located within these specific areas.
Mininff Water Use!
Mining water use consists primarily of clay and gravel operations in Mississippi. Water-use data are obtained by a telephone survey of the major mining operations within the State. The Mississippi State Geological Survey provides the USGS with a list of mining facilities operating within the State. These industries are contacted for the following informationi the amount of withdrawal, the source of water withdrawn (ground or surface water), location of Withdrawal site, and annual production. Mining water-use totals for each hydrologic cataloging urtit within the State are determined by aggregation of site-specific data located within these specific areas.
Livestock Water Uiie
Livestock water use includes water used for stock watering, feed lots, dairy operations, aquaculture (catfish farming), and other farm needs. The livestock water-use category consists primarily of the summation of two user groups. The first and foremost is catfish farming. The second user group consists of the livestock industry. Due to the size of the catfish farming industry in Mississippi, the large amounts of water used, and the impact on the State's economy, water used for catfish farming is monitored as a separate category. Therefore, the first part of the livestock section describes livestock data collection and the second section discusses data collection techniques used to monitor aquaculture (catfish farming).
The livestock category includes the use of water for the cattle, hogs, and chickens). Data components required for include county livestock populations and the appropriate livestock produced within the State.
production of livestock (dairy cattle, other the estimation of water use for livestock water-use requirement for each type of
Livestock population values for Mississippi are provided by county (Mississippi Department of Agriculture and Commerce, 1987). Water-use requirements for livestock are as follows:
LivestockWater required (gallons per day)
Dairy cattleOther cattleHogsChickens
20103
.04
38

The sources of water for livestock water use are estimated to be 40 percent withdrawn from ground water and the remaining 60 percent supplied by surface water. The ground- and surface-water percentages are derived by consultation with the State Agriculture Engineer (Mississippi State University, Cooperative Extension Service, Agricultural Engineering Extension, oral commun., 1985) and from previous State surveys. Consumptive use for livestock water use is estimated to be 100 percent. Water-use totals for the hydrologic cataloging units within Mississippi are assigned by the USGS in the same manner as described for aquacultural water use.
Catfish farming is the dominant aquacultural water user. Water withdrawals for catfish farming are used to maintain appropriate pond levels and in the past were used to provide aeration. Approximately 96 percent of all catfish farming in the State takes place in the Delta, where ground water from the shallow Mississippi River alluvial aquifer is the only source of water supply used. Elsewhere in the State, water use for catfish farming is estimated to be 40 percent surface water and 60 percent ground water.
Water-use estimates for catfish farming are calculated by multiplying the total county catfish farm acreage by an application rate times the duration of pumping. Information pertaining to pond acreage and the type offish stocked in each pond is furnished by Mississippi State University (Mississippi State University, Cooperative Extension Service, Wildlife and Fisheries Extension and Agricultural Engineering Extension, written commun., 1985). Acreage is reported by county and application rate estimates are based on water-use studies of selected catfish farming operations in the Delta. Selected catfish farms are monitored to collect withdrawal information and the duration of pumping. Two types of time totalizers are used to record the duration of pumping for aquaculture; the digital vibration time totalizer and the digital inductive time totalizer. Another method of monitoring duration of pumping is reading the electric meter attached to the pump.
The pump duration data are applied to the measured pump discharge of the monitor withdrawal site and a total withdrawal is calculated for the site. The withdrawal then is divided by the pond acreage in order to determine the application rate. This process is duplicated for all sites in the study network. Upon completion of these studies a mean application rate for the monitor network is determined. Consumptive uses for catfish farming are estimated to equal approximately 38 percent of the water withdrawn.
Water-use totals for the hydrologic cataloging units within Mississippi are assigned by the USGS. These assignments are based on the percentage of land area of the hydrologic cataloging units located within the county. Allowances are made in the hydrologic cataloging units assignment process for variations in topography within a county. Topographic maps and aerial photographs, Soil Conservation Service contacts, and farmer consultation are also key components in these assignment decisions.
Irrigation Water Use
Water used for irrigation is estimated by multiplying an application rate by the number of irrigated acres for each crop type. In Mississippi, the major irrigated crops are rice, cotton, and soybeans. Irrigation is used mainly in the northwestern part of Mississippi, commonly known as the Delta. Irrigated acreage for crops raised in the State are provided by the Mississippi Department of Agriculture and Commerce (1987).
Application rates used in Mississippi for irrigation are as follows: rice irrigation requirements are approximately 4.1 ft of water per acre and for other crops (cotton and soybeans) about 1.3 ft per acre. These values are variable and are dependent on climatic conditions from year to year. They are determined by studies conducted in the Delta. The values are updated annually by determining water withdrawals from monitor farm withdrawal sites within the Delta and through contacts with the State Agriculture Engineer. Withdrawals from the monitor withdrawal sites are calculated using data from
39

time totalizers placed on the pumps to record the duration of pumping. This value is multiplied by the measured pump discharge to obtain withdrawal values. Another method for estimating time of operation for electrical pumps is by reading the electric meter on the pump to verify the time of operation with the servicing electric power company.
Consumptive use of irrigation water is estimated to be losses equal 10 percent of the total water withdrawn, units within Mississippi are assigned by the USGS in the water use.
approximately 40 percent and conveyance Water-use totals for the hydrologic cataloging
manner as described for aquaculturalsame
Power Generation Watsr Use
Water use for power generation is represented by the water withdrawn for once-through or condenser cooling of the 12 fossil-fuel and 1 nuclear plants ir)i the State. Both fresh and saline surface water is used for cooling purposes. Also, a small amount of ground water is used primarily for boiler feed water.
The following power companies in Mississippi are inventoried for data relevant to thermoelectric power generation: Mississippi Power Company, Mississippji Power and Light Company, and South Mississippi Electric Power Association, including Greenwood and Clarksdale Municipal Power Companies. The following power generation data are furnished by these companies: monthly water withdrawn (either by ground or surface water, saline or fresh), annual amounts of water withdrawn, monthly power produced, annual power produced, and installed generating capacity. These data are collected annually from personal contacts with power company plant supervisors and engineers. Power generation water-use totals for each hydrologic cataloging unit within the State are determined by aggregation of site-specific data located within these specific areas.
Sewage-Treatment Water Use
Data about sewage-treatment facilities (both industrial and municipal) are provided by the Mississippi Department of Environmental Quality, Division of Pollution Control. These data are received upon request by the USGS on a magnetic tape. Information on this tape includes: name and location of facility, the estimated average daily treated release for each plant, and the location of therelease point by latitude and longitude. Sewage-treatment r unit within the State are determined by aggregation of site
jlease totals for each hydrologic cataloging specific data located within these specific
areas.
DATA COLLECTION TECHNIQUES IN NORTH CAROLINA
Water-use data in North Carolina are primarily collected by the North Carolina Department of Environment, Health, and Natural Resources (EHNR) in cooperation with the USGS. Water-use information also is derived from other State agencies, ilniversities, and private companies that maintain records pertaining to water use or water requirements. The nine national water-use categories listed in the Introduction are collected in No^th Carolina. Public-supply, industrial, commercial, mining, power generation, and sewage-treatment water-use data are collected by contacting the appropriate agency or facility. Domestic,1 livestock, and irrigation water use are estimated using population or acreage estimates and water application rates. The categories of water- use data collected in North Carolina and the associated sources of information are given in table 9.
Public-Supply Watey Use
Public-supply water use is defined as water withdrawn for all uses by public and private water suppliers and delivered to users that do not supply all their own water. Water-use data are collected by the EHNR by site visits and mail survey (appendix 3, pages 3-44 and 3-45), and by accessing North
40

Table 9.--North Carolina: Categories of water use and sources of information
Water-use category Data sources
Public supply
Domestic
Industrial
Commercial
Mining
Livestock
Irrigation
Power generation
North Carolina Department of Environment, Health, and Natural Resources, Division of Water
North Carolina Department of Human Resources, Division of Health Services, Environmental Health, Section, Water Supply Branch
North Carolina Department of Environment, Health,and Natural Resources, Division of Water
U.S. Department of Commerce, Bureau of the Census North Carolina State University U.S. Geological Survey
North Carolina Department of Environment, Health, and Natural Resources, Division of Water
North Carolina Department of Commerce, Industrial Development Division
U.S. Geological Survey
North Carolina Department of Environment, Health, and Natural Resources, Division of Water
North Carolina Department of Human Resources, Division of Health Services, Environmental Health Section, Water Supply Branch
North Carolina Department of Environment, Health, and Natural Resources, Division of Land Resources
North Carolina Department of Commerce, Industrial Development Division
U.S. Geological Survey
North Carolina State University, AgriculturalExtension Service
North Carolina Crop and Livestock Reporting Service
North Carolina Department of Environment, Health, and Natural Resources, Division of Water
North Carolina State University, Agricultural Extension Service
North Carolina State University, Department of Agricultural Engineering
North Carolina Department of Environment, Health,and Natural Resources, Division of Water
U.S. Environmental Protection Agency Duke Power Company Carolina Power and Light Company Nantahala Power and Light Company Virginia Electric Company Tennessee Valley Authority U.S. Department of Energy U.S. Army Corps of Engineers
41

Table $.~North Carolina: Categories of water use and sources of information-Continued
Water-use category Data sources
Sewage treatment North Carolina Department of Environment, Health,and Natural Resources, Department ofEnvironmental Management
U.S. Environmental Protection Agency (EPA-National Pollution Discharge Elimination Systemcomputer fie)
Carolina Department of Human Resources (DHR) data files.. Also, the USGS maintains pumpage or withdrawal data collected for other projects that are incorporated into the water-use files. EHNR conducts an inventory of public-supply water use for the primarily during site visits conducted as part of specific water-use studies or in conjunction with the water loss and leak detection program administered by EHN R. As part of this program, interviews areconducted with superintendents about operation of the facil ties. It is estimated that approximately 5percent of the State is covered annually by site visits to theie facilities.
Periodically, EHNR will conduct a mail survey (appendix 3, pages 3-44 and 3-45) of all public- supply facilities in the State, to update their files with a complete statewide record of water use in a particular year, but these surveys are not made on an annual basis. When additional or current water- use information is required that is not already reported on the EHNR questionnaire or that has not been updated by site visits, data from DHR are accessed. DHR's primary function is to monitor the quality of the drinking water in the State and ensure that vsfater systems are complying with drinking water regulations and standards. The DHR is considered tihe secondary source of water-use data for the public-supply category.
According to DHR, public suppliers can be subdivided into four types of systems: (1) community ground-water systems, (2) community surface-water systems, (3) nontransient and noncommunity systems, and (4) noncommunity systems. Community ground-water systems are those that supply 15 or more service connections or regularly serve 25 or more year-round residents. Community surface- water systems are facilities whose source of water comes from a river, stream, or lake system that provides 15 or more service connections or regularly serves 25 or more year-round residents. Non- transient-noncommunity systems regularly serve at least 2J5 of the same persons for 6 or more months per year. Noncommunity systems serve 25 or more people at least 60 days per year.
Water-use data are collected by DHR monthly. These reports treatment plant operators or other water managers information about the facility, but also include the withdrawal rates of the water supply. Public-supply water-use totals for each are determined by aggregation of site-specific data located
Domestic Water L se
are submitted to DHR by the water- primarily contain water-treatment
;, population served, and the source hydrologic cataloging unit within the State vithin these specific areas.
Domestic water users are defined as individual families and small communities not served by a public-supply system. Domestic water use is estimated by multiplying the domestic population for a county by a per capita water-use coefficient. In North Carolina, the domestic (self-supplied) population is determined by subtracting the total population of a county (U.S. Department of Commerce, Bureau of the Census, written commun., 1985) from the total population served by municipal or community water systems in that county. The population values served by public-supply systems are derived from EHNR and USGS interviews with the public-supply facilities or by DHR data. A water-use coefficient of 60 gal/d per person (appendix 2, page 2-4) is used (Sneed, 1961). This water-use coefficient also is substantiated by examining actual metered water use for rural domestic housing units.
42
Self-supplied domestic consumptive use is calculated as a percentage of the self-supplied domestic withdrawals and the delivered water to domestic users (households) by public-supply facilities. It is estimated that 80 percent of the water withdrawn by self-supplied domestic users was consumed, and 5 percent of the delivered water was consumed. This rate is derived from the USGS estimates.
Self-supplied domestic water use for hydrologic cataloging units is determined by disaggregation of county water use and population served data for public and community water systems. The population served for each hydrologic cataloging unit is determined and then subtracted from the estimated population in that hydrologic cataloging unit. Water use for the hydrologic cataloging units is determined by applying the same per capita factor (60 gal/d per person) that is used for the county values. The hydrologic accounting units are determined by summing the water use in the hydrologic cataloging units in each accounting unit.
Industrial Water Use
Industrial water use includes all water associated in any way with the manufacture of a product, the operation of the manufacturing facility, or the safety and welfare of the facility's employees. Industrial water-use data are obtained from a complete inventory obtained from EHNR. The industries surveyed are identified by using the "Directory of North Carolina Manufacturing Firms" (North Carolina Department of Commerce, 1987). During a preliminary survey in 1981, approximately 1,200 industrial water users were contacted by questionnaire (appendix 3, pages 3-47 and 3-48), telephone interviews, and some site visits. In 1987, a mail survey was conducted of industries that withdrew more than 80,000 gal/d, thus reducing the number of sites inventoried to about 250.
Currently (1990) industrial water-use data are being updated by the EHNR and the USGS. Industrial water-use data are collected by a mail survey (appendix 3, pages 3-47 and 3-48) and followed by telephone interviews. Site visits are made when necessary and in conjunction with special projects that require site-specific water-use data.
Consumptive use is estimated for all (self-supplied) industrial facilities by subtracting the returns from the withdrawals whenever return flows are available. When return flow data are not available, estimates of consumptive use are based on the water-use values computed for similar types of industry that had reliable return flow and consumptive use data. Industrial water-use totals for each hydrologic cataloging unit within the State are determined by aggregation of site-specific data located within these specific areas.
Commercial Water Use
Commercial establishments using their own water-source facilities and those that receive deliveries from public-supply facilities are categorized as commercial water users. EHNR collects commercial water-use information by completing questionnaires (appendix 3, pages 3-47 to 3-49, 3-59) during site visits to the facilities or by telephone or mail contacts. Data are collected by EHNR for the following commercial users: universities, military facilities, prisons, campgrounds, parks, and recreational services. These data are collected on the same form used for public-supply facilities. DHR data are used whenever EHNR or USGS data are not available.
The amount of water delivered to commercial water users from public-supply systems is obtained from EHNR files. The public supplier provides EHNR with information concerning the percentage of water they delivered to various user groups.
Consumptive use information is obtained for major self-supplied commercial users by direct contacts from EHNR and USGS personnel. For other commercial users, the estimated consumptive use rates for the domestic category are applied to commercial use (80 percent for self-supplied
43
commercial and 5 percent for commercial deliveries from public-supply systems). Commercial water- use totals for each hydrologic cataloging unit within the State are determined by aggregation of site- specific data located within these specific areas.
Mining Water Use
Mining water use or mineral extraction is water removed from a quarry for the purpose of working below the natural water table and water used to wash, sort, and separate mineral products. Mining water-use estimates are obtained by EHNR from personal contacts by telephone, mail, or site visits in the same manner as for the industrial category of use. Questionnaires (appendix 3, pages 3-47 to 3-49) are completed during site visits to the facilities and from telephone interviews with facility managers. The site visits usually are conducted in conjunction with a special water-use project or project that requires water-use information with priority based on regional requirements. The telephone interviews are sometimes followed by a site visit to gather additional information that could not be obtained from the telephone interview. Mail surveys are conducted to complete statewide data- collection requirements for report purposes. The mail survey is different and more concise than the regular interview forms and primarily focuses on sources of water supply and amount of water withdrawals and returns.
A complete inventory of mining operations in the State can be obtained from the Directory of Manufacturing Firms (North Carolina Department of Commerce, 1987) and the Directory of North Carolina Mineral Producers (North Carolina Department of Environment, Health, and Natural Resources, 1981). Data obtained for mining operations include withdrawal amounts, location of diversion, source of diversion, and return flows.
All consumptive use estimates for the mining category are obtained from personal contacts. The values for consumptive use were made by subtracting returifi flows for the facility from the amount of water withdrawn. Mining water-use totals for each hydrobgic cataloging unit within the State are determined by aggregation of site-specific data located within these specific areas.
Livestock Water Uke
Livestock water use in North Carolina includes water used horses, hogs, sheep, chickens, and turkeys). Livestock water water requirement (Sneed, 1961) for livestock and multip population totals. The per capita water requirements are:
for the propagation of livestock (cattle, use is estimated by applying a per capita ying this coefficient by county livestock
VLivestock type (g
Dairy cattle 4< Horses 1! Dry or beef cattle 1! HogsSheep 1Chickens 1
^ater required aliens per day)
) ?> t
>) per 100 chickens
Turkeys 9 per 50 turkeys
Livestock populations for each county are acquired from the North Carolina Crop and Livestock Reporting Service (1985). The proportion of water withdrawn from surface water versus ground water is estimated for various regions in the State based on topographic and climatic variability for the various regions of the State. It is estimated that approximately 85 percent of the withdrawals for livestock use were ground-water withdrawals.
44

Livestock water-use totals for hydrologic cataloging unit areas were determined by disaggregation of county data using the percentage of the county land area located within the hydrologic cataloging unit.
Irrigation Water Use
Information required for estimating irrigation water use is provided by EHNR and North Carolina State University (NCSU) Agricultural Extension Service. EHNR conducts field surveys in cooperation with county extension agents in selected river basins. Also, NCSU periodically estimates irrigation water use with the assistance of the county extension agents. The primary factors for estimating irrigation water use are: (1) obtaining the amount of irrigated acreage by crop type for each county, (2) the irrigation frequency and duration periods, (3) type of irrigation systems used (including information on pumps and power source), and (4) water-use coefficient (water requirement for crop type).
Irrigation water use for approximately 50 percent of the State is acquired from the surveys conducted by EHNR (appendix 3, page 3-46). The remainder of the State is estimated by using coefficients based on research conducted by the Department of Agricultural Engineering at NCSU, in addition to other data collected by EHNR. The Department of Agricultural Engineering periodically conducts surveys to record the amount of irrigated acreage by crop in each county. Also, they have established estimates of water requirements and application rates for each crop (table 10). Irrigated acreage values are obtained from a complete inventory provided by field interviews conducted by EHNR personnel and from the biannual surveys conducted by the Agricultural Extension Service, NCSU.
Consumptive use and conveyance losses are estimates made by the Department of Agricultural Engineering at NCSU and from EHNR inventories. The consumptive use for irrigation is estimated to be 100 percent of the withdrawals minus the conveyance loss. Conveyance losses are estimated to be 30 percent of the withdrawal amount.
Table W.~Average irrigation application rates used for calculation of water use in North Carolina
Crop type Application rate
Tobacco 4 inches/acre (average)Corn 7 inches/acre (average)Peanuts 5 inches/acre (average)Soybeans 4 inches/acre (average) Small fruits (strawberries, blueberries) 9 inches/acre Tree fruits (apples, peaches) 6 inches/acreIrish potatoes 4 inches/acreSweet potatoes 4 inches/acreVegetables 4 inches/acreWheat 2 inches/acreHay 8 inches/acreOther small grains 2 inches/acreAlfalfa (coastal) 6 inches/acreAlfalfa (other areas) 8 inches/acrePasture 2 inches/acre
Water-use estimates for each hydrologic cataloging unit are determined by two methods. In areas where site-specific data are available, the water-use values are aggregated by location of the diversion within the hydrologic cataloging unit. In the remaining areas of the State, irrigation water-use totals
45
for hydrologic cataloging unit areas are determined by disaggregation of county data using the percentage of the county land area located within the hydrologic cataloging unit. The resulting hydrologic cataloging unit subtotals for each county are then regrouped for the State and totaled.
Power Generation Water Use
The amount of water used for the generation at 40 hydroe generation facilities is obtained from a complete inventory of EHNR collects these data by a mail survey (appendix 3, page s data compiled by U.S. Department of Energy and private generation operations.
ectric, 16 fossil-fuel, and 3 nuclear power ;he power generating plants in the State.
3-49 to 3-58). Also, the USGS receives ntities who maintain records on power
Data collected on the EHNR form includes amount of surface-water withdrawn (fresh or saline), power generation, water releases, and the location of the withdrawal site. The following companies are sources of data for EHNR and the USGS: Duke Power Company, Carolina Power and Light Company, Nantahala Power and Light Company, Virginia Electric Company, TVA, U.S. Department of Energy, and the U.S. Army Corps of Engineers. Consumptive use for these facilities is estimated by subtracting the return flows from the amount of water withdrawn for each facility. Power generation water-use totals for each hydrologic cataloging unit within the Statel are determined by aggregation of site- specific data located within these specific areas.
Sewage-Treatment Wat0r Use
Return flow information for sewage-treatment facilities located within the State is provided by the EHNR Department of Environmental Management (DEM) and the U.S. Environmental Protection Agency (EPA-NPDES computer file). This information is acquired from an inventory of these facilities.
Information concerning the number of municipal wa stewater-treatment facilities and their associated locations and releases is provided by EHNR, DEM, and EPA-NPDES files. These same values for industrial and other wastewater-treatment facilities are provided by DEM and EPA. Sewage-treatment release totals for each hydrologic cataloging unit within the State are determined by aggregation of site-specific data located within these specific areas.
DATA COLLECTION TECHNIQUES IN PUERTO RICO AND THE U.S. VIRGIN
Water-use data collected for the Commonwealth of Pu Islands of the United States are monitored by the Caribbean
irto Rico and the territory of the Virgin District of the USGS located in San Juan,
Puerto Rico. Water-use data are collected for Puerto Rico by the Commonwealth of Puerto Rico Aqueduct and Sewer Authority, Puerto Rico Department oi'Natural Resources, Puerto Rico Electric Power Authority, Puerto Rico Environmental Quality Board, and Puerto Rico Department of Agriculture in cooperation with the USGS. These data also are collected for the U.S. Virgin Islands in cooperation with the U.S. Virgin Islands Water and Power Authority; U.S. Virgin Islands Public Works Department; and the Caribbean Research Institute, CollegB of the Virgin Islands, St. Thomas, U.S. Virgin Islands.
The nine national water-use categories listed in the Introduction are collected in the Caribbean District. Public-supply industrial, commercial, mining, power generation, and sewage-treatment water-use data are collected by contacting the appropriate agency or facility. Domestic, livestock, and irrigation water use are estimated using population or acreage estimates and water application rates. The categories of water-use data collected in Puerto Rico and the U.S. Virgin Islands and the associated sources of information are given in table 11. Data collection techniques will be explained for each water-use category, first for Puerto Rico and then for the U.S. Virgin Islands.
46
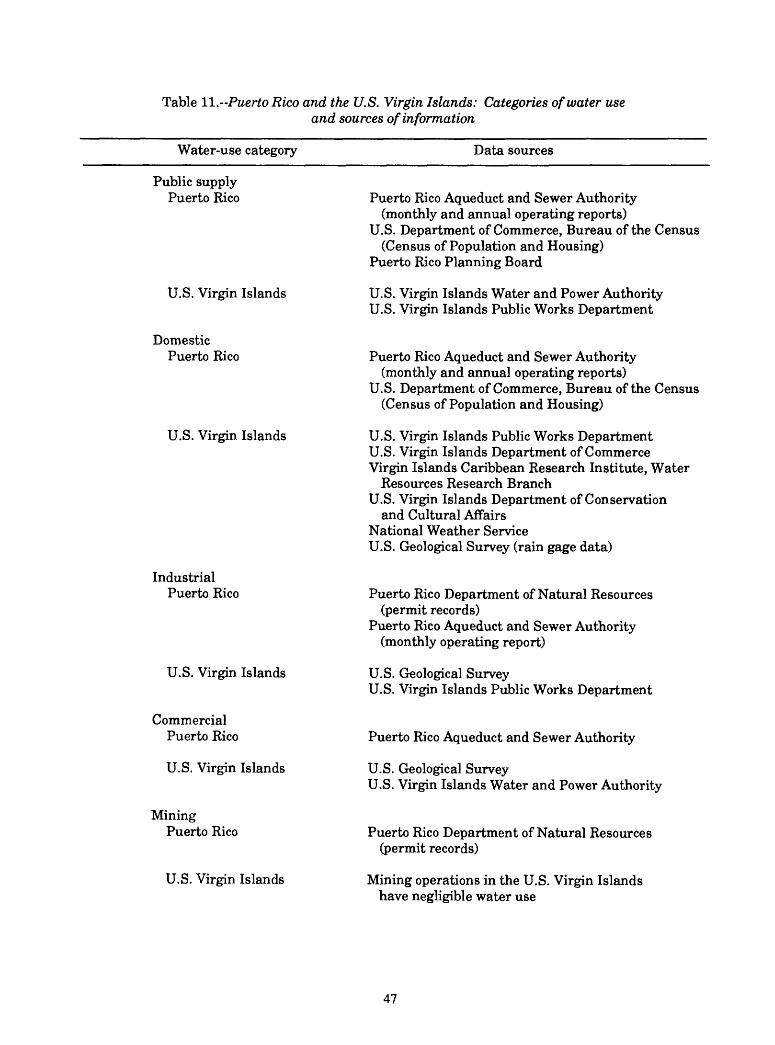
Table 11.-Puerto Rico and the U.S. Virgin Islands: Categories of water useand sources of information
Water-use category Data sources
Public supply Puerto Rico
U.S. Virgin Islands
Domestic Puerto Rico
U.S. Virgin Islands
Industrial Puerto Rico
U.S. Virgin Islands
Commercial Puerto Rico
U.S. Virgin Islands
MiningPuerto Rico
U.S. Virgin Islands
Puerto Rico Aqueduct and Sewer Authority (monthly and annual operating reports)
U.S. Department of Commerce, Bureau of the Census (Census of Population and Housing)
Puerto Rico Planning Board
U.S. Virgin Islands Water and Power Authority U.S. Virgin Islands Public Works Department
Puerto Rico Aqueduct and Sewer Authority (monthly and annual operating reports)
U.S. Department of Commerce, Bureau of the Census (Census of Population and Housing)
U.S. Virgin Islands Public Works Department U.S. Virgin Islands Department of Commerce Virgin Islands Caribbean Research Institute, Water
Resources Research Branch U.S. Virgin Islands Department of Conservation
and Cultural Affairs National Weather Service U.S. Geological Survey (rain gage data)
Puerto Rico Department of Natural Resources(permit records)
Puerto Rico Aqueduct and Sewer Authority(monthly operating report)
U.S. Geological SurveyU.S. Virgin Islands Public Works Department
Puerto Rico Aqueduct and Sewer Authority
U.S. Geological SurveyU.S. Virgin Islands Water and Power Authority
Puerto Rico Department of Natural Resources (permit records)
Mining operations in the U.S. Virgin Islands have negligible water use
47
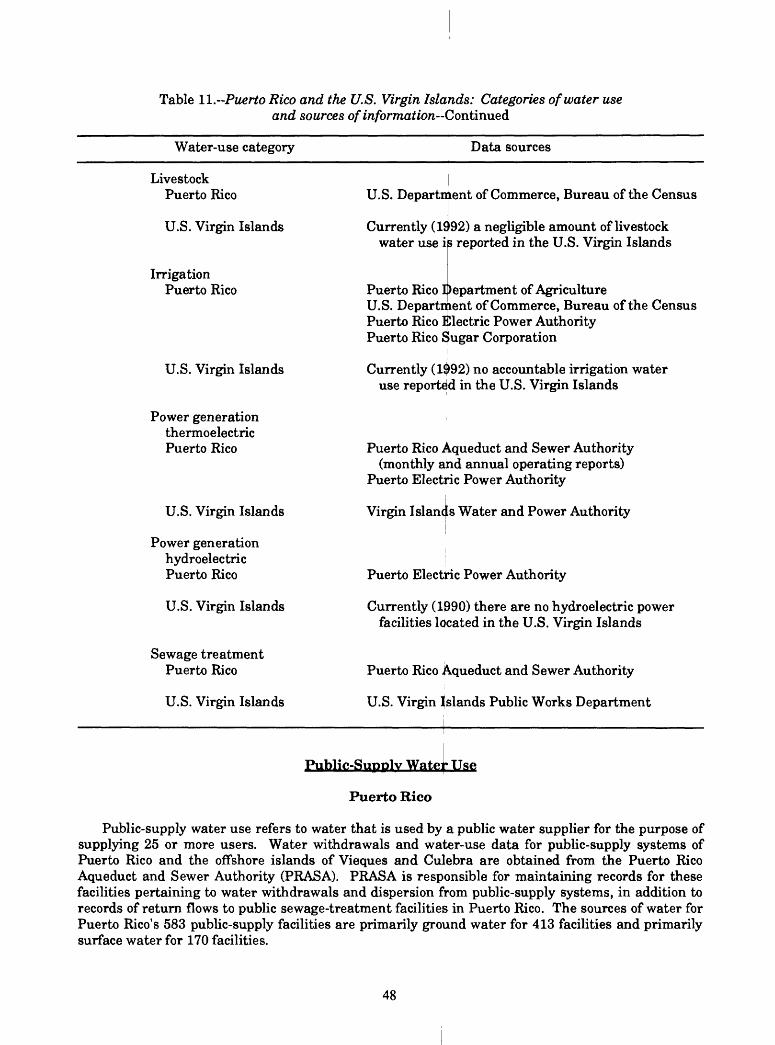
Table ll.-Puerto Rico and the U.S. Virgin Islands: Categories of water use and sources of information Continued
Water-use category Data sources
Livestock Puerto Rico
U.S. Virgin Islands
Irrigation Puerto Rico
U.S. Virgin Islands
Power generation thermoelectric Puerto Rico
U.S. Virgin Islands
Power generation hydroelectric Puerto Rico
U.S. Virgin Islands
Sewage treatment Puerto Rico
U.S. Virgin Islands
U.S. Department of Commerce, Bureau of the Census
Currently (1£'92) a negligible amount of livestock water use is reported in the U.S. Virgin Islands
Puerto Rico Department of AgricultureU.S. Department of Commerce, Bureau of the CensusPuerto Rico Electric Power AuthorityPuerto Rico Sugar Corporation
Currently (1092) no accountable irrigation water use reported in the U.S. Virgin Islands
Puerto Rico Aqueduct and Sewer Authority(monthly and annual operating reports)
Puerto Electric Power Authority
Virgin Islands Water and Power Authority
Puerto Electric Power Authority
Currently (1990) there are no hydroelectric power facilities located in the U.S. Virgin Islands
Puerto Rico Aqueduct and Sewer Authority
U.S. Virgin Jslands Public Works Department
Public-Supply Wflter Use
Puerto Rico
Public-supply water use refers to water that is used by a public water supplier for the purpose of supplying 25 or more users. Water withdrawals and water-use data for public-supply systems of Puerto Rico and the offshore islands of Vieques and Culebra are obtained from the Puerto Rico Aqueduct and Sewer Authority (PRASA). PRASA is responsible for maintaining records for these facilities pertaining to water withdrawals and dispersion from public-supply systems, in addition to records of return flows to public sewage-treatment facilities in Puerto Rico. The sources of water for Puerto Rico's 583 public-supply facilities are primarily ground water for 413 facilities and primarily surface water for 170 facilities.
48

Water use and distribution are published monthly and annually in reports by PRASA. These reports list water and sewer withdrawals (in cubic meters) by municipio, the number of connections (both metered and unmetered) for residential, commercial, industrial, government deliveries, public fountains and hydrants, and category totals. The term "municipio" is the minimum legal or jurisdictional unit in Puerto Rico as used by the U.S. Department of Commerce, Bureau of the Census. A "municipio" essentially is equivalent to a county in the United States. Puerto Rico is made up of 78 municipios. For report purposes, the municipios are grouped together into six districts: San Juan, Arecibo, Mayagiiez, Ponce, Guayama, and Humacao. The water-use values in these reports are in metric units and must be converted to English units before data can be aggregated, stored, or published. This information is from a complete survey of the larger public-supply systems.
Water-use estimates are made by hydrologic cataloging units by multiplying the domestic-use coefficient by a hydrologic cataloging unit population value. Hydrologic cataloging unit population values for public-supply systems are determined from "Census of Population and Housing" (U.S. Department of Commerce, Bureau of the Census, 1984) and by consulting with the Puerto Rico Planning Board. Population values and the number of connections per housing unit are listed in this publication for each municipio and are subdivided into smaller units called wards. The domestic use coefficient is determined from PRASA reports (Puerto Rico Aqueduct and Sewer Authority, 1987). The hydrologic cataloging unit population values are determined by regrouping the wards to fit within the hydrologic cataloging unit boundaries. The ward populations then are totaled within the hydrologic cataloging unit boundaries and multiplied by the domestic use coefficient. Consumptive uses for public-supply systems are difficult to determine for Puerto Rico because of system distribution leaks, defective metering equipment, or unmetered connections, but the average consumptive use value is approximately 30 percent.
U.S. Virgin Islands
Public-supply water use refers to water that is withdrawn by a public water supplier for the purpose of supplying 25 or more users. The U.S. Virgin Islands consist of more than 40 small islands and cays. The three largest islands are St. Croix, St. Thomas, and St. John. Water use for public- supply systems is supplied primarily from 2 seawater desalination plants and from 15 ground-water wells located within the islands. Water-use data for public-supply systems are supplied by the U.S. Virgin Islands Water and Power Authority and the U.S. Virgin Islands Public Works Department (VIPW).
The U.S. Virgin Islands public-supply facilities furnish water for domestic and commercial customers and for thermoelectric power production. Ground-water use by public-supply facilities is provided upon request from the VIPW. The seawater supply system of St. Thomas and St. Croix consists of single distribution systems involving only the urban areas. The purpose of the seawater systems are twofold-they provide a secondary water supply for sanitary use and supply fire hydrants and other fire protection needs. Water-use values pertaining to the seawater supply distribution system are provided by the VIPW. Public-supply water-use totals for each hydrologic cataloging unit within the Territory are determined by aggregation of site-specific data located within these specific areas.
Domestic Water Use
Puerto Rico
Self-supplied domestic water use reflects the population outside the urban areas of Puerto Rico not serviced by public-supply facilities. Water is withdrawn from wells or springs to provide for personal household needs. Self-supplied domestic water use in Puerto Rico is estimated by multiplying the population not served by public-supply systems by a water-use coefficient. The population values for self-supplied domestic water users are determined by subtracting the municipio population (public-
49
supplied) from the total population; the remaining population is that of self-supplied domestic water users. The U.S. Department of Commerce, Bureau of the Census (1984) publishes municipio population values and the Puerto Rico Aqueduct and Sewer Authority (1987) furnish population values for public supplied customers by municipio.
OS
The water-use coefficient for the self-s 2, page 2-4). This value was determined by averagin supplied customers. Hydrologic cataloging unit aggregation public supply. The U.S. Department of Commerce, making population assignments. Ward population valu figures for public suppliers and the remaining population ii totals then are regrouped by land area located within th These hydrologic cataloging unit population totals are n domestic use. Water used for self-supplied domestic consumed.
upplied domestic population is 40 gal/d per person (appendix g billing records for domestic deliveries of public
estimates are made the same way as for Bureau of the Census (1984) report is used for
are subtracted from population-served , self-supplied domestic users. These ward dr respective hydrologic cataloging units, ultiplied by the water-use coefficient for
purposes is considered to be 100 percent
U.S. Virgin Islands
Individuals located outside urban areas, which are n0t connected to public-supply systems, are considered to be self-supplied domestic. Water used for these purposes is supplied by rainfall and wells. Cisterns that store roof rainfall runoff are required by law and are an important source of water supply for most rural homes. The quantity of rainfall collected in a cistern is a result of the amount ofrainfall, roof area and configuration, wind velocity, ancmonthly rainfall recovery and cistern yield were made coni idering the following factors: (1) number ofnonserved housing units in each district of the islands, (2) roof area of 1,000 square ft per housing unit,(3) monthly rainfall in each district that is applied, and (4(Jordan and Cosner, 1973) (appendix 2, page 2-4). The number of nonserved housing units in eachplanning district of the Virgin Islands was provided by th The estimated roof area assumption of 1,000 square ft per
; Virgin Islands Department of Commerce, lousing unit was derived after consultation
with the Virgin Islands Department of Conservation and Cultural Affairs. Rainfall and other climatological information are provided by the National Weather Service (National Weather Service, oral commun., 1985), with some supplemental rainfall data obtained from rain gages installed by the USGS.
Ground-water withdrawal information is provided Conservation and Cultural Affairs (oral commun., 1983). water haulers are obtained from a complete survey conducted by for hydrologic cataloging unit areas are determined by di of the population located within the hydrologic cataloging
Industrial Water LJse
other weather conditions. Estimates of
a total rainfall recovery rate of 70 percent
by the Virgin Islands Department of Deliveries from wells operated by private
the VIPW. Domestic water-use totals saggregation of data based on the percentage
unit.
Puerto Rico
Industrial water use in Puerto Rico refers to water that is used in the petroleum industry, pharmaceutical and electronic industries, rum refining, and paper products. A listing of these industries is provided upon request from the Puerto Rico Department of Natural Resources. These data come from a listing of their permit records. From this listing a complete survey is conducted to determine the self-supplied users, and the amount of water used by each industry. Deliveries from public-supplied facilities are provided by the monthly operating reports from PRASA. Consumptive use for industrial purposes is estimated to be 20 percent. Industrial water-use totals for each hydrologic cataloging unit within the Commonwealth are determined by aggregation of site-specific data located within these specific areas.
50

U.S. Virgin Islands
The largest self-supplied industrial users are a petroleum refinery and several rum distilleries that are located in St. Croix. Water used by the petroleum refinery is for cooling and desalination purposes. At the refinery, brackish ground water is used for processing crude oil. Rum distilleries use ground water and rainwater collected in cisterns. Data relevant to the self-supplied industrial water-use category are collected from a complete inventory of industrial users. Deliveries of water from public- supply systems are provided by the VIPW. Consumptive use is considered to be 100 percent for industrial uses. Industrial water-use totals for each hydrologic cataloging unit within the Territory are determined by aggregation of site-specific data located within these specific areas.
Commercial Water Use
Puerto Rico
Commercial water use is defined as water used by office buildings, hotels, motels, restaurants, and warehouses. Water supply for commercial purposes is provided by public-supply systems. These data are provided by PRASA and are compiled by municipio and by district (Puerto Rico Aqueduct and Sewer Authority, 1987). The report displays the deliveries from each municipio by the number of metered and unmetered customers, amount of consumptive use, and gross revenues. These data are reported in metric units and must be converted to English units before storage and publication. Commercial water-use totals for each hydrologic cataloging unit within the Commonwealth are determined by aggregation of site-specific data located within these specific areas.
U.S. Virgin Islands
The principal self-supplied commercial users in the U.S. Virgin Islands are hotels and condominiums. The water used primarily is seawater and is used as feedwater for small desalination plants, for swimming pools, and flushing toilets. Information pertaining to self-supplied commercial users is obtained from a mail or telephone survey of the users themselves. These surveys have indicated that the various hotels and condominiums maintain good records for water production at these small desalination plants as well as visitation records. Some additional water is provided by rainfall. The rainfall is collected in water catchments and stored in cisterns. Ground water also is used, to a lesser extent, at other commercial facilities, such as airports, laundries, and gasoline stations. Deliveries from public-supply systems are provided by the U.S. Virgin Islands Water and Power Authority. Commercial water-use totals for each hydrologic cataloging unit within the Territory are determined by aggregation of site-specific data located within these specific areas.
Mining Water Use
Puerto Rico
Water used for mining in Puerto Rico primarily is for sand and gravel operations. These plants use surface water for washing the sand and gravel. These facilities are classified as self-supplied users. The Puerto Rico Department of Natural Resources supplies permitted withdrawal amounts for these operations. Consumptive use for mining is negligible, because essentially all the water withdrawn is returned to its source. Mining water-use totals for each hydrologic cataloging unit within the Commonwealth are determined by aggregation of site-specific data located within these specific areas.
U.S. Virgin Islands
Water use for mining operations in the U.S. Virgin Islands is considered negligible; therefore, no estimates are made in this category.
51

Livestock Water Use
Puerto Rico
Livestock water use refers to water that is used for livestock purposes, such as feedlot, stock watering, and dairy operations. Water withdrawals for livestock (agriculture) use are based on a fixed amount of water used per head for each type of animal. The following daily livestock water requirements (Kirk and others, 1982) provide the basis for these calculations.
LivestockWater required (gallons per day)
Dairy cattleNon-dairy cattle, horses, muHogsSheep, goatsRabbitsChickens
35es 12
421.06
The livestock population by municipio is provided by the "Census of Agriculture" (U.S. Department of Commerce, Bureau of the Census, 1984). Livestock water-use totals for hydrologic cataloging unit areas are determined by disaggregation of municipio data ibased on the percentage of the livestock population located within the hydrologic cataloging unit. Consumptive use for livestock is 100 percent.
U.S. Virgin Islands
Water use for livestock is considered negligible; therefore, no estimates are made in this category.
Irrigation Water Utse
Puerto Rico
Irrigation water use refers to water distributed on lands pasture or maintaining recreational lands, such as parks vegetables are the primary crops irrigated in Puerto Rico, operates the wells on most of these government-owned i on these farms is by drip, flood, or gravity feed. Water-use made by multiplying the number of acres of land irrigated irrigation canals or withdrawn from ground-water wells, water used by crop type for irrigation.
Ttie irrigation
The
for the purpose of growing crops and and golf courses. Sugar cane, rice, and
Puerto Rico Department of Agriculture districts. The method of irrigation
estimates for the irrigation category are by the amount of water diverted from total of this calculation is the amount of
In order to obtain the data components necessary to make a water-use estimate for irrigation, it is necessary to obtain the following data: (1) the number of acnss irrigated for all crop types by municipio, (2) the amount of water diverted for irrigation by canal, and (3) the amount of ground water withdrawn for each well. Acquiring this information requires contacting several sources. Irrigated acreage values by crop type are published by the U.S. Department of Commerce, Bureau of the Census (1984). Surface-water withdrawals used by government irrigation districts are supplied by the Irrigation Services Division of the Puerto Rico Electric Power Authority. Ground-water withdrawals for irrigation on the south coast are collected by the Puerto Rico Sugar Corporation. Consumptive use for irrigation in Puerto Rico is estimated to be 65 percent, with a 10 percent value assigned for conveyance losses (Solley and others, 1983). Irrigation water-use totals for hydrologic cataloging unit areas were
52

determined by disaggregation of municipio data using the percent of the municipio land area located within the hydrologic cataloging unit. The resulting hydrologic cataloging unit subtotals for each municipio are then regrouped for the Commonwealth and totaled.
U.S. Virgin Islands
The U.S. Virgin Islands currently (1990) have no accountable irrigation water use.
Power Generation Water Use (Thermoelectric)
Puerto Rico
Power generation water use refers to water that is used to generate electric power, such as hydroelectric and thermoelectric. There are four thermoelectric fossil-fuel power facilities in Puerto Rico. The withdrawal of seawater for thermoelectric cooling in the production of electricity accounts for 100 percent of all seawater withdrawals in Puerto Rico. Freshwater usage consists of ground-water withdrawals and deliveries from public-supply systems.
Water-use information pertaining to thermoelectric power generation is supplied by the Puerto Rico Electric Power Authority (PREPA). There are three PREPA offices in Puerto Rico where information about power generation is obtained: (1) hydroelectric power production data comes from the office in Toa Baja, (2) thermoelectric power production data are maintained in the Santurce office, and (3) information pertaining to discharge information and other power related data reside in the PREPA headquarters office in San Juan. Deliveries from public-supply systems for thermoelectric generation are provided by PRASA. Consumptive use for thermoelectric power generation is estimated to be less than 1 percent. Power generation water-use totals for each hydrologic cataloging unit within the Commonwealth are determined by aggregation of site-specific data located within these specific areas.
U.S. Virgin Islands
Power generation water use refers to water that is used to generate electric power, such as hydroelectric and thermoelectric. Thermoelectric power generation is the largest water user in the U.S. Virgin Islands. The two fossil-fuel plants are located on St. Croix and St. Thomas. These plants are operated by the Virgin Islands Water and Power Authority (VIWAPA). Seawater is used as the primary source of water for thermoelectric power generation. The seawater is used for condenser cooling at these facilities. In addition to the seawater, approximately 1 percent of water used is freshwater obtained directly from the desalination plants and mainly used for boiler feed. Consumptive use is estimated to be 20 percent of the freshwater used for thermoelectric power generation. All water-use data relevant to thermoelectric power in the U.S. Virgin Islands are provided by the VIWAPA. Power generation water-use totals for each hydrologic cataloging unit within the Territory are determined by aggregation of site-specific data located within these specific areas.
Power Generation Water Use (Hydroelectric)
Puerto Rico
Water used for hydroelectric power generation is the only instream use of water in Puerto Rico. Hydroelectric power is produced at seven hydroelectric facilities. Surface-water withdrawal information and power generation values are provided by PREPA. Power generation water-use totals for each hydrologic cataloging unit within the Commonwealth are determined by aggregation of site- specific data located within these specific areas.
53

U.S. Virgin Islands
There are no hydroelectric power facilities located in the U.S. Virgin Islands; therefore, no water- use estimates are made.
Sewage-Treatment Water Use
Puerto Rico
Sewage-treatment water use (releases) refers to the coll by wastewater-treatment systems to improve water maintains records pertaining to sewage-treatment or public Rico. These data are reported by municipio, and contain commercial, and industrial connections. PRASA records annual discharges for all 78 municipios. This information is Rico Aqueduct and Sewer Authority, 1987). Sewage- cataloging unit within the Commonwealth are determined within these specific areas.
ection of sewage from 25 or more sources quality before it is returned. The PRASA
wastewater-treatment releases in Puerto information about the number of domestic,
nclude data pertaining to monthly and published monthly and annually (Puerto
treatment release totals for each hydrologic aggregation of site-specific data locatedby
U.S. Virgin Islands
Sewage-treatment water use (releases) refers to the coll|ection of sewage from 25 or more sources by wastewater-treatment systems tc improve water quality before it is returned. The VIPW provides information about public wastewater-treatment facilities fot the U.S. Virgin Islands. These data are for the seven facilities on St. Thomas and the one on St. Croix. Information relevant to the number and type of connections as well as their treated releases for each facility also are provided by VIPW. Sewage-treatment release totals for each hydrologic cataloging unit within the Territory are determined by aggregation of site-specific data located within these specific areas.
DATA COLLECTION TECHNIQUES IN SOUTH CAROLINA
Water-use data in South Carolina are collected by the South Carolina Water Resources Commission (SCWRC) in cooperation with the USGS. Mos|t of South Carolina's water-use data are collected from water-use reporting forms. In South Carolina, anyone with a single-day maximum water usage equal to or exceeding 100,000 gal/d is mandatec by law to report their withdrawals to the SCWRC (South Carolina Water Use Reporting and Coordination Act of 1982). Reports are submitted to the Commission on a quarterly basis by complying users, e xcept for livestock users, who report their withdrawals annually because of the seasonal nature of their water usage. In addition, all water users who are required to report, must complete a one-time-only Water Use System Report (appendix 3, pages 3-69 and 3-70) in which they describe their water Dumping system and the location of the withdrawal site. The SCWRC uses these forms to collect wa ;er-use information. SCWRC also provide handout form WV-A that describes methods for estimating water use (appendix 3, pages 3-60 to 3-78).
Public-supply, industrial, commercial, mining, power generation, and sewage-treatment water-use data are collected by contacting the appropriate agency or facility. Both domestic and livestock water use are estimated using population estimates and water application rates. The categories of water-use data collected in South Carolina and the associated sources of information are given in table 12.
Public-Supply Water,Use
Water-use amounts for public supply are based on monthly reports (appendix 3, pages 3-80) submitted to the South Carolina Department of Health and Environmental Control (DHEC) as required by the State Safe Drinking Water Act of 1976. Systems unaccounted for in the DHEC files include a few small public suppliers not applying treatment. There are approximately 1,800 public-
54

Table I2.~South Carolina: Categories of water use and sources of information
Water-use category Data sources
Public supply
Domestic
Industrial
Commercial
Mining
Livestock
Irrigation
Power generation thermoelectric and hydroelectric
Sewage treatment
South Carolina Department of Health andEnvironmental Control
South Carolina Water Resources Commission
South Carolina Department of Health andEnvironmental Control
U.S. Department of Commerce, Bureau of the Census
South Carolina Water Resources Commission (Water Use System Description Report)
South Carolina Water Resources Commission (Water Use System Description Report)
South Carolina Water Resources Commission (Water Use System Description Report)
South Carolina Crop and Livestock Reporting Service
South Carolina Water Resources Commission (Agricultural and Golf Course Water Use Report forms)
Clemson University Cooperative Extension Service
U.S. Geological Survey (interviews)South Carolina Power and Gas CompanyDuke Power CompanyCarolina Power and Light CompanySouth Carolina Public Service AuthorityRegal Textile CompanySpartanburg Water Company
South Carolina Department of Health and Environmental Control
supply facilities in the files maintained by DHEC. Data in DHEC files include daily water withdrawals for each withdrawal site for each facility, total hours of pumping per day (by well), static water level, pumping level, flow information for each well, and population served by each facility. Additional information collected includes chemical treatment data for each facility, pounds of chemicals used, chemical dosage, and the chemical analyses for each plant.
55

In addition to the DHEC files, the SCWRC has water-use information for approximately 330 public-supply facilities in their data base. These data are reported to SCWRC on the Water Use System Report form (appendix 3, pages 3-69 and 3-70). These data include monthly water withdrawals by facility, address of the facility, contact person, SIC code (primary and secondary), whether water used by the facility is purchased or withdrawn, and location of withdrawal and treatment facilities. There also is information concerning deliveries from public suppliers to domestic, commercial, industrial, agricultural, and institutional users; resale to other public suppliers; lost or unaccounted water; and untreated water sales. This information is transferred to the USGS annually by magnetic computer tape. Public-supply water-use totals for each hydrologic cataloging unit within the State are determined by aggregation of site-specific data located within these specific areas.
Domestic Water Use
Domestic water use describes water that is used by individual families and small communities not served by a public-supply system. Domestic use is calculated by multiplying the county population not served by municipalities or water districts by a rate of 75 ga.l/d per person (appendix 2, page 2-4). The self-supplied domestic population is determined by subtracting the population served by public supplied systems (by county) from the county census totals. The DHEC provides data on the population served by public-supplied systems, and the U.S Department of Commerce, Bureau of the Census provides total county population values. Water usejd for domestic purposes is considered to be 100 percent consumed.
Estimating domestic water use for the hydrologic cataloging units is accomplished by estimating the percentage of the land area for each of the hydrologic cataloging units that is encompassed within each county. This percentage is then multiplied by the water-use value for the county. This process is duplicated for every county in the State. These totals then are regrouped by hydrologic cataloging units and summed to represent hydrologic cataloging unit totals for the State.
Industrial Water IjJse
Industrial water use is defined as the use of water for the purpose of manufacturing a product, including water employed in once-through cooling. The^ SCWRC collects water-use information quarterly for self-supplied industrial facilities. These data are reported to SCWRC by each facilityusing the Industrial Water Use System Description Reportinventoried are primarily chemical, paper, and textile industries. Industrial consumptive use is estimated to be 15 percent of the amount of water withdr awn. Industrial water-use totals for each hydrologic cataloging unit within the State are determined by aggregation of site-specific data located within these specific areas.
Commercial Water
appendix 3, pages 3-69 to 3-74). The users
Use
The SCWRC collects water-use information quarterly for self-supplied commercial facilities. These data are reported to SCWRC by the facility using the Industrial Water Use System Description Report. The information provided by commercial establishments is the same as that provided by industrial water users (appendix 3, pages 3-69 to 3-74). Commercial consumptive use is estimated to be negligible, according to reported SCWRC information. Commercial water-use totals for each hydrologic cataloging unit within the State are determined by aggregation of site-specific data located within these specific areas.
Mining Water U^e
Mining water use or mineral extraction is water removed from a quarry or mine for the purpose of working below the natural water table and water used to wash, sort, and separate mineral products. Mining water use is reported to the SCWRC (appendix 3, pages 3-69 to 3-74). The primary mining
56

industries monitored in South Carolina are sand and gravel, stone (crushed), limestone, and clay. These data are reported on the Industrial Water Use System Description Report, and is the same type of information described in the section for Industrial Water Use. Consumptive water use for mining is estimated to be zero according to a 1980 mail survey by SCWRC. Mining water-use totals for each hydrologic cataloging unit within the State are determined by aggregation of site-specific data located within these specific areas.
Livestock Water Use
Livestock water use refers to water that is used for livestock purposes such as feedlot, stock watering, and dairy operations. Livestock water use is based on the estimated number of farm animals (South Carolina Agricultural Statistics Service, 1986) and estimates of water needs for each type of livestock and poultry (MacKichan and Kammerer, 1961). Livestock populations for each county are multiplied by the appropriate water-use coefficient for each type of livestock. Water requirements for livestock are as follows:
Water required Livestock (gallons per day)
Livestock: (per animal)CattleDairy cattleGoatsHogsHorsesMulesSheepSteers
Poultry:Chickens (per 100)Turkeys (per 100)
1235
24
12122
12
5-1010-18
Livestock water-use totals for hydrologic cataloging unit areas were determined by disaggregation of county data using the percent of the county land areas located within the hydrologic cataloging unit. The resulting hydrologic cataloging unit subtotals for each county are then regrouped for the State and totaled.
Irrigation Water Use
Irrigation water use is defined as an application of water to any agricultural crop (including golf courses) for the purpose of maturing that crop. Water use for irrigation is reported to the SCWRC on the Agricultural Water Use Report Form (appendix 3, page 3-75). These forms are completed by farmers on an annual basis and contain information relevant to the previous years' water use for irrigation. Forms are sent to the Clemson University Cooperative Extension Service in each county where they are reviewed for completeness. Those forms not properly completed are set aside and the farmers are contacted to fill in the missing data. Completed forms then are forwarded to the Cooperative Extension Service office at Clemson University where they are rechecked and forwarded to the SCWRC for computer entry. The consumptive use value for irrigation is estimated to be 100 percent of the amount of water withdrawn.
In addition to irrigation data, golf course water-use information is reported to SCWRC. These data are collected on a form that is identical to the Water Use System Report used by public-supply facilities. Irrigation water-use totals for each hydrologic cataloging unit within the State are determined by aggregation of site-specific data located within these specific areas.
57

Power Generation Water Use
Water-use figures for thermoelectric and hydroelectric plants were obtained by interviewing the owners of the facilities. There are 14 thermoelectric and 40 hydroelectric plants inventoried in South Carolina. The following companies (both private and public) are contacted for power generation information about their facilities: South Carolina Power s.nd Gas, Carolina Power and Light, Duke Power, South Carolina Public Service Authority, Regal Textile Company, and Spartanburg Water Company. The data collected include the installed generating capacity of the facility, total power generated, monthly power generated, location of facility, and the amount of water withdrawn (monthly and annually) by the facility for power generation. Power generation water-use data also are provided to SCWRC on data collection forms (appendix 3, pages 3-76 to 3-79). Power generation water-use totals for each hydrologic cataloging unit within the State are determined by aggregation of site-specific data located within these specific areas.
Sewage-Treatment Water Use
Sewage-treatment water use refers to sewage-treatment facilities engaged primarily in the collection and disposal of wastewater conveyed through a sewer system. A list of sewage-treatment facilities is furnished from the NPDES files maintained by t he DHEC. These data contain the latitude and longitude of the release point of the treated wastewatur. These data also include the amount of water treated and released. Sewage-treatment release totals for each hydrologic cataloging unit within the State are determined by aggregation of site-specific data located within these specific areas.
DATA COLLECTION TECHNIQUES IN TENNESSEE
Water-use data in Tennessee are collected by the Tennessee Department of Health and Environment (TDHE) in cooperation with the USGS. The nine national water-use categories listed in the Introduction are collected in Tennessee. Public-supply, industrial, commercial, irrigation, mining, power generation, and sewage-treatment water-use data are collected by contacting the appropriate agency or facility. Domestic and livestock water use are determined using population estimates and per capita coefficients. The categories of water-use data collected in Tennessee and the associated sources of information are given in table 13.
Public-Supply Water Use
The definition of a public-supply system in Tennessee i minimum of 25 people or 15 connections for 6 months or more to the amount of water used for public supply is maintaine d Water Supply.
a water supplier that provides water for a during a year. Information pertaining
in manual files by the TDHE Division of
The data collection process is performed within the fives basin offices of the TDHE. The engineers within each of the five basin offices are assigned the responsibility of collecting public-supply facility information for users within their basin areas. These data are provided by personal contacts. Data collection forms are provided in appendix 3, pages 3-81 to 3-84. These data are updated routinely for approximately 700 public suppliers in Tennessee.
Deliveries of public-supplied water use in 1985 are projected from the results of a complete public- supply survey in 1980, and a partial survey conducted in 1985. The information collected during these surveys was the basis for projecting the commercial and industrial deliveries from the current reported withdrawals. Data indicating the number of persons per household by county collected by the U.S. Census Bureau in 1970 were used to derive a number of persons per connection coefficient. The coefficient is multiplied by the number of connections for a public supplier to determine the population served. The number of connections per public-supply system is updated every 3 years. Consumptive
58

use and conveyance losses for public-supplied water users are estimated to be 10 percent. Public- supply water-use totals for each hydrologic cataloging unit within the State are determined by aggregation of site-specific data located within these specific areas.
Table 13. --Tennessee: Categories of water use and sources of information
Water-use category Data sources
Public supply
Domestic
Industrial
Commercial
Mining
Livestock
Irrigation
Power generation
Sewage treatment
Tennessee Department of Health and Environment, Division of Water Supply
Tennessee Department of Health and Environment,Division of Water Supply
Shelby County Health Department University of Tennessee, Department of Sociology
Tennessee Department of Health and Environment, Division of Water Quality Control (Discharge Monitoring Report)
Shelby County Health Department U.S. Geological Survey, Tennessee District
Tennessee Department of Health and Environment,Division of Water Supply
Shelby County Health Department
Tennessee Department of Health and Environment Tennessee Department of Conservation, Division of
Geology Tennessee Department of Labor, Division of Mine
Permits U.S. Department of the Interior, Office of Surface
Mining Tennessee Department of Health and Environment,
Division of Surface Mining and Reclamation EPA-National Pollution Discharge Elimination
System (permits)
U.S. Geological Survey, Mississippi District Tennessee Wildlife Resources Agency Tennessee Agriculture Statistical Service Tennessee Agricultural Extension Service
U.S. Department of Agriculture, Soil Conservation Service
Tennessee Valley Authority
Tennessee Department of Health and Environment, Division of Water Quality Control (Discharge Monitoring Report)
EPA-National Pollution Discharge Elimination System (computer files)
59

Domestic Water Use
Water use for domestic purposes is estimated, but some site-specific data are available. Estimates for domestic water use are computed using a domestic use coefficient and an estimate of the population using domestic wells (based on the number of persons not served by public supply facilities within a county). The domestic use coefficient (60-70 gal/d per person) is determined by a TDHE survey of public suppliers conducted in 1980 requesting information on the amount of water delivered for domestic purposes and the number of people served. The amount of water delivered to domestic users was divided into the population served resulting in a coefficient for domestic usage for each public supplier. These coefficients (appendix 2, page 2-4; represen ;ing the public suppliers located within a county) are averaged for the particular county, reviewed, a range table was developed, and then plotted on a choropleth map. Upon completion of the plot, it was possible to geographically organize the coefficients within regions and the coefficients identified wit \ the region that is used for all the public suppliers (domestic users) located within the area. Census values for the counties of Tennessee are provided by the University of Tennessee (1985). Consumptive use for domestic purposes is estimated to be 100 percent. Domestic water-use totals for hydrologic cataloging unit areas are determined by disaggregation of county data using the percentage of the county land area located within the hydrologic cataloging unit. These percentages are then multiplied by the county water-use totals. The resulting hydrologic cataloging unit subtotals for each county are then regrouped for the State and totaled.
Industrial Water Uffe
The primary (self-supplied) industrial water users in Tennessee are the chemical, pulp and paper, munitions, textiles, and food processors. A telephone survey of industries was conducted by TDHE, Division of Water Supply. Data collected by the survey included location (city and county), mailing address, and source of supply. An example of the surveV form and instructions are provided in appendix 3, pages 3-84 to 3-86.
A master list of self-supplied industries is updated by deferring to the most current copy of the Directory of Manufacturers of Tennessee, cross-referencing of city telephone directories, and then conducting a telephone survey to determine active or inactive industrial users or adding new users to the list. This list is updated every 5 years.
responseThe TDHE also collects monthly pumpage for industries
collected by a mail survey, and in cases where there is no use is calculated using 9 percent of the total withdrawals Industrial water-use totals for each hydrologic cataloging aggregation of site-specific data located within these specific
in Shelby County. These data are with a telephone call. Consumptive
and deliveries (Solley and others, 1983). unit within the State are determined by areas.
Commercial Water Use
Commercial water use is subdivided into two categories: large commercial and noncommunity public supply. Large commercial water users include military facilities, penal facilities, and universities, as well as retail stores, restaurants, and Is.undry services. Noncommunity public suppliers (small commercial users) are water systems that serve less than 25 people or fewer than 15 connections for 6 months or less. These users include churches, truck stops, campgrounds, and some trailer parks.
The TDHE Division of Water Supply provides the USGS with commercial facility data for the State. Data collection forms are provided in appendix 3, pages 3-84 to 3-86. Water use is estimated by multiplying the transient or nontransient population figures by a standard per capita consumption coefficient (MacKichan and Kammerer, 1961). Consumptive use for commercial purposes is estimated
60

to be 9 percent (Solley and others, 1983). Commercial water-use totals for each hydrologic cataloging unit within the State are determined by aggregation of site-specific data located within these specific areas.
Mining Water Use
Water is used in the mining industry for dust control, process washing, and dewatering. Both surface and underground mining are active in Tennessee. The various mined products include: coal, phosphate, barite, copper, zinc, limestone, gravel, sand, and clay.
Mining water use is estimated by using tonnage data (for all mined products in Tennessee) and multiplying it by a water-use coefficient of 200 gallon per ton. The mining water-use coefficient (200 gallon per ton) was determined during a 1986 survey by the TDHE. Data sources pertaining to coal mining are as follows: coal mine listings are provided by the Tennessee Department of Conservation, Division of Geology; and annual tonnage production is from the Tennessee Department of Labor, Division of Mines Permits and U.S. Department of the Interior, Office of Surface Mining (since 1978). Data relevant to mining other than coal are provided by TDHE, Division of Surface Mining and Reclamation, and NPDES permits. This information is part of the mining permits file and contains data relevant to number of mining sites and their acreage, location (latitude and longitude), and mailing address.
Consumptive use is considered to be 11 percent of the total withdrawals and deliveries (Solley and others, 1983). Mining water-use totals for each hydrologic cataloging unit within the State are determined by aggregation of site-specific data located within these specific areas.
Livestock Water Use
Livestock water use includes water withdrawn for aquaculture and livestock watering. Aquacultural water use is determined by two techniques. The first technique requires multiplying the number of pounds offish produced per acre of pond surface area by a water-use coefficient (8 gallon per pound offish produced). Aquacultural production values and pond acreage are provided upon request from the Tennessee Wildlife Resources Agency. In areas where production data are not available the other technique is used. The other technique requires multiplying a water-use coefficient of 1.5 ft per acre by the pond surface acreage to estimate annual water use for fish farms and catch-out basins. Both coefficients were determined during field studies in Mississippi and were transferred to Tennessee (J.C. Callahan, U.S. Geological Survey, oral commun., 1985).
Water used for livestock is determined by multiplying the stock population by the water-use coefficient appropriate for each species of livestock. The per capita water-use coefficients were developed by the Tennessee Agricultural Extension Service. The coefficients were determined by measuring the amount of water used per ton of feed consumed per livestock type produced. The coefficients (water requirements) for livestock are as follows:
Water required Livestock (gallons per day)
Beef cattle 10Pigs and hogs 5Horses 10Dairy cattle 35Poultry .05
Livestock population values are reported by the Tennessee Agricultural Statistics Service, except for horse populations, which are maintained by several horse associations located throughout the State.
61

Livestock water-use totals for hydrologic cataloging unit areas were determined by disaggregation of county data using the percentage of the county land area located within the hydrologic cataloging unit. The resulting hydrologic cataloging unit subtotals for each county are then regrouped for the State and totaled.
Irrigation Water t se
Three methods are used to estimate water withdrawalsthe number of water applications during a cropping season is multiplied by the average number of hours a pump is used per application, and by the pump capacity in gallons per minute; (2) the number of water applications during a cropping season is multiplied by the recommended rate of application for a given crop type and soil classification (U.S. Department of Agriculture, 1962); and (3) the cropconsumptive irrigation requirement (U.S. Department of number of irrigated acres. Data collection forms are listedmethod selected depends on the type of data collected for t le site. The most accurate estimates arederived using the first method. The second and third methmethods assume that consistent and highly efficient management criteria are always used forscheduling irrigation. Further, both of these methods re
for irrigation purposes in Tennessee: (1)
Agriculture, 1976) is multiplied by the in appendix 3, page 3-87 and 3-88. The
ds are less accurate. Both of these latter
y on coefficients describing regional soilmoisture or precipitation distributions, rather than site-specific conditions.
Method I
About two-thirds of those surveyed provided estimated number of hours per application, and the calculated as follows:
information on the number of applications, the pump capacity. Water withdrawals were
AxHxCxCf=Q
A = number of applications during cropping season;H = average time per application, in hours;C = pump capacity, in gallons per minute;Cf = conversion factor, to million gallons per day; andQ = water withdrawal, in million gallons per day.
Method H
The second method is used with the following data: crop location. This method relies on recommended application and region (either western Tennessee or central and easterr each site; therefore, the application coefficient for each estimates for Method II are calculated using the following equat
type, acreage, number of applications, and amounts for nine crops, by soil classification
Tennessee). Soil data are not collected at crop is averaged by region. Water-use
ion:
A x R x Ac x Cf = Ae
A = number of applications during cropping season;R = rate of application, acre-feet per acre;Ac = acreage;Cf = conversion factor, to million gallons per day; andAe = estimation application amount.
62

Method in
The third method uses crop consumptive irrigation requirements (CIR), which are calculated monthly for 12 crops for the major basins in Tennessee. Water-use data are expressed in acre-feet per acre. CIR is the consumptive use or evapotranspiration of an individual crop, less the effective precipitation, over a particular period of time (usually monthly or annually). It does not include water requirements for leaching, germination, frost protection, or cooling. Nearly all CIRs were computed using the Modified Blaney-Criddle Method. CIRs were developed by the Soil Conservation Service for dry and normal rainfall years. A normal year is one in which a 50 percent level is assumed on the irrigated area, meaning that the total precipitation amount for that year is equaled or exceeded 5 out of 10 years. A dry year is a year in which an 80 percent precipitation level is assumed on the irrigated area, meaning that the total precipitation amount for that year is equaled or exceeded 8 out of 10 years.
April through August comprise the cropping season in Tennessee (Paul Lucas, State Conservationist, Soil Conservation Service, oral commun., 1985). Irrigation demand was calculated as follows:
AxAcxCIRxCf=I,
A = number of applications during cropping season;Ac = acreage;CIR = crop consumptive irrigation requirement (normal season);Cf = conversion factor, to million gallons per day; andI = seasonal irrigation demand for a particular crop, in million gallons per day.
Irrigation water-use totals for hydrologic cataloging unit areas are determined by disaggregation of county data using the percentage of the county land area located within the hydrologic cataloging unit. The resulting hydrologic cataloging unit subtotals for each county are then regrouped for the State and totaled.
Power Generation Water Use
Power generation is divided into two categories; hydroelectric and thermoelectric. Water used for hydroelectric power generation refers to the volume of water released through the turbines for each facility. Water use at thermoelectric plants includes water for condenser cooling and emergency raw cooling water. The TVA provides water use and power production information to the USGS. Power production facilities in Tennessee consist of 8 fossil-fuel plants, 2 nuclear plants, 28 hydroelectric plants and 1 pump-storage facility.
TVA provides site-specific records for all their plants within the State. These data include site location information, monthly and annual discharge, and power production values. The responsibility of maintaining these data are divided among two TVA offices in the State. The TVA office in Knoxville provides data pertaining to water pumpage or release values, whereas the office in Chattanooga provides the power production values. Power generation water-use totals for each hydrologic cataloging unit within the State are determined by aggregation of site-specific data located within these specific areas.
Sewage-Treatment Water Use
The sewage-treatment category consists of an inventory of public, industrial, and commercial wastewater-treatment facilities and the water released by community facilities. The primary source of facilities information is a computer-generated list provided by the Tennessee Division of Water Control. This list is compared to a list of wastewater dischargers that is furnished from the NPDES computer files maintained by EPA. These data are maintained in manual files and contain the location
63

of the release point of the treated waste water, and the amount of water treated and released. Sewage- treatment release totals for each hydrologic cataloging unit within the State are determined by aggregation of site-specific data located within these specific areas.
SUMMARY
This report describes the techniques and methods collect water-use data in Puerto Rico, the U.S. Virgin States: Alabama, Arkansas, Florida, Georgia, Kentucky, South Carolina, and Tennessee. Water-use data are National water-use information program.
as of 1990 used by the USGS and cooperators to Islands, and the following southeastern United
Louisiana, Mississippi, North Carolina, collected in nine major categories as part of the
In the southeastern United States, both site-specific anjd aggregated water-use data are collected and aggregated annually. Because only a small percentage (j>f the total water-use information collected or reported is site-specific, it is necessary to obtain an understanding of the techniques used for estimating water use. The purpose of this report is to describe for the Southeastern States, Puerto Rico, and the U.S. Virgin Islands, the data collection techniques used for estimating water use and consumption for all categories. These techniques are an updated version of the documentation used for the 1985 national water-use data collection; therefore, the time period encompassed during the updating of these techniques was from 1985 to 1990.
This report describes the techniques used to collect water-use data in each State, Puerto Rico, and the U.S. Virgin Islands for the following nine categories: pufblic-supply water use, domestic water use,industrial water use, commercial water use, mining water use, power generation water use (including hydroelecgeneration), and sewage-treatment water use (releases). Ac ditionally, in Florida miscellaneous water- use data (flow data for free-flowing wells and water use for £ ir-conditioning systems) are collected, andin Alabama recreation, preservation, and navigation water
use, livestock water use, irrigation water ric, thermoelectric, and nuclear power
use data are collected.
Information described in each water-use category includes: (1) a definition of the water-use category as defined by the cooperator, (2) the name of the agency or other organization that provides water-use data, (3) a description of how data are collected or estimated, (4) a list of the data elements for making the water-use estimate, and (5) description of the steps required for computations or conversion when applicable. A description of the process for converting water-use totals from county aggregates or site-specific values to hydrologic cataloging unit aggregates also are discussed.
64

SELECTED REFERENCES
Alabama
Alabama Crop and Livestock Reporting Service, 1985, Alabama agricultural statistics: Alabama Department of Agriculture and Statistics, 9 p.
Alabama Development Office, 1985, 1985-86 Alabama directory of mining and manufacturing: Alabama Development Office, 726 p.
Alabama Department of Economic and Community Affairs, 1986, Alabama county data book 1985: Alabama Office of State Planning and Federal Programs, 84 p.
Alabama Department of Environmental Management, 1986, Model state information system, public water system inventory subsystem: Alabama Department of Environmental Management, 1,319 p.
___ 1986, Industrial/UIC county report: Alabama Department of Environmental Management, 46 p.
Baker, R.M., and Mooty, W.S., 1987, Use of water in Alabama, 1985: Geological Survey of Alabama, Water Resources Division, Information Series 59 D, 51 p.
Baker, R.M., 1983, Use of water in Alabama, 1982: Geological Survey of Alabama, Water Resources Division, Information Series 59 C, 49 p.
Baker, R.M., Blakeney, G., and Peggye, M.M., 1982, Use of water in Alabama, 1980: Geological Survey of Alabama, Water Resources Division, Information Series 59, 49 p.
Curtis, L.M., and Tyson, T.W., 1986, 1985 Alabama irrigation survey, agriculture and natural resources timely information: Alabama Cooperative Extension Service, Auburn University, 12 P-
U.S. Army Corps of Engineers, 1979, Water resources development: U.S. Army Corps of Engineers, Mobile District (Alabama), 116 p.
U.S. Department of Commerce, Bureau of the Census, 1986, 1985 Estimated Alabama population: special tabulation, U.S. Department of Commerce, Bureau of the Census.
Wentz, S.J., and Baker, R.M.,1986, Drought related impacts on water uses in North Alabama: Alabama Geological Survey Circular 127 B, 483 p.
Arkansas
Arkansas Department of Health, 1989, Arkansas community public water system list, September 20, 1989: Arkansas Department of Health, Division of Engineering, 60 p.
Harrington, A.D., 1990, Directory of Arkansas manufacturers, 1990 edition: Arkansas Industrial Development Foundation, 328 p.
Holland, T.W., 1987, Use of water in Arkansas, 1985: Arkansas Geological Commission Water- Resources Summary 16, 27 p.
Holland, T.W., and Hall, A.P., 1986, Water use in Arkansas, 1982: U.S. Geological Survey Water- Resources Investigations Report 85-4282, 1 sheet.
65
SELECTED REFERENCE S-Con tinned
Holland, T.W., and Ludwig, A.H., 1981, Use of water in Arkansas, 1980: Arkansas Geological Commission Water Resources Summary 14, 30 p.
U.S. Department of Agriculture, Statistical Reporting Service, 1989, Arkansas agricultural statistics: U.S. Department of Agriculture Report Series 316, 56 p.
White, D.H., Jr., and Bush, W.V., 1988, Arkansas minerals yearbook 1988: U.S. Department of the Interior Bureau of Mines Mineral Yearbook, 10 p.
Florida
Duerr, A.D., and Trommer, J.T., The benchmark-farm program-A method for estimating irrigation water use in southwest Florida, 1982: U.S. Geological Survey Water-Resources Investigations Report 82-17, 49 p.
Healy, H.G., 1978, Appraisal of uncontrolled flowing artes: an well in Florida, 1975: U.S. Geological Survey Water-Resources Investigations Report 78-96, 26 p.
Leach, S.D., 1983, Source, use, and disposition of water in Florida, 1980: U.S. Geological Survey Water-Resources Investigations Report 82-4090, 337 p.
Marella, R.L., 1988, Water withdrawals, use and trends in Florida, 1985: U.S. Geological Survey Water-Resources Investigations Report 88-4103, 43 p.
Shoemyen, A.H., Floyd, S.S., and Banta, A.T., 1987, Florida [statistical abstract (20th ed.): Gainesville, University of Florida, Bureau of Economic and Business Research, 730 p.
Smaj stria, A.G., 1986, Agricultural field scale irrigation requirements simulation model: Technical Manual: Gainesville, University of Florida Agricultural Engineering Department, 52 p.
St. Johns River Water Management District, 1984, Applicait's handbook, Consumptive uses of water, 39 p.
Stieglitz, E.H., 1986, Estimated water use in the Southwest Florida Water Management District, 1985:Brooksville, Southwest Florida Water Management District, 53 p.
Suwannee River Water Management District, 1979, Procedure for assessing agricultural irrigation water use, 114 p.
U.S. Soil Conservation Service, 1970, Irrigation water requirement: Technical Release 21, 88 p.
___ 1982, Gainesville, Florida irrigation guide.
University of Florida, 1986, Florida estimates of population, April 1, 1985: States, counties, municipalities: Gainesville, University of Florida, Bureau of Economic and Business, 48 p.
Georgia
Barber, N.L., 1987, Public-supply water use in Georgia, 1983: Georgia Geologic Survey Hydrologic Atlas 15, 1 sheet.
Fanning, J.L., 1985, The Georgia water-use program: U.S. (ideological Survey Open-File Report 85-481, pamphlet.
66
SELECTED REFERENCES-Continued
Georgia Department of Industry and Trade and Tourism, 1983, Georgia manufacturing directory, 1983: Georgia Department of Industry and Trade and Tourism, 1983 edition, 360 p.
Harrison, Kerry, and Tyson, A.W., 1987, 1986 Irrigation Survey: Athens, Ga., University of Georgia Cooperative Extension Service, 60 p.
Lewis, George, 1984, Catfish farming in Georgia: Athens, Ga., University of Georgia Cooperative Extension Service.
Pierce, R.R., and Barber, N.L., 1982, Water Use in Georgia 1980: A preliminary report: Georgia Geologic Survey Circular 4, 15 p.
Pullin, Debra, ed., 1970, Horse and pony survey: Georgia Department of Agriculture, 9 p.
Steele, W.M., and O'Connor, B.J., 1986, Mining directory of Georgia: 19th ed., Georgia Geologic Survey Circular 2, 54 p.
Strong, C.F., and Wildey, H.E., 1986, A summary of the 1985 poultry survey by Georgia county agents: Athens, University of Georgia Cooperative Extension Service, 34 p.
Trent, V.P., Fanning, J.L., and Doonan, G.A., 1990, Water use in Georgia by county for 1987: Georgia Geologic Survey Information Circular 85, 112 p.
U.S. Department of Agriculture Crop Reporting Service, 1980, Georgia agricultural facts 1978-1979: Georgia Department of Agriculture, 98 p.
U.S. Department of Energy, 1987, Monthly powerplant report, Georgia: Energy Information Administration 759, 22 p.
Kentucky
Mull, D.S., Lee, V.D., 1984, Water use in Kentucky, 1980: Kentucky Natural Resources and Environmental Protection Cabinet, Department of Environmental Protection 1011, 1 sheet.
Scholar, C.J., and Lee, V.D., 1988, Water use in Kentucky, 1985: U.S. Geological Survey Water- Resources Investigations Report 88-4043, 53 p.
Scholar, C. J., and Wood, P.A., 1986, Water supplies in western Kentucky during 1984: U.S. Geological Survey Water-Resources Investigations Report 86-4171, 89 p.
U.S. Department of Commerce, Bureau of the Census, 1984, 1982 Census of agriculture, preliminary report, Kentucky: U.S. Government Printing Office, Washington D.C.
U.S. Department of Energy, 1984, Estimated water usage of power plants, Kentucky: Hanford Engineering Development Laboratory, Richland, Washington.
Louisiana
Louisiana Department of Commerce, 1986, Directory of Louisiana Manufacturers: 422 p.
Lurry, D.L., 1985, Public water supplies in Louisiana, volume 1: northern Louisiana, 1985: Louisiana Department of Transportation and Development Basic Records Report 13,119 p.
Lurry, D.L., 1987, Pumpage of water in Louisiana, 1985: U.S. Geological Survey Water-Resources Investigations Report 87-4059, 1 sheet.
67
SELECTED REFERENCES-Continued
U.S. Department of Commerce, Bureau of the Census, 1982a, Census of Agriculture: U.S. Government Printing Office, v. 1, part 18, 348 p.
___ 1982b, Water use in manufacturing: 72 p.
___ 1982c, Water use in mineral industries: 32 p.
___ 1982d, The characteristics of the population from the 1980 census: 237 p.
Walter, W.H., 1982, Pumpage of water in Louisiana, 1980: Louisiana Department of Transportationand Development, Office of Public Works, Water Resources Special Report 3, 15 p.
Mississippii
Callahan, J.A., 1983, Water use in Mississippi 1980: U.S. Geological Survey Open-File Report 83-224, 1 sheet.
___ 1985, Water use in the delta counties of Mississippi, 1983: U.S. Geological Survey, Water- Resources Investigations Report 85-4187, 1 sheet.
Mississippi Department of Agriculture and Commerce, 1987p Mississippi agricultural statistics 1985- 1986: Mississippi Department of Agriculture and Commerce supplement 21, 60 p.
Mississippi Municipal Association, 1981, Mississippi mujnicipal directory, 1977-1981: Jackson, Mississippi, 87 p.
Mississippi Research and Development Center, 1985, Mississippi manufacturers directory, 1985, edition: Mississippi Department of Economic Development, 385 p.
U.S. Department of Commerce, Bureau of the Census, 1981, 1980 Census of population and housing: Mississippi PHC80-V-26, 20 p.
[
North Carolina
Jackson, N.M., Jr., 1972, Public water supplies of North Carolina, part 1, northern Piedmont: North Carolina Department of Natural and Economic Resources, 277 p.
___ 1973, Public water supplies of North Carolina, part 2, southern Piedmont: North Carolina Department of Natural and Economic Resources, 255| p.
___ 1974, Public water supplies of North Carolina, part 3, mountains and western Piedmont: North Carolina Department of Natural and Economic Resources, 232 p.
North Carolina Crop and Livestock Reporting Service, 198£i, North Carolina Agricultural Statistics, 68 p.
North Carolina Department of Agriculture, 1984, North Carolina agricultural statistics-1983: North Carolina Department of Agriculture, 62 p.
North Carolina Department of Commerce, 1987, Directory of North Carolina manufacturing firms 1985-1986: North Carolina Department of Natural Resources and Community Development, 662 p.
68

SELECTED REFERENCES-Continued
North Carolina Department of Environment, Health, and Natural Resources, 1981, Directory of North Carolina mineral producers for 1980: North Carolina Department of Natural Resources and Community Development, Division of Land Resources, Geologic Section, 58 p.
North Carolina Department of Natural Resources and Community Development, 1983, Self-supplied industrial water use summary for 1981: North Carolina Department of Natural Resources and Community Development, 42 p.
Robison, T.M., 1977, Public water supplies of North Carolina, part 4, northern Coastal Plain, North Carolina Department of Natural and Economic Resources, 218 p.
Robison, T.M., and Mann, L.T., Jr., 1977, Public water supplies of North Carolina, part 5, southern Coastal Plain, North Carolina Department of Natural and Economic Resources, 333 p.
Sneed, Ronald, 1961, Which water pump for you?, 1962: North Carolina Agricultural Extension Service Folder 210, 5 p.
Puerto Rico
Gomez-Gomez, Fernando, Dacosta, Rafael, and Orona, Miguel, 1983, Estimated water use in Puerto Rico, 1980: Puerto Rico Department of Natural Resources Miscellaneous Map Series, 1 sheet.
Gomez-Gomez, Fernando, Quinones-Marquez, Ferdinand, and Lopez, Marisol, 1984, Public water supplies in Puerto Rico, 1983: U.S. Geological Survey Open-File Report 84-126, 103 p.
Jordan, D.G., and Cosner, O.J., 1973, A survey of the water resources of St. Thomas Virgin Islands: U.S. Geological Survey Open-File Report, 55 p.
Kirk, J.R., Jarboe, J., Sanderson, E.W., Sasman, R.T., and Lonnquist, C., 1982, Water withdrawals in Illinois, 1980: Illinois State Water Survey Circular 152, 47 p.
Puerto Rico Aqueduct and Sewer Authority, 1987, Statistical report for Executive Director, July 1987: Puerto Rico Aqueduct and Sewer Authority, 54 p.
Roman-Mas, Angel, and Green, Bruce, 1987, Climatological data for the rice-growing areas along the North Coast of Puerto Rico: U.S. Geological Survey Open-File Report 86-53, 90 p.
Torres-Sierra, Heriberto, 1987, Estimated water use in St. Croix, U.S. Virgin Islands, October 1983- September 1985: U.S. Geological Survey Open-File Report 86-537, 1 sheet.
Torres-Sierra, Heriberto, and Aviles, Ada, 1986, Estimated water use in Puerto Rico, 1980-1982: U.S. Geological Survey Open-File Report 85-557, 77 p.
Torres-Sierra, Heriberto, and Dacosta, Rafael, 1984, Estimated water use in St. Thomas, U.S. Virgin Islands, July 1983-June 1984: U.S. Geological Survey Open-File Report 84-721, 1 sheet.
U.S. Department of Commerce, Bureau of the Census, 1984, 1982 Census of Agriculture: Puerto Rico, AC82-A-52, 202 p.
___ 1982, 1980 Census of population and housing: Puerto Rico, PH80-V-53, lip.
69
SELECTED REFERENCES-Continued
South Carolina
Harrington, Joseph, 1985, Water use in South Carolina, Juh Resources Commission Report 148, 18 p.
Lonon, G.E., Burnette, C.B., and Morris, H.J., 1983, Water use in South Carolina, 1980: SCWRC Report 138, 20 p.
MacKichan, K.A., and Kammerer, J.C., 1961, Estimated use Geological Survey Circular 456, 26 p.
South Carolina Agricultural Statistics Service, 1986, South
-December 1983: South Carolina Water
of water in the United States, 1960: U.S.
Carolina state and county livestock andpoultry statistics: Clemson University, South Carolina Agricultural Experiment Station, 41 p.
Tennessee
Alexander, P.M., Keck, L.A., Conn, L.G., and Wentz, S.J., 1984, Drought-related impacts on municipal and major self-supplied industrial water withdrawals in Tennessee-parts A and B: U.S. Geological Survey Water-Resources Investigations Resport 84-4074, 16 p.
Hutson, S.S., 1988, Estimated use of water in Tennessee, 3-985: U.S. Geological Survey Open-File Report 88-348, 1 sheet.
MacKichan, K.A., and Kammerer, J.C., 1961, Estimated use Geological Survey Circular 456, 26 p.
of water in the United States, 1960: U.S.
Tennessee Crop Reporting Service, April 1985 to November 1985, Tennessee weather and crops, weekly edition, 4 p.
U.S. Department of Agriculture, 1962, Sprinkler irrigation^ guide for Tennessee, Soil Conservation Service and the University of Tennessee, College of Agriculture, 23 p.
___ 1976, Crop consumptive irrigation requirements and irrigation efficiency coefficients for the United States: Special Projects Division of the U.S. Conservation Service, 141 p.
University of Tennessee, 1985, Population projections for Tennessee counties (computerized data base): Knoxville, University of Tennessee, Department of Sociology, 1 p.
General references
Baker, N.T., 1990, Summary and analysis of water-use data collection in eastern Arkansas: U.S. Geological Survey Water-Resources Investigations Report 90-4177, 25 p.
MacKichan, K.A., 1951, Estimated water use in the United States, 1950: U.S. Geological Survey Circular 115, 13 p.
___ 1957, Estimated water use in the United States, 1955: U.S. Geological Survey Circular 398,18 p.
Mann, W.B., IV., Moore, J.E., and Chase, E.B., 1982, A national water-use information program: U.S. Geological Survey Open-File Report 82-862, 12 p.
Mann, W.B., IV., Solley, W.B., and Chase, E.B., 1983, Summary of water withdrawals in the United States, 1950-80: U.S. Geological Survey Open-File Rjeport 83-207.
70

SELECTED REFERENCES-Continued
Murray, C.R., 1968, Estimated use of water in the United States, 1965: U.S. Geological Survey Circular 556, 53 p.
___ 1977, Estimated use of water in the United States in 1975: U.S. Geological Survey Circular 765, 37 p.
Murray, C.R., and Reeves, E.B., 1972, Estimated use of water in the United States in 1970: U.S. Geological Survey Circular 676, 37 p.
Seaber, Y.R., Kapinos, P.P., and Knapp, G.L., 1984, State hydrologic unit maps: U.S. Geological Survey Open-File Report 84-708, 198 p.
Solley, W.B., Chase, E.B., and Mann, W.B., IV., 1983, Estimated use of water in the United States in 1980: U.S. Geological Survey Circular 1001, 56 p.
Solley, W.B., Merk, C.F., and Pierce, R.R., 1988, Estimated use of water in the United States 1985: U.S. Geological Survey Circular 1004, 82 p.
71
GLOSSARY
Water-use terminology continues to evolve as the field grows and expands. The following is a list of definitions for terms, phrases, and various data collection components commonly used in the process of water-use data collection and compilation.
Acre-foot of water (acre-ft)--The volume of water required toa depth of 1 ft.
Acres irrigated~The total number of acres of the crop that was irrigated during the year.
Annual power produced~The total power that the facility generated during the calendar year. The units of measure for these data are determined at tho State level.
Aquaculture-Farming of organisms that live in water, such
cover 1 acre of land (43,560 square ft) to
as fish, shellfish, and algae.
Aquifer~A geologic formation, group of formations, or part of a formation that contains sufficient saturated permeable material to yield significant quantities of water to wells and springs.
Commercial water use-Water for motels, hotels, restaurants, office buildings, and other commercial facilities and institutions, both civilian and military. The water may be obtained from a public- supply facility or may be self-supplied. See also public-supply and self-supplied water.
Consumptive use-The part of the water withdrawn that is evaporated, transpired, incorporated intoproducts or crops, consumed by humans or livestock, or otherwise removed from the immediatewater environment. Also referred to as water consumed and water depletion.
Conveyance loss-Water that is lost (by leakage or evaporation) while in transit in a pipe, canal, conduit, or ditch. Generally, the water is not available for further use; however, leakage froman irrigation ditch, for example, may percolate to a ground-water source and be available forfurther use.
Cooling water--Water used for cooling purposes, such as cooling of condensers and nuclear reactors.
Delivery/release~The amount of water delivered to the poinl; of use and the amount released after use;the difference between these amounts is usually th consumptive use.
e same as the consumptive use. See also
Domestic population served-The total number of people served by the public supplier during the calendar year.
Domestic water use-Water used for household purposes, such as drinking, food preparation, bathing, washing clothes and dishes, flushing toilets, and watering lawns and gardens. Also called residential water use. The water may be obtained fiiom a public-supply facility or may be self- supplied. See also public supply and self-supplied water.
Evaporation-Process by which water is changed from a liquid into a vapor, evapotranspiration and transpiration.
See also
Evapotranspiration-A collective term that includes water discharged to the atmosphere as a result of evaporation from the soil and surface-water bodies and by plant transpiration. See also evaporation and transpiration.
Freshwater-Water that contains less that 1,000 mg/L (milligrams per liter) of dissolved solids; generally, more than 500 mg/L of dissolved solidfe is undesirable for drinking and many industrial uses.
72

GLOSSARY-Continued
Generating capacity~The maximum rate of power that the facility is capable of producing. The units of measure for these data are determined at the State level.
Gigawatthour (GWh)--One billion watt-hours.
Ground water-Generally all subsurface water as distinct from surface water; specifically, that part of the subsurface water in the saturated zone (a zone in which all voids are filled with water) where the water is under pressure greater than atmospheric.
Hydroelectric power water use-The use of water in the generation of electricity at plants where the turbine generators are driven by falling water; an instream use.
Hydrologic unit code-An eight-digit code identifying the facility's location with reference to the areal breakdown shown of State hydrologic unit maps. The format is (RRSSAACC) where: RR is the 2-digit code for the Water Resources Council Region. SS is the 2-digit code for the Water Resources Council subregion. AA is the 2-digit code for the National Water Data Network Accounting Unit. CC is the 2-digit code for the cataloging unit of the catalog of information on water data
maintained by the Office of Water Data Coordination.Hydrologic unit codes are given in the U.S. Geological Survey Map Series "State Basic Hydrologic Unit Maps." The series provides a uniform, nationally consistent set of maps showing drainage, cultural features, hydrographs, and hydrologic boundaries.
In-channel use-See instream use.
Industrial water use-Water used for industrial purposes, such as fabrication, processing, washing, and cooling, and includes such industries as steel, chemical and allied products, paper and allied products, mining, and petroleum refining. The water may be obtained from a public- supply facility or may be self-supplied. See also public-supply and self-supplied water.
Instream use-Water use taking place within the stream channel for such purposes as hydroelectric power generation, navigation, water-quality improvement, fish propagation, and recreation. Sometimes called nonwithdrawal use or in-channel use.
Irrigation-Refers to the process of supplementing rainfall with water that is needed to produce a crop.
Irrigation return flow-Part of irrigation water that is not consumed by evapotranspiration and that migrates to an aquifer or surface-water body.
Irrigation water use-Artificial application of water on lands to assist in the growing of crops and pastures or to maintain vegetative growth in recreational lands, such as parks and golf courses.
Livestock water use-Water for stock watering, feed lots, dairy operations, fish farming, and other on- farm needs. Livestock as used here includes cattle, sheep, goats, hogs, and poultry. Also included are such animal specialties as horses, rabbits, bees, pets, fur-bearing animals in captivity, and fish in captivity. See also rural water use.
Mining water use-Water use for the extraction of minerals occurring naturally, including solids, such as coal, clay, and ores; liquids, such as crude petroleum; and gases, such as natural gas. Also includes uses associated with such as sand, gravel, and quarrying for rock aggregates, well operations (dewatering), milling (crushing, screening, washing, floatation, and other), and other preparations customarily done at the mine site or as part of a mining activity.
73

GLOSSARY-Continued
Monthly power produced--The total power that the facility generated during a month of the year. The units of measure for these data are determined at the State level.
Nonwithdrawal use-See instream use.
Offstream use-Water withdrawn and diverted from a ground- or surface-water source for public water supply, industry, irrigation, livestock, thermoelectric power generation, and other uses. Sometimes called off-channel use or withdrawal use.
Per capita use-The average amount of water used per person during a standard time period, generally per day.
Power generation water use-See hydroelectric power water use and thermoelectric power water use.
Public supply-Water withdrawn by public and private water suppliers and delivered to groups of users. Public suppliers provide water for a variety of uses, such as domestic, commercial, thermoelectric power, industrial, and public water use. See also commercial water use, domestic water use, industrial water use, and public iwater use.
Public-supply deliveries-Water provided for multiple users through a public-supply distribution system.
Public water use-Water supplied from a public water supply and used for such purposes as firefighting, street washing, and municipal parks and swimming pools. See also public supply.
Reclaimed sewage-Waste water-treatment plant effluent th&t has been diverted or intercepted for use before it reaches a natural waterway or aquifer.
Recycled water-Water that is used more than one time before it passes back into the natural hydrologic system.
Residential water use-See domestic water use.
Reverse osmosis-A process of desalination of saline water solids from saline water to make it potable.
that removes chlorides or other dissolved
Return flow-The water that reaches a ground- or surface-water source after release from the point of use and thus becomes available for further use.
Reuse-See recycled water.
Rural water use-Water used in suburban or farm areas for generally is self-supplied, and includes domestic us
domestic and livestock needs. The water i, drinking water for livestock, and other
uses, such as dairy sanitation, evaporation from stoc i-watering ponds, and cleaning and waste disposal. See also domestic water use, livestock water use, and self-supplied water.
Saline water Water that contains more than 1,000 mg/L of dissolved solids.
Self-supplied industrial use-See industrial water use and self-supplied water.
Self-supplied water Water withdrawn from a ground- or surface-water source by a user rather than being obtained from a public-supply facility.
74
GLOSSARY-Continued
Sewage Wastewater carried off by sewers and drains.
Sewage treatment--The processing of wastewater for the removal or reduction of contained solids or other undesirable constituents.
Sewage-treatment return flow-Water returned to the hydrologic system by sewage-treatment facilities.
Surface water~An open bodj' of water, such as a stream or a lake.
Thermoelectric power-Electrical power generated using fossil-fuel (coal, oil, or natural gas), geothermal, or nuclear energy.
Thermoelectric power water use Water used in the process of the generation of thermoelectric power. The water may be obtained from a public-supply facility or may be self-supplied. See also public-supply and self-supplied water.
Transpiration-Process by which water that is absorbed by plants, usually through the roots, is evaporated into the atmosphere from the plant surface. See also evaporation and evapotranspiration.
Wastewater Water that carries wastes from homes, businesses, and industries.
Water consumed or consumptive use-Refers to that part of water withdrawn that is no longer available because it has evaporated, been incorporated into products and crops, consumed by man or livestock, or otherwise removed from the water environment.
Water transfer-Artificial conveyance of water from one area to another.
Water-resources region-Designated natural drainage basin or hydrologic area that contains either the drainage area of a major river or the combined drainage areas of 2 or more rivers; of 21 regions, 18 are in the conterminous United States, and 1 each is in Alaska, Hawaii, and the Caribbean.
Water-resources subregion-The 21 designated water-resources regions of the United States are subdivided into 222 subregions. Each subregion includes that area drained by a river system, a reach of a river and its tributaries in that reach, a closed basin(s), or a group of streams forming a coastal drainage system.
Water use-Describes how and where the water was used and in what amounts. See offstream use and instream use.
Watt-hour (Wh)-An electrical energy unit of measure equal to one watt of power supplied to, or taken from, an electrical circuit steadily for one house.
Withdrawal The amount of water withdrawn from a source (ground or surface, fresh or saline). This is equivalent to "intake," "water diversion," or "pumpage," terms commonly used by industry, and for irrigation, and public supply, respectively. See also offstream use and self-supplied water.
75


Appendix 1
Tables representing the sources of information by water-use category
1-1
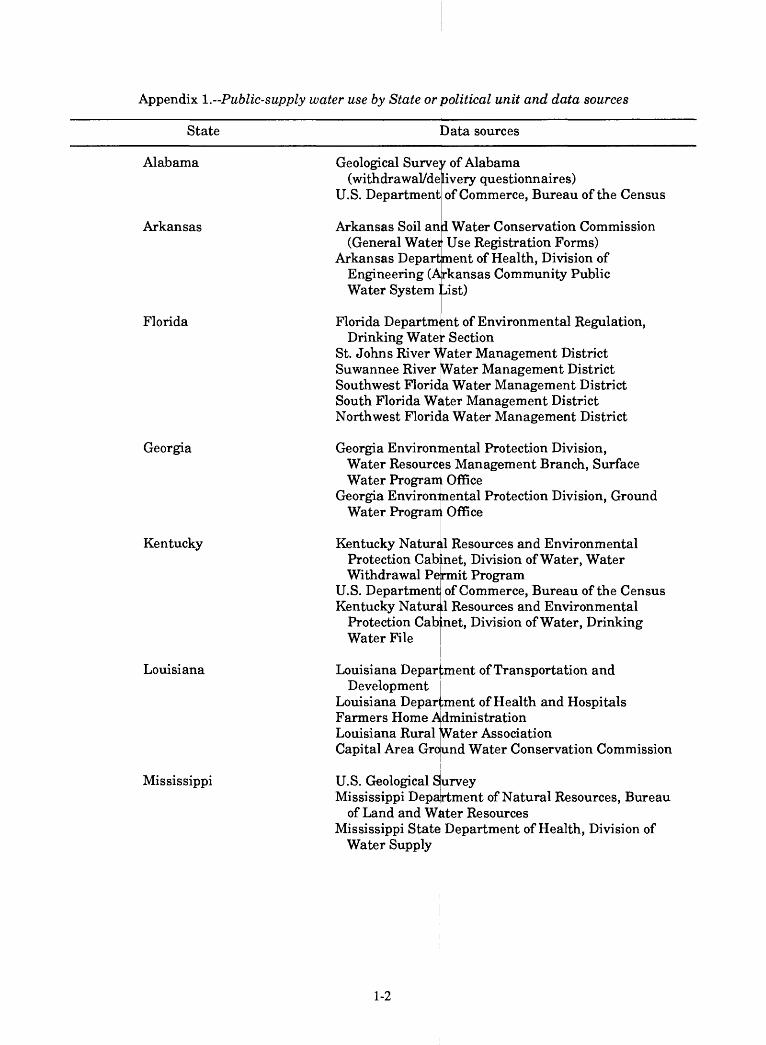
Appendix l.-Public-supply water use by State or political unit and data sources
State Data sources
Alabama
Arkansas
Florida
Georgia
Kentucky
Louisiana
Mississippi
Geological Survey of Alabama(withdrawal/delivery questionnaires)
U.S. Department of Commerce, Bureau of the Census
andArkansas Soil (General Water
Arkansas Department Engineering (Ark Water System
Suwannee River
Water Conservation Commission Use Registration Forms)
of Health, Division ofansas Community Public
ist)
Florida Department of Environmental Regulation,Drinking Wate:r Section
St. Johns River Water Management DistrictWater Management District
Southwest Floriqa Water Management District South Florida Water Management District Northwest Florida Water Management District
Georgia Environmental Protection Division, Water Resources Management Branch, Surface Water Program Office
Georgia Environmental Protection Division, Ground Water Program Office
Kentucky Nature il Protection Cab: Withdrawal Permit
U.S. Department Kentucky Natural
Protection Cab Water File
Resources and Environmental net, Division of Water, Water
Program of Commerce, Bureau of the CensusResources and Environmental
net, Division of Water, Drinking
Louisiana Department of Transportation andDevelopment
Louisiana Department of Health and Hospitals Farmers Home Administration Louisiana Rural Water Association Capital Area Ground Water Conservation Commission
U.S. Geological SurveyMississippi Department of Natural Resources, Bureau
of Land and Water Resources Mississippi State Department of Health, Division of
Water Supply
1-2

Appendix I.-Public-supply water use by State or political unit and data sources
State Data sources
North Carolina
Puerto Rico
U.S. Virgin Islands
South Carolina
Tennessee
North Carolina Department of Environment, Health, and Natural Resources, Division of Water
North Carolina Department of Human Resources, Division of Health Services, Environmental Health Section, Water Supply Branch
Puerto Rico Aqueduct and Sewer Authority (monthly and annual operating reports)
U.S. Department of Commerce, Bureau of the Census (Census of Population and Housing)
Puerto Rico Planning Board
U.S. Virgin Islands Water and Power Authority U.S. Virgin Islands Public Works Department
South Carolina Department of Health andEnvironmental Control
South Carolina Water Resources Commission
Tennessee Department of Health and Environment, Division of Water Supply
1-3

Appendix l.-Domestic water use by State or political unit and data sources
State Data sources
Alabama
Arkansas
Florida
Georgia
Kentucky
Louisiana
Mississippi
North Carolina
Geological Survejy of AlabamaTennessee Vallej U.S. Department
Authorityof Commerce, Bureau of the Census
Arkansas Soil and Water Conservation Commission(General Water Use Registration Forms)
U.S. Department of Commerce, Bureau of the Census
Florida Department of Environmental Regulation(population da;a)
St. Johns River Water Management District Suwannee River Water Management District Southwest Flork a Water Management District South Florida Water Management District Northwest Florida Water Management District University of Florida, College of Business
Administration, Bureau of Economic and Business'Research (population program)
U.S. Department of Commerce, Bureau of the Census Georgia Environmental Protection Division, Water
Resources Management Branch, Ground WaterProgram Office
Kentucky Natural Resources and Environmental Protection Cabinet, Division of Water, Drinking Water File
U.S. Department of Commerce, Bureau of the Census
U.S. Department of Commerce, Bureau of the CensusLouisiana Department of Health and HospitalsFarmers Home AdministrationLouisiana Rural Water AssociationCapital Area Ground Water Conservation Commission
U.S. Department of Commerce, Bureau of the Census Mississippi Department of Natural Resources,
Division of Natural Resources
North Carolina [Department of Environment, Health,and Natural Resources, Division of Water
U.S. Department of Commerce, Bureau of the Census North Carolina State University U.S. Geological Survey
1-4

Appendix l.-Domestic water use by State or political unit and data sources
State Data sources
Puerto Rico
U.S. Virgin Islands
South Carolina
Tennessee
Puerto Rico Aqueduct and Sewer Authority (monthly and annual operating reports)
U.S. Department of Commerce, Bureau of the Census (Census of Population and Housing)
U.S. Virgin Islands Public Works Department U.S. Virgin Islands Department of Commerce Virgin Islands Caribbean Research Institute, Water
Resources Research Branch U.S. Virgin Islands Department of Conservation and
Cultural Affairs National Weather Service U.S. Geological Survey (rain gage data)
South Carolina Department of Health andEnvironmental Control
U.S. Department of Commerce, Bureau of the Census
Tennessee Department of Health and Environment,Division of Ground Water Protection
Shelby County Health Department University of Tennessee
1-5

Appendix ^.-Industrial water use by State or political unit and data sources
State Data sources
Alabama
Arkansas
Florida
Georgia
Kentucky
Louisiana
Mississippi
North Carolina
Alabama Department of Economic and CommunityAffairs
Alabama Department of EnvironmentalManagement (bomputer files)
Arkansas Soil and Water Conservation Commission (General Water Use Registration Forms)
Arkansas Industrial Development Foundation (Arkansas Directory of Manufacturers)
St. Johns River Water Management District Suwannee River Water Management District Southwest Florida Water Management District South Florida Water Management District Northwest Florida Water Management District
(Consumptive Use Permit files and Compliancerecords, and questionnaire and telephone surveys)
Florida Department of Environmental RegulationDrinking Water Section (Monthly OperatingReport for Noncommunity Systems)
Georgia Environmental Protection Division, WaterResources Management Branch, Surface WaterProgram Office
Georgia Environmental Protection Division, WaterResources Management Branch, Ground WaterProgram Office
Kentucky Natural Resources and Environmental Protection Cabinet, Division of Water, Water Withdrawal Permit Program
Louisiana Department of Transportation andDevelopment
Louisiana Department of Commerce Capital Area Ground Water Conservation Commission
Mississippi Development and Services Bureau
North Carolina Department of Environment, Health, and Natural Resources, Division of Water
North Carolina Department of Commerce, Industrial Development Division
U.S. Geological Survey
1-6

Appendix l.-Industrial water use by State or political unit and data sources
State Data sources
Puerto Rico
U.S. Virgin Islands
South Carolina
Tennessee
Puerto Rico Department of Natural Resources(permit records)
Puerto Rico Aqueduct and Sewer Authority(monthly operating report)
U.S. Geological SurveyU.S. Virgin Islands Public Works Department
South Carolina Water Resources Commission (Industrial Water Use System Description Report)
Tennessee Department of Health and Environment, Division of Water Quality Control (Discharge Monitoring Report)
Shelby County Health Department
1-7
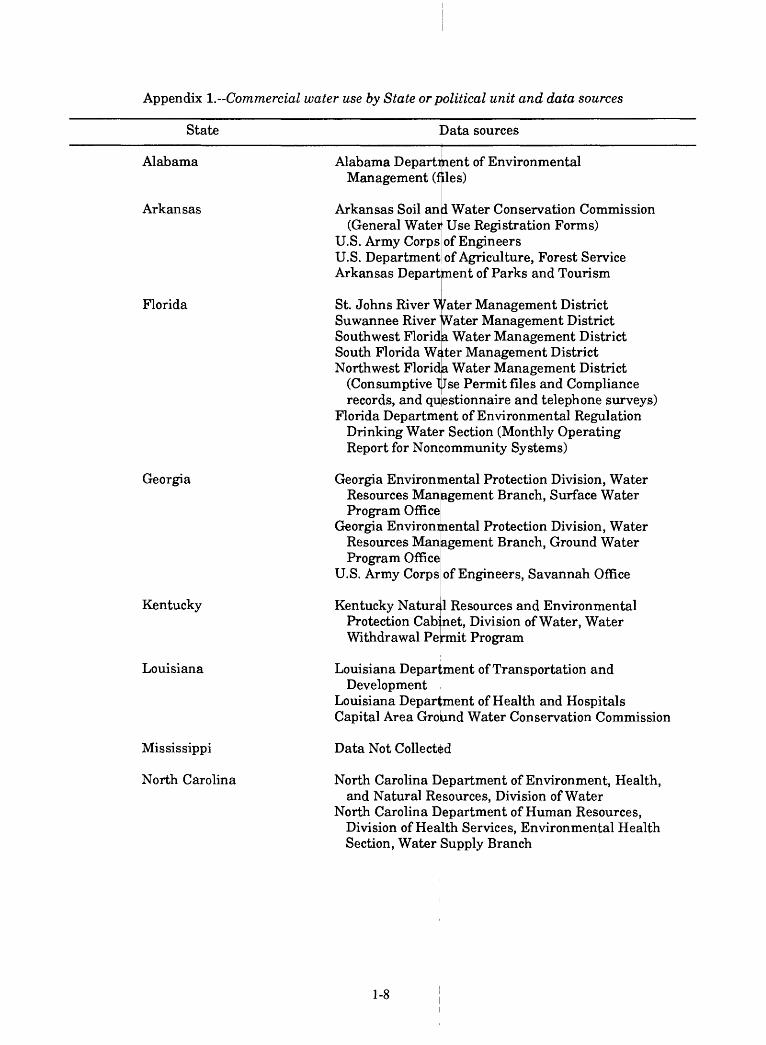
Appendix 1.---Commercial water use by State or political unit and data sources
State Data sources
Alabama
Arkansas
Florida
Georgia
Kentucky
Louisiana
Mississippi
North Carolina
Alabama Department of Environmental Management (files)
Arkansas Soil an(General Water
U.S. Army CorpsU.S. Department
i Water Conservation Commission Use Registration Forms) of Engineers of Agriculture, Forest Service
Arkansas Department of Parks and Tourism
St. Johns River Water Management District Suwannee River Water Management District Southwest Florida Water Management District South Florida Water Management District Northwest Florida Water Management District
(Consumptive Use Permit files and Compliancerecords, and questionnaire and telephone surveys)
Florida Department of Environmental RegulationDrinking Water Section (Monthly OperatingReport for Noncommunity Systems)
Georgia Environmental Protection Division, WaterResources Management Branch, Surface WaterProgram Office
Georgia Environmental Protection Division, WaterResources Management Branch, Ground WaterProgram Office
U.S. Army Corps
Kentucky Natural Protection Cabinet Withdrawal Permit
of Engineers, Savannah Office
Resources and Environmental , Division of Water, Water
Program
Louisiana Department of Transportation andDevelopment
Louisiana Department of Health and Hospitals Capital Area Ground Water Conservation Commission
Data Not Collected
North Carolina Department of Environment, Health, and Natural Resources, Division of Water
North Carolina Department of Human Resources, Division of Health Services, Environmental Health Section, Water Supply Branch
1-8
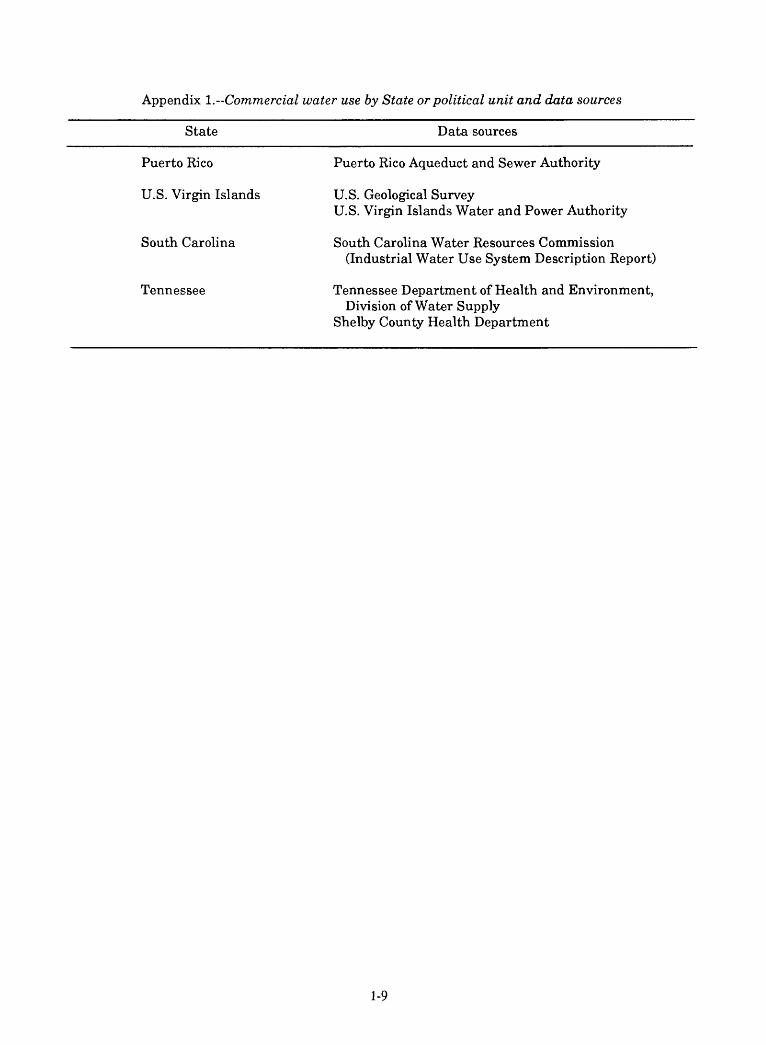
Appendix ^.--Commercial water use by State or political unit and data sources
State Data sources
Puerto Rico
U.S. Virgin Islands
South Carolina
Tennessee
Puerto Rico Aqueduct and Sewer Authority
U.S. Geological SurveyU.S. Virgin Islands Water and Power Authority
South Carolina Water Resources Commission (Industrial Water Use System Description Report)
Tennessee Department of Health and Environment,Division of Water Supply
Shelby County Health Department
1-9
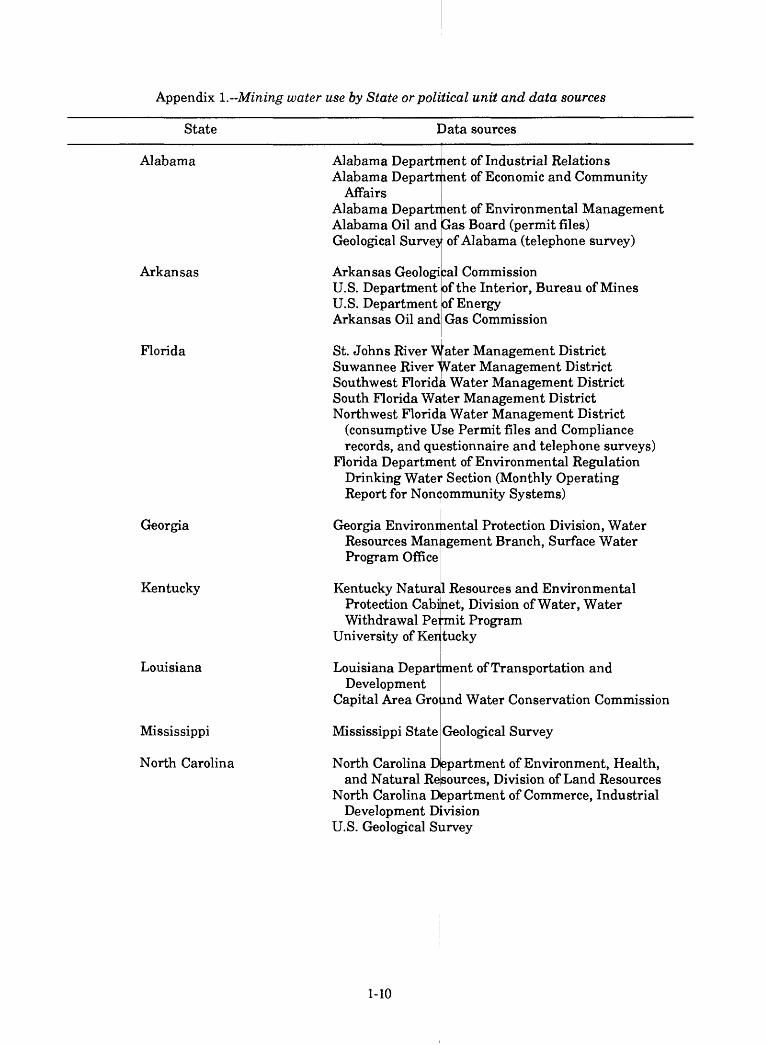
Appendix l.-Mining water use by State or political unit and data sources
State Data sources
Alabama
Arkansas
Florida
Georgia
Kentucky
Louisiana
Mississippi
North Carolina
Alabama Alabama
Affairs Alabama Alabama Oil and Geological Survej
Department of Industrial Relations Department of Economic and Community
Department of Environmental Management Gas Board (permit files) of Alabama (telephone survey)
cal CommissionDepartment of the Interior, Bureau of Mines
t of Energy Gas Commission
Arkansas GeologiU.S.U.S. DepartmenArkansas Oil and
St. Johns River Water Management District Suwannee River Water Management District Southwest Florida Water Management District South Florida Water Management District Northwest Florida Water Management District
(consumptive Use Permit files and Compliancerecords, and questionnaire and telephone surveys)
Florida Department of Environmental RegulationDrinking Water Section (Monthly OperatingReport for NonQommunity Systems)
Georgia Environmental Resources Management Program Office
Kentucky Natural Protection Cabinet Withdrawal Pennit
University of Kentucky
Protection Division, Water Branch, Surface Water
Resources and Environmental , Division of Water, Water
Program
Louisiana Department of TransportatiDevelopment
Capital Area Ground
ion and
Water Conservation Commission
Mississippi State Geological Survey
North Carolina Department of Environment, Health, and Natural Resources, Division of Land Resources
North Carolina Department of Commerce, Industrial Development Division
U.S. Geological Survey
1-10

Appendix \.--Mining water use by State or political unit and data sources
State Data sources
Puerto Rico
U.S. Virgin Islands
South Carolina
Tennessee
Puerto Rico Department of Natural Resources (permit records)
Mining operations in the U.S. Virgin Islands have negligible water use
South Carolina Water Resources Commission (Industrial Water Use System Description Report)
Tennessee Department of Health and Environment Tennessee Department of Conservation, Division of
Geology Tennessee Department of Labor, Division of Mine
Permits U.S. Department of the Interior, Office of Surface
Mining Tennessee Department of Health and Environment,
Division of Surface Mining and Reclamation EPA-National Pollution Discharge Elimination
System (permits)
1-11

Appendix I. Livestock water use by State or political unit and data sources
State Data sources
Alabama
Arkansas
Florida
Georgia
Kentucky
Louisiana
Alabama Cooper atiAuburn Unive
Alabama Crop and U.S. Departmen
ive Extension Service, sity
Livestock Reporting Service of Agriculture
Arkansas Soil ar d Water Conservation Commission (Agricultural Water Use Registration Forms)
U.S. Departmen; of the Interior, Fish and Wildlife Service, Fish F'arming Experimental Laboratory
Arkansas Game University of Ar
and Fish Commission;ansas, Cooperative Extension
ServiceU.S. Department of Agriculture, Crop Reporting
Service
St. Johns River "iVater Management District Southwest Florida Water Management District South Florida Wlater Management District Suwannee River Water Management District Northwest Florida Water Management District
(Consumptive Use Permit and Compliance files) Florida Crop and Livestock Reporting Service,
Florida Agricultural Statistics University of Florida, Institute of Food and
Agricultural S ience, main office and CountyExtension Service
University of Georgia, Cooperative Extension ServiceGeorgia Crop Reporting ServiceU.S. Department of Agriculture, Equine Program
U.S. Department of Commerce, Bureau of the Census
Louisiana Department of Transportation andDevelopment
Louisiana State [University Extension Service U.S. Agricultural! Stabilization and Conservation
Service
1-12
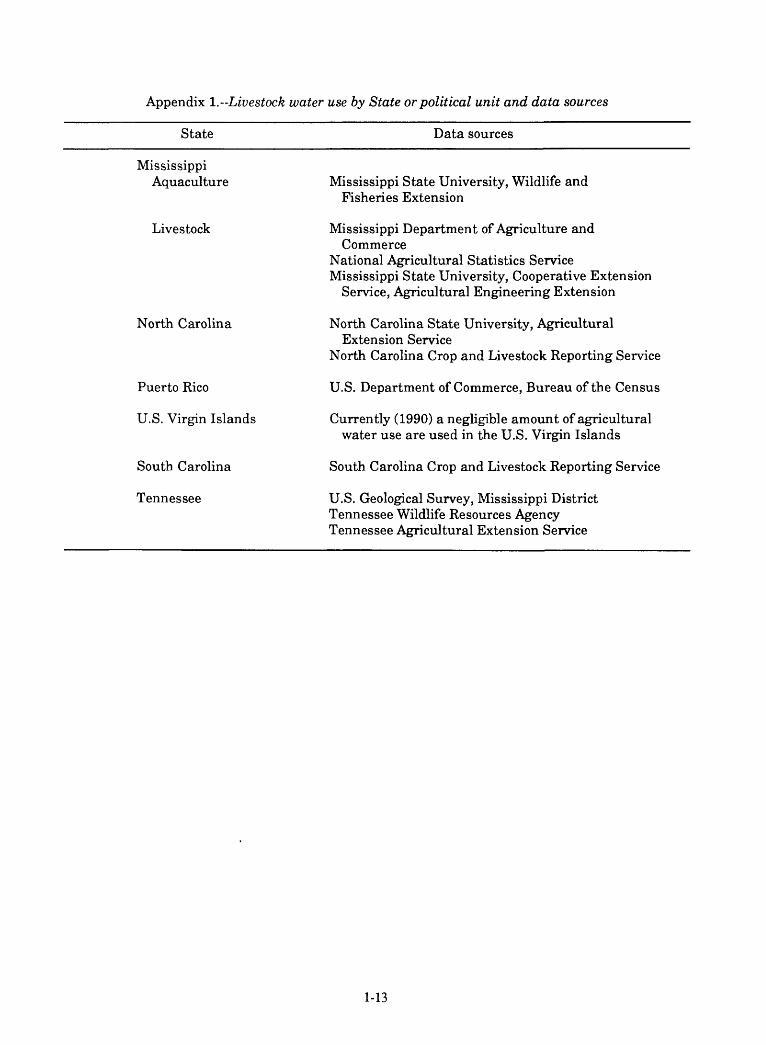
Appendix l.--Livestock water use by State or political unit and data sources
State Data sources
Mississippi Aquaculture
Livestock
North Carolina
Puerto Rico
U.S. Virgin Islands
South Carolina
Tennessee
Mississippi State University, Wildlife and Fisheries Extension
Mississippi Department of Agriculture andCommerce
National Agricultural Statistics Service Mississippi State University, Cooperative Extension
Service, Agricultural Engineering Extension
North Carolina State University, AgriculturalExtension Service
North Carolina Crop and Livestock Reporting Service
U.S. Department of Commerce, Bureau of the Census
Currently (1990) a negligible amount of agricultural water use are used in the U.S. Virgin Islands
South Carolina Crop and Livestock Reporting Service
U.S. Geological Survey, Mississippi District Tennessee Wildlife Resources Agency Tennessee Agricultural Extension Service
1-13

Appendix ^.--Irrigation water use by State or political unit and data sources
State Data sources
Alabama
Arkansas
Florida
Georgia
Kentucky
Louisiana
Mississippi
Alabama Cooperative Auburn University
Geological Survey
Arkansas Soil (Agricultural
and Water Conservation Commission Water Use Registration Form)
St. Johns River
(Consumptive
ive Extension Service,ityof Alabama
Water Management DistrictSouthwest Florida Water Management District South Florida Water Management District Suwannee River Water Management District Northwest Florida Water Management District
Use Permit and Compliance files)Soil Conservation Service (Crop Requirements Needs
Manual) Florida Institute of Food and Agriculture,
County Extension agents Florida Crop and Livestock Reporting Service U.S. Geological Survey Report: Benchmark Farms
Program-A Method for Estimating Irrigation WaterUse in Florida
University of Georgia Georgia Water
Wastewater
, Cooperative Extension Service Protection Branch, Municipal
Office
U.S. Department University of K
of Commerce, Bureau of the Census ijntucky
Louisiana Department of Transportation andDevelopment
Louisiana State U.S. Agricultural
Service
University Extension Service Stabilization and Conservation
Mississippi Department of Agriculture and Commerce National Agricultural Statistics Service Mississippi Staie University, Cooperative Extension
Service, Agricultural Engineering Extension
1-14

Appendix I.--Irrigation water use by State or political unit and data sources
State Data sources
North Carolina
Puerto Rico
U.S. Virgin Islands
South Carolina
Tennessee
North Carolina Department of Environment, Health, and Natural Resources, Division of Water
North Carolina State University, Agricultural Extension Service
North Carolina State University, Department of Agricultural Engineering
Puerto Rico Department of AgricultureU.S. Department of Commerce, Bureau of the CensusPuerto Rico Electric Power AuthorityPuerto Rico Sugar Corporation
Currently (1990) no accountable irrigation water use reported in the U.S. Virgin Islands
South Carolina Water Resources Commission (Agricultural and Golf Course Water Use Report Forms)
Clemson University Cooperative Extension Service
U.S. Department of Agriculture, Soil Conservation Service
1-15
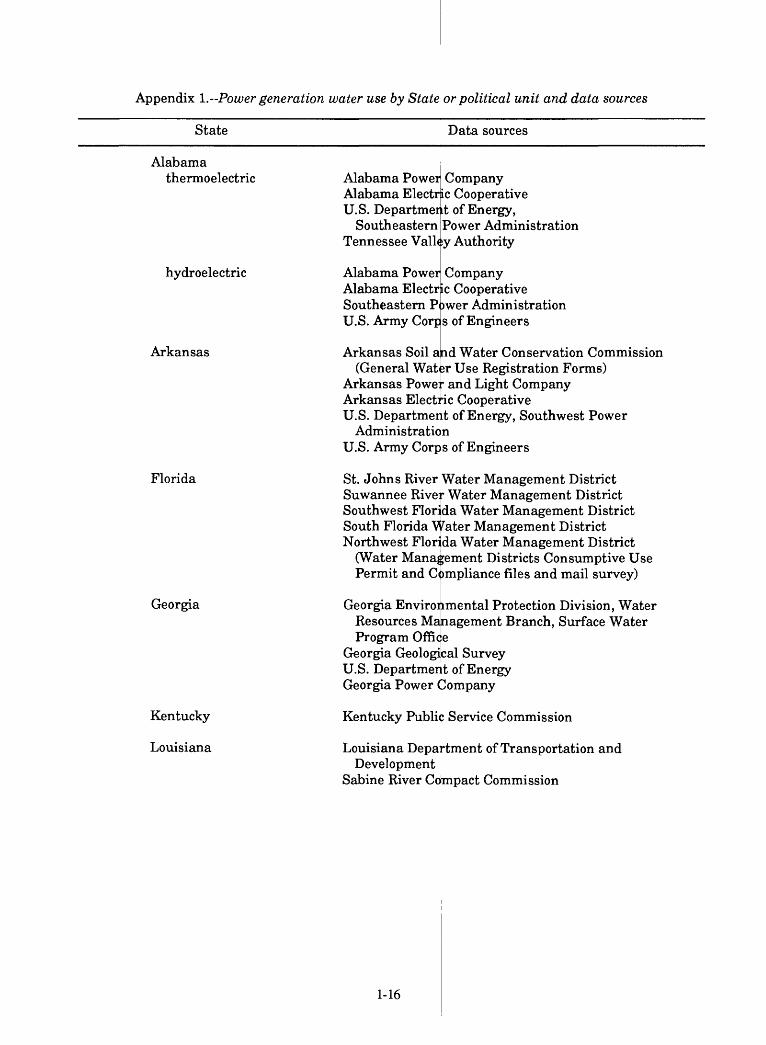
Appendix l.--Power generation water use by State or political unit and data sources
State Data sources
Alabamathermoelectric
hydroelectric
Arkansas
Florida
Georgia
Kentucky
Louisiana
Alabama Power Alabama Electric U.S. Department
Southeastern Tennessee Valley Authority
Alabama Power Alabama Electr Southeastern Power U.S. Army
CompanyCooperativeof Energy,
Power Administration
Company ic Cooperative
Administration of EngineersCorps
Arkansas Soil and Water Conservation Commission (General Water Use Registration Forms)
Arkansas Power and Light CompanyArkansas Electiic CooperativeU.S. Department of Energy, Southwest Power
AdministrationU.S. Army Corps of Engineers
St. Johns River Water Management District Suwannee River Water Management District Southwest Florida Water Management District South Florida Water Management District Northwest Florida Water Management District
(Water Management Districts Consumptive Use Permit and Compliance files and mail survey)
Georgia Environmental Protection Division, Water Resources Management Branch, Surface Water Program Office
Georgia Geological SurveyU.S. Department of EnergyGeorgia Power Company
Kentucky Public Service Commission
Louisiana Department of Transportation andDevelopment
Sabine River Cotnpact Commission
1-16
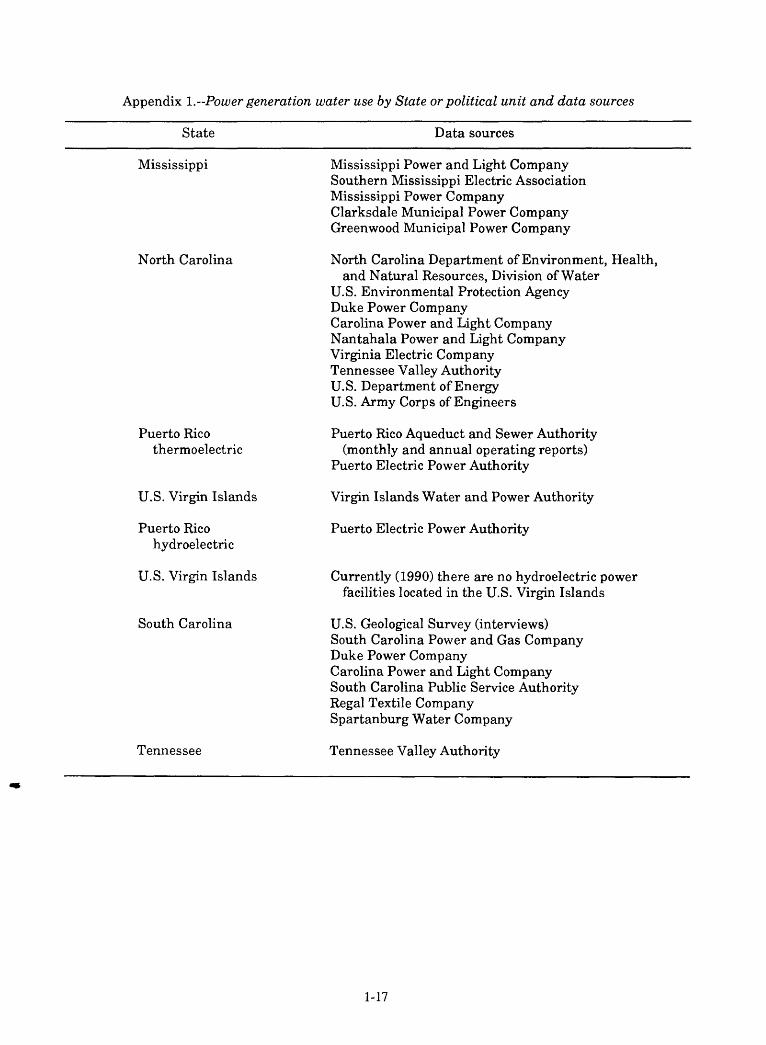
Appendix 1.--Power generation water use by State or political unit and data sources
State Data sources
Mississippi
North Carolina
Puerto Rico thermoelectric
U.S. Virgin Islands
Puerto Rico hydroelectric
U.S. Virgin Islands
South Carolina
Tennessee
Mississippi Power and Light Company Southern Mississippi Electric Association Mississippi Power Company Clarksdale Municipal Power Company Greenwood Municipal Power Company
North Carolina Department of Environment, Health,and Natural Resources, Division of Water
U.S. Environmental Protection Agency Duke Power Company Carolina Power and Light Company Nantahala Power and Light Company Virginia Electric Company Tennessee Valley Authority U.S. Department of Energy U.S. Army Corps of Engineers
Puerto Rico Aqueduct and Sewer Authority(monthly and annual operating reports)
Puerto Electric Power Authority
Virgin Islands Water and Power Authority
Puerto Electric Power Authority
Currently (1990) there are no hydroelectric power facilities located in the U.S. Virgin Islands
U.S. Geological Survey (interviews)South Carolina Power and Gas CompanyDuke Power CompanyCarolina Power and Light CompanySouth Carolina Public Service AuthorityRegal Textile CompanySpartanburg Water Company
Tennessee Valley Authority
1-17
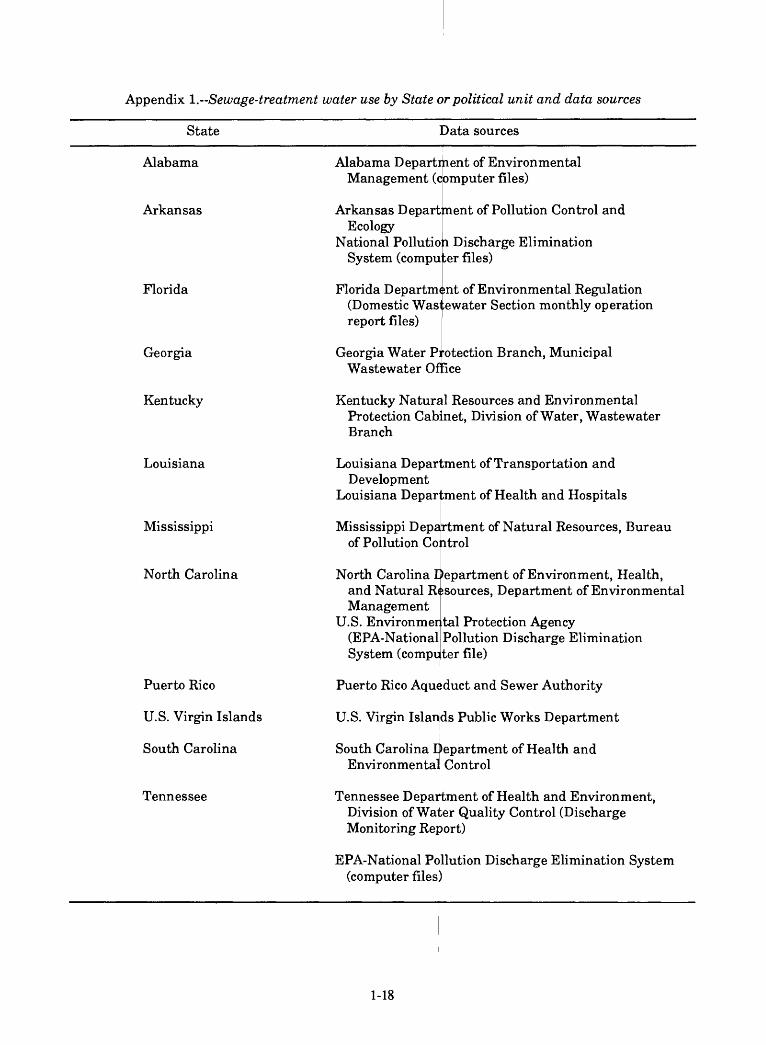
Appendix 1.--Sewage-treatment water use by State or political unit and data sources
State Data sources
Alabama
Arkansas
Florida
Georgia
Kentucky
Louisiana
Mississippi
North Carolina
Puerto Rico
U.S. Virgin Islands
South Carolina
Tennessee
Alabama Department of Environmental Management (computer files)
Arkansas Department of Pollution Control andEcology
National Pollution Discharge EliminationSystem (computer files)
Florida Department of Environmental Regulation (Domestic Wastewater Section monthly operation report files)
Georgia Water Protection Branch, Municipal Wastewater Of ice
Kentucky Natural Resources and Environmental Protection Cabinet, Division of Water, Wastewater Branch
Louisiana Department of Transportation andDevelopment
Louisiana Department of Health and Hospitals
Mississippi Department of Natural Resources, Bureau of Pollution Control
North Carolina Department of Environment, Health,and Natural Resources, Department of EnvironmentalManagement
U.S. Environmental Protection Agency(EPA-National Pollution Discharge EliminationSystem (computer file)
Puerto Rico Aqueduct and Sewer Authority
U.S. Virgin Islanjds Public Works Department
South Carolina Department of Health and Environmental Control
Tennessee Department of Health and Environment, Division of Water Quality Control (Discharge Monitoring Report)
EPA-National Pollution Discharge Elimination System (computer files)
1-18

Appendix 1.--Other miscellaneous categories of water use by State or political unit and data sources
State Data sources
AlabamaNavigation U.S. Army Corps of Engineers
Tennessee Valley Authority
Recreation/Preservation Alabama Department of Conservation(Parks and Recreation)
Tennessee Valley Authority U.S. Army Corps of Engineers
Florida St. Johns River Water Management District Miscellaneous Suwannee River Water Management District
Southwest Florida Water Management District South Florida Water Management District Northwest Florida Water Management District
(Consumptive Use Permit files and Compliance records)
1-19


Appendix 2
Tables representing coefficients and formulas used for estimating water use by water-use category

Appendix 2.~Daily water requirements for livestock in the southeastern United States, Puerto Rico, and the U.S. Virgin Islands
[--, no data reported; all values in gallons per day per head]
Livestock AL
Beef cattle 12Milk cows 35SteersSheepLambsGoatsHogs 12PigsHorsesMulesPoultry .05ChickensHensBroilersTurkeysDogsRabbits
AL-- AlabamaAR--ArkansasFL-FloridaGA-GeorgiaKY-KentuckyLA Louisiana
AR
1530 2-- --
.06
.04
.08--
FL
12
GA
7.915 28.7 2 22--
12 --
.10 1
.10
.05
.2.2
2.92.9--
.05 ------
KY
1265 1 6-
12
.10 «------
LA
1020 2--23--
1010--
.04
MS NC PR/VI
10 12 1220 40 35..- 2 2..
234 4..
12 1212
...04 .09 .06
..
...06 -- .18
..1
MS-MississippiNC--North CarolinaPR/VT-Puerto Rico and the U.S. VirginSC-South CarolinaTN~Tennessee
[slands
SC TN
12 1035 35122..24 5
512 1012
.05.08
..
.14..
2-2

Appendix 2.---Water-use coefficients used for estimating irrigation use in the southeastern United States,Puerto Rico, and the U.S. Virgin Islands
[**, site-specific data reported; --, no data reported; all values in inches per acre]
Crop type
CornSoybeansPeanutsPlant nurseriesRiceWheatSorghumMiloAlfalfa (coastal)Alfalfa (other)PastureHayCash grainsCottonVegetablesBerriesGrapesFruit treesSodIrish potatoesSweet potatoesCabbageCarrotsCucumbersPeppersTomatoesTruck cropsWatercressBlueberriesCitrusPeachesApplesPecansStrawberriesWatermelonsSugarcaneTobaccoFernsFlowers/FoliageOrnamentalsOrchardsImproved pastureTurf grassMiscellaneousAthletic fieldsGolf courses
AL AlabamaAR-- ArkansasFL-FloridaGA GeorgiaKY-KentuckyLA--Louisiana
AL
6666 -- ---- -------- ------ -- « -- ..-- -- -- --
AR****-- ********---- --************** ------ -- « -- .. -- ---- --
FL GA KY** ** 5** - 5** **
****** - 5** .. ............**..** ********** ******************** ** 4****** ******
26.926.9
LA
186
2442
18 ---- --6-- ------ ----
12 ..
18 6.. -- -
MS
16 49 -- ---- --16-- ------ -- .. .. .. .. --
NC
745 2-- 68282 4 -- 44-- -- 9 66 9._ 4 .. -- --
PR/VI SC TN**
..
._**
**.. ............** **
**........ _...._ ..
**..._....** ..
**
**
MS MississippiNC--North CarolinaPR/VI»Puerto Rico and the U.S. Virgin IslandsSC~South CarolinaTN-Tennessee
2-3

Appendix ^.--Formulas and coefficients used for estimating (self-supplied) domestic water use and consumptive use in the southeastern United States, Puerto Rico, and the U.S. Virgin Islands
[gal/d, gallon per day per person; *, County or hydrologic cataloging unit; --, no data reported; ft?, square foot]
State Water-use formula Consumptive-use coefficient
Alabama (County population) - (population served) x (75 gal/d)Arkansas (County population) - (population served) x (89 gal/d)Florida (County population) - (population served) x (75 gal/d)Georgia (County population) - (population served) x (75 gal/d)Kentucky (County population) - (population served) x (50 gal/d)Louisiana (County population) - (population served) x (80 gal/d)Mississippi (County population) - (population served) x (50 gal/d)N. Carolina (County population) - (population served) x (60 gal/d)Puerto Rico (County population) - (population served) x (40 gal/d)U.S.Virgin (number of nonserved housing unit per district) x
Islands (monthly rainfall by district) x (rainfall recovery rate
S. Carolina (County population) - (population served) x (75 gal/d)Tennessee (County population) - (population served) x (60-70
(Domestic water-use total *) x 1.00 (Domestic water-use total *) x 1.00 (Domestic water-use total *) x 1.00 (Domestic water-use total *) x 0.18 (Domestic water-use total *) x 0.57 (Domestic water-use total *) x 1.00 (Domestic water-use total *) x ~ (Domestic water-use total *) x 0.80 (Domestic water-use total *) x 1.00
(cistern-roof area 1,000 ft? per housing unit) x 0.70)
(Domestic consumptive use is not collected) (Domestic water-use total *) x 1.00
gal/d)(Domestic water-use total *) x 1.00
2-4

Appendix 3
Water-use data collection forms used in the southeastern United States, Puerto Rico, and the U.S. Virgin Islands
3-1

Geological Survey of Alabama 1n cooperation with the U.S. Geological Survey
1. Name of water supply system
2. Street address ________
520 19th Avenue Tuscalopsa, Alabama 35401
PUBLIC HATER SUPPLYWATER-USE UATA
1985
1)2)3)4)5)6)
tact person Phone
rce(s) a. Purchased fromb. Surface water namec. Ground water
WELL NAME 1(section.
Position
.OCATIOUtownship, range)
5. Monthly wlthdr
SOURCE a.b.c.d.e.f.
awals for each soi
JAN , FEB , MAR
jrce (;
APR
jpedfj
MAY
f unit
JUN
of met
JUL
1! iuremc
AUG
;nt). f
SEP
G/mont
OCT
h
NOV UEC
6. Monthly deliver
7. Indus trlal/comm
NAME
1es (amount sold to customers specify un
JAN FED MAR APR MAY JUN JUL
erclal customers (those purchasing more t
JAN FEB MAR APR MAY JUN JUL
It of measurement). M/G Month
AUG SEP OCT NOV DEC
lian 2,000 gallons per day).(Hundreds qallon) .
AUG SEP OCT NOV DEC
(continue on reverse if needed)
Alabama data collection fprm. 3-2

7. (continued)
NAME
JAN1
FEB MAR APR MAY JUN JUL AUG SEP OCT NOV DEC
8. Total number of customers or services during 1985:
INSTRUCTIONS
PUBLIC WATER SUPPLY
Question Numbers
1. Give the name of .your water system.
2. Give the street address of the plant Itself. If there 1s no precise address, give name of the nearest road or highway.
3. Give the name of an Individual who has access to water-use Information and could be called If questions arise or further Information 1s needed.
4. Give the source of your water supply. If purchased, give the name of the system sup plying you. If surface water, give the water bodies names (lake, river or stream). If ground water, 11st all active wells and their approximate locations (township, section and range; EX: SE^SEJ sec. 1, T. 2 S., R. 3 W. or highway directions to well).
5. Give the average amount of water withdrawn from each source each month during the calendar year 1985. Please give these figures 1n millions of gallons per month. If this Is not possible, be sure to state the units used.
9- Give the average amount of water delivered to customers each month during the calendar year. 1985. Please give these figures In millions of gallons per month. If this 1s not possible, Le sure to state the units used.
7. Give the name and address of your Industrlal/commerical customers who use more than 2,000 gallons per day. Also give their average monthly use. This Information will be kept strictly confidential.
\8. List the number of customers or services during 19.85. (EX: total number of customers
served = 1,000.)
Alabama data collection form. 3-3

TOMBIGSEE-3LACK WARRIOR WATER-USE DATA
1987
3ASIN
1. Name of water-supply system,
2. S tr aet adar 9ss. City_________ County,
3. Contact person Phone
4. Sourca(s) of uiater a. Purchased fron,12 Surface-ujater ic. 3rouna uj a t 3 r
HELL NA M E
State Zip C
__ Position ____
LOCATION
1)2)3)
6)
A.vsrags montniy or annual mi thcr auiais frorn escn source of (juster (clesse spacify unit of nsasursrnant)
SOURCE JAN FE3 MAY JUN JUL AUG OCT NCV DEC 19J w u f\ i_ ^
a .:J
C .
d .e .f . _
6. Location of seuuaga trsat^nent facii (Release poirt of u; a t e r (laker rive
J vj :> ^
itv
r / c^ee
u i_ ^ u o
k)
7. Average monthly or annual relaases of ujatjsr (please specify unit ofmeasure
JAN a .b.c .d .s .f .
m e n t )
FE3 *AR A^R MAY JUN JUL AUG SE? CCT NCV - ; rw 1 ^ 1957
Alabama data collection fdrm. 3-4

< WATER-USE HEGISTHATIOII FORM
1. Name of Facility __________________
2. Water-user Id. ____________________
3. Use of water: (check one)US - Public Supply Use ___ PF - Fossil Fuel Power CO - Commercial Use ___ PC - Geothermal Power IN - Industrial Use ___ PN - Nuclear Energy Power HI - Mining ___ PH - Hydroelectric Power
^. SIC Code (1) ________ (2)_________ (3)________
b. Permit* or PWiil________ 6. Telephone Number (__)_
7. Location of Facility: Latitude_________ Longitude_
8. Hydrologic Unit Code_______________
9. Address _ ____________________________________
10. City ___________________________________ 11. ZIP Code
« COMPLETE 12-18 FOR PUBLIC WATER SUPPLY FACILITIES OWLY
12. Total Ground 4 Surface Water withdrawals(MILLION GALS.)_________
13. Water Purchased From Other Facilities (Amount in MILLION GALS.):
Facility Name _______________________ Amount:________ Facility Name ______________________ Amount:________
Water Sold To Other Facilities (Amount in MILLION GALS.):
Facility Name _______________________ Amount:_ Facility Name ______________________ Amount:_
15. Water Used For Facility Maintenance (backflushing, plant operations losses due to seepage and leaks - MILLION GALS.)____________
16. Domestic Population Served ___________________________
17. Deliveries to Users (Do not include water sold to other facilities)
Water Furnished To; Total Water Delivered Number of Connections
Domestic Households ______________ ______________Commercial ______________ ______________Industrial _____________ _____________MiningAgriculture ______________ ______________Irrigation _____
18. Current Rate Structure:
(Name of Plant Manager) (Date) (County of Diversion)
Arkansas data collection form. 3-5
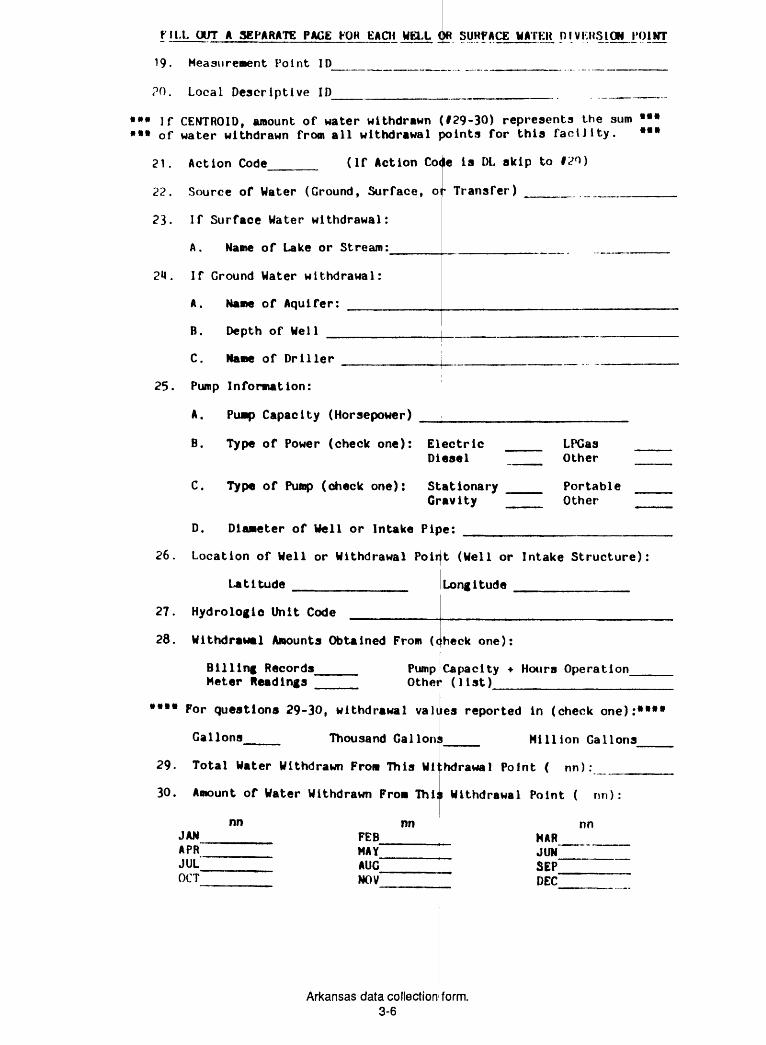
FILL OUT A SEPARATE PAGE FOR EACH WELL (« SURFACE WATER DIVKIISION I'OIWT
19. Measurement Point ID____________
?0. Local Descriptive ID__________
"« If CENTROID, amount of water withdrawn (129-30) represents the sum « « of water withdrawn from all withdrawal points for this faculty. * *
21. Action Code (If Action Code la DL skip to f?Q)
22. Source of Water (Ground, Surface, or Transfer)
23. If Surface Water withdrawal:
A. Name of Lake or Stream:____
24. If Ground Water withdrawal:
A. Nane of Aquifer: ________
B. Depth of Well __________
C. Nane of Driller _________
25. Pump Information:
A. Pump Capacity (Horsepower) __
B. Type of Power (check one): ElectricDiesel
C. Type of Pump (check one): StationaryGravity
D. Diameter of Well or Intake Pipe: ___
LPGas Other
Portable Other
26. Location of Well or Withdrawal Point (Well or Intake Structure):
Latitude
27. Hydroloflo Unit Code
28. Withdrawal Amounts Obtained From (check one):
Longitude
Billing Records^ Meter Readings
Pump Capacity + Hours Operation Other (list) _____ ____
** * For questions 29-30, withdrawal values reported in (check one):* 1*"
Gallons Thousand Gallons
29. Total Water Withdrawn From This Withdrawal Point ( nn):
30. Amount of Water Withdrawn From Thin Withdrawal Point ( nn):
nn nn nn
Million Gallons
JAM APR"
JUL OCT~
FEBMAY"AUG~MOV"
MAR JUNSEP" DEC"
Arkansas data collection form. 3-6

31. Generating Capacity
32. Annual Power I'l
Monthly Power Produced:
JAN_____ FtU_______ MAR_
APR________ MAY________ JUN_
JUL___ ____ AUG_________ SEP_
OCT Nt'tf DEC
Arkansas data collection form. 3-7
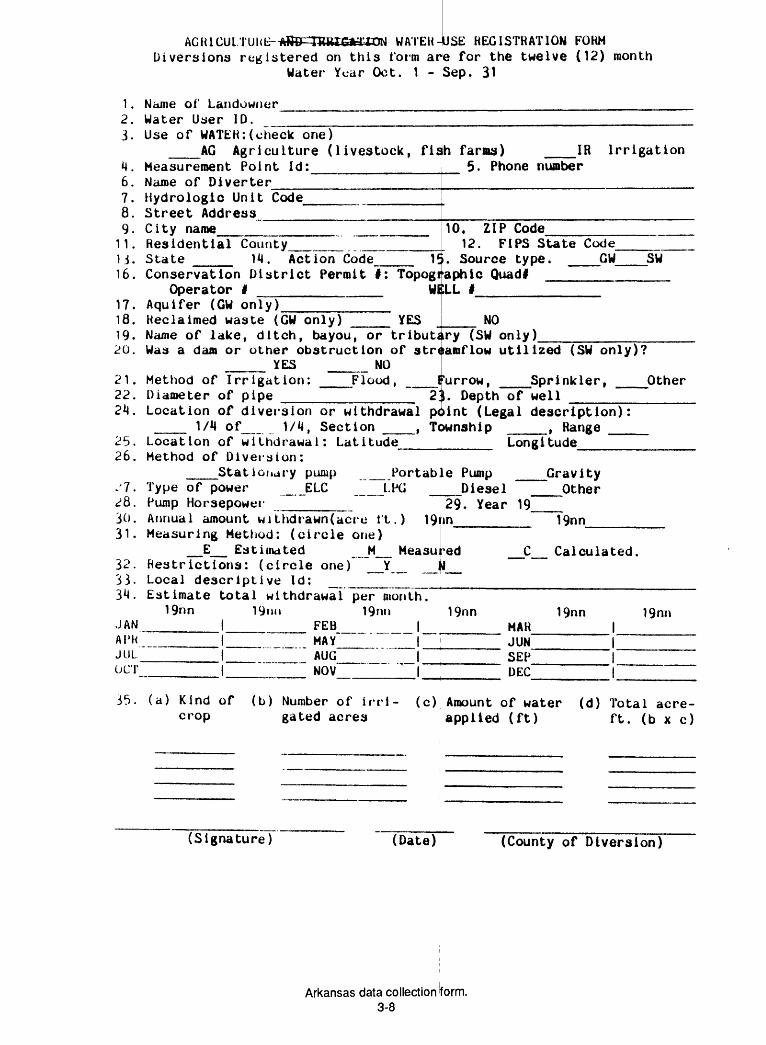
WATER-USE REGISTRATION FORMDiveraiona registered on thia form are for the twelve (12) month
Water Year Oct. 1 - Sep. 31
1.2.3.
4.6.7.8.9.
11, U. 16,
1718.19.20
2122
25.26.
.-'7.
28.30.31.
32.33.34.
JANAPR"
JUL OCT
Name of Landowner Water User ID.Use of WATER:(check one)__AC Agriculture (livestock, fiah farms) __IR
Measurement Point Id:_____________ 5. Phone number Name of Diverter
Irrigation
Hydrologic Unit Code_ Street Address____ City name__________Residential County_____ _____State 14. Action Code 1*>. Source type.Conservation District Permit I: Topographic Quad*
Operator I __________ WI1L IAquifer (GW only)________Reclaimed waste (GW only) YESName of lake, ditch, bayou, or tributary (SW only) Was a dam or other obstruction of stroamflow utilized (SW only)?
___ YES ___ NO_Flood, ___Furrow, __Sprinkler, OtherMethod of Irrigation:
Diameter of pipe ____
10. ZIP Code______ 12. FIPS State Code
GW SW
NO
2:). Depth of wellLocation of diversion or withdrawal point (Legal description): __ 1/4 of_ 1/4, Section __, Township ___, Range __Location of withdrawal: Latitude_________ Method of Diversion:
___Stationary pump _ Portable Pump Type of power ELC LHG Diesel
Longitude
Gravity Other
Pump HorsepowerAnnual amount withdrawn(acre ft.) Measuring Method: (circle one)
_E_ Estimated M_ Measured Restrictions: (circle one) _Y Local descriptive Id: ___
29. Year 19_ 19nn___ 19nn
C Calculated.
Estimate total withdrawal per month.19nn 19nu 19nn
_______I________ FEB __ __|_._____I__. __ MAY"__"" _j________I___ _ __ AUG__ _ _J_ _______I " ~ NOV " ' I
19nn 19nn 19nnMAR JUN"SEP" DEC"
35. (a) Kind of crop
(b) Number of irri gated acres
(c) Amount of water applied (ft)
(d) Total acre- ft. (b x c)
(Signature) (Date) (County of Diversion)
Arkansas data collection form. 3-8
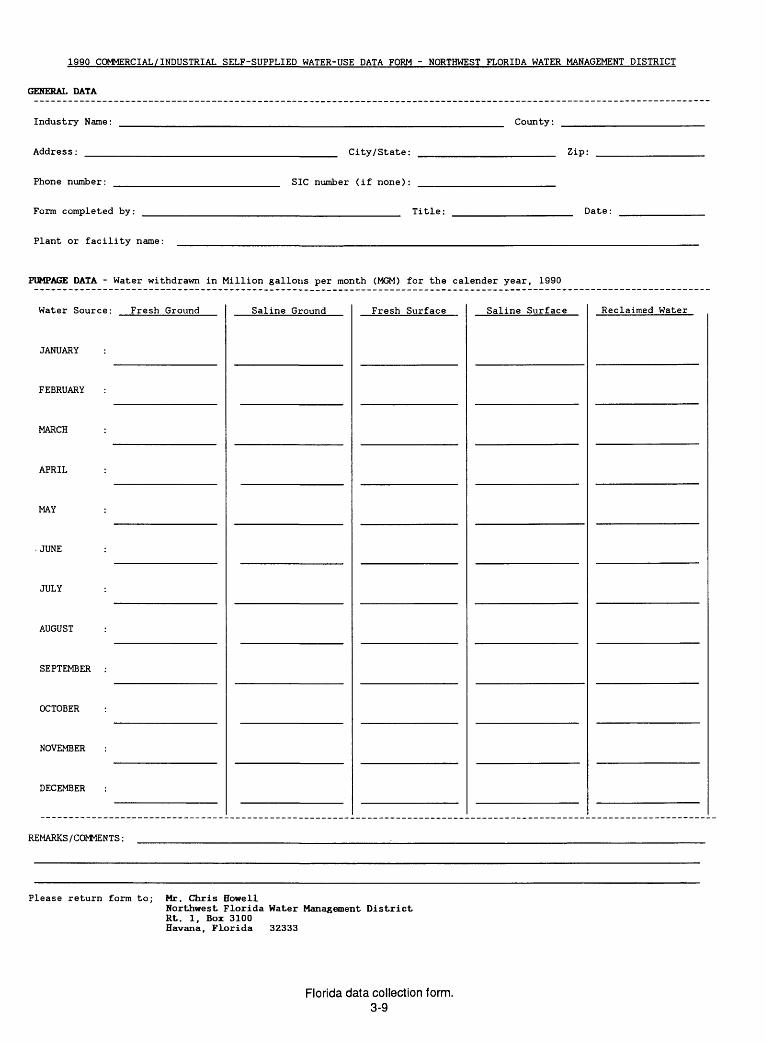
1990 COMMERCIAL/INDUSTRIAL SELF-SUPPLIED WATER-USE DATA FORM - NORTHWEST FLORIDA WATER MANAGEMENT DISTRICT
GENERAL DATA
Industry Name: _____________________________________________________ County: ________________
Address: ___________________________________ City/State: ___________________ Zip: __
Phone number: _______________________ SIC number (if none): ___________________
Form completed by: ____________________________________ Title: ________________ Date:
Plant or facility name: ____________________________________________________________
PUMPAGE DATA - Water withdrawn in Million gallons per month (MGM) for the calender year, 1990
Water Source: Fresh Ground
JANUARY :
FEBRUARY :
MARCH :
APRIL :
MAY :
. JUNE :
JULY :
AUGUST :
SEPTEMBER :
OCTOBER :
NOVEMBER :
DECEMBER :
REMARKS /COMMENTS :
Saline Ground Fresh Surface Saline Surface Reclaimed Water
Please return form to; Mr. Chris HowellNorthwest Florida Water Management District Rt. 1, Box 3100 Havana, Florida 32333
Florida data collection form. 3-9
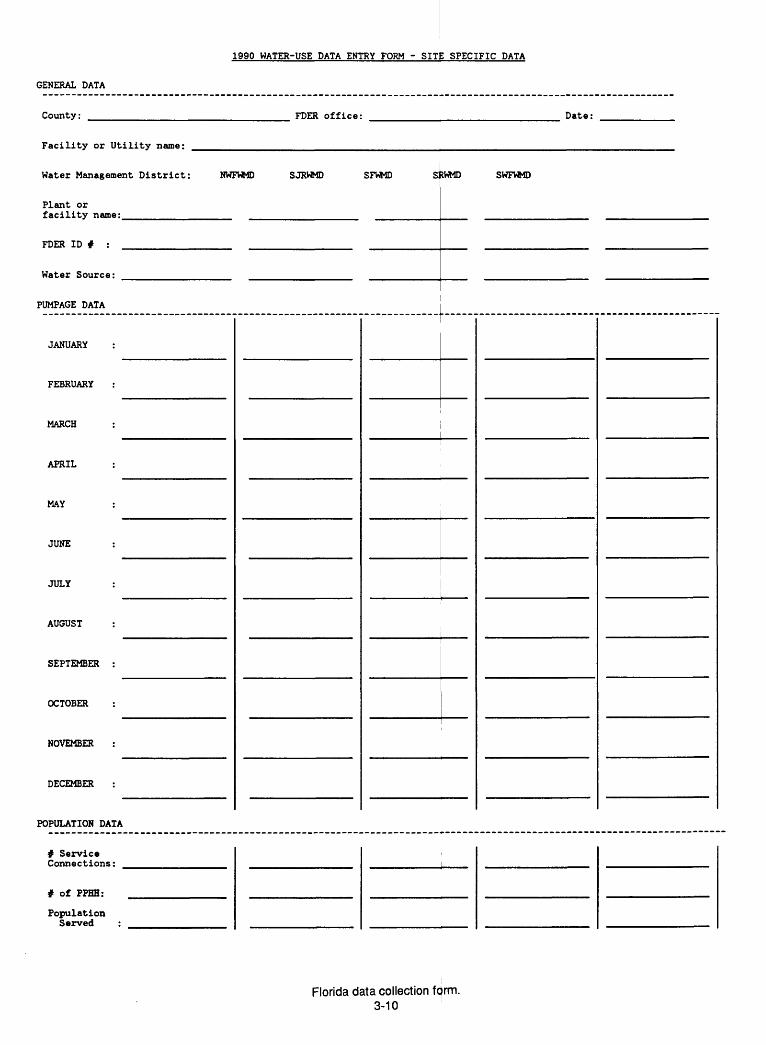
1990 WATER-USE DATA ENTRY FORM - SITE SPECIFIC DATA
GENERAL DATA
County: __ FDER office: Date:
Facility or Utility name:
Plant or facility name:
FDER ID # :
Water Source:
PUMPAGE DATA
nt District: NWFWMD SJRWMD SFWMD SRWMD SWFWMD
JANUARY
FEBRUARY
MARCH
APRIL
MAY
JUNE
JULY
AUGUST
SEPTEMBER
OCTOBER
NOVEMBER :
DECEMBER
POPULATION DATA
£ Service Connections:
* of PPHH:
Population Served
Florida data collection f0rm. 3-10

SU
WA
NN
EE
R
IVE
R
WA
TE
R
MA
NA
GE
ME
NT
D
IST
RIC
T
CO
UN
TY
:
EX
TE
NS
ION
O
FF
ICE
:
MAILING
ADDRESS:
19
90
Ir
rig
ate
d A
cre
ag
e/W
ate
r U
se
S
urv
ey
CONT
ACT
PERS
ON:
PHO
NE:
CITY
:Z
IP:
Ple
ase
fill
In
th
e ap
pro
pri
ate
cate
go
ries
fo
r th
e c
ale
nd
ar
ye
ar:
1990
CROP
VEGETABLE
CROPS:
Cabb
ages
Cucumbers
String Be
ans
Pepp
ers
Potatoes
Toma
toes
(S
prin
g)To
mato
es (F
all)
Sweet
Corn
Misc.
Vege
tabl
es
FRUI
T JCROPS:
Blueberries
Grac
esPeaches
Pecans
Stra
wber
ries
Wate
rmel
ons
Misc
. Fruit
PAST
URE
& GRASSES:
Improved Pasture
Sod
Turf
(G
olf
Courses)
GROW
ING
SEASON
(Mon
th)
to (M
onth
)
- - - _ _ _ - - - - _ _ - - - -
IRRIGATED
ACRES
IRRIGATED
A(Sp
rink
ler:R
ES B
Y SYSTEM
Drip
Flood
WATER
SOUR
CE (*)
Surf
ace
Ground
Flor
ida da
ta col
lect
ion fo
rm
\UVer /
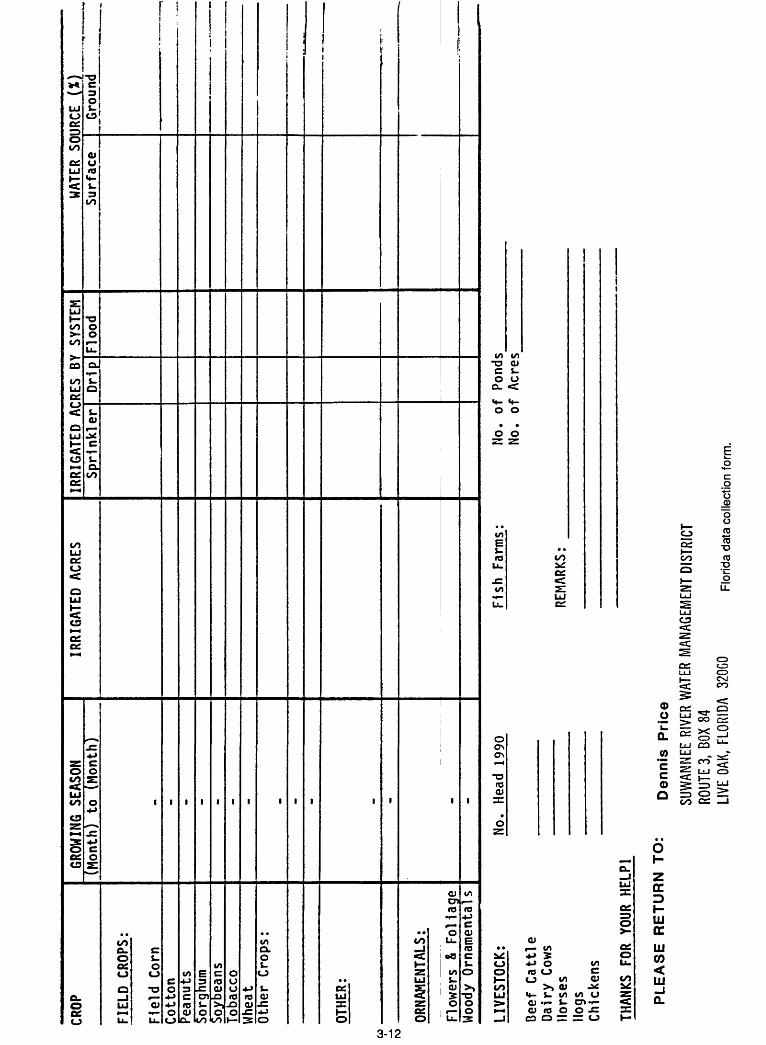
CROP
FIELD
CROP
S:
Field
Corn
Cotton
Peanuts
Sorg
hum
Soybeans
Toba
cco
Whea
tOt
her
Crop
s:
OTHER:
ORNAMENTALS:
Flow
ers
& Fo
liag
eWoody
Ornamentals
GROW
ING
SEAS
ON(M
onth
) to (M
onth
)
- - - - - - - - - - -
IRRIGATED
ACRE
SIRRIGATED
ACRE
S BY
SYS
TEM
Sprinkler
Drip
Flood
WATER
SOUR
CE (%)
Surf
ace
Grou
nd
LIV
ES
TOC
K;
Bee
f C
attle
D
airy
Cow
s H
orse
s H
ogs
Chi
cken
s
THAN
KS
FOR
YOUR
HE
LP1
PLE
AS
E
RE
TU
RN
TO
:No.
H
ead
1990
Fis
h
Farm
s
REM
ARKS
:
No.
of
Pon
ds
No.
o
f A
cres
De
nn
is P
rice
SUW
ANNE
E RI
VER
WAT
ER M
ANAG
EMEN
T DI
STRI
CTRO
UTE
3, B
OX 8
4LI
VE O
AK,
FLO
RIDA
32
0GO
Flor
ida
data
col
lect
ion
form
.

NORT
HWES
T FL
ORID
A WATER
MANAGEMENT DISTRICT
1990 WATER USE SURVEY
COMPANY
NAME:
CONTACT
PERS
ON:
PHON
E:
MAILING
ADDRESS:
CITY:
ZIP:
COUN
TY OF
OPERATION:
Please fill in the
appropriate
cate
gori
es for
1985:
CROP
VEGETABLE
CROPS:
Cabbages
Cucu
mber
sStri
ng Be
ans
Pepp
ers
Potatoes
Toma
toes
(Spring)
Tomatoes TFallT
Swee
t Co
rnMisc
. Vegetables
FRUI
T CROP
S:
Blue
berr
ies
Grapes
Peac
hes
Peca
nsSt
rawberries
Watermelons
Misc.
Fruit
PAST
URE
& GRASSES:
Impr
oved
Pa
stur
eSod
Turf
(L
awns
, Golf
Courses)
GROW
ING
SEAS
ON(M
onth
) to (M
onth
)
- - - _ _ - - - - - - _ - - - -
IRRIGATED
ACRES
IRRIGATED
ACRES
BY SYSTEM
Spri
nkle
rDr
ipFl
ood
WATER
SOURCE (%)
Surf
ace
Ground
Flnriria ria
ta rnl
lent
inn fo
rm
^Uverj

CROP
FIEL
D CROPS:
Field
Corn
Cotton
Peanuts
Sorg
hum
Soybeans
Toba
cco
Wheat
Othe
r Crops:
OTHE
R:
CO ^ ORNA
MENT
ALS:
Flow
ers
& Foliage
Woody
Orna
ment
al s
GROWING
SEAS
ON(Month)
to (Month)
- - - - - - ^ - - - mf -
IRRIGATED
ACRE
SIR
RIGA
TED
ACRE
S BY SY
STEM
Spri
nkle
rDrip^Fl
ood
WATER
SOURCE (%
)Su
rfac
eGr
ound
LIVE
STOCK;
Beef
Cattl
e Da
iry
Cows
Horses
Hogs
Chickens
THANKS
FO
R YO
UR HELP!
No.
Head 19
90Fish Farms
REMARKS:
No.
of Ponds
No.
of A
cres
Flor
ida
data
col
lect
ion
form
.

CO
1986
IN
ST
ITU
TIO
N-R
EC
RE
AT
ION
W
AT
ER
U
SE
D
AT
A
FA
CIL
ITY
N
AM
E___________________________________________
AD
DR
ES
S_
__
__
__
__
__
__
__
__
__
__
__
__
__
__
__
__
__
CIT
Y_
__
__
__
__
__
__
__
ZIP
.
CO
UN
TY
__
__
__
__
__
__
__
__
__
__
__
__
__
__
__
BA
SIN
_________________________
MA
NA
GE
R / S
UP
ER
INT
EN
DE
NT
__
__
__
__
__
__
__
__
__
__
__
__
__
__
__
_T
EL
EP
HO
NE
.
1986
PO
PU
LAT
ION
S
ER
VE
D_
__
__
__
__
__
_
Ple
ase
fill in
the
appro
pria
te c
ate
go
ry b
elow
for
1986
gro
ss w
ithdr
awal
s?
A)
FR
ES
H
GR
OU
ND
W
ATE
R
WIT
HD
RA
WN
IN
M
ILL
ION
G
ALL
ON
S
PE
R
MO
NT
H
(MG
M)
JA
N_
__
__
__
_F
EB
__
__
__
__
MA
R_
__
__
__
_A
PR
__
__
__
__
MA
Y_
__
__
__
_JU
N_
_
JU
I__
__
__
__
_ A
UG
__
__
__
__
SE
P_
__
__
__
_O
CT
__
__
__
__
NO
V_
__
__
__
_D
EC
__
B)
* S
ALI
NE
G
RO
UN
D
WA
TER
W
ITH
DR
AW
N
(MG
M)
JA
N_
__
__
__
_F
EB
__
__
__
__
MA
R_
__
__
__
_A
PR
__
__
__
__
MA
Y_
__
__
__
_JU
N_
_
JU
I__
__
__
__
_A
UG
__
__
__
__
SE
P_
__
__
__
_O
CT
__
__
__
__
NO
V_
__
__
__
_D
EC
__
C)
FRE
SH
S
UR
FA
CE
W
AT
ER
W
ITH
DR
AW
N
(MG
M)
JA
N_
__
__
__
_F
EB
__
__
__
__
MA
R_
__
__
__
_A
PR
__
__
__
__
MA
Y_
__
__
__
_JU
N_
_
JU
I__
__
__
__
_A
UG
__
__
__
__
SE
P_
__
__
__
_O
CT
__
__
__
__
NO
V_
__
__
__
_D
EC
__
FOR
M
CO
MP
LET
ED
B
Y__________________________________D
AT
E____________
RE
MA
RK
S_
__
__
__
__
__
__
__
__
__
__
__
__
__
__
__
__
__
__
__
__
__
__
__
__
__
__
__
__
__
_
* W
ATE
R
WIT
H O
VE
R t
OO
O P
PM
OR
TR
EA
TED
BY
R/O
P
LA
NT
IS
CO
NS
IDE
RE
D
GR
OU
ND
S
ALI
NE
.
Flo
rida
data
col
lect
ion
form
.

US6S - HATER MANAGEMENT DISTRICT
PUBLIC / DOMESTIC WITHDRAWALS
COUNTY :
HATER SOURCE :
SOURCE ID I : PUMPAGE DATA -
JANUARY :
FEBRUARY :
MARCH :
APRIL :
MAY :
JUNE :
JULY :
AUGUST :
SEPTEMBER !
OCTOBER :
NOVEMBER :
DECEMBER :
POPULATION DATA
1985 WATER USE DATA ENTRY FORM
POPULATION IN HMD : OWNER ID!
PUBLIC WATER WITHDRAWALS (MS)
FRESH GROUND SURFACE GROUND
SALINE (R/0)SURFACE
POPULATION SERVED BY PUBLIC SUPPLY :
PERCAPITA : __________
DOMESTIC WATER USE (MGD) :
DOMES 1C POPULATION :
DOMESTIC (PUBLIC SUPPLIED) WASTE WATER IN MGD :
PERCENT OF USE = 1002 RESIDENTIAL = COMMERCIAL * INDUSTRIAL = WATER UTILITY= OTHER
NUM. OF FACILITIES :
Florida data collection fcjrm. 3-16
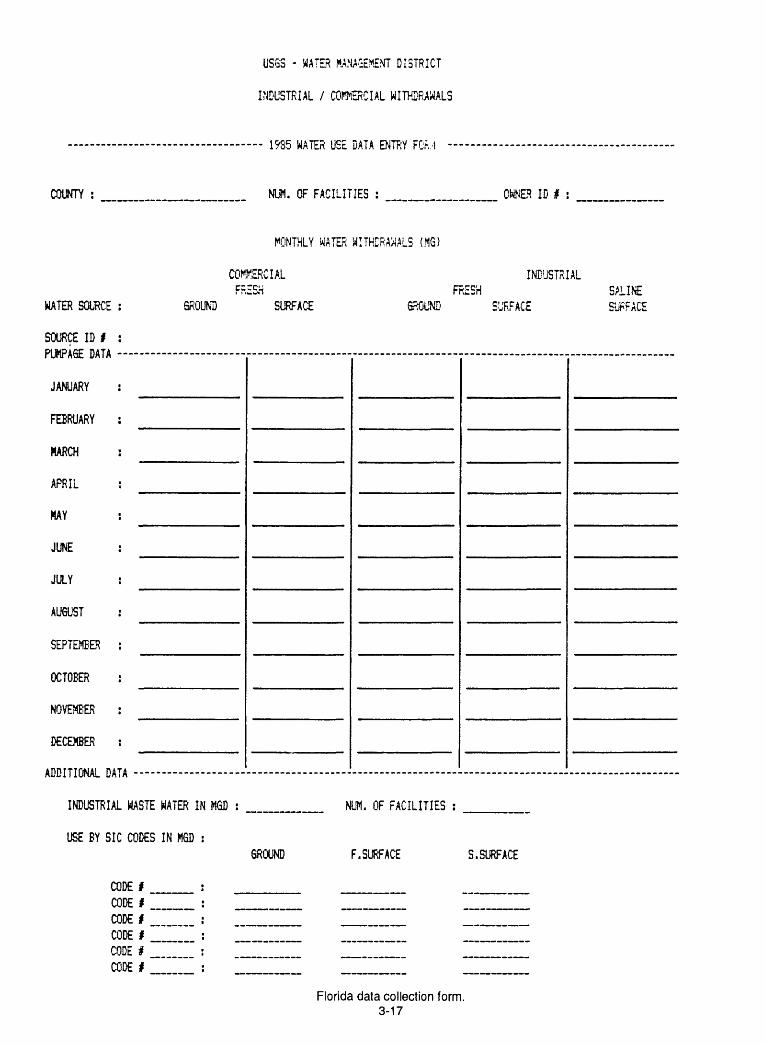
USGS - WATER MANAGEMENT DISTRICT
INDUSTRIAL / CQfliERCIAL WITHDRAWALS
1935 WATER USE DATA ENTRY FCr.,1
COUNTY : NUM. OF FACILITIES : ID I :
MONTHLY yiATER WITHDRAWALS (MG)
COMMERCIAL INDUSTRIALF=
WATER SOURCE : GROUND
SOURCE IDI : PUHPA6E DATA - -
JANUARY :
FEBRUARY :
MARCH :
APRIL :
MAY :
JUNE :
JULY :
AUGUST :
SEPTEMBER :
OCTOBER :
NOVEMBER :
DECKER :
AnnmnMdi FUTA . ...
ESH SURFACE
FGROUND
ESH SURFACE
SALINE SURFACE
INDUSTRIAL WASTE HATER IN MGD :
USE BY SIC CODES IN MGD :
CODE I CODE I CODE I CODE I CODE # CODE I
GROUND
I. OF FACILITIES :
F.SURFACE S.SURFACE
Florida data collection form. 3-17

USGS - WATER MANAGEMENT DISTRICT
THERMOELECTRIC WITHDRAWS
COUNTY :
WATER SOURCE :
SOURCE ID I : fWASE DATA -
JANUARY :
FEBRUARY :
MARCH :
APRIL
HAY
JUNE :
JULY :
AUGUST :
SEPTEMBER :
OCTOBER :
NOVEMBER :
DECEMBER :
ADDITIONAL DATA
FACILITY DATA
FOSSIL FUEL GEOTHERMAL NUCLEAR HYDRO-ELEC.
1985 WATER USE DATA ENTRY FORM
NUM. OF FACILITIES :
POWER WATER WITHDRAWALS (MG)
FRESH GROUND SURFACE GROUND
OWNER ID I
SALINESURFACE
POWER PRO. 6WH
GROUND MGD
F.SURfACE MGD
S.SURFACE MGD
PERCENT OF USE = 100% DOMESTIC COOLING HATER UTILITY= OTHER
Florida data collection form. 3-18

SYSTEM NAME:
COUNTY:
AMOUNT OF WATER USED BY SYSTEM: ANNUALLY (MOD OR GALLONS)
IS SYSTEM METER ED OR NONMETERED?
POPULATION SERVED BY WATER SYSTEM OR NUMBER OF CONNECTIONS/METERS:
WATER SOURCE GROUND-WATbK OR SURFACE-WATER
CONTACT NAME:
POSITION:
PHONE NUMBER:
BE SURE TO SAYTHANK-YOU!!!!!!!
Georgia data collection form. 3-19

DEP7005 COMMONWEALTH OF KENTUCKY NATURAL RESOURCES AND ENVIRONMENTAL PROTECTION CABINET
DEPARTMENT FOR ENVIRONMENTAL PROTECTIONDIVISION OF WATER
FRANKFORT, KENTUCKY 40601
APPLICATION FOR WATER WITHDRAWAL PERMIT(Type or Print Clearly)
New application Application to revise permit (permit no.
I. FACILITY INFORMATION
Name of business, municipality, company, etc., requesting permit
Street address of facility City
Facility Site:County
Major Products or Services (list below):
Standard Industrial Classification (SIC) Code:
Average Annual Production:
Sfafe Zip Code
Latitude Longitude
(If known)
units
units
II. WATER WITHDRAWAL INFORMATION
Requested withdrawal amounts (average gallons per day)
Jan. ___________ Apr. ___________ July _
Feb.___________ May___________ Aug,
Mar. __________ June__________ Sepl
Raw Water Storage Capability (number, type and capacity)
Oct.
Nov.
Dec.
Attach a USGS 7 1/2 minute quadrangle map for this site with the following information marked:
a. Surface intake facilities or wellsb. Raw water storage facilitiesc. Pumping plant(s)
d. Water treatment plant(s)e. Waste water discharge sitef. Dams and reservoirs
USGS maps can be obtained from the Kentucky Commerce Cabinet, Map Sales Office, 133 Holmes Street, Frankfort, Kentucky 40601. Phone: (502) 564-4715-
Kentucky data collection 3-20
form.

IF WITHDRAWAL IS FROM A GROUND WATER SOURCE, COMPLETE SECTION A IF WITHDRAWAL IS FROM A SURFACE WATER SOURCE, COMPLETE SECTION B
A. Ground Water Withdrawal
Number of wells Average depth Drawdown
Location of well or well field: _______County
Maximum sustained yield
Latitude Longitude
B. Surface Water Withdrawal
Name of surface stream or spring
Location of intake site:County
If Surface Withdrawal Is From An Impoundment:
Latitude Longitude
Impor ". ment Name
Impoundment Owner
Approximate Volume
Address
Attach documentation of owner's consent to the proposed withdrawal, if applicable.
WATER RETURN
Name of stream or spring receiving discharge
Location of discharge site:County Latitude Longitude
Average amount of water returned (gallons per day)
Method used to estimate discharge rate
Discharge Permit Number(s)
Kentucky data collection form. 3-21

KENTUCKY 1)1 VISION OF WATEKWATER WITHDRAWAL PERMITTING SUMMARY
The Water Withdrawal Permit Program is in the Division of Water, Water Resources Branch, Water Quantity Section. Contact: Dionne Fields (502/564-3410).
Permit Required (no fee) -- KRS 151.140All withdrawals, diversions or transfers of any surface, ground, or spring water averaging more
than 10,000 gpd must be permitted, in most cases regardless of the purpose for which the water is used. This requirement applies even if the land surrounding the water source is privately owned (including underground reservoirs, irrigation, storage, or sediment impoundments). In addition to the traditional uses of drinking water and industrial process water, this includes such diverse uses as deep mine and quarry dewatering operations, golf course withdrawals for irrigation, trout farms, artificial water falls, coal prep plant recycling ponds, etc.
Exemptions: no permit is required for1. domestic purposes (needs for one household);2. withdrawal, transfer or diversion of 10,000 averagd gpd or less (401 KAR 4:010):
except: permits may be required for withdrawals of less than 10,000 gpd where the Division determines that the water withdrawn represents a [significant portion of the available water supply or that collection of withdrawal data is necessary for water resource planning purposes;
3. agricultural withdrawals including irrigationexcept: the agricultural exemption does not include withdrawals from impoundments -- agricultural users must have permits to withdraw more than an average of 10,000 gpd if the water is impounded (KRS 151.210);
4. water used in the production of electricity by steEim generating plants of companies whose retail rates are regulated by the KY Public Service Commission or for which plants a certificate of environmental compatibility from su<:;h commission is required by law; or
5. injection underground in conjunction with operations for the production of oil and gas.
Application Required (no fee) -- KRS 151.150All persons wishing to withdraw public water must register with the Division and submit a permit
application. Withdrawal without a permit is subject to penalties provided in KRS 151.990.Temporary or emergency: All persons wishing to withdraw public water on a temporary or
emergency basis must first notify the Department, and commencement of such withdrawals.
obtain agency authorization prior to
Reporting Required -- KRS 151.160All permittees must record their use and report it to the Department (daily average withdrawals
recorded monthly and reported to the Divison semi-annually, 401 KAR 4:010). Additional recording and reporting of withdrawals, groundwater levels, and/or stream flows may be required on a case by case basis. Failure to report.may result in revocation of the permit.
Public Water Defined -- KRS 151.120"Water occurring in any stream, lake, groundwater, subterranean water or other body of water in
the Commonwealth which may be applied to any useful and beneficial purpose is hereby declared to be a natural resource and public water of the Commonwealth and subject to control or regulation for the public welfare..."
Kentucky data collection f brm. 3-22

MULTIPLE GROUNDWATER WITHDRAWALS
This chart is to be completed if application is for multiple withdrawal sources. Please list in the chart all groundwater sources of withdrawal currently on the property including active, inactive, abandoned, dry and
unused wells. Do not include wells which are permanently sealed or plugged.On the topographic map requested in Part II of the regular permit application form, show locations of all wells
on the property, indicating status of each well, whether proposed, existing, inactive, or abandoned. Include any
wells proposed for groundwater monitoring and recharge, if applicable. If any existing withdrawal wells are
already permitted, please indicate permit number.
, Well ID#
Existing? (E) or
Proposed? (P)
Well Diameter
Well Depth
Casing Depth
Screened Interval
Screen Diameter
Pump Type & Location
Pump Capacity
Status*
Average Daily W/D
Maximum Daily W/D
Metered? Y/N & Type
Beginning W/D Date
Use
Well surface elevation
Static water level
Log Available?
Method of Drilling
Well Develop. , Method
EXAMPLE
E
6"
120'
80'
80- 100'
24"
submersible
100 gpm
Active
100,000 gal
120,000 gal
Yes Johnson
6/1/81
heat/cool
650'
60'
Yes
Driven
surging
1
J*Status: A= Active; B = Abandoned; C = Capped; D = Dry F = FMted?
I = Inactive; P = Plugged. (Choose one or more)
Kentucky data collection form. 3-23

Commonwealth of Ken tuckyNatural Resources and Environmental Protection Cabinet
Department for Environmental ProtectionDivision of Water
18 Reilly Road Frankfort, Kentucky 40601
GROUNDWATER WITHDRAWAL SUPPLEMENT
If the proposed withdrawal is from a groundwater source
return it to the Division of Water, along with the regular perrr i
WITHDRAWAL METHOD
Is the proposed withdrawal source a well? [ ] Yes. [
, please complete this supplement, and
t application form.
] No. If yes, answer the questions below. If
no, attach a detailed description of the method of withdrawal; including size, equipment used, method of
operation, and purpose. If permit will be for multiple wells, use chart on reverse side.
(a) Well number: ______
(b) Well diameter:
(c)
(d) ______
(feet), to:
Depth of casing: Total well depth:
Length of wel I screen :
(e) Interval screened from: (feet), depth
(f) Screen diameter: and slot size:
(g) Pump power rating:
(h) Pump type and location (surface, submerged, etc.):
(i) Surface elevation of well:
(j) Static water level:
DRAWDOWN TEST-INCLUDE THE FOLLOWING:
(a) Date of test:
(b) Discharge in GPM: ______
(c) Static water level before pumping:
(d) Test method: pump
(e) Drawdown:
, bailer
feet, after
Pumping at GPM
(f) Method of calculating drawdown:
other
houfs
(g) Type of water level measuring device used:
LOCATION
On the USGS topographic map requested in Part II 0f the regular permit application, show
locations of all wells on the property, indicating status of each well, whether proposed, existing, inactive,
or abandoned. Include any wells proposed for groundwater monitoring and recharge, if applicable. If
any existing withdrawal wells are already permitted, please indicate permit number.
Kentucky data collection 3-24
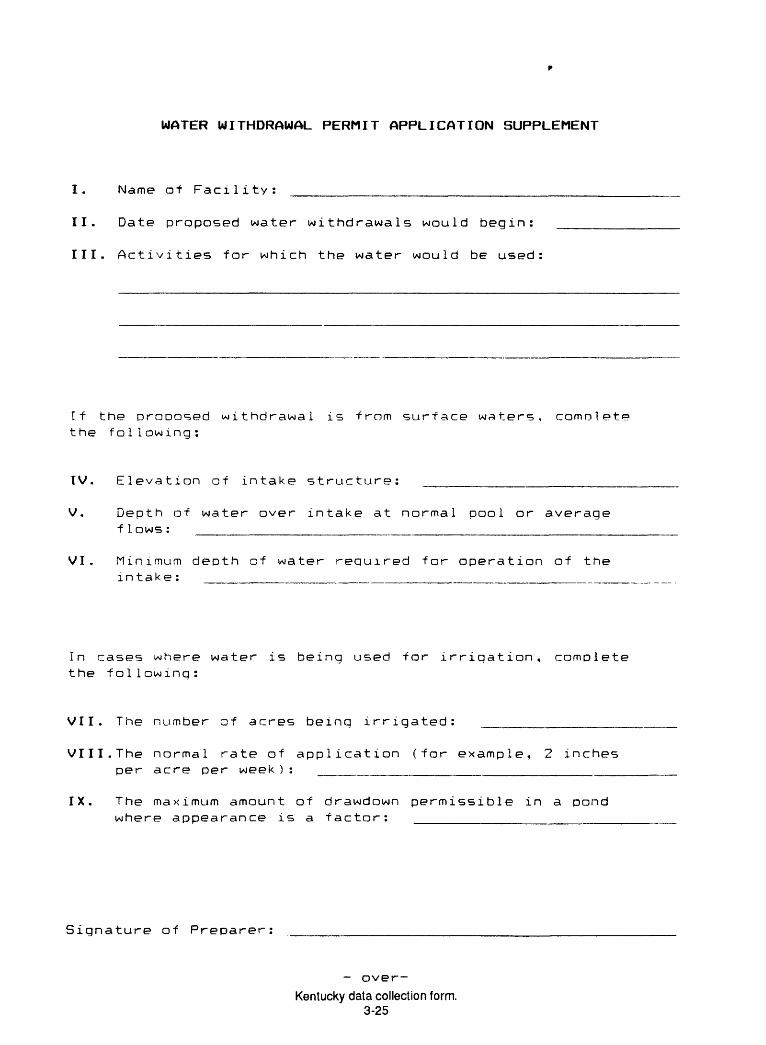
WATER WITHDRAWAL PERMIT APPLICATION SUPPLEMENT
I. Name of Facility:
II. Date proposed water withdrawals would begin:
III. Activities for which the water would be used
If the proposed withdrawal is from surface waters, comnlete the foil owing:
IV. Elevation of intake structure:
V. Depth of water over intake at normal pool or average flows: _______________________________________________________
VI. Minimum depth of water required for operation of the intake:
In cases where water is being used for irrigation, complete the foilowinq:
VII. The number of acres being irrigated:
VIII.The normal rate of application (for example, 2 inches per acre per week ) : _____________________________________________
IX. The maximum amount of drawdown permissible in a pond where appearance is a factor: ______________________________
Signature of Preparer:
- over
Kentucky data collection form. 3-25

X. In the area below, draw and label a sketch map of the proposed water intake(s) and transfer of water at the faci1ity.Include the following:(a) location of ail surface and ground water supplies
and intake sites:(b)' c ) d ) < e i
location of pumps and meterir course and direction of flowcourse and amount of water be»ing recycled: location of the discharge site(s).
g devices:through the facility
10/89
Kentucky data collection 3-26
form.
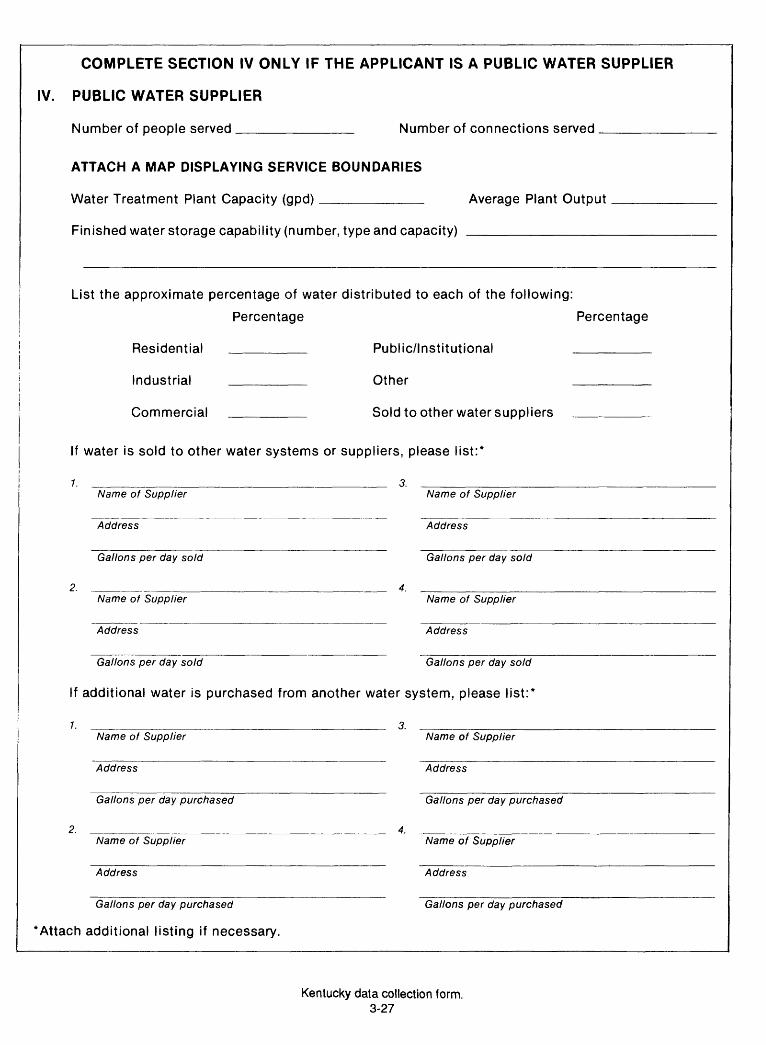
COMPLETE SECTION IV ONLY IF THE APPLICANT IS A PUBLIC WATER SUPPLIER
IV. PUBLIC WATER SUPPLIER
Number of people served __________ Number of connections served _______
ATTACH A MAP DISPLAYING SERVICE BOUNDARIES
Water Treatment Plant Capacity (gpd) _________ Average Plant Output _____
Finished water storage capability (number, type and capacity) ______________________
List the approximate percentage of water distributed to each of the following:
Percentage Percentage
Residential ________ Public/Institutional _______
Industrial _______ Other _______
Commercial __________ Sold to other water suppliers _________
If water is sold to other water systems or suppliers, please list:*
Name of Supplier Name of Supplier
Address Address
Gallons per day sold Gallons per day sold
2. _____.____________________________ 4. ____________Name of Supplier Name of Supplier
Address Address
Gallons per day sold Gallons per day sold
If additional water is purchased from another water system, please list:*
3.Name of Supplier Name of Supplier
Address Address
Gallons per day purchased Gallons per day purchased
2. _______________________________ 4. ________________Name of Supplier Name of Supplier
Address Address
Gallons per day purchased Gallons per day purchased
*Attach additional listing if necessary.
Kentucky data collection form. 3-27

V. REPORTING OF ACTUAL WATER WITHDRAWAL
KRS 151.160 requires that permit holders report actual water withdrawals to the Department. At present, special forms are sent to permit holders in January and July for reporting withdrawals for the previous six months.
Please provide the name and address of the contact withdrawals to the Department and to whom the special
Contact Person Title
person to be in charge of reporting actual report forms are to be sent.
Address
Telephone
How will withdrawal rates be measured? Metered Calculated Estimated
If calculated or estimated, describe method used:
Anticipated accuracy of withdrawal rate measurement (check one)
Excellent (within 5% of actual rate)
Good(accurate within 5-70% of
actual rate)
Fair(accurate within 10-25% of
actual rate)
Poor(contains more than 25%
error)
Name of person preparing application
Title
Signature
If application is prepared by a consultant or other person independent pany, etc., requesting permit, please provide contact informat
Date
of the business, municipality, corn- on below:
Name of consulting company or other entity
Address
Telephone
If approved, who do you wish the permit be mailed to:Your Client
Kentucky data collection form. 3-28

WATER SUPPLY SURVEY
MUNICIPAL USERS
The attached questionnaire is part of a study of water supplies in Eastern Kentucky, beingconducted by the Kentucky Division of Water in cooperation with the U.S. Geological Survey. The
purpose is to better serve the water users of Kentucky, including this facility. You will probably notbe able to provide all of the information requested. Please provide as much and as accurate
information as you can. Your cooperation is appreciated. Please return to the following address bySeptember 10, 1985:
Mail to: Pamla Wood, Program DevelopmentKentucky Divison of Water
Fort Boone Plaza , 19 Reilly RoadFrankfort, Kentucky 40601
Please return completed questionnaire by September 10.Your cooperation is appreciated.
If you have questions, call 502-564-3410 extension 406 (Pamla Wood).
Note: You are welcome to use additional paper as necessary.
You may not be able to answer all of the questions. Please provide the best information you have.
Kentucky data collection form. 3-29
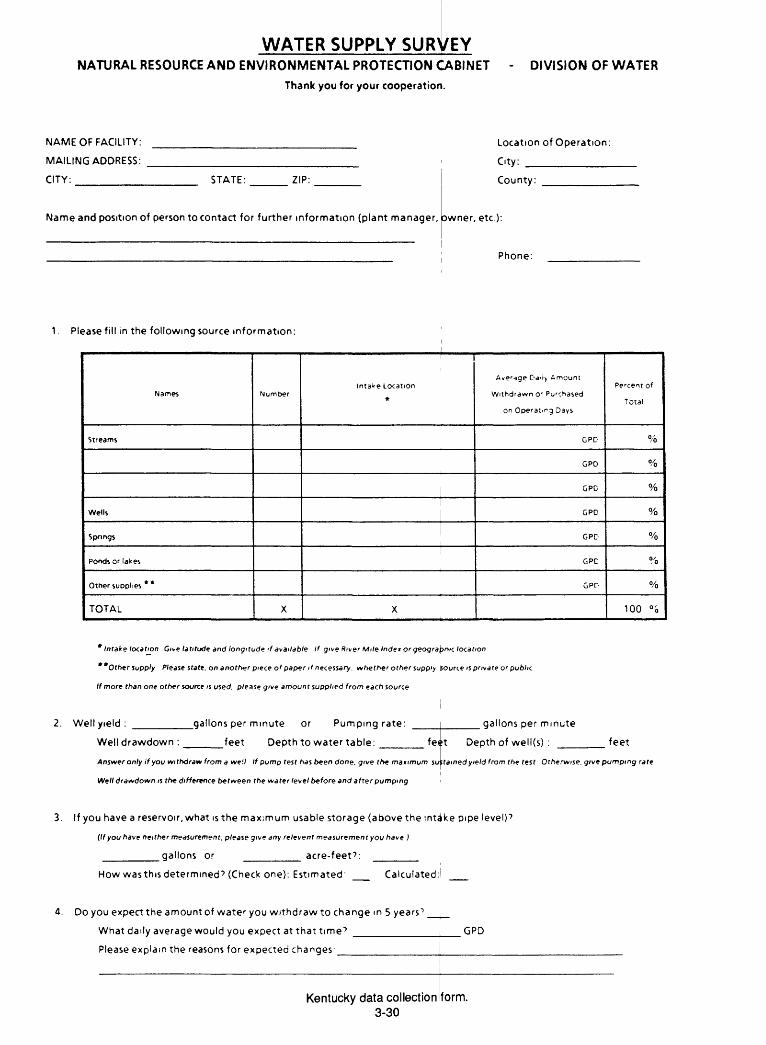
WATER SUPPLY SURVEYNATURAL RESOURCE AND ENVIRONMENTAL PROTECTION CABINET
Thank you for your cooperation.
DIVISION OF WATER
NAME OF FACILITY:
MAILING ADDRESS:
CITY: STATE: ZIP:
Name and position of person to contact for further information (plant manager, owner, etc.):
Location of Operation:
City: __________
County: ________
Phone:
1. Please fill in the following source information:
Names
Streams
Wells
Springs
Ponds or lakes
Other supplies **
TOTAL
Number
X
intake Location
*
X
A>/e r -»ge Dd'i> Amount
Withdrawn or Pu'chased
on Operating Days
GPD
GPO
GPD
GPD
GPD
GPD
GPD
Percent of
Total
%
%
%
%
%
%
%
100 °i
* Intake location Give latitude and longitude if available If give River Mile Inde* or geogratpnic location
**0ther supply Pleas* state, on another piece of paper if necessary, whether other supply Source is private or public
If more than one other source is used, please give amount supplied from each source
2. Well yield : ___________gallons per minute or Pumping rate:
Well drawdown : ____feet Depth to water table: _____
gallons per minute
fe<;t Depth of well(s) : feet
Answer only if you withdraw from a well If pump test has been done, give the maximum su-ttained yield from the test Otherwise, give pumping rate
Well drawdown is the difference between the water level before and after pumping
3. If you have a reservoir, what is the maximum usable storage (above the intake pipe level) 7
(If you have neither measurement, please give any relevent measurement you have )
_______gallons or _______ acre-feet 7 : _____
How wasthis determined 7 (Check one}: Estimated' __ Calculated: __
4. Do you expect the amount of wate r you withdraw to change m 5 years'5
What daily average would you expect at that time 7 _________
Please explain the reasons for expected changes'___________
GPD
Kentucky data collection form. 3-30

5. Have you recently made or do you expect any major facilities changes in the next five years, ?
Please explain any changes and give a completion date or anticipated completion date:
6. Maximum daily withdrawal or peak use in 1984: ____________ GPD
7. Treatment plant capacity (maximum treatment capability): _________GPM or _____________GPD
8. Age of treatment plant: ________years
9. Percent of water withdrawn which is: Metered:__% Calculated:__%
10. Percent of water distributed which is: Metered: __% Estimated: __%
11. Number of people served: ________________
12. Please give the number of customers in each category and an estimate of average daily use per category:
Number of Connections Average Daily Amount (GPD)
(A) Other towns or utility districts: ________ ____________
(B) Industry: ________ ____________
(C) Commercial: ________ ___________
(D) Residential: ________ ___________
(E) Other (Please explain): _________ ___________
TOTAL ________ ____________
Total should equal the total average given in question 1
13. Please list individual towns and districts to whom water is sold and the amount purchased by each:
14. Please list industrial customers which use more than 2,000 GPD, and give amount puchased by each:
Information concerning individual industries will be held confidential
15. Please assist us in this survey effort by listing other municipal, commercial, or industrial water users in your county who
may be withdrawing more than 10,000 GPD: ____________________________________
16. Do you store water before treatment? ___ If yes, how much? __________gallons
Rawwater is stored in: Tank_ Instream impoundment_ Off-stream impoundment_ Other_
Age of storage structure: ___years
17. Is the amount in question 16 the original design volume? ___
18. Maximum storage capacity for treated water: ________________ gallons
19. Describe how and what water use records you maintain Please specify whether any of these are computerized, and
what sort of categories you use: ___________________________________________
Kentucky data collection form. 3-31

20. Do you prepare an annual water management and operations report? ___ If yes, please enclose the most recent copy.
21. Who owns the system ?(check one): Public, local government: __ Private, reports to local government: ___
Private, separate from local government: __ Other (specify): ___________
22. Source of operating revenue: ___________________________________
23. What is your present rate structure? (check one) Uniform: __ Declining block: __ Increasing block: ___
Varies by user: __ Other: __________________
24. Do you have any chemical or biological information about your water before treatment?
experienced som e water s nortage25. How many times in the last 5 years has your system
26. What water problems, if any, have you experienced? (For exam pie raw water
turbidity, pump or system failure, or other). Please state the frequency and/or year of occurence:
If so, please enclose.
supply, water storage, water quality,
27. Does your service area have a public information program relative to water conservation and the potential for supply
shortage? (Please describe):__________________________
28. Does your system have an active leakage detection program? ____
29. What conservation measures and/or ordinances are in effect in your service area? _____________________
30. Have you used other source(s) of water because of shortage? (Specify source, a mount, owner, and/or water district):
31. Do you have a possible alternate source(s) of water in case of future shortage^? (Specify source, amount, owner and/or
water district):
32. Do you have emergency or back-up supply agreements with other water systems? (Specify source, amount, owner
and/or water district): _____________________________
33. What percent of your customers useseptictanks? (Estimate if necessary) ____%
Percent with sewer service? ____% Other: ____%
34. Average amount of water returned to a municipal wastewater system: |
35. Do your sewer and water supply systems have combined billing? ___
GPD
Thank you for your cooperation. Please return completed questionnaire to Pamla Wood, Kentucky Divison of Water,
Fort Boone Plaza, 19 Reilly Road, Frankfort, Kentucky 40601.
If you have questions, call 502-564-3410 extension 406
MUNICIPAL USERS
Kentucky data collection form. 3-32

WATER SUPPLY SURVEY
SELF-SUPPLIED INDUSTRIAL AND COMMERCIAL USERS
The attached questionnaire is part of a study of water supplies in Eastern Kentucky, beingconducted by the Kentucky Division of Water in cooperation with the U.S. Geological Survey. The
purpose is to better serve the water users of Kentucky, including this facility. You will probably notbe able to provide all of the information requested. Please provide as much and as accurate
information as you can. Your cooperation is appreciated. Please return to the following address bySeptember 10, 1985:
Mail to: Pamla Wood, Program DevelopmentKentucky Divison of Water
Fort Boone Plaza , 19 Reilly RoadFrankfort, Kentucky 40601
Please return completed questionnaire by September 10.Your cooperation is appreciated.
If you have questions, call 502-564-3410 extension 406 (Pamla Wood).
Note: You are welcome to use additional paper as necessary.
You may not be able to answer all of the questions. Please provide the best information you have.
Kentucky data collection form. 3-33

WATER SUPPLY SURVEYNATURAL RESOURCE AND ENVIRONMENTAL PROTECTION CABINET
Thank you for your cooperation.
DIVISION OF WATER
NAME OF FACILITY:
MAILING ADDRESS:
CITY: STATE: ZIP:
Location of Operation:
City: __________
County: ________
Name and position of person to contact for further information (plant managerj owner, etc.):
Phone:
1. Please fill in the following source information:
Names
Streams
Wells
Springs
Ponds or lakes
Other supplies **
TOTAL
Number
X
intake Location
*
X
Avenge Daily Amount
Withdrawn or Purchased
on Operating Days
GPD
GPO
GPO
GPO
GPO
GPO
GPO
Percent o'
Total
%
%
%
%
%
%
%
100 %
* Intake location: Give latitude and longitude if available. If give River Mile Index or geographic location
**Other supply: Please state, on another piece of paper if necessary, whether other supply source is private or public.
If more than one other source is used, please give amount supplied from each source.
2. Well yield : ______ gallons per minute or Pumping rate:
Well drawdown : ____ feet Depth to water table:
gallons per minute
fe^t Depth of well(s) : feet
Answer only if you withdraw from a well. If pump test has been done, give trie maximum sustained yield from the test. Otherwise, give pumping rate.
Well drawdown is the difference between the water level before and after pumping.
3. If you have a reservoir, what is the maximum usable storage (above the intake pipe level)?
(If you have neither measurement, please give any relevent measurement you have)
gallons or acre-feet?:
How was this determined? (Check one): Estimated: __ Calculated:
4. Do you expect the amount of water you withdraw to change m 5 years?
What daily average would you expect at that time? ________
Please explain the reasons for expected changes:__________
GPD
Kentucky data collection form. 3-34

5. Have you recently made or do you expect any major facilities changes in the next five years, ?
Please explain any changes and give a completion date or anticipated completion date:
6. Normal pumping operation is ___ hours per day,
7. Maximum daily withdrawal or peak use in 1984: _
days per week,
GPD
weeks per year.
Hours per day:8. Average number of employees occupying this facility: ___
9. Major product(s) or service(s) (give the four digit Standard Industrial Classification number if known):
10. Major byproducts: __________________________________
11. Major raw materials used: _______________________
12. Minimum amount of water necessary to maintain a minimum production level:
13. Please fill in to show how water is used:
GPD
Use
Cooling or condensing
Processing (including
process washing)
Domestic (including
general sanitation)
Boiler
Lost in system
TOTAL
Percent of
Total Use
100%
Percent
Recirculated
(A)
X
Percent
Consumed
(8)
X
Percent
Discharged
(C)
X
Total
(A « B « C)
100%
100%
100%
100%
100%
X
14. Please assist us in this survey effort by listing other municipal, commercial, or industrial water users in your county who
may be withdrawing more than 10,000 GPD: _____________________________________
1 5. Maximum impoundment or storage capacity for raw water, according to design specifications: __________ gallons
Is this the original design volume? ___ Age of storage structure: ___years
16. Describe how and what water use records you maintain. Please specify whether any of these are computerized, and what
sort of categories you use: ___________________________________________
17. Cost of waterwithdrawal: S per _gallons OR S _perday
18. What percent of water is treated prior to use?
Please specify the type of treatment being applied:
19. How many times in the last 5 years has your system experienced some water shortage? _______
20. What water problems, if any, have you experienced (for example, water supply, water
storage, water quality, pump or system failure, turbidity, or other) ? Please state the frequency and/or year of occurence:
Kentucky data collection form. 3-35

21. Average amount of water reused or recirculated on normal operating days: GPD
The average daily amount reused or recirculated may be based on the capacity of the pump used to pump
recirculated or reused water, and the duration of that pumping.
22. Have you recently made or do you plan to make, in the next five years, any ma
water use efficiency ? ___ Please explain any changes and giv
or facilities or operational changes to improve
e completion date or anticipated completion date:
23. Based on available information and your water use/supply situation, do you think that the increased
of water would be practical and cost-effective for your operation? _
physical modifications, if any, would be needed to acheive this higher level of water reuse?
reuse or recirculation
If yes; what legal, institutional, financial, and
24. What conservation measures are used in addition to recirculation?
25. Have you used other source(s) of water because of shortage 7 (Specify source, amount, owner, and/or water district):
26. Do you have a possible alternate source(s) of water in case of future shortages? (Specify source, amount, owner and/or
water district): ______________________________________________
27. Do you have emergency or back-up supply agreements with other water systefas? (Specify source, amount, owner
and/or water district): ____________________________________________
28. Average daily discharge: GPD
Type of treatment applied to discharge:
29. Average amount of water returned to a wastewater system:
30. Percent of total discharge returned to:
GPD
Stream
Sinkhole ___ %
Well injection ___ %
Septic tank &
field tile ___ %
Spray irrigation
Public system ___ %
Other %
Name of stream:
Location on stream (river mile or geographi: location)
Gallons pumped per day:
Name of system: _
Specify if by sale, etc: _
Thank you for your cooperation. Please return completed questionnaire to Pamla Wood, Kentucky Divison of Water,
Fort Boone Plaza, 19Reilly Road, Frankfort, Kentucky 40601 If you have questions, call 502-564-3410 Extension 406.
Kentucky data collection 3-36
Self-supplied Crmmerrifll and Industrial Users
form.
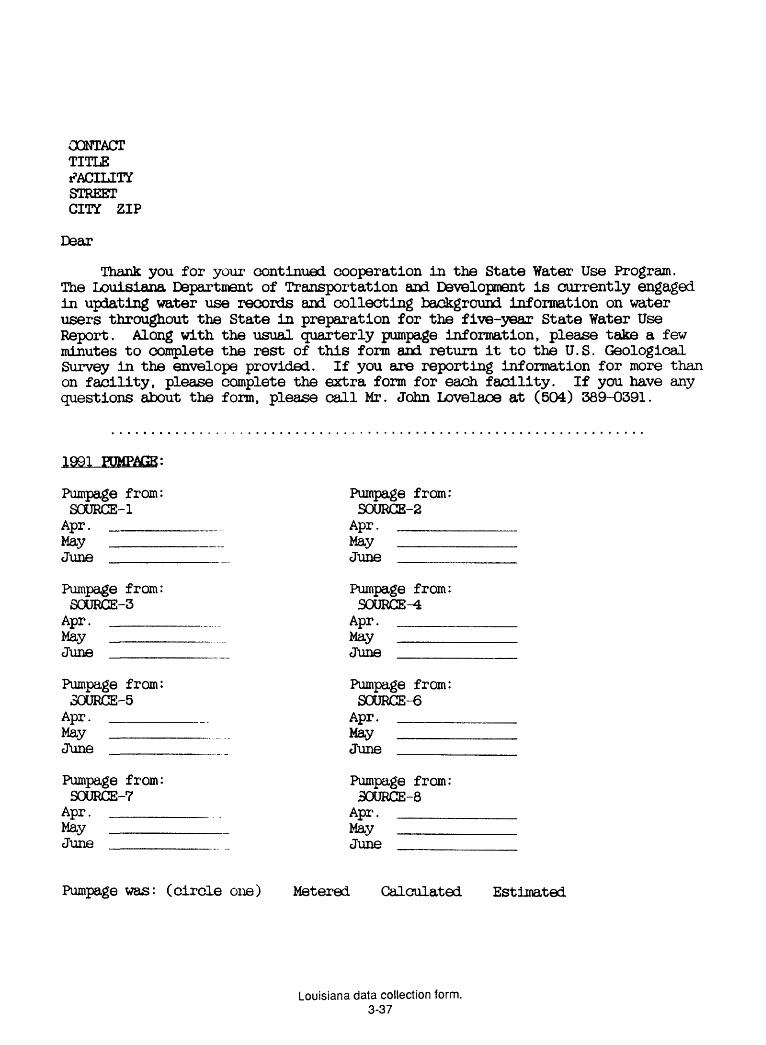
CONTACT TITLE
STREET CITY ZIP
Dear
Thank you for your continued cooperation in the State Water Use Program. The Louisiana Department of Transportation and Development is currently engaged in updating water use records and collecting background information on water users throughout the State in preparation for the five-year State Water Use Report. Along with the usual quarterly pumpage information, please take a few minutes to complete the rest of this form and return it to the U.S. Geological Survey in the envelope provided. If you are reporting information for more than on facility, please complete the extra form for each facility. If you have any questions about the form, please call Mr. John Lovelace at (504) 389-0391.
1991
Pumpage from: Pumpage from:SOURCE-1 SOURCE-2
Apr. _________ _ Apr. ____May _________ .. May ____June ___________ June ____
Pumpage from: Pumpage from:SOURCE-3 SOURCE-4
Apr. __________ Apr. ____May ________.__ May ____June _____________ June ____
Pumpage from: Pumpage from:oOURCE-5 SOURCE-6
Apr. ________. Apr. ____May ________ _.. May ____June _________.._ June ____
Pumpage from: Pumpage from:SOURCE-7 SOURCE-8
Apr. _________ . Apr. ____May __________ May ____June ________.. _ June ______
Pumpage was: (circle one) Metered Calculated Estimated
Louisiana data collection form. 3-37

1990 WATER USE REPORTING FORM
Facility name:.
If use is Industrial, state major product(s):.
If use is Public Supply, please respond to the following:
Total number of service connections
Percentage of residential use: __
Percentage of industrial use: __
Percentage of commercial use: __
Population served:
Percentage of unsold water (system losses a4d public use)
Water source: (circle) Ground water Sijrface water Both
Ground water quality: (circle) Fresh Saline Unknown
Surface water quality: (circle) Fresh Seiline Unknown
Number of surface water intakes: Canal___ l£ike__
Name(s) of body of water:___________________
Number of wells:______
River other
USGS well number(s), if known:.
Owner's well names or numbers:
Aquifer(s) or depth(s), if known:.
Area or water body to which water is returned:.
Percentage of ground water consumed or not discliarged:
Percentage of surface water consumed or not discharged:.
If water is purchased, how much and from whom:______
Please supply sketch or map showing location of wells, if available.
Signature. Date_
Louisiana data collection torm. 3-38
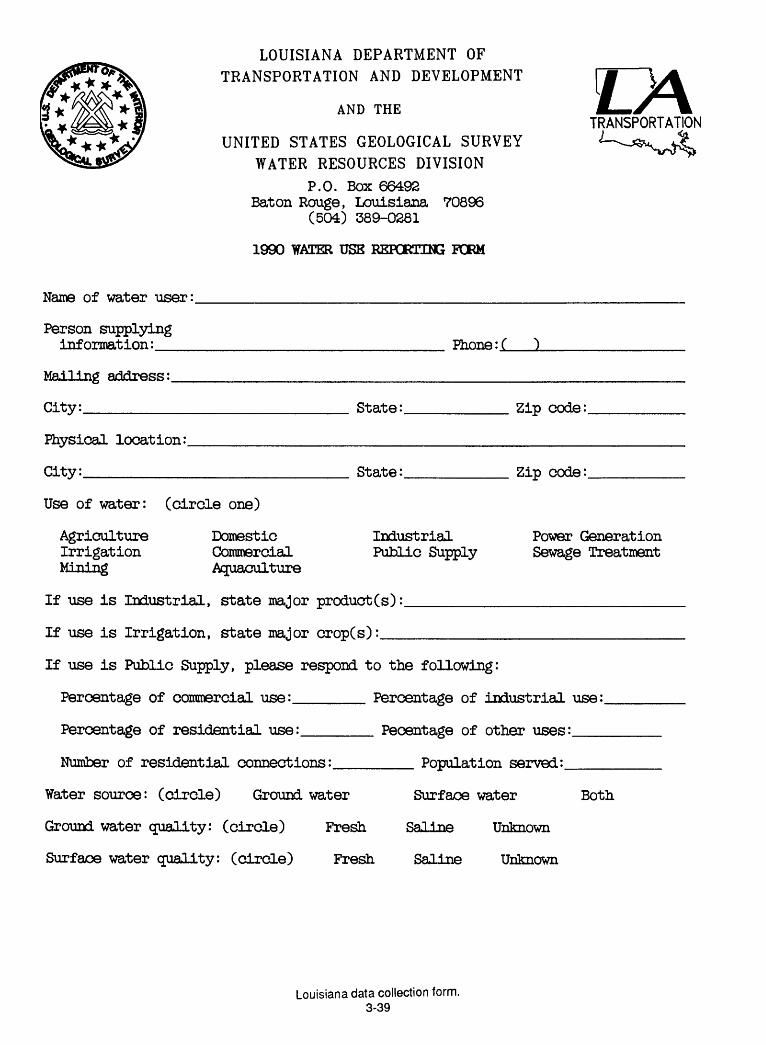
LOUISIANA DEPARTMENT OF TRANSPORTATION AND DEVELOPMENT
AND THE
UNITED STATES GEOLOGICAL SURVEY WATER RESOURCES DIVISION
P.O. Box 66492Baton Rouge, Louisiana 70896
(504) 389-0281
1990 WATER USE REFCKEENG FORM
1J\TRANSPORTATION
Name of water user:.
Person supplying information: ___ Phone: (
Mailing address;.
City:_______ State: Zip code:.
Physical location:.
City:_________ State: Zip code:.
Use of water: (circle one)
AgricultureIrrigationMining
DomesticCommercialAquaculture
Industrial Public Supply
Power Generation Sewage Treatment
If use is Industrial, state major product(s):.
If use is Irrigation, state major crop(s):__
If use is Public Supply, please respond to the following:
Percentage of commercial use:______ Percentage of industrial use:_
Percentage of residential use:_____ Pecentage of other uses:___
Number of residential connections:______ Population served:____
Water source: (circle) Ground water Surface water Both.
Ground water quality: (circle) Fresh Saline Unknown
Surface water quality: (circle) Fresh Saline Unknown
Louisiana data collection form. 3-39
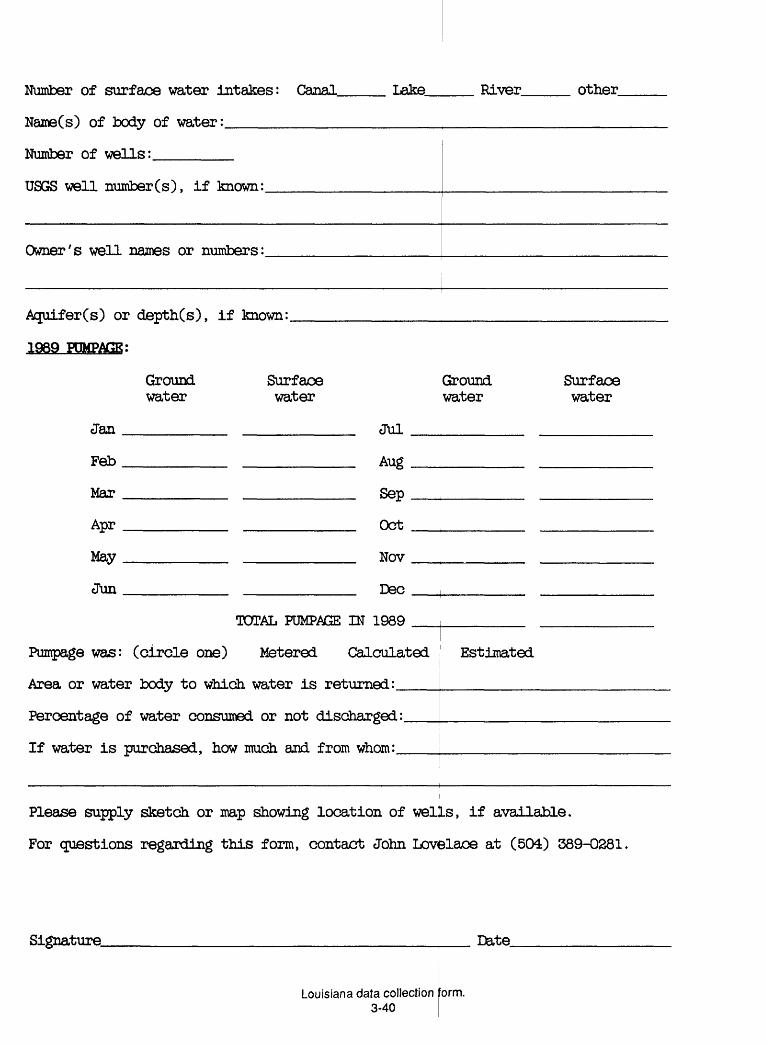
Number of surface water intakes: Canal.
Name(s) of body of water:_________
Number of wells:______
USGS well number(s), if known:______
Lake River other
Owner's well names or numbers:
Aquifer (s) or depth(s), if known:
1989 HJMPASE:
Ground Surface Ground water water water
Jan Jul
Feb Aug
Mar Sep
Apr Oct
Mav Nov
Jun Dec
Surface water
TOTAL FUMPAGE IN 1989
Pumpage was: (circle one) Metered Calculated Estimated
Area or water body to which water is returned:__
Percentage of water consumed or not discharged:.
If water is purchased, how much and from whom:_
Please supply sketch or map showing location of wells, if available.
For questions regarding this form, contact John Lovelace at (504) 389-0281
Signature. Date
Louisiana data collection 3-40
orm.

1990 AGRimUEURAL WATER USE QOEffTIQNNAIRE
Parish.: __________________ County Agent
Please estimate the average amount of water, in inches or feet per acre, applied in 1989 for the following: (please indicate units used)
Rice ____
Cotton ____
Soybeans ____
Strawberries ____
Truck crops ____
Catfish ____
Crawfish ____
Other (list) _____________ ____
Please list major surface water sources in your parish for:
Livestock Watering _______________________
Irrigation _____________________________
Aquaculture
Please indicate the percentage of ground water and surface water used in your parish for the following :
Livestock watering
Aquaculture
Crop Irrigation
Notes :
Louisiana data collection form. 3-41

PARISH___________________ FSN
IRRIGATED GROP(S).
ACREAGE IRRIGATED WITH (3OJND WATER
ESTIMATED TOTAL AMOUNT OF (3OJNDWATER APPLIED FOR YEAR(INCHES PER ACRE)___________
ACREAGE IRRIGATED WITH SURFACE WATER.
SOURCE OF SURFACE WATER_________
ESTIMATED TOTAL AMOUNT OF SURFACEWATER APPLIED FOR YEAR(INCHES PER ACRE)____________
Louisiana data collection 3-42
form.
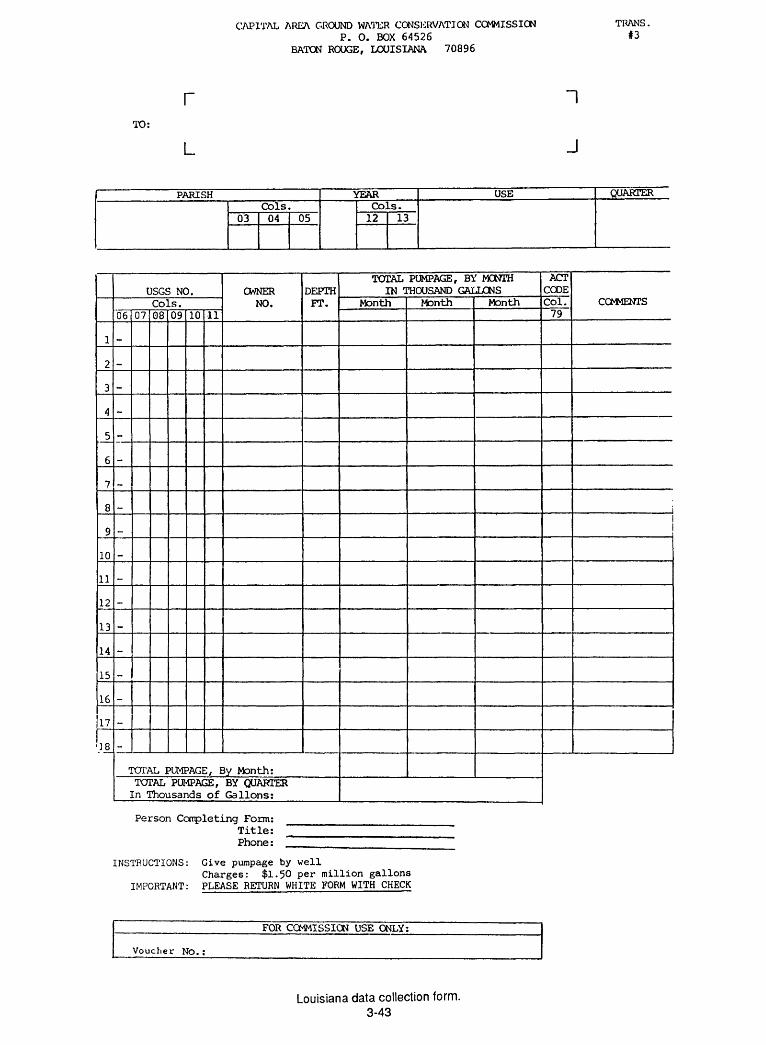
CAPITAL AREA GROUND WATER CONSERVATION COMMISSIONP. 0. BOX 64526
BATON ROUGE, LOUISIANA 70896
TRANS. #3
TO:
r
L j
PARISHCols.
03 04 05
YEARCols.12 13
USE QUARTER
1
7
3
4
5
6
7
8
9
10
11
12
13
14
15
16
17
.] JL
USGS NO.Cols.
06
_
_
_
_
_
_
_
_
_
_
_
_
_
_
07 08 09 10 11
OWNER NO.
DEPTH FT.
TOTAL PUMPAGE, By Month:TOTAL PUMPAGE, BY QUARTER In Thousands of Gallons:
TOTAL PUMPAGE, BY MONTH IN THOUSAND GALLONS
Month Month Month
ACT CODECol.79
COMMENTS
Person Corrpleting Form: Title: Phone:
INSTRUCTIONS: Give pumpage by wellCharges: $1.50 per million gallons
IMPORTANT: PLEASE RETURN WHITE FORM WITH CHECK
FOR COMMISSION USE ONLY:
Voucher No.:
Louisiana data collection form. 3-43

Public Wacer Supplier Daca Sr.eec
Name and Mailing Address^
?ws
Contact: Person Telephone »
Ownership: Authority or District Municipality State Mobile Home
Subdivision Non-profit association Business Federal County
County _____________ *______ HUG * ___
Peculation serviced
Average annual daily water use
Amount from ground-water sources
MGD
% of ground water from various aquifers:
Water Pumped MGD Aquifer Well Depth Screen/Casing Depth
Amount from surface-water sources
Average Monthly Water Use:
MGD
Jan.Feb.Mar.Aor.MavJune
MGDMGDMGDMGDMGDMGD
JulvAug.Sep.Oct.Nov.Dec.
MGD MGD MGD MGD MGD MGD
Average Annual Water Use
Tvoe Metered Connections Monmetered Connections Number Water Use MGD Number Water Use MGD
Residential
Commercial
Industrial
Institutional
Bulk sales to _ other suooliers
Un-accounted water
Total
North Carolina data collection form. 3-44
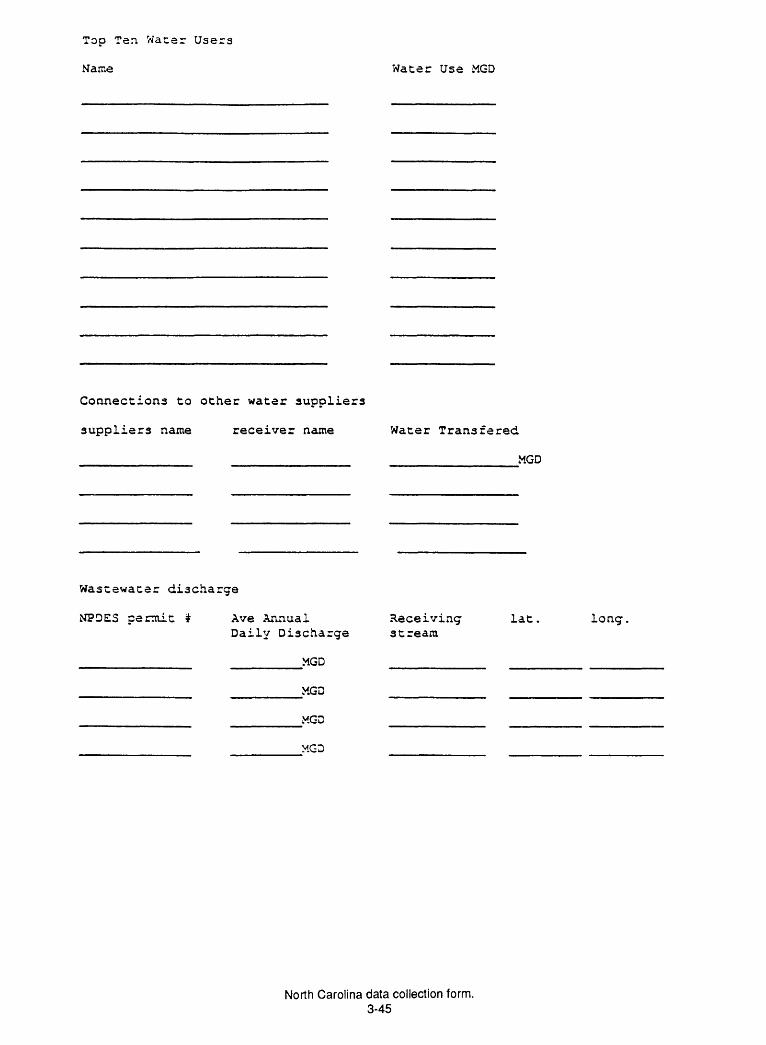
Top Ten Water Users
Name Water Use MGD
Connections to other water suppliers
suppliers name receiver name Water Transferee!
MGD
Wastewater discharge
permit # Ave Annual Receiving lat. long. Daily Discharge stream
MGD
MGD
MGD
MGD
North Carolina data collection form. 3-45
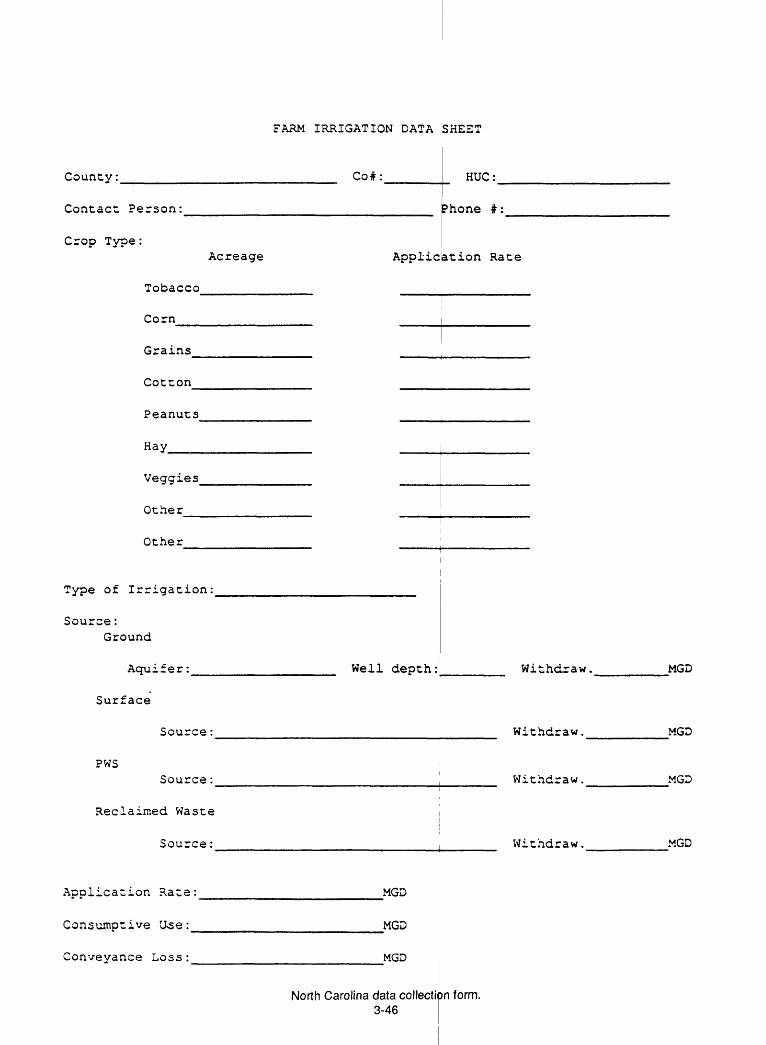
FARM IRRIGATION DATA SHEET
Countv:
Contact Person:__
Crop Type:
Tobacco_
Corn
Acreage
Grains_
Cotton
Peanuts_
Hay___
Veggies_
Other_
Other
Type of Irrigation^
Source:Ground
Aquifer:_
Surface
Source:
PWSSource:_
Reclaimed Waste
Source:_
Application Rate:__
Consumptive Use:__
Conveyance Loss:__
Cot: HUC:
Phone #:
Application Rate
Well depth: Withdraw,
Withdraw.
Withdraw.
Withdraw.
_MGD
MGD
MGD
North Carolina data collection 3-46
form.
MGD
MGD
MGD
MGD

INDUSTRIAL QUESTIONNAIRE 1990
Facility Name:__________________________________________Location (City/County) :________________________________Contact Person:______________________________Phone # Mailing Address:__________________________________Street Address (if different from mailing address):_____
River Basin:
Is your facility Self-supplied or Publicly Supplied ?If it is Publicly supplied, what is the name of the supplier ?
If your facility is publicly supplied, skip the Water Sources section and precede to the Production Usage section.
Ground Water Sources
WATER SOURCES
(MGD = Million Gallons per Day)
Well Well Screen Average Maxmimum SalineWell Dia. Depth Interval Daily Use Daily Use Well Location or FreshNo. in. ft_____ft______MGD______MGD______Lat.____Long. Water
Surface Water Sources
Name of Stream
&/or Reservoir
Ave. daily Max. daily Intake Location SalineWithdrawal Withdrawal or Fresh
MGD________MGD________Lat. Long.____Water
North Carolina data collection form. 3-47
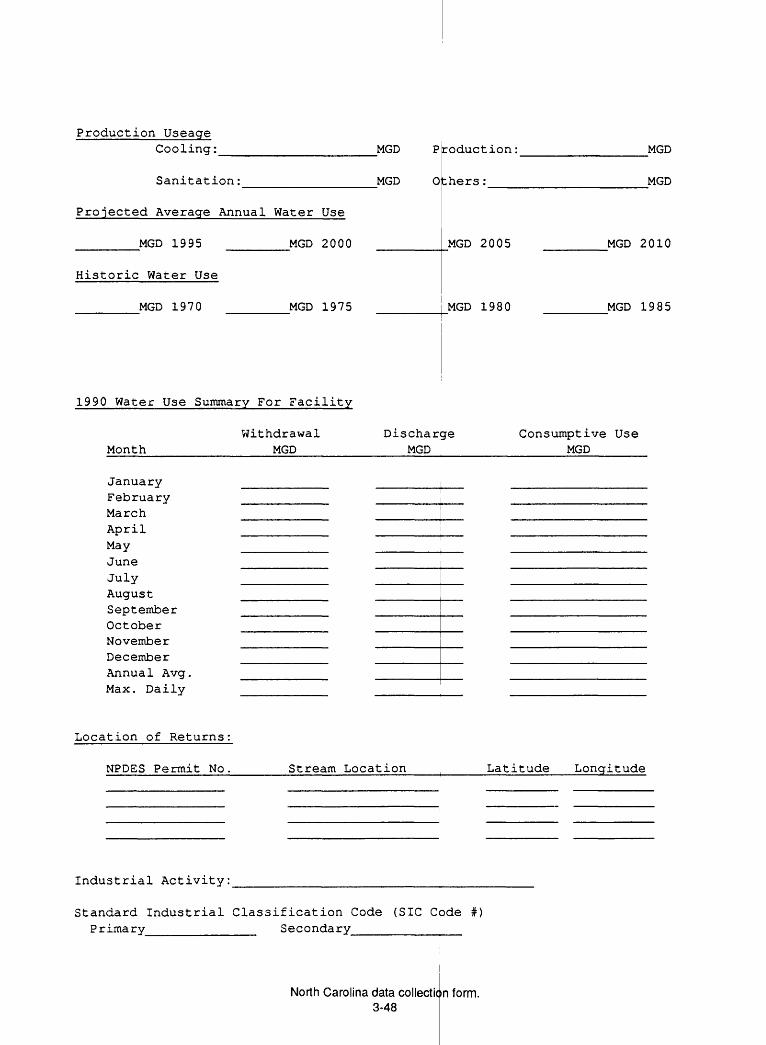
Production UseageCooling: MGD P
Sanitation: MGD 0
Projected Average Annual Water Use
MGD 1995 MGD 2000
Historic Water Use
MGD 1970 MGD 1975
reduction:
thers :
MGD 2005
MGD 1980
MGD
MGD
MGD 2010
MGD 1985
1990 Water Use Summary For Facility
Withdrawal Discharge Consumptive Use Month MGD MGD MGD
JanuaryFebruaryMarchAprilMayJuneJulyAugustSeptemberOctoberNovemberDecemberAnnual Avg.Max. Daily
Location of Returns:
NPDES Permit No. Stream Location Latitude Longitude
Industrial Activity:
Standard Industrial Classification Code (SIC Code #) Primary Secondary
North Carolina data collecticin 3-48
form.

1990 HYDROELECTRIC POWER WATER USE DATA SHEET
Company Name:
Office Address
Contact Person: _________________________ Telephone No
Plant Name:
Plant Location:
County
Latitude ____________ Longitude
Hydrologic Unit Code ____________ River Basin
Source Name:
Withdrawal Location: Latitude _______________ Longitude
Return Location: Latitude _______________ Longitude
1990 Average Daily _____________ Million Gallons per Day (MGD) Water Use
Average Daily Water Use by Month in MGD
Jan. _______________MGD July ________________MGD
Feb. ______________ Aug. _______________
Mar. ______________ Sep. _______________
Apr. ______________ Oct. _______________
May ______________ Nov. ________________
June Dec.
North Carolina data collection form. 3-49

1990 HYDROELECTRIC POWER WATER USE DATA SHEET, continued
Total 1990 Annual Power Production in Gigawatt-hours (GWh)
Monthly 1990 Power Production GWh
Jan. ______________GWh July____^^_^^_^^^__^^^^^
Feb. ______________ Aug.
Mar. ______________ Sep.
Apr. ______________ Oct.
May _______________ j Nov.
June Dec.
GWh
North Carolina data collection 3-50
form.

WATER USE DATA SHEET 1990 THERMOELECTRIC - FOSSIL FUEL POWER
Company Name:
Office Address
Contact Person: __________________________ Telephone No,
Plant Name: _________________________________________
Nearest City: ___________________________________
County
Latitude ____________ Longitude
Hydrologic Unit Code ___________ River Basin
1990 Average Daily Withdrawal _____________ Million Gallons per Day (MOD)
Average Daily Withdrawal by Month in MGD
Jan. ______________MGD
Feb. _______________MGD
Mar. _______________MGD
Apr. _______________MGD
May ______________MGD
June ______________MGD
1990 Peak Daily Water Use ___________MGD
Projected Average Daily Water Use for Year 2000 ____________MGD
Projected Capacity Need for Year 2000 _______________Gigawatt-hours (GWh)
nth in MGD
July
Aug.
Sep.
Oct.
Nov.
Dec.
MGD
MGD
MGD
MGD
MGD
MGD
North Carolina data collection form. 3-51

WATER USE DATA SHKET 1990 THERMOELECTRIC - FOSSIL FUEL POWER Continued
Surface water Withdrawal Locations:
Source Name
1.________
2.________
3.________
4.________
5.________
6.________
7.________
8.
Fresh or 1990 Average Daily Latitude Longitude Salin« Water Water Withdrawal
MGD
MGD
MGD
MGD
MGD
MGD
MGD
MGD
Ground water Withdrawal Locations:
WellAverage Daily Water
Well Name Latitude Longitude Depth
1.
2.
3.
4.
5.
6.
7.
8.
Aquifer A Aquifer BAquifer C Aquifer D
Aquifer Withdrawal
ft MGD
ft MGD
ft MGD
ft MGD
ft MGD
ft MGD
ft MGD
ft MGD
North Carolina data collec 3-52
ion form.

WATER USE DATA SHEET 1990 THERMOELECTRIC - FOSSIL FUEL POWER Continued
Name of Public Water Supplier
Return Location: Latitude _______________ Longitude ____________
Average Daily Annual Discharge _______________MGD
Average Daily Annual Consumptive Use Fresh Water _______________MGD
AveragevDaily Annual Consumptive Use Saline Water _______________MGD
Deliveries from Ave. Daily Consumptive use Public Water supply Monthly Discharge___Fresh water___Saline water
Jan.
Feb.
Mar.
Apr.
May
June
July
Aug.
Sep.
Oct.
Nov.
Dec.
MGD
MGD
MGD
MGD
MGD
MGD
MGD
MGD
MGD
MGD
MGD
MGD
MGD
MGD
MGD
MGD
MGD
MGD
MGD
MGD
MGD
MGD
MGD
MGD
MGD MGD
MGD
MGD
MGD
MGD
MGD
MGD
MGD
MGD
MGD
MGD
MGD
Percent of Total Water Withdrawals that is Consumptively Used
Cooling Method:_______________________________________
Forced Evaporation _________________MGD
North Carolina data collection form. 3-53

WATER USE DATA SHEET 1990 THERMOELECTRIC - FOSSIL FUELiPOWER Continued
Total 1990 Annual Power Production in Gigawatt-Hours (GWh)
Monthly 1990 Power Production GWh
Jan. ______________GWh July __
Feb. ______________GWh Aug. __
Mar. ______________GWh Sep. __
Apr. ______________GWh Oct. __
May ______________GWh Nov. __
June GWh Dec.
GWh
GWh
GWh
GWh
GWh
GWh
North Carolina data collection form. 3-54
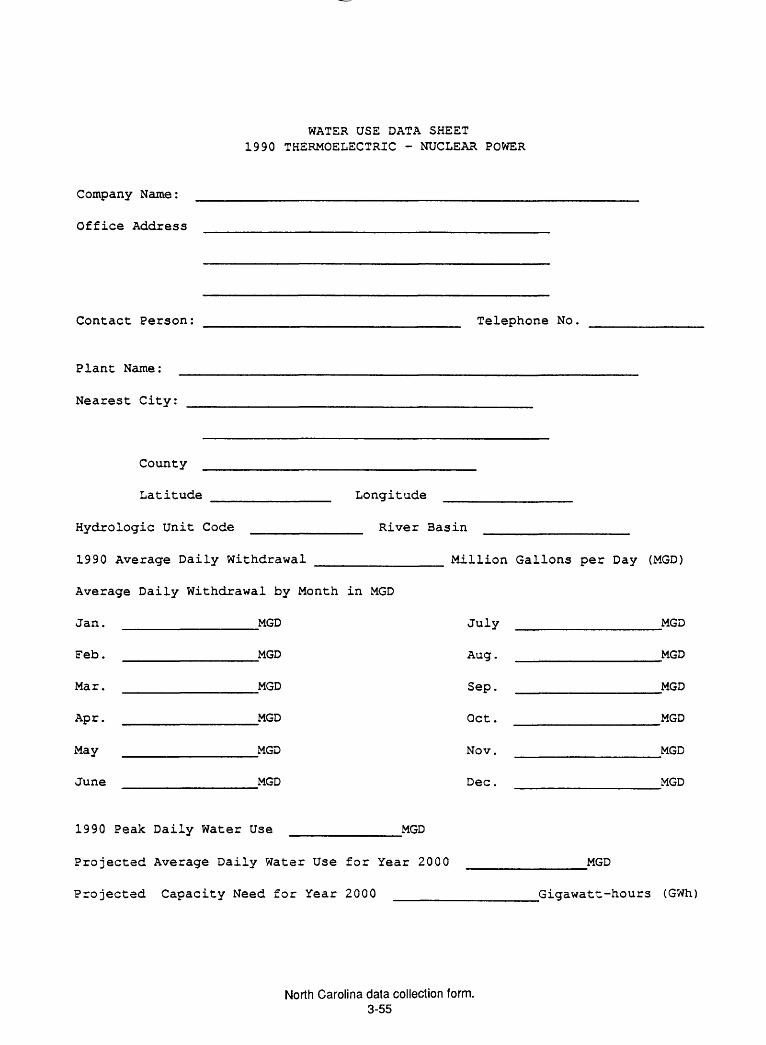
Company Name:
Office Address
Contact Person:
Plant Name: _
Nearest City: _
County
Latitude
WATER USE DATA SHEET 1990 THERMOELECTRIC - NUCLEAR POWER
Telephone No
Longitude
Hydrologic Unit Code River Basin
1990 Average Daily Withdrawal Million Gallons per Day (MGD)
Average Daily Withdrawal by Month in MGD
Jan. ______________MGD
Feb. _______________MGD
Ma r. _______________MGD
Apr. _______________MGD
May _______________MGD
June ______________MGD
1990 Peak Daily Water Use
nth in MGD
July
Aug.
Sep.
Oct.
Nov.
Dec.
MGD
MGD
MGD
MGD
MGD
MGD
MGD
Projected Average Daily Water Use for Year 2000
Projected Capacity Need for Year 2000 ______
MGD
_Gigawatt-hours (GWh)
North Carolina data collection form. 3-55

WATER USE DATA SHEET 1990 THERMOELECTRIC - NUCLEAR POVFER Continued
Surface water Withdrawal Locations:
Source Name
1._______
2._______
3._______
4.________
5._______
6.________
7.________
8.
Fresh dr 1990 Average Daily Latitude Longitude Saline water Water Withdrawal
MGD
MGD
MGD
MGD
MGD
MGD
MGD
MGD
Ground water Withdrawal Locations:
Well Name
1.______
2.______
3.______
4.______
5.
7.
Aquifer A Aquifer C
Well Latitude Longitude Depth
Aquifer B Aquifer D
- 2 -
ft
ft
ft
ft
ft
ft
ft
ft
Aquifer
Average DailyWaterWithdrawal
MGD
MGD
MGD
MGD
MGD
MGD
MGD
MGD
North Carolina data collecticn 3-56
form.
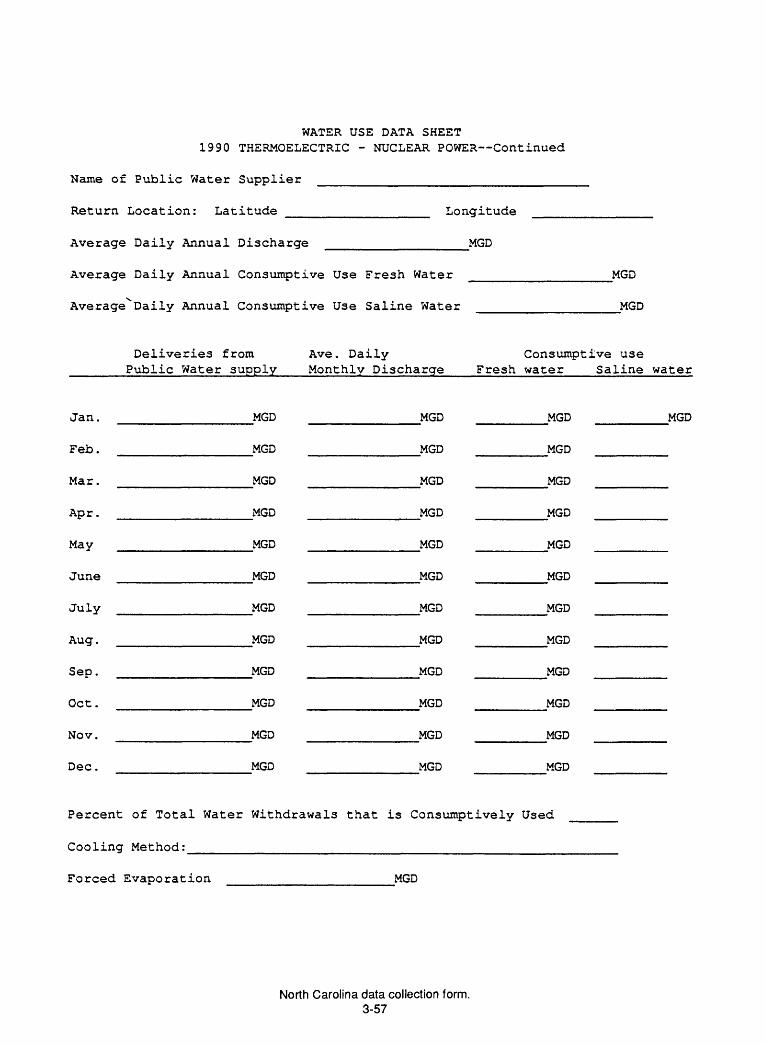
WATER USE DATA SHEET 1990 THERMOELECTRIC - NUCLEAR POWER Continued
Name of Public Water Supplier
Return Location: Latitude __________________ Longitude
Average Daily Annual Discharge _______________ MGD
Average Daily Annual Consumptive Use Fresh Water ______
Average^Daily Annual Consumptive Use Saline Water _______________ MGD
Deliveries from Ave. Daily Consumptive use Public Water supply Monthly Discharge___Fresh water___Saline water
Jan.
Feb.
Mar.
Apr.
May
June
July
Aug.
Sep.
Oct.
Nov.
Dec.
MGD
MGD
MGD
MGD
MGD
MGD
MGD
MGD
MGD
MGD
MGD
MGD
MGD
MGD
MGD
MGD
MGD
MGD
MGD
MGD
MGD
MGD
MGD
MGD
MGD MGD
MGD
MGD
MGD
MGD
MGD
MGD
MGD
MGD
MGD
MGD
MGD
Percent of Total Water Withdrawals that is Consumptively Used
Cooling Method:______________________________________
Forced Evaporation __________________MGD
North Carolina data collection form. 3-57

WATER USE DATA SHEET 1990 THERMOELECTRIC - NUCLEAR P<j)WER Continued
Total 1990 Annual Power Production in Gigawatt-hours (GWh)
Monthly 1990 Power Production GWh
Jan.
Feb.
Mar.
Apr.
May
June
GWh
GWh
GWh
GWh
GWh
GWh
July
Aug.
Sep.
Oct.
Nov.
Dec.
_GWh
GWh
GWh
GWh
GWh
GWh
North Carolina data collection form. 3-58
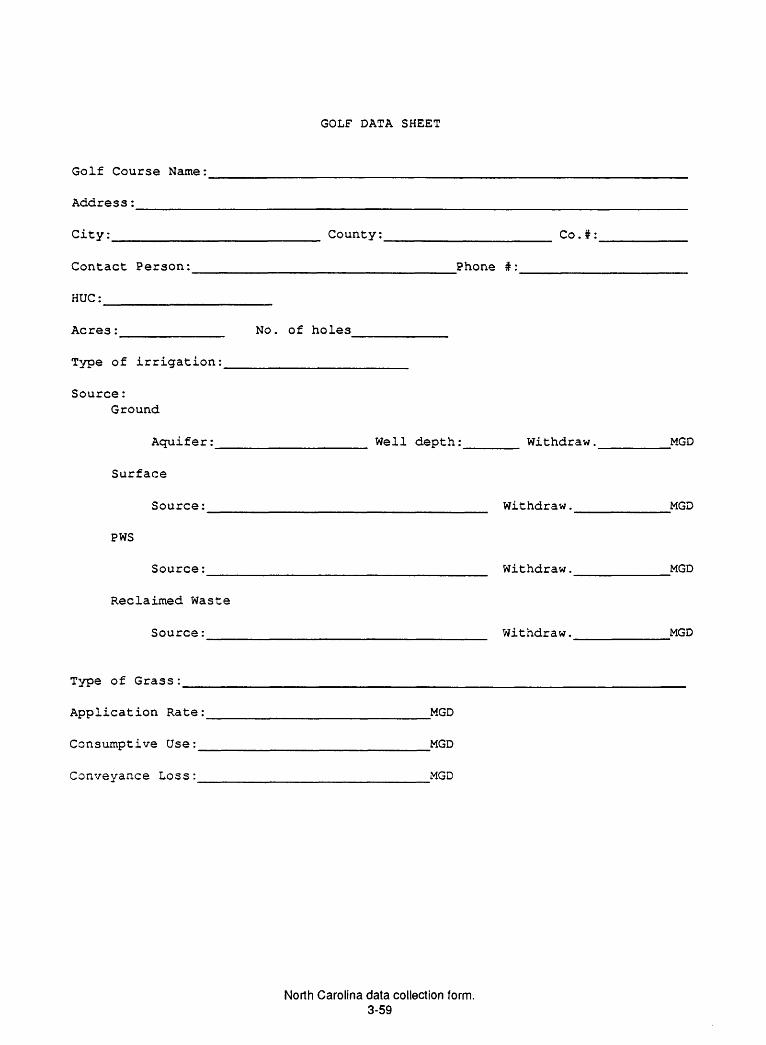
GOLF DATA SHEET
Golf Course Name:
Address:
City:______________________ County:__________________ Co.#:
Contact Person:___________________________Phone #:________
HUC:_________________
Acres: No. of holes
Type of irrigation:___________________
Source:Ground
Aquifer:_______________ Well depth:_____ Withdraw._______MGD
Surface
Source:______________________________ Withdraw.__________MGD
PWS
Source:______________________________ Withdraw.__________MGD
Reclaimed Waste
Source:______________________________ Withdraw.__________MGD
Type of Grass:____________________________________________________
Application Rate:_________________________MGD
Consumptive Use:__________________________MGD
Convevance Loss: MGD
North Carolina data collection form. 3-59
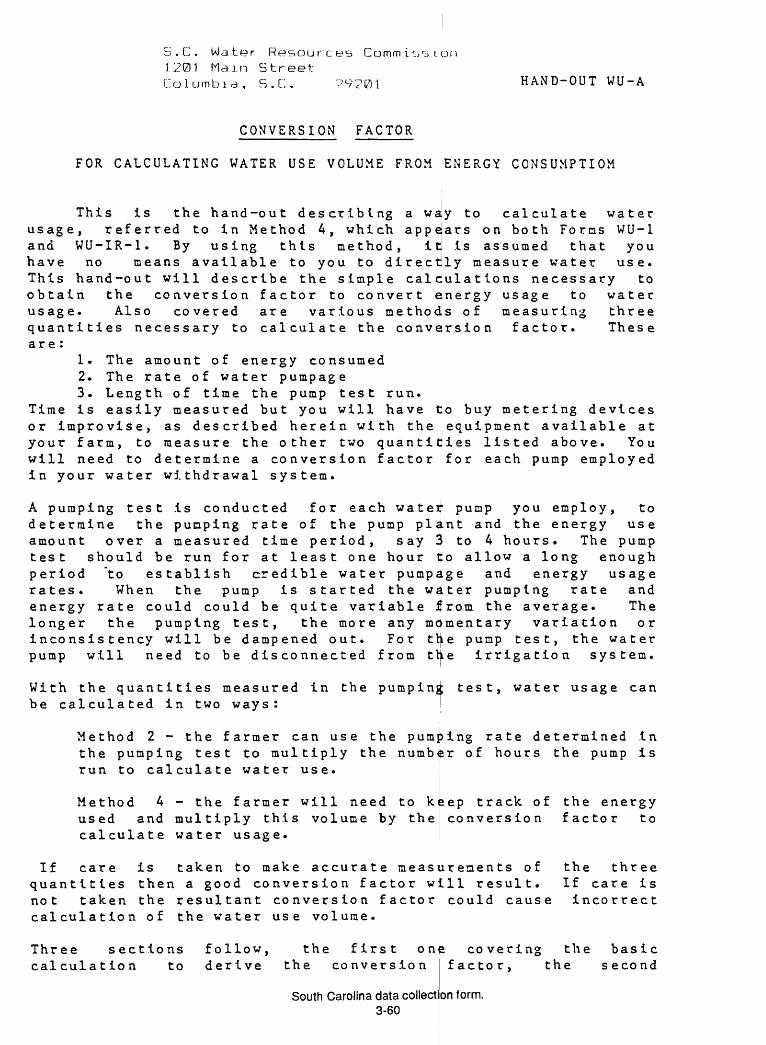
B.C. Water Resources Commission1201 Main StreetC o 1 u m b i a , S . C;. 7 9 2 F) 1 HAND-OUT WU-A
CONVERSION FACTOR
FOR CALCULATING WATER USE VOLUME FROM ENERGY CONSUMPTION*
This is the hand-out describing a way to calculate water usage, referred to in Method 4, which appears on both Forms WU-1 and WU-IR-1. By using this method, it is assumed that you have no means available to you to directly measure water use. This hand-out will describe the simple calculations necessary to obtain the conversion factor to convert energy usage to water usage. Also covered are various methods of measuring three quantities necessary to calculate the conversion factor. These are :
1. The amount of energy consumed2. The rate of water pumpage3. Length of time the pump test run.
Time is easily measured but you will have to buy metering devices or improvise, as described herein with the equipment available at your farm, to measure the other two quantities listed above. You will need to determine a conversion factor for each pump employed in your water withdrawal system.
A pumping test is conducted for each water| pump you employ, to determine the pumping rate of the pump plant and the energy use amount over a measured time period, say 3 to 4 hours. The pump test should be run for at least one hour tto allow a long enough period "to establish credible water pumpage and energy usage rates. When the pump is started the water pumping rate and energy rate could could be quite variable from the average. The longer the pumping test, the more any momentary variation or inconsistency will be dampened out. For ttye pump test, the water pump will need to be disconnected from the irrigation system.
With the quantities measured in the pumpin be calculated in two ways:
test, water usage can
Method 2 - the farmer can use the pumping rate determined in the pumping test to multiply the number of hours the pump is run to calculate water use.
Method 4 - the farmer will need to k<»ep track ofused and multiply this volume by calculate water usage.
the co nvers io n
If care is taken to make accurate measurements of quantities then a good conversion factor will result, not taken the resultant conversion factor could cause calculation of the water use volume.
the energy facto r to
the threeIf care isincorrect
Three sections follow, the first one covering the basic calculation to derive the conversion factor, the second
South Carolina data collection form. 3-60
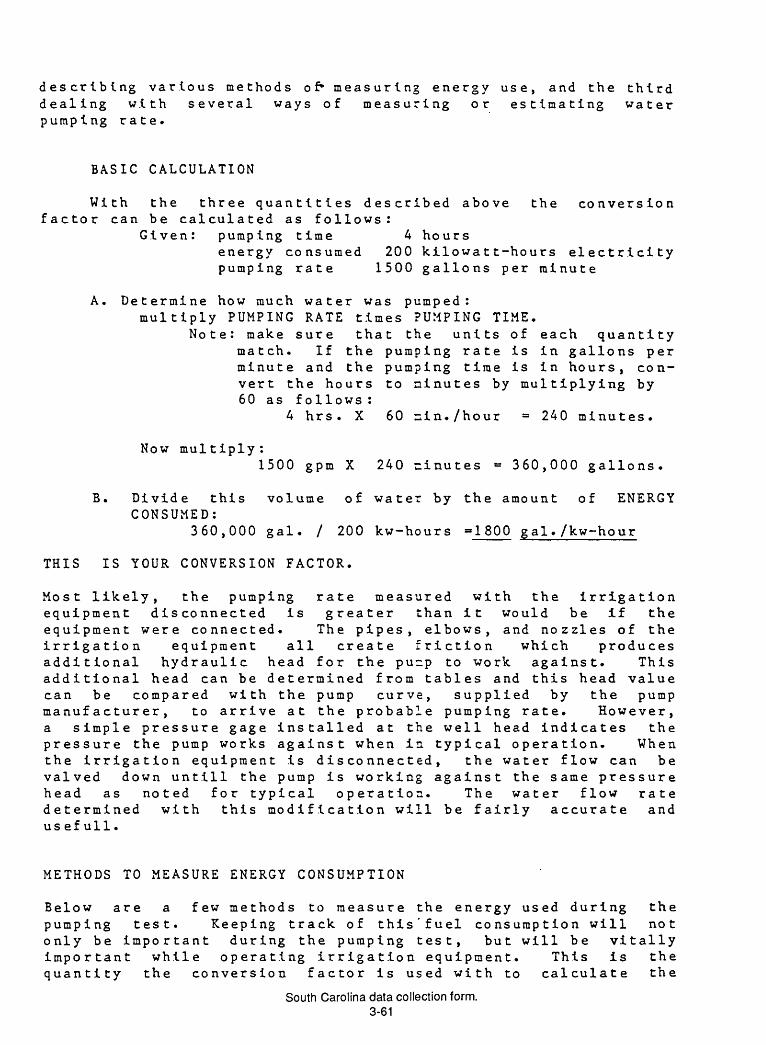
describing various methods of* measuring energy use, and the third dealing with several ways of measuring or estimating water pump ing rate
BASIC CALCULATION
With the three quantities described above the conversion factor can be calculated as follows:
Given: pumping time 4 hoursenergy consumed 200 kilowatt-hours electricity pumping rate 1500 gallons per minute
A. Determine how much water was pumped:multiply PUMPING RATE times PUMPING TIME
Note: make sure that the units ofmatch. If the pumping rate isminute and the pumping time isvert the hours60 as f o Hows :
4 hrs. X
each quantity in gallons per i n hours, co n-
to ninutes by multiplying by
60 nin./hour = 240 minutes.
Now multiply:1500 gpm X 240 ninutes = 360,000 gallons.
B. Divide this volume of water by the amount of ENERGY CONSUMED:
360,000 gal. / 200 kw-hours =1800 gal./kw-hour
THIS IS YOUR CONVERSION FACTOR.
Most likely, the pumping rate measured with the irrigation equipment disconnected is greater than it would be if the equipment were connected. The pipes, elbows, and nozzles of the irrigation equipment all create friction which produces additional hydraulic head for the punp to work against. This additional head can be determined from tables and this head value can be compared with the pump curve, supplied by the pump manufacturer, to arrive at the probable pumping rate. However, a simple pressure gage installed at the well head indicates the pressure the pump works against when in typical operation. When the irrigation equipment is disconnected, the water flow can be valved down unt.ill the pump is working against the same pressure head as noted for typical operation. The water flow rate determined with this modification will be fairly accurate and us ef ull.
METHODS TO MEASURE ENERGY CONSUMPTION
Below are a few methods to measure the energy used during the pumping test. Keeping track of this'fuel consumption will not only be important during the pumping test, but will be vitally important while operating irrigation equipment. This is the quantity the conversion factor is used with to calculate the
South Carolina data collection form. 3-61
water usage. Therefore, finding a fool-proof method for keepingfuel consumption records will make using this Method A easy.
ELECTRICITY Reading the meter on the main power box before andafter pump operation and subtracting the beginning reading fromthe ending reading will result In the
an important consideration is whether or not the pump isHowever,the onlysome way will have to bepower usage and deduct this from the totalpumping. For instance, if two other devicesmeter, operate each of them separately for
electrical device connected to the meter.devised to determine these
power
to tal power us ed.
calculate each devices energy use per hour.
If no t, then o ther devi ces usag e during
the and
Then all you
are connected to a period of time
thenhave to keep track of is how many hours each device was operating while the irrigation pump was operating, calculate the power used by the other devices, and subtract that ^alue from the total power used.
If this additional power usage is not subtracted from the total, particularly if the pumping test for the water pump was run without the other devices operating, then the conversion factor will be multiplying an energy value greater than what should be considered for water pumping. The resultant calculation will estimate a greater water usage than actually occurred.
GASOLINE or DIESEL one
FUEL Both of_______ _ _____ ___ these fuels; have to be stored in a tank of one sort or another. One measuring method would be to fill the tank at the pump site to the brim or a set level each time and keep track of how much fuel is neec.ed to refill the tank after each pumping period. Another methoc would be to estimate contents of the tank. This is done by knowing the size and volume of the tank and be able to measure i:he depth of the fuel in the tank in inches. This data can be used to find in special tables the conversion factor for calculating the fuel volume.
METHODS TO MEASURE WATER PUMPING RATE
Several methods exist for measuring or estimating the pumping rate. Some provide accurate measurements wiile others only roughes tima tes. accurate and
The descriptions below will start with the mostwork towards the least accurate.
Two important considerations to note when ujsing these methods are first - that the pump will have to be disconnected from the irrigation equipment and second, that a great deal of water will be pumped during the test. Catching or diverting the water for later re-use will make the test less wasteful.
Other methods exist for measuring smaller pumping rates but are not presented here because pumping rates expected are too great.
South Carolina data collection form 3-62

ORIFICE TU BE Instructions below accompany the diagram and table for describing how to use this method of measuring pumping rate. The set-up for this method requires the following:
A. The hole, or orifice, In the orifice plate must be perfectly round and centered on the end of discharge pipe. The orifice diameter should be about 1/2 to 3/4 pipe dia.
B. Orifice must have clean, square edges.
C. Edge of hole must be beveled to l/16-.inch thick.
D. Orifice plate must be vertical ( pipe horizontal ).
E. Bore of pipe should be smooth and free of obstructions.
F. Discharge pipe must be straight and level for a distance of as least 4 feet, but preferably 6 feet.
G. A device, called the piezometer tube, measures the water level or pressure in the discharge pipe. This tube is attached to a 1/8-inch or 1/4-inch diameter nipple tapped into the discharge pipe exactly 24 .inches from the orifice plate, midway between the top and bottom of the pipe.
H. Piezometer tube consists of a rubber or plastic hose, 4-5 feet long with a glass tube at the end. This hose is raised or lowered until the water level is seen in the clear tube.
I. An accurate scale, labeled in Inches, and oriented vertically, must be fastened to the discharge pipe. This allows the vertical distance, in Inches, to be measured from the center of the piezometer tube port, In the discharge pipe, up to the water level, as seen In the piezometer tube. The zero level of the scale rests at the center-line of the piezometer tube hole in the discharge pipe.
J. No air should be allowed to be trapped in piezometer tube. To prevent this, let the piezometer tube hang down between readings so that water will flow through the tube.
Make several water level measurements with the piezometer tube on the scale to make sure the pumping rate stays constant-. Use the graph on the following page to determine the pumping rate.
Note: If you have decided to go to the trouble to construct this orifice tube, keep in mind that you can use this same device to check the efficiency of your pump. Conduct the pump test as you would for determination of the conversion factor and check to see if the the rates stay the same. A lower pumping rate and a higher energy usage could indicate that your pump is not working as efficiently as It did. More on this Is available from the Commission and hopefully in a future hand-out.
South Carolina data collection form. 3-63
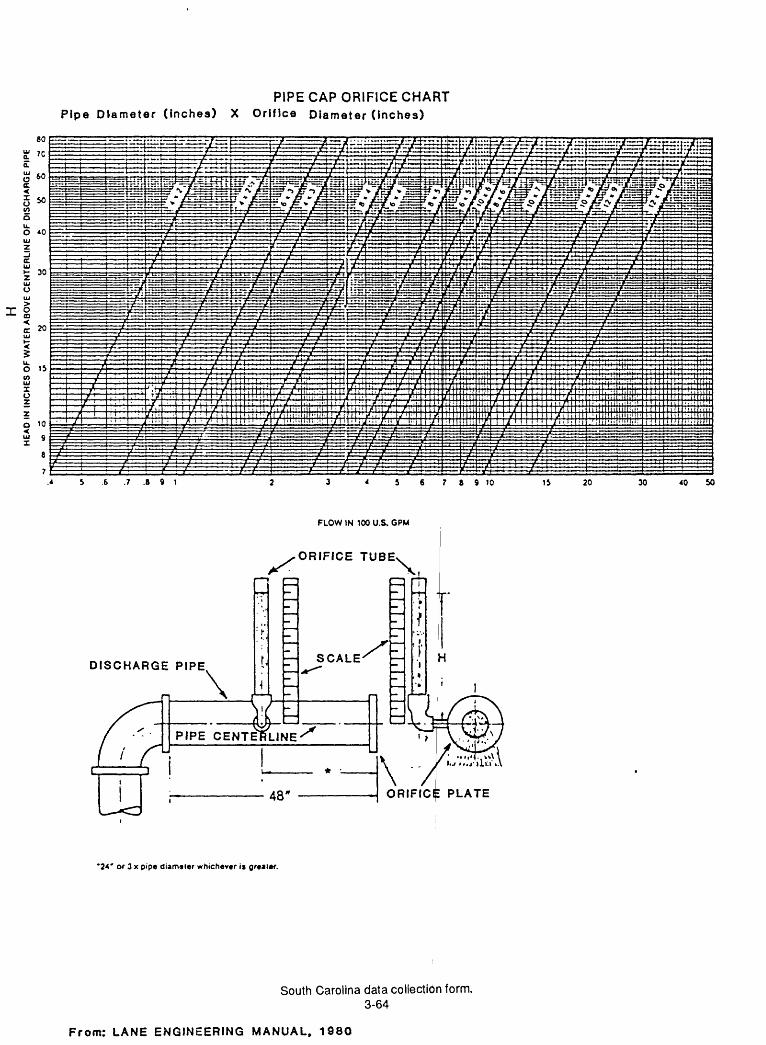
HH
EA
D I
N I
NC
HE
S O
F W
AT
ER
AB
OV
E C
EN
TE
RL
INE
OF
DIS
CH
AR
GE
PIP
E
1
0
u
*
V"
~ a
o
v>
3
o
o
o
o
o
o
CO
o c O &) ZJ
&)
CO
CX &>
o
o_ CD" a o-' Z
J
0_
CO
O
I
> 73
' r
x TO »
*
rO
x^
^
D n S\
m^
^ o
f^
>
^IS
St
TJ 13 m o m z H "V
=o(<
H z
m \ -/< ~L p ^
i_X
^ n r M K j-T
*- S
^--
T)
TJ m
X J
'.
: »
'I'l'l
'l' \. o >
r
m3
\'IT
I'l
1»"
. » * - i-
:
«
- 'X
^\
TI'll \ O 31 n
O m H c OJ
M'l'll/
--
H-
_^
^
XJ
A 3
O :r X o SS
o o
» >
3
-O
o
O
^ 2
33
Oo
nia
O

FREE FLOWING HORIZONTAL or INCLINED PIPEThis method gives a fairly good estimation of pumping ratediscussion below for detail's. Courtesy U. S. Geological Survey
ESTEUirS'G FL01T FROM HORIZONTAL OR INCLUZD PIPSS
(FULL PIPES)
See
Inclined
A fairly close deteroinatics of the flow fron full opan pipas say b« nade by aoasurine tha distance the traaa of water trarels parallel to tha pipe in filling 12 inches verti cally.
Ueasure tha inside dianeter of the pipa accurately (in inches) and the distance (A) tha strean travels in inches parallel to the pipa for & 12-inch vertical drop.(See diagru»)
The flow, in gallons per ninut*, qua.Is the distance (A) in inches BU!- tiplied by & oooat&nt I obtninod froa tha following tablet
I.D.Pipe
2lAlA3/4
3l#1/23/4
K
3.34.15.16.2
7.38.6
10.011.5
I.D. Pipe
41X?1X?3/4
51/41/23/4
E
13.114.716.518.4
20.422.524.727.0
I.D. Pipa
6l/?1/23/4
7l/f1/23/4
r29.431.934.537.2
40.042.945.949.0
I.D.Pi?9
8lA/1/23/4
9l/f1/23/4
I
52.355.559.062.5
66.269.973.777.7
I.D. Pip«
101/41/23/4
11l£1/23/4
K
81.785.990.194.4
98.9103.108.113.
I.D. Pip«
121/2
131/2
141/2
1516
£
113.123.138*149.
160.172.184.209.
(PARTIALLY FITTED PIPES)
For partially filled pipes, oe*3ure the fr»«bosjrd (?) *nd th« inside dUaetar (D) and o»loulAt« tha mtio of ?/D (in percent). Me*s- ure tha stre&a &s axpl&ined &boTB for full pi?"1 &nd o&lcul&t« tha dlsohjo-ge. The notu&l dia- oh&rga will be ipproxin&tely tha v^lue for & full pipa of tha suaa divaatar aultipliad by tha correction fnotor froa tha following tablet
T/D Percent
510152025
F»otor
0.981.948.905.358.305
FAPercent
3035404550
Factor
0.747.688.627.564.500
P/DPercent
5560657075
Factor
0.436.375.312.253.195
FAPwroant
80859095
100
Factor
0.142.095.052.019.000
VERTICAL PIPE OR CASINGThis method gives an approximatediscussion below for instructions.
pumping rate value. See
Tha fcpproxiafcta fl»w froa rartioal pipas or casing* can ba dataralnad by ja»«.8uring tha rnaT^^mt baight (H) in inches to which tha w*,tar jet rises &bcr« tha pipa, snd tha inside diaaatar of tha pipa (D) in ineha*.
Tha flow in g&llon« par minuta i» giran in tha following table for diff- rant sires of Standard Pipa snd for - different heights of tha wmter jets.
South Carolina data collection form. 3-65
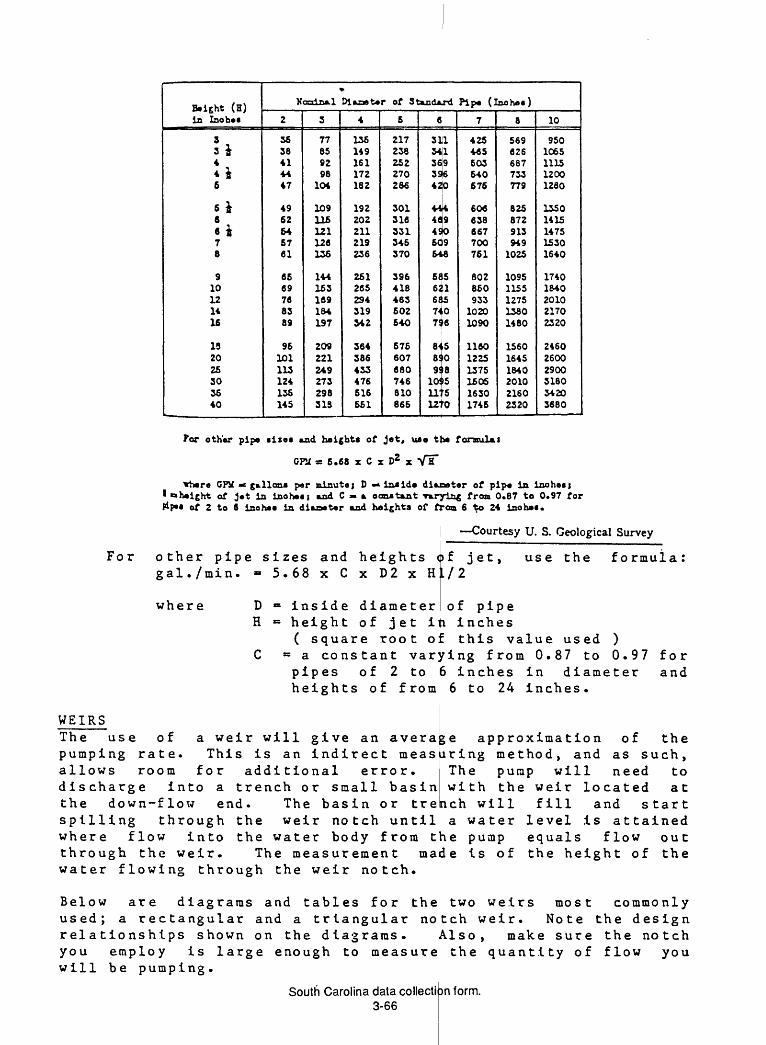
Height (H) in Inohe*
3si4ii6
6*66 &78
910121416
IS2026303640
NosxinjLl Dlaneter of Standard Pipe (inohet)
2
3638414447
4962646761
6669768389
96101113124135145
3
77859298
104
109116121126136
144153169184197
209221249273298313
4
136149161172182
192202211219236
261265294319342
364386433476616551
6
217238252270286
301316331346370
396418463602640
675607680746810866
6
311541136|9396420
444fl4S
490
609648
6£6268747S
848<9<
10iU'
51506
508
)5'5
1270
7
425465503540676
606638667700761
802850933
10201090
116012251375150516301746
8
569626687733779
825872913949
1025
10951155127513801480
156016451840201021602320
10
9501065111512001280
13501415147515301640
17401840201021702320
246026002900318034203680
For other pip* «ire« and haightt of Jet, ua« tb« foraul*i
OPU a 6.68 x C x D2 x Ylf
*S«re CPU K gallon* p«r minutej D in*ids diaeater of pip« in iuoha*iHeight of Jet in inoh«*i and C a oonmtant raryiag from 0.87 to 0.97 for
of 2 to 6 lnoh*« la dianeter and Heights of frcna 6 to 24 inoh»«.
Courtesy U. S. Geological Survey
For other pipe sizes and heights of jet, gal./min. » 5.68 x C x D2 x HL/2
use the formula:
where D = inside diameter of pipe H = height of jet ift inches
( square root of this value used ) C « a constant varying from 0.87 to 0.97
pipes of 2 to 6 inches in diameter heights of from 6 to 24 inches.
for and
WEIRSThe use of a weir willpumping rate. This is anallows room for additional error.discharge into a trench or small basinthe down-flow end. The basin or trench will spilling through the weir notch until a water where flow into the water body from the pump through the weir. The measurement made is of
give an average approximation of the indirect measuring method, and as such,
The pump will need to with the weir located at
fill and start level is attained equals flow out the height of the
water flowing through the weir notch.
Below are diagrams and tables for the two weirs most commonly used; a rectangular and a triangular notch weir. Note the design relationships shown on the diagrams. Also, make sure the notch you employ is large enough to measure the quantity of flow you will be pumping.
South Carolina data collection form. 3-66

ALTERNATIVE METHOD BASED ON ELECTRICAL ENERGY USED If you know some specific information for the pump and motor water usage can be estimated by multiplying the amount of energy used by a term derived from t-he pump and motor ef f ici ency. The relationship is as follows:
no of gal. - KW-hours used x ( (Eff* )(Eff )(317,500)/ HEAD)p m
Where:HEAD = pumping water level + water level in storage
tank, o r « pumping water level + (water pressure x 2.307).
Eff = .60 to .85 (depending on age and design of pump)P
Effm = .60 to .93 (depending on horse power of motor -see table below).
TYPICAL, MOTOR EFFICIENCY {%) 60 CYCLE
MOTORHP
1/31/23/4
1i S2357
101520253040506075
100125150
SINGLE PHASE1750RPM
6064637072767676
3450 RPM5961656672737578
3 PHASE1750 RPM
79.582.084;84i868787.588.589.589.590.590.591.091.592.092.092.592.5
34 50 RPM
697679.583.085.084.586.585.587.587.589.089.590.090.590.591.092.091.592.5
From: BERKELEY PUMP CATALOG, 10/1/79
South Carolina data collection form. 3-67
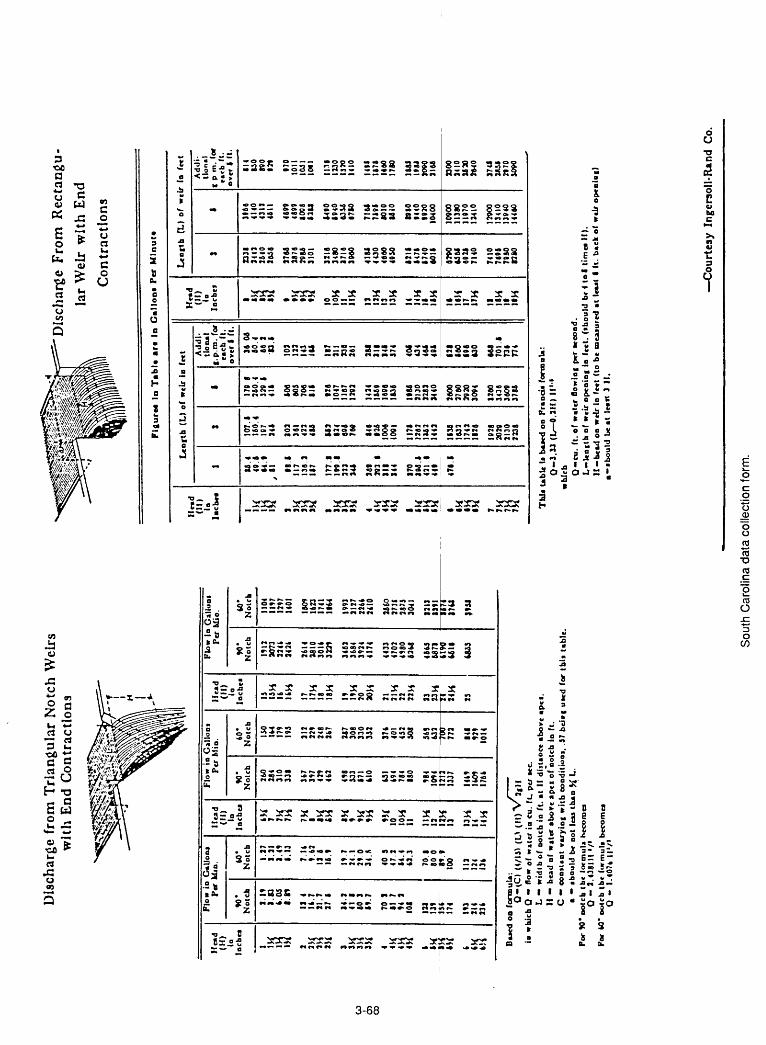
Dis
char
ge f
rom
Tri
ang
ula
r N
otch
Wei
rs
wit
h E
nd C
ontr
acti
ons
CO
00
Head
(H)
la
Inches
1 \\{
JH IH 2 ni
151
I JH 3H 4 <K j L
/
4H
6 *K *?
l
6H k
Plo
w i
n G
allo
n*
Per
IdU
n.
90
*
No
te*
1.1
91
.83
4>.0
11
.19
11
41
4.7
31
.27 14
.41 60 69
.
70 61 94 101
124
139
ttt
174
193
214
216
W
No
tch
1.2
71
.11
1.4
96
.13
7.1
49
.61
11
6
16.9
19
.72
4.1
29
03
4.5
40
947
2
64
.44
1.3
70
.880
0t»
.ttoo 111 12
4 13
6
He
ad
In
Incb
ej
H 7 7W ?H 8 *8 IH 9 »H t,{
10 lo^f
11 HH 13 *?/
13 I3H
14
Flo
w i
a C
allo
Ds
Per
MID
.
No
tch
760
284
310
338
167
197
429
462
498
133
671
410
til
694
784
8SO
984
1094
1213
1337
1449
1609
17
(6
60*
No
tch
IM>
164
179
191
112
229
248
267
287
308
330
312
374
401
412
108
56)
433
700
773
848
929
1014
He
ad
(H
) ia
la
ch
ei
11 llH
16 UH
17 18 18
H
19 70 30
>i
21 2IV
i22 22
M
23 2JH
24 21
Plo
w I
n G
allo
ns
Per
MJo
.
90
*
No
tch
1912
3073
3244
3424
3614
2410
30
1632
31
14(1
1684
19
2441
74
4431
4702
4980
6368
4661
W71
4190
6411
tui
to*
Notr
b
1104
1197
1297
1401
1609
1623
17
4111
64
1991
1127
22
6624
10
24(0
37
K38
7130
41
1211
1191
1674
I7U
1914
T *
**
Ba»
ed o
n f
orm
uU
: / ~
Q
-lC
) (4
/111
(U
(M
)VJ
iH
in w
hic
h Q
flow
of
wat
er i
n cu
. ft
, pe
r te
e.L
*
wid
th o
f oo
tch
ia
ft.
at I
I d
lsu
oct
ab
ove
apct
. II
h
ead
of w
att*
ab
ort
ap
ei o
f ao
tcb
in
ft.
C c
onst
ant
vary
ing
wit
h o
ond
itiu
oi,
.17
bcl
vf u
»ed
for
Ibli
tab
le.
«
ib
ould
b*
aot
leu
th
an ^
L..
For
90*
not
ch t
he
form
ula
bec
omes
0 -
2.4
3811
1 /
«Fo
r M
* oo
tcb
th
e f"
rmu
li b
ecom
e*
Q -
1.40
7* |
|>/»
Dis
char
ge F
rom
Rec
tang
u
lar
Wei
r w
ith
End
Contr
acti
ons
IB T
abU
art
IB
Gal
lon
* P
er M
lnu
t*
He
ad
(11
)la
lacb
rt
1 1 W IH I 8 i |jy IH In 4 m i jw IH i 6V4
IH 7 7V
i7
H
Lenrt
b (L
) o
f w
eir i
n fe
et
1
16
.44
9.6
64
.1
11
111
7 13
6 3
167
17
7.8
199
831
324
6
141
J93
611
114
4
170
1M
.I41
1 1
441
471.1
1
10
7.1
1(0
.419
734
1
103
161
422
486
661
124
006
709
141
926
1004
1001
1176
1701
1142
1443
1636
1031
1743
1126
1978
207V
2130
2238
1
179
17
60
.412
9 6
416
604
601
704
816
28
1047
1107
I7V
2
1424
1649
1696
1636
1986
3130
3283
1440
7000
3700
3V 2
010
94
1200
1430
100V
1786
Ad
di
tio
na
lI.
p.r
o.
for
each
ft.
ove
r 6
ft.
18
046
0.4
66
28
3.6
103
123
141
164
117
111
236
261
3S8
111
141
174
404
434
404
496
621
600
698
630
648
70
1.6
736
774
He
ad
(ID lo
Inches
| 'K |u 8H
t $ 10 IOH
11 HM
13 "H 13 I3M
14 !<H
16 I6H
16 I6){
17 mi
II UV
iII 1I
H
Lco
rtb
(L
) o
f w
eir
In
fee
t
1
2338
3(1
12
1(0
2W
6
3706
3876
2V
84
1101
1218
3480
1718
1V40
4186
4430
4600
4910
6216
6476
6740
0011
87VO
6104
0914
7140
7410
7696
7980
1280
1
11(0
4140
4311
4611
46W
4899
60
08
6368
6490
6940
0314
6710
7104
7196
8010
8610
BIO
9440
1920
1040
0
IOVO
O11
180
1197
012
410
I7V
OO
1141
013
940
1440
0
Addi
tio
n.!
| p m
. (o
rr.
cb ft
.o
ve
r 6
ft.
614
840
IVO
971
970
ton
1011
IM
I
1116
1230
1370
1410
1411
1676
1*00
1780
1681
1964
1090
3106
3300
11 1
0363)
3*4
0
3744
Mil
7170
1090
Tb
ia t
able
(
baae
d on
Pra
ocia
for
mu
la:
Q-3
.U (
L 0
.2H
) I!
"
wh
ich Q cu
. ft
. of
wat
er f
low
iof
per
seco
nd
.L
Uoit
h o
f w
eir
open
ing
in f
ret,
(sh
ould
br
4 Io
8 ti
me*
II)
. II
b
ead
oo w
eir
la f
e*t
(to
be m
easu
red
at
leaa
t I
ft.
back
of
wti
/ a
-ib
ou
ld b
e at
lea
st 3
II.
Co
urt
esy
Ing
enol
l-IU
nd C
o.
Sou
th C
arol
ina
data
col
lect
ion
form
.

State of South Carolina
WATER RESOURCES COMMISSIONWATER USE SECTION
FORM WU-WS-1
1201 Main Street. Suite 1100 Columbia, South Carolina 29201
WATER USE SYSTEM REPORT
WATER USER ID
FIPS City Code _
SHADED AREAS FOR OFFICIAL USE ONLY
_ Primary SIC _________________ Secondary SIC
"IPS County Code FIPS State Code
COMPLETION OF THIS FORM WILL BE REQUIRED ONLY ONCE UNLESS SUBSTANTIAL ALTERATIONS ARE MADE TO YOUR WITHDRAWAL, USE. OR DISCHARGE SYSTEMS.
Fill in the appropriate blanks or check proper spaces. Make best estimates of percentages and volumes requested. These forms are de signed to provide ample space for complex system descriptions. Therefore. Public Supply systems of a simple configuration may require com pletion of only a few spaces in each section, if more space is required to complete any section of this report, make additional listings on a separate sheet in a similar manner as on this form.
As specified in Regulation 121-10.8(A), you nave the right to indicate that any data supplied on this form may be held confidential by this Commission. Any information will be held confidential by marking a check in front of the specific information section heading (such as II B, III C, etc.) where the information is contained.
If youJiave any questions, contact the Water Use Section at the address or telephone number listed above. The completed PUBLIC SUPPLY SYSTEM DESCRIPTION REPORT FORM is to be submitted to the address listed at the top of this form.
I. WATER USER IDENTIFICATION (Section 49-4-20(a)(b))For questions A3, A4, and AS, fill in the information for the person who will be completinq WATER USAGE REPORTING. A. USER NAME
1. Facility
3. Contact Person
5. Address ___
2. Telephone
4. Telephone.
WITHDRAWAL SOURCE INFORMATIONLOCATION: Plot the location of treatment plants, wells, and surface water withdrawal points, that you will describe below, on the coun
ty highway map attached. (Sec. 49-4-20(a)(b)(c)(d)(i-2)) A. PURCHASE WATER (Sec. 49-4-20(cUk»
1. If all or part of your water supply is purchased list the name of your water supplier _________________________
3. Full Time ( ) or for peak demand periods ( )
4. Percentage of water supply that is purchased _________%
B. GROUND WATER SOURCES (Sec. 40-4-20(bMc)(e))Fill in requested information below one column for each well.
2. User ID Code
SCWRC WELL #
Owner's Well ID.
Source Status: Primary
Stand-by
Well depth below land (ft)
Screen Locations:
1. Top/ bottom
2. Top / bottom
3. Top / bottom
Pump Setting depth
Pump Capacity
Motor Capacity
Latitude/ Longitude
Hydrologic Unit
1.
( )( )
ft
ft/ ftft/ ftft/ ft
ft
gpm
HP
/
2.
( )
( )
ft
ft/ ft
ft/ ft
ft/ ft
ft
,. gpm
HP
/
3.
( )
( )
ft
ft/ ft
ft/ ft
ft/ ft
ft
gpm
HP
/
4.
( )
( )
ft
ft/ ft
ft/ ft
ft/ ft
ft
aom
HP
/
C. SURFACE WATER SOURCES (Sec. 49-4-20(a)(c)(d)(h))Treatment Facility Treatment
Owner's Name Capacity MGDReservoir, river,
or Stream
South Carolina data collection form. 3-69
County Latitude Longitude
/
/
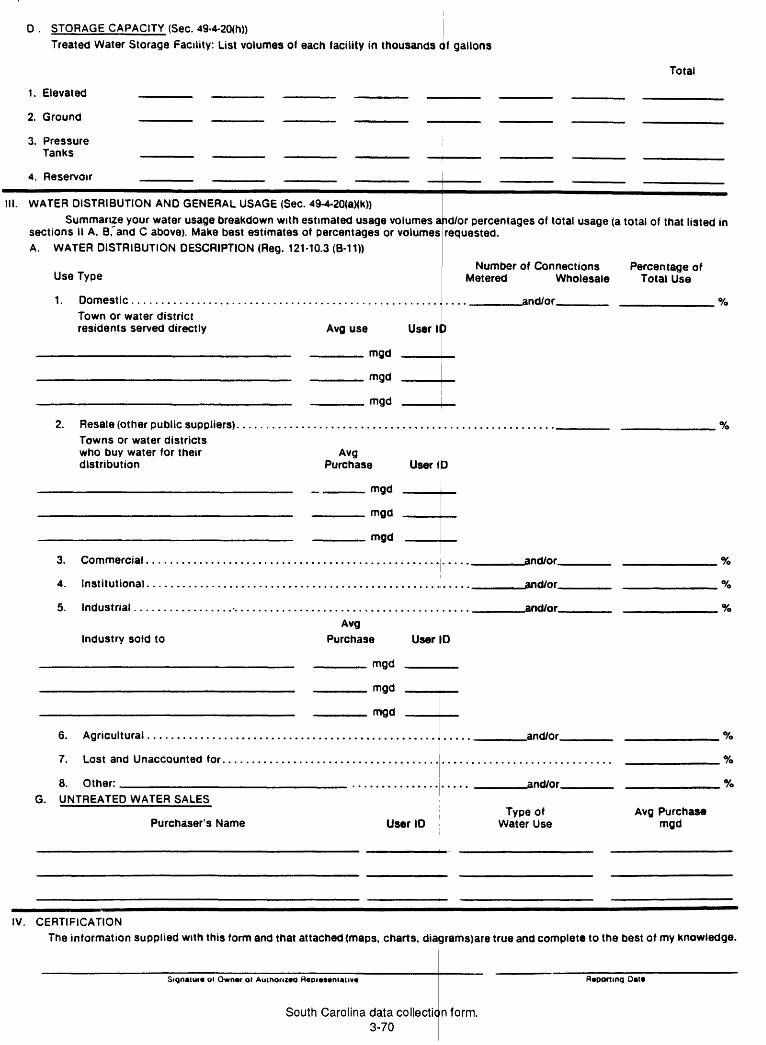
D . STORAGE CAPACITY (Sec. 49-4-20(h))
Treated Water Storage Facility. List volumes of each facility in thousands of gallons
Total
1. Elevated
2. Ground
3. Pressure Tanks
4. Reservoir
III. WATER DISTRIBUTION AND GENERAL USAGE (Sec. 49-4-20(aMk»
Summarize your water usage breakdown with estimated usage volumes and/or percentages of total usage (a total of that listed insections II A, B, and C above). Make best estimates of percentages or volumes requested.A. WATER DISTRIBUTION DESCRIPTION (Reg. 121-10.3 (8-11))
Number of Connections Percentage of Use Type Metered Wholesale Total Use
1. Domestic ......................................................... _____and/or_____ __________ %Town or water districtresidents served directly Avg use User II)
_______________________ _____ mgd
___________________________ _____ mgd ____[__
_____ mgd _____
2. Resale (other public suppliers)......................................................_____ __________ %Towns or water districtswho buy water for their Avgdistribution Purchase User ID
___________________________ _____ mgd
__________________________ _____ mgd
__________________________ _____ mgd
3. Commercial....................................................... _____and/or_____ __________ %
4. Institutional....................................................... _____and/or_____ __________ %
5. Industrial.......................................................... _____and/or_____ __________ %Avg
Industry sold to Purchase User ID
__________________________ _____ mgd _____
__________________________ _____ mgd _____
_____ mgd
6. Agricultural....................................................... ______and/or______ __________ %
7. Lost and Unaccounted for.................................................................. __________ %
8. Other: ________________________ .................... _____and/or_____ __________ %G. UNTREATED WATER SALES
Type of Avg Purchase Purchaser's Name User ID Water Use mgd
IV. CERTIFICATION
The information supplied with this form and that attached (maps, charts, diagrams)are true and complete to the best of my knowledge.
Signaiui* oi Ownm ol Authoiueo Repi«s«niaiiv«
South Carolina data collection form. 3-70
Reporting D«t«

Form WU-1
State of South Carolina
WATER RESOURCES COMMISSIONWATER USE SECTION1201 Main Street, Suite 1100
Columbia, South Carolina 29201
WATER USE REPORT
Section I. Water User Identification
Owner___________________
Address.
City__ State
Phone
Zip Code
Section II. Monthly Use
Owners ID Source IDCalc.
Method
MONTHLY USAGE (in millions of gallons)
Section III. The above is true and correct to the best of my knowledge.
Water User Name Authorized Representative Date
South Carolina data collection form. 3-71
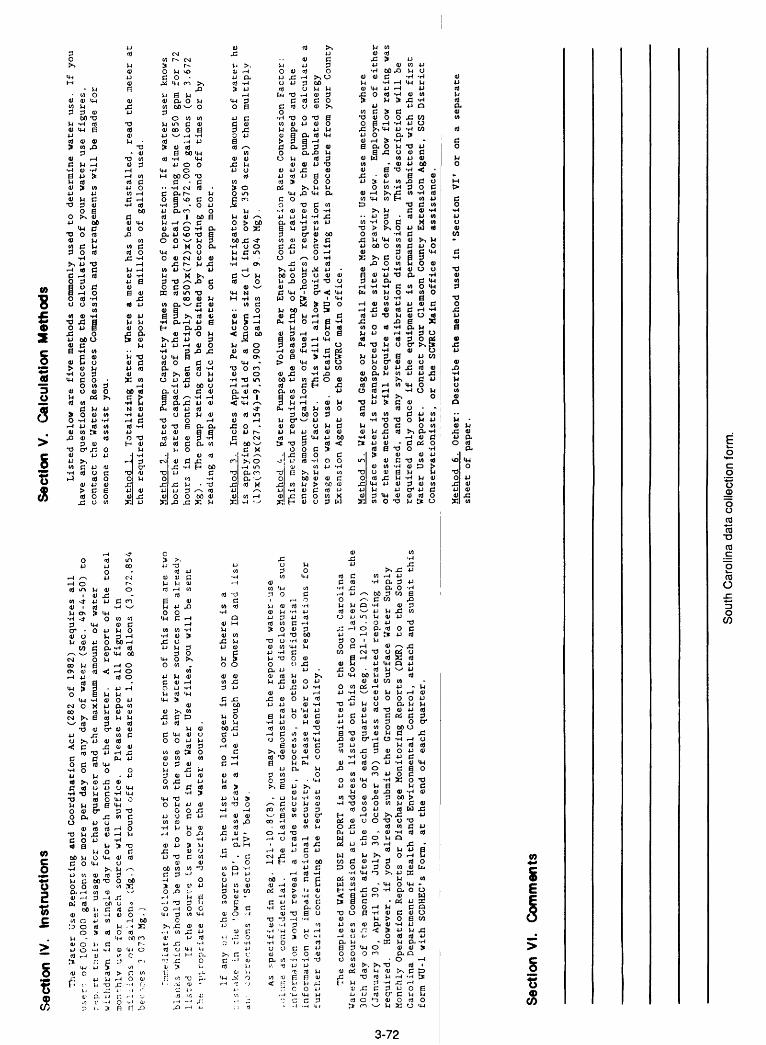
Sec
tion
IV.
Inst
ruct
ions
Sec
tion
V.
Cal
cula
tion
Met
hods
The
Water
Use
Reporting and Coordination Act
(282
of 1982)
requires all
user:; of
100,000
gall
ons
or mo
re per
day
on any day
of water (Sec.
49-4
-50)
to
r-ip> rt tr.eir water
usage
for
that quarter and
the
maximum am
ount
of water
withdrawn in a
sing
le da
y for
each month of
the
quarter.
A re
port
of the
total
monthly us
e fo
r each source will suffice.
Please repo
rt all
figu
res
in
millions of gallon*
(Mg.
) an
d round
off
to th
e nearest 1,000
gallons (3,072,854
bec-
oes
3 073
Mg.)
r.T-jr
.e.i lately
following
the
list
of sources
on the
front
of th
is form are
two
blan
ks which
should be
used to record th
e vise of
any
water sources
not
alre
ady
listed
If the
sour
ce is new or
not
in the
Water Use
files, you will be
se
nt
the. ap
prop
riat
e forrc
to de
scri
be the
water source.
If an
y ot th
e sources
in the
list
ar
e no longer in use
or there
is a
::: st
rike
in che
'Owners
ID',
please dr
aw a
line through the
Owners ID an
d li
st
air
corrections in 'S
ecti
on IV be
low.
AS sp
ecif
ied
in Reg. 12
1-10
.3(3
), you may claim the
reported water-use
.>>l-.;T.e as
confidential.
The
clai
mant
must demonstrate th
at disclosure of such
information
would reveal a
trade
secret,
process, or
other
conf
iden
tial
information or
im
pair
national security.
Please refer
to the
regulations for
further
details
concerning the
request
for
confidentiality.
The
completed WATER USE
REPORT is to
be
submitted to the
South
Carolina
'water Re
sour
ces
Commission at th
e address listed on th
is form no later
than
the
30th day
of the
month after
the
close
of each quarter (Reg.
121-10.5(0))
(Jan
uary
30
, April 30
, July 30
, October 30
) unless accelerated reporting is
required.
However, if you
already submit th
e Ground or Surface Water Supply
Monthly Operation Re
port
s or
Discharge Monitoring Reports (D
MR)
to the
South
Carolina Department of Health and
Environmental Control, attach and su
bmit
this
form WU
-1 with SC
DHEC
's Form,
at th
e end
of each quarter.
Listed below are
five methods commonly used to
de
term
ine
water use. If you
have an
y questions concerning th
e calculation of your water use figures,
contact the
Water Re
sour
ces
Commission and arrangements wi
ll be
made fo
r so
meon
e to assist you.
Method 1. Totalizing Me
ter:
Where a meter ha
s been in
stal
led,
re
ad th
e meter at
the
required in
terv
als
and
report the
millions of
ga
llon
s used.
Method 2. Rated Pump Capacity Times
Hour
s of
Operation: If a water user knows
both the
rated capacity of th
e pump an
d th
e total
pumping time (850 gp
m for
72
hours in one
month) then multiply (850)x(72)x(60)=3,672,000 ga
llon
s (o
r 3.
672
Mg).
The
pump rating can
be obtained by
recording on and
off
time
s or
by
reading a
simp
le el
ectr
ic hour meter on
th
e pump mo
tor.
Method 3. Inches Applied Per
Acre:
If an irrigator knows
the
amou
nt of
water he
is
applying to a
field
of a known si
ze (1 in
ch ov
er 350
acres) then multiply
(l)x(350)x(27,154)-9,503,900 gallons (or
9.504
Mg).
Method
*.. Water Pu
mpag
e Vo
lume
Pe
r Energy Consumption Rate Conversion Fa
ctor
: This method requires the
measuring of
both th
e ra
te of water pumped and
the
energy amount (gallons of fu
el or
KW-hours)
required by th
e pump to calculate a
conversion factor.
This will allow quick conversion from tabulated energy
usage to water use.
Obtain form WU-A detailing th
is procedure from your County
Extension Agent
or the
SCWRC
main office.
Method 5.
Wier and Gage or
Parshall Flume
Methods: Us
e th
ese
methods where
surface
water is transported to
th
e si
te by gravity flow.
Employment of
either
of these
methods will require
a description of your system,
how flow rating was
determined,
and any system calibration discussion.
This description will be
required only once if
the
equipment is permanent and submitted with the
firs
t Water Us
e Re
port
. Contact
your Clemson County Extension Agent, SCS
District
Conservationists, or
the
SCWR
C Main of
fice
fo
r assistance.
Method 6. Ot
her:
De
scri
be th
e method used in
sheet
of pa
per.
'Section VI
' or
on a
separate
Sec
tion
VI.
Com
men
ts
Sou
th C
arol
ina
data
col
lect
ion
form
.

Form CAP-1
State of South Carolina
WATER RESOURCES COMMISSION1201 jvtain Street, Suite 1100, Columbia, S.C. 29201
CAPACITY USE REPORT
Owner/Authorized Agent
Facility __________
Address ___________
City ____________
Phone
State Zip Code
Well Identifiers
SCWRC No. Owner No.
Water Use Reports DueMonthly Usage (millions of gallons)
Meter Reading
at end of Quarter
The above is true and -Direct to the best of my knowledge.
Print your name Signature
(Authorized a ,ent as designated on records of Water Resources Commission)
South Carolina data collection form. 3-73
Date

Instructions
1. Review form for correctness: (a) owner/authorized agent name, (b) address, (c) owner's well name/number.
2. Complete form as follows:(a) enter monthly wi JhdrawaJ for each well in column under the correct month(b) record the last meter reading of the quarter for each well in Meter Reading
column I(c) fold and staple tiie water-use report wi^h the Commission's address facing
outward
3. Mail form by the 10th day after the end of the quarter to avoid fine for late reporting.
PlaceStampHere
_J
So jth Carolina Water Resburces Commission
1231 Main Street Suite 1100
Co.umbia, S. C. 29201
South Carolina data coHectic n form. 3-74

jgg/
1
Farm
er
or
Forility
N
nr
Add
ress
:
2O
wne
rs
ID
Des
crip
t.
Sou
rce
Ow
ners
ID
D
escr
ipt.
Sou
rce
Ow
ners
ID
D
escr
ipt.
Sou
rce
Ow
ners
ID
D
escr
ipt.
Sou
rce
Ow
ners
ID
D
escr
ipt.
/^^$fc\
Sta
te
of
Sou
th
Car
olin
a f<
y ^\
Form
AG~
1
WAT
ER
RE
SO
UR
CE
S
CO
MM
ISS
ION
U
^Jjs
WAT
ER
US
E
SEC
TIO
N
Xf^
^^W
1201
M
ain
Str
ee
t,
Sui
te
11
00
\0
UR
Cg^X
C
olum
bia,
S
outh
C
arol
ina
2920
1
Ow
ner
Nom
e n*
»-
Irrig
atio
n
Eq
uip
me
nt
Irrigatio
n
Equ
ipm
ent
Irrigatio
n
Equ
ipm
ent
Irrigatio
n
Eq
uip
me
nt
Irrigatio
n
Equ
ipm
ent
^
The
abov
e is
tr
ue
an
d co
rrect
to
th
e
Cal
c.
Cro
ps /
Acr
es
Met
hod
/
JAN
/JU
L
Cal
c.
Cro
ps /
Acr
es
Met
hod
/
JAN
/JU
L
Cal
c.
Cro
ps /
Acr
es
Met
hod
/
JAN
/JU
L
Cal
c.
Cro
ps /
Acr
es
Met
hod
/
JAN
/JU
L
Cal
c.
Cro
ps /
Acr
es
Met
hod
/
JAN
/JU
L
best
of
m
y kn
owle
dge.
T^phon*.
-
City:
Sto
le:
7ip
MO
NTH
LY
US
AG
E
(in
mill
ion
s o
f g
allo
ns)
FE
B
MA
R
AP
R
MA
Y
JUN
AU
G
SE
P
OC
T N
OV
D
EC
FE
B
MA
R
AP
R
MA
Y
JUN
AU
G
SE
P
OC
T N
OV
D
EC
FEB
M
AR
A
PR
M
AY
JU
N
AU
G
SE
P
OC
T N
OV
D
EC
FEB
M
AR
A
PR
M
AY
JU
N
AU
G
SE
P
OC
T N
OV
D
EC
FEB
M
AR
A
PR
M
AY
JUN
AU
G
SE
P
OC
T N
OV
D
EC
Wat
er
Use
r N
ome
Au
tho
rize
d
Rep
rese
ntat
ive
Dot
e
Sou
th C
arol
ina
data
col
lect
ion
form
.
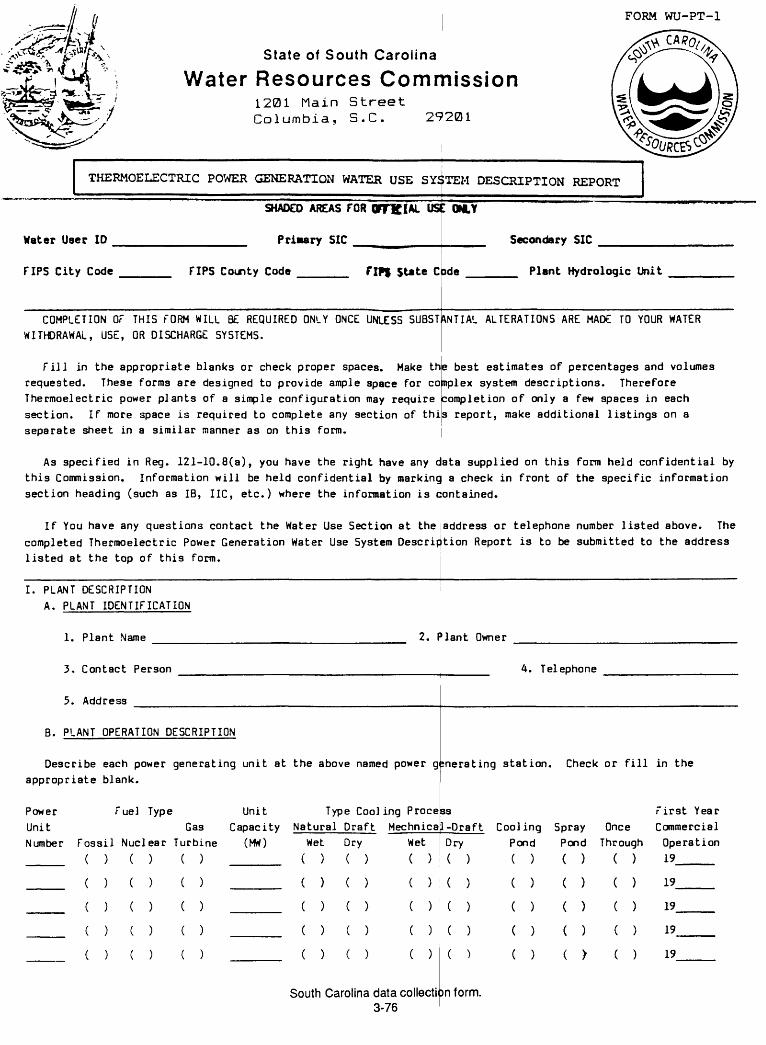
FORM WU-PT-1
-51 "*L,*-^^r^^y^^v
State of South Carolina
Water Resources Commission1201 Main Street Columbia, S.C. 29201
THERMOELECTRIC POWER GENERATION WATER USE SYSTEM DESCRIPTION REPORT
Water User ID
SHADED AREAS FOR OFFICIAL
Primary SIC
ONLY
Secondary SIC
FIPS City Code FIPS County Code SUte Cade Plant Hydrologic Unit
COMPLETION Of THIS FORM WILL BE REQUIRED ONLY ONCE UNLESS
WITHDRAWAL, USE, OR DISCHARGE SYSTEMS.
SUBSTANTIAL ALTERATIONS ARE MADE TO YOUR WATER
fill in the appropriate blanks or check proper spaces. Make the best estimates of percentages and volumes requested. These forms are designed to provide ample space for complex system descriptions. ThereforeThermoelectric power plants of a simple configuration may require completion of only a few spaces in eachsection. If more space is required to complete any section of this report, make additional listings on a separate sheet in a similar manner as on this form.
As specified in Reg. 121-10.8(a), you have the right have any data supplied on this form held confidential by this Commission. Information will be held confidential by marking a check in front of the specific information section heading (such as IB, IIC, etc.) where the information is contained.
If You have any questions contact the Water Use Section at the address or telephone number listed above. The completed Thermoelectric Power Generation Water Use System Description Report is to be submitted to the address listed at the top of this form.
I. PLANT DESCRIPTIONA. PLANT IDENTIFICATION
1. Plant Name 2. Plant Owner
3. Contact Person
5. Address
4. Telephone
B. PLANT OPERATION DESCRIPTION
Describe each power generating unit at the above named power generating station. Check or fill in the appropriate blank.
Fuel Type Unit Type Cooling ProcessGas Capacity Natural Draft Mechnical-Draft Cooling Spray Once
PowerUnitNumber Fossil Nuclear Turbine (MW) Wet Dry Wet Dry Pond Pond Through
First Year Commercial
Operation 19____
19____
19____
19
South Carolina data collection form. 3-76
19

II. WITHDRAWAL SOURCE INFORMATION
LOCATION: Plot the location of your facilities, surface water withdrawal points, wells, and water treatment plants, that you will describe below, on the county road map attached. [Sec. 49-4-20(a)(b)(c)(d)(i-(2)]
A. PURCHASE WATER [Sec. 49-4-20(c)(k)]1. If all or part of your water supply is purchased list the name of your.water supplier.
______________________________________________ 2. Uaer ID Code
3. Percent of water supply that is purchased
4. Purchase water source stauts: Primary ( ), Stand-by ( )
B. GROUND WATER SOURCES [Sec. 40-4-20(b)(c)(e)]
Fill in requested information below, one column for each well.
.SCWRC WELL £
Owner's Well ID
1. Top/Bottom
2. Top/Bottom
3. Top/Bottom
Pump Setting
Pump Capacity
Motor Capacity
Latitude/
Li
Hydrologic Unit
123
, ..- '-^'*;^^;^^^^.^J^?^,^^^
ID
la: Primary ( ) ( ) ( )
: Stand by ( ) ( ) ( )
lelow Land ft ft
.ions:
.ton, ft/ ft ft/ ft ft/
.torn ft/ ft ft/ ft ft/
torn ft/ ft ft/ ft ft/
j Depth ft ft
:y qpm qprn
ity hp hp
- - . .ML-: - ~ - ----- ~.ir2^:^-^--^r2^:
litude
jnit - - - - "" ' - ~_-j_ _-...---. ,-:- .
4
»* * '.: ; "l^1 , -" . ' .: _ w^tS^l^siT "' '';' > ' "**, ' J TKf&, JIT PC"V* ~» ^J
ft ft
ft ft/ ft
ft ft/ ft
ft ft/ ft
ft ft
qpm qpm
hp hp
... . . _. - 'I .- . . , _^
--...-..: ^ .,:-;,, -;-^f^^y
C. SURFACE WATER SOURCES [Sec. 49-4-20(a)(c)(d)(h)]
Reservoir, river or stream
name, and treatment plant
name, if applicable.
-r , Withdrawal or L ^tocation "^"^T^Hydrologic Treatment Plant Source Status County Latitude Longitude >
; Unit \ Capacity (GPM) Primary Stand-by Code D M S D M S }
South Carolina data collection form. 3-77
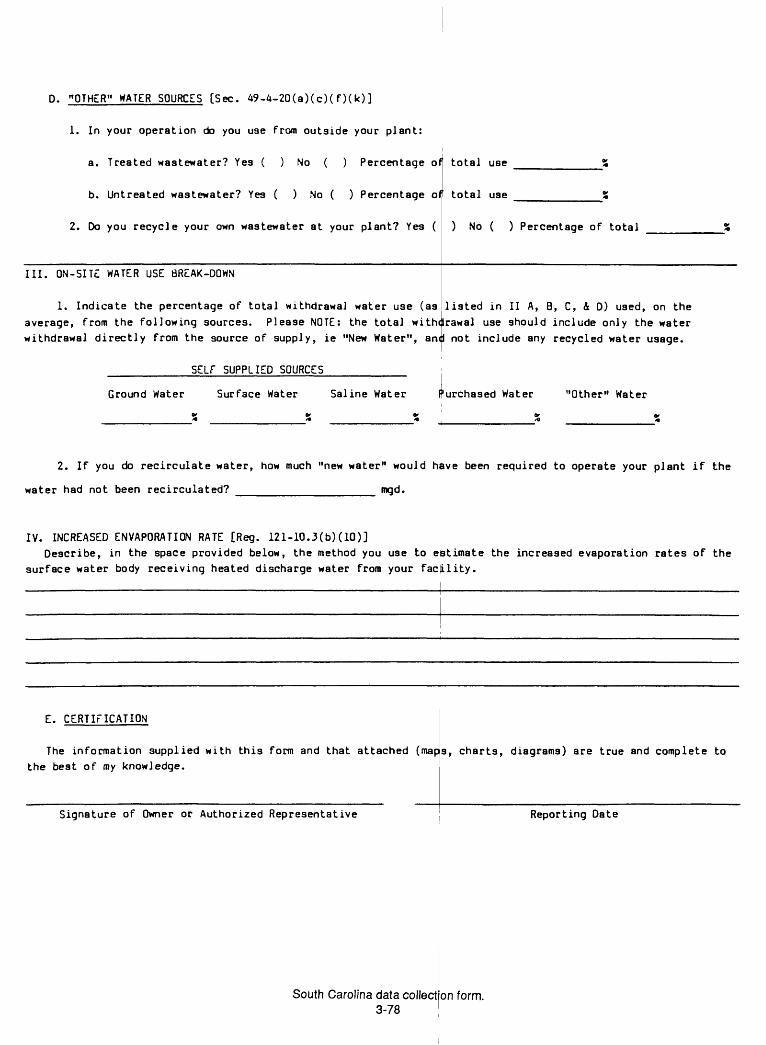
D. "OTHER" WATER SOURCES [Sec. 49-4-20(a)(c)(f)(k)]
1. In your operation do you use from outside your plant:
a. Treated wastewater? Yea ( ) No ( ) Percentage of total use
b. Untreated wastewater? Yea ( ) No ( ) Percentage of total use
2. Do you recycle your own wastewater at your plant? Yes ( ) No ( ) Percentage of total
III. ON-SITF. WATER USE BREAK-DOWN
1. Indicate the percentage of total withdrawal water use (as average, from the following sources. Please NOTE: the total withdrawal directly from the source of supply, ie "New Water", and
SELF SUPPLIED SOURCES
listed in II A, B, C, & D) used, on the withdrawal use should include only the water
not include any recycled water usage.
Ground Water Surface Water Saline Water 'urchased Water "Other" Water
2. If you do recirculate water, how much "new water" would have been required to operate your plant if the
water had not been recirculated? ________________ mgd.
IV. INCREASED ENVAPORATION RATE [Reg. 121-10.3(b)(10)]Describe, in the space provided below, the method you use to estimate the increased evaporation rates of the
surface water body receiving heated discharge water from your facility.
E. CERTIFICATION
The information supplied with this form and that attached (map the best of my knowledge.
Signature of Owner or Authorized Representative
s, charts, diagrams) are true and complete to
Reporting Date
South Carolina data collect on form. 3-78
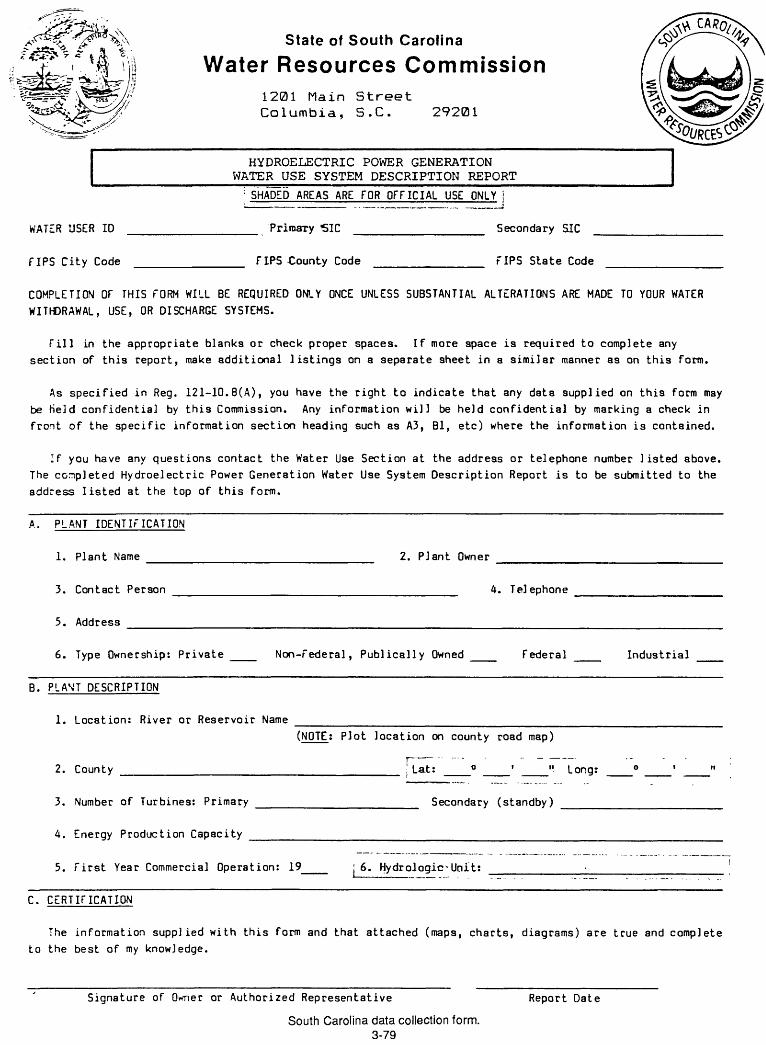
State of South Carolina
Water Resources Commission1201 Main Street Columbia, S.C. 29201
HYDROELECTRIC POWER GENERATION WATER USE SYSTEM DESCRIPTION REPORT
: SHADED AREAS ARE FOR OFFICIAL USE ONLY !
WATER USER ID
FIPS City Code
Primary SIC Secondary SIC
TIPS County Code FIPS State Code
COMPLETION OF THIS FORM WILL BE REQUIRED ONLY ONCE UNLESS SUBSTANTIAL ALTERATIONS ARE MADE TO YOUR WATER WITHDRAWAL, USE, OR DISCHARGE SYSTEMS.
Fill in the appropriate blanks or check proper spaces. If more space is required to complete any section of this report, make additional listings on a separate sheet in a similar manner as on this form.
As specified in Reg. 121-10.8(A), you have the right to indicate that any data supplied on this form may be Held confidential by this Commission. Any information will be held confidential by marking a check in front of the specific information section heading such as A3, Bl, etc) where the information is contained.
If you have any questions contact the Water Use Section at the address or telephone number listed above. The completed Hydroelectric Power Generation Water Use System Description Report is to be submitted to the address listed at the top of this form.
A. PLANT IDENTIFICATION
1. Plant Name 2. Plant Owner
3. Contact Person
5. Address
4. Telephone
6. Type Ownership: Private Non-Federal, Publically Owned Federal Industrial
B. PLANT DESCRIPTION
1. Location: River or Reservoir Name
2. County
(NOTE; Plot location on county road map)
flat: ° " Long:
3. Number of Turbines: Primary
4. Energy Production Capacity
Secondary (standby)
5. First Year Commercial Operation: 19_ j 6. Hydrologic^Unit:
C. CERTIFICATION
The information supplied with this form and that attached (maps, charts, diagrams) are true and complete
to the best of my knowledge.
Signature of Owner or Authorized Representative
South Carolina data collection form. 3-79
Report Date

South Carolina data collection form in pocket3-80
at the back of this report.

INSTRUCTIONS FOR COMPLETEING THE WATER-USE SURVEY QUESTIONNAIRE FOR PUBLIC SUPPLIES
GENERAL INFORMATION: Name of agency, organization, or utility district, mailing adrcss, and details regarding location of water source or operation. Indicate the year data reflect. If water use is seasonal, indicate months.
1. If source is an instream impoundment, provide name of stream. Indicate the amount of water withdrawn (in million gallons per day) from each source and the percent of the total each source represents. For example, 25 % from a municipal system and 75 % from a stream.
2. The amount of water withdrawn or purchased may be both metered and estimated, especially if from several sources.
3. Water obtained from a public-supply system, or purchased from an industry is not considered a "natural" source.
4. Self-explanatory. Indicate if pumps are automatic.
5. Describe any problems experienced within the last 12 months. This information may help the Division evaluate available resources.
6. An estimate of the number of persons or population served on an average day during the last year.
7. Number of connections, including commercial, industrial, and residential customers.
8. The amount of water (in million gallons per day) distributed as described in the questions. The total amount should equal the total amount of water withdrawn. The distribution amounts include distribution losses. Free service includes no charge water used at parks, zoos, libraries, schools, etc.
9-11. Self-explanatory.
12. May be several treatment schemes.
13.*]rhe average daily amount of water returned to a wastewater system is helpful in detrmining the amount of water consumed.
Tennessee data collection form. 3-81
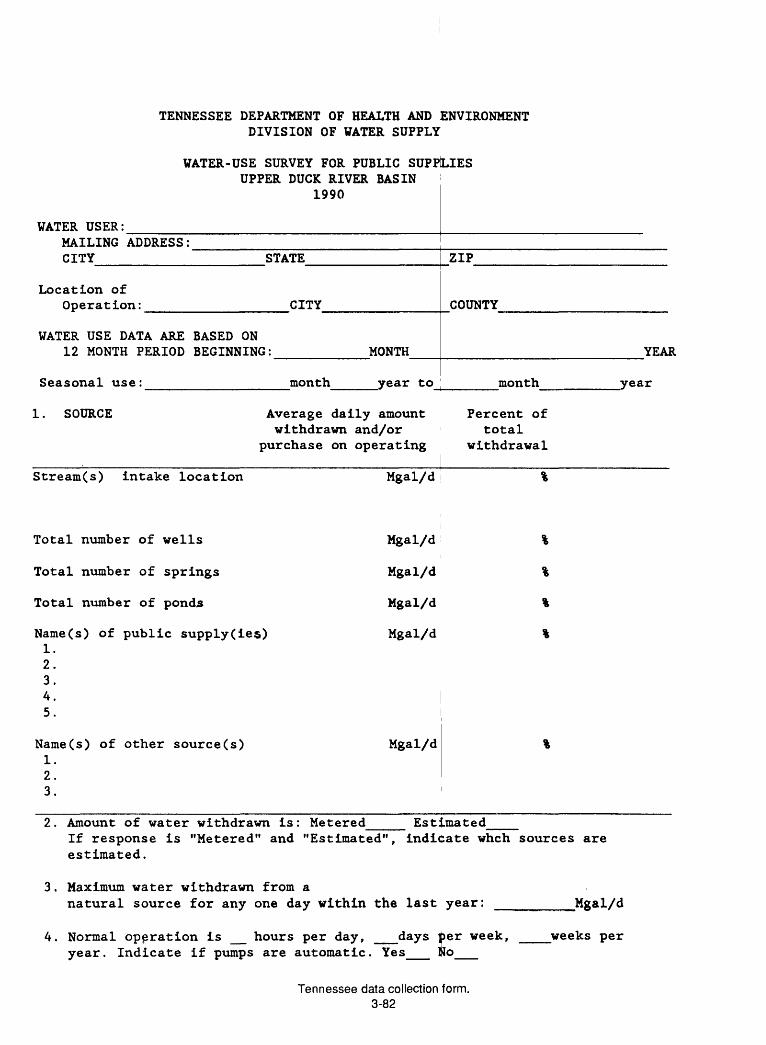
TENNESSEE DEPARTMENT OF HEALTH AND ENVIRONMENT DIVISION OF WATER SUPPLY
WATER-USE SURVEY FOR PUBLIC SUPPLIES UPPER DUCK RIVER BASIN
1990
WATER USER:MAILING ADDRESS:CITY STATE
Location ofOperation: CITY
WATER USE DATA ARE BASED ON12 MONTH PERIOD BEGINNING:
Seasonal use: month
ZIP
COUNTY
MONTH YEAR
year to month year
1. SOURCE Average daily amount Percent of withdrawn and/or total
purchase on operating withdrawal
Stream(s) intake location
Total number of wells
Total number of springs
Total number of ponds
Name(s) of public supply (ies)
Mgal/d %
Mgal/d %
Mgal/d %
Mgal/d %
Mgal/d %1.2.3.4.5.
Name(s) of other source(s)1.2.3.
Mgal/d
2. Amount of water withdrawn is: Metered EstimatedIf response is "Metered" and "Estimated", indicate whch sources are estimated.
3. Maximum water withdrawn from anatural source for any one day within the last year: ,Mgal/d
4. Normal operation is _ hours per day, __days per week, ___weeks per year. Indicate if pumps are automatic. Yes__ ilo__
Tennessee data collection form. 3-82
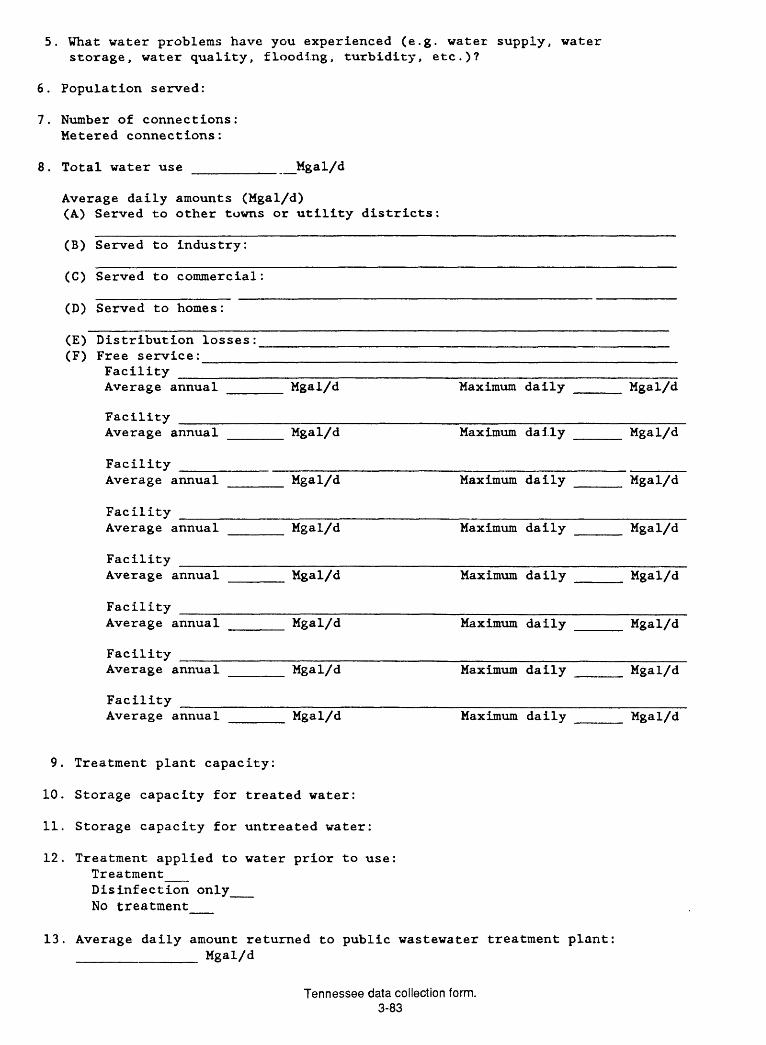
5. What water problems have you experienced (e.g. water supply, water storage, water quality, floodi.ng, turbidity, etc.)?
6. Population served:
7. Number of connections: Metered connections:
8. Total water use ________ _Mgal/d
Average daily amounts (Mgal/d)(A) Served to other towns or utility districts:
(B) Served to industry:
(C) Served to commercial:
(D) Served to homes:
(E) Distribution losses:____________________________________(F) Free service:__________________________________________
Facility ____________________________________________Average annual _____ Mgal/d Maximum daily _____ Mgal/d
Facility _____________________________________________________ Average annual _____ Mgal/d Maximum daily _____ Mgal/d
Facility ___________________________________________________ Average annual _____ Mgal/d Maximum daily _____ Mgal/d
Facility ____________________________________________________ Average annual ______ Mgal/d Maximum daily _____ Mgal/d
Facility _____________________________________________________ Average annual _____ Mgal/d Maximum daily _____ Mgal/d
Facility _____________________________________________________ Average annual _____ Mgal/d Maximum daily _____ Mgal/d
Facility ____________________________________________________ Average annual _____ Mgal/d Maximum daily ______ Mgal/d
Facility ____________________________________________________ Average annual ______ Mgal/d Maximum daily ______ Mgal/d
9. Treatment plant capacity:
10. Storage capacity for treated water:
11. Storage capacity for untreated water:
12. Treatment applied to water prior to use: Treatment__ Disinfection only__ No treatment__
13. Average daily amount returned to public wastewater treatment plant ____________ Mgal/d
Tennessee data collection form. 3-83

INSTRUCTIONS FOR COMPLETING THE WATER-USE SURVEYQUESTIONNAIRE FOR INDUSTRIES AND
COMMERCIAL ESTABLISHMENTS
GENERAL INFORMATION: Name of business or organization, mailing address, and details regarding location of water source or operation. Indicate the year data reflect. If water use is seasonal, indicate months.
1. If source is an instream impoundment, provide name of stream. Indicate the amount of water withdrawn (in million gallons per day) from each source and the percent of the total each source represents.
8
9
10
11
12
13-14
15
municipal system and 75% from a
The amount of water withdrawn
For example, 25% from a stream.
or purchased may be bothmetered and estimated, especially from several sources.
Water obtained from a public-supply system or purchased from an industry is not considered a "natural" source.
EXAMPLE: "Water is used 8 hours per day, 5 days per week, 50 weeks per year."
Describe any problems experienced within the last 12 months. This information may help the Division evaluate available resources.
"Total water use" is the sum of the average daily amount withdrawn or purchased.
What percent increase or decrease in "total water use" is anticipated in the next two years.
List principal product(s) or service, preferably by SIC.
"Percent of Total" water by types of use should equal 100%. Percent of each use which is consumed and discharged on an average day.
Maximum amount of water used curing the reported period during any one calendar day.
The maximum amount of raw or untreated water stored, in- and off-stream.
Self-explanatory
The average daily amount discharged to a stream or returned to a public-wastewater system, etc. is helpful in determining the amount of water consumed.
Confidentially handled. A possible indicator of the magnitude of water use by general industry type.
Tennessee data collection form. 3-84

TENNESSEE DEPARTMENT OP HEALTH AND ENVIRONMENT DIVISION OF WATER SUPPLY
WATER-USE SURVEY FOR INDUSTRIAL
AND COMMERCIAL ESTABLISHMENTS
1990WATER USER:
MAILING ADDRESS: CITY STATE ZIP
Location of Operation: CITY COUNTY
WATER USE DATA ARE BASED ON 12 MONTH PI
Seasonal use:
1. SOURCE
2RIOD BEGINNING:
month year to
MONTH
month
YEAR
year
Average daily amountwithdrawn and/or
purchase on operating
Percent oftotal
withdrawal
Stream(s) intake location
Total number of wells
Total number of springs
Total number of ponds
Name(s) of public supply(iee)1.2.3.4.5.
N-ame(s) of other aource(8)1.2.3.
Mgal/d
Mgal/d
Mgal/d
Mgal/d
Mgal/d
Mgal/d
If response is2. Amount of water withdrawn is: Metered___ Estimated___,"Metered" and "Estimated", indicate which sources are estimated.
3. Maximum water withdrawn from a natural source for any one day within the last year: ________Mgal/d
4. Normal operation is _ hours per day, __days per week, ___weeks per year.5. What water problems have you experienced (e.g. water supply, water storage,
water quality, flooding, turbidity, etc.)?6. Total water use __________Mgal/d
Tennessee data collection form. 3-85

7. What percent change in "total water use" (Question 6) do you plan to make in the next two years (indicate increase or decrease)? %
8. Major product(s) or service(B)(Standard Industrial Classification number if known):
9. Water is used for:(Total must equal "Total Water Use", Question 6)
PercentPercent of Percent Rec:
Total Consumed (if A 1
Cooling or condensing
irculated Percent known) Discharge
i C
A+B+C equals
100%
Process (including process wash)
Domestic (including general sanitation)
Boiler
Total 100 %
10. Maximum amount of water used in one day:11. Impoundment or storage capacity: ___
Mgal/dMgal/d
12. What percent of water is treated prior to use:13. Average daily effluent: ____Mgal/d14. Percent of total effluent returned to:
Stream _ % Name of stream
Well injection
Septic tank & field tile
Spray irrigation
Public system
Other
% Depth of well Injection zone
feetft to ft
Mgal/d
Mgal/d
% Specify , if by sale, etc.
15. Number of employees:Number of production employees:
100%
100%
100%
Name and position of person to contact for further information (e.g. plant manager, etc):
Datet
Phone:
Tennessee data collection form. 3-86

\
Acre
ag
e E
stim
ate
An a
cre
age s
eale
r is re
co
mm
en
de
d; a
n a
ltern
ativ
e
is to u
se th
e scr.le
on^e
ach
m
ap
in the
sa
me
manner it is
use
d in
the e
xam
ple
.________
AC
RE
AG
E
*1
CO
UN
TY
:D
ISTR
ICT
C
ON
SER
VA
TIO
MST
:A
DD
RE
SS:PH
ON
E:
Irngatcr
Give the com
pany name or
last name and firs; initial
of the irrigate:. This is a
helpful identifier
in know
ing if someone w
as m
issed.
Crop
Indicate by letter (O
ne crop per line):
(A)
feed grains: soybeans,
mile. corn. etc.
(B)
food grains: rye. oats,
wheat, sorghum
, etc.(C
) cotton
(D.I
berries, nuts,
grapes(E
i horticulture
(Fj
pasture, hay. silage(G
) tobacco
(K)
tree fruits
(I) turf,
recreation(Jj
vegetables(K
) other,
specify
Source of Water
Indicate by. letter, give nam
e if B. C. D.
F. G:
(A)
well
(B)
spring(C
) stream
/river(D
) lake
(E)
pond(F
) m
unicipal(G
) reclaim
ed w
aste(H
) other,
specify
System Type
Indicate bv letter:
(A)
drip/trickle (E
) fiooc
(C)
surge(D
) furrow
(E)
other grant)
(F) center pivot
(G)
boom
gunhand-m
ove solid-set traveller
(K)
(II (J) (K
)
Map N
umber
Using the county
map. indicate the
irrigation site and
give it a number.
Use one line for
each croc.
Acreaj s
Estiim
ed num
ber of acreage per irrigate crop or activnr
Exclude
acreag w
ith gross sales ! ss than S3.000
Application
Estim
ated num
ber of
applications during 1990 grow
ing season.
Hours
Hours purnp w
as typically used per application.
Pump C
apacity
Estim
ated or 'rated purnp capacity in gallons per m
inute if know
n.
Source of Power
Indicate by letter:
(a) diesel
(B)
LP gas(C
) gasoline
(D)
electric(E
) other,
specify
Age of system
, in vears.
Average
percent increase
in productivity
due to
irrigation.
8/5
oo
&JJl.
LTennessee data collection form
. 3-87

CO
UN
TY
: D
IST
RIC
T C
ON
SER
VA
TIO
MST
:
rng
ato
r
Giv
e th
e co
mpa
ny n
ame
or
ast
nam
e an
d fi
rst
initi
al
of t
he i
rngat
or.
T
his
is a
he
lpfu
l id
enti
fier
in
cn
owm
g if
som
eone
was
m
isse
d.
Cro
p
Indi
cate
by
lett
er
(One
cro
p pe
r lin
e):
(A)
feed
gra
ms:
so
ybea
ns,
milo
. co
rn.
etc.
(B
) fo
od g
rain
s:
rye.
oat
s,
whe
at,
sorg
hum
, et
c.
(C)
cott
on
(D)
berr
ies,
nu
ts,
grap
es
(E)
hort
icult
ure
(F
; pa
stur
e, h
ay.
sila
ge
(G)
toba
cco
('H)
tree
fr
uits
d
) tu
rf,
recr
eati
on
(J1
vege
tabl
es
(K)
othe
r,
spec
ify
Sour
ce o
f W
ater
Indi
cate
by
lett
er,
give
nam
e if
B.
C. D
. F.
G:
(A)
wel
l (B
) sp
ring
(C
) st
ream
-riv
er
(D)
lake
(E
) po
nd
(F)
mun
icip
al
(G)
recl
aim
ed
was
te
(H)
othe
r,
spec
ify
»yst
em T
ype
Indi
cate
by
le
tter:
A)
drip
tri
ckle
(B
) fl
ood
(C)
surg
e (D
) fu
rrow
(E
) ot
her
grav
ity
(F)
cent
er
pivo
t (G
) bo
om
(H)
gun
(I)
hand
-mov
e (J
) so
lid-
set
(K)
trav
elle
r
Map
N
umbe
r
Usi
ng t
he c
ount
y m
ap.
indi
cate
th
e ir
riga
tion
si
te
and
give
it
a nu
mbe
r.
Use
one
lin
e fo
r ea
ch
crop
.
Acr
eage
Est
imai
eJ
num
be
of a
crea
ge p
er
irri
gate
d cr
op o
r ac
tivm
E
xclu
de
acre
age
-Mth
gr
os
sale
s les
.< th
an
S3.0
00
AD
DR
ESS
: P
HO
NE
:
r
App
lica
tion
Est
imat
ed
num
ber
of
appl
icat
ions
du
ring
19
90
grow
ing
seas
on.
Hou
rs
Hou
rs p
ump
was
ty
pica
lly u
sed
per
appl
icat
ion.
Pum
p C
apac
ity
Est
imat
ed
or r
ated
pu
mp
capa
cm'
in
gallo
ns
per
min
ute,
if
kno
wn.
Sour
ce o
f PC
-;-e
r
Indi
cate
by
lett
er
(a)
dies
e!
(B)
LP
gas
CC)
gaso
line
(D
) el
ectr
ic
(E;
othe
r,
spec
ify
i
Age
of
syst
em.
in v
ears
Ave
rage
pe
rcen
t in
crea
se
in
prod
uctiv
ity
due
to
irri
gatio
n.
Tenn
esse
e da
ta c
olle
ctio
n fo
rm.
3-88