water treatment facility effectiveness in newfoundland and ... · drinking water safety workshop,...
TRANSCRIPT

Water Treatment Facility Effectiveness in
Newfoundland and Labrador
Drinking Water Safety Workshop, GanderAnnette Tobin, P.Eng
[email protected] 22‐24, 2016
Water ResourcesManagement
Division
Department of Environment & Conservation

Water Resources Management
Division
Department of Environment & Conservation
Definitions Water Treatment Facility
• A public drinking water system that has a drinking water treatment process other than chlorine disinfection.
• Can include a single treatment process or multiple treatment processes that target specific water quality parameters.
Water Treatment Plant• A water treatment facility that is designed to
produce drinking water that meets all required drinking water standards and guidelines.
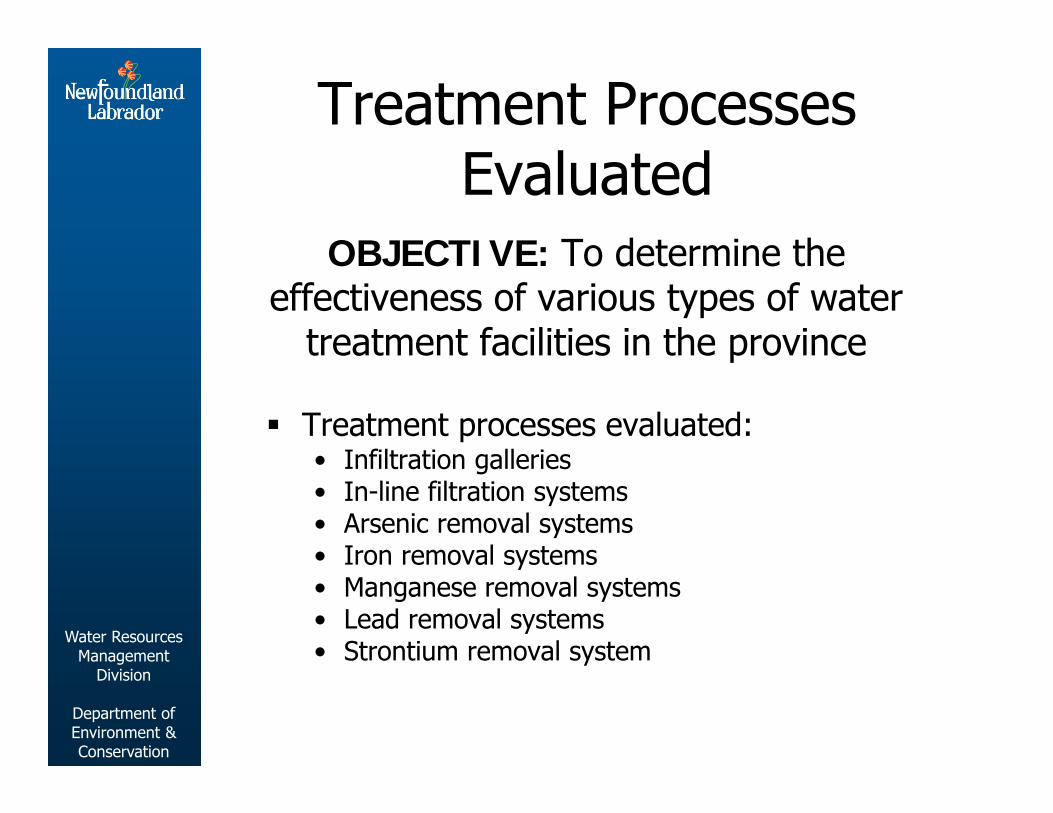
Treatment Processes Evaluated
OBJECTIVE: To determine the effectiveness of various types of water
treatment facilities in the province
Treatment processes evaluated:• Infiltration galleries• In-line filtration systems• Arsenic removal systems• Iron removal systems• Manganese removal systems• Lead removal systems• Strontium removal system
Water Resources Management
Division
Department of Environment & Conservation

Water Resources Management
Division
Department of Environment & Conservation
Study Approaches
Approach No. 1• “Pre/Post”
Approach No. 2• “Raw/Treated”
Tap water before treatment installed
Tap water aftertreatment installed
Vs.
AllSource water
Tap water after treatment installed
Vs.
Approach No. 3• % Removal

Infiltration Gallery
Water Resources Management
Division
Department of Environment & Conservation

Water Resources Management
Division
Department of Environment & Conservation
Infiltration Gallery An intake structure in which the intake is
buried or contained within a berm A perforated intake pipe is placed and
permeable material is backfilled on top or around it creating a barrier to filter water before it reaches the intake pipe
Construction of Buried Infiltration Gallery Finished Infiltration Gallery

Water Resources Management
Division
Department of Environment & Conservation
Infiltration Gallery Newfoundland & Labrador currently has 24
infiltration galleries in operation Approximately half of which are of the
buried type, located directly in the main source
The majority of those introduced to specifically target turbidity are berm infiltration galleries
Cost ranges from $20,000 to $130,000 depending on the size and type
Average cost is approximately $95,000

Water Resources Management
Division
Department of Environment & Conservation
Infiltration Galleries in Newfoundland & Labrador
Community Commissioned Cost Community Commissioned Cost
Anchor Point 2007 - Loon Bay 2003 23,000
Appleton 2000 115,000 McIvers 2011 -
Bird Cove 1996 - Millertown 2007 115,000
Burlington 2012 74,700 Morrisville 2005 -
Centreville-Wareham-Trinity
2003 50,000 New Perlican 1992 -
Comfort Cove-Newstead
2004/2005 115,000 Norris Arm 2007 126,300
Cow Head 2006 - Northern Arm 1998 70,000
Crow Head 2010 - Phillips Head 2007 100,050
Flower’s Cove 2000 - Robert’s Arm 2012 115,000
Gander Bay South
2006 115,000 Springdale 2007 895,625(Also intake upgrade)
Harbour Breton
2007 - St. Paul’s 2006 -
Hare Bay 2007 115,000 Twillingate 1998 -
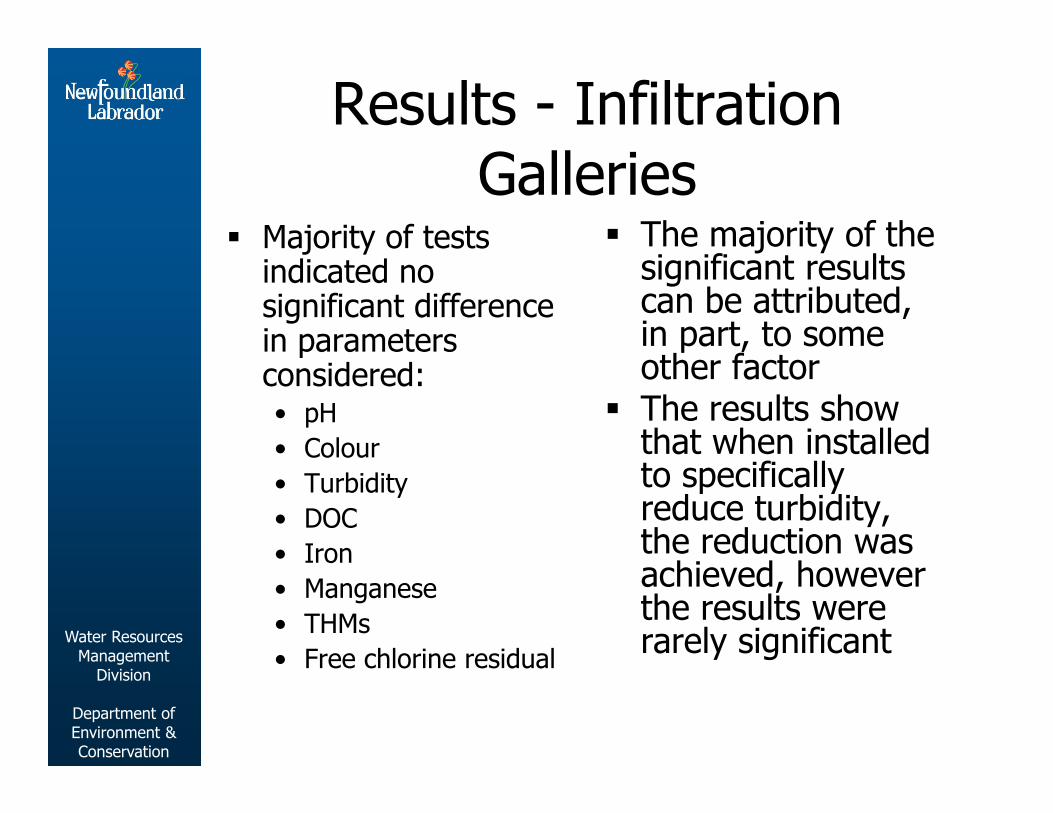
Results - Infiltration Galleries
Majority of tests indicated no significant difference in parameters considered:• pH • Colour • Turbidity • DOC • Iron • Manganese • THMs• Free chlorine residual
The majority of the significant results can be attributed, in part, to some other factor
The results show that when installed to specifically reduce turbidity, the reduction was achieved, however the results were rarely significantWater Resources
Management Division
Department of Environment & Conservation

Water Resources Management
Division
Department of Environment & Conservation
Conclusion - Infiltration Galleries
Marginally effective in specific cases for turbidity reduction Dependent upon:
• Source • Design
Other options may be more effective in dealing with certain issues (i.e. in-line filters)

Water Resources Management
Division
Department of Environment & Conservation
Recommendations-Infiltration Galleries
Establish criteria which must be met prior to the approval for construction of an infiltration galleryi. intake pond is shallowii. intake is in an exposed pond prone to wave
actioniii. turbidity is an issueiv. icing of the intake is an issue
ENVC should develop design guidelines for the construction of future infiltration galleries

In-Line Filters
Water Resources Management
Division
Department of Environment & Conservation

In-Line Filters
Filtration is the process where water flows through a permeable media while solid particles are retained or adsorbed.
The filter pore size represents the size of solid particles that can be removed by the filter.
Newfoundland & Labrador currently has 34 in-line filters in operation
19 communities were involved in this study
Water Resources Management
Division
Department of Environment & Conservation

Water Resources Management
Division
Department of Environment & Conservation
Types of In-Line Filters Filter Types in NL
• Media filter (Sand, anthracite &GAC)▫ Retaining and adsorbing
• Mesh filter▫ Single-layer Retaining
• Thread filter▫ Multi-layer Retaining

In-Line Filters in Newfoundland and Labrador
Water Resources Management
Division
Department of Environment & Conservation
Media Filtero Cottrell’s Coveo Grand Banko Hermitageo Isle aux Mortso Lewisporteo Milltown‐Head of Bay
D’Espoiro Salvage
Thread Filtero Deer Lakeo Pasadena
Mesh Filtero Burnt Islando Cape Freels Northo Embreeo Happy Adventureo Harbour Bretono Hare Bayo Mile’s Coveo Rattling Brooko Seal Coveo Steady Brook

Water Resources Management
Division
Department of Environment & Conservation
Results - In-Line Filters
“Raw/Filtered”
Colour 1 18
Turbidity 4 2
DOC 10 0
Iron 10 1
Manganese 1 13
Approach Parameter Increase Decrease
“Pre/Post”
Colour 7 0
Turbidity 3 0
DOC 12 0
Iron 1 2
Manganese 0 9
Total THMs 15 1
Free Chlorine 11 2

Water Resources Management
Division
Department of Environment & Conservation
Effectiveness on Turbidity Only 2 communities showed significant
decreases About 11 communities showed increases from
the pre-filter water to filtered water Why?
• Corrosion of distribution system pipes over the years• Re-suspended sediments in pipes
“Mass Balance Model”, J.H.G. Vreeburg (2004)

Water Resources Management
Division
Department of Environment & Conservation
Filtered Tap Turbidity vs. Filter Size & Type
1 – 10 microns group• Red dots• Lower turbidity• Follow a linear trend• More effective
11 – 100 microns group• Black dots• Higher turbidity• Mesh filters showed the
highest turbidity
Water Resources Management
Division
Department of Environment & Conservation

Water Resources Management
Division
Department of Environment & Conservation
Most Effective Filters in NL
The lowest two turbidity results• Pasadena (Decreased 38% from source to filtered tap)• Deer Lake (Decreased 31% from source to filtered tap)
CommunityFilter Size
(Micron)
Filter TypesPre‐
filtration(Micron)
Filtered Tap Turbidity Mean
Filtered Tap Turbidity Median
Pasadena 2 Thread 80 0.2650 0.30
Deer Lake 3 Thread 50 0.2875 0.20
*Canadian Drinking Water Guideline for Turbidity: 1.0 Turbidity Unit

Water Resources Management
Division
Department of Environment & Conservation
Recommendations- In-Line Filters
For the filters size of 11 – 100 microns• Add a filter of 1 – 10 microns • Keep the current filter as pre-filtration
For media filters• Proper maintenance required• Replacing the media material
For mesh filters• Consider switching to thread filters
For the increased turbidity from Pre-filter to Post-filter tap water• Investigate condition of the distribution pipes• Check for water main breaks or rupture in the distribution
system• Flush to remove sediments from the pipes

Arsenic Removal Systems
Water Resources Management
Division
Department of Environment & Conservation

Arsenic Removal Systems 10 systems in NL GCDWQ for
arsenic is 0.01 mg/L
AdEdge Ad-33 Adsorption System
Water Resources Management
Division
Department of Environment & Conservation

Arsenic Removal SummaryTown Percent
Removal
Chance Cove (Angus Brace Well) 71.35%
Conception Harbor (Healey’s Pond Road Well) 50.23%
Conception Harbor (Upper Bacon Cove) 100%
Grates Cove (#1C Well) 54.72%
Harbour Grace (#2 Thicket New Well) 98.29%
Harbour Grace (Southside Wellfield) 100%
Small Point‐Adam’s Cove‐Blackhead‐Broad Cove (#6 Well‐ Herb Trickett Well) 88.79%
Small Point‐Adam’s Cove‐Blackhead‐Broad Cove (#9‐Walter Reynolds Well) 100%
Small Point‐Adam’s Cove‐Blackhead‐Broad Cove (#1‐Reg Bursey Well) 100%
Small Point‐Adam’s Cove‐Blackhead‐Broad Cove (#8‐Effie Flight Well) 43.13%
Significant decrease in Arsenic observed
Arsenic levels tend to increase over time as media is spent• ~3 years
Water Resources Management
Division
Department of Environment & Conservation

Iron and Manganese Removal Systems
Water Resources Management
Division
Department of Environment & Conservation

Iron and Manganese Removal Systems
• GCDWQ• Iron- 0.3 mg/L• Manganese- 0.05 mg/L
• Health Canada looking at revising Mn guideline:• proposed MAC of 0.1 mg/L
• Affects 76 public drinking water systems
• Proposed AO of 0.02 mg/L • Affects 232 public drinking water systems
• Greensand adsorption removal system
Water Resources Management
Division
Department of Environment & Conservation
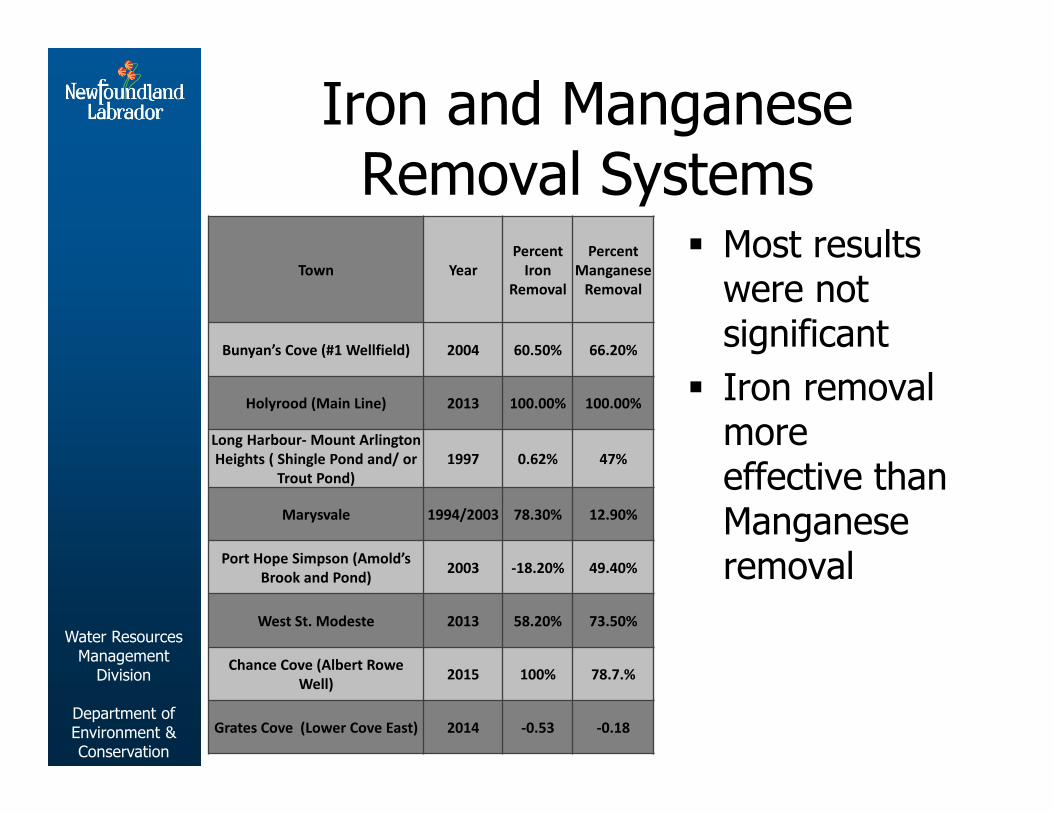
Iron and Manganese Removal Systems
Most results were not significant
Iron removal more effective than Manganese removal
Water Resources Management
Division
Department of Environment & Conservation
Town YearPercent Iron
Removal
Percent Manganese Removal
Bunyan’s Cove (#1 Wellfield) 2004 60.50% 66.20%
Holyrood (Main Line) 2013 100.00% 100.00%
Long Harbour‐Mount Arlington Heights ( Shingle Pond and/ or
Trout Pond)1997 0.62% 47%
Marysvale 1994/2003 78.30% 12.90%
Port Hope Simpson (Amold’s Brook and Pond) 2003 ‐18.20% 49.40%
West St. Modeste 2013 58.20% 73.50%
Chance Cove (Albert RoweWell) 2015 100% 78.7.%
Grates Cove (Lower Cove East) 2014 ‐0.53 ‐0.18

Lead Removal Systems
Water Resources Management
Division
Department of Environment & Conservation

Lead Removal System One system in NL GCDWQ is
0.01mg/L Significant
decrease in Lead observed
1 micron cartridge filter replacement time varies but usually it is done every 6-8 weeks
Water Resources Management
Division
Department of Environment & Conservation
TownPercent Removal
Port au Port West 74.93%

Strontium Removal Systems
Water Resources Management
Division
Department of Environment & Conservation

Strontium Removal System One system in NL HC drinking water
guidance value of 4.4mg/L
Ion exchange using a sodium resin
Significant decrease in Strontium observed
Values above 4.4 mg/L observed• Sodium resin needs
to be regenerated regularly
Water Resources Management
Division
Department of Environment & Conservation
TownPercent Removal
Bay St. George South 58.82%

Conclusions Communities should determine if the anticipated
improvement in water quality is worth the capital and O&M costs for the treatment system
Infiltration galleries do not significantly improve drinking water quality
Smaller filters (<5 microns) are more effective at removing turbidity
The condition of the distribution system has a major impact on tap water quality
Treatment systems need to be operated and maintained effectively in order to work properly
Need to continuously monitor water quality to make sure treatment systems are working
Iron and manganese removal systems may need to be decoupled with a focus on manganese removal systemsWater Resources
Management Division
Department of Environment & Conservation

Water Resources Management
Division
Department of Environment & Conservation
Thank You
Questions?