water transaction program - idaho department of water ... · idaho water transaction program...
TRANSCRIPT

Page | 1 2011-2012 Idaho Water Transactions Program Monitoring and Evaluation Report
Idaho Water Transaction Program 2011-2012 Monitoring and Evaluation Report
Introduction During 2011 and 2012, the Idaho Water Resource Board (IWRB) monitored the following 32 water transactions in the Upper Salmon River Basin:
Alturas Lake Creek non-pivot (2007 – 2011)
Bayhorse Creek (2012-2031)
Beaver Creek and Salmon River above Alturas Lake Creek (2005-2014)
Big Hat Creek (2010-2014)
Big Timber Creek Tyler (2010-2029)
Canyon and Big Timber Creek (2011-2030)
Lower Eighteenmile Creek – Ellsworth (2006-2015)
Fourth of July Creek (2009-2028)
Iron Creek 2007 – Phase II (2007-2026)
Little Springs Creek (2011-2030)
Lemhi and Little Springs (2011-2030)
Lemhi TNC Permanent Donation
Lower Lemhi (2011)
Lower Lemhi (2012)
Lower Lemhi Permanent – Bird
Lower Lemhi Permanent – Cheney
Lower Lemhi Permanent – Demick
Lower Lemhi Permanent – Fisher
Lower Lemhi Permanent – Olson
Lower Lemhi Permanent – Bob Thomas
Lower Lemhi Permanent – Kim Thomas
Lower Lemhi Permanent – Wolters
Lower Lemhi Thomas (2010-2021)
Morgan Creek (2009-2013)
Pahsimeroi P-9 Bowles (2008-2027)
Pahsimeroi P-9 Charlton (2008-2027)
Pahsimeroi P-9 Dowton (2008-2027)
Pahsimeroi P-9 Elzinga (2008-2027)
Patterson Big Springs Creek (2012-2031)
Pole Creek (2011-2012)
Sulphur Creek Permanent Donation
Whitefish Ditch (2008-2026)
These projects increased flows and provided valuable fish habitat and passage on more than 200 river miles in the Upper Salmon River Basin.
Page | 2 2011-2012 Idaho Water Transactions Program Monitoring and Evaluation Report
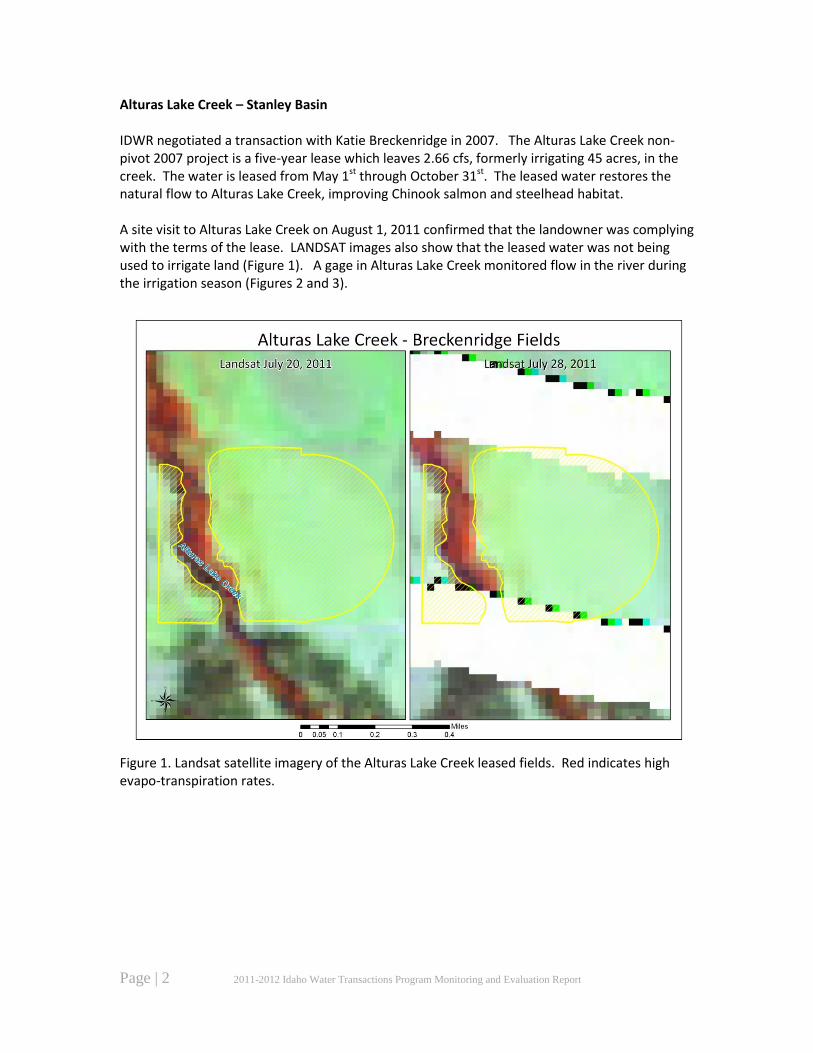
Alturas Lake Creek – Stanley Basin IDWR negotiated a transaction with Katie Breckenridge in 2007. The Alturas Lake Creek non-pivot 2007 project is a five-year lease which leaves 2.66 cfs, formerly irrigating 45 acres, in the creek. The water is leased from May 1st through October 31st. The leased water restores the natural flow to Alturas Lake Creek, improving Chinook salmon and steelhead habitat. A site visit to Alturas Lake Creek on August 1, 2011 confirmed that the landowner was complying with the terms of the lease. LANDSAT images also show that the leased water was not being used to irrigate land (Figure 1). A gage in Alturas Lake Creek monitored flow in the river during the irrigation season (Figures 2 and 3).
Figure 1. Landsat satellite imagery of the Alturas Lake Creek leased fields. Red indicates high evapo-transpiration rates.
Page | 3 2011-2012 Idaho Water Transactions Program Monitoring and Evaluation Report
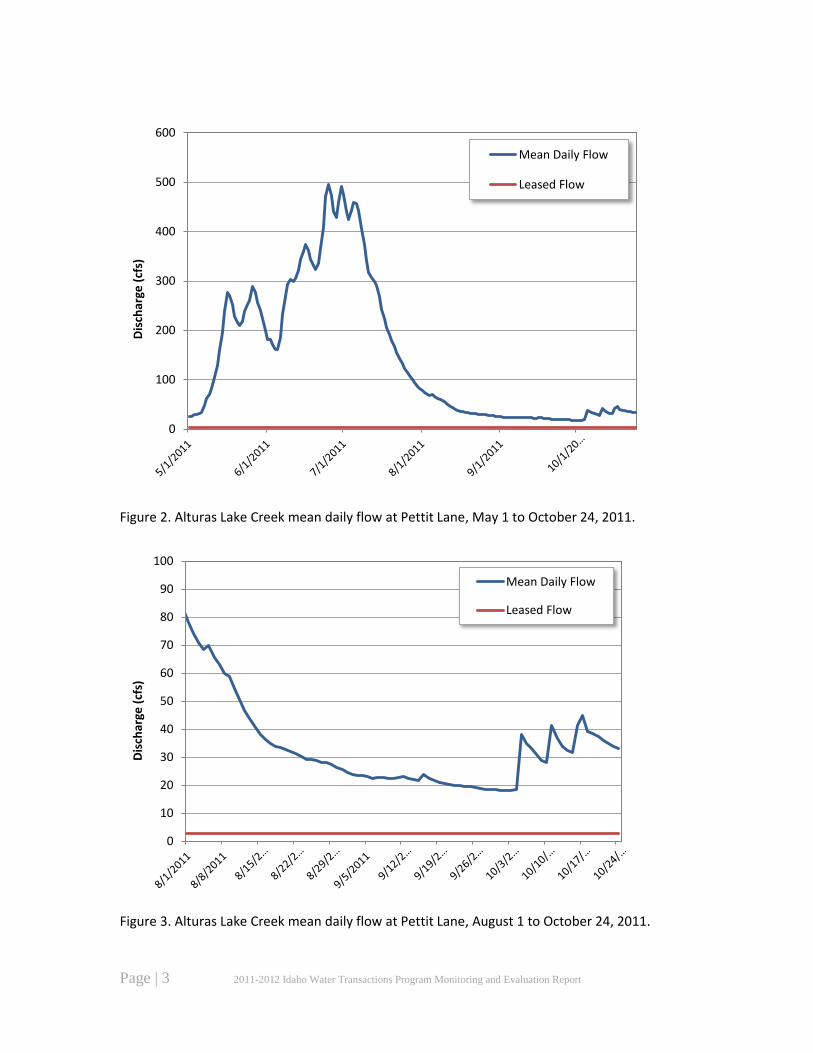
Figure 2. Alturas Lake Creek mean daily flow at Pettit Lane, May 1 to October 24, 2011.
Figure 3. Alturas Lake Creek mean daily flow at Pettit Lane, August 1 to October 24, 2011.
0
100
200
300
400
500
600 D
isch
arge
(cf
s)
Mean Daily Flow
Leased Flow
0
10
20
30
40
50
60
70
80
90
100
Dis
char
ge (
cfs)
Mean Daily Flow
Leased Flow
Page | 4 2011-2012 Idaho Water Transactions Program Monitoring and Evaluation Report
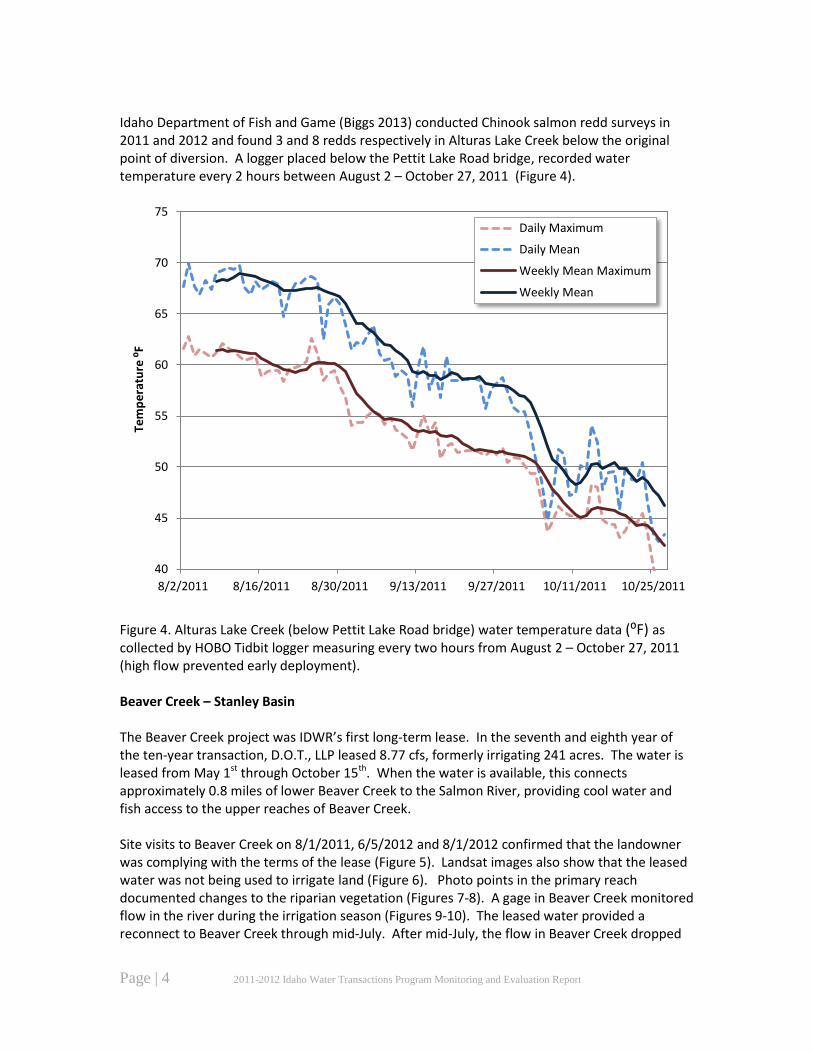
Idaho Department of Fish and Game (Biggs 2013) conducted Chinook salmon redd surveys in 2011 and 2012 and found 3 and 8 redds respectively in Alturas Lake Creek below the original point of diversion. A logger placed below the Pettit Lake Road bridge, recorded water temperature every 2 hours between August 2 – October 27, 2011 (Figure 4).
Figure 4. Alturas Lake Creek (below Pettit Lake Road bridge) water temperature data (⁰F) as collected by HOBO Tidbit logger measuring every two hours from August 2 – October 27, 2011 (high flow prevented early deployment). Beaver Creek – Stanley Basin The Beaver Creek project was IDWR’s first long-term lease. In the seventh and eighth year of the ten-year transaction, D.O.T., LLP leased 8.77 cfs, formerly irrigating 241 acres. The water is leased from May 1st through October 15th. When the water is available, this connects approximately 0.8 miles of lower Beaver Creek to the Salmon River, providing cool water and fish access to the upper reaches of Beaver Creek. Site visits to Beaver Creek on 8/1/2011, 6/5/2012 and 8/1/2012 confirmed that the landowner was complying with the terms of the lease (Figure 5). Landsat images also show that the leased water was not being used to irrigate land (Figure 6). Photo points in the primary reach documented changes to the riparian vegetation (Figures 7-8). A gage in Beaver Creek monitored flow in the river during the irrigation season (Figures 9-10). The leased water provided a reconnect to Beaver Creek through mid-July. After mid-July, the flow in Beaver Creek dropped
40
45
50
55
60
65
70
75
8/2/2011 8/16/2011 8/30/2011 9/13/2011 9/27/2011 10/11/2011 10/25/2011
Tem
pe
ratu
re ⁰
F
Daily Maximum
Daily Mean
Weekly Mean Maximum
Weekly Mean
Page | 5 2011-2012 Idaho Water Transactions Program Monitoring and Evaluation Report
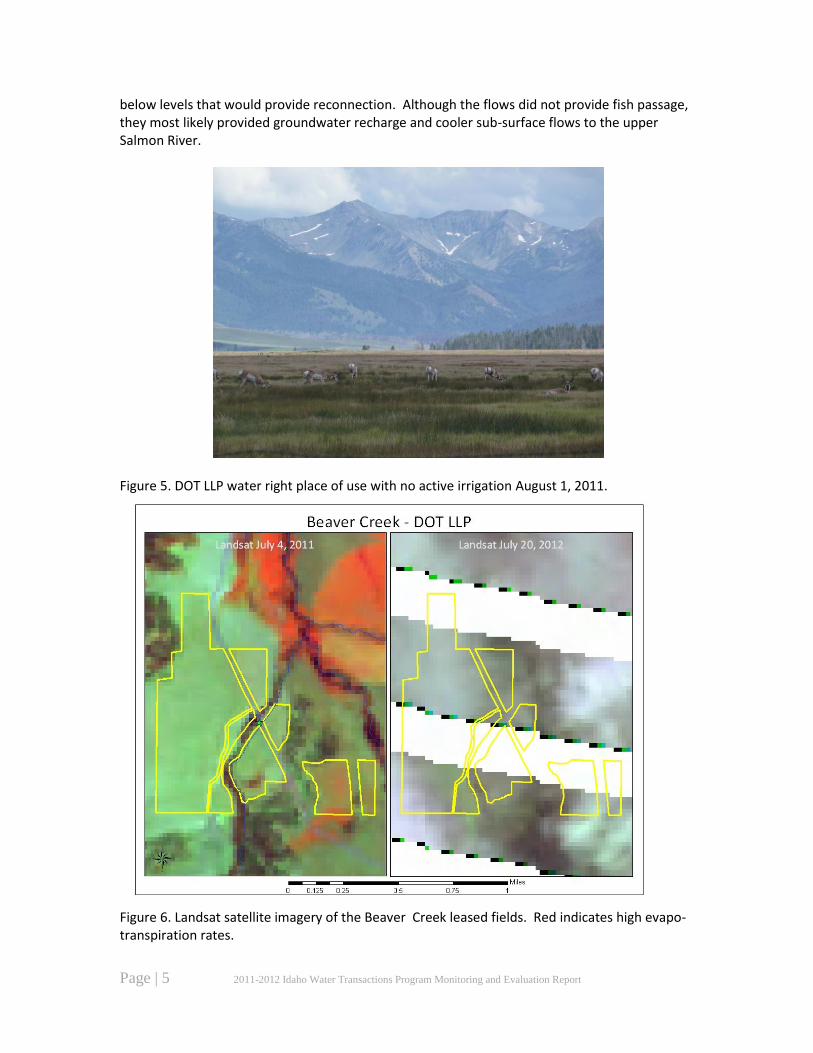
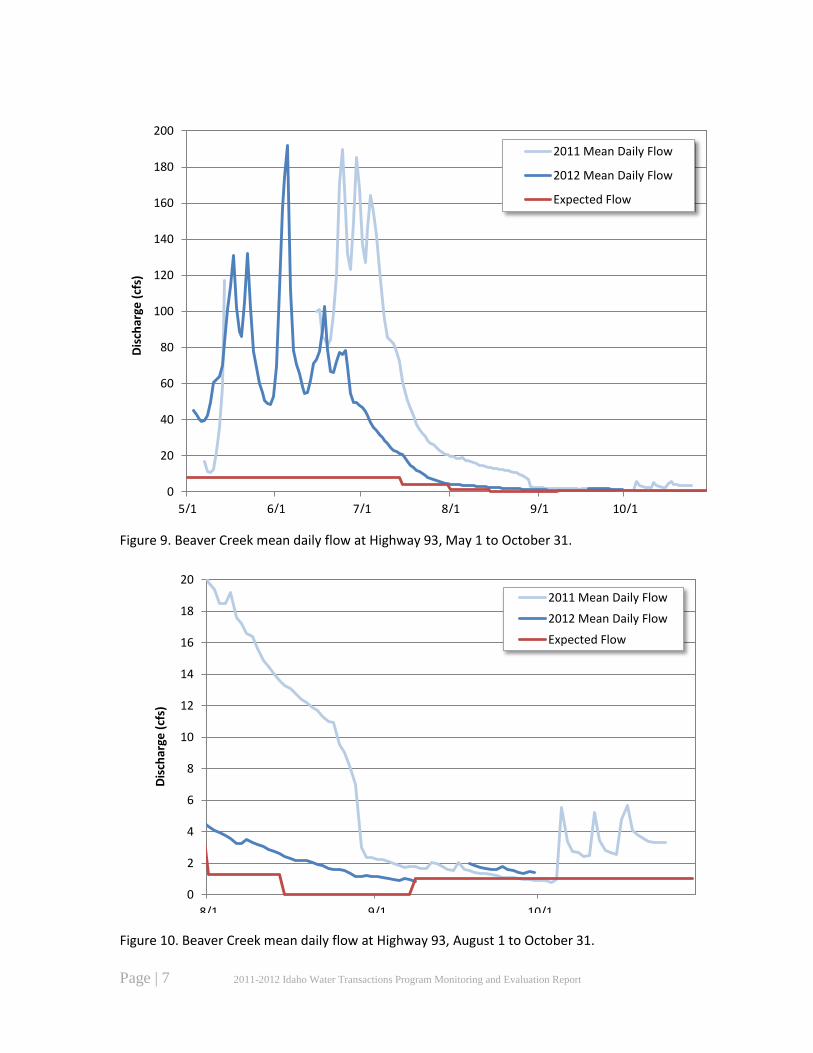
below levels that would provide reconnection. Although the flows did not provide fish passage, they most likely provided groundwater recharge and cooler sub-surface flows to the upper Salmon River.
Figure 5. DOT LLP water right place of use with no active irrigation August 1, 2011.
Figure 6. Landsat satellite imagery of the Beaver Creek leased fields. Red indicates high evapo-transpiration rates.
Page | 6 2011-2012 Idaho Water Transactions Program Monitoring and Evaluation Report
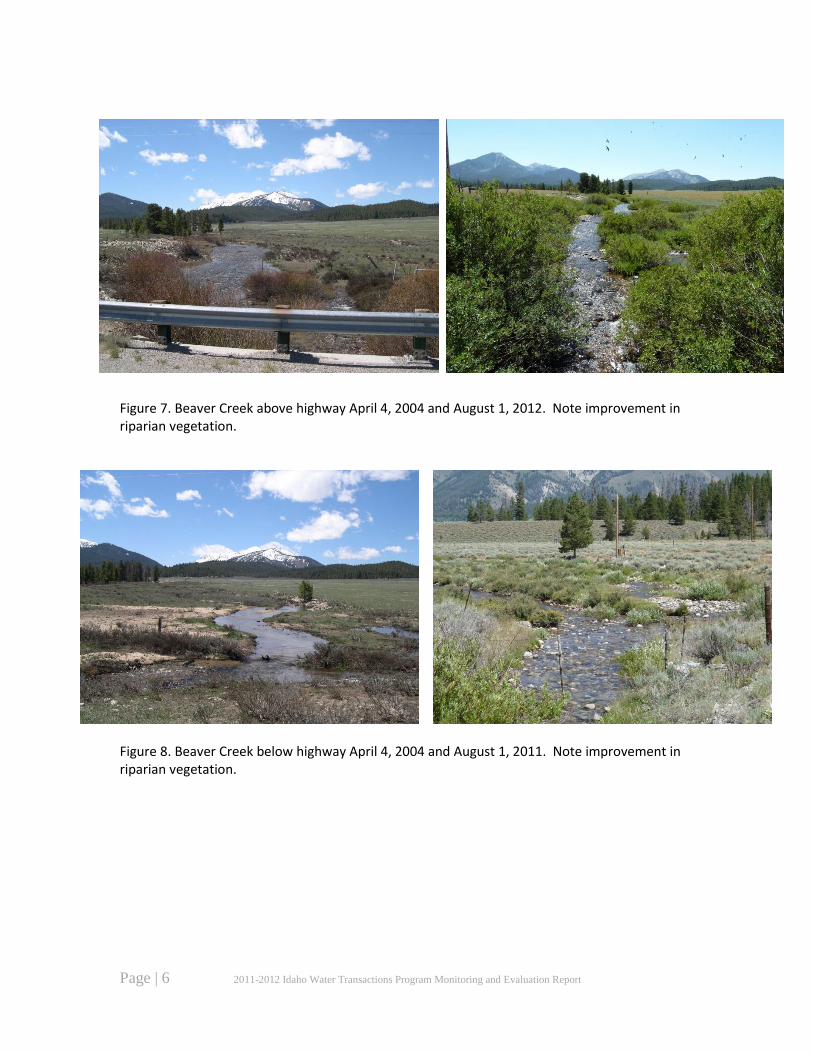
Figure 7. Beaver Creek above highway April 4, 2004 and August 1, 2012. Note improvement in riparian vegetation.
Figure 8. Beaver Creek below highway April 4, 2004 and August 1, 2011. Note improvement in riparian vegetation.
Page | 7 2011-2012 Idaho Water Transactions Program Monitoring and Evaluation Report
Figure 9. Beaver Creek mean daily flow at Highway 93, May 1 to October 31.
Figure 10. Beaver Creek mean daily flow at Highway 93, August 1 to October 31.
0
20
40
60
80
100
120
140
160
180
200
5/1 6/1 7/1 8/1 9/1 10/1
Dis
char
ge (
cfs)
2011 Mean Daily Flow
2012 Mean Daily Flow
Expected Flow
0
2
4
6
8
10
12
14
16
18
20
8/1 9/1 10/1
Dis
char
ge (
cfs)
2011 Mean Daily Flow
2012 Mean Daily Flow
Expected Flow
Page | 8 2011-2012 Idaho Water Transactions Program Monitoring and Evaluation Report
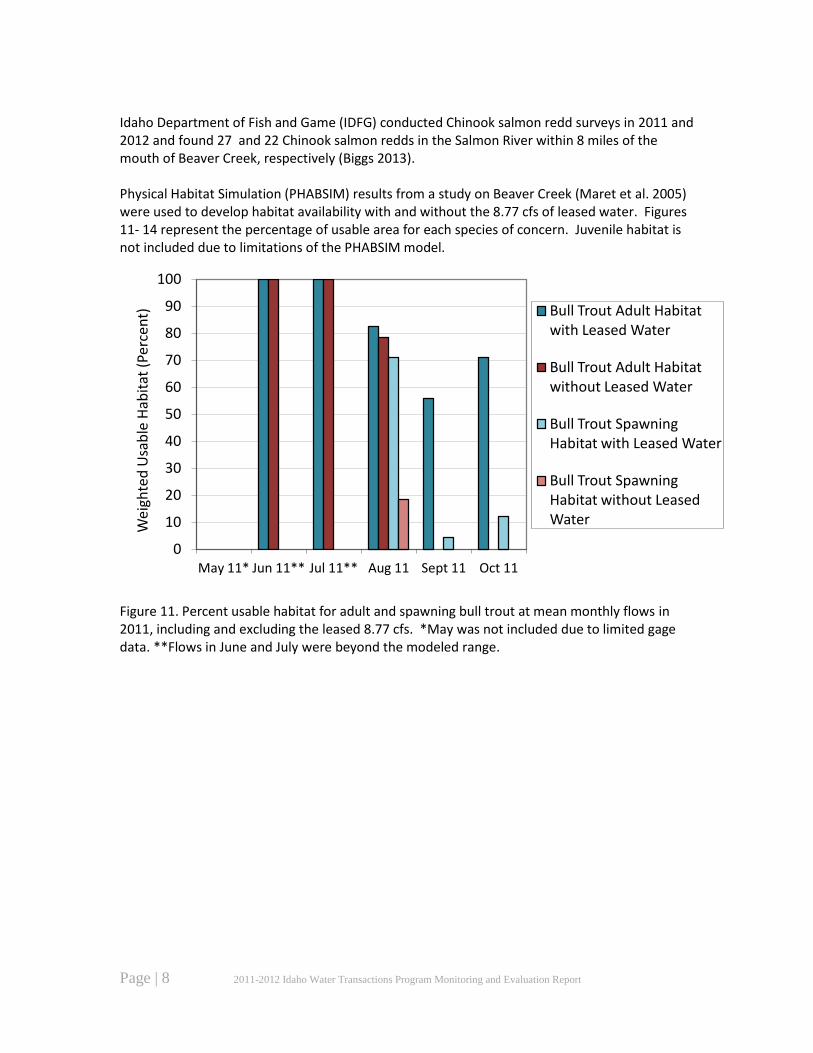
Idaho Department of Fish and Game (IDFG) conducted Chinook salmon redd surveys in 2011 and 2012 and found 27 and 22 Chinook salmon redds in the Salmon River within 8 miles of the mouth of Beaver Creek, respectively (Biggs 2013). Physical Habitat Simulation (PHABSIM) results from a study on Beaver Creek (Maret et al. 2005) were used to develop habitat availability with and without the 8.77 cfs of leased water. Figures 11- 14 represent the percentage of usable area for each species of concern. Juvenile habitat is not included due to limitations of the PHABSIM model.
Figure 11. Percent usable habitat for adult and spawning bull trout at mean monthly flows in 2011, including and excluding the leased 8.77 cfs. *May was not included due to limited gage data. **Flows in June and July were beyond the modeled range.
0
10
20
30
40
50
60
70
80
90
100
May 11* Jun 11** Jul 11** Aug 11 Sept 11 Oct 11
Wei
ghte
d U
sab
le H
abit
at (
Perc
ent)
Bull Trout Adult Habitat with Leased Water
Bull Trout Adult Habitat without Leased Water
Bull Trout Spawning Habitat with Leased Water
Bull Trout Spawning Habitat without Leased Water

Page | 9 2011-2012 Idaho Water Transactions Program Monitoring and Evaluation Report
Figure 12. Percent usable habitat for adult and spawning Chinook salmon at mean monthly flows in 2011, including and excluding the leased 8.77 cfs. *May was not included due to limited gage data. **Flows in June and July were beyond the modeled range.
Figure 13. Percent usable habitat for adult and spawning bull trout at mean monthly flows in 2012, including and excluding the leased 8.77 cfs. *Flows in May and June were beyond the modeled range. ** October was not included due to limited gage data.
0
10
20
30
40
50
60
70
80
90
100
May 11* Jun 11** Jul 11** Aug 11 Sept 11
We
igh
ted
Usa
ble
Hab
itat
(P
erc
ent)
Chinook Salmon Adult Habitat with Leased Water
Chinook Salmon Adult Habitat without Leased Water Chinook Salmon Spawning Habitat with Leased Water
Chinook Salmon Spawning Habitat without Leased Water
0
10
20
30
40
50
60
70
80
90
100
May 12* Jun 12* Jul 12 Aug 12 Sept 12 Oct 12**
Wei
ghte
d U
sab
le H
abit
at (
Perc
ent)
Bull Trout Adult Habitat with Leased Water
Bull Trout Adult Habitat without Leased Water
Bull Trout Spawning Habitat with Leased Water
Bull Trout Spawning Habitat without Leased Water
Page | 10 2011-2012 Idaho Water Transactions Program Monitoring and Evaluation Report
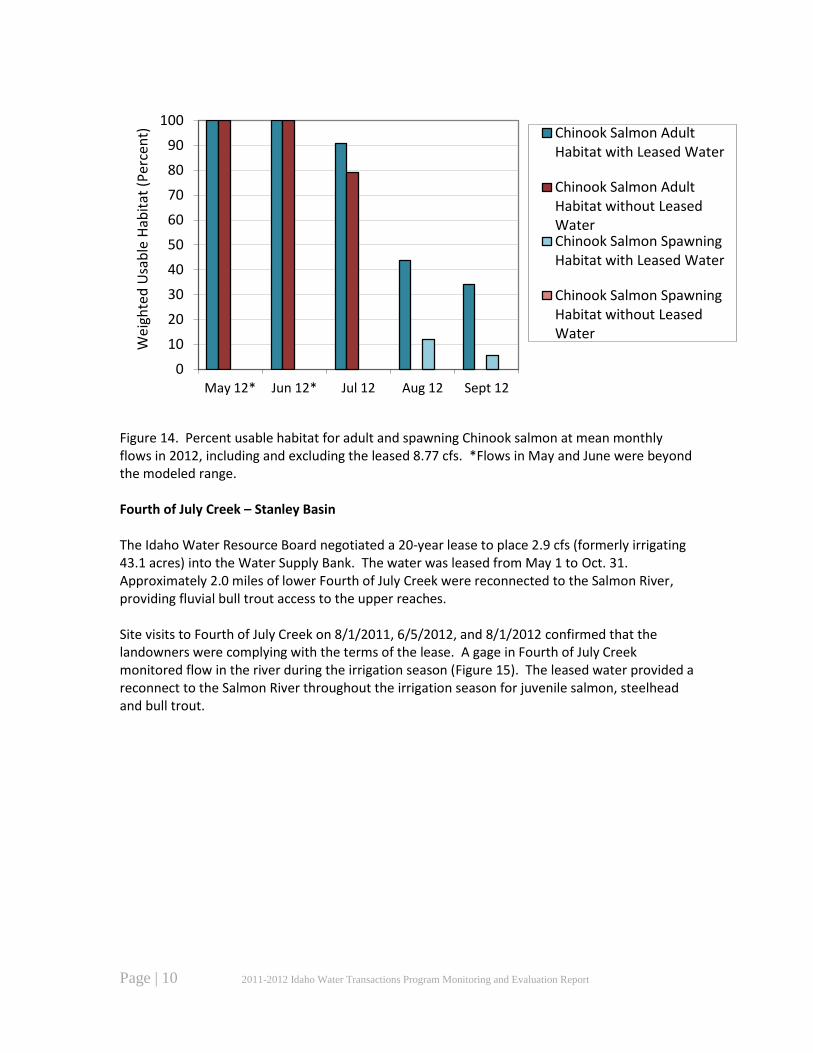
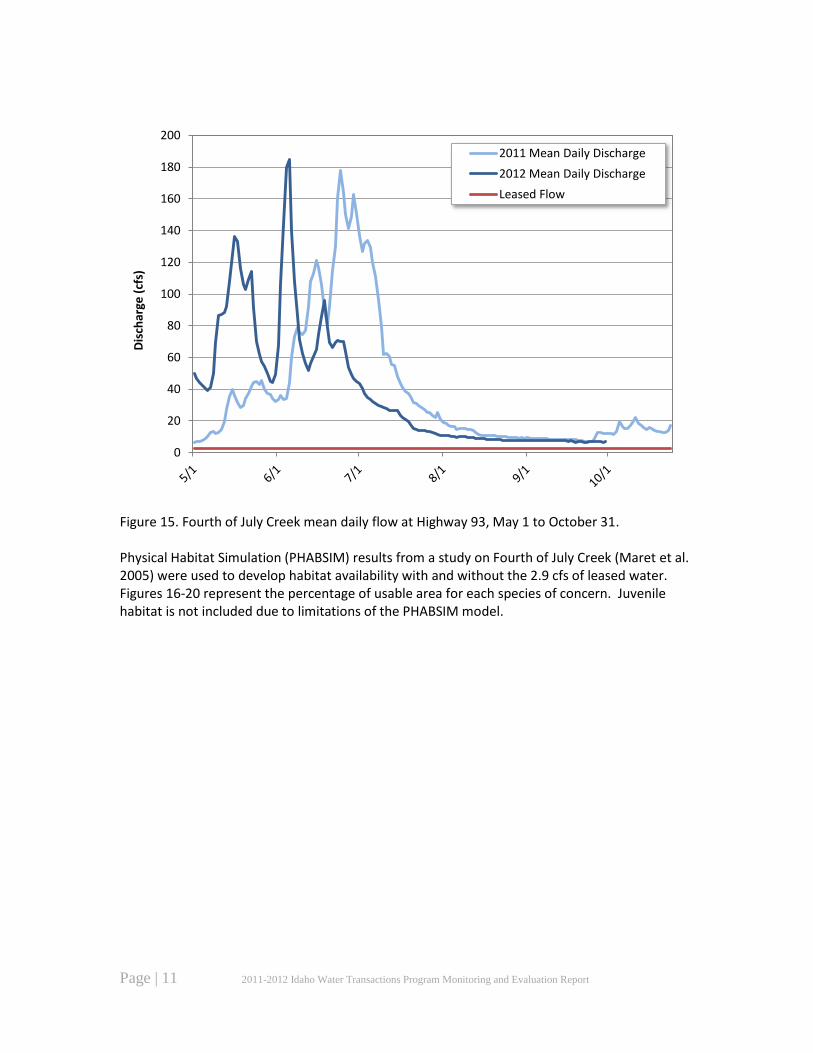
Figure 14. Percent usable habitat for adult and spawning Chinook salmon at mean monthly flows in 2012, including and excluding the leased 8.77 cfs. *Flows in May and June were beyond the modeled range. Fourth of July Creek – Stanley Basin The Idaho Water Resource Board negotiated a 20-year lease to place 2.9 cfs (formerly irrigating 43.1 acres) into the Water Supply Bank. The water was leased from May 1 to Oct. 31. Approximately 2.0 miles of lower Fourth of July Creek were reconnected to the Salmon River, providing fluvial bull trout access to the upper reaches. Site visits to Fourth of July Creek on 8/1/2011, 6/5/2012, and 8/1/2012 confirmed that the landowners were complying with the terms of the lease. A gage in Fourth of July Creek monitored flow in the river during the irrigation season (Figure 15). The leased water provided a reconnect to the Salmon River throughout the irrigation season for juvenile salmon, steelhead and bull trout.
0
10
20
30
40
50
60
70
80
90
100
May 12* Jun 12* Jul 12 Aug 12 Sept 12
We
igh
ted
Usa
ble
Hab
itat
(P
erc
ent)
Chinook Salmon Adult Habitat with Leased Water
Chinook Salmon Adult Habitat without Leased Water Chinook Salmon Spawning Habitat with Leased Water
Chinook Salmon Spawning Habitat without Leased Water
Page | 11 2011-2012 Idaho Water Transactions Program Monitoring and Evaluation Report
Figure 15. Fourth of July Creek mean daily flow at Highway 93, May 1 to October 31. Physical Habitat Simulation (PHABSIM) results from a study on Fourth of July Creek (Maret et al. 2005) were used to develop habitat availability with and without the 2.9 cfs of leased water. Figures 16-20 represent the percentage of usable area for each species of concern. Juvenile habitat is not included due to limitations of the PHABSIM model.
0
20
40
60
80
100
120
140
160
180
200 D
isch
arge
(cf
s)
2011 Mean Daily Discharge
2012 Mean Daily Discharge
Leased Flow

Page | 12 2011-2012 Idaho Water Transactions Program Monitoring and Evaluation Report
Figure 16. Percent weighted usable habitat for adult and spawning bull trout at mean monthly flows in 2011, including and excluding the leased 2.9 cfs. * Flows in June were beyond the modeled range.
Figure 17. Percent weighted usable habitat for adult and spawning Chinook salmon at mean monthly flows in 2011, including and excluding the leased 2.9 cfs. * Flows in June were beyond the modeled range.
0
10
20
30
40
50
60
70
80
90
100
Wei
ghte
d U
sab
le H
abit
at (
Perc
ent)
Bull Trout Adult Habitat with Leased Water
Bull Trout Adult Habitat without Leased Water
Bull Trout Spawning Habitat with Leased Water
Bull Trout Spawning Habitat without Leased Water
0
10
20
30
40
50
60
70
80
90
100
Wei
ghte
d U
sab
le H
abit
at (
Per
cen
t)
Chinook Salmon Adult Habitat with Leased Water
Chinook Salmon Adult Habitat without Leased Water
Chinook Salmon Spawning Habitat with Leased Water
Chinook Salmon Spawning Habitat without Leased Water
Page | 13 2011-2012 Idaho Water Transactions Program Monitoring and Evaluation Report
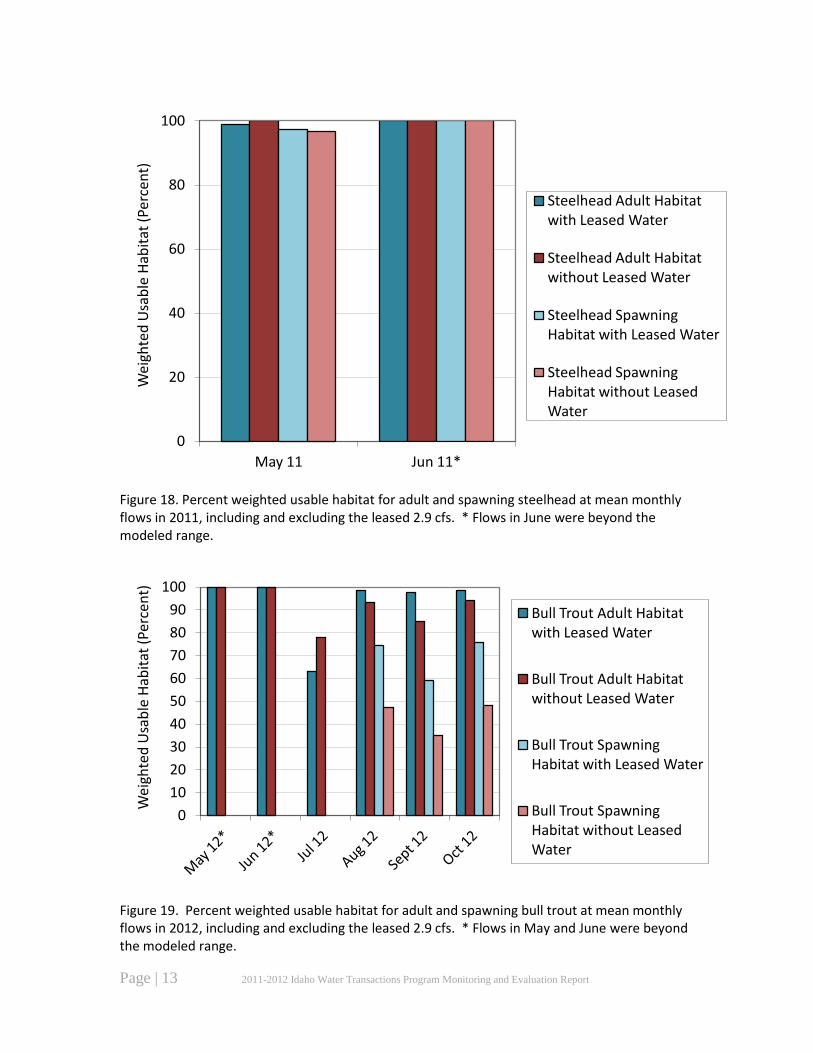
Figure 18. Percent weighted usable habitat for adult and spawning steelhead at mean monthly flows in 2011, including and excluding the leased 2.9 cfs. * Flows in June were beyond the modeled range.
Figure 19. Percent weighted usable habitat for adult and spawning bull trout at mean monthly flows in 2012, including and excluding the leased 2.9 cfs. * Flows in May and June were beyond the modeled range.
0
20
40
60
80
100
May 11 Jun 11*
Wei
ghte
d U
sab
le H
abit
at (
Perc
ent)
Steelhead Adult Habitat with Leased Water
Steelhead Adult Habitat without Leased Water
Steelhead Spawning Habitat with Leased Water
Steelhead Spawning Habitat without Leased Water
0
10
20
30
40
50
60
70
80
90
100
Wei
ghte
d U
sab
le H
abit
at (
Perc
ent)
Bull Trout Adult Habitat with Leased Water
Bull Trout Adult Habitat without Leased Water
Bull Trout Spawning Habitat with Leased Water
Bull Trout Spawning Habitat without Leased Water
Page | 14 2011-2012 Idaho Water Transactions Program Monitoring and Evaluation Report
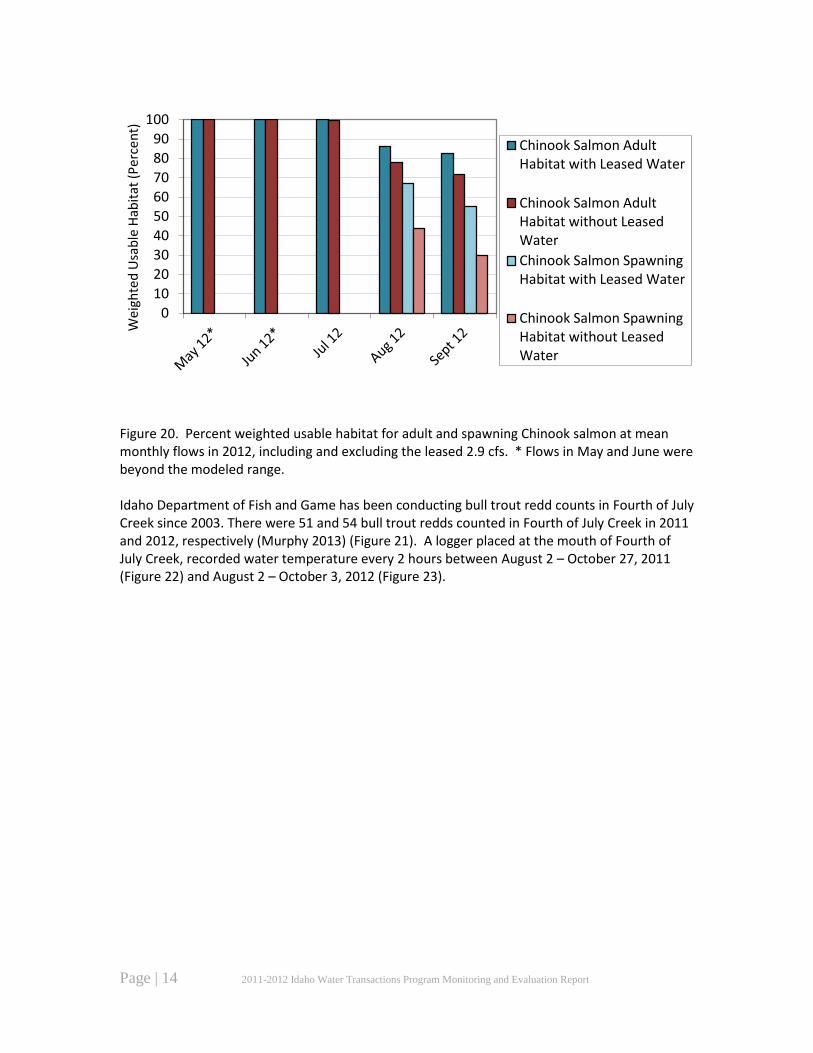
Figure 20. Percent weighted usable habitat for adult and spawning Chinook salmon at mean monthly flows in 2012, including and excluding the leased 2.9 cfs. * Flows in May and June were beyond the modeled range. Idaho Department of Fish and Game has been conducting bull trout redd counts in Fourth of July Creek since 2003. There were 51 and 54 bull trout redds counted in Fourth of July Creek in 2011 and 2012, respectively (Murphy 2013) (Figure 21). A logger placed at the mouth of Fourth of July Creek, recorded water temperature every 2 hours between August 2 – October 27, 2011 (Figure 22) and August 2 – October 3, 2012 (Figure 23).
0
10
20
30
40
50
60
70
80
90
100 W
eig
hte
d U
sab
le H
abit
at (
Per
cen
t)
Chinook Salmon Adult Habitat with Leased Water
Chinook Salmon Adult Habitat without Leased Water
Chinook Salmon Spawning Habitat with Leased Water
Chinook Salmon Spawning Habitat without Leased Water

Page | 15 2011-2012 Idaho Water Transactions Program Monitoring and Evaluation Report
Figure 21. Annual counts of fluvial bull trout redds in Fourth of July Creek from 2003-2012 (Murphy 2013).
Figure 22. Fourth of July Creek (near mouth) water temperature data (⁰F) as collected by HOBO Tidbit logger measuring every two hours from August 2 – October 27, 2011 (high flow prevented early deployment).
16
33
41
71
49
25
50
56 51
54
0
10
20
30
40
50
60
70
80
2003 2004 2005 2006 2007 2008 2009 2010 2011 2012
No
. Red
ds
Ob
serv
ed
30
35
40
45
50
55
60
8/2/2011 8/16/2011 8/30/2011 9/13/2011 9/27/2011 10/11/2011 10/25/2011
Tem
pe
ratu
re ⁰
F
Daily Maximum
Daily Mean
Weekly Mean Maximum
Weekly Mean
Page | 16 2011-2012 Idaho Water Transactions Program Monitoring and Evaluation Report
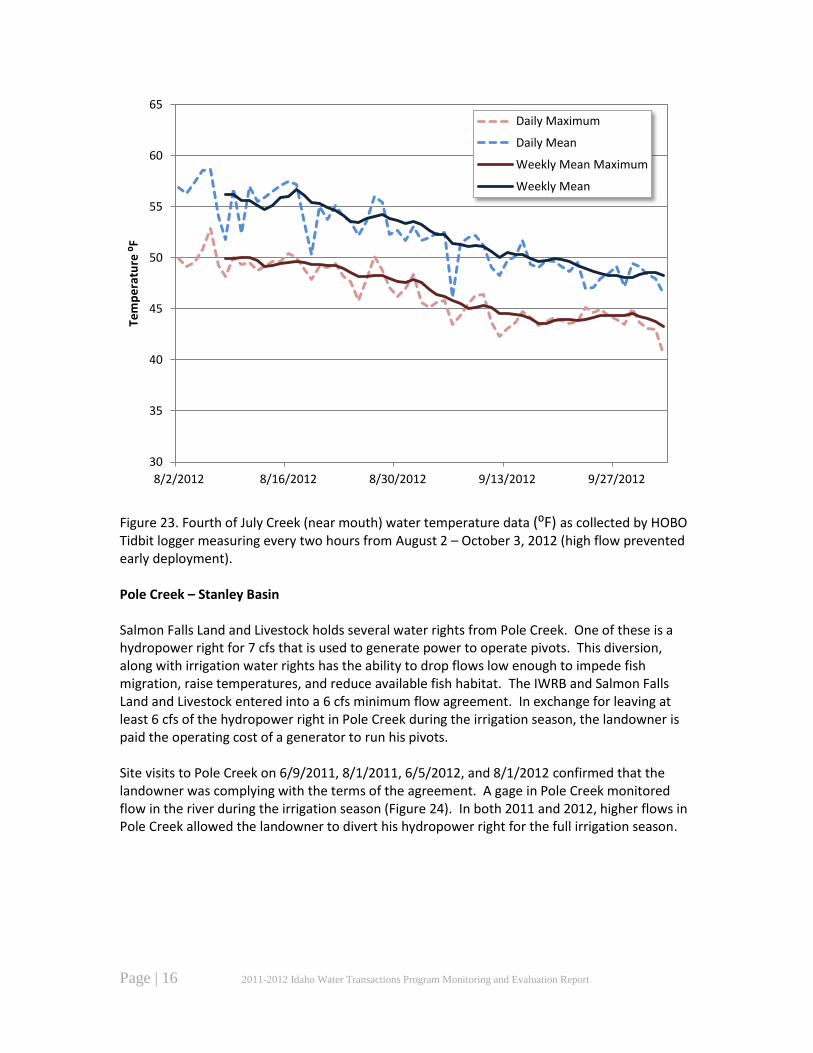
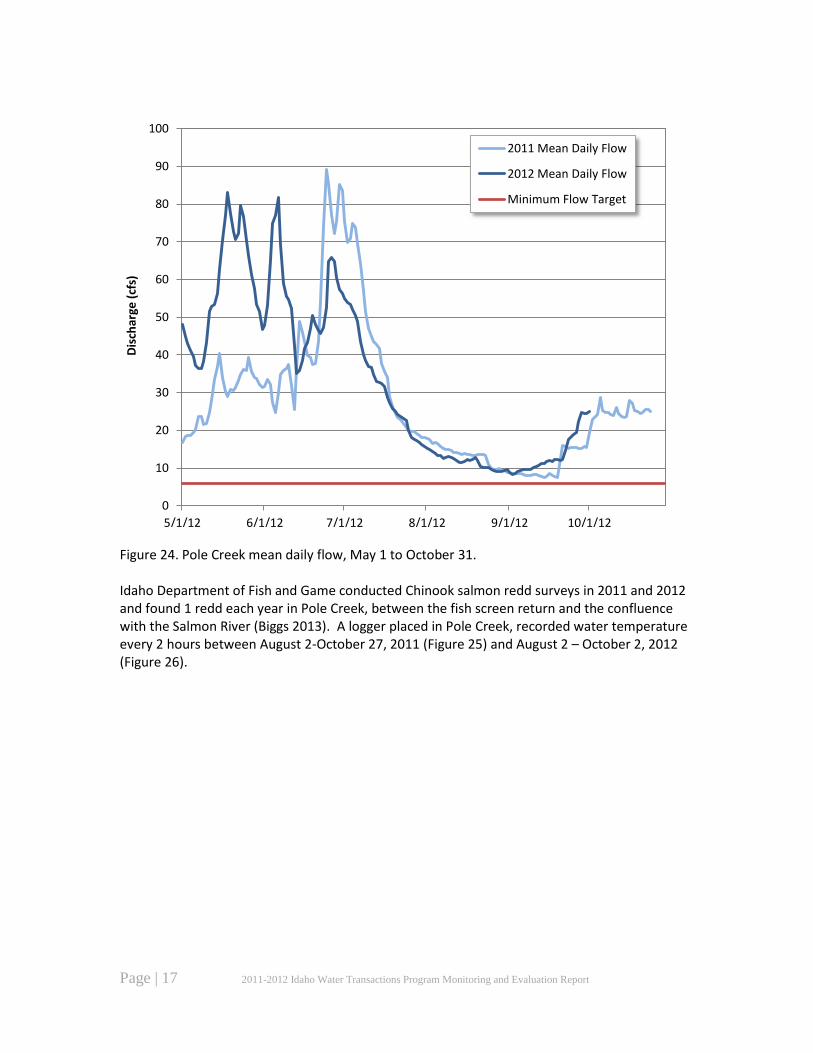
Figure 23. Fourth of July Creek (near mouth) water temperature data (⁰F) as collected by HOBO Tidbit logger measuring every two hours from August 2 – October 3, 2012 (high flow prevented early deployment). Pole Creek – Stanley Basin Salmon Falls Land and Livestock holds several water rights from Pole Creek. One of these is a hydropower right for 7 cfs that is used to generate power to operate pivots. This diversion, along with irrigation water rights has the ability to drop flows low enough to impede fish migration, raise temperatures, and reduce available fish habitat. The IWRB and Salmon Falls Land and Livestock entered into a 6 cfs minimum flow agreement. In exchange for leaving at least 6 cfs of the hydropower right in Pole Creek during the irrigation season, the landowner is paid the operating cost of a generator to run his pivots. Site visits to Pole Creek on 6/9/2011, 8/1/2011, 6/5/2012, and 8/1/2012 confirmed that the landowner was complying with the terms of the agreement. A gage in Pole Creek monitored flow in the river during the irrigation season (Figure 24). In both 2011 and 2012, higher flows in Pole Creek allowed the landowner to divert his hydropower right for the full irrigation season.
30
35
40
45
50
55
60
65
8/2/2012 8/16/2012 8/30/2012 9/13/2012 9/27/2012
Tem
pe
ratu
re ⁰
F Daily Maximum
Daily Mean
Weekly Mean Maximum
Weekly Mean
Page | 17 2011-2012 Idaho Water Transactions Program Monitoring and Evaluation Report
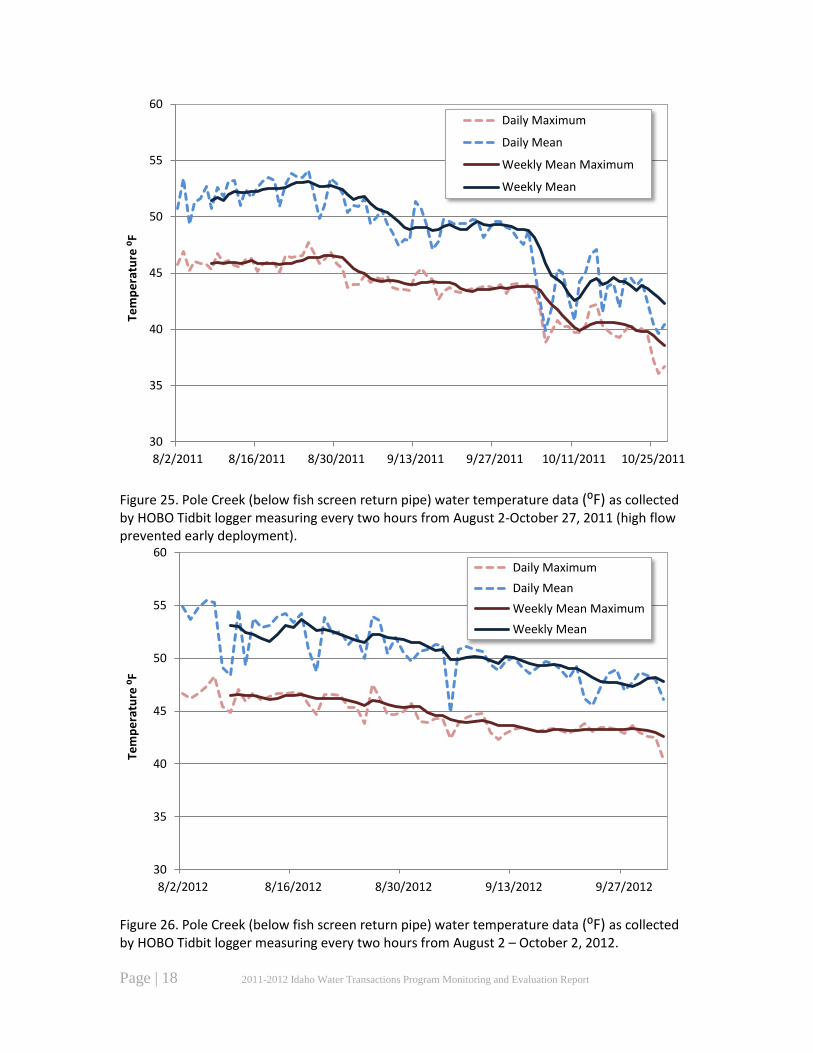
Figure 24. Pole Creek mean daily flow, May 1 to October 31. Idaho Department of Fish and Game conducted Chinook salmon redd surveys in 2011 and 2012 and found 1 redd each year in Pole Creek, between the fish screen return and the confluence with the Salmon River (Biggs 2013). A logger placed in Pole Creek, recorded water temperature every 2 hours between August 2-October 27, 2011 (Figure 25) and August 2 – October 2, 2012 (Figure 26).
0
10
20
30
40
50
60
70
80
90
100
5/1/12 6/1/12 7/1/12 8/1/12 9/1/12 10/1/12
Dis
char
ge (
cfs)
2011 Mean Daily Flow
2012 Mean Daily Flow
Minimum Flow Target
Page | 18 2011-2012 Idaho Water Transactions Program Monitoring and Evaluation Report
Figure 25. Pole Creek (below fish screen return pipe) water temperature data (⁰F) as collected by HOBO Tidbit logger measuring every two hours from August 2-October 27, 2011 (high flow prevented early deployment).
Figure 26. Pole Creek (below fish screen return pipe) water temperature data (⁰F) as collected by HOBO Tidbit logger measuring every two hours from August 2 – October 2, 2012.
30
35
40
45
50
55
60
8/2/2011 8/16/2011 8/30/2011 9/13/2011 9/27/2011 10/11/2011 10/25/2011
Tem
pe
ratu
re ⁰
F Daily Maximum
Daily Mean
Weekly Mean Maximum
Weekly Mean
30
35
40
45
50
55
60
8/2/2012 8/16/2012 8/30/2012 9/13/2012 9/27/2012
Tem
pe
ratu
re ⁰
F
Daily Maximum
Daily Mean
Weekly Mean Maximum
Weekly Mean
Page | 19 2011-2012 Idaho Water Transactions Program Monitoring and Evaluation Report
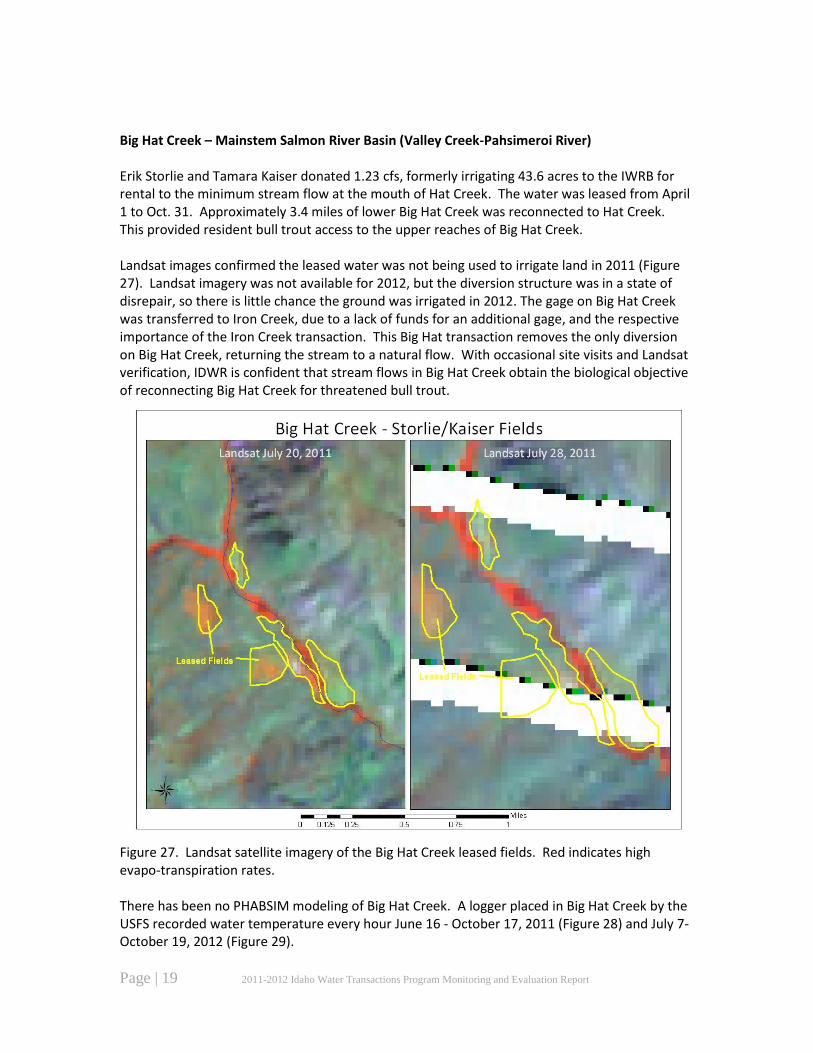
Big Hat Creek – Mainstem Salmon River Basin (Valley Creek-Pahsimeroi River) Erik Storlie and Tamara Kaiser donated 1.23 cfs, formerly irrigating 43.6 acres to the IWRB for rental to the minimum stream flow at the mouth of Hat Creek. The water was leased from April 1 to Oct. 31. Approximately 3.4 miles of lower Big Hat Creek was reconnected to Hat Creek. This provided resident bull trout access to the upper reaches of Big Hat Creek. Landsat images confirmed the leased water was not being used to irrigate land in 2011 (Figure 27). Landsat imagery was not available for 2012, but the diversion structure was in a state of disrepair, so there is little chance the ground was irrigated in 2012. The gage on Big Hat Creek was transferred to Iron Creek, due to a lack of funds for an additional gage, and the respective importance of the Iron Creek transaction. This Big Hat transaction removes the only diversion on Big Hat Creek, returning the stream to a natural flow. With occasional site visits and Landsat verification, IDWR is confident that stream flows in Big Hat Creek obtain the biological objective of reconnecting Big Hat Creek for threatened bull trout.
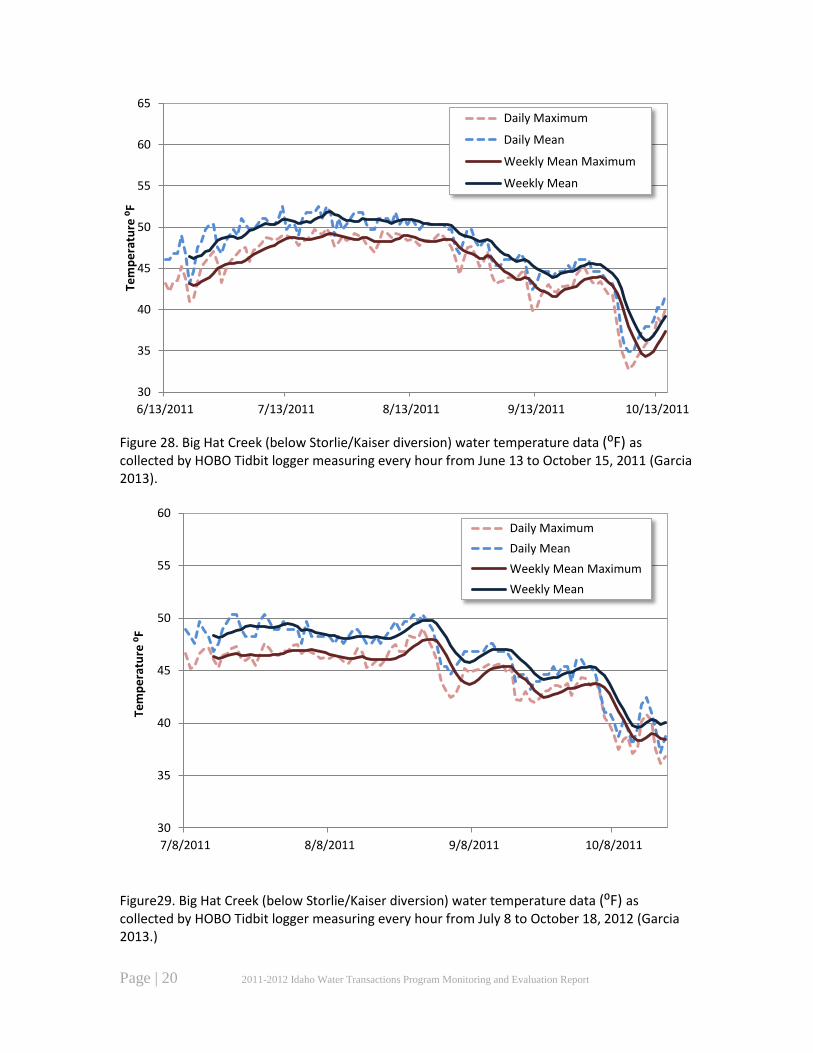
Figure 27. Landsat satellite imagery of the Big Hat Creek leased fields. Red indicates high evapo-transpiration rates. There has been no PHABSIM modeling of Big Hat Creek. A logger placed in Big Hat Creek by the USFS recorded water temperature every hour June 16 - October 17, 2011 (Figure 28) and July 7-October 19, 2012 (Figure 29).
Page | 20 2011-2012 Idaho Water Transactions Program Monitoring and Evaluation Report
Figure 28. Big Hat Creek (below Storlie/Kaiser diversion) water temperature data (⁰F) as collected by HOBO Tidbit logger measuring every hour from June 13 to October 15, 2011 (Garcia 2013).
Figure29. Big Hat Creek (below Storlie/Kaiser diversion) water temperature data (⁰F) as collected by HOBO Tidbit logger measuring every hour from July 8 to October 18, 2012 (Garcia 2013.)
30
35
40
45
50
55
60
65
6/13/2011 7/13/2011 8/13/2011 9/13/2011 10/13/2011
Tem
pe
ratu
re ⁰
F Daily Maximum
Daily Mean
Weekly Mean Maximum
Weekly Mean
30
35
40
45
50
55
60
7/8/2011 8/8/2011 9/8/2011 10/8/2011
Tem
pe
ratu
re ⁰
F
Daily Maximum
Daily Mean
Weekly Mean Maximum
Weekly Mean
Page | 21 2011-2012 Idaho Water Transactions Program Monitoring and Evaluation Report
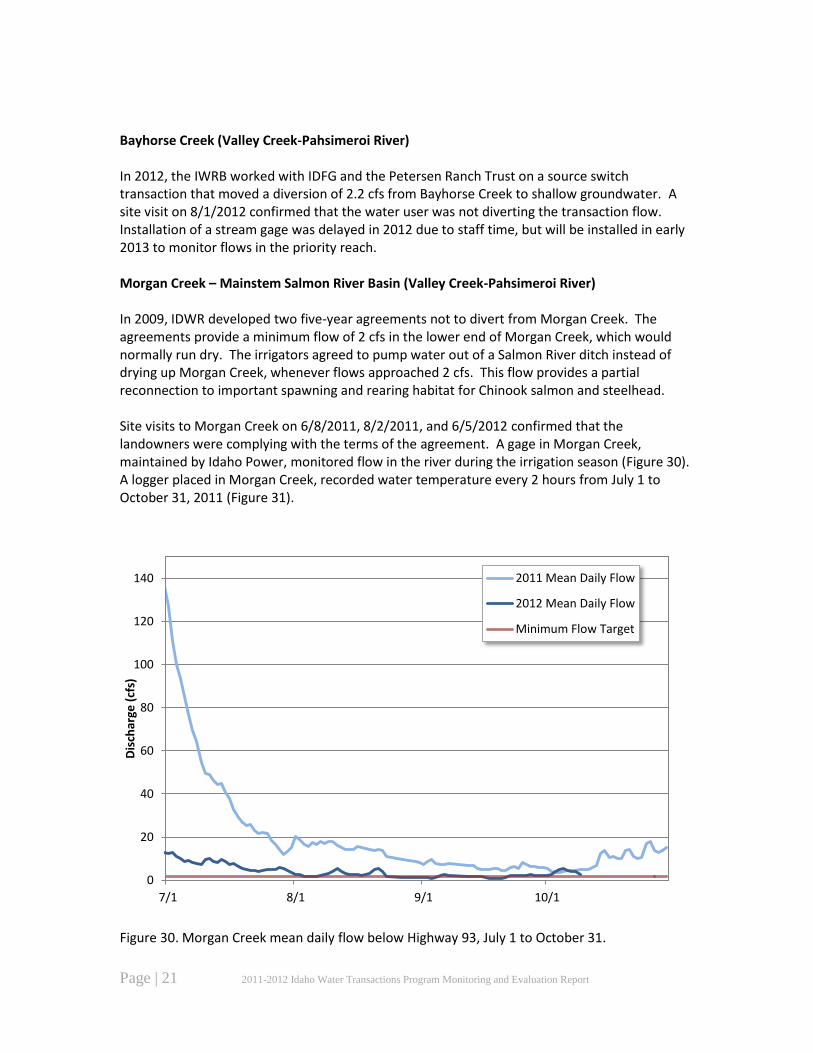
Bayhorse Creek (Valley Creek-Pahsimeroi River) In 2012, the IWRB worked with IDFG and the Petersen Ranch Trust on a source switch transaction that moved a diversion of 2.2 cfs from Bayhorse Creek to shallow groundwater. A site visit on 8/1/2012 confirmed that the water user was not diverting the transaction flow. Installation of a stream gage was delayed in 2012 due to staff time, but will be installed in early 2013 to monitor flows in the priority reach. Morgan Creek – Mainstem Salmon River Basin (Valley Creek-Pahsimeroi River) In 2009, IDWR developed two five-year agreements not to divert from Morgan Creek. The agreements provide a minimum flow of 2 cfs in the lower end of Morgan Creek, which would normally run dry. The irrigators agreed to pump water out of a Salmon River ditch instead of drying up Morgan Creek, whenever flows approached 2 cfs. This flow provides a partial reconnection to important spawning and rearing habitat for Chinook salmon and steelhead. Site visits to Morgan Creek on 6/8/2011, 8/2/2011, and 6/5/2012 confirmed that the landowners were complying with the terms of the agreement. A gage in Morgan Creek, maintained by Idaho Power, monitored flow in the river during the irrigation season (Figure 30). A logger placed in Morgan Creek, recorded water temperature every 2 hours from July 1 to October 31, 2011 (Figure 31).
Figure 30. Morgan Creek mean daily flow below Highway 93, July 1 to October 31.
0
20
40
60
80
100
120
140
7/1 8/1 9/1 10/1
Dis
char
ge (
cfs)
2011 Mean Daily Flow
2012 Mean Daily Flow
Minimum Flow Target
Page | 22 2011-2012 Idaho Water Transactions Program Monitoring and Evaluation Report
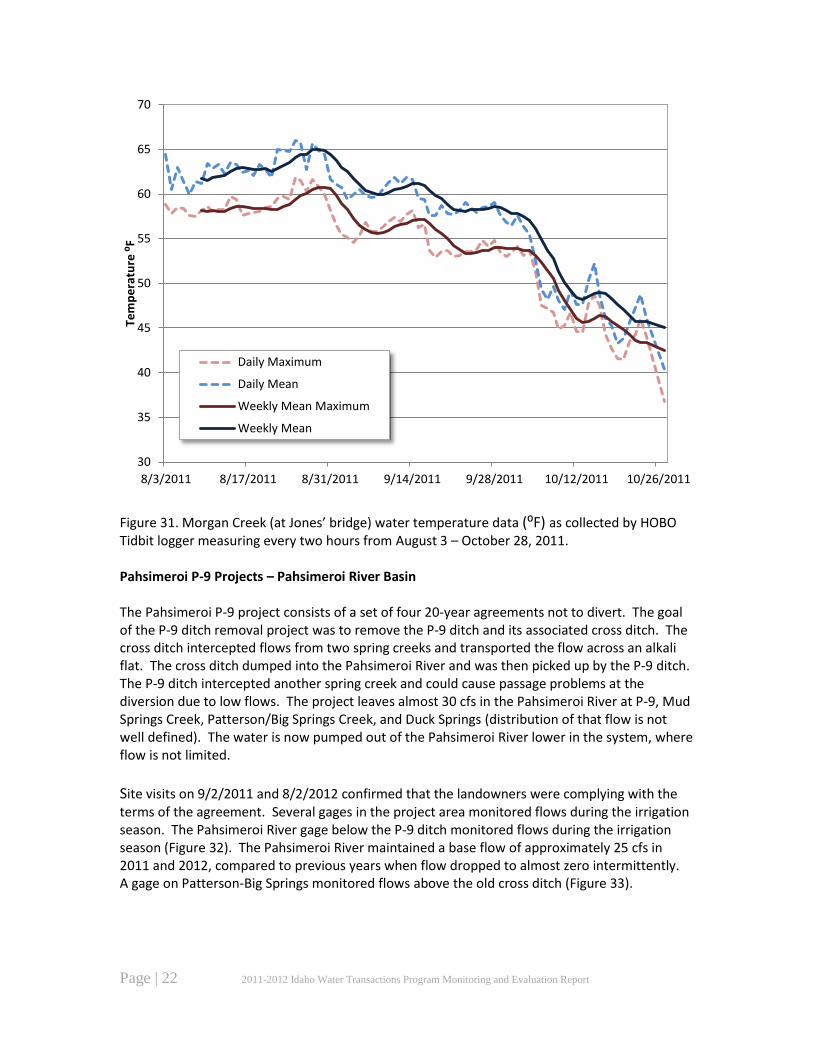
Figure 31. Morgan Creek (at Jones’ bridge) water temperature data (⁰F) as collected by HOBO Tidbit logger measuring every two hours from August 3 – October 28, 2011. Pahsimeroi P-9 Projects – Pahsimeroi River Basin The Pahsimeroi P-9 project consists of a set of four 20-year agreements not to divert. The goal of the P-9 ditch removal project was to remove the P-9 ditch and its associated cross ditch. The cross ditch intercepted flows from two spring creeks and transported the flow across an alkali flat. The cross ditch dumped into the Pahsimeroi River and was then picked up by the P-9 ditch. The P-9 ditch intercepted another spring creek and could cause passage problems at the diversion due to low flows. The project leaves almost 30 cfs in the Pahsimeroi River at P-9, Mud Springs Creek, Patterson/Big Springs Creek, and Duck Springs (distribution of that flow is not well defined). The water is now pumped out of the Pahsimeroi River lower in the system, where flow is not limited.
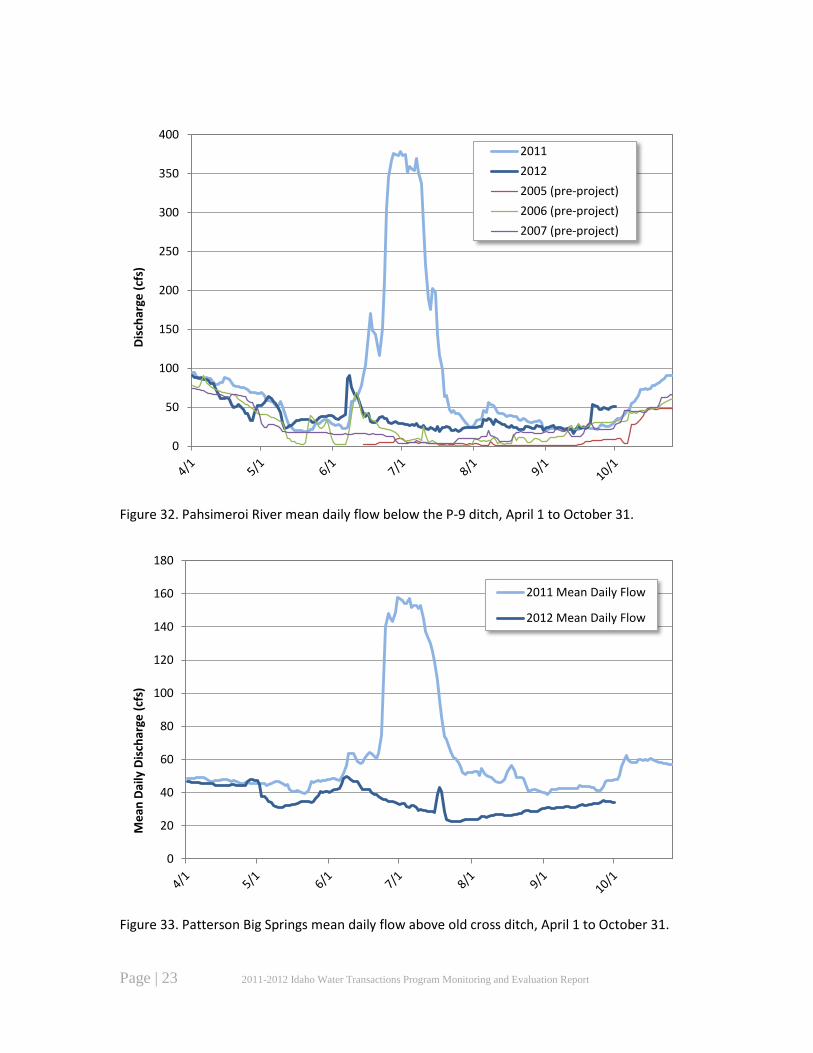
Site visits on 9/2/2011 and 8/2/2012 confirmed that the landowners were complying with the terms of the agreement. Several gages in the project area monitored flows during the irrigation season. The Pahsimeroi River gage below the P-9 ditch monitored flows during the irrigation season (Figure 32). The Pahsimeroi River maintained a base flow of approximately 25 cfs in 2011 and 2012, compared to previous years when flow dropped to almost zero intermittently. A gage on Patterson-Big Springs monitored flows above the old cross ditch (Figure 33).
30
35
40
45
50
55
60
65
70
8/3/2011 8/17/2011 8/31/2011 9/14/2011 9/28/2011 10/12/2011 10/26/2011
Tem
pe
ratu
re ⁰
F
Daily Maximum
Daily Mean
Weekly Mean Maximum
Weekly Mean
Page | 23 2011-2012 Idaho Water Transactions Program Monitoring and Evaluation Report
Figure 32. Pahsimeroi River mean daily flow below the P-9 ditch, April 1 to October 31.
Figure 33. Patterson Big Springs mean daily flow above old cross ditch, April 1 to October 31.
0
50
100
150
200
250
300
350
400 D
isch
arge
(cf
s)
2011
2012
2005 (pre-project)
2006 (pre-project)
2007 (pre-project)
0
20
40
60
80
100
120
140
160
180
Me
an D
aily
Dis
char
ge (
cfs)
2011 Mean Daily Flow
2012 Mean Daily Flow
Page | 24 2011-2012 Idaho Water Transactions Program Monitoring and Evaluation Report
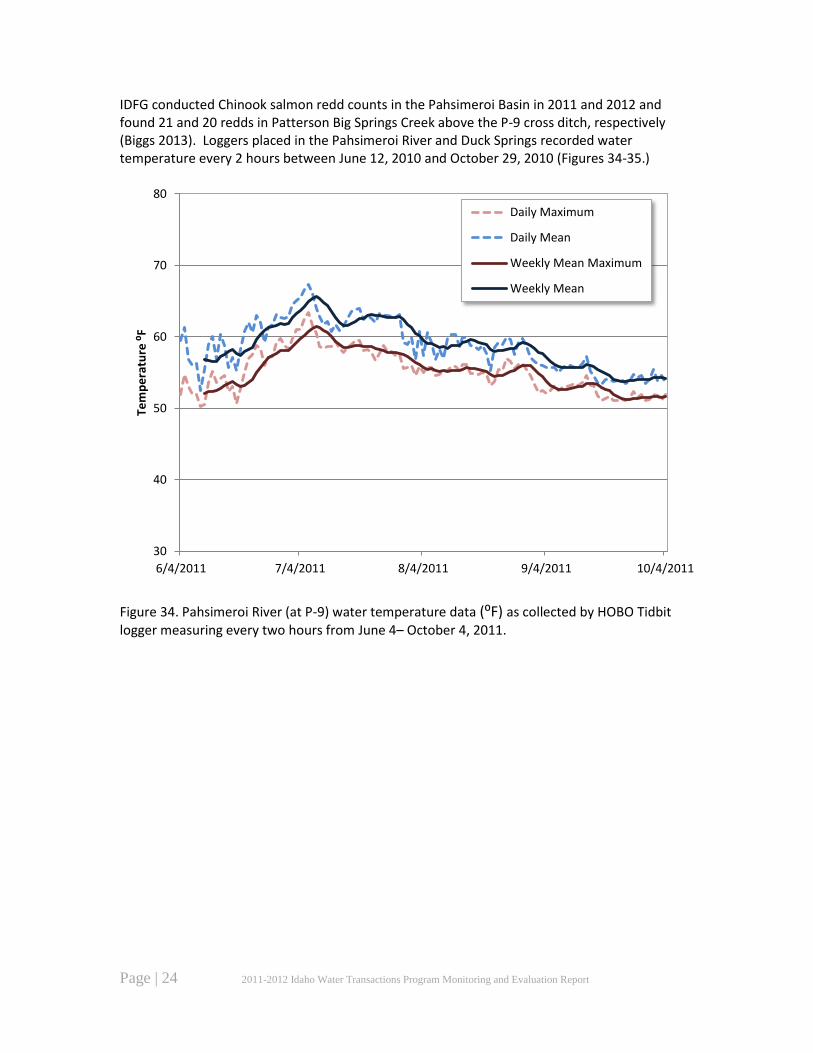
IDFG conducted Chinook salmon redd counts in the Pahsimeroi Basin in 2011 and 2012 and found 21 and 20 redds in Patterson Big Springs Creek above the P-9 cross ditch, respectively (Biggs 2013). Loggers placed in the Pahsimeroi River and Duck Springs recorded water temperature every 2 hours between June 12, 2010 and October 29, 2010 (Figures 34-35.)
Figure 34. Pahsimeroi River (at P-9) water temperature data (⁰F) as collected by HOBO Tidbit logger measuring every two hours from June 4– October 4, 2011.
30
40
50
60
70
80
6/4/2011 7/4/2011 8/4/2011 9/4/2011 10/4/2011
Tem
pe
ratu
re ⁰
F
Daily Maximum
Daily Mean
Weekly Mean Maximum
Weekly Mean
Page | 25 2011-2012 Idaho Water Transactions Program Monitoring and Evaluation Report
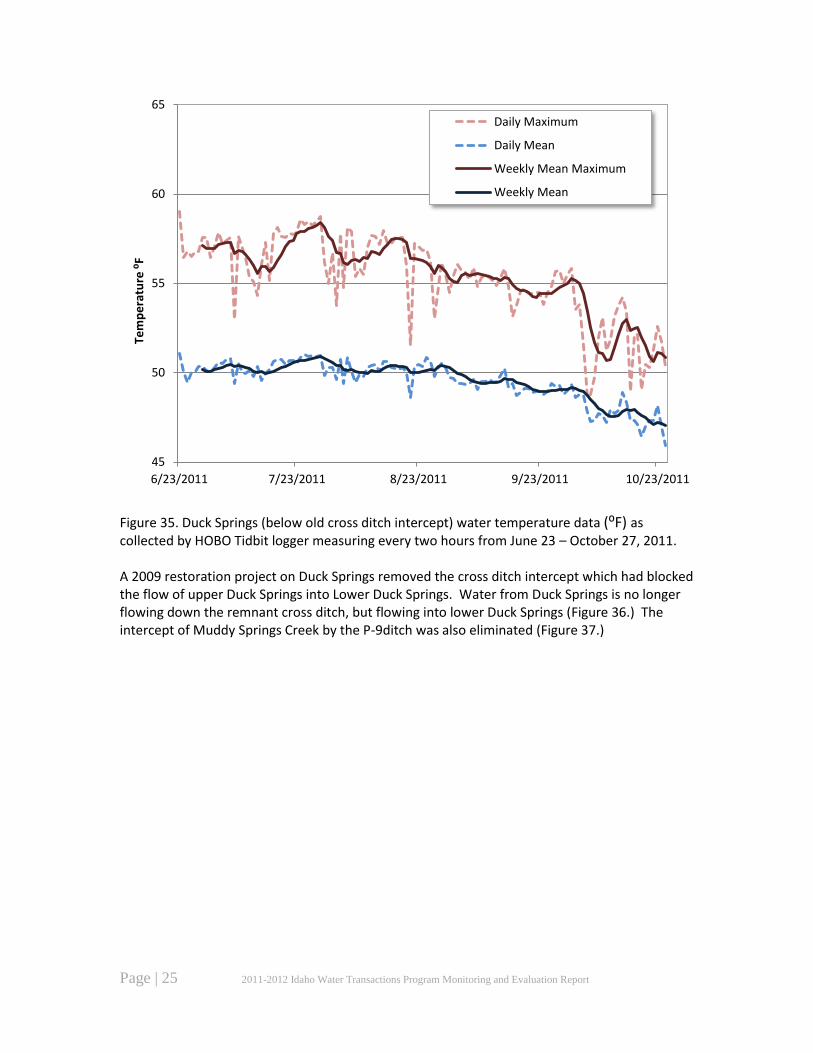
Figure 35. Duck Springs (below old cross ditch intercept) water temperature data (⁰F) as collected by HOBO Tidbit logger measuring every two hours from June 23 – October 27, 2011. A 2009 restoration project on Duck Springs removed the cross ditch intercept which had blocked the flow of upper Duck Springs into Lower Duck Springs. Water from Duck Springs is no longer flowing down the remnant cross ditch, but flowing into lower Duck Springs (Figure 36.) The intercept of Muddy Springs Creek by the P-9ditch was also eliminated (Figure 37.)
45
50
55
60
65
6/23/2011 7/23/2011 8/23/2011 9/23/2011 10/23/2011
Tem
pe
ratu
re ⁰
F
Daily Maximum
Daily Mean
Weekly Mean Maximum
Weekly Mean
Page | 26 2011-2012 Idaho Water Transactions Program Monitoring and Evaluation Report
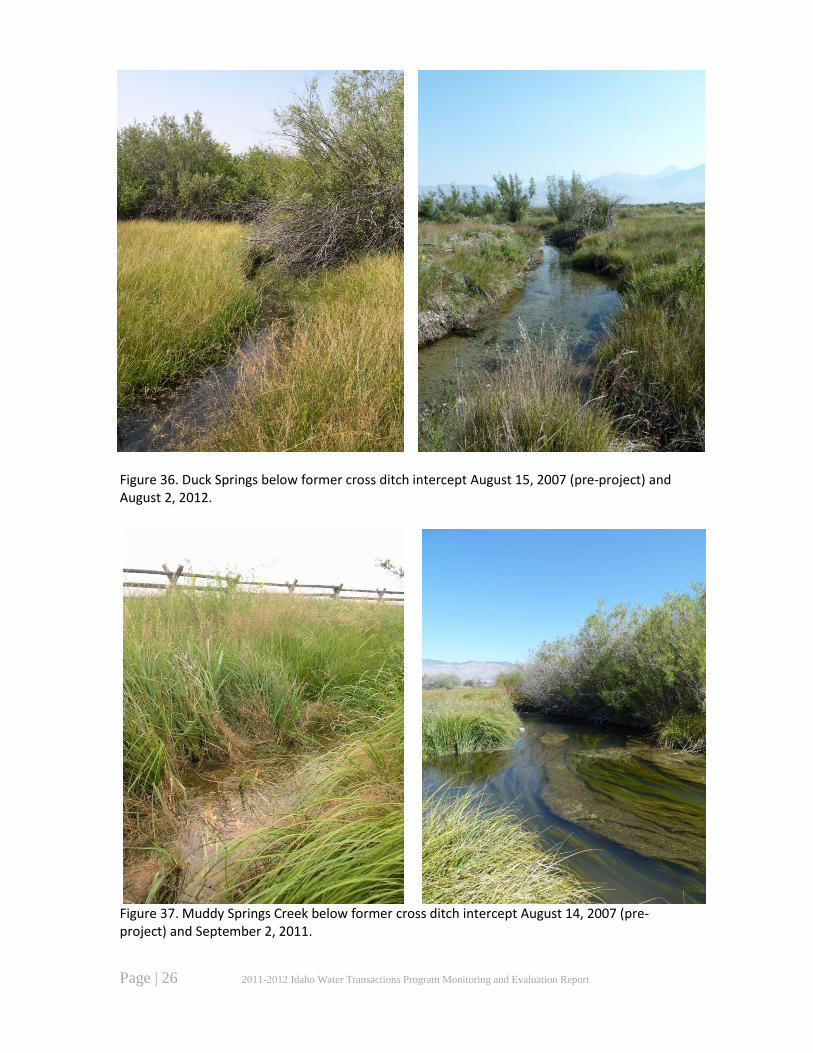
Figure 36. Duck Springs below former cross ditch intercept August 15, 2007 (pre-project) and August 2, 2012.
Figure 37. Muddy Springs Creek below former cross ditch intercept August 14, 2007 (pre-project) and September 2, 2011.
Page | 27 2011-2012 Idaho Water Transactions Program Monitoring and Evaluation Report
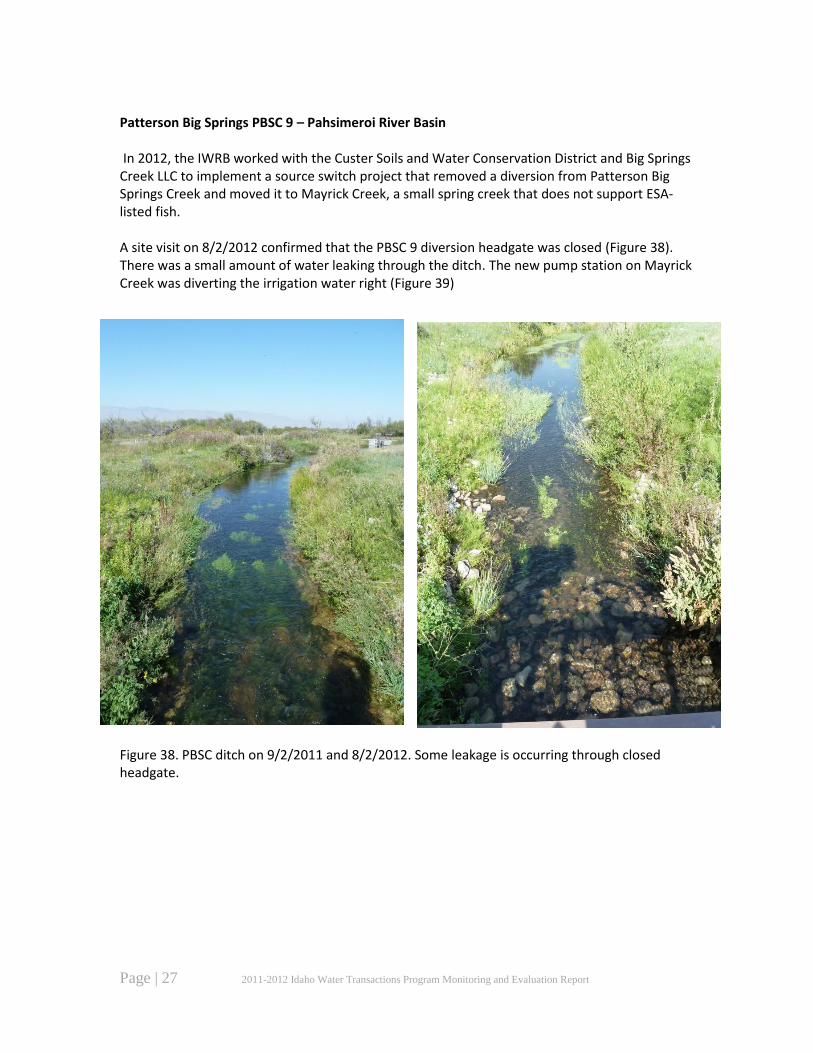
Patterson Big Springs PBSC 9 – Pahsimeroi River Basin In 2012, the IWRB worked with the Custer Soils and Water Conservation District and Big Springs Creek LLC to implement a source switch project that removed a diversion from Patterson Big Springs Creek and moved it to Mayrick Creek, a small spring creek that does not support ESA-listed fish. A site visit on 8/2/2012 confirmed that the PBSC 9 diversion headgate was closed (Figure 38). There was a small amount of water leaking through the ditch. The new pump station on Mayrick Creek was diverting the irrigation water right (Figure 39)
Figure 38. PBSC ditch on 9/2/2011 and 8/2/2012. Some leakage is occurring through closed headgate.
Page | 28 2011-2012 Idaho Water Transactions Program Monitoring and Evaluation Report
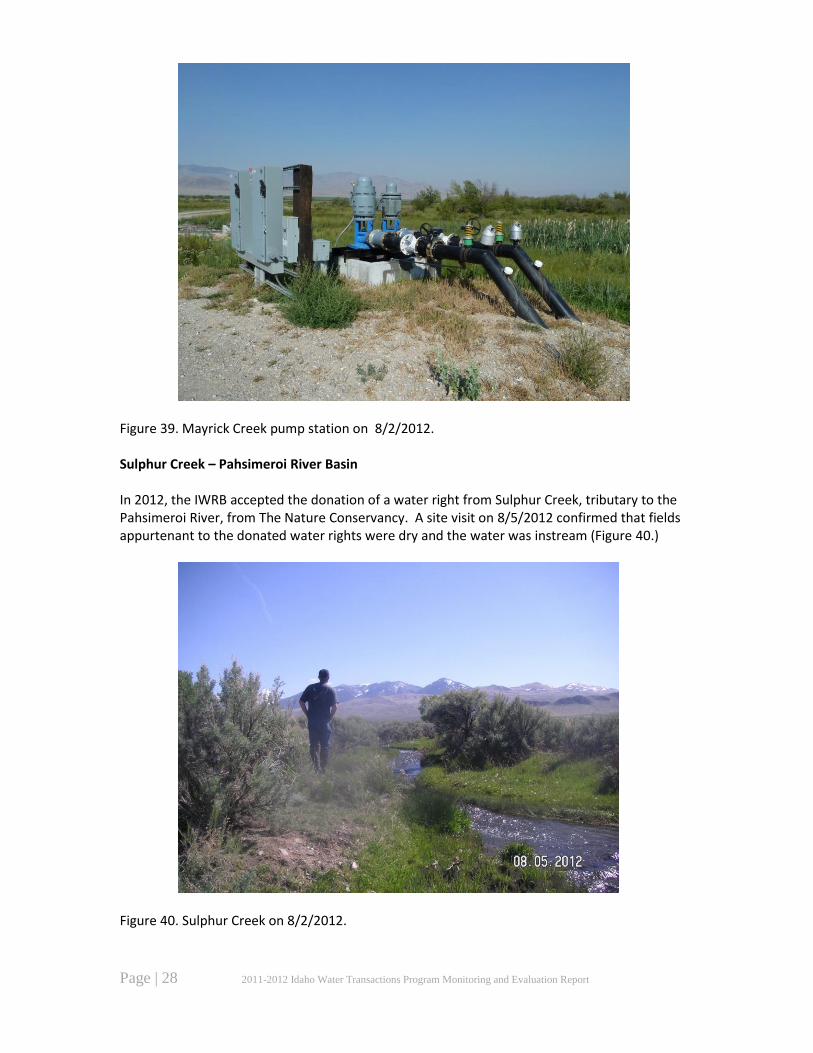
Figure 39. Mayrick Creek pump station on 8/2/2012. Sulphur Creek – Pahsimeroi River Basin In 2012, the IWRB accepted the donation of a water right from Sulphur Creek, tributary to the Pahsimeroi River, from The Nature Conservancy. A site visit on 8/5/2012 confirmed that fields appurtenant to the donated water rights were dry and the water was instream (Figure 40.)
Figure 40. Sulphur Creek on 8/2/2012.
Page | 29 2011-2012 Idaho Water Transactions Program Monitoring and Evaluation Report
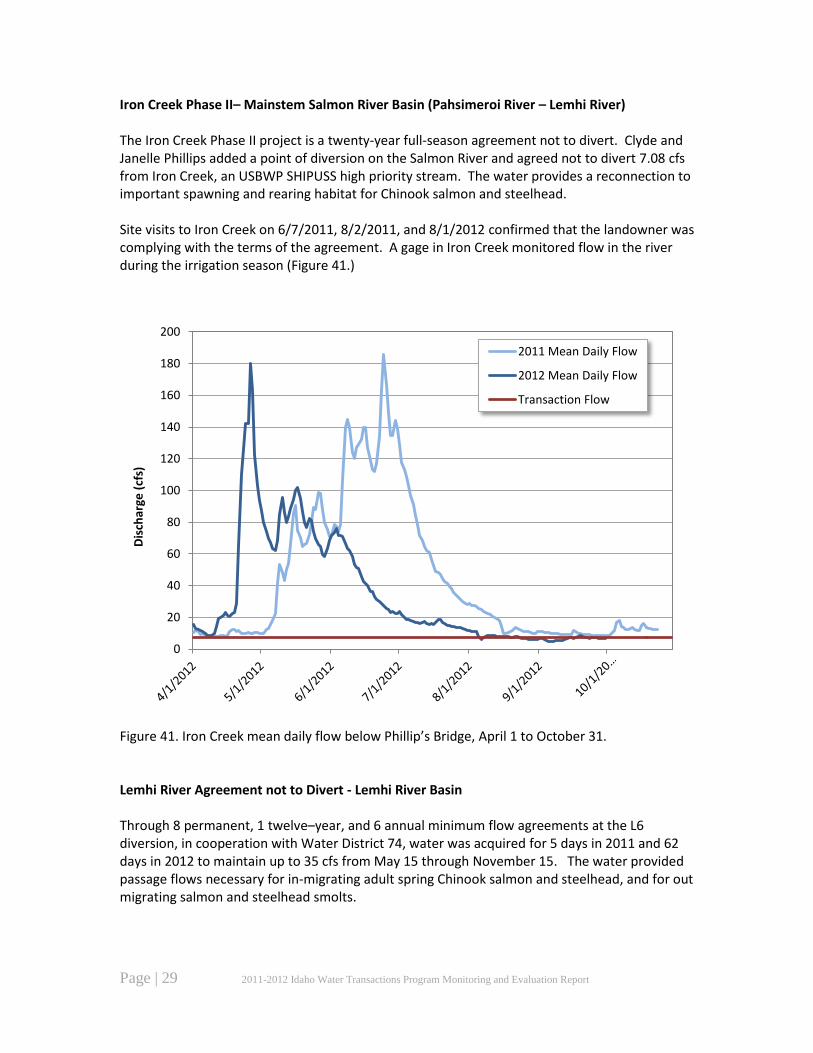
Iron Creek Phase II– Mainstem Salmon River Basin (Pahsimeroi River – Lemhi River) The Iron Creek Phase II project is a twenty-year full-season agreement not to divert. Clyde and Janelle Phillips added a point of diversion on the Salmon River and agreed not to divert 7.08 cfs from Iron Creek, an USBWP SHIPUSS high priority stream. The water provides a reconnection to important spawning and rearing habitat for Chinook salmon and steelhead. Site visits to Iron Creek on 6/7/2011, 8/2/2011, and 8/1/2012 confirmed that the landowner was complying with the terms of the agreement. A gage in Iron Creek monitored flow in the river during the irrigation season (Figure 41.)
Figure 41. Iron Creek mean daily flow below Phillip’s Bridge, April 1 to October 31. Lemhi River Agreement not to Divert - Lemhi River Basin Through 8 permanent, 1 twelve–year, and 6 annual minimum flow agreements at the L6 diversion, in cooperation with Water District 74, water was acquired for 5 days in 2011 and 62 days in 2012 to maintain up to 35 cfs from May 15 through November 15. The water provided passage flows necessary for in-migrating adult spring Chinook salmon and steelhead, and for out migrating salmon and steelhead smolts.
0
20
40
60
80
100
120
140
160
180
200
Dis
char
ge (
cfs)
2011 Mean Daily Flow
2012 Mean Daily Flow
Transaction Flow

Page | 30 2011-2012 Idaho Water Transactions Program Monitoring and Evaluation Report
Rick Sager, the WD 74 Watermaster, administered this project. He adjusted the flows at L6 to meet the Lemhi Conservation Agreement flows (Figure 42.) A revised protocol now requires manual measurements at the USGS as flows approach 42 cfs to prevent flows dropping below the targets due to gage shifts at the USGS Real Time Lemhi River gage.
Figure 42. Lemhi River mean daily flow at L5, March 15 to November 15. IDFG conducted biologic monitoring in the Lemhi Basin in 2010 and found the 89 Chinook salmon redds in the Lemhi River (Biggs 2013) (Figure 43).
0
200
400
600
800
1000
1200
1400
1600
1800
Dis
char
ge (
cfs)
2011 Mean Daily Flow
2012 Mean Daily Flow
Minimum Flow Target
Page | 31 2011-2012 Idaho Water Transactions Program Monitoring and Evaluation Report
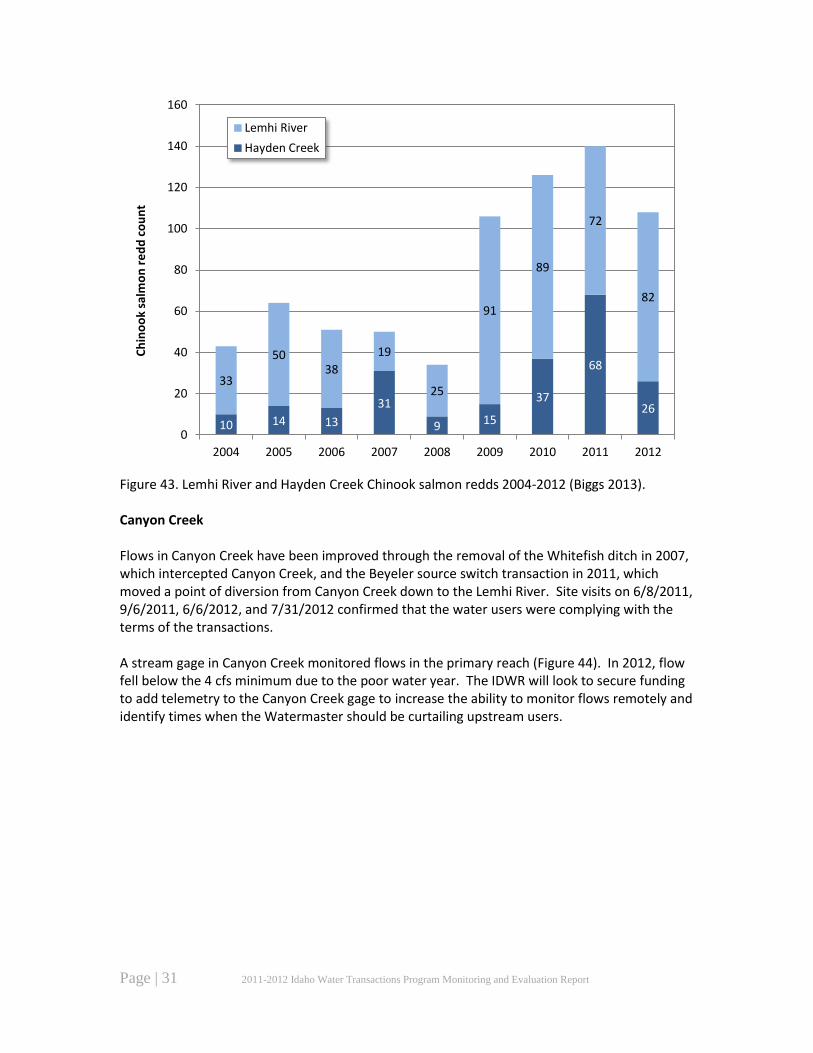
Figure 43. Lemhi River and Hayden Creek Chinook salmon redds 2004-2012 (Biggs 2013). Canyon Creek Flows in Canyon Creek have been improved through the removal of the Whitefish ditch in 2007, which intercepted Canyon Creek, and the Beyeler source switch transaction in 2011, which moved a point of diversion from Canyon Creek down to the Lemhi River. Site visits on 6/8/2011, 9/6/2011, 6/6/2012, and 7/31/2012 confirmed that the water users were complying with the terms of the transactions. A stream gage in Canyon Creek monitored flows in the primary reach (Figure 44). In 2012, flow fell below the 4 cfs minimum due to the poor water year. The IDWR will look to secure funding to add telemetry to the Canyon Creek gage to increase the ability to monitor flows remotely and identify times when the Watermaster should be curtailing upstream users.
10 14 13
31
9 15
37
68
26
33
50 38
19
25
91
89
72
82
0
20
40
60
80
100
120
140
160
2004 2005 2006 2007 2008 2009 2010 2011 2012
Ch
ino
ok
salm
on
re
dd
co
un
t Lemhi River
Hayden Creek
Page | 32 2011-2012 Idaho Water Transactions Program Monitoring and Evaluation Report
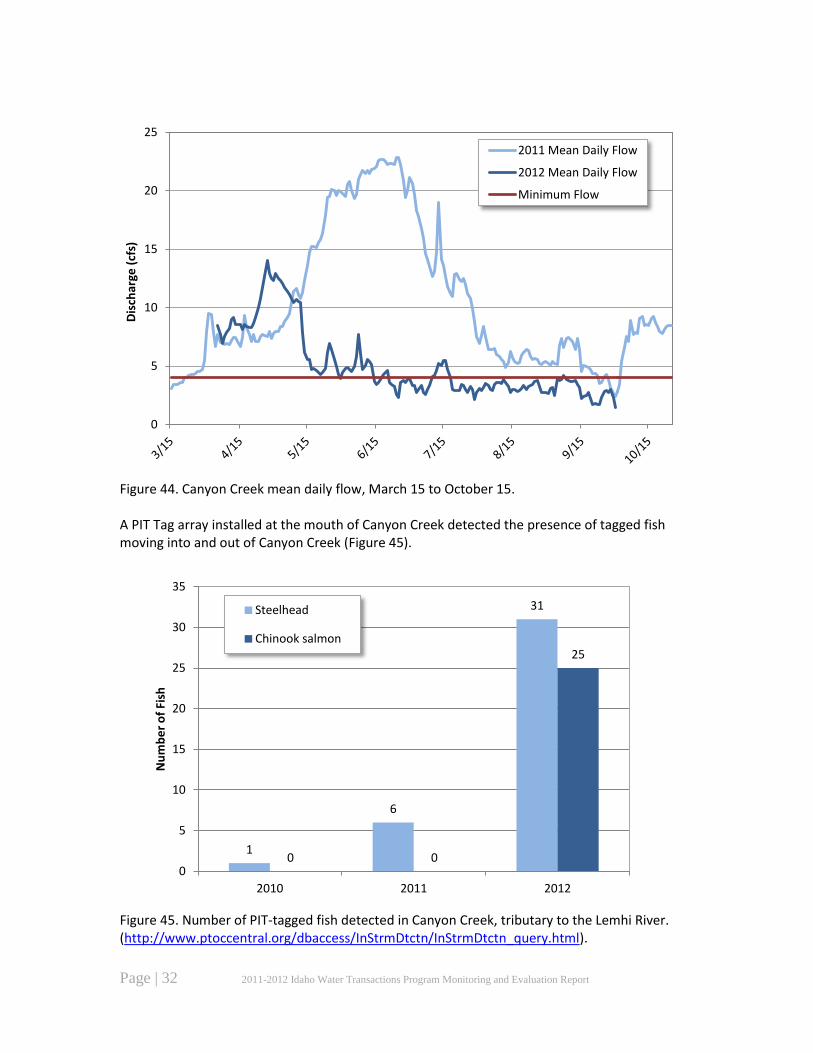
Figure 44. Canyon Creek mean daily flow, March 15 to October 15. A PIT Tag array installed at the mouth of Canyon Creek detected the presence of tagged fish moving into and out of Canyon Creek (Figure 45).
Figure 45. Number of PIT-tagged fish detected in Canyon Creek, tributary to the Lemhi River. (http://www.ptoccentral.org/dbaccess/InStrmDtctn/InStrmDtctn_query.html).
0
5
10
15
20
25 D
isch
arge
(cf
s)
2011 Mean Daily Flow
2012 Mean Daily Flow
Minimum Flow
1
6
31
0 0
25
0
5
10
15
20
25
30
35
2010 2011 2012
Nu
mb
er
of
Fish
Steelhead
Chinook salmon
Page | 33 2011-2012 Idaho Water Transactions Program Monitoring and Evaluation Report
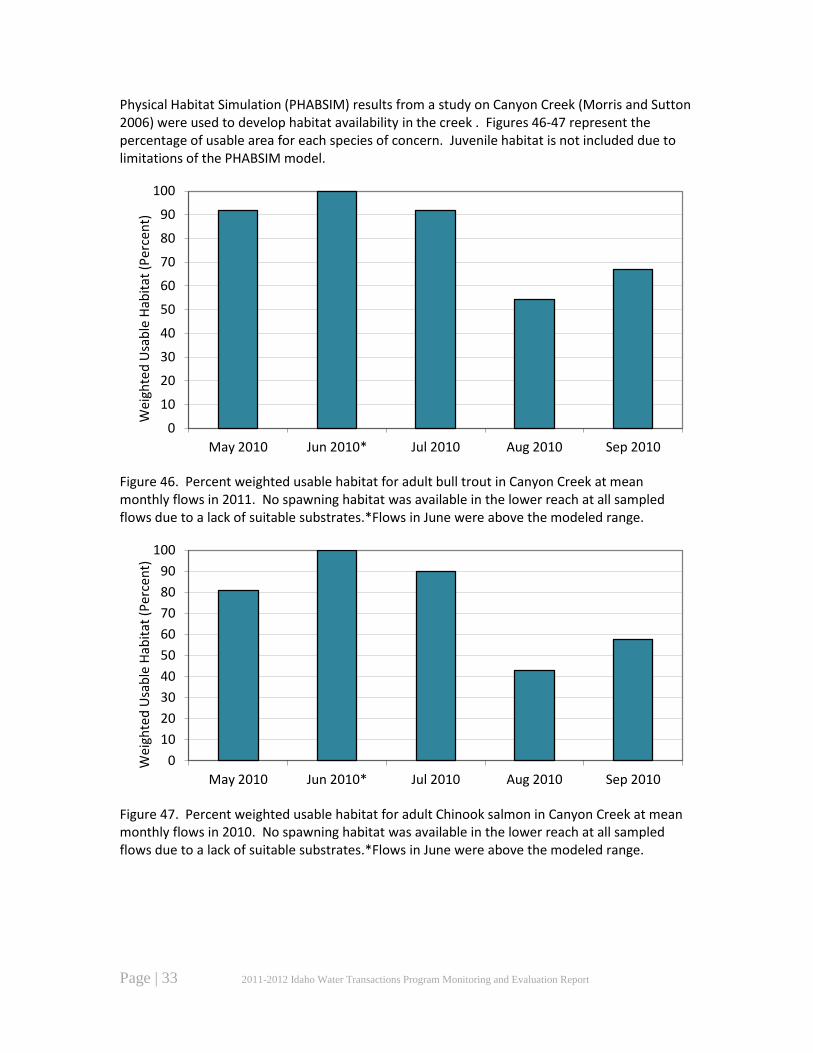
Physical Habitat Simulation (PHABSIM) results from a study on Canyon Creek (Morris and Sutton 2006) were used to develop habitat availability in the creek . Figures 46-47 represent the percentage of usable area for each species of concern. Juvenile habitat is not included due to limitations of the PHABSIM model.
Figure 46. Percent weighted usable habitat for adult bull trout in Canyon Creek at mean monthly flows in 2011. No spawning habitat was available in the lower reach at all sampled flows due to a lack of suitable substrates.*Flows in June were above the modeled range.
Figure 47. Percent weighted usable habitat for adult Chinook salmon in Canyon Creek at mean monthly flows in 2010. No spawning habitat was available in the lower reach at all sampled flows due to a lack of suitable substrates.*Flows in June were above the modeled range.
0
10
20
30
40
50
60
70
80
90
100
May 2010 Jun 2010* Jul 2010 Aug 2010 Sep 2010
We
igh
ted
Usa
ble
Hab
itat
(P
erce
nt)
0
10
20
30
40
50
60
70
80
90
100
May 2010 Jun 2010* Jul 2010 Aug 2010 Sep 2010
Wei
ghte
d U
sab
le H
abit
at (
Per
cen
t)
Page | 34 2011-2012 Idaho Water Transactions Program Monitoring and Evaluation Report
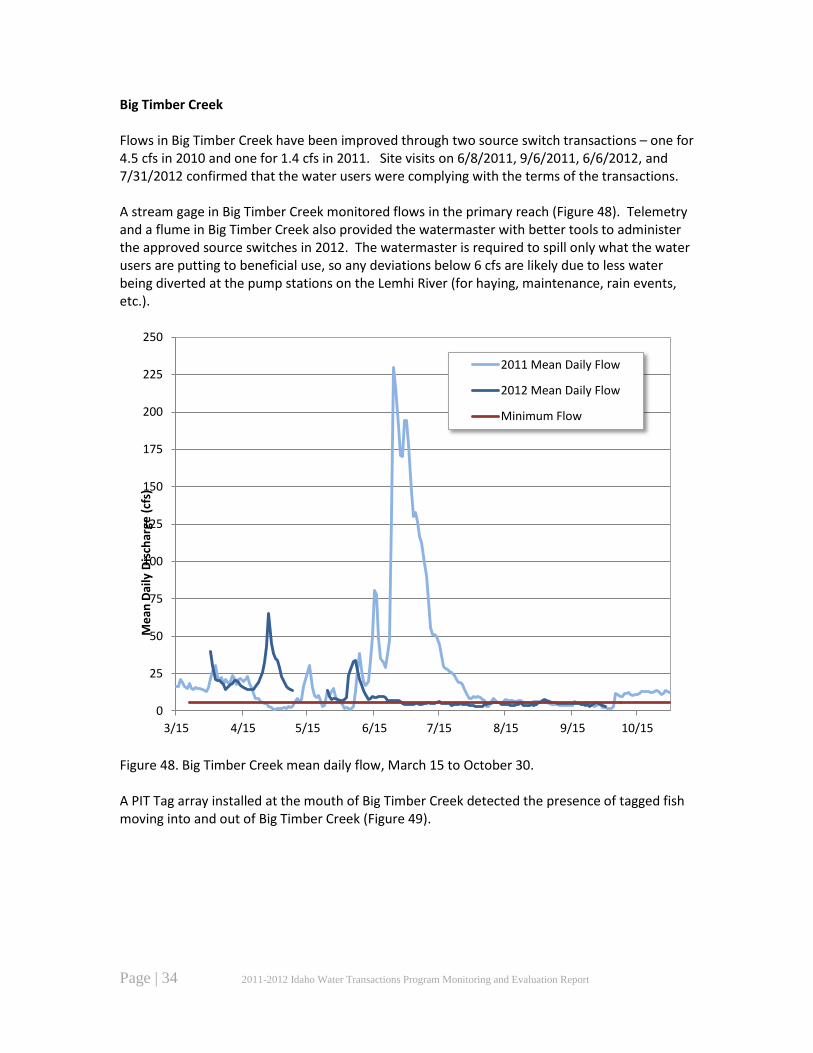
Big Timber Creek Flows in Big Timber Creek have been improved through two source switch transactions – one for 4.5 cfs in 2010 and one for 1.4 cfs in 2011. Site visits on 6/8/2011, 9/6/2011, 6/6/2012, and 7/31/2012 confirmed that the water users were complying with the terms of the transactions. A stream gage in Big Timber Creek monitored flows in the primary reach (Figure 48). Telemetry and a flume in Big Timber Creek also provided the watermaster with better tools to administer the approved source switches in 2012. The watermaster is required to spill only what the water users are putting to beneficial use, so any deviations below 6 cfs are likely due to less water being diverted at the pump stations on the Lemhi River (for haying, maintenance, rain events, etc.).
Figure 48. Big Timber Creek mean daily flow, March 15 to October 30. A PIT Tag array installed at the mouth of Big Timber Creek detected the presence of tagged fish moving into and out of Big Timber Creek (Figure 49).
0
25
50
75
100
125
150
175
200
225
250
3/15 4/15 5/15 6/15 7/15 8/15 9/15 10/15
Me
an D
aily
Dis
char
ge (
cfs)
2011 Mean Daily Flow
2012 Mean Daily Flow
Minimum Flow
Page | 35 2011-2012 Idaho Water Transactions Program Monitoring and Evaluation Report
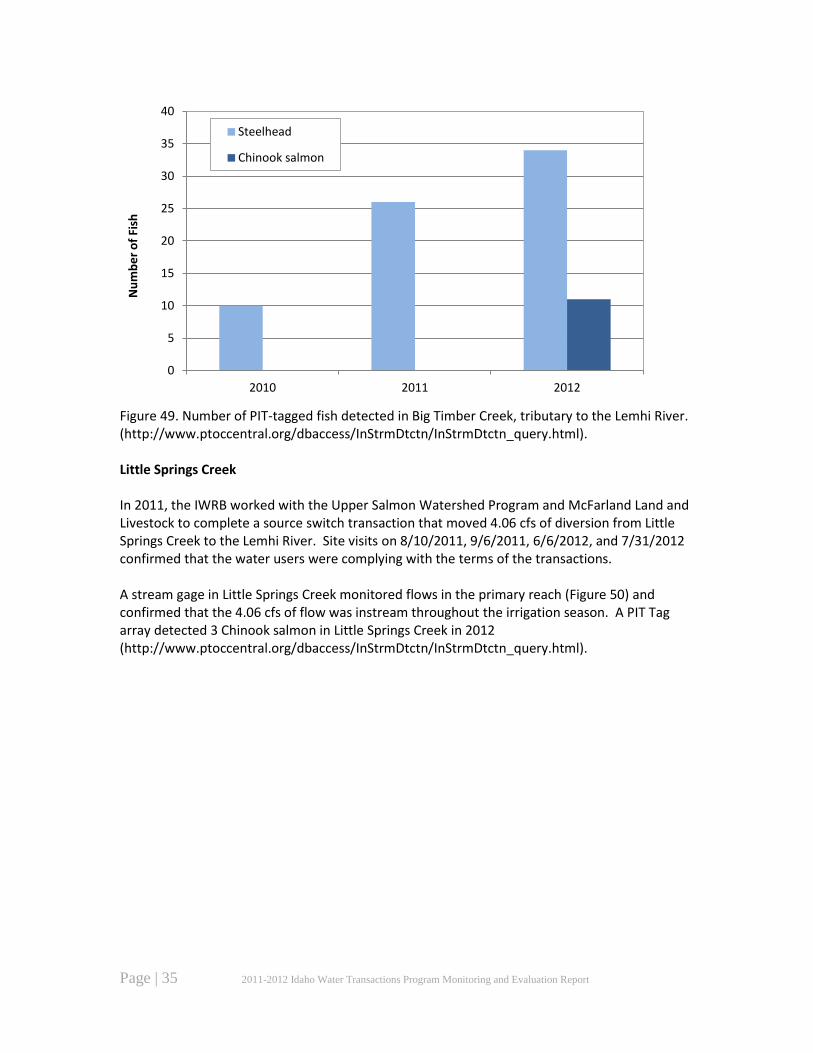
Figure 49. Number of PIT-tagged fish detected in Big Timber Creek, tributary to the Lemhi River. (http://www.ptoccentral.org/dbaccess/InStrmDtctn/InStrmDtctn_query.html). Little Springs Creek In 2011, the IWRB worked with the Upper Salmon Watershed Program and McFarland Land and Livestock to complete a source switch transaction that moved 4.06 cfs of diversion from Little Springs Creek to the Lemhi River. Site visits on 8/10/2011, 9/6/2011, 6/6/2012, and 7/31/2012 confirmed that the water users were complying with the terms of the transactions. A stream gage in Little Springs Creek monitored flows in the primary reach (Figure 50) and confirmed that the 4.06 cfs of flow was instream throughout the irrigation season. A PIT Tag array detected 3 Chinook salmon in Little Springs Creek in 2012 (http://www.ptoccentral.org/dbaccess/InStrmDtctn/InStrmDtctn_query.html).
0
5
10
15
20
25
30
35
40
2010 2011 2012
Nu
mb
er
of
Fish
Steelhead
Chinook salmon
Page | 36 2011-2012 Idaho Water Transactions Program Monitoring and Evaluation Report
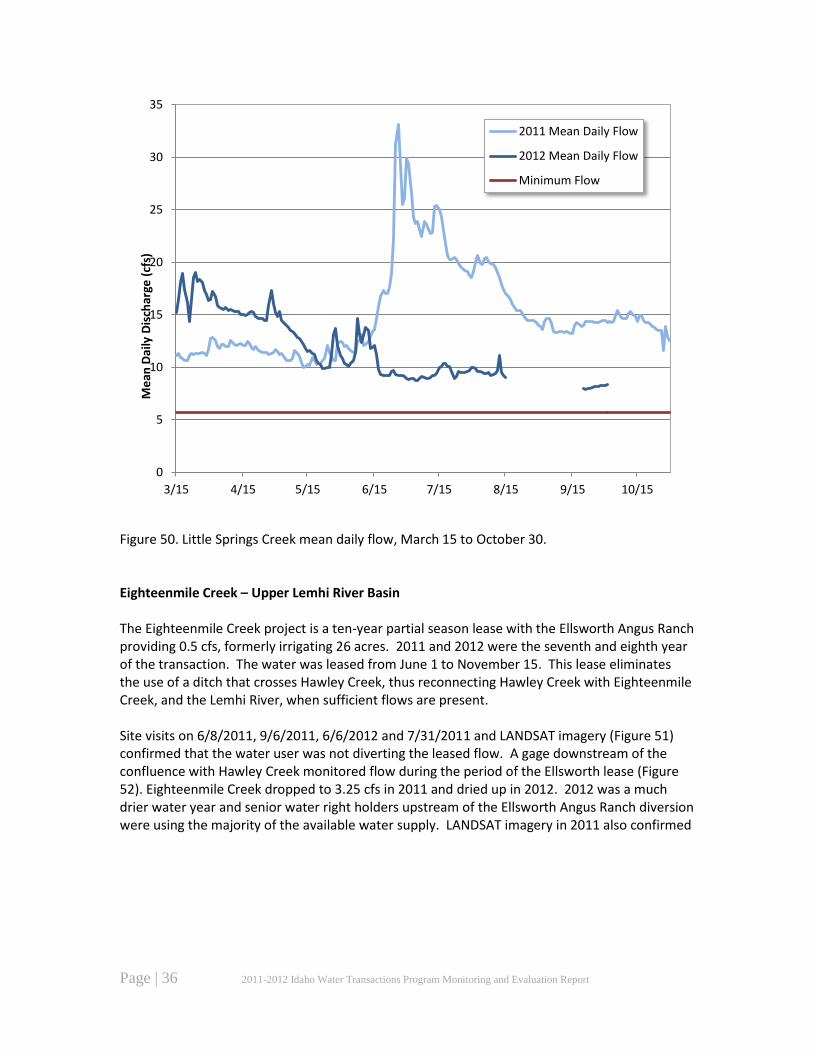
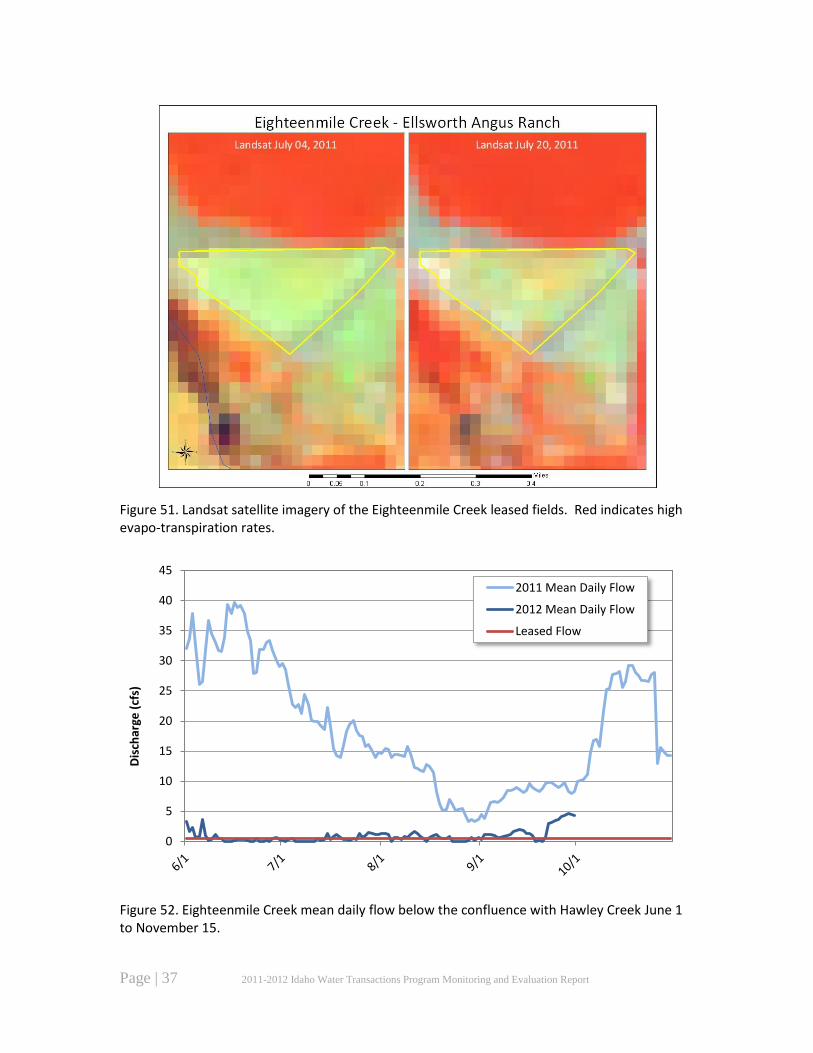
Figure 50. Little Springs Creek mean daily flow, March 15 to October 30. Eighteenmile Creek – Upper Lemhi River Basin The Eighteenmile Creek project is a ten-year partial season lease with the Ellsworth Angus Ranch providing 0.5 cfs, formerly irrigating 26 acres. 2011 and 2012 were the seventh and eighth year of the transaction. The water was leased from June 1 to November 15. This lease eliminates the use of a ditch that crosses Hawley Creek, thus reconnecting Hawley Creek with Eighteenmile Creek, and the Lemhi River, when sufficient flows are present. Site visits on 6/8/2011, 9/6/2011, 6/6/2012 and 7/31/2011 and LANDSAT imagery (Figure 51) confirmed that the water user was not diverting the leased flow. A gage downstream of the confluence with Hawley Creek monitored flow during the period of the Ellsworth lease (Figure 52). Eighteenmile Creek dropped to 3.25 cfs in 2011 and dried up in 2012. 2012 was a much drier water year and senior water right holders upstream of the Ellsworth Angus Ranch diversion were using the majority of the available water supply. LANDSAT imagery in 2011 also confirmed
0
5
10
15
20
25
30
35
3/15 4/15 5/15 6/15 7/15 8/15 9/15 10/15
Me
an D
aily
Dis
char
ge (
cfs)
2011 Mean Daily Flow
2012 Mean Daily Flow
Minimum Flow
Page | 37 2011-2012 Idaho Water Transactions Program Monitoring and Evaluation Report
Figure 51. Landsat satellite imagery of the Eighteenmile Creek leased fields. Red indicates high evapo-transpiration rates.
Figure 52. Eighteenmile Creek mean daily flow below the confluence with Hawley Creek June 1 to November 15.
0
5
10
15
20
25
30
35
40
45
Dis
char
ge (
cfs)
2011 Mean Daily Flow
2012 Mean Daily Flow
Leased Flow
Page | 38 2011-2012 Idaho Water Transactions Program Monitoring and Evaluation Report
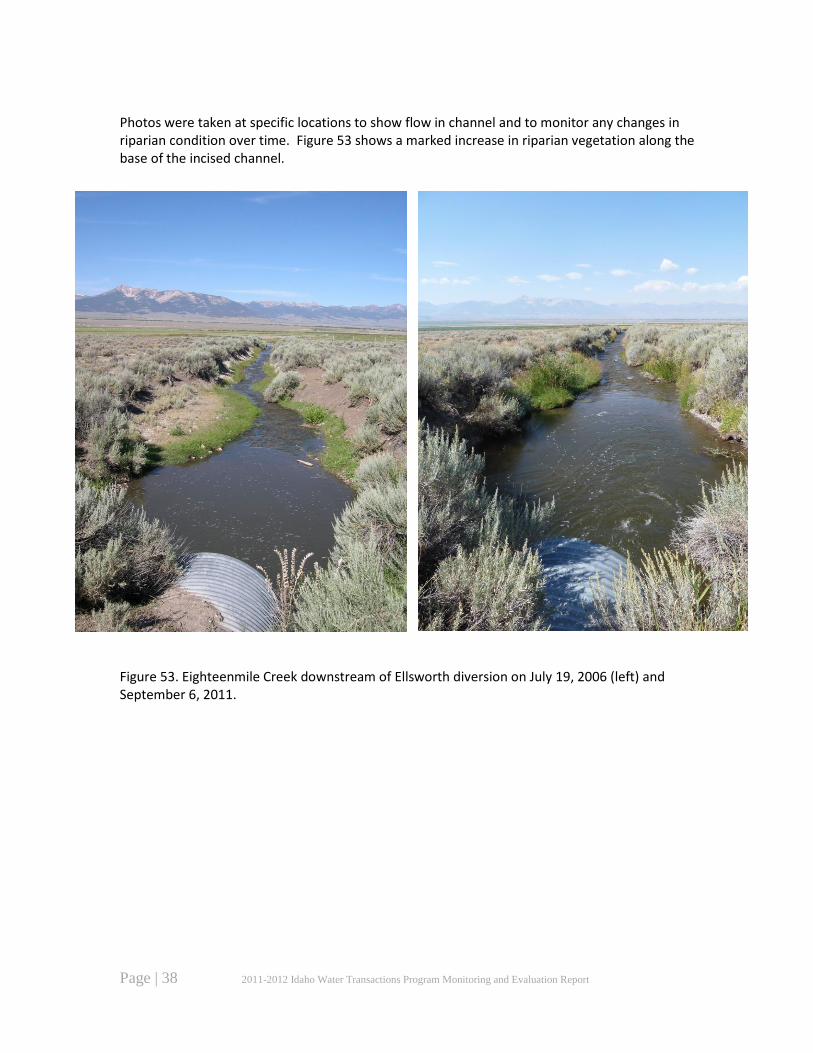
Photos were taken at specific locations to show flow in channel and to monitor any changes in riparian condition over time. Figure 53 shows a marked increase in riparian vegetation along the base of the incised channel.
Figure 53. Eighteenmile Creek downstream of Ellsworth diversion on July 19, 2006 (left) and September 6, 2011.
Page | 39 2011-2012 Idaho Water Transactions Program Monitoring and Evaluation Report
References Biggs, M. 2013. Fisheries Biologist. Idaho Fish and Game Screen Shop. Personal communication. Garica, D. 2013. Fisheries Biologist. Unites States Forest Service, Salmon-Challis National Forest,
Idaho. Personal communication. Maret, T.R., Hortness, J.E., and Ott, D.S. 2005. Instream flow characterization of Upper Salmon
River Basin streams, central Idaho, 2004. USGS. Scientific Investigation Report 2005-5212.
Maret, T.R., Hortness, J.E., and Ott, D.S. 2003. Instream flow characterization of Upper Salmon
River Basin streams, central Idaho, 2003. USGS. Scientific Investigation Report 2004-5173.
Morris, C. and R. Sutton. 2007. Instream Flow Assessment Upper Lemhi River and Canyon
Creek, Idaho. U.S. Department of the Interior, Bureau of Reclamation Snake River Area Office. Boise, Idaho.
Murphy, P. 2013. Fishery Staff Biologist. Idaho Department of Fish and Game. Personal
communication.