water supply public or private - sciences po -...
TRANSCRIPT

Working PaperFebruary 2009
Water Supply: Public or Private? An approach based on cost of funds, transaction costs, efficiency and political costs.
Edouard Pérard ∗
Abstract
Most theories on private sector participation in water infrastructure are based on the sole supposed difference of efficiency between the public and the private sector. The review of 23 empirical tests and 51 case studies shows that private sector participation per se in water supply does not systematically have a significant positive effect on efficiency. Thus, the choice between public and private water delivery is probably not only a question of efficiency. We developed a complete theory of the choice between public and private water supply based on four components: difference of cost of funds, transaction costs of outsourcing, difference of efficiency and potential political cost of privatizing. Since determinants of the theory fluctuate over the time and depend on the local context, it explains both “privatization” and municipalization movements as well as why some local governments outsource water supply, while others opt for direct provision. The tests on 459 US Counties in charge of water supply in 45 States provide substantial support for the theory. Significant determinants of the choice of public versus private water delivery include the cost of funds, especially the social cost of taxes, transaction costs, the difference of efficiency and the political cost of privatizing. Moreover, we tested other literature’s theories, which suggest employment as a motive of public provision and cost of public wages as a cause of privatization. These two arguments seem to be irrelevant. We additionally tested the influence of ownership on the number of drinking water environmental violations and found no significance.
∗ Email: [email protected] This paper was an invited presentation at the conference “The Role of the State in Public Service Delivery”, Lee Kuan Yew School of Public Policy, National University of Singapore, Singapore, September 2007. The peer reviewed version of this article was published as Pérard, E. (2009). “Water supply: Public or private? An approach based on cost of funds, transaction costs, efficiency and political costs” Policy and Society. 27: 193-219, http://dx.doi.org/10.1016/j.polsoc.2008.10.004The author would like to thank particularly Jean-Jacques Rosa, Bradford Gentry and Sheila Olmstead for their very helpful comments. The author is also very grateful to the Yale School of Forestry and Environmental Studies for having hosted him to conduct this research in 2005-2006. All errors and omissions remain of course the sole responsibility of the author.
1

I. Introduction
The economic literature dedicated to water infrastructure “privatization” is relatively poor in regard
to what has already been written on electricity, transportation and telecommunication.
However, interest in water issue is growing. Not only because of the development aspect, but also
because of the financial challenge it represents both in OECD and developing countries. Indeed, the water
utilities industry generated total revenues of approximately 450 billion US Dollars in 20051. In addition, it has
been estimated that global water infrastructure spending over the next 20 years will represent more than 22
Trillion US Dollars2.
When studying the private sector participation in water supply, one needs first to understand the
heterogeneity of international situation and the dynamic characteristic of the choice between public and
private water supply.
Heterogeneity of international situation of privatization and delegation of water supply
Overall in OECD countries, the number of people relying on the private sector for water services
ranges between 200 and 300 million3. It represents about 17% to 25% of OECD members’ population.
However, experience with delegation of water supply varies very much from one country to
another, even among OECD countries (Table 1 and Figure 1). In term of population, private water supply
is major (over 50% of population served) in only five countries of the world, three of which belongs to the
OECD: Chile, the Czech Republic, France, Malaysia and England. On the other hand, private sector
participation is low or inexistent (less than 10% of population served by the private sector) in 17 out of the
30 OECD countries.
Table 1: Level of private sector participation in water supply in OECD countries (Percentage of population served by the private sector)
Low or inexistent (Less than 10%)
Austria, Belgium, Canada, Denmark, Finland, Iceland, Ireland, Japan, Luxembourg, Netherlands, New-Zealand, Norway, Poland, South Korea,
Sweden, Switzerland and Turkey. Moderate
(Between 10% and 30%) Australia, Germany, Hungary, Mexico, Portugal, Slovakia, United States
High (Between 30% and 50%) Greece, Italy, Spain
Major (Between 50% and 70%) Czech Republic
Predominant (Over 70%) France, England
Source: Perard (2007a) based on the review of institutional communication of major private operators, national and local governments, as well as literature review.
1 Datamonitor (2006)
2 Viren, Schulman and Gabaldon (2007)
3 Author’s estimate, based on the review of institutional communication of major private operators, national and local governments.
2

Figure 1: Private sector participation in water supply in OECD countries
Source: Perard (2007a) based on the review of institutional communication of major private operators, national and local governments, as well as literature review.
Thus, the scope of privatization/delegation of water supply is particularly heterogeneous among
OECD countries, from quite inexistent in Japan to full divestiture in the United Kingdom. This situation is
very different to what happens in other infrastructure as the energy and telecommunication sectors, which
are predominantly private all over OECD countries.
Any theory on private sector participation in water supply needs to address the issue of contrasted
international situation. Considering the relative economic homogeneity of OECD countries, one question
which has to be answered is why water supply is private in some places and public in others.
The dynamic of “privatization” and nationalization of water supply
The choice between public and private drinking water is not fixed; it does not consist in a one-time
decision of public versus private, but rather “privatization” and “deprivatization” movements over long
period of time. History of water supply in OECD countries illustrates the dynamic feature of the choice of
ownership and management of water supply.
As it is well documented in several studies (Gentry, 2000; Jacobson and Tarr, 1994; Koeppel,
2000; Masten 2004), delegation of water services is not a new phenomenon; it exists for more than 200
years in OECD countries.
3

In France for example, the operation of water systems has been private since its creation, when
the water supply of Paris was outsourced in 1782 to a private company owned by the brothers Perrier.
History of the largest private water companies dates back to this time. Indeed, the world leading water
corporation, Veolia Water, formerly know as Generale des Eaux, won its first municipal contract in 1853
under the reign of Napoleon III (Gentry, 2000).
Mexico has also a long tradition of water concessions. The first concession contracts for water
supply of Pueble, Saltillo and Monterrey were awarded in 1855, 1899 and 1904 respectively. In the 1920s,
there were about 20 water concessions in operation. Then, these were taken over by the state during the
1940s. Fifty years later, the Mexican government expressed again his interest for private water delivery
with the 1992 National Water Law.
In England, private water companies have been serving London for more than 200 years, until
they were nationalized in 1903 and regrouped under a single public body, the Metropolitan Water Board.
After 86 years of public water supply, England “switched” back to private water delivery and privatized
government-owned water companies in 1989.
In the United States, water systems were initially privately owned and operated. At the beginning
of the XIXth century, all but one waterwork (Winchester, VA) were private. Private companies were
supplying Boston, Bethlehem, Providence, Geneva, Plymouth, Salem, Hartford, Portsmouth, Worcester,
Albany, Peabody, New York, Lynchburg and Newark.
Until the middle of the XIXth century, many cities have been delegating water supply to private
companies. By the end of the XIXth century, the water outsourcing trend reversed and most cities
“switched” for municipal ownership (Baker, 1899) (Table 2). As a result, in 1896, only nine of the largest
fifty cities in the United States still relied upon privately owned waterworks (Jacobson and Tarr, 1994).
4

Table 2: Waterworks municipalization in the United States during the XIXth century
City State Year built as private system
Year changed to public ownership
Boston Mass. 1795 1848 Bethlehem Pa. 1761 1871 Providence R.I. 1772 1871
Geneva N.Y. 1787 1896 Plymouth Mass. 1796 1855
Salem Mass. 1796 1873 Hartford Conn. 1797 1854
Portsmouth N.H. 1798 1891 Worcester Mass. 1798 1852
Albany N.Y. 1799 1851 Peabody Mass. 1799 1873 New York N.Y. 1799 1843 Lynchburg Va. 1799 1828
Newark N.J. 1800 1860 Source: Adapted from M. N. Baker, “Water-Works,” in Edward W. Bemis, editor,
Municipal Monopolies (Thomas Y. Crowell, 1899)
However, privately owned water providers have remained important in small communities. Their
proportion has even increased during the second half of the XXth century (Chart1). Nowadays, about half
of waterworks are privately owned. The estimation of the percentage of population served by the private
sector varies between 10% and 20%.
Chart 1: Percentage of private waterworks in the United States since 1800
84%80%
61%58%
51%
57%
30%
44%
58%
51%
94%
65%
53%
46%
49%
82%
47%
0%
10%
20%
30%
40%
50%
60%
70%
80%
90%
100%
1800
1805
1810
1815
1820
1825
1830
1835
1840
1845
1850
1855
1860
1865
1870
1875
1880
1885
1890
1895
1900
1905
1910
1915
1920
1925
1930
1935
1940
1945
1950
1955
1960
1965
1970
1975
1980
1985
1990
1995
2000
2005
Source: Perard (2007a), based on data from Jacobson and Tarr (1994), Melosi (2000) and data provided by the EPA.
5

Thus, many water systems have been private during the last 200 years. Private sector
participation in water supply is not a new phenomenon.
Moreover, history of water supply in OECD countries shows that the choice of public versus
private water delivery is not defined once for all. It rather consists in movements of privatization and
deprivatization over long period of time. Thus, economic analysis must address the dynamic characteristic
of the choice. This aspect is usually neglected in other economic studies.
II. Theoretical issues The issue of public versus private has been widely discussed during the last twenty years, but
theories about ownership in the particular case of monopoly markets remain ambiguous and cannot
completely explain the choice of privatizing/delegating water supply.
In the existent literature, the two most prevalent explanations of the choice between public and
private ownership are corruption and efficiency.
We can first consider the argument of corruption and see why it does not really solve the question
of ownership.
One of the advantages of public ownership would be that it could reduce corruption. Glaeser
(2001) identifies three risks in particular: the under pricing of public inputs to the private sector, the over
pricing of private outputs to the public and the subvention of the private by the public. These risks exist,
but public ownership does not solve the problem, it moves it forward: a public supplier can also overpay
private inputs. Public suppliers can be corrupted by private companies. Thus, the argument of corruption
does not seem powerful enough to explain the choice between public and private ownership.
The argument of efficiency takes a much lager place in the literature. Most of theories are
considering it as the determinant of privatizations. However, theories do not agree on the effect of private
ownership per se.
State Owned Enterprises are usually considered as less efficient than private firms are. Some
argue that private ownership per se can improve the performance of firms (Boycko, Shleifer and Vishny,
1996,; Brada, 1996; Nellis 1994; Schleifer 1998; Vining and Boardman, 1992), others argue that the
efficiency depends on the combination of three factors: the ownership, the competition and the regulation.
Competition and regulation would be more important than privatization in improving performances of firms
(Bishop and Kay, 1989; Kay and Thompson, 1986; Vickers and Yarrow, 1991; Yarrow, 1986). Thus, in a
fully competitive market, private ownership would be more efficient than the public one; but the answer
would be less clear for less competitive markets like water supply and sanitation.
6

As a natural monopoly, it is difficult to turn the water supply industry into a fully competitive
market. Nature of costs does not permit the duplication of the network and the fragmentation of the market
would limit the economies of scale. Direct competition is not desirable and/or possible.
Demsetz (1968) proposes a solution to introduce competition in monopoly markets: the
competition for the market. However, Williamson (1976) and Goldberg (1976) find several problems with
this approach: the bidding may not be competitive because of collusion, asymmetric information,
incumbent advantages and problems in the pricing of the assets.
These arguments apply well to the water sector where the number of bidders is usually small.
Moreover, bids for water supply are incomplete contracts (Williamson, 1976). Competition for the market in
water supply and sanitation cannot fully substitute direct competition.
Thus, without a full competitive market, the theory remains unclear about efficiency gains of
private ownership and management of water infrastructure.
Empirical works confirm the theory’s ambiguity about the effect of ownership in monopolistic
markets. In a review of 52 empirical studies on the impact of ownership on the performance of firms
(Shirley and Walsh, 2000), 32 conclude the superiority of private ownership. However, the results are
much less conclusive for monopolistic infrastructures. On the 16 studies concerning monopolistic markets:
6 find private superiority, 5 find neutral results, and 5 find public superiority.
In a study on 21 African water utilities from 1995-1997, Estache and Kouassi (2002) found that
private operators are more cost-efficient.
However, in another empirical test on 110 African water utilities from 1998-2001, Kirkpatrick,
Parker, and Zhang (2004) found no significant difference between public and private operators in terms of
cost once environmental factors have been accounted for.
Using a sample of 50 firms in 19 Asian countries in 1997, Estache and Rossi (2002) also found no
statistically significant difference between public and private water operators.
Much less empirical work has been done lately on OECD countries. A study published in 2005 by
the AEI-Brookings Joint Center on the effects of ownership and benchmark competition on regulatory
compliance and household water expenditures in the United States concluded: “Overall, the results
suggest that absent competition, whether water systems are owned by private firms or governments may,
on average, simply not matter much.” (Wallsten and Kosec, March 2005).
The next table (Table 3) presents an extensive review of most of econometric tests and case
studies on public versus private water delivery. The result of this survey is summarized below (Chart2).
7

Chart 2: A review of 51 case studies and 23 econometric tests on public versus private water delivery
27
5
1513
3
11
0
5
10
15
20
25
30
Case Studies Econometric TestsFind private superiority or positive influence of private sector participationFind no difference between public and private provisionFind public superiority or negative influence of private sector participation
Source: Perard (2007a, 2007b, 2008)
Table 3: Review of econometric tests and case studies on privatization and delegation of water services
Region or Country Method Results References
Africa Stochastic Production Frontier
Private operators are more cost efficient Estache and Kouassi (2002)
Africa Stochastic Production
Frontier / Data Envelopment Analysis
No differences in costs Kirkpartick, Parker and Zhang (2004)
Argentina (Buenos Aires) Multiple Case Studies
Positive effect of the introduction of private sector participation on the
sector performance
Abdala (1997); Alcazar et al. (2002); Artana et al. (1999); Crampes and
Estache (1996); Rivera (1996)
Argentina (Cordoba) Case Study Positive effect of the introduction of private sector participation on the
sector performance Nickson (2001a)
Argentina (Corrientes) Case Study
Positive effect of the introduction of private sector participation on the
sector performance
Artana, Navajas and Urbiztondo (1999)
Argentina (Salta) Case Study Positive effect of the introduction of private sector participation on the
sector performance Salatiel (2003)
Argentina (Tucumán) Multiple Case Studies
Negative effect of the introduction of private sector participation on the
sector performance
Rais, Esquivel and Sour (2002); Artana, Navajas and Urbiztondo
(1998)
Asia Stochastic Cost Frontier No differences between public and private Estache and Rossi (2002)
8

Bolivia (Cochabamba) Multiple Case Studies
Negative effect of the introduction of private sector participation on the
sector performance
Nickson and Vargas (2002); Hall (2002)
Bolivia (La Paz – El Alto) Multiple Case Studies
Mixed results of the introduction of private sector participation on the
sector performance
Hall and Lobina (2002); Komives (1999, 2001); Komives and Brook-
Cowen (1998)
Brazil Data Envelopment Analysis
No differences between public and private Seroa da Motta and Moreira (2004)
Chile (Santiago) Multiple Case Studies Positive effect of the introduction of private sector participation on the
sector performance
Rivera (1996); Shirley, Xu and Zuluaga (2002)
Colombia (Barranquilla) Case Study
Positive effect of the introduction of private sector participation on the
sector performance Avendaño and Basañes (1999)
Colombia (Cartagena) Multiple Case Studies
Positive effect of the introduction of private sector participation on the
sector performance
Rivera (1996); Nickson (2001b); Beato and Díaz (2003); Avendaño
and Basañes (1999)
Colombia (Marinilla) Multiple Case Studies Positive effect of the introduction of private sector participation on the
sector performance
Arévalo and Schippner (2002); Avendaño and Basañes (1999)
Colombia (Montería) Case Study Positive effect of the introduction of private sector participation on the
sector performance Avendaño and Basañes (1999)
Côte d'Ivoire Multiple Case Studies Positive effect of the introduction of private sector participation on the
sector performance
Collignon (2002); Kerf (2000); Menard and Clarke (2002a);
Trémolet, Browning and Howard (2002)
France Regression Model No difference in compliance with water quality regulation Menard and Saussier (2000)
Gabon Multiple Case Studies Positive effect of the introduction of private sector participation on the
sector performance
Trémolet (2002); Trémolet and Neale (2002)
Gambia Case Study Negative effect of the introduction of
private sector participation on the sector performance
Kerf (2000)
Guinea Multiple Case Studies Mixed results of the introduction of private sector participation on the
sector performance
Brook-Cowen (1999); Brook and Lucussol (2001); Clarke, Ménard and Zugula (2002); Kerf (2000);
Ménard and Clarke (2002b); Rivera (1996)
Honduras (San Pedro Sula) Case Study
Positive effect of the introduction of private sector participation on the
sector performance Díaz (2003)
India (Prune) Case Study Negative effect of the introduction of
private sector participation on the sector performance
Zérah (2000)
Latin America (Argentina, Bolivia,
Brazil) Regression Model Private sector participation per se
does not improve coverage Clarke, Kosec and Wallsten (2004)
Low and middle income countries Regression Model
Positive effect of the introduction of private sector participation on the
sector performance Gassner, Popov and Pushak (2008)
México (Cancún and Isla Mujeres) Case Study
Mixed results of the introduction of private sector participation on the
sector performance Rivera (1996)
México (Mexico City) Case Study
Mixed results of the introduction of private sector participation on the
sector performance
Haggarty, Brook and Zuluaga (2002)
Philippines Multiple Case Studies Mixed results of the introduction of private sector participation on the
sector performance
Dumol (2000); Santos (2003); Porter (2001)
9

Poland (Gdansk Case Study Positive effect of the introduction of private sector participation on the
sector performance Rivera (1996)
Senegal Multiple Case Studies Positive effect of the introduction of private sector participation on the
sector performance
Kerf (2000); Trémolet, Browning and Howard (2002)
South Africa (Queenstown) Case Study
Mixed results of the introduction of private sector participation on the
sector performance Palmer Development Group (2000)
Trinidad and Tobago Multiple Case Studies
Negative effect of the introduction of private sector participation on the
sector performance Nankani (1997); Stiggers (1999)
United Kingdom Financial Analysis No differences after privatisation Shaoul (1997)
United Kingdom Cost Function Regulation lowered costs but privatisation did not Saal and Parker (2000)
United Kingdom Productivity analysis No difference in efficiency after privatisation Saal and Parker (2001)
United States Cost Function Private has lower costs Morgan (1977)
United States Cost Function Private has lower costs Crain and Zardkoohi (1978)
United States Cost Function Public has lower costs Bruggink (1982)
United States Cost Function No differences in costs Feigenbaum and Teeples (1983)
United States Data Envelopment Analysis No differences in efficiency Byrnes et al. (1986)
United States Econometric cross-sectional analysis
Lower prices charged by municipality, but no conclusion on costs
Hausman, Kemme and Neufeld (1986)
United States Cost Function No differences in costs Teeples and Gyler (1987)
United States Stochastic Cost Frontier No differences in costs Byrnes (1991)
United States Data Envelopment Analysis Public operators are more efficient Lambert et al. (1993)
United States Stochastic Cost Frontier Public operators are more cost efficient Lynk (1993)
United States Cost Function No differences in efficiency Bhattacharyya et al. (1994)
United States Data Envelopment Analysis Private operators are more efficient Bhattacharyya et al. (1995)
United States Regression Model No difference in compliance with water regulation. Wallsten and Kosec (2005)
Source: Perard (2007a, 2008). Based on Dupont and Renzetti (2003); Clarke, Kosec and Wallsten (2004); Estache, Perelman and Trujillo (2005) and literature review.
Results of empirical studies on the difference of efficiency between public and private water supply
are contradictory.
Besides the measurement problem of efficiency in the water sector, divergent results obtained are
due to the fact that the alleged superior private management efficiency relies on “the implicit assumption
10

that all firms are cost minimizing, but if state-owned enterprises have other objectives, it is difficult to
interpret the meaning of differences in costs” (Megginson and Netter, 2001). Thus, studies focusing only
on a difference of efficiency between public and private water infrastructure seem less relevant.
Even if a difference of efficiency between some international private water operators and some
municipalities is likely, it does not explain the persistence of the public model, international differences and
several changes between the public and the private model.
Rosa (1993) and Rosa and Perard (2007) propose another explanation of privatization and
nationalization movements in the economy in general. They “consider that the government’s motive is the
same than the private investor’s motive: to control the firm’s profit or cash flow in order to further one’s
own interests. In the case of government, the one and major interest is political power and survival. In
order to succeed any government has to transfer some wealth to supporters, on top of consuming
resources by itself. Instead of distributing profits to shareholders or retaining resources for the manager,
the state as owner uses the firms’ resources to grant rents and advantages to selected and useful (to him)
clienteles thus aiming at maximizing his chances of staying in power. Thus both types of investors,
whether private or government, value firms for the cash flow they produce even though the beneficiaries of
the cash flow they have in mind are different.”
Since both private sector and governments are interested in firms, the one who value the firm the
most proposes the highest bid. It results in privatization if private valuation is the highest one and
nationalization if public valuation outbid the private’s one. The difference of economic valuation determines
the allocation of property rights.
Rosa (1993) and Rosa and Perard (2007) explain the difference between public and private
valuation, and therefore privatization and nationalization movements, by a difference of costs of funds.
The costs of funds differ because the sources of funds are different and the financial structure of private
sector and governments is different. The cost of capital, for the State, is the weighted average of the social
cost of taxes and the cost of borrowed funds in the same way as the cost of capital of the firm in finance
theory is the weighted average of the costs of equity and debt capital.
This analysis can be extended to local governments, which have the choice between direct
provision and outsourcing water supply. Local governments’ aim is to maximize their political (electoral)
support through wealth distribution. Considering the activity of water supply, wealth distribution can take
different forms: lower water tariffs, better water services and quality, lower taxes, lower municipal deficit,
public (over)employment, direct distribution, and subsidies.
Local governments can achieve as well wealth distribution by providing the service directly or by
outsourcing to the private sector.
11

Indeed, since water tariffs and level of service are usually set in delegation contracts or by the
regulator, subsidies are always possible even when water supply is outsourced4. Similarly, if the aim of a
municipality/county is (over)employment, a municipality can force a private operator to over employ; this is
the case, when concession contracts state that employment conditions (and number of employees) must
remain the same.
In addition, public (over)employment does not necessarily have to be achieved through water
supply. Money, a municipality can save with private water supply does not automatically have to be
distributed thru water tariffs; it can be allocated in public employment at the mayor office or in another
public activity (police for example).
Thus, considering local governments’ objective of wealth distribution maximization and the fact
that wealth distribution can be achieved as well with private or public water supply, economic rationality of
local governments implies that they will choose water projects (direct provision or outsourcing) with the
highest economic value.
Let us first consider the case of a switch from public to private. Water supply is directly provided
and the municipality/county wonders about outsourcing to the private sector. The local government will
“privatize” water supply:
• If the private sector proposes to pay a higher concession fee (or bid in case of full divestiture) than
the present value of expected cash flows the public sector could get from running the activity (with
the same level of tariff and services).
• If the private sector proposes to pay a concession fee equivalent to the present value of expected
cash flows the public sector could get from running the activity, but by proposing a better
tariff/services ratio than the public sector could offer (which is equivalent to proposing a higher
concession fee than the public present value of expected cash flows)
Let us now consider the case of a switch from private to public. Water supply is outsourced and
the municipality/county investigates the choice of municipalization (or not renewing a concession contract).
The local government will “municipalize” water supply:
• If it considers that the present value of cash flows it could get by providing directly water supply is
higher than the concession fee the private sector is willing to pay (with the same level of tariff and
services).
• If it considers that the present value of cash flows it could get by providing directly water supply is
equivalent to the concession fee the private sector is willing to pay, but assumes it could propose
a better tariff/services ratio to users (who are also voters) than the private sector (which is
equivalent to considering that the public present value of cash flows is higher than the concession
fee proposed by the private sector for the same level of tariff and services)
4 Free drinking water could even be possible with a private operator as soon as the local government pays for operational costs.
12

Given expected common flow of revenues, for the same level of tariffs and services, the value of
water projects will differ for private investors and local governments in so far as the cost of funds differs for
the two kinds of agents. Private firms rely on shares and bonds, while the local governments rely on taxes
and bonds.
Contrary to theories of privatization solely based on the efficiency, the theory developed by Rosa
(1993) and Rosa and Perard (2007) and based on a difference of cost of funds is the only one which
explains both privatization and nationalization movements.
However, three remarks can be made:
• First, even if a difference of efficiency does not explain movements of privatization and
nationalization by itself, it seems very much likely that it contributes, in some cases, to the choice
between public and private.
Moreover, since the difference of efficiency between public and private is not identical in all
situations and for all sectors, it explains partially why some governments outsource while
others provide directly services (i.e. for example, all other things being equal, a country with
no experience in the oil business is more likely to outsource this activity than another one who
holds experience in this field)
• Then, their model fails to explain why some industries, as water infrastructure in our case, remain
mostly public, while other sectors are predominantly private.
• Finally, if governments’ aim is to maximize their electoral support, it seems certain that they take
into account electoral consequences of privatization, and therefore the potential political cost of
privatizing.
Thus, using the framework developed by Rosa (1993) and Rosa and Perard (2007) and their
argument of a difference of cost of funds, three additional determinants can explain the choice between
public and private.
A difference of efficiency
The first determinant is a difference of efficiency. While theories of privatization simply based on a
difference of efficiency don’t seem accurate, it is difficult to deny that private water operators can be more
efficient, in some cases, than local governments because of a difference of technical and management
knowledge. The difference of efficiency is not identical for all local governments and depends on their
experience. This difference contributes to the choice between public and private.
13
Transaction costs of delegating water supply
The second factor, which drives the choice of delegating water supply or providing directly the
service, is the transaction costs of outsourcing.
The first part of these costs occurs once at the decision of contracting out. Because of asymmetry
of information, the cost of bid evaluation and due diligence process is extremely important for
infrastructure projects and more particularly for water supply. In a review of 33 infrastructure projects of
the World Bank, Klein (1996) found that transaction costs were representing on average around 3 to 5% of
total project costs, but they could reach up to 12% for some projects.
The second part of the transaction costs takes place during all the time the private sector is
involved in infrastructure projects (Sclar, 2000). When water supply is outsourced, local governments face
problems of asymmetry of information and incomplete contract (Williamson, 1976), which lead to important
agency costs. In order to mitigate these costs, local governments have to monitor private water operators
and to constantly renegotiate. Indeed, Guasch (2004) studied more than 1,000 concessions in
infrastructure in Latin America and the Caribbean granted during 1985–2000 and found that 74.4% of
water and sanitation concession contracts were renegotiated. Most renegotiation underwent very soon
after their award, occurring on average 1.6 years after concession awards. Monitoring and renegotiation
costs are recurring and are ultimately paid by the user.
It is most likely that the importance of recurring transaction costs of outsourcing water supply is
the reason of predominance of public provision.
Potential political cost of “privatizing” water supply
Contrary to other theories based on ideology, we do not believe that privatization depends on the
ideology of governments, but it relies more on the opinion of voters. This is an important distinction; in
order to remain in post, elected officials take into account potential political (electoral) consequences of
privatization based on the opinion of voters (which can differ on some issues from government’s ideology).
Thus, the third determinant of choice between public and private water supply is the potential
political cost of “privatizing” drinking water. Even when it follows economic rationality, privatization is often
negatively perceived by the population. This is particularly true for water supply, which tends to be a highly
political issue. Many decisions of outsourcing water supply have led to strong opposition from the
population (Table 4). Since local governments’ final aim is to maximize their electoral support, they take
into account the potential political cost of water privatization. This cost depends on the ideology and
characteristics of users who are also voters.
14

Table 4: Population opposition and rejection of private water provision Year Country Region or city 1994 Poland Ło´dz´ 1995 Honduras Honduras 1995 Hungary Debrecen 1995 Sweden Malmo 1996 USA Washington, DC 1998 Argentina Tucuman 1998 Germany Munich 1999 Brazil Rio de Janeiro 1999 Canada Montreal 1999 Panama Nationwide 1999 Trinidad Nationwide 2000 Bolivia Cochabamba 2000 Germany Potsdam 2000 Mauritius Nationwide 2000 USA Birmingham 2002 Brazil Nationwide 2002 Paraguay Nationwide 2002 Poland Poznan 2002 South Africa Nkonkobe 2002 Thailand Nationwide 2003 USA Atlanta
Source: Public Services International
III. The model A difference of cost of funds
In order to simplify, we first consider, as a hypothesis, that public and private firms are able to
generate the same theoretical revenue for the same level of tariff and services (a difference of technical
and management capacities between the public and the private sector will be introduced later).
The model developed by Rosa (1993) and Rosa and Perard (2007) for full divestiture can be
adapted to delegation contracts for a limited period of time.
Considering:
k: Cost of equity
i: Interest rate of private debt
l: Private leverage
t: Social cost of taxes
15

d: Interest rate of public debt
g: Public leverage
The respective cost of funds for private sector and local governments, noted Cp and Cg, are:
Cp= (1-l).k + l.i
Cg = (1- g).t + g.d
It follows that the private and public values, Vp and Vg, of the same water project are:
Vp = m
∑n = 1
⎛⎜⎜⎜⎜⎝
Pn
⎛⎝1 + ⎛⎝1 - l⎞⎠⋅k + l⋅i⎞⎠
⎞⎟⎟⎟⎟⎠ and
Vg = m
∑n = 1
⎛⎜⎜⎜⎜⎝
Pn
⎛⎝1 + ⎛⎝1 - g⎞⎠⋅t + g⋅d⎞⎠
⎞⎟⎟⎟⎟⎠
With P: Revenue (assumed to be the same for private and public sector)
And m: Length of operation of the firm = duration of the delegation contract
(m=∞ in the case of a full divestiture)
A difference of efficiency
As discussed previously, municipalities and private water firms might not have the same
competences for managing water delivery. We can now introduce a difference of management and
technical efficiency between private sector and local governments.
e: technical and management advantage of private sector over public sector
(e is usually superior to 1)
Private revenue = e * P
Public revenue = P
Thus,
Vp = m
∑n = 1
⎛⎜⎜⎜⎜⎝
e⋅Pn
⎛⎝1 + ⎛⎝1 - l⎞⎠⋅k + l⋅i⎞⎠
⎞⎟⎟⎟⎟⎠ and
Vg = m
∑n = 1
⎛⎜⎜⎜⎜⎝
Pn
⎛⎝1 + ⎛⎝1 - g⎞⎠⋅t + g⋅d⎞⎠
⎞⎟⎟⎟⎟⎠
Transaction costs of delegating water supply
Then, we can introduce in the model the “one time” and recurring transaction costs. Thus, with c:
“one time” transaction cost, a: recurring transaction costs.
Vp =
m
∑n = 1
⎛⎜⎜⎜⎜⎝
e⋅⎛⎝1 - a⎞⎠⋅Pn
⎛⎝1 + ⎛⎝1 - l⎞⎠⋅k + l⋅i⎞⎠
⎞⎟⎟⎟⎟⎠ - c⋅P
and
Vg = m
∑n = 1
⎛⎜⎜⎜⎜⎝
Pn
⎛⎝1 + ⎛⎝1 - g⎞⎠⋅t + g⋅d⎞⎠
⎞⎟⎟⎟⎟⎠
16

The “one time” transaction cost is expressed in the model as a percentage of the theoretical
revenue. Since recurring transaction costs are ultimately paid by the user, it lowers the theoretical annual
revenue obtained when water supply is outsourced.
Potential olitical cost of “privatizing” water supply
The last determinant of choice between public and private water supply is the political cost of
“privatizing” drinking water. This cost lowers the value of the private project.
With s: potential political cost of privatizing water supply
Vp = m
∑n = 1
⎛⎜⎜⎜⎜⎝
e⋅⎛⎝1 - a⎞⎠⋅Pn
⎛⎝1 + ⎛⎝1 - l⎞⎠⋅k + l⋅i⎞⎠
⎞⎟⎟⎟⎟⎠ - c⋅P - s
and Vg =
m
∑n = 1
⎛⎜⎜⎜⎜⎝
Pn
⎛⎝1 + ⎛⎝1 - g⎞⎠⋅t + g⋅d⎞⎠
⎞⎟⎟⎟⎟⎠
When Vp > Vg, the economic value of the private project is higher than the public one, the local
government will choose to privatize/outsource and will get the theoretical difference of value either as a
“selling bonus” (and distribute it among citizens) or by requesting better ratio tariff/services for the users
(who are also voters). Both are possible.
When Vp < Vg, the economic value of the public project is higher than the private one, the
municipality will choose to “nationalize” or not renew the concession contract. The theoretical difference of
value will allow the public operator to propose better ratio tariff/services or employ more people for the
same level of tariff/services for example.
IV. Theoretical influence of the variables on the choice of public versus private drinking water
Having considered all elements entering into the valuation of both private and public water
projects, the ratio of private and local governments’ valuations, Vprivate / Vpublic, determines the choice
between delegating to the private sector and providing directly water supply.
VprivateVpublic
=
m
∑n = 1
⎛⎜⎜⎜⎜⎝
e⋅⎛⎝1 - a⎞⎠⋅Pn
⎛⎝1 + ⎛⎝1 - l⎞⎠⋅k + l⋅i⎞⎠
⎞⎟⎟⎟⎟⎠ - c⋅P - s
m
∑n = 1
⎛⎜⎜⎜⎜⎝
Pn
⎛⎝1 + ⎛⎝1 - g⎞⎠⋅t + g⋅d⎞⎠
⎞⎟⎟⎟⎟⎠
17

When Vprivate / Vpublic = 1, the ratio is at the equilibrium, there is no privatization or
municipalization incentive. We want to know the influence of each variable on the equilibrium, and thus on
the decision of providing directly water supply or outsourcing.
The influences of the different variables are obtained by differentiating Vprivate / Vpublic with
respect to the variables around its unitary equilibrium value. The sign of each derivative will determine the
privatizing or nationalizing influence of these variables.
A positive derivative means that an increase in the factor’s value will influence positively the
choice of private provision because the value of the private provision project will increase more than the
value of direct provision project.
A negative derivative means that an increase in the factor’s value will influence positively the
choice of direct provision because the value of the direct provision project will increase more than the
value of private provision project.
Influence of technical and management advantage of private sector over public sector (e)
d (Vprivate / Vpublic) ------------------------------ = d e
⎛⎝a - 1⎞⎠⋅⎛⎜⎜⎝m
⎛⎝i⋅l - k⋅⎛⎝l - 1⎞⎠ + 1⎞⎠ - 1⎞⎟⎟⎠⋅⎛⎝⎛⎝g - 1⎞⎠⋅t - d⋅g⎞⎠⋅-m
⎛⎝i⋅l - k⋅⎛⎝l - 1⎞⎠ + 1⎞⎠ ⋅m
⎛⎝-⎛⎝⎛⎝g - 1⎞⎠⋅t - d⋅g - 1⎞⎠⎞⎠⎛⎝i⋅l - k⋅⎛⎝l - 1⎞⎠⎞⎠⋅⎛⎜⎜⎝
m⎛⎝-⎛⎝⎛⎝g - 1⎞⎠⋅t - d⋅g - 1⎞⎠⎞⎠ - 1⎞⎟⎟⎠
The sign of the derivative is positive. When the technical and management advantage of private
sector over public sector decreases, local governments tend to provide directly water supply.
Influence of the level of revenue of the water activity (P)
d (Vprivate / Vpublic) ------------------------------ = d P
-s⋅⎛⎝⎛⎝g - 1⎞⎠⋅t - d⋅g⎞⎠⋅m
⎛⎝-⎛⎝⎛⎝g - 1⎞⎠⋅t - d⋅g - 1⎞⎠⎞⎠2p ⋅⎛⎜⎜⎝
m⎛⎝-⎛⎝⎛⎝g - 1⎞⎠⋅t - d⋅g - 1⎞⎠⎞⎠ - 1⎞⎟⎟⎠
The sign of the derivative is positive. An increase of the level of revenue of the water activity
influences positively the choice of delegating water services. This relation between outsourcing and
18

potential revenue can be explained by the relative weight of transaction and political costs, which
decreases with the level of profit.
In addition, considering a possible technical and management advantage of private sector over
public sector, the difference between the “public” and the “private” value of the project increases with the
level of revenue. Thus, private sector participation is more likely for important project.
Influence of the “one time” transaction cost of outsourcing water supply (c)
d (Vprivate / Vpublic) ------------------------------ = d c
⎛⎝⎛⎝g - 1⎞⎠⋅t - d⋅g⎞⎠⋅m
⎛⎝-⎛⎝⎛⎝g - 1⎞⎠⋅t - d⋅g - 1⎞⎠⎞⎠m
⎛⎝-⎛⎝⎛⎝g - 1⎞⎠⋅t - d⋅g - 1⎞⎠⎞⎠ - 1
The sign of the derivative is negative. The importance of transaction costs influences negatively
the choice of delegating water services. The level of private sector participation in water supply is
expected to be higher in counties and municipalities, where transaction costs of outsourcing are low.
Influence of recurring transaction costs of outsourcing water supply (a)
d (Vprivate / Vpublic) ------------------------------ = d a
e⋅⎛⎜⎜⎝m
⎛⎝i⋅l - k⋅⎛⎝l - 1⎞⎠ + 1⎞⎠ - 1⎞⎟⎟⎠⋅⎛⎝⎛⎝g - 1⎞⎠⋅t - d⋅g⎞⎠⋅-m
⎛⎝i⋅l - k⋅⎛⎝l - 1⎞⎠ + 1⎞⎠ ⋅m
⎛⎝-⎛⎝⎛⎝g - 1⎞⎠⋅t - d⋅g - 1⎞⎠⎞⎠⎛⎝i⋅l - k⋅⎛⎝l - 1⎞⎠⎞⎠⋅⎛⎜⎜⎝
m⎛⎝-⎛⎝⎛⎝g - 1⎞⎠⋅t - d⋅g - 1⎞⎠⎞⎠ - 1⎞⎟⎟⎠
The sign of the derivative is negative. When recurring transaction costs (monitoring activity and
possible renegotiations) of delegating water supply increases, local governments tend to provide directly
water supply.
Influence of potential political cost of privatizing (s)
d (Vprivate / Vpublic) ------------------------------ = d s ⎝ ⎝ ⎠ ⎠
⎛⎝⎛⎝g - 1⎞⎠⋅t - d⋅g⎞⎠⋅m
⎛⎝-⎛⎝⎛⎝g - 1⎞⎠⋅t - d⋅g - 1⎞⎠⎞⎠p⋅⎛⎜⎜⎝
m⎛⎝-⎛⎝⎛⎝g - 1⎞⎠⋅t - d⋅g - 1⎞⎠⎞⎠ - 1⎞⎟⎟⎠
19

The sign of the derivative is negative. This result is intuitive, the highest the potential political cost
of privatizing is, the less likely privatization/delegation of water supply will be.
Influence of cost of equity (k)
d (Vprivate / Vpublic) ------------------------------ = d k
-⎛⎝a - 1⎞⎠⋅e⋅⎛⎜⎜⎝⎛⎝-i⋅l + k⋅⎛⎝l - 1⎞⎠ - 1⎞⎠⋅
m⎛⎝i⋅l - k⋅⎛⎝l - 1⎞⎠ + 1⎞⎠ + i⋅l⋅⎛⎝m + 1⎞⎠ - k⋅⎛⎝l - 1⎞⎠⋅⎛⎝m + 1⎞⎠ + 1⎞⎟⎟⎠⋅⎛⎝l - 1⎞⎠
⎛⎝⎛⎝g - 1⎞⎠⋅t - d⋅g⎞⎠⋅-m
⎛⎝i⋅l - k⋅⎛⎝l - 1⎞⎠ + 1⎞⎠ ⋅m
⎛⎝-⎛⎝⎛⎝g - 1⎞⎠⋅t - d⋅g - 1⎞⎠⎞⎠2
⎛⎝i⋅l - k⋅⎛⎝l - 1⎞⎠⎞⎠ ⋅⎛⎝i⋅l - k⋅⎛⎝l - 1⎞⎠ + 1⎞⎠⋅⎛⎜⎜⎝m
⎛⎝-⎛⎝⎛⎝g - 1⎞⎠⋅t - d⋅g - 1⎞⎠⎞⎠ - 1⎞⎟⎟⎠
The sign of the derivative depends on the sign of:
⎛⎜⎜⎝-i⋅l + k⋅⎛⎝l - 1⎞⎠ - 1⎞⎟⎟⎠⋅m
⎛⎜⎜⎝i⋅l - k⋅⎛⎝l - 1⎞⎠ + 1⎞⎟⎟⎠ + i⋅l⋅⎛⎝m + 1⎞⎠ - k⋅⎛⎝l - 1⎞⎠⋅⎛⎝m + 1⎞⎠ + 1
= -⎛⎜⎜⎝⎛⎜⎜⎝m + 1⎞⎟⎟⎠⎛⎜⎜⎝i⋅l + k⋅⎛⎝1 - l⎞⎠ + 1⎞⎟⎟⎠
⎞⎟⎟⎠ + ⎛⎝m + 1⎞⎠⋅⎛⎜⎜⎝i⋅l + k⋅⎛⎝1 - l⎞⎠ + 1⎞⎟⎟⎠ - m
Since (i.l + k.(1 - l) + 1) >1, and m ≥ 1, the sign of the derivative is always negative. A decrease of
cost of equity reduces the cost of private funds and influences positively the choice of delegating water
services to the private sector.
Influence of interest rate of private debt (i)
d (Vprivate / Vpublic) ------------------------------ = d i
⎛⎝a - 1⎞⎠⋅e⋅⎛⎜⎜⎝⎛⎝-i⋅l + k⋅⎛⎝l - 1⎞⎠ - 1⎞⎠⋅
m⎛⎝i⋅l - k⋅⎛⎝l - 1⎞⎠ + 1⎞⎠ + i⋅l⋅⎛⎝m + 1⎞⎠ - k⋅⎛⎝l - 1⎞⎠⋅⎛⎝m + 1⎞⎠ + 1⎞⎟⎟⎠⋅l⋅
⎛⎝⎛⎝g - 1⎞⎠⋅t - d⋅g⎞⎠⋅-m
⎛⎝i⋅l - k⋅⎛⎝l - 1⎞⎠ + 1⎞⎠ ⋅m
⎛⎝-⎛⎝⎛⎝g - 1⎞⎠⋅t - d⋅g - 1⎞⎠⎞⎠2
⎛⎝i⋅l - k⋅⎛⎝l - 1⎞⎠⎞⎠ ⋅⎛⎝i⋅l - k⋅⎛⎝l - 1⎞⎠ + 1⎞⎠⋅⎛⎜⎜⎝m
⎛⎝-⎛⎝⎛⎝g - 1⎞⎠⋅t - d⋅g - 1⎞⎠⎞⎠ - 1⎞⎟⎟⎠
As for the influence of the cost of equity, the sign of the derivative depends on the sign of:
⎛⎜⎜⎝-i⋅l + k⋅⎛⎝l - 1⎞⎠ - 1⎞⎟⎟⎠⋅m
⎛⎜⎜⎝i⋅l - k⋅⎛⎝l - 1⎞⎠ + 1⎞⎟⎟⎠ + i⋅l⋅⎛⎝m + 1⎞⎠ - k⋅⎛⎝l - 1⎞⎠⋅⎛⎝m + 1⎞⎠ + 1
= -⎛⎜⎜⎝⎛⎜⎜⎝m + 1⎞⎟⎟⎠⎛⎜⎜⎝i⋅l + k⋅⎛⎝1 - l⎞⎠ + 1⎞⎟⎟⎠
⎞⎟⎟⎠ + ⎛⎝m + 1⎞⎠⋅⎛⎜⎜⎝i⋅l + k⋅⎛⎝1 - l⎞⎠ + 1⎞⎟⎟⎠ - m
20

Since (i.l + k.(1 - l) + 1) >1, and m ≥ 1, the sign of the derivative is always negative. A decrease of
interest rate of private debt reduces de cost of private funds. Thus, it influences positively the choice of
delegating water services to the private sector.
Influence of the social cost of taxes (t)
d (Vprivate / Vpublic) ------------------------------ = d t
-⎛⎜⎜⎜⎜⎝
m
∑n = 1
⎛⎜⎜⎜⎜⎝
e⋅⎛⎝1 - a⎞⎠⋅Pn
⎛⎝1 + ⎛⎝1 - l⎞⎠⋅k + l⋅i⎞⎠
⎞⎟⎟⎟⎟⎠ - c⋅P - s
⎞⎟⎟⎟⎟⎠⋅⎛⎝g - 1⎞⎠⋅
⎛⎜⎜⎝⎛⎝⎛⎝g - 1⎞⎠⋅t - d⋅g - 1⎞⎠⋅
m⎛⎝-⎛⎝⎛⎝g - 1⎞⎠⋅t - d⋅g - 1⎞⎠⎞⎠ - ⎛⎝g - 1⎞⎠⋅⎛⎝m + 1⎞⎠⋅t + d⋅g⋅⎛⎝m + 1⎞⎠ + 1⎞⎟⎟⎠
4⋅p⋅⎛⎝⎛⎝g - 1⎞⎠⋅t - d⋅g - 1⎞⎠⋅2
⎛⎜⎜⎜⎜⎝sinh
⎛⎜⎜⎜⎜⎝
m⋅ln⎛⎝-⎛⎝⎛⎝g - 1⎞⎠⋅t - d⋅g - 1⎞⎠⎞⎠2
⎞⎟⎟⎟⎟⎠
⎞⎟⎟⎟⎟⎠
The sign of the derivative depends on the sign of:
-⎛⎜⎜⎝⎛⎝g - 1⎞⎠⋅t - d⋅g - 1⎞⎟⎟⎠⋅m
⎛⎜⎜⎝-⎛⎜⎜⎝⎛⎝g - 1⎞⎠⋅t - d⋅g - 1⎞⎟⎟⎠⎞⎟⎟⎠ + ⎛⎝g - 1⎞⎠⋅⎛⎝m + 1⎞⎠⋅t - d⋅g⋅⎛⎝m + 1⎞⎠ - 1
= ⎛⎜⎜⎝m + 1⎞⎟⎟⎠⎛⎜⎜⎝d⋅g - ⎛⎝g - 1⎞⎠⋅t + 1⎞⎟⎟⎠ - ⎛⎝m + 1⎞⎠⋅⎛⎜⎜⎝d⋅g + ⎛⎝1 - g⎞⎠⋅t + 1⎞⎟⎟⎠ + m
Since (d.g + t.(1 - g) + 1) >1, and m ≥ 1, the sign of the derivative is always positive. An increase
of the social cost of taxes influences positively the choice of delegating water services. Thus, we expect
private sector participation in water services to be more important in counties and municipalities where the
social cost of taxes is high.
Influence of interest rate of public debt (d)
d (Vprivate / Vpublic) ------------------------------ = d d
⎛⎜⎜⎜⎜⎝
m
∑n = 1
⎛⎜⎜⎜⎜⎝
e⋅⎛⎝1 - a⎞⎠⋅Pn
⎛⎝1 + ⎛⎝1 - l⎞⎠⋅k + l⋅i⎞⎠
⎞⎟⎟⎟⎟⎠ - c⋅P - s
⎞⎟⎟⎟⎟⎠⋅
⎛⎜⎜⎝
⎛⎜⎜⎝m + 1⎞⎟⎟⎠⎛⎝d⋅g - ⎛⎝g - 1⎞⎠⋅t + 1⎞⎠ - d⋅g⋅⎛⎝m + 1⎞⎠ + ⎛⎝g - 1⎞⎠⋅⎛⎝m + 1⎞⎠⋅t - 1⎞⎟⎟⎠⋅g
4⋅⎛⎝d⋅g - ⎛⎝g - 1⎞⎠⋅t + 1⎞⎠⋅2
⎛⎜⎜⎜⎜⎝sinh
⎛⎜⎜⎜⎜⎝
ln⎛⎝d⋅g - ⎛⎝g - 1⎞⎠⋅t + 1⎞⎠⋅m2
⎞⎟⎟⎟⎟⎠
⎞⎟⎟⎟⎟⎠⋅p
The sign of the derivative depends on the sign of:
⎛⎜⎜⎝m + 1⎞⎟⎟⎠⎛⎜⎜⎝d⋅g - ⎛⎝g - 1⎞⎠⋅t + 1⎞⎟⎟⎠ - ⎛⎝m + 1⎞⎠⋅⎛⎜⎜⎝d⋅g + ⎛⎝1 - g⎞⎠⋅t + 1⎞⎟⎟⎠ + m
21

Since (d.g + t.(1 - g) + 1) >1, and m ≥ 1, the sign of the derivative is always positive. As for the
social cost of taxes, an increase of the interest rate of public debt influences positively the choice of
delegating water services. Thus, we expect private sector participation in water services to be more
important in counties and municipalities facing high interest rate.
Influence of private leverage (l)
d (Vprivate / Vpublic) ------------------------------ = d l
⎛⎝a - 1⎞⎠⋅e⋅⎛⎝i - k⎞⎠⋅⎛⎜⎜⎝⎛⎝-i⋅l + k⋅⎛⎝l - 1⎞⎠ - 1⎞⎠⋅
m⎛⎝i⋅l - k⋅⎛⎝l - 1⎞⎠ + 1⎞⎠ + i⋅l⋅⎛⎝m + 1⎞⎠ - k⋅⎛⎝l - 1⎞⎠⋅⎛⎝m + 1⎞⎠ + 1⎞⎟⎟⎠⋅
⎛⎝⎛⎝g - 1⎞⎠⋅t - d⋅g⎞⎠⋅-m
⎛⎝i⋅l - k⋅⎛⎝l - 1⎞⎠ + 1⎞⎠ ⋅m
⎛⎝-⎛⎝⎛⎝g - 1⎞⎠⋅t - d⋅g - 1⎞⎠⎞⎠2
⎛⎝i⋅l - k⋅⎛⎝l - 1⎞⎠⎞⎠ ⋅⎛⎝i⋅l - k⋅⎛⎝l - 1⎞⎠ + 1⎞⎠⋅⎛⎜⎜⎝m
⎛⎝-⎛⎝⎛⎝g - 1⎞⎠⋅t - d⋅g - 1⎞⎠⎞⎠ - 1⎞⎟⎟⎠
As discussed previously:
⎛⎜⎜⎝-i⋅l + k⋅⎛⎝l - 1⎞⎠ - 1⎞⎟⎟⎠⋅m
⎛⎜⎜⎝i⋅l - k⋅⎛⎝l - 1⎞⎠ + 1⎞⎟⎟⎠ + i⋅l⋅⎛⎝m + 1⎞⎠ - k⋅⎛⎝l - 1⎞⎠⋅⎛⎝m + 1⎞⎠ + 1
= -⎛⎜⎜⎝⎛⎜⎜⎝m + 1⎞⎟⎟⎠⎛⎜⎜⎝i⋅l + k⋅⎛⎝1 - l⎞⎠ + 1⎞⎟⎟⎠
⎞⎟⎟⎠ + ⎛⎝m + 1⎞⎠⋅⎛⎜⎜⎝i⋅l + k⋅⎛⎝1 - l⎞⎠ + 1⎞⎟⎟⎠ - m
is negative, considering possible range of value for each of the variables.
Thus, the sign of the derivative depends of the respective value of the cost of equity k and the
interest rate of private debt i. If the cost of equity k is greater than the interest rate of private debt i,
( I - k )<0, the sign of the derivative is positive. Therefore, an increase of the private leverage lowers the
cost of private funds and influences positively the choice of delegating water supply to the private sector.
22

Influence of public leverage (g)
d (Vprivate / Vpublic) ------------------------------ = d g
-⎛⎜⎜⎝⎛⎝g⋅⎛⎝t - d⎞⎠ - t - 1⎞⎠⋅m
⎛⎝-⎛⎝g⋅⎛⎝t - d⎞⎠ - t - 1⎞⎠⎞⎠ - g⋅⎛⎝t - d⎞⎠⋅⎛⎝m + 1⎞⎠ + ⎛⎝m + 1⎞⎠⋅t + 1⎞⎟⎟⎠⋅⎛⎝t - d⎞⎠⋅⎛⎜⎜⎜⎜⎝
m
∑n = 1
⎛⎜⎜⎜⎜⎝
e⋅⎛⎝1 - a⎞⎠⋅Pn
⎛⎝1 + ⎛⎝1 - l⎞⎠⋅k + l⋅i⎞⎠
⎞⎟⎟⎟⎟⎠ - c⋅P - s
⎞⎟⎟⎟⎟⎠
4⋅⎛⎝g⋅⎛⎝t - d⎞⎠ - t - 1⎞⎠⋅2
⎛⎜⎜⎜⎜⎝sinh
⎛⎜⎜⎜⎜⎝
ln⎛⎝-⎛⎝g⋅⎛⎝t - d⎞⎠ - t - 1⎞⎠⎞⎠⋅m2
⎞⎟⎟⎟⎟⎠
⎞⎟⎟⎟⎟⎠⋅p
The sign of:
-⎛⎜⎜⎝⎛⎝g - 1⎞⎠⋅t - d⋅g - 1⎞⎟⎟⎠⋅m
⎛⎜⎜⎝-⎛⎜⎜⎝⎛⎝g - 1⎞⎠⋅t - d⋅g - 1⎞⎟⎟⎠⎞⎟⎟⎠ + ⎛⎝g - 1⎞⎠⋅⎛⎝m + 1⎞⎠⋅t - d⋅g⋅⎛⎝m + 1⎞⎠ - 1
= ⎛⎜⎜⎝m + 1⎞⎟⎟⎠⎛⎜⎜⎝d⋅g - ⎛⎝g - 1⎞⎠⋅t + 1⎞⎟⎟⎠ - ⎛⎝m + 1⎞⎠⋅⎛⎜⎜⎝d⋅g + ⎛⎝1 - g⎞⎠⋅t + 1⎞⎟⎟⎠ + m
is always positive, since (d.g + t.(1 - g) + 1) >1, and m ≥ 1. Thus, the sign of the derivative depends of the
respective values of the social cost of taxes t and the interest rate of public debt d. If the social cost of
taxes t is greater than the interest rate of public debt d, (d - t) < 0, the sign of the derivative is negative. An
increase of the public leverage lowers the average cost of public funds. Consequently, it influences
positively the choice of providing directly water services.
23
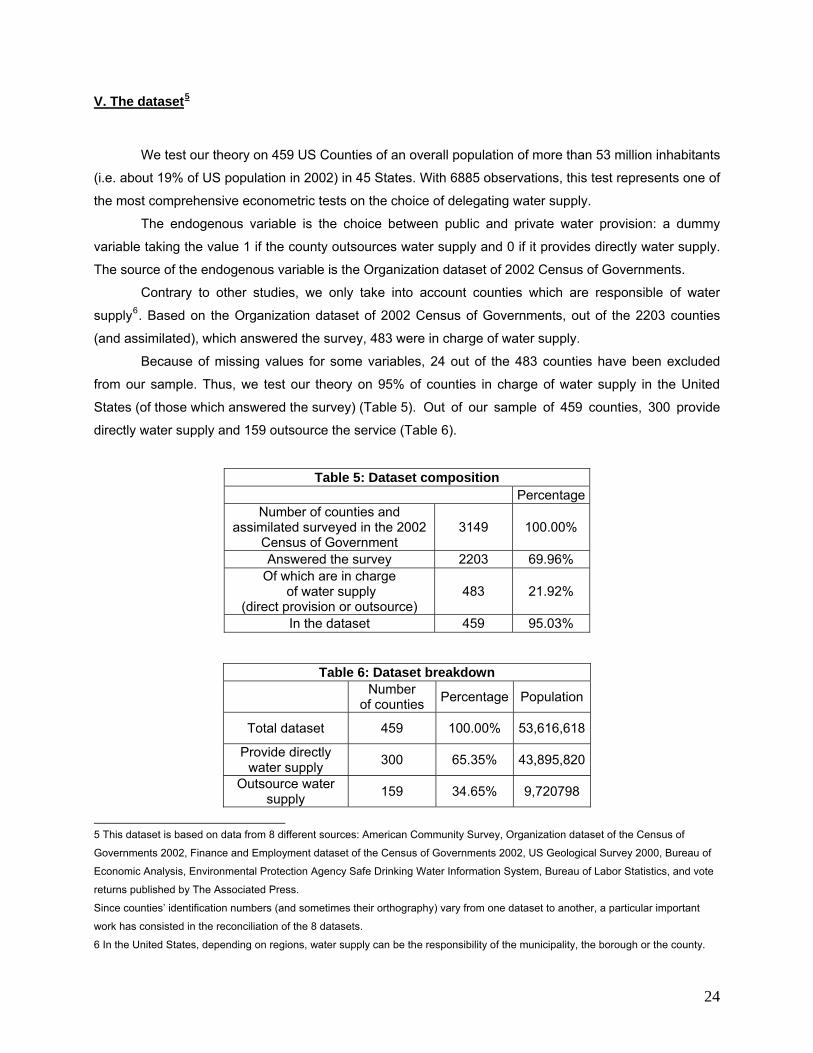
V. The dataset5
We test our theory on 459 US Counties of an overall population of more than 53 million inhabitants
(i.e. about 19% of US population in 2002) in 45 States. With 6885 observations, this test represents one of
the most comprehensive econometric tests on the choice of delegating water supply.
The endogenous variable is the choice between public and private water provision: a dummy
variable taking the value 1 if the county outsources water supply and 0 if it provides directly water supply.
The source of the endogenous variable is the Organization dataset of 2002 Census of Governments.
Contrary to other studies, we only take into account counties which are responsible of water
supply6. Based on the Organization dataset of 2002 Census of Governments, out of the 2203 counties
(and assimilated), which answered the survey, 483 were in charge of water supply.
Because of missing values for some variables, 24 out of the 483 counties have been excluded
from our sample. Thus, we test our theory on 95% of counties in charge of water supply in the United
States (of those which answered the survey) (Table 5). Out of our sample of 459 counties, 300 provide
directly water supply and 159 outsource the service (Table 6).
Table 5: Dataset composition Percentage
Number of counties and assimilated surveyed in the 2002
Census of Government 3149 100.00%
Answered the survey 2203 69.96% Of which are in charge
of water supply (direct provision or outsource)
483 21.92%
In the dataset 459 95.03%
Table 6: Dataset breakdown
Number of counties Percentage Population
Total dataset 459 100.00% 53,616,618
Provide directly water supply 300 65.35% 43,895,820
Outsource water supply 159 34.65% 9,720798
5 This dataset is based on data from 8 different sources: American Community Survey, Organization dataset of the Census of
Governments 2002, Finance and Employment dataset of the Census of Governments 2002, US Geological Survey 2000, Bureau of
Economic Analysis, Environmental Protection Agency Safe Drinking Water Information System, Bureau of Labor Statistics, and vote
returns published by The Associated Press. Since counties’ identification numbers (and sometimes their orthography) vary from one dataset to another, a particular important
work has consisted in the reconciliation of the 8 datasets.
6 In the United States, depending on regions, water supply can be the responsibility of the municipality, the borough or the county.
24

Since the decision of outsourcing water supply is local, the exogenous variables are measured
only with county’s level data (and not with state’s level data) as follow:
• The interest rate of the public debt (d) is approximated by the interest paid by the county’s
government divided by the outstanding public debt of the county’s government at the beginning of
the year. The calculation is based on data from the Finance dataset of the 2002 Census of
Governments.
• The social cost of taxes (t) has been calculated as follow:
Social cost of taxes = (Total of the national, state and local taxes paid by county’s population /
Total revenue of county’s population)²
With total of the national, state and local taxes paid by county’s population =
Total revenue of county’s population * National tax rate
+ Total revenue of county’s population * State tax rate
+ Tax collected by the county
The sources of data are the US Census Bureau, the US Bureau of Economic Analysis and the
OECD.
• The public leverage (g) is approximated by the ratio:
County’s public debt / (county’s public debt + county’s revenue of taxation)
The calculation is based on data from the Finance dataset of the 2002 Census of
Governments.
• The level of revenue (P) generated by the water activity is approximated by the weighted average
of water household expenses per year in the county multiplied by the number of households in the
county.
The calculation of the weighted average of water household expenses for each county is
based on the average of water household expenses in the PUMA area weighted by the proportion
of county’s population living in the PUMA area. For definition of PUMA area, see
http://www.census.gov/acs/www/index.html
The source of data is the American Community Survey for 2000.
• Transaction costs: “one time” (c) and recurring (a) are approximated by three common variables:
o The experience with outsourcing: “one time” and recurring transaction costs depend
obviously of the prior experience (and therefore knowledge) of a county in the field of
delegation of public services.
25

This experience is approximated by the number of public services already outsourced by
the county. Public services reported are airports, ambulances, cemeteries, corrections (jails),
electric utility, fire protection, gas utility, health (other than hospitals), hospitals, housing and
community development, law enforcement (police), libraries, nursing homes, parks and
recreation (including stadiums and convention centers), public transit, sewerage system,
solid waste, streets – roads – highways – bridges. The source of data is the Organization
dataset of 2002 Census of Governments.
o The housing density: transaction costs depend also of the housing density.
The cost of acquisition of information for the due diligence process and for the bid
evaluation of the water network, which is considered for being outsourced, is relatively
lower for a densely populated area. Therefore transaction costs of outsourcing water supply
are inferior in very densely populated areas.
Similarly, the housing density has an influence on the recurring monitoring cost of
the private operator. Indeed, the cost of acquisition of information on water quality and
on management of the water system is relatively lower in densely populated areas.
The source of data is the US Geological Survey 2000.
o The percentage of groundwater: An important level of surface water (i.e. low percentage
of groundwater) facilitates monitoring and evaluation procedures by lowering the cost of
acquisition of information about the water network and the quality of water. The source of
data is the US Geological Survey 2000.
• The technical and management advantage of private sector over public sector (e) is approximated
by two variables:
o The experience with direct provision: the difference of efficiency between the local
government and the private sector depends of the experience acquired by the local
government in provision of public services.
This experience is approximated by the number of public services already provided
directly by the county. Public services reported are airports, ambulances, cemeteries,
corrections (jails), electric utility, fire protection, gas utility, health (other than hospitals),
hospitals, housing and community development, law enforcement (police), libraries, nursing
homes, parks and recreation (including stadiums and convention centers), public transit,
solid waste, streets – roads – highways – bridges. The source of data is the Organization
dataset of 2002 Census of Governments.
26

o The direct provision of sewerage: Because of similarity between sewerage management
and water supply management, the difference of efficiency between local governments
and the private sector is lower when local governments are already in charge of
sewerage.
The direct provision of sewerage is a dummy variable: 1 when sewerage is directly
provided, 0 otherwise. The source of data is the Organization dataset of 2002 Census of
Governments.
• The potential political cost of privatizing (s) is approximated by two variables:
o The percentage of public employees in the county’s population (excluding those working
in water supply to avoid bias): As Fernandez and Smith (2006) tested for the State of
Georgia, privatization is significantly more negatively perceived by public employees.
Thus, the political (electoral) cost of a privatization is higher when a large percentage of
population is employed by the public sector. The source of data is the Employment
dataset of 2002 Census of Governments.
o The political ideology of voters is approximated by the percentage of Republican votes at
the presidential elections of 2000.The political cost of privatizing is expected to be lower in
counties, where the proportion of Republicans is high (i.e. higher cost in “Democrat
counties”) The source of data is the Associated Press.
Since our dataset on water privatization is not available over a long period of time, we are not able
to test the influence of the fluctuation of the cost of private funds7. However, we test all other determinants
in order to explain why for a given year, 2002, some counties choose direct provision and why others
outsource water supply.
In addition to our theory, we test two other arguments usually discussed in the literature on
privatizations:
• The first one is the argument of public employment: one of the reasons for public provision would
be public employment. Thus, we test the influence of the unemployment rate in the county on the
choice between public and private water supply. The source of data is the US Bureau of Labor
Statistics.
7 Rosa and Perard (2007) test the influence of the cost of private funds on privatization movements in general for 8 OECD countries
over 15 years.
27
• Others argue that the high cost of public wages is the cause of privatization. Thus, we test the
influence of the average public wage of the county (excluding those working in water supply to
avoid bias) on the choice of outsourcing water supply. The source of data is the Employment
dataset of 2002 Census of Governments.
In addition to our main test, we provide a second empirical test on the influence of the choice
between public and private water supply on the number of drinking water quality environmental violations
reported in the county by the US Environmental Protection Agency. The source of data is the EPA Safe
Drinking Water Information System. For this second test, the control variables are the density, the
percentage of groundwater and the number of housing units.
The next table (Table 7) summarizes information on all variables, the sign expected, the
methodology of calculation and the source of data. A positive sign means we expect that an increase of
the factor (or a high value) will influence positively the choice of outsourcing water supply.
Note: Concerning the influence of the public leverage, which varies depending on the value of the social
cost of taxes t and the public interest rate d, in our dataset t > d. Thus, an increase of the public leverage
will lower the average cost of public funds. Consequently, it will influence positively the choice of providing
directly water services.
28

Table 7: Summary of exogenous variables tested
Label Sign expected
Element of the theory
tested Methodology Source
Interest rate +
Influence of interest rate
of public debt
Interest paid by the county’s government / outstanding public debt of the county’s
government at the beginning of the year
Calculation based on data from the 2002 Census of
Governments, US Census Bureau
http://www.census.gov/econ/www/index.html
Social cost of taxes +
Influence of social cost of
taxes
(National, state and local weighted total taxation paid by
county’s population / Revenue generated by the
county’s population)² See precedent paragraph, for
detailed methodology.
Calculation based on data from the US Census Bureau, the US
Bureau of Economic Analysis and the OECD
Public Leverage _
Influence of public
leverage
County’s public debt / (County’s public debt +
county’s revenue of taxation)
Calculation based on data from the 2002 Census of
Governments, US Census Bureau
http://www.census.gov/econ/www/index.html
Revenue + Influence of the level of
revenue
Weighted average water household expenses per year
in the county * number of households in the county
(The calculation of the
weighted average water household expenses for each
county is based on the average water household
expenses in the PUMA area weighted by the proportion of county’s population living in
the PUMA area) For definition of PUMA area,
see http://www.census.gov/acs/ww
w/index.html
Calculation based on data from the American Community Surveyhttp://www.census.gov/acs/www/i
ndex.html
Experience with
outsourcing +
Influence of “one time”
and recurring transaction
costs
Number of public services outsourced by the county’s
government
Calculation based on data from the 2002 Census of
Governments, US Census Bureau
http://www.census.gov/econ/www/index.html
Experience with direct provision
_
Influence of technical and management advantage of private sector
over public sector
Number of public services directly provided by the county’s government
Calculation based on data from the 2002 Census of
Governments, US Census Bureau
http://www.census.gov/econ/www/index.html
29

Direct provision of sewerage
_
Influence of technical and management advantage of private sector
over public sector
Does the county’s government provide directly sewerage (1=Yes, direct provision;
0=No)
2002 Census of Governments, US Census Bureau
http://www.census.gov/econ/www/index.html
Density +
Influence of “one time”
and recurring transaction
costs
Housing density Calculation based on US Geological Survey 2000
http://www.usgs.gov/
Percentage of
groundwater _
Influence of “one time”
and recurring transaction
costs
Percentage of groundwater US Geological Survey 2000 http://www.usgs.gov/
Percentage of public
employees in the
population
_
Influence of political cost of privatizing
Number of people employed by the county’s government
(less public employees working for water services) /
county’s population
Calculation based on data from the 2002 Census of
Governments, US Census Bureau
http://www.census.gov/econ/www/index.html
Republican vote in 2000
+ Influence of political cost of privatizing
Percentage of county’s population, who voted
Republican at the presidential elections of 2000
Vote returns per county reported by The Associated Press
Unemployment rate
No sign expected
Theories on privatization
and employment
Percentage of unemployed population in the county
Bureau of Labor Statistics www.bls.gov
Public wage
No sign expected
Arguments on
privatization and the cost
of public wages
Sum of wages paid by the county’s government (less public wages paid for water
services) / number of full time equivalent employees
Calculation based on data from the 2002 Census of
Governments, US Census Bureau
Water quality
standard violation
Endogenous
variable of the
second test
Arguments on a
difference of efficiency/quality between the public and the
private sector
Number of drinking water environmental violation
reported in the county during a given year
US Environmental Protection Agency
Safe Drinking Water Information System
http://www.epa.gov/safewater/data/getdata.html
Water outsourcing
or direct provision?
Endogenous
variable
Endogenous variable
Is drinking water outsourced or directly provided by the
county’s government (1=Private, 0=Public)
2002 Census of Governments, US Census Bureau
http://www.census.gov/econ/www/index.html
30

VI. Tests and interpretation The following tables present results of the tests on our dataset of 459 counties using OLS method
(Table 8), PROBIT method (Table 9) and OLS method for the second test on water quality environmental
violations (Table 10).
Summary statistics (Appendix 1) and correlation coefficients (Appendix 2) are presented in the
Annex.
31

Table 8: OLS Estimates Dependent Variable: Dummy Water Outsourcing (1=Private, 0=Public)
Variables
0.204201 -0.209522 -0.283025 -0.20362 Constant (1.0427) (-0.9827) (-1.2242) (-0.8263)
-1.05515 -0.692298 -0.770447 -0.93136 Interest rate (-0.694) (-0.4641) (-0.5153) (-0.6187)
5.86503*** 5.44567*** 5.61694*** 6.03593*** Social cost of taxes (3.2402) (3.0667) (3.1406) (3.2726)
0.0193483 0.0722783 0.0628957 0.058882 Public Leverage (0.1773) (0.6719) (0.5812) (0.5436)
-5.41E-10 -2.40E-10 -2.39E-10 -1.16E-10 Revenue (-1.1226) (-0.5045) (-0.5011) (-0.2344)
0.039426*** 0.03676*** 0.03724*** 0.03725*** Experience with outsourcing (7.9429) (7.5046) (7.5466) (7.5478)
-0.01673** -0.01935*** -0.01946*** -0.01837** Experience with direct provision
(-2.2442) (-2.6409) (-2.6538) (-2.4733)
-0.43652*** -0.43670*** -0.43072*** -0.42342***Direct provision of sewerage (-11.0052) (-11.2384) (-10.8927) (-10.5017)
0.0002968* 0.000362** 0.000377** 0.0004*** Density (1.9526) (2.4235) (2.5017) (2.6176)
-0.0498788 -0.0379154 -0.0361407 -0.03808 Percentage of groundwater (-1.2134) (-0.9394) (-0.8939) (-0.9405)
-4.91324*** -4.3385** -4.68117** -5.05068***Percentage of public employees in the population (-2.5966) (-2.3348) (-2.4575) (-2.5955)
0.68262*** 0.732131*** 0.722665***Republican vote in 2000 (4.4499) (4.4424) (4.376)
0.00778013 0.007711 Unemployment rate (0.8237) (0.8162)
-3.73E-05 Public wage (-0.9319)
Number of observations 459 459 459 459
F statistic 33.4912 p<0.00001
33.5245 p<0.00001
30.7652 p<0.00001
28.4571 p<0.00001
Adjusted R2 0.415004 0.438567 0.438163 0.437997
Significance level: 10 percent (*), 5 percent (**), and 1 percent (***). T statistics are presented in brackets.
32

Table 9: Probit test Dependent Variable: Dummy Water Outsourcing (1=Private, 0=Public)
Variables
-1.14553 -2.59411*** -3.08984*** -2.67327***Constant (-1.3456) (-2.6909) (-2.929) (-2.3739)
-5.84748 -3.73681 -4.23528 -4.80797 Interest rate (-0.8085) (-0.5407) (-0.6034) (-0.6898)
23.2911*** 21.6823** 22.9647*** 25.1302*** Social cost of taxes (2.8546) (2.5568) (2.6698) (2.8326)
0.092037 0.201467 0.165806 0.096471 Public Leverage (0.1973) (0.4244) (0.3456) (0.199)
-5.53E-09 -3.73E-09 -3.63E-09 -1.98E-09 Revenue (-1.2396) (-0.8703) (-0.8445) (-0.4789)
0.16859*** 0.160489*** 0.164811*** 0.167102***Experience with outsourcing
(6.2196) (5.8371) (5.918) (5.9483)
-0.06595** -0.07347** -0.07642** -0.0713** Experience with direct provision
(-1.9646) (-2.1436) (-2.2128) (-2.044)
-1.68003*** -1.71336*** -1.6852*** -1.65789***Direct provision of sewerage (-8.544) (-8.5765) (-8.3462) (-8.1428)
0.001675** 0.00193** 0.002015*** 0.002107***Density (2.1762) (2.5343) (2.6122) (2.7683)
-0.21229 -0.15172 -0.14588 -0.16542 Percentage of groundwater (-1.1592) (-0.8135) (-0.7798) (-0.8789)
-20.634** -19.296** -22.3551** -23.9359** Percentage of public employees in the population
(-2.3859) (-2.1659) (-2.403) (-2.5339)
2.41883*** 2.78373*** 2.79014*** Republican vote in 2000 (3.4896) (3.6629) (3.6527)
0.051429 0.053184 Unemployment rate (1.2243) (1.2537) -0.00021 Public wage (-1.0935)
Number of observations 459 459 459 459
McFadden's pseudo-R2 0.406093 0.427263 0.429795 0.431816
Number of cases 'correctly predicted'
387 (84.3%)
395 (86.1%)
390 (85.0%)
389 (84.7%)
Significance level: 10 percent (*), 5 percent (**), and 1 percent (***).T statistics are presented in brackets.
33

Table 10: OLS estimates Dependent variable: Number of water quality standard violations
Variables Test for 2000 Test for 2001 Test for 2002
1.96722*** 1.86929*** 1.95427*** Constant (4.2273) (4.1952) (3.9408)
-0.0038* -0.0032 -0.0036 Density (-1.7494) (-1.5379) (-1.5392)
-0.6129 -0.3664 -0.2366 Percentage of groundwater
(-1.1155) (-0.6964) (-0.4041)
9.83E-06*** 9.44E-06*** 1.06E-05*** Number of housing units
(3.1065) (3.1149) (3.1465)
0.49307 0.25377 -0.0397 Private water delivery (1=Yes) (0.9885) (0.5314) (-0.0747)
Number of
observations 459 459 459
F-statistic 2.74289 p = 0.0281
2.57022 p = 0.0374
2.64098 p = 0.0333
Adjusted R2 0.0149935 0.0135282 0.0141292
Significance level: 10 percent (*), 5 percent (**), and 1 percent (***).T statistics are presented in brackets. (2000 and 2001 are presented for information, since our data on public or private delivery concern only 2002)
The results of our tests (Table 8 and 9) are conformed to our theory. The lack of significance of
public leverage, interest rate and revenue might be attributed to a problem of evaluation at first.
Other variables are significant at less than 1% or 5%.
The tests confirm that our theory explains well why some counties outsource water supply and
why others choose public provision.
The influence of the social cost taxes is particularly significant (at less than 1%). An increase of
social cost of taxes increase mechanically the county’s cost of funds. Thus, it influences positively the
choice of outsourcing drinking water. Counties with a high social cost of taxes tend more to delegate water
supply.
34

“One time” and recurring transaction costs are particularly important with regard to the choice of
delegating water supply. Indeed, two of the three variables which serve as proxy for transaction costs, are
significant at less than 1% and 5%. As we expected, lower transaction costs influences positively the
choice of delegating water supply. Thus, counties densely populated and with experience of outsourcing
tend more to “privatize” water supply.
The difference of technical and management capacities influences also the decision between
public and private drinking water. Therefore, counties, which provide directly sewerage and which hold
experience of direct provision of other public services, are more likely to opt for public provision.
The potential political (electoral) cost of privatizing plays an important role as well. The political
orientation in favor of Republicans and the low percentage of public employees reduce the political cost of
privatizing and thus influence positively the choice of outsourcing.
Theories, which suggest employment as a motive for public provision and cost of public wages as
a cause of privatization, are irrelevant. Indeed, the influence of the county’s unemployment rate and level
of county’s public wages is not significant.
In addition, our second econometric test (Table 10) shows that there is not any difference of
drinking water quality standard violations between the public and the private sector for the years 2000,
2001 and 2002.
VII. Conclusion
The review of international experiences has revealed great differences of level of private sector
participation in water supply among OECD countries. In addition, the history of privatization and
municipalization of water provision in OECD countries shows that the choice between public and private
water supply is not a once for all decision. It rather consists in movement of privatization and
deprivatization over long period of time.
Most theories on privatization of water are based on the sole difference of efficiency between the
public and the private sector. Empirical tests based on these theories are not really conclusive. Moreover,
these theories cannot explain the persistence of the public model, nationalization movements and
international differences of water privatization trends.
We developed a complete theory of the choice between public and private water supply based on
four determinants: difference of cost of funds between public and private sector, difference of efficiency,
transaction costs, and potential political cost of privatizing.
35

In our theory, determinants, which drive the choice of delegating or not water services, fluctuate
over the time and depend on local factors. It can thus explain both privatization and municipalization
movements as well as why some local governments outsource water supply, while others opt for direct
provision.
Our empirical test on 459 US Counties in 45 States is conclusive and provides substantial support
to our theory. Cost of public funds, and especially the social cost of taxes, influences the choice of
delegating water services. Other variables which favor the choice of public provision are transaction costs
and the potential political cost of privatizing. The difference of management and technical capacities
between private sector and local governments is also a determinant.
We also tested literature’s theories on employment and privatizations, as well as the explanation
of privatization by the cost of public wages and concluded that they were not relevant.
In another econometric test, we found that the difference of drinking water environmental
violations between public and private water providers is not significant either.
Further interesting empirical work should concentrate on long time series, in order to test the
influence of the fluctuation of private cost of funds on the privatization of water8. Unfortunately, to our
knowledge, for the time being, data similar to those tested in this paper are not available over long period
of time.
VIII. Implication for reducing the cost of water infrastructure projects
Considering the importance of financing needs for water infrastructure in OECD countries and in
developing countries, local governments need to tap both public and private capital markets.
Thus, reducing the cost of water infrastructure projects can be achieved in two ways.
The first approach concerns the cost of funds. As discussed previously, cost of funds is one of the
main determinants of the choice of outsourcing water supply. Lowering cost of funds can increase the
attractiveness of private water investments and therefore enhances competition between public and
private resulting in gains in efficiency.
The second approach is less developed but is also essential. It deals with institutional costs
generated by investments in the water sector. As discussed previously, asymmetry of information and
incomplete contracts lead to important recurring transaction costs when water is outsourced. Thus, as we
tested, transaction costs are one of the determinants of the choice between public and private water
supply. 8 Rosa and Perard (2007) find substantial support for the influence of the cost of equity on privatization movements in the economy
in general.
36

Better design of institutional arrangements can lower transaction costs by reducing the need of
monitoring activities and probability of contract’s renegotiation. Therefore, it moderates the cost of private
investments in water infrastructure and increases consequently competition between public and private
water projects leading to possible gains in efficiency in the public and the private sector.
Thus, research on institutional arrangements in the water sector is particularly important and could
contribute in reducing the cost of public and private water infrastructure projects.
37

38
IX. Annex
Appendix 1: Summary Statistics, using the observations 1 – 459
Variable Mean Median Minimum Maximum
Interest rate 0.0559584 0.0557214 0.0158782 0.132841
Social cost of taxes 0.0941374 0.0929601 0.0736943 0.151081
Public Leverage 0.638284 0.664012 0.0126304 0.989687
Revenue 1.84E+07 3.83E+06 117417 4.13E+08
Experience with outsourcing 4.00436 3 0 14
Experience with direct provision 7.50327 8 0 15
Direct provision of sewerage (1= direct provision) 0.459695 0 0 1
Density 74.1576 31.4271 0.497659 1622.77
Percentage of groundwater 0.550949 0.591052 0 1
Percentage of public employees in the population 0.0365163 0.0349972 0.0084666 0.0837321
Republican vote in 2000 0.573536 0.579044 0.177313 0.893574
Unemployment rate 5.90022 5.6 2.1 19.7
Public wage 2746.47 2652.53 1692.01 4886.86
Dummy Water Outsourcing (1=Private, 0=Public) 0.346405 0 0 1

39
Appendix 2: Correlation coefficients, using the observations 1 – 459
Interest rate
Public Leverage
Social cost of taxes
Percentage of public
employees in the
population
Public wage
Unemployment rate
Experience with
outsourcing
Experience with direct provision
Direct provision
of sewerage
Dummy Water
Outsourcing Density
Percentage of
groundwater
Republican vote in 2000
Revenue
Interest rate 1 0.0215 0.1162 0.0494 -0.0639 0.0726 -0.0352 0.0117 0.0308 -0.0428 0.0016 0.0396 -0.0594 0.0091
Public Leverage 1 -0.152 -0.0454 0.0567 0.1305 0.0032 0.094 0.0794 -0.0438 0.1481 -0.1317 -0.1479 0.1848
Social cost of taxes 1 0.3686 0.1252 -0.0522 0.0242 0.0825 -0.0428 0.0975 -0.0458 0.1073 0.053 -0.0294
Percentage of public
employees in the population
1 -0.1845 0.2132 -0.0116 0.029 -0.1364 -0.0074 -0.0922 0.1251 -0.0225 -0.1365
Public wage 1 -0.1147 -0.0909 0.3796 0.3765 -0.218 0.4199 -0.0513 -0.1369 0.4935
Unemployment rate 1 -0.1094 -0.057 -0.1799 -0.0066 -0.0852 -0.0119 -0.3576 -0.0427
Experience with outsourcing 1 -0.2104 -0.2294 0.4233 -0.0697 -0.0283 0.1248 -0.054
Experience with direct provision 1 0.4402 -0.3431 0.2702 -0.053 -0.0324 0.3512
Direct provision of sewerage 1 -0.5521 0.2529 0.0257 -0.069 0.2759
Dummy Water Outsourcing 1 -0.0948 -0.0726 0.2252 -0.1679
Density 1 -0.1164 -0.205 0.5703
Percentage of groundwater 1 -0.0558 0.027
Republican vote in 2000 1 -0.2303
Revenue 1
References Abdala, Manuel Angel (1997). Welfare Effects of Buenos Aires' Water and Sewerage Services Privatization. Washington DC: World Bank.
Alcázar, Lorena, Manuel Abdala and Mary M Shirley (2002). "The Buenos Aires water concession." Thirsting for Efficiency: The Economics and Politics of Urban Water System Reform, ed. Mary M. Shirley, 65-102. Oxford UK: Pergamon Press,.
Armstrong, Mark, Simon Cowan and John Vickers (1994). Regulatory Reform: Economic Analysis and British Experience. The MIT Press.
Artana, Daniel, Fernando Navajas and Santiago Urbiztondo (1998). “Governance and regulation: A tale of two concessions in Argentina.” Spilled Water: Institutional Commitment in the Provision of Water Services, ed. Pablo T. Spiller, 197-248. Washington DC: Inter-American Development Bank.
Bhattacharyya, A., E. Parker, and K. Raffiee (1994). “An examination of the effect of ownership on the relative efficiency of public and private water utilities.” Land Economics 70(2):197–209.
Bhattacharyya, A., T. Harris, R. Narayanan and K. Raffiee (1995). Specification and estimation of the effect of ownership on the economic efficiency of the water utilities. Regional Science and Urban Economics 25:759–784.
Bishop, Matthew R. and Kay, John A. (1989) “Privatization in the United Kingdom: Lessons From Experience.” World Development, 17(5).
Boycko, Maxim, Andrei Shleifer and Robert W Vishny (1996). “A theory of privatisation.” The Economic Journal, Vol. 106, (435):309-319.
Boardman, Anthony E. and Vining, Aidan R. (1992) “Ownership vs. Competition: Efficiency in Public Enterprise.” Public Choice, 73(2).
Brada, Josef C. (1996) “Privatization is Transition - Or Is It?” Journal of Economic Perspectives, 10(2).
Brook Cowen, Penelope J. (1999). “The Guinea water lease -- five years on [Revised].” Public Policy for the Private Sector. Washington DC: World Bank.
Brook, Penelope J., and Alain Locussol (2001). “Easing tariff increases: Financing the transition to cost-covering water tariffs in Guinea.” Contracting for Public Services: Output Based Aid and Its Applications, ed. Suzanne M. Smith. Washington DC: World Bank.
Brubaker, E. (2002). Liquid Assets: Privatizing and Regulating Canada’s Water Utilities. Toronto: University of Toronto Centre for Public Policy.
Bruggink, T. (1982). “Public versus regulated private enterprise in the municipal water industry: A comparison of operating costs.” Quarterly Review of Economics and Business. 22:111–125.
Buller, H. (1996). “Privatization and Europeanization: The changing context of water supply in Britain and France.” Journal of Environmental Planning and Management, 39:461–483.
Burns P. and A. Estache (1999) “Infrastructure concessions, Information flows, and regulatory risk.” Public Policy for the Private Sector Washington DC: The World Bank.
Byrnes, P. (1991). “Estimation of cost frontiers in the presence of selectivity bias: Ownership and efficiency of water utilities.” Advances in Econometrics 9:121–137.
Byrnes, P., S. Grosskopf and K. Hayes (1986). “Efficiency and ownership: Further evidence.” Review of Economics and Statistics. 65:337–341.
Chret, I. (1994). “Managing water: The French model.” Valuing the Environment: Proceedings of the First Annual International Conference on Environmentally Sustainable Development, pp. 80–92. Washington, DC: The World Bank.
Clark, E. and G. Mondello (2000). “Resource management and the mayor’s guarantee in French water allocation.” Environmental and Resource Economics, 15:103–113.
Clarke, George, Claude Ménard, and Ana Maria Zuluaga (2002). “Measuring the welfare effects of reform: Urban water supply in Guinea.” World Development 30, no. 9:1517-37.
40
Colenutt, Dennis and Stuart Holder (1997). “Governance and regulatory regimes for private sector infrastructure development.” Final Report from the National Economic Research Associates for the Asian Development Bank. Manila: Asian Development Bank.
Collignon, Bernard (2002). “Urban water supply innovations in Côte D'ivoire: How cross-subsidies help the poor.” Nairobi, Kenya: Water and Sanitation Program -- Africa.
Cowan Simon (1994). “Privatization and regulation of the water industry in England and Wales.” Privatization and Economic Performance, eds. M. Bishop, J. Kay, and C. May, pp. 112–137. Oxford: Oxford University Press.
Cowan Simon (1997). “Competition in the water industry.” Oxford Review of Economic Policy. Oxford University Press, vol. 13(1), pages 83-92, Spring.
Cowan Simon (1998). “The water industry.” Competition in Regulated Industries, eds. D. Helm and T. Jenkinson, pp. 150–175. Oxford: Oxford University Press.
Crain, W. M. and A. Zardkoohi (1978). “A test of the property-rights theory of the firm: Water utilities in the United States.” Journal of Law and Economics. 21:385–408.
Crampes, Claude, and Antonio Estache (1996). “Regulating water concessions: Lessons from the Buenos Aires concession.”Public Policy for the Private Sector. Washington DC: World Bank.
Cubbin, J. and G Tzanidakis (1998). “Regression versus data envelopment analysis for efficiency measurement: An application to the England and Wales regulated water industry.” Utilities Policy 7:75–85.
Demsetz, H. (1968). “Why regulate utilities?” Journal of Law and Economics 11: 55-65.
Doshi Viren, Gary Schulman and Daniel Gabaldon (2007) “Lights! Water! Motion!” Strategy+Business issue 46, Spring 2007.
Dupont, D. P., R. Q. Grafton, J. Kirkley and D. Squires (2002). “Capacity utilization measures and excess capacity in multi-product privatized fisheries.” Resource Energy Economics. 24:193–210.
Easter, K. W, G. Feder, G. Le Moigne and A. Duda. (1993). Water Resources Management. Washington, DC: The World Bank.
Estache, Antonio, and David Martimort (1998). “Transaction costs, politics, regulatory institutions, and regulatory outcomes.” EDI Regulatory Reform Discussion Paper. Washington DC: World Bank.
Estache, Antonio, and Eugene Kouassi (2002). “Sector organization, governance, and the inefficiency of African water utilities.” World Bank Policy Research Working Paper. Washington, DC: World Bank.
Estache, Antonio, and Martin Rossi (2002). “How different is the efficiency of public and private water companies in Asia?” The World Bank Economic Review, 16(1), 139-148.
Estache, Antonio, Vivien Foster, and Quentin Wodon (2002). Accounting for Poverty in Infrastructure Reform: Learning from Latin America's Experience. Washington DC: World Bank.
Feigenbaum, S. and R Teeples (1983). “Public versus private water delivery: A hedonic cost approach.” Review of Economics and Statistics, 65:672–678.
Fernandez, S. and C.Smith (2006). “Looking for Evidence of Public Employee Opposition to Privatization: An Empirical Study With Implications for Practice.” Review of Public Personnel Administration, 26, 356.
Fox, W. and R. Hofler (1986). “Using homothetic composed error frontiers to measure water utility efficiency.” South African Journal of Economics, 53:461–478. Gassner, Katharina, Alexander Popov and Nataliya Pushak (2008). Does private sector participation improve performance in electricity and water distribution. Washington, DC: The World Bank.
Garcia, S., and T. Alban (2001). “The structure of municipal water supply costs: Application to a panel of French local communities.” Journal of Productivity Analysis, 16:5–29.
Garn, Mike, Jonathan Isham and Satu Kahkonen (2000). “Should we bet on private or public water utilities in Cambodia? Evidence on incentives and performance from seven provincial towns. ” Middlebury College of Economics Discussion Paper No. 02-19. Middlebury.
41
Gentry, Bradford and Auyuan Alethea (2000). “Global Trend in Urban Water Supply and Waste Water Financing and Management: changing Roles for the Public and Private Sector.” Paris: OECD Publications.
Glaeser, Edward L., (2001). “Public Ownership in the American City” Harvard Institute of Economic Research Working Papers (1930). Cambridge.
Glaeser, Edward L. and Andrei Shleifer (2001). “The rise of the regulatory state.” Harvard Institute of Economic Research Working Papers (1934). Cambridge.
Goldberg, Victor P (1976). “Regulation and Administered Contracts.” Bell Journal of Economics, 7(2).
Gordon-Walker S. and S. Marr, (2002). “Study on the application of the competition rules to the water sector in the European Community.” Competition Directorate-General of the European Commission.
Grafton, R. Q., D. Squires and K. J. Fox ( 2000). “Private property and economic efficiency: A study of a common-pool resource.” Journal of Law and Economics, 43:679–713.
Guasch, José Luis (2002). “Concessions of infrastructure services: Incidence and determination of renegotiations - An empirical evaluation and guidelines for optimal concession design.” Washington DC: World Bank.
Guasch, J. Luis, Jean-Jacques Laffont and Stephane Straub (2003). “Renegotiation of concession contracts in Latin America.” World Bank Policy Research Working Paper. Washington DC: World Bank.
Guislain Pierre and Michel Kerf (1996). “Concession - The way to privatize infrastructure sector monopolies.” Public Policy for the Private Sector – Infrastructure. Washington DC: World Bank.
Haggarty, Luke, Penelope Brook and Ana Maria Zuluaga (2002). “Water service contracts in Mexico City, Mexico.” Thirsting for Efficiency: The Economics and Politics of Urban Water System Reform, ed. Mary M. Shirley, 139-88. Oxford UK: Pergamon Press.
Hall, David, and Emanuele Lobina (2002). “Water privatization in Latin America, 2002.” Greenwich, UK: Public Services International Research Unit.
Harris, Clive, John Hodges, Michael Schur and Padmesh Shukla (2003). “Infrastructure projects: A review of cancelled pojects.” Public Policy for the Private Sector. Washington, DC:,World Bank.
Hausman, William, David Kemme and John Neufeld (1986). “The relative economic efficiency of private versus municipal waterworks in the 1890s.” Business and Economic History, Second Series, Volume Fifteen.
Hodge, G. (2000). Privatization: An International Review of Performance. Boulder, CO: Westview Press.
Hunt, L., and E. Lynk (1995). Privatisation and efficiency in the UK water industry: An empirical analysis. Oxford Bulletin of Economics and Statistics, 57:371–388.
Jacobson, C.D. and J.A. Tarr (1993). “Ownership and financing of infrastructure: Historical perspectives.” Paper for the 1994 World Development Report, Policy Research Working Paper 1466, Washington DC: World Bank.
Kay John, Colin Mayer and David Thompson (1986). Privatization and regulation: the UK experience. New York: Oxford University Press.
Kerf, Michel (2000). “Do state holding companies facilitate private participation in the water sector? Evidence from Cote D'Ivoire, the Gambia, Guinea and Senegal.” Policy Research Working Paper. Washington DC: World Bank.
Kessides, Ioannis (2003). “Infrastructure regulation promises, perils and principles.” AEI-Brookings Joint Center for Regulatory Studies. Available at http://aei-brookings.org/admin/authorpdfs/redirect-safely.php?fname=../pdffiles/phpsH.pdf
Kirpatrick, C., D. Parker and Y-F. Zhang (2004). “State versus private sector provision of water wervices in Africa: An empirical analysis.” University of Manchester, Centre on Regulation and Competition, Working Paper Series, Paper No70, June.
Koeppel, G. (2000). Water for Gotham: A History. Princeton: Princeton University Press.
42
Komives, Kristin, and Penelope Brook Cowen (1998). “Expanding sater and sanitation services to low-income households.” Public Policy for the Private Sector. Washington DC: World Bank.
Komives, Kristin (1999). “Designing Pro-Poor Water and Sewer Concessions: Early Lessons from Bolivia.” Policy Research Working Paper. Washington DC: World Bank.
Lambert, D., D. Dichev and K. Raffiee (1993). “Ownership and sources of inefficiency in the provision of water services.” Water Resources Research. 29,6:1573–1578.
Littlechild, S. (1988). “Economic regulation of privatised water authorities and some further reflections.” Oxford Review of Economic Policy, 4:40–68.
Lynk, E. (1993). “Privatisation, joint production and the comparative efficiencies of private and public ownership: The UK water industry.” Fiscal Studies, 14:98–116.
Martin, S. and D. Parker (1997). The impact of privatization: Ownership and corporate performance in the U.K. New York: Routledge Press.
McGuire, R. and R. Ohsfeldt (1986). “Public versus private water delivery: A critical analysis of a hedonic cost approach.” Public Finance Quarterly, 14:339–350.
Megginson, W. and J. Netter (2001). “From state to market: A survey of empirical studies on privatization.” Journal of Economic Literature, 39:321–389.
Ménard C. and S.Saussier (2000). “Contractual choice and performance: The case of water supply in France”. The Economics of Contracts: Theory and Applications, eds. Eric Brousseau and John-Michel Glachant, pp. 440-462. Cambridge, UK: Cambridge University Press.
Ménard, Claude, and George R.G. Clarke (2002a). “Reforming water supply in Abidjan, Côte D'ivoire: A mild reform in a turbulent environment.” Thirsting for Efficiency: The Economics and Politics of Urban Water System Reform. ed. Mary M Shirley, 233-72. Oxford, UK: Pergamon Press.
Ménard, Claude and George R.G. Clarke (2002b). “A transitory regime: Water supply in Conakry, Guinea.” Thirsting for Efficiency: The Economics and Politics of Urban Water System Reform, .ed. Mary M. Shirley, 273-316. Oxford, UK: Pergamon Press.
Morgan, D. (1977). “Investor owned vs. publicly owned water agencies: An evaluation of the property rights theory of the firm.” Water Resources Bulletin, 13:775–781.
Nellis, John (1994) “Is Privatization Necessary?” World Bank Viewpoint, Note 17, May 1994.
Nickson, Andrew (2001a). “The Cordoba Water Concession in Argentina.” Working Paper London: GHK International.
Nickson, Andrew (2001b). “Establishing and Implementing a Joint Venture: Water and Sanitation Services in Cartagena, Colombia.” Working Paper. London: GHK International.
Nickson, Andrew and Claudia Vargas (2002). “The limitations of water regulation: The failure of the Cochabamba Concession in Bolivia.” Bulletin of Latin American Research 21, no. 1: 99-120.
Nickson, Andrew and Richard Franceys (2003). Tapping the market: the challenge of institutional reform in the urban water sector. Basingstoke: Palgrave Macmillan.
Noll, Roger G. (2002). “The economics of urban water systems.” Thirsting for Efficiency: The Economics and Politics of Urban Water System Reform. ed. Mary M. Shirley, 43-64. Oxford UK: Pergamon.
Orwin, A. (1999). Privatization of Water and Wastewater Utilities: An International Survey. Toronto, Canada: Environment Probe.
Palmer Development Group (2000). “PPP and the poor in water and sanitation.” (Interim Findings. Case Study: Queenstown, South Africa.) Loughborough, UK: Water, Engineering and Development Centre, Loughborough University.
Pérard, E. (2007a).Water supply: Public or private? Working paper presented at the conference ‘‘The role of the state in public service delivery’’ at Lee Kuan Yew School of Public Policy, National University of Singapore, September 2007.
Pérard, E. (2007b). Private sector participation and regulatory reform in water supply in the Middle East and North African region. In Presentation at the World Water Week 2007, Stockholm, August 2007.
43

Pérard, E. (2008). Private sector participation and regulatory reform in water supply: The southern Mediterranean experience. OECD Development Centre Working Paper No. 265.
Pérard, E. (2009). “Water supply: Public or private? An approach based on cost of funds, transaction costs, efficiency and political costs” Policy and Society 27: 193-219, doi:10.1016/j.polsoc.2008.10.004
Pitt, M. M., and Lee, L.-F. 1981. The measurement and sources of technical inefficiency in the Indonesian weaving industry. J. Dev. Econ. 9:43–64.
Raffiee, K., R Narayanan, T Harris, D Lambert and J Collins (1993). “Cost analysis of water utilities: A goodness-of-fit approach.” Atlantic Economic Journal. 21:18–29.
Rais, Jorge Carlos, Maria Esther Esquivel and Sergio Sour (2002). "La concesión de los servicios de agua potable y alcantarillado sanitario en Tucumán Republica, Argentina." Washington DC: Public Private Infrastructure Advisory Facility.
Renzetti, S. (1999). “Municipal water supply and sewage treatment: Costs, prices and distortions.” Canadian Journal of Economics, 32:688–704.
Renzetti, S., and Dupont, D. (2003). “Ownership and performance of water utilities”. Greener Management International, 42, 9–19.
Rivera, D. (1996). Private Sector Participation in the Water Supply and Wastewater Sector: Lessons from Six Developing Countries. Washington DC: World Bank.
Rosa, Jean-Jacques, (1993), “Nationalization, Privatization, and the Allocation of Financial Property Rights”, Public Choice, Vol. 75, 317-337.
Rosa, Jean-Jacques, (1997), “Public Choice Aspects of Privatization Policies: Driving Forces and Obstacle”, in Herbert Giersch (ed.), Privatization at the End of the Century, Berlin: Springer.
Rosa, Jean-Jacques and Edouard Perard (2007) “Why privatize? A competition for ownership approach”, presented at the conference “The Role of the State in Public Service Delivery” at Lee Kuan Yew School Of Public Policy, National University of Singapore, September 2007 and at the Paris International Finance Meeting AFFI-EUROFIDAI, December 2007.
Saal, D. and D Parker (2000). “The impact of privatization and regulation on the water and sewerage industry in England and Wales: A translog cost function model.” Managerial and Decision Economics, 21:253–268.
Saal, D. and D Parker (2001). “Productivity and price performance in the privatized water and sewerage companies of England and Wales.” Journal of Regulatory Economics, 20:61–90.
Salatiel, Gustavo (2003). “La participación del sector privado en los servicios de agua y saneamiento en la provincia de Salta en Argentina. ” International American Development Bank, Working Paper (Banco Interamericano de Desarrollo, Departamento de Desarrollo Sostenible), Washington DC: IDB.
Sawkins, J. (2001). “The development of competition in the English and Welsh water and sewerage industry.” Fiscal Studies, 22:189–215.
Sclar, Elliott (2000). You Don’t Always Get What You are Paying For: The Economics of Privatization. Ithaca, NY: Cornell University Press.
Shaoul, J. (1997). “A critical financial analysis of the performance of privatized industries: The case of the water industry in England and Wales.” Critical Perspectives, 8:479–505.
Shirley, Mary and Patrick Walsh (2000). “Public versus private ownership: The current state of the debate.” World Bank Policy Research Working Paper 2420. Washington DC: World Bank.
Shirley, Mary M. (2002). ed. Thirsting for Efficiency: The Economics and Politics of Urban Water System Reform. Oxford, UK: Pergamon Press.
Shleifer, Andrei (1998) “State versus Private Ownership.” Journal of Economic Perspectives, 12(4).
Shleifer, Andrei and Robert W.Vishny (1994). “Politicians and firms.” The Quarterly Journal of Economics, Vol. 109, Issue 4, 995-1025.
Spulber, N. and A.Sabbaghi (1998). Economics of Water Resources: From Regulation to Privatization, 2nd ed. Boston: Kluwer Academic.
44

Stiggers, David (1999). “Private Participation in Water and Wastewater Services in Trinidad and Tobago.” Can Privatization Deliver? Infrastructure for Latin America. Eds. Federico Basañes, Evamaría Uribe and Robert Willig, Washington DC: Inter-American Development Bank.
Stone and Webster, Inc. 2004. “The Hashemite Kingdom of Jordan: Assessment of Options for the Regulatory Reform of the Water and Wastewater Sector. Sector Review and Restructuring Options Report.” Stone and Webster, Inc., Boston.
Teeples, R. and D Glyer (1987a). “Production functions for water delivery systems: Analysis and estimation using dual cost function and implicit price specifications.” Water Resources Research, 23:765–773.
Teeples, R. and D Glyer (1987b). “Cost of water delivery systems: Specification and ownership effects.” Review of Economics and Statistics, 69:399–408.
Trémolet, Sophie and Joanna Neale (2002). “Emerging lessons in private provision of infrastructure services in rural areas: Water and electricity services in Gabon.” Washington DC: World Bank/Public Private Infrastructure Advisory Facility (PPIAF).
Trémolet, Sophie, Sara Browning and Charlotte Howard (2002). “Emerging lessons in private provision of infrastructure services in rural areas: Water services in Côte d’Ivoire and Senegal.” Washington DC: World Bank/ Public Private Infrastructure Advisory Facility (PPIAF).
Trémolet, Sophie (2002). “Multi-utilities and access.“ Public Policy for the Private Sector. Washington DC: World Bank.
Tynan, Nicola (2000). “Private participation in infrastructure and the poor: Water and sanitation.“ Public Private Infrastructure Advisory Facility (PPIAF) Conference Infrastructure for Development (31 May-2 June),London.
Vickers, John and George Yarrow (1988). Privatization: An Economic Analysis. Cambridge: The MIT Press.
Vickers, John and George Yarrow (1991). “Economic Perspectives on Privatization.” Journal of Economic Perspectives, 5(2).
Wallsten, S. and K.Kosec (2005). “Public or private drinking water? The effects of ownership and benchmark competition on US water system regulatory compliance and household water expenditures” Working Paper 05-05 AEI-Brookings Joint Center for Regulatory Studies.
Williamson, O.E. (1976). “Franchising bidding for natural monopolies-in general and with the respect to CATV.” Bell Journal of Economics, 7: 73-104.
Yarrow, George (1986) “Privatization in Theory and Practice.” Economic Policy, vol. 2, April 1986.
45