water supply – detailed precipitation and hydrologic analysis · 2008-03-31 · water supply –...
TRANSCRIPT

Water supply – detailed precipitation and hydrologic analysis
1. Hydrometric stations – instrumentation and monitoring procedures:There is only one established, federally operated hydrometric station in the area: on St. Mary's Riverat Stillwater, roughly 24 km west of Goldboro. Data from it cannot be easily applied to the Isaac'sHarbour River watershed, as the St. Mary's River watershed is much larger than the Isaac's HarbourRiver watershed, topography is different, as is the bedrock type at the upper reaches of the St.Mary's watershed.
In an effort to properly assess the characteristics of the Isaacs Harbour River and the Gold Brookwatersheds, four hydrometric stations were installed in the vicinity of the proposed Keltic plant siteand operated from November 2001 through to May 2003. Three were installed on the Gold brooksystem: one (GB1) at a tributary to Gold Brook Lake from Oak Hill Lake, another (GB2) in GoldBrook a short distance below Gold Brook Lake, and the third (GB3) in Gold Brook just above SealHarbour Lake. The fourth stream gaging station (ML1) was installed on the Issac's Harbour Riverjust below Meadow Lake where the gas pipeline crosses the river.
The stations were established using Global Water model WL14 data loggers and pressuretransducers (0 to 4.5m, vented for automatic barometric compensation) placed as deep as possible ateach stream location. For protection the transducers were placed inside schedule 40 PVC screens,except at GB1 where the transducer was jammed in a joint in a culvert under the road. The dataloggers were placed inside PVC tubing with caps for protection. They were programmed to recordstream water depth every 30 minutes.
Streamflow was estimated using:Q=VA
Stream profiles at stations GB2, GB3 and ML1 were obtained using totalstation survey gear, and atGB1 the crosssection of the culvert was assumed to be circular with a diameter of 1.68 m. At theML1, GB1 and GB2 stream locations, flowvelocity (measured using Global Water model FP101Flow Probe), streamdepth and lake level (ML1 and GB2 only) were measured and recorded 45times at high and low stream stages and before and after major precipitation events betweenNovember 2001 and April 2003.
In order to estimate a flow value for each of the 45 measurement days, the wet crosssectional areaof the channel was calculated for each of those days. At ML1, GB2 and GB3 the crosssectional areawas calculated by dividing the channel into a series of slivers defined by the location of each streamprofile station. The height of water at each profile station was determined using measured depth andstation elevation (see Figures 1, 4 and 7). The shape of each sliver was assumed to be trapezoidaland the area of each was calculated. The sum of the sliverareas equals the total crosssectional areaof the channel.
At the time each velocity measurement was taken in the field, the channel was divided into equallyspaced panels and average velocity was measured by sweeping the probe from top to bottom acrosseach panel. At GB2 and GB3 the channel was divided into two panels and two average velocity
earthwater Concepts inc. — for Keltic Petrochemicals Inc., Dec. 2005 page 1 of 34

readings were taken. At ML1 the channel was divided into four panels and four average velocitymeasurements were made. The crosssectional area of each panel was then calculated based on theassumption that at the time of every manual depth measurement, the channel width was equallydivided into the same number of panels.
Isaacs Harbour River (ML1)The stream profile at station ML1 on the Isaacs Harbour River is shown in Figure 1 below.
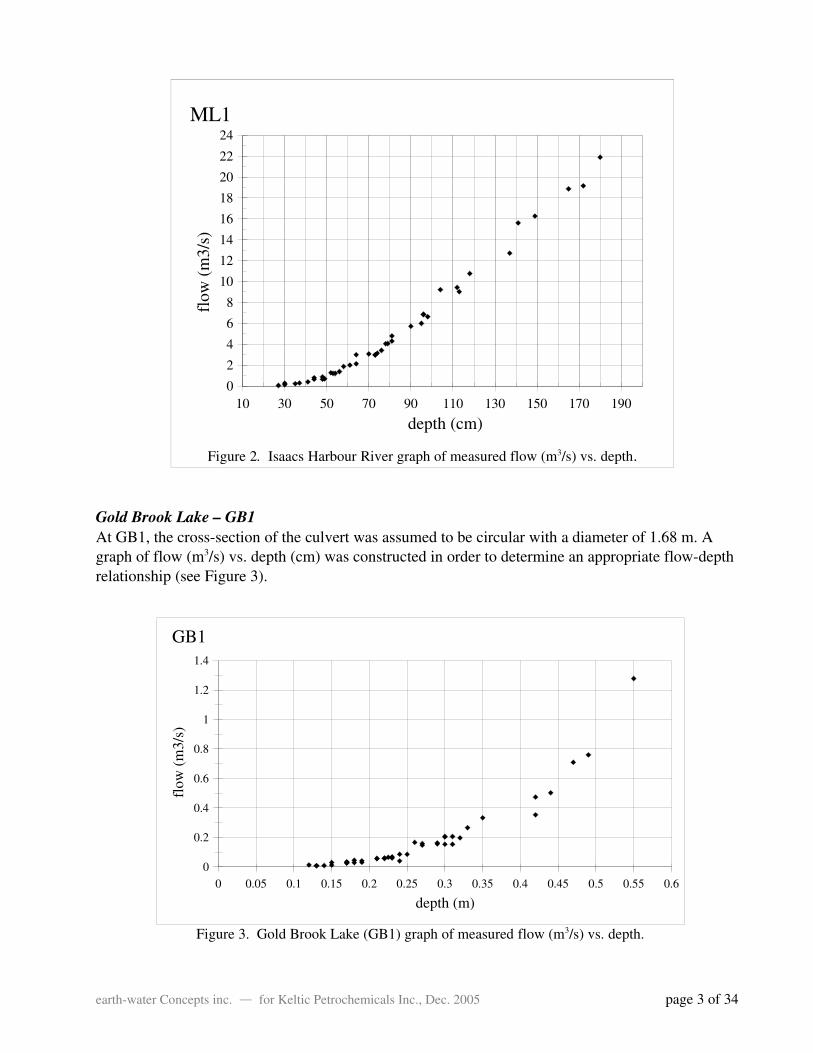
A graph of flow (m3/s) vs. depth (cm) was constructed in order to determine an appropriate flowdepth relationship (see Figure 2).
Two flowdepth relationships are necessary to describe the stream because of a “thresholdcondition” occurring at about 64 cm depth. For depth values less than or equal to 64 cm, the flowdepth relationship is best described with a power function and for those greater than 64 cm, the trendis linear. Several relationships were tested and the following were chosen because of the overall fitto both the upper and lower sections of the curve:
d≤64 cm Q=7.33 x10⁻⁸ d 4.1430
d64 cm Q=0.153 d−7.562126
earthwater Concepts inc. — for Keltic Petrochemicals Inc., Dec. 2005 page 2 of 34
Figure 1. Crosssection of the Isaacs Harbour River at ML1.
0.00 0.50 1.00 1.50 2.00 2.50 3.00 3.50 4.00 4.50 5.00 5.50 6.00 6.50 7.00 7.50 8.00 8.50 9.00 9.50 10.00 10.50 11.00 11.50 12.00 12.50 13.00 13.50
28.00
28.50
29.00
29.50
30.00
30.50
Isaacs Harbour River cross-section
station distance (m)
elev
atio
n (m
)
Gold Brook Lake – GB1At GB1, the crosssection of the culvert was assumed to be circular with a diameter of 1.68 m. Agraph of flow (m3/s) vs. depth (cm) was constructed in order to determine an appropriate flowdepthrelationship (see Figure 3).
earthwater Concepts inc. — for Keltic Petrochemicals Inc., Dec. 2005 page 3 of 34
Figure 2. Isaacs Harbour River graph of measured flow (m3/s) vs. depth.
10 30 50 70 90 110 130 150 170 1900
2
4
6
8
10
12
14
16
18
20
22
24ML1
depth (cm)
flow
(m3/
s)
Figure 3. Gold Brook Lake (GB1) graph of measured flow (m3/s) vs. depth.
0 0.05 0.1 0.15 0.2 0.25 0.3 0.35 0.4 0.45 0.5 0.55 0.60
0.2
0.4
0.6
0.8
1
1.2
1.4
GB1
depth (m)
flow
(m3/
s)
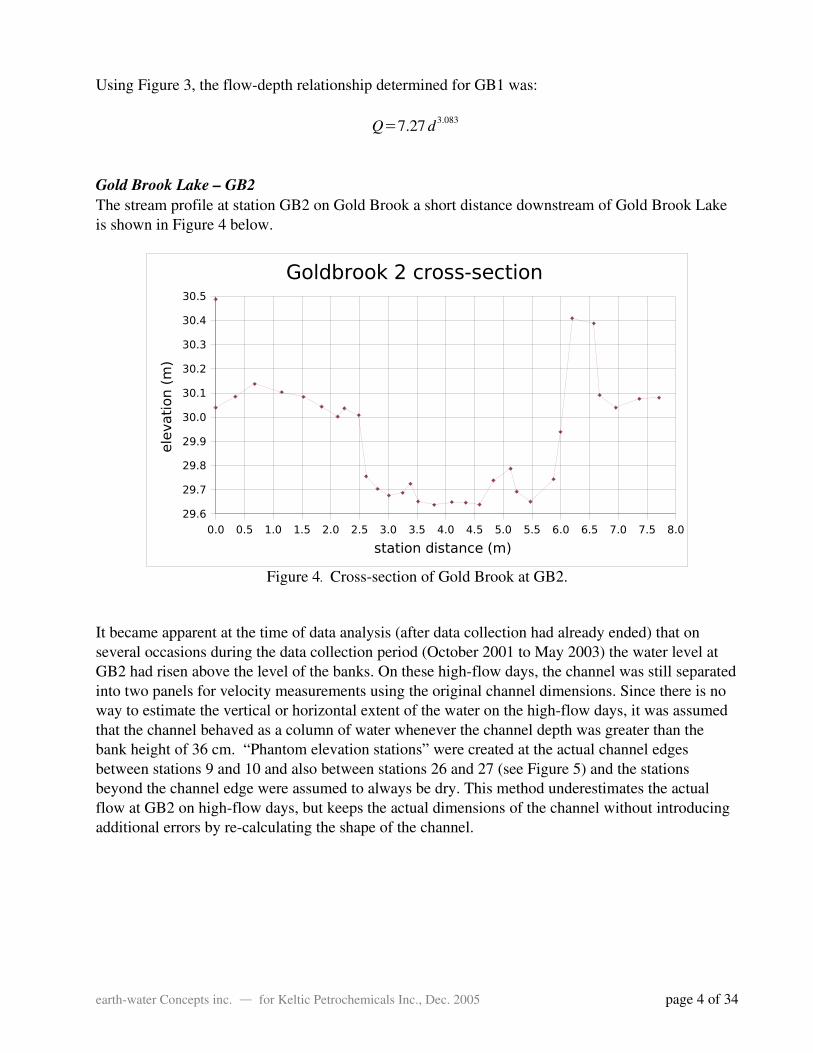
Using Figure 3, the flowdepth relationship determined for GB1 was:
Q=7.27 d3.083
Gold Brook Lake – GB2The stream profile at station GB2 on Gold Brook a short distance downstream of Gold Brook Lakeis shown in Figure 4 below.
It became apparent at the time of data analysis (after data collection had already ended) that onseveral occasions during the data collection period (October 2001 to May 2003) the water level atGB2 had risen above the level of the banks. On these highflow days, the channel was still separatedinto two panels for velocity measurements using the original channel dimensions. Since there is noway to estimate the vertical or horizontal extent of the water on the highflow days, it was assumedthat the channel behaved as a column of water whenever the channel depth was greater than thebank height of 36 cm. “Phantom elevation stations” were created at the actual channel edgesbetween stations 9 and 10 and also between stations 26 and 27 (see Figure 5) and the stationsbeyond the channel edge were assumed to always be dry. This method underestimates the actualflow at GB2 on highflow days, but keeps the actual dimensions of the channel without introducingadditional errors by recalculating the shape of the channel.
earthwater Concepts inc. — for Keltic Petrochemicals Inc., Dec. 2005 page 4 of 34
Figure 4. Crosssection of Gold Brook at GB2.
0.0 0.5 1.0 1.5 2.0 2.5 3.0 3.5 4.0 4.5 5.0 5.5 6.0 6.5 7.0 7.5 8.0
29.6
29.7
29.8
29.9
30.0
30.1
30.2
30.3
30.4
30.5
Goldbrook 2 cross-section
station distance (m)
ele
vati
on (
m)
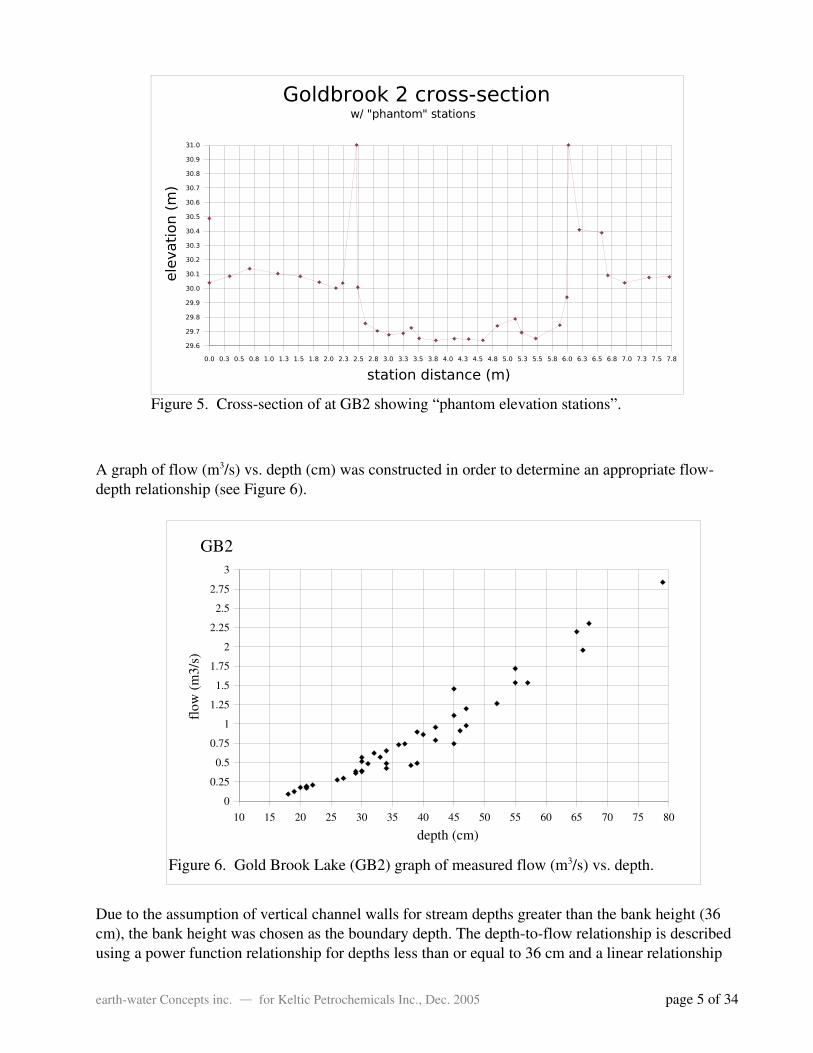
A graph of flow (m3/s) vs. depth (cm) was constructed in order to determine an appropriate flowdepth relationship (see Figure 6).
Due to the assumption of vertical channel walls for stream depths greater than the bank height (36cm), the bank height was chosen as the boundary depth. The depthtoflow relationship is describedusing a power function relationship for depths less than or equal to 36 cm and a linear relationship
earthwater Concepts inc. — for Keltic Petrochemicals Inc., Dec. 2005 page 5 of 34
Figure 5. Crosssection of at GB2 showing “phantom elevation stations”.
Figure 6. Gold Brook Lake (GB2) graph of measured flow (m3/s) vs. depth.
10 15 20 25 30 35 40 45 50 55 60 65 70 75 800
0.25
0.5
0.75
1
1.25
1.5
1.75
2
2.25
2.5
2.75
3
GB2
depth (cm)
flow
(m3/
s)
0.0 0.3 0.5 0.8 1.0 1.3 1.5 1.8 2.0 2.3 2.5 2.8 3.0 3.3 3.5 3.8 4.0 4.3 4.5 4.8 5.0 5.3 5.5 5.8 6.0 6.3 6.5 6.8 7.0 7.3 7.5 7.8
29.6
29.7
29.8
29.9
30.0
30.1
30.2
30.3
30.4
30.5
30.6
30.7
30.8
30.9
31.0
Goldbrook 2 cross-sectionw/ "phantom" stations
station distance (m)
ele
vati
on (
m)
for depths greater than 36 cm. This division is confirmed by studying the graphical relationshipbetween depth and flow (see Figure 6). Several relationships were tested and the following werechosen because of the overall fit to both the upper and lower sections of the curve:
d≤36 cm Q=6.2 x10⁻⁵ d 2.580
d36 cm Q=0.0520 d−1.229827
Gold Brook – GB3The stream profile at station GB3 on Gold Brook is shown in Figure 7 below.
On several highflow occasions, it was noted that the stream formed several channels upstream ofthe measurement site, which resulted in overbank leakage at GB3. Therefore the depth and velocitymeasurements do not accurately represent the conditions at GB3, particularly on days when highflows were present. Because of this and the damage incurred by the data logger placed at ML1 on 04March 2002, the data logger at GB3 was removed on 09 March 2002 and placed at ML1 for theremainder of the datacollection period.
A graph of flow (m3/s) vs. depth (cm) was constructed in order to determine an appropriate flowdepth relationship (see Figure 8)
earthwater Concepts inc. — for Keltic Petrochemicals Inc., Dec. 2005 page 6 of 34
Figure 7. Crosssection of Gold Brook at GB3.
0.00 0.25 0.50 0.75 1.00 1.25 1.50 1.75 2.00 2.25 2.50 2.75 3.00 3.25 3.50 3.75
29.40
29.50
29.60
29.70
29.80
29.90
30.00
30.10
30.20
30.30
30.40
30.50
Goldbrook 3 cross-section
station distance (m)
ele
vati
on (
m)

Figure 8. Gold Brook Lake (GB3) graph of measured flow (m3/s) vs. depth (cm)
Three points which are considered outliers are shown as open circles in Figure 8. These pointsrepresent measurements made during highdepth conditions. The highdepth conditions shouldcorrespond to highflow conditions, but that is not the case for these three points, likely due to overbank leakage which occurred on many occasions during highflows. These three points were notused in the determination of the flow/depth relationship.
The following power function was determined to be the best relationship between depth and flow:
Q=1.25 x10⁻⁶ d3.315
Gagedepth calibration The manual flow and depth measurements were made at the same location (at the measured streamprofile) every time, but these measurement could not be made directly at the pressure transducerlocation and so the depths recorded from both instruments could not be the same. Therefore, toapply proper flow/depth relationships to the depths recorded by the data logger at each site, therelationship between the data logger depth values and the manuallymeasured depth values wasdetermined for each site. Also, the data logger clock did not account for time changes (daylightsavings), and so an average of instantaneous pressure transducer depth measurements taken withinone hour of the manual measurement was used as the equivalent value. In this way each manualmeasurement had an equivalent data logger measurement, and a linear relationship between the twocould be determined.
At ML1 two data loggers were used to collect streamdepth data. The first was installed on 29September 2001 and removed on 04 March 2002 when, because of rising stream levels, the datalogger became submerged and stopped operating. The second data logger unit, which had originally
earthwater Concepts inc. — for Keltic Petrochemicals Inc., Dec. 2005 page 7 of 34
10 15 20 25 30 35 40 45 50 55 60 65 70 75 80 85 90 95
0
0.25
0.5
0.75
1
1.25
1.5
1.75
2
2.25
2.5
2.75
3
3.25
3.5
GB3
depth (cm)
flow
(m3/
s)
been placed at GB3, was installed at ML1 on 13 March 2002 and remained in place until May 2003.Since the two data loggers at ML1 could not be placed at exactly the same location within thestream, two data logger–measured depth relationships were determined, as follows:
29 September 2001 to 04 March 2002 dc = 1.38 dd – 23.73
13 March 2002 to 24 May 2003 dc = 1.19 dd – 0.67
where dc is corrected depth in cm, and dd is data logger depth in cm. The data logger relationshipsfor the GB1, GB2 and GB3 in the Gold Brook watershed were:
dc = 1.07 dd + 10.01
dc = 1.22 dd + 2.61
and dc = 0.98 dd + 19.73
At the time of installation, each data logger was calibrated, and so the relationships betweenmeasured depths and data logger depths should theoretically be 1:1. The equations above show thatthis is in fact the case as all relationships have a slope which is very close to 1. The yinterceptsrepresent the depth at which the data logger was installed at each site.
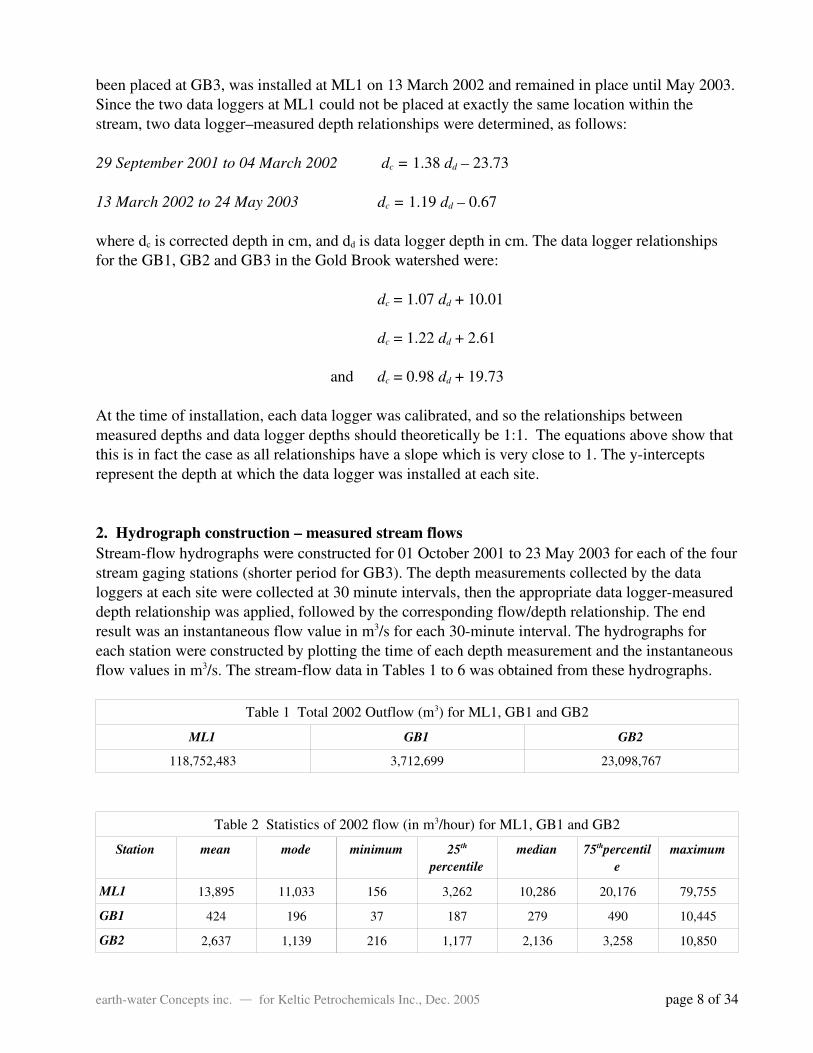
2. Hydrograph construction – measured stream flowsStreamflow hydrographs were constructed for 01 October 2001 to 23 May 2003 for each of the fourstream gaging stations (shorter period for GB3). The depth measurements collected by the dataloggers at each site were collected at 30 minute intervals, then the appropriate data loggermeasureddepth relationship was applied, followed by the corresponding flow/depth relationship. The endresult was an instantaneous flow value in m3/s for each 30minute interval. The hydrographs foreach station were constructed by plotting the time of each depth measurement and the instantaneousflow values in m3/s. The streamflow data in Tables 1 to 6 was obtained from these hydrographs.
Table 1 Total 2002 Outflow (m3) for ML1, GB1 and GB2
ML1 GB1 GB2
118,752,483 3,712,699 23,098,767
Table 2 Statistics of 2002 flow (in m3/hour) for ML1, GB1 and GB2
Station mean mode minimum 25th
percentilemedian 75thpercentil
emaximum
ML1 13,895 11,033 156 3,262 10,286 20,176 79,755
GB1 424 196 37 187 279 490 10,445
GB2 2,637 1,139 216 1,177 2,136 3,258 10,850
earthwater Concepts inc. — for Keltic Petrochemicals Inc., Dec. 2005 page 8 of 34
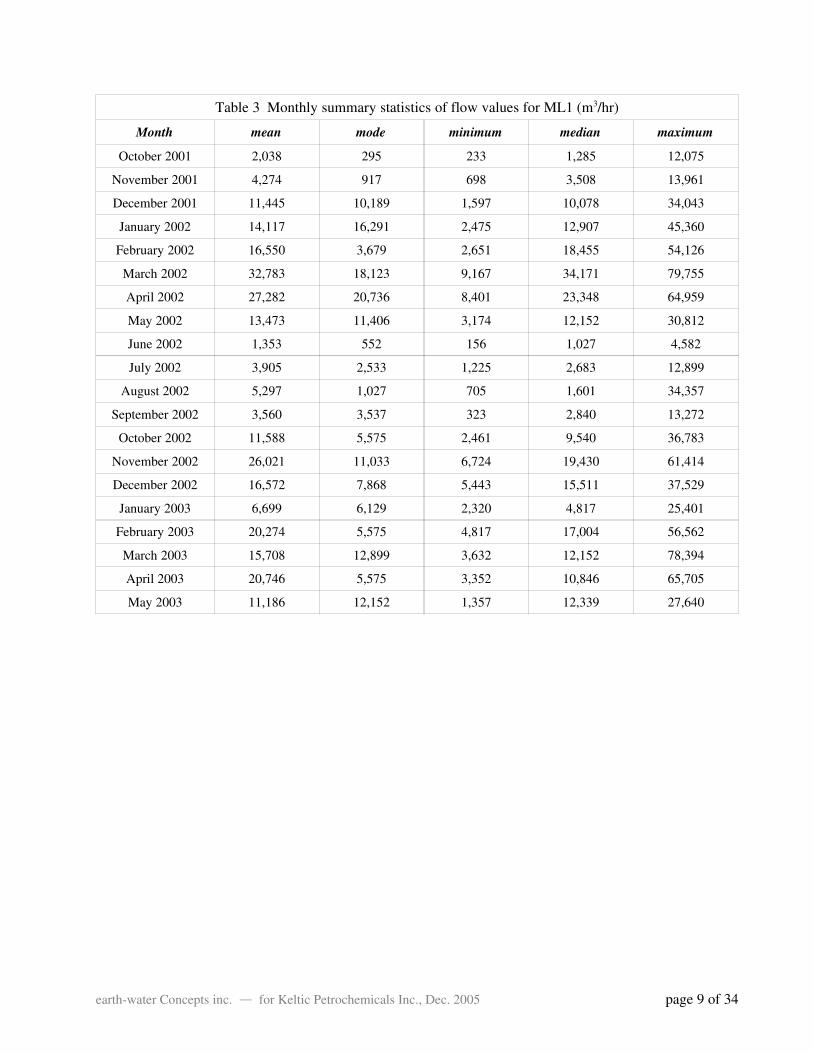
Table 3 Monthly summary statistics of flow values for ML1 (m3/hr)
Month mean mode minimum median maximum
October 2001 2,038 295 233 1,285 12,075
November 2001 4,274 917 698 3,508 13,961
December 2001 11,445 10,189 1,597 10,078 34,043
January 2002 14,117 16,291 2,475 12,907 45,360
February 2002 16,550 3,679 2,651 18,455 54,126
March 2002 32,783 18,123 9,167 34,171 79,755
April 2002 27,282 20,736 8,401 23,348 64,959
May 2002 13,473 11,406 3,174 12,152 30,812
June 2002 1,353 552 156 1,027 4,582
July 2002 3,905 2,533 1,225 2,683 12,899
August 2002 5,297 1,027 705 1,601 34,357
September 2002 3,560 3,537 323 2,840 13,272
October 2002 11,588 5,575 2,461 9,540 36,783
November 2002 26,021 11,033 6,724 19,430 61,414
December 2002 16,572 7,868 5,443 15,511 37,529
January 2003 6,699 6,129 2,320 4,817 25,401
February 2003 20,274 5,575 4,817 17,004 56,562
March 2003 15,708 12,899 3,632 12,152 78,394
April 2003 20,746 5,575 3,352 10,846 65,705
May 2003 11,186 12,152 1,357 12,339 27,640
earthwater Concepts inc. — for Keltic Petrochemicals Inc., Dec. 2005 page 9 of 34

Table 4 Monthly statistics of flows for GB1 (in m3/hour)
Month mean mode minimum median maximum
October 2001 278 235 132 235 1,195
November 2001 383 302 246 315 913
December 2001 452 235 215 368 1,531
January 2002 528 235 215 441 2,238
February 2002 836 279 246 490 10,445
March 2002 638 279 37 382 5,887
April 2002 607 659 179 474 4,710
May 2002 362 215 187 302 790
June 2002 253 162 126 215 701
July 2002 261 196 106 225 618
August 2002 173 126 50 119 1,164
September 2002 179 50 43 126 723
October 2002 330 154 119 225 2,192
November 2002 640 279 162 382 4,867
December 2002 320 196 154 235 1,019
January 2003 239 179 95 162 1,226
February 2003 578 279 132 327 3,637
March 2003 560 196 89 246 6,839
April 2003 149 79 46 119 1,047
May 2003 111 65 22 106 279
earthwater Concepts inc. — for Keltic Petrochemicals Inc., Dec. 2005 page 10 of 34
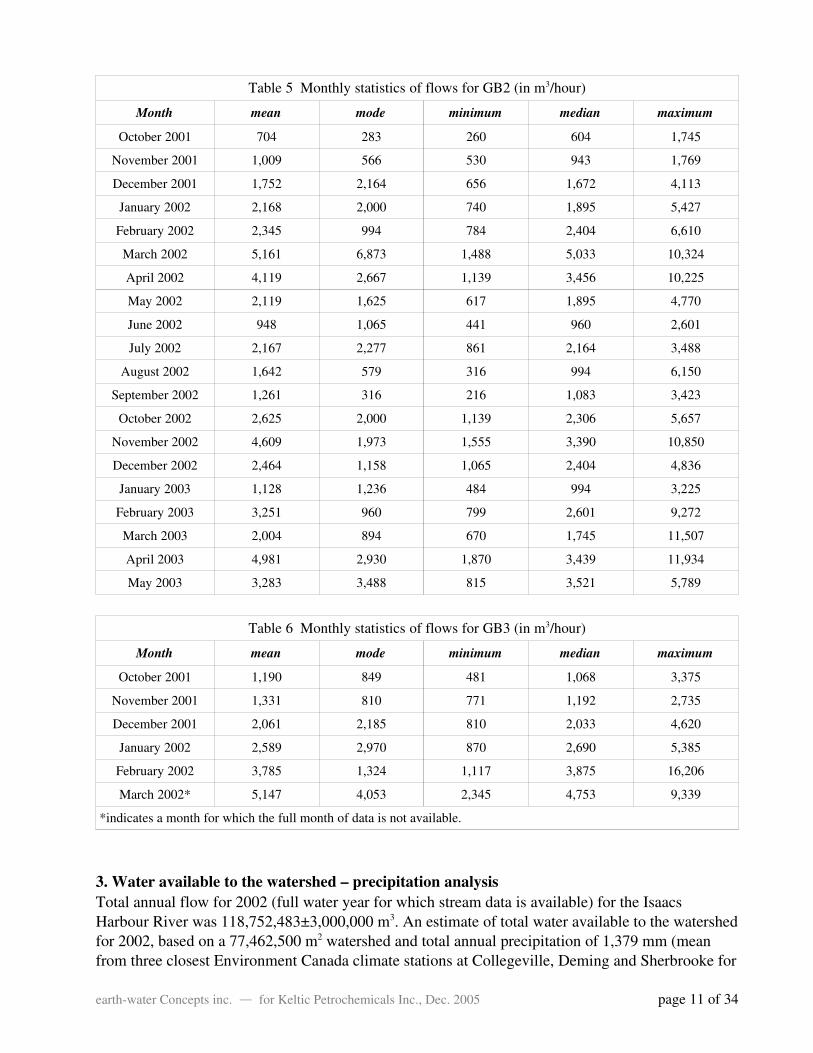
Table 5 Monthly statistics of flows for GB2 (in m3/hour)
Month mean mode minimum median maximum
October 2001 704 283 260 604 1,745
November 2001 1,009 566 530 943 1,769
December 2001 1,752 2,164 656 1,672 4,113
January 2002 2,168 2,000 740 1,895 5,427
February 2002 2,345 994 784 2,404 6,610
March 2002 5,161 6,873 1,488 5,033 10,324
April 2002 4,119 2,667 1,139 3,456 10,225
May 2002 2,119 1,625 617 1,895 4,770
June 2002 948 1,065 441 960 2,601
July 2002 2,167 2,277 861 2,164 3,488
August 2002 1,642 579 316 994 6,150
September 2002 1,261 316 216 1,083 3,423
October 2002 2,625 2,000 1,139 2,306 5,657
November 2002 4,609 1,973 1,555 3,390 10,850
December 2002 2,464 1,158 1,065 2,404 4,836
January 2003 1,128 1,236 484 994 3,225
February 2003 3,251 960 799 2,601 9,272
March 2003 2,004 894 670 1,745 11,507
April 2003 4,981 2,930 1,870 3,439 11,934
May 2003 3,283 3,488 815 3,521 5,789
Table 6 Monthly statistics of flows for GB3 (in m3/hour)
Month mean mode minimum median maximum
October 2001 1,190 849 481 1,068 3,375
November 2001 1,331 810 771 1,192 2,735
December 2001 2,061 2,185 810 2,033 4,620
January 2002 2,589 2,970 870 2,690 5,385
February 2002 3,785 1,324 1,117 3,875 16,206
March 2002* 5,147 4,053 2,345 4,753 9,339
*indicates a month for which the full month of data is not available.
3. Water available to the watershed – precipitation analysisTotal annual flow for 2002 (full water year for which stream data is available) for the IsaacsHarbour River was 118,752,483±3,000,000 m3. An estimate of total water available to the watershedfor 2002, based on a 77,462,500 m2 watershed and total annual precipitation of 1,379 mm (meanfrom three closest Environment Canada climate stations at Collegeville, Deming and Sherbrooke for
earthwater Concepts inc. — for Keltic Petrochemicals Inc., Dec. 2005 page 11 of 34
January to December 2002), is 106,820,787 m3. This suggests that about 11 percent more water waspresent as stream discharge at ML1, than was available as total precipitation falling onto the Isaac'sHarbour River watershed for the year 2002. It was clear from this that using simple means from thenearest climate stations would not produce reliable data for the Keltic water supply and so a study ofthe precipitation at the watershed was initiated in order to better understand the water balance in thearea and, therefore, total quantity of water moving through the watershed system.
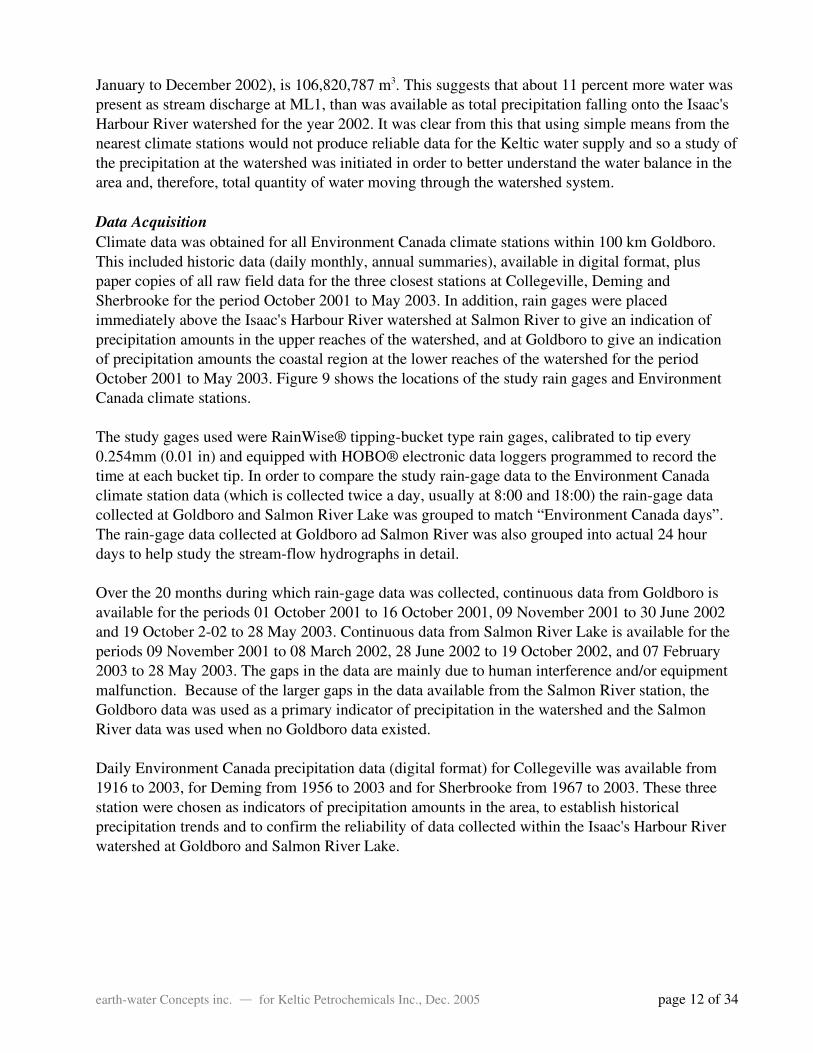
Data AcquisitionClimate data was obtained for all Environment Canada climate stations within 100 km Goldboro.This included historic data (daily monthly, annual summaries), available in digital format, pluspaper copies of all raw field data for the three closest stations at Collegeville, Deming andSherbrooke for the period October 2001 to May 2003. In addition, rain gages were placedimmediately above the Isaac's Harbour River watershed at Salmon River to give an indication ofprecipitation amounts in the upper reaches of the watershed, and at Goldboro to give an indicationof precipitation amounts the coastal region at the lower reaches of the watershed for the periodOctober 2001 to May 2003. Figure 9 shows the locations of the study rain gages and EnvironmentCanada climate stations.
The study gages used were RainWise® tippingbucket type rain gages, calibrated to tip every0.254mm (0.01 in) and equipped with HOBO® electronic data loggers programmed to record thetime at each bucket tip. In order to compare the study raingage data to the Environment Canadaclimate station data (which is collected twice a day, usually at 8:00 and 18:00) the raingage datacollected at Goldboro and Salmon River Lake was grouped to match “Environment Canada days”.The raingage data collected at Goldboro ad Salmon River was also grouped into actual 24 hourdays to help study the streamflow hydrographs in detail.
Over the 20 months during which raingage data was collected, continuous data from Goldboro isavailable for the periods 01 October 2001 to 16 October 2001, 09 November 2001 to 30 June 2002and 19 October 202 to 28 May 2003. Continuous data from Salmon River Lake is available for theperiods 09 November 2001 to 08 March 2002, 28 June 2002 to 19 October 2002, and 07 February2003 to 28 May 2003. The gaps in the data are mainly due to human interference and/or equipmentmalfunction. Because of the larger gaps in the data available from the Salmon River station, theGoldboro data was used as a primary indicator of precipitation in the watershed and the SalmonRiver data was used when no Goldboro data existed.
Daily Environment Canada precipitation data (digital format) for Collegeville was available from1916 to 2003, for Deming from 1956 to 2003 and for Sherbrooke from 1967 to 2003. These threestation were chosen as indicators of precipitation amounts in the area, to establish historicalprecipitation trends and to confirm the reliability of data collected within the Isaac's Harbour Riverwatershed at Goldboro and Salmon River Lake.
earthwater Concepts inc. — for Keltic Petrochemicals Inc., Dec. 2005 page 12 of 34

Data validationFor the period October 2001 to May 2003, the data collected at Goldboro was compared to dailyprecipitation data for Deming and Sherbrooke. These two were selected for the validation processbecause the coastal conditions at these two stations most resemble coastal conditions at Goldboro.
For each day data was available, the Goldboro data was examined in terms of quantity of rainrecorded and the timing of the precipitation. If the precipitation at Goldboro was confirmed by eitherof these two Environment Canada climate stations, it was considered a valid reading. If not, thestreamflow hydrographs were examined for the same period and if the streamflow response withina few days of the supposed precipitation seemed to confirm the occurrence of precipitation, then itwas also considered valid precipitation. Precipitation falling as snow was generally found to meltshortly after each event and, therefore, tipping bucket readings generally matched the EnvironmentCanada rainfall equivalent for each snowfall event. There was no doubt moisture loss due tosublimation before snow melted, but this would likely not account for any large errors.
Precipitation recorded on 28, 29 and 30 June 2002 was the only Goldboro data found to beerroneous. On 28 June 2002, the data from 09 March 2002 to 28 June 2002 was downloaded at12:30. This data included 10.92 mm (0.43 in) recorded on 28 June 2002. After the download,between 28 June 2002 at 12:34 up until 30 June 2002 at 18:50, the rain gage at Goldboro recordedan additional 113.54 mm (4.47 in) of precipitation. This amount was not confirmed by any of thethree nearby stations nor by the streamflow response on the hydrographs. This suggested thatsomeone may have tampered with the rain gage, possibly dumping water into it. The data wasadjusted accordingly and the additional 113.54 mm (4.47 in) was not used in calculations.
earthwater Concepts inc. — for Keltic Petrochemicals Inc., Dec. 2005 page 13 of 34
Figure 9. Locations of study rain gages and EC climate stations.
The data collected at Salmon River was analyzed for the period during which no data fromGoldboro was available (28 June 2002 to 19 October 2002) and was compared to Collegeville datasince both stations are located inland. The Salmon River data appears to match Collegeville data interms of timing of precipitation events, but not in terms of quantity recorded. The precipitationamounts recorded at Salmon River for the months of July, August and September (complete monthsduring which data was collected) seem to be significantly lower than the amounts recorded atCollegeville. The total precipitation for September (4.57 mm (0.18 in) was so low that it wasconsidered unusable.
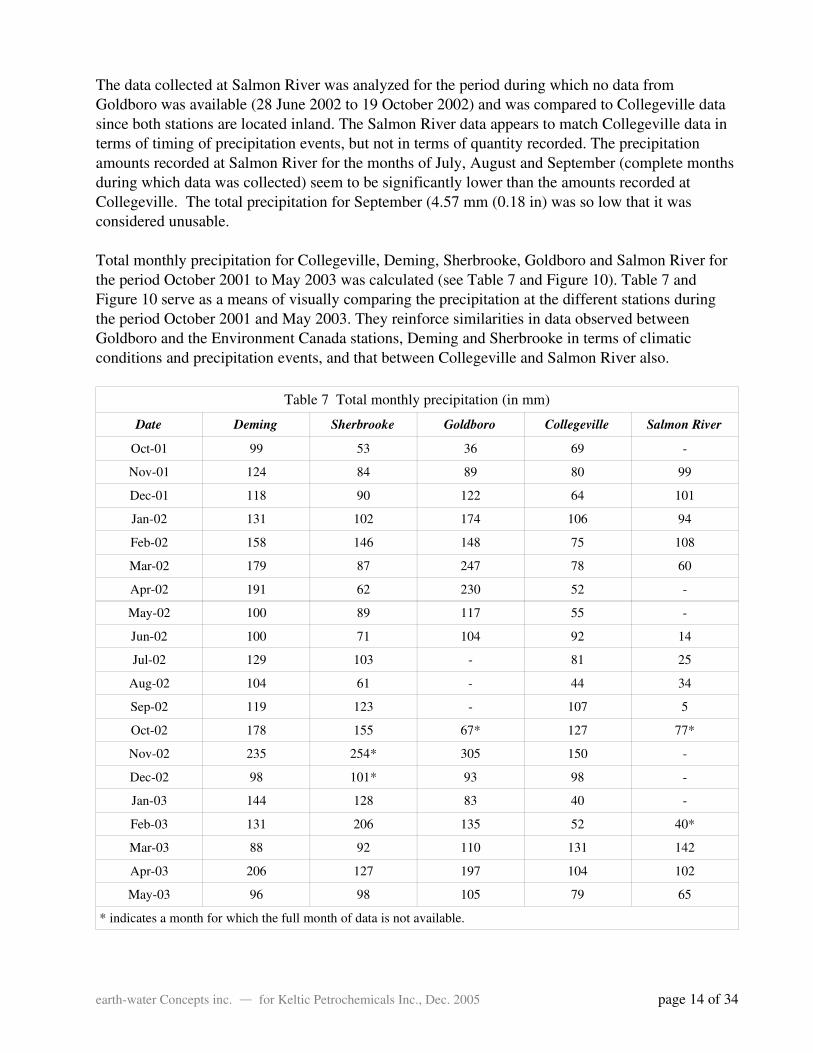
Total monthly precipitation for Collegeville, Deming, Sherbrooke, Goldboro and Salmon River forthe period October 2001 to May 2003 was calculated (see Table 7 and Figure 10). Table 7 andFigure 10 serve as a means of visually comparing the precipitation at the different stations duringthe period October 2001 and May 2003. They reinforce similarities in data observed betweenGoldboro and the Environment Canada stations, Deming and Sherbrooke in terms of climaticconditions and precipitation events, and that between Collegeville and Salmon River also.
Table 7 Total monthly precipitation (in mm)
Date Deming Sherbrooke Goldboro Collegeville Salmon River
Oct01 99 53 36 69
Nov01 124 84 89 80 99
Dec01 118 90 122 64 101
Jan02 131 102 174 106 94
Feb02 158 146 148 75 108
Mar02 179 87 247 78 60
Apr02 191 62 230 52
May02 100 89 117 55
Jun02 100 71 104 92 14
Jul02 129 103 81 25
Aug02 104 61 44 34
Sep02 119 123 107 5
Oct02 178 155 67* 127 77*
Nov02 235 254* 305 150
Dec02 98 101* 93 98
Jan03 144 128 83 40
Feb03 131 206 135 52 40*
Mar03 88 92 110 131 142
Apr03 206 127 197 104 102
May03 96 98 105 79 65
* indicates a month for which the full month of data is not available.
earthwater Concepts inc. — for Keltic Petrochemicals Inc., Dec. 2005 page 14 of 34
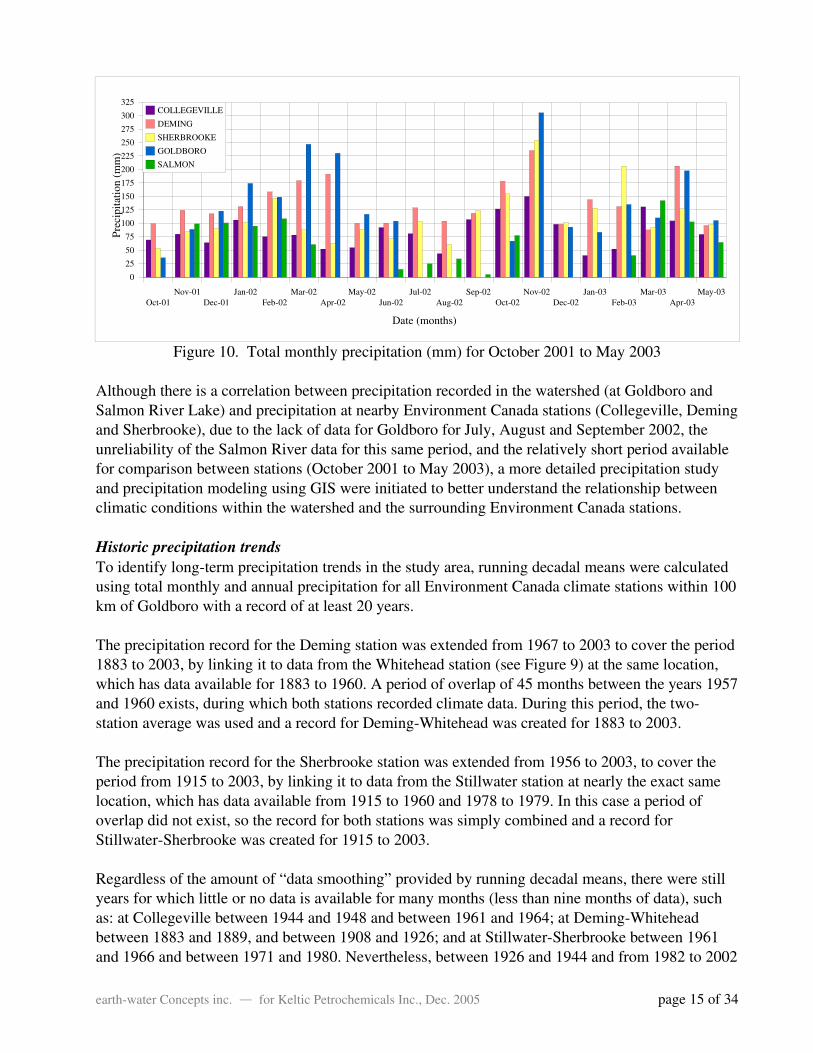
Figure 10. Total monthly precipitation (mm) for October 2001 to May 2003
Although there is a correlation between precipitation recorded in the watershed (at Goldboro andSalmon River Lake) and precipitation at nearby Environment Canada stations (Collegeville, Demingand Sherbrooke), due to the lack of data for Goldboro for July, August and September 2002, theunreliability of the Salmon River data for this same period, and the relatively short period availablefor comparison between stations (October 2001 to May 2003), a more detailed precipitation studyand precipitation modeling using GIS were initiated to better understand the relationship betweenclimatic conditions within the watershed and the surrounding Environment Canada stations.
Historic precipitation trendsTo identify longterm precipitation trends in the study area, running decadal means were calculatedusing total monthly and annual precipitation for all Environment Canada climate stations within 100km of Goldboro with a record of at least 20 years.
The precipitation record for the Deming station was extended from 1967 to 2003 to cover the period1883 to 2003, by linking it to data from the Whitehead station (see Figure 9) at the same location,which has data available for 1883 to 1960. A period of overlap of 45 months between the years 1957and 1960 exists, during which both stations recorded climate data. During this period, the twostation average was used and a record for DemingWhitehead was created for 1883 to 2003.
The precipitation record for the Sherbrooke station was extended from 1956 to 2003, to cover theperiod from 1915 to 2003, by linking it to data from the Stillwater station at nearly the exact samelocation, which has data available from 1915 to 1960 and 1978 to 1979. In this case a period ofoverlap did not exist, so the record for both stations was simply combined and a record forStillwaterSherbrooke was created for 1915 to 2003.
Regardless of the amount of “data smoothing” provided by running decadal means, there were stillyears for which little or no data is available for many months (less than nine months of data), suchas: at Collegeville between 1944 and 1948 and between 1961 and 1964; at DemingWhiteheadbetween 1883 and 1889, and between 1908 and 1926; and at StillwaterSherbrooke between 1961and 1966 and between 1971 and 1980. Nevertheless, between 1926 and 1944 and from 1982 to 2002
earthwater Concepts inc. — for Keltic Petrochemicals Inc., Dec. 2005 page 15 of 34
Oct01Nov01
Dec01Jan02
Feb02Mar02
Apr02May02
Jun02Jul02
Aug02Sep02
Oct02Nov02
Dec02Jan03
Feb03Mar03
Apr03May03
0
25
50
75
100
125
150
175
200
225
250
275
300
325COLLEGEVILLE
DEMING
SHERBROOKE
GOLDBORO
SALMON
Date (months)
Prec
ipita
tion
(mm
)

there exists a nearcomplete record for these three stations – which indicates that there has been ageneral increase in total annual precipitation amounts over time. This increase is most obvious in theDemingWhitehead and Collegeville areas. Overprinted on this longterm trend, mean total annualprecipitation (values obtained from GIS at roughly the center of the Isaac's Harbour Riverwatershed) increased from 1,475mm during the period 19821987, to 1,507mm during the period19881994, decreasing to 1,341mm during the period 19952002. Total annual precipitation over thewatershed averaged 1,554mm during the year 2002 (value obtained from GIS). The individualrecords for total annual precipitation for 2002 at Collegeville, DemingWhitehead and StillwaterSherbrooke were 1,065mm, 1,722mm and 1,357mm, respectively. For these three stations, eleven,eleven and nine out of twelve months in 2002 recorded more precipitation than in 2001.
Three quasidistinct periods were identified within the more recent data by which to characterizetotal annual precipitation amounts. These are from 1982 to 1987, 1988 to 1994 and 1995 to 2002.Also, by studying the seasonal total precipitation at Collegeville, DemingWhitehead and StillwaterSherbrooke, “precipitation seasons” were defined, as follows:
Fall September to November;Winter December to February;Spring March to May;Summer June to August.
Precipitation modelingThe 11 percent excess runoff versus precipitation observed at the start of this section suggested thatsimply using mean precipitation from the three nearest Environment Canada climate stations mightnot correctly represent the precipitation amounts actually falling onto the Isaac's Harbour watershed– it was thought that one or more climate station could be biasing the mean.
Nearly complete data from several other Environment Canada stations is available for the period1982 to 2002, including at Ecum Secum, Malay Falls, Middle Musquodoboit, PictouLyons Brook,Port Hastings, Port Hawkesbury, Port Hood, River Denys and Upper Stewiacke. Use of this dataallowed an accurate simulation of precipitation over the Isaacs Harbour Watershed using GRASSGIS, where rainfall data interpolation from the stations listed in Table 8 and (raster surface)modeling was done to tabulate the following:
Seasonal means (19822002)Seasonal means (19821987)Seasonal means (19881994)Seasonal means (19952002)
Average annual total (19822002)Average annual total (19821987)Average annual total (19881994)Average annual total (19952002)
Monthly totals (October 2001 to May 2003)Seasonal totals (2002)Annual total (2002)
Average monthly totals (19822002)
earthwater Concepts inc. — for Keltic Petrochemicals Inc., Dec. 2005 page 16 of 34
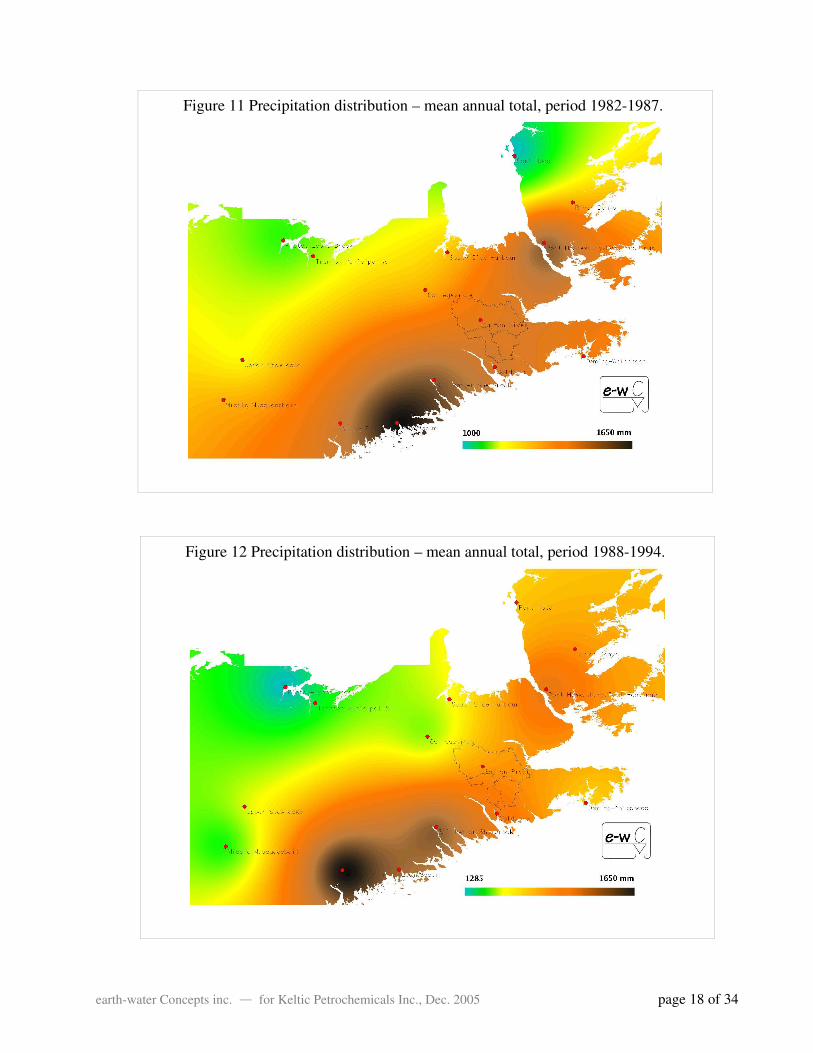
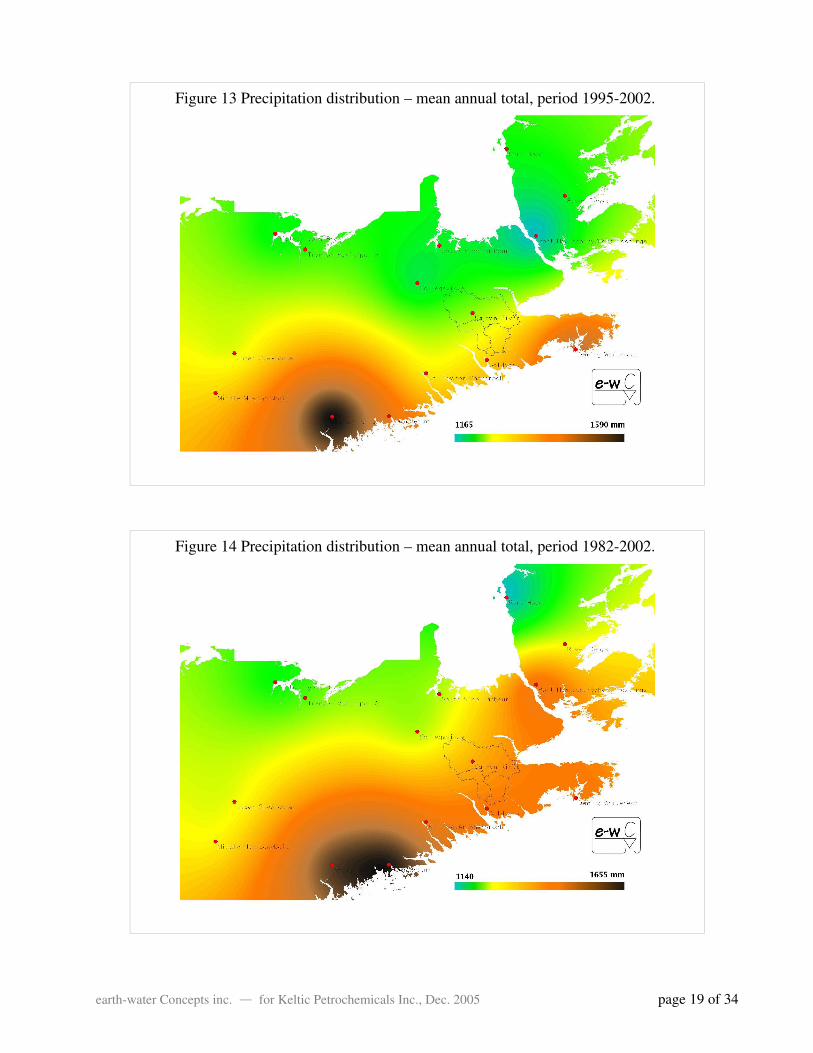
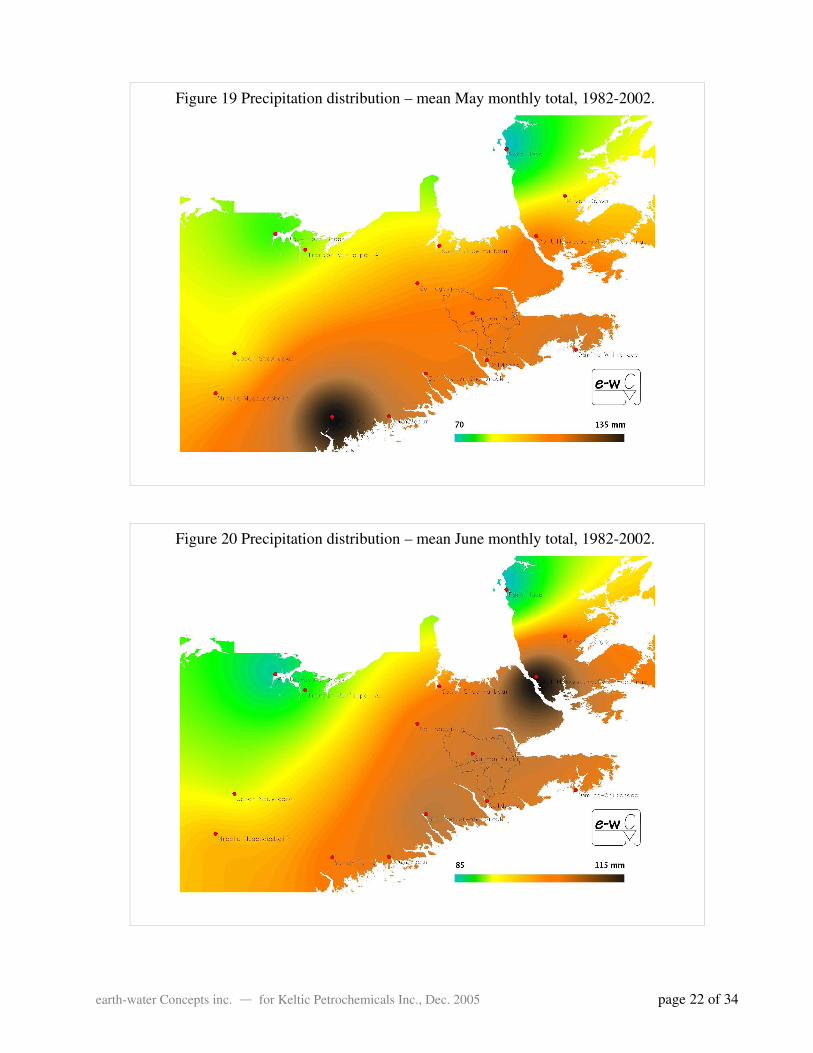
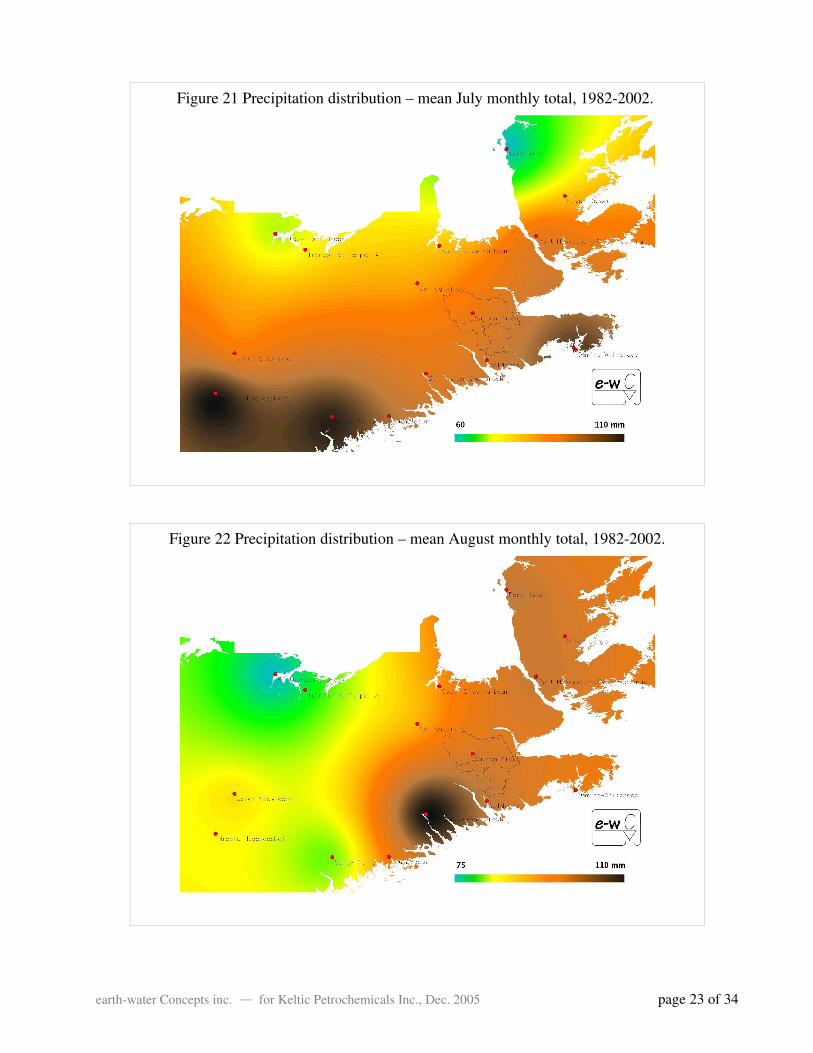
To illustrate how rainfall distribution has varied over time, Figures 11 to 14 show total mean annualprecipitation for eastern Nova Scotia for the periods 19821987, 19881994, 19952002 and 1982 to2002, respectively. Also, mean average total monthly precipitation for the period 1982 to 2002(shown in Figures 15 to 26) and individual monthly totals for October 2001 through May 2003 weretabulated for the stations listed in Table 9. These data are used later to calculate the October 2001 toMay 2003 and overall average (1982 to 2002) monthly and annual flow versus precipitation atIsaacs Harbour River, and thus, reservoir storage requirements.
Table 8 Period of record for stations used for historic (19822002) rain modeling
Station Name Period of Record
Collegeville 19822002
DemingWhitehead 19822002
Ecum Secum 19821985
Malay Falls 19882002
Middle Musquodoboit 19822002
PictouLyons Brook 19852002
Port Hawkesbury/Port Hastings 19821995/20012002
Port Hood 1982/19851987/1990
River Denys 19821987
StillwaterSherbrooke 19822002
Upper Stewiacke 19822002
Table 9 Period of record for stations used for modeling October 2001 to May 2003
Station Name Period of record data available
Collegeville Oct01 to May03
DemingWhitehead Oct01 to May03
Goldboro Oct01 to May03
Malay Falls Oct01 to Mar03
Middle Musquodoboit Oct01 to Mar03
PictouLyons Brook Oct01 to Mar03
Port Hawkesbury Oct01 to Mar03
Salmon River Oct01 to May03
South Side Harbour Oct01 to Feb03
StillwaterSherbrook Oct01 to May03
Trenton Municipal A Oct01 to Mar03
Upper Stewiacke Oct01 to Mar03
earthwater Concepts inc. — for Keltic Petrochemicals Inc., Dec. 2005 page 17 of 34
earthwater Concepts inc. — for Keltic Petrochemicals Inc., Dec. 2005 page 18 of 34
Figure 11 Precipitation distribution – mean annual total, period 19821987.
Figure 12 Precipitation distribution – mean annual total, period 19881994.
earthwater Concepts inc. — for Keltic Petrochemicals Inc., Dec. 2005 page 19 of 34
Figure 13 Precipitation distribution – mean annual total, period 19952002.
Figure 14 Precipitation distribution – mean annual total, period 19822002.

earthwater Concepts inc. — for Keltic Petrochemicals Inc., Dec. 2005 page 20 of 34
Figure 15 Precipitation distribution – mean January monthly total, 19822002.
Figure 16 Precipitation distribution – mean February monthly total, 19822002.

earthwater Concepts inc. — for Keltic Petrochemicals Inc., Dec. 2005 page 21 of 34
Figure 17 Precipitation distribution – mean March monthly total, 19822002.
Figure 18 Precipitation distribution – mean April monthly total, 19822002.
earthwater Concepts inc. — for Keltic Petrochemicals Inc., Dec. 2005 page 22 of 34
Figure 19 Precipitation distribution – mean May monthly total, 19822002.
Figure 20 Precipitation distribution – mean June monthly total, 19822002.
earthwater Concepts inc. — for Keltic Petrochemicals Inc., Dec. 2005 page 23 of 34
Figure 21 Precipitation distribution – mean July monthly total, 19822002.
Figure 22 Precipitation distribution – mean August monthly total, 19822002.

earthwater Concepts inc. — for Keltic Petrochemicals Inc., Dec. 2005 page 24 of 34
Figure 23 Precipitation distribution – mean September monthly total, 19822002.
Figure 24 Precipitation distribution – mean October monthly total, 19822002.

earthwater Concepts inc. — for Keltic Petrochemicals Inc., Dec. 2005 page 25 of 34
Figure 25 Precipitation distribution – mean November monthly total, 19822002.
Figure 26 Precipitation distribution – mean December monthly total, 19822002.

Drought and flood frequency forecastingDrought frequency analysis was performed on total summer (June, July plus August) precipitationvalues for the three nearest Environment Canada stations (Collegeville, DemingWhitehead andStillwaterSherbrooke). For each station, the total summer precipitation was calculated for each yearof record. The data was ranked in ascending order and the nonexceedance probability wascalculated using:
Pne=m
n1
where Pne = probability of nonexceedance, m = rank, and n = number of years of record.
The recurrence interval, (return period) was calculated using:
T=1
Pne
where T = return period in years.
A semilog graph of the recurrence interval (in years) and precipitation (in mm) was plotted for eachclimate station. Trend lines were drawn to estimate a range of values for the 50year, 100year, 200year and 500year summer droughts for each climate station which are presented in Table 10.
Table 10 Summer (June, July, August) drought estimates (in mm).
Station Name 50year 100year 200year 500year
Collegeville 110115 8595 6577 2555
DemingWhitehead 100 7075 3750 015
StillwaterSherbrooke 120 8592 5370 1528
Storm frequency analysis was performed on 24hour, 48hour and 72hour precipitation values forthe same three climate stations. For the 24hour events, daily precipitation values were used. Thecalculations for the 48hour and 72hour events required the sum of the daily precipitation values forevery two and three consecutive days respectively. For each station, the total event precipitation wascalculated for each year of record. The data was then ranked in descending order and the exceedanceprobability was calculated using:
Pe=m
n1
The recurrence interval, (return period) was then calculated in days and converted to equivalentyears. A semilog graph of the recurrence interval (in years) and precipitation (in mm) was plottedfor each climate station for the 24hour, the 48hour and the 72hour storm events. Trend lines weredrawn in order to estimate a range of values for the 100year, 200year and 500year storm eventsfor each climate station and the results are presented in Tables 11, 12 and 13.
earthwater Concepts inc. — for Keltic Petrochemicals Inc., Dec. 2005 page 26 of 34

Table 11 100year storm events (in mm)
Station Name 24hour event 48hour event 72hour event
Collegeville 150204 176240 180250
DemingWhitehead 135 170 185188
StillwaterSherbrooke 145150 185192 208213
Table 12 200year storm events (in mm)
Station Name 24hour event 48hour event 72hour event
Collegeville 164212 186258 196270
DemingWhitehead 138142 179185 194202
StillwaterSherbrooke 155162 200210 222230
Table 13 500year storm events (in mm)
Station Name 24hour event 48hour event 72hour event
Collegeville 184220 204280 210300
DemingWhitehead 144153 191204 208220
StillwaterSherbrooke 171179 220230 242251
4. Detailed hydrographic analysisThe rainfall models noted above give a value of 120,400,662 m3 as total amount of water availablefrom precipitation falling onto the Isaac's Harbour River watershed during the year 2002. Whencompared to total discharge at ML1 of 118,752,483 m3 for the same period, this suggests a value ofC=0.99 as runoff coefficient for the Isaac's Harbour River watershed – a value that is consideredmuch too large in light that there is perhaps 20 to 30 percent water loss from evapotranspiration andgroundwater recharge (little of which would be expected to emanate as base flow at ML1).
One hypothesis to help explain the large value obtained for C involves groundwater contributionsfrom the Salmon River watershed (situated at higher elevation and immediately north of the Isaac'sHarbour River watershed); deemed possible in light of the presence of sandstone with relativelyhigh porosity and permeability beneath the Salmon River watershed, and northwest trending faultspresent within the Isaac's Harbour River watershed and basement rock which are likely to be presentunder and in hydraulic connection with the Salmon River sandstone aquifer above. Groundwatercomputer modeling would help to confirm such a hypothesis. However, there is insufficientgroundwater data to warrant doing groundwater modeling – the Isaac's Harbour River watershed andparts of the Salmon River watershed of concern are sparsely populated and thus contain too fewwells to provide a proper groundwater database. Therefore, it was necessary to further evaluate thewatershed by doing detailed analysis of the hydrographs in an effort to separate quick flow (surfacerain event flows) from base flow (steadier groundwater contribution to streams).
Two streamflow hydrographs were created showing streamflow (m3/s), instantaneous precipitation(mm) and total precipitation (mm). One hydrograph (at ML1, shown in Figure 27) was used to
earthwater Concepts inc. — for Keltic Petrochemicals Inc., Dec. 2005 page 27 of 34

describe the Isaacs Harbour River Watershed and the other (combining GB1, GB2 and GB3 ontoone chart) to characterize the Gold Brook subwatershed for comparative purposes. Theprecipitation used was actual rain gage data collected at Goldboro. Base flow separation wasperformed manually by corresponding hydrograph response peaks to individual precipitation events,and drawing a straight line to represent the baseline condition beneath each peak. A detailed viewfrom ML1 is presented in Figure 28 to help illustrate this.
The area beneath all base flow on the ML1 hydrograph was integrated to obtain total monthly baseflow for the period October 2001 to May 2003. These values were subtracted from the total flowrecorded for the same periods to obtain monthly values for quick flow.
earthwater Concepts inc. — for Keltic Petrochemicals Inc., Dec. 2005 page 28 of 34
Figure 27 ML1 hydrograph with precipitation from Goldboro rain gage, Oct 2001 to May 2003.
Figure 28. Detail from ML1 hydrograph showing separation into base flow and quick flow
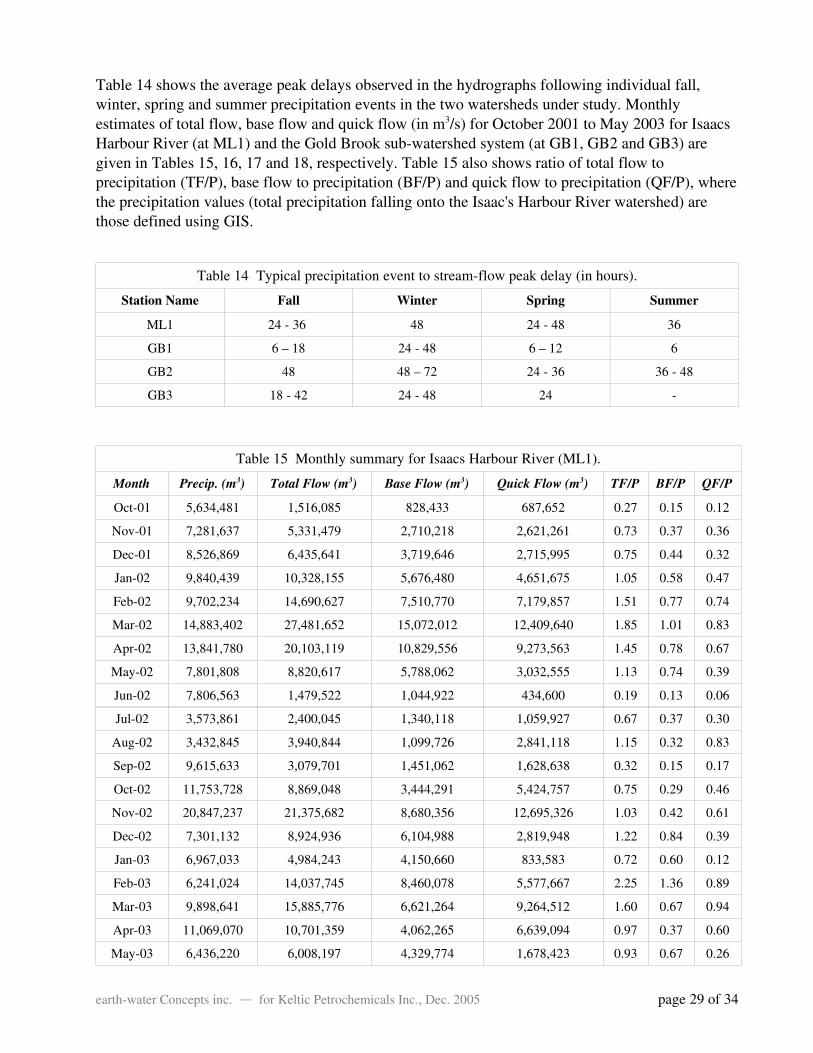
Table 14 shows the average peak delays observed in the hydrographs following individual fall,winter, spring and summer precipitation events in the two watersheds under study. Monthlyestimates of total flow, base flow and quick flow (in m3/s) for October 2001 to May 2003 for IsaacsHarbour River (at ML1) and the Gold Brook subwatershed system (at GB1, GB2 and GB3) aregiven in Tables 15, 16, 17 and 18, respectively. Table 15 also shows ratio of total flow toprecipitation (TF/P), base flow to precipitation (BF/P) and quick flow to precipitation (QF/P), wherethe precipitation values (total precipitation falling onto the Isaac's Harbour River watershed) arethose defined using GIS.
Table 14 Typical precipitation event to streamflow peak delay (in hours).
Station Name Fall Winter Spring Summer
ML1 24 36 48 24 48 36
GB1 6 – 18 24 48 6 – 12 6
GB2 48 48 – 72 24 36 36 48
GB3 18 42 24 48 24
Table 15 Monthly summary for Isaacs Harbour River (ML1).
Month Precip. (m3) Total Flow (m3) Base Flow (m3) Quick Flow (m3) TF/P BF/P QF/P
Oct01 5,634,481 1,516,085 828,433 687,652 0.27 0.15 0.12
Nov01 7,281,637 5,331,479 2,710,218 2,621,261 0.73 0.37 0.36
Dec01 8,526,869 6,435,641 3,719,646 2,715,995 0.75 0.44 0.32
Jan02 9,840,439 10,328,155 5,676,480 4,651,675 1.05 0.58 0.47
Feb02 9,702,234 14,690,627 7,510,770 7,179,857 1.51 0.77 0.74
Mar02 14,883,402 27,481,652 15,072,012 12,409,640 1.85 1.01 0.83
Apr02 13,841,780 20,103,119 10,829,556 9,273,563 1.45 0.78 0.67
May02 7,801,808 8,820,617 5,788,062 3,032,555 1.13 0.74 0.39
Jun02 7,806,563 1,479,522 1,044,922 434,600 0.19 0.13 0.06
Jul02 3,573,861 2,400,045 1,340,118 1,059,927 0.67 0.37 0.30
Aug02 3,432,845 3,940,844 1,099,726 2,841,118 1.15 0.32 0.83
Sep02 9,615,633 3,079,701 1,451,062 1,628,638 0.32 0.15 0.17
Oct02 11,753,728 8,869,048 3,444,291 5,424,757 0.75 0.29 0.46
Nov02 20,847,237 21,375,682 8,680,356 12,695,326 1.03 0.42 0.61
Dec02 7,301,132 8,924,936 6,104,988 2,819,948 1.22 0.84 0.39
Jan03 6,967,033 4,984,243 4,150,660 833,583 0.72 0.60 0.12
Feb03 6,241,024 14,037,745 8,460,078 5,577,667 2.25 1.36 0.89
Mar03 9,898,641 15,885,776 6,621,264 9,264,512 1.60 0.67 0.94
Apr03 11,069,070 10,701,359 4,062,265 6,639,094 0.97 0.37 0.60
May03 6,436,220 6,008,197 4,329,774 1,678,423 0.93 0.67 0.26
earthwater Concepts inc. — for Keltic Petrochemicals Inc., Dec. 2005 page 29 of 34

Tables 15 through 18 show that the values TF/P, BF/P and QF/P are clearly variable on a monthlyand annual basis. Comparing the values for fall (October to December) 2001 to those for fall 2002,the following is apparent:
• the watersheds received substantially more precipitation (86% more in the Isaacs Harbour RiverWatershed) during the fall 2002 than during the fall 2001,
• the proportion of precipitation contributing to total flow within the watersheds is significantlyhigher during the fall 2002.
This is likely due to there having been considerably more precipitation recorded for the year 2002,than is shown for the GISmodeled annual average for the period 19822002. Similarly, comparingthe values for January to May 2002 (winter/spring 2002) to those for January to May 2003(winter/spring 2003), it is noted that the watersheds received 38% more precipitation during thewinter 2002 than during the winter 2003. Notwithstanding this variability, due to the absence of anyother data, the values in columns 3 to 5 of Table 19 were calculated by simply multiplying those incolumn 1 (total monthly precipitation obtained from GIS) by the ratios in Table 15 (the mean of twomonths was used where data was available for more than one year).
Table 16 Monthly summary for GB1
Month Total Flow (m3) Base Flow (m3) Quick Flow (m3)
Oct01 207,161 172,136 35,024
Nov01 325,985 257,865 68,120
Dec01 285,659 229,617 56,042
Jan02 392,961 296,441 96,520
Feb02 561,526 267,636 293,891
Mar02 485,556 276,364 209,192
Apr02 449,011 305,089 143,923
May02 246,569 208,899 37,670
Jun02 181,906 154,509 27,397
Jul02 198,726 158,240 40,486
Aug02 124,208 87,608 36,600
Sep02 128,623 81,320 47,303
Oct02 245,286 157,589 87,697
Nov02 460,558 264,112 196,445
Dec02 237,769 160,704 77,064
Jan03 177,928 128,199 49,729
Feb03 440,290 278,395 161,895
Mar03 365,100 217,374 147,726
Apr03 107,316 87,294 20,023
May03 61,928 49,856 12,072
earthwater Concepts inc. — for Keltic Petrochemicals Inc., Dec. 2005 page 30 of 34

Table 17 Monthly summary for GB2.
Month Total Flow (m3) Base Flow (m3) Quick Flow (m3)
Oct01 523,585 385,011 138,573
Nov01 1,082,771 752,138 330,633
Dec01 1,088,869 703,522 385,348
Jan02 1,471,440 1,013,165 458,275
Feb02 2,004,065 1,407,050 597,015
Mar02 3,472,990 2,104,274 1,368,716
Apr02 3,106,891 1,652,639 1,454,252
May02 1,373,820 988,829 384,991
Jun02 1,008,405 700,604 307,801
Jul02 1,430,051 1,170,426 259,625
Aug02 1,076,998 488,267 588,731
Sep02 1,202,145 587,262 614,883
Oct02 1,990,527 1,124,494 866,034
Nov02 2,986,559 1,247,885 1,738,675
Dec02 1,833,189 1,287,581 545,608
Jan03 861,424 772,563 88,860
Feb03 2,238,444 1,135,055 1,103,388
Mar03 2,652,792 1,355,042 1,297,750
Apr03 2,581,073 1,401,831 1,179,242
May03 1,605,265 1,274,597 330,669
Table 18 Monthly summary for GB3.
Month Total Flow (m3) Base Flow (m3) Quick Flow (m3)
Oct01 907,033 685,291 221,742
Nov01 1,364,898 935,947 428,951
Dec01 1,266,999 888,754 378,245
Jan02 1,798,210 1,287,354 510,856
Feb02 2,864,231 1,906,812 957,418
earthwater Concepts inc. — for Keltic Petrochemicals Inc., Dec. 2005 page 31 of 34

Table 19 Monthly average values for precipitation (GISmodeled values) and calculated flowfor the years 1982 to 2002 for the Isaacs Harbour River watershed at ML1.
Month Precipitation (m3) Total Flow (m3) Base Flow (m3) Quick Flow (m3)
January 9,736,045 8,869,995 5,692,556 3,177,439
February 8,076,487 14,553,131 8,090,463 6462668
March 9,359,327 16,378,389 8,192,806 8,185,584
April 9,033,673 11,170,939 5,400,371 5,770,567
May 8,612,891 8,970,270 6,120,498 2,849,773
June 8,328,281 1,578,400 1,114,755 463,645
July 7,418,206 4,981,735 2,781,661 2,200,073
August 7,950,241 9,126,733 2,546,892 6,579,841
September 9,667,652 3,096,361 1,458,912 1,637,449
October 10,867,227 6,490,466 2,670,353 3,820,113
November 12,009,330 11,402,344 4,863,087 6,539,257
December 10,371,420 10,065,137 6,437,667 3,627,469
Total annual 111,430,780 106,683,900 55,370,021 51,313,878
Hydrologic budget calculationsThe hydrologic budget is usually calculated on the basis of the water year (October 1 to September30) because surface water discharge and groundwater storage are generally at a minimum at thebeginning and end of this period. However, this period may vary from place to place. At the studyarea, the water year for the period of 20 months (October 2001 to May 2003) over which stream andprecipitation data were collected appears to have been 01 November to 31 October (see Table 15),whereas for the 1982 to 2002 period represented in Table 19, the end of the water year appears to besomewhere between the start to the middle of September.
When stated as an equation including all items that may be involved, the hydrologic budget is:
Pr + SurI + SubI + Imp = R + ET + U + Exp ± ∆Soil ± ∆Ss ± ∆Sg
where: Pr = precipitationSurI = surface inflowSubI = subsurface inflowImp = imported waterR = stream flow (includes surface and groundwater runoff)ET = evapotranspirationU = subsurface flowExp = exported water∆Soil = change in soil moisture storage∆Ss = changed in surface water storage∆Sg = change in groundwater storage
earthwater Concepts inc. — for Keltic Petrochemicals Inc., Dec. 2005 page 32 of 34

Of the many factors that may introduce water into a basin, precipitation and perhaps subsurfaceinflow are the only contributions of water to the Isaacs Harbour River watershed. On the right sideof the equation, runoff, evapotranspiration, and changes in groundwater and perhaps also changes insoil storage (especially for calculations done on a monthly or seasonal basis) are by far the mostimportant. Subsurface outflow is present only in the vicinity of the gaging station. Elsewhere,groundwater would be expected to move toward the Isaacs Harbour River, toward Meadow Lake, ortoward tributaries to the river or lake.
Change in soil moisture storage, however, may be an important factor in the water budget,particularly if the budget is calculated on a monthly or season basis. The soil is generally near orabove field capacity in the late winter and early spring, and has the greatest soil moisture deficiencyin the late summer. On an annual basis, however, the change in soil moisture storage should besmall except between wet and dry years. The 2001 water year appears to have been unusually dryand there may be a error in the budget due to the lack of soil moisture data.
About 5.2 percent of the Isaacs Harbour River watershed is covered by surface water, almost all inthe form of lakes in the upper reaches of the watershed. Records of uncontrolled lake levels are notavailable, but this does not introduce serious errors in the water budget because a relative change inlake levels of 0.3 to 0.5 m from one year to the next would amount to less than 2 percent of the totalvolume of water accounted for on the right side of the hydrologic budget equation.
By eliminating those items of the hydrologic budget which do not apply to the Isaacs Harbour Riverwatershed or which are generally insignificant int eh calculations, the equation for the hydrologicbudget reduces to the following form:
Pr + SubI = R + ET ± ∆Sg
Average total annual runoff (R) for the period 1982 to 2002 is known from Table 19 to be106,683,900 m3. The change in groundwater storage is not known, but available data suggests that itmay have varied from one year to the next over the 20 months of study records (see Table 15).However, without also having a record of groundwater levels for the area (there are no groundwaterhydrographic stations nearby – the nearest one which is drilled into similar bedrock is located atLawrencetown), it is not clear whether this change may represent an overall increase or a decrease ingroundwater storage over this period of record.
Values for ET may vary from place to place and over time, but ET is generally expected to be in therange of 20 to 35 percent of total precipitation (a value of 25 percent is suggested for the study sitedue to its close proximity to the ocean), or perhaps around 27,857,700 m3 annually (25 percent ofprecipitation) for the period 1982 to 2002.
Rearranging terms in the hydrologic budget equation so that the unknowns are on one side, we get:
Pr R ET = ± ∆Sg SubI
This suggests that SubI or ∆Sg (or both combined) may be equal to approximately 41,193,000 m3
earthwater Concepts inc. — for Keltic Petrochemicals Inc., Dec. 2005 page 33 of 34

for the year 2002 during which stream and precipitation measurements were taken, or on average,23,110,800 m3 per year (about 2,638 m3/hr) for the period 1982 to 2002.
Notwithstanding any changes to surface water infiltration and/or groundwater flow regimes, one canexpect increases in groundwater storage to equal decreases generally over the long term, suggestinga significant value for SubI for the Isaacs Harbour River watershed of around23,110,800 m3 per yearon average (27 percent of total annual runoff) based on period 1982 to 2002. As noted earlier, thissubsurface inflow may originate from the Salmon River watershed to the north. Unfortunately, sincethe Salmon River is not gaged, similar calculations are not possible for the Salmon River watershedto determine whether it may be experiencing a SubI or ∆Sg surplus or deficit to match the valuesestimated for the Isaacs Harbour River watershed.
earthwater Concepts inc. — for Keltic Petrochemicals Inc., Dec. 2005 page 34 of 34