water sensitivity microporosity … · 3 the aim of the research presented in this is to gain more...
TRANSCRIPT

A. PETRA DRAL
WATER SENSITIVITY AND MICROPOROSITY
IN ORGANOSILICA GLASSES


WATER SENSITIVITY AND MICROPOROSITY IN ORGANOSILICA GLASSES
A. PETRA DRAL

Committee members
Chairman: Prof. dr. ir. H.J.W. Zandvliet University of Twente Secretary: Prof. dr. ir. H.J.W. Zandvliet Supervisor: Prof. dr. ir. J.E. ten Elshof University of Twente Members: Prof. dr. K.D. de Buysser Ghent University Prof. dr. G. Rothenberg University of Amsterdam Prof. dr. A.J.A. Winnubst University of Science and Technology of China, Hefei City / University of Twente Prof. dr. ir. N.E. Benes University of Twente Prof. dr. ir. L. Lefferts University of Twente
The research in this dissertation has been carried out at the Inorganic Materials Science group of the Faculty of Science and Technology at the University of Twente and has been financially supported by the Advanced Dutch Energy Materials (ADEM) program of the Dutch Ministry of Economic Affairs, Agriculture and Innovation.
Dutch title: Watergevoeligheid en microporositeit in organosilica glazen Cover image: © Russell Shively, Dreamstime ID 1523207
Printed by: Ipskamp Printing, Enschede, The Netherlands ISBN: 978-90-365-4400-9 DOI: 10.3990/1.9789036544009 © 2017 Petra Dral
WATER SENSITIVITY AND MICROPOROSITY IN ORGANOSILICA GLASSES
DISSERTATION
to obtain the degree of doctor at the University of Twente,
on the authority of the rector magnificus Prof. dr. T.T.M. Palstra,
on account of the decision of the graduation committee, to be publicly defended
on Friday 1 December 2017 at 14:45 h
by
Albertine Petra Dral
born on 31 January 1990 in Utrecht, The Netherlands.

This dissertation has been approved by:
Prof. dr. ir. J.E. ten Elshof (supervisor)

Contents
Introduction .............................................................................................................. 1
Chapter 1 Hydrothermal stability of organosilicas .................................................. 7
Chapter 2 Long-term structural evolution and condensation in microporous organosilica membranes ........................................................................................... 27
Chapter 3 Micropore structure stabilization in organosilica membranes by gaseous catalyst post-treatment ............................................................................................ 55
Chapter 4 Analyzing microporosity with vapor thermogravimetry and gas pycnometry .............................................................................................................. 73
Chapter 5 Organic groups influencing microporosity in organosilicas .................... 91
Conclusion: Just relax! .............................................................................................. 109
Summary | Samenvatting ......................................................................................... 111
Dankwoord | Acknowledgements ............................................................................ 115
List of publications .................................................................................................... 117


1
Introduction

2 | Introduction

3
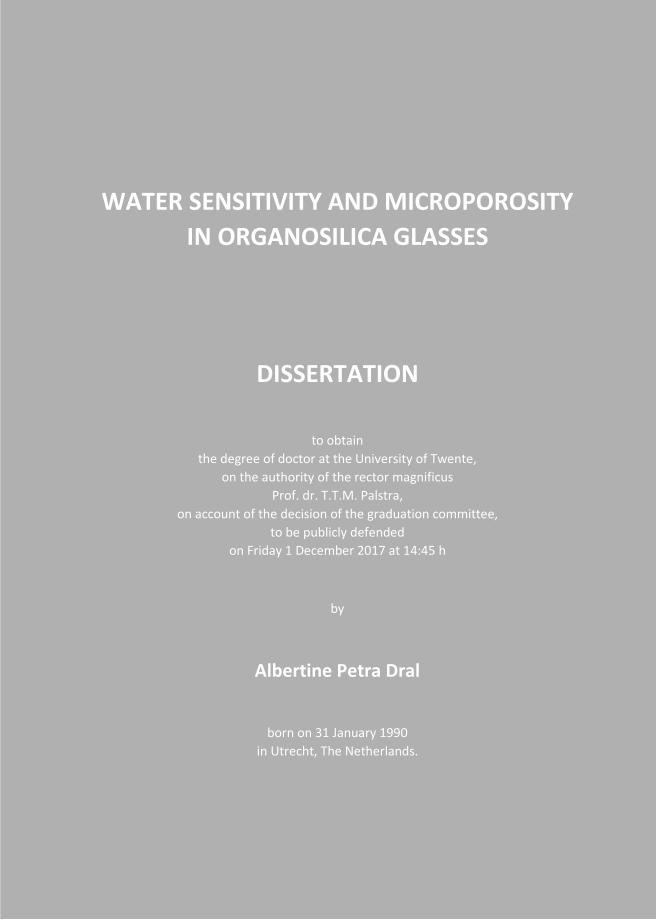
The aim of the research presented in this dissertation is to gain more insight in the water sensitivity and microporosity of organosilica materials. These materials are glasses in which part of the Si-O-Si bonds are replaced by Si-R or Si-R-Si groups, as schematically depicted in Figure 1. Organosilica glasses can be synthesized from organoalkoxysilane precursors via sol-gel processing. The silica moieties provide mechanical rigidity and high thermal and chemical stability, while the organic segments can be used to tune e.g. the flexibility and surface properties of the hybrid material. The organic groups also influence the micropore structure; micropores have sizes <2 nm according to the IUPAC definition and are important for membrane applications, as will be discussed below. The effect of the organic moieties on various properties strongly depends on the molecular arrangement of the network. Organic groups in terminal positions (Si-R) reduce the network connectivity and tend to stick out at the (internal) surface. This generally results in a denser packing, strong surface hydrophobicity and easy access to functional groups.1–3 Organic groups in bridging positions (Si-R-Si) are part of the network backbone and are more encapsulated by the surrounding siloxane bonds, affecting the micropore structure by acting as spacers.4–6 Such molecular design in combination with the tunability of sol-gel syntheses enables the development of tailored organosilica materials for a variety of applications in e.g. separation technology,4,7,8 catalysis9 and low-k dielectrics.10,11
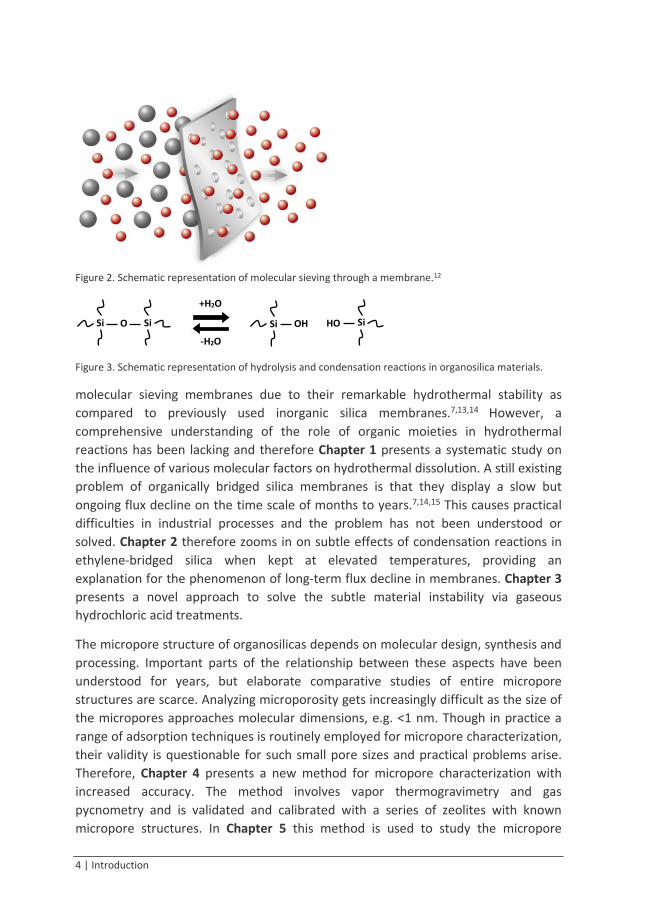
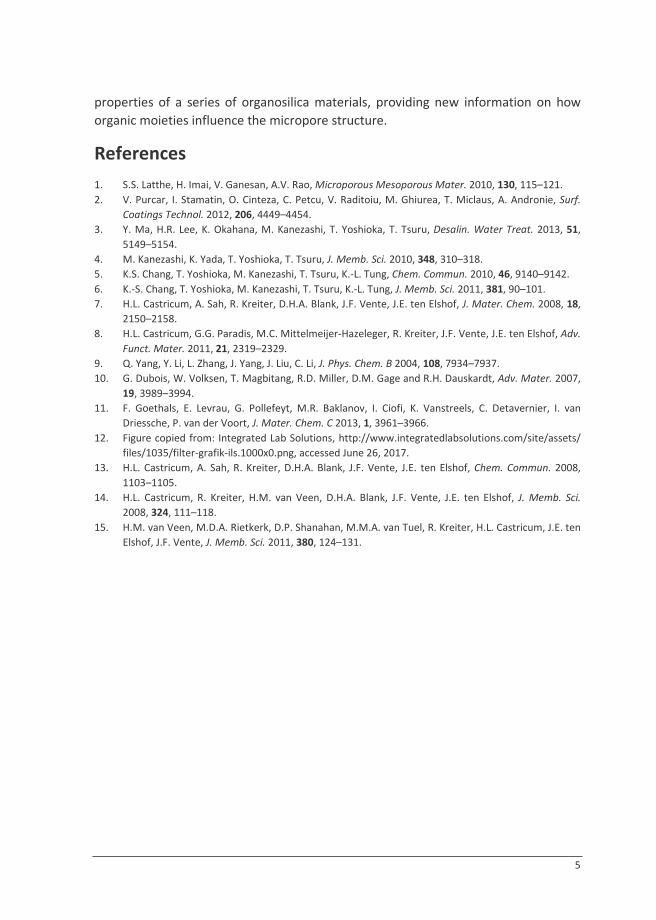
The research in this dissertation primarily focuses on fundamental understanding of water sensitivity and microporosity in organosilicas, but stands in close relation with the industrial application of organically bridged silicas as molecular sieving membranes. Molecular sieving requires pores that are just large enough to let through the smallest molecules in a mixture while the others are rejected, as schematically shown in Figure 2.12 Industrial membranes are often operated at 120-190 °C in the presence of water, making hydrothermal stability a key factor for long-term performance. Since organosilica networks contain large numbers of Si-O-Si bonds, they are intrinsically susceptible to hydrolysis and condensation reactions as schematically shown in Figure 3. These reactions occur continuously in humid or wet environments, altering the internal (micropore) structure of the material and under certain conditions dissolving it. Organically bridged silicas are used as industrial
Figure 1. Schematic representation of a) inorganic silica, b) silica with terminal organic groups and c) silica with bridging organic groups.
O
O Si O Si
O
O O
O CxHy O Si
O
O
CxHy O Si
O
O
O
Si
O
O
a) b) c)
4 | Introduction
Figure 2. Schematic representation of molecular sieving through a membrane.12
Figure 3. Schematic representation of hydrolysis and condensation reactions in organosilica materials.
molecular sieving membranes due to their remarkable hydrothermal stability as compared to previously used inorganic silica membranes.7,13,14 However, a comprehensive understanding of the role of organic moieties in hydrothermal reactions has been lacking and therefore Chapter 1 presents a systematic study on the influence of various molecular factors on hydrothermal dissolution. A still existing problem of organically bridged silica membranes is that they display a slow but ongoing flux decline on the time scale of months to years.7,14,15 This causes practical difficulties in industrial processes and the problem has not been understood or solved. Chapter 2 therefore zooms in on subtle effects of condensation reactions in ethylene-bridged silica when kept at elevated temperatures, providing an explanation for the phenomenon of long-term flux decline in membranes. Chapter 3 presents a novel approach to solve the subtle material instability via gaseous hydrochloric acid treatments.
The micropore structure of organosilicas depends on molecular design, synthesis and processing. Important parts of the relationship between these aspects have been understood for years, but elaborate comparative studies of entire micropore structures are scarce. Analyzing microporosity gets increasingly difficult as the size of the micropores approaches molecular dimensions, e.g. <1 nm. Though in practice a range of adsorption techniques is routinely employed for micropore characterization, their validity is questionable for such small pore sizes and practical problems arise. Therefore, Chapter 4 presents a new method for micropore characterization with increased accuracy. The method involves vapor thermogravimetry and gas pycnometry and is validated and calibrated with a series of zeolites with known micropore structures. In Chapter 5 this method is used to study the micropore
Si HO OH Si Si O Si
+H2O
-H2O
5
properties of a series of organosilica materials, providing new information on how organic moieties influence the micropore structure.
References 1. S.S. Latthe, H. Imai, V. Ganesan, A.V. Rao, Microporous Mesoporous Mater. 2010, 130, 115–121. 2. V. Purcar, I. Stamatin, O. Cinteza, C. Petcu, V. Raditoiu, M. Ghiurea, T. Miclaus, A. Andronie, Surf.
Coatings Technol. 2012, 206, 4449–4454. 3. Y. Ma, H.R. Lee, K. Okahana, M. Kanezashi, T. Yoshioka, T. Tsuru, Desalin. Water Treat. 2013, 51,
5149–5154. 4. M. Kanezashi, K. Yada, T. Yoshioka, T. Tsuru, J. Memb. Sci. 2010, 348, 310–318. 5. K.S. Chang, T. Yoshioka, M. Kanezashi, T. Tsuru, K.-L. Tung, Chem. Commun. 2010, 46, 9140–9142. 6. K.-S. Chang, T. Yoshioka, M. Kanezashi, T. Tsuru, K.-L. Tung, J. Memb. Sci. 2011, 381, 90–101. 7. H.L. Castricum, A. Sah, R. Kreiter, D.H.A. Blank, J.F. Vente, J.E. ten Elshof, J. Mater. Chem. 2008, 18,
2150–2158. 8. H.L. Castricum, G.G. Paradis, M.C. Mittelmeijer-Hazeleger, R. Kreiter, J.F. Vente, J.E. ten Elshof, Adv.
Funct. Mater. 2011, 21, 2319–2329. 9. Q. Yang, Y. Li, L. Zhang, J. Yang, J. Liu, C. Li, J. Phys. Chem. B 2004, 108, 7934–7937. 10. G. Dubois, W. Volksen, T. Magbitang, R.D. Miller, D.M. Gage and R.H. Dauskardt, Adv. Mater. 2007,
19, 3989–3994. 11. F. Goethals, E. Levrau, G. Pollefeyt, M.R. Baklanov, I. Ciofi, K. Vanstreels, C. Detavernier, I. van
Driessche, P. van der Voort, J. Mater. Chem. C 2013, 1, 3961–3966. 12. Figure copied from: Integrated Lab Solutions, http://www.integratedlabsolutions.com/site/assets/
files/1035/filter-grafik-ils.1000x0.png, accessed June 26, 2017. 13. H.L. Castricum, A. Sah, R. Kreiter, D.H.A. Blank, J.F. Vente, J.E. ten Elshof, Chem. Commun. 2008,
1103–1105. 14. H.L. Castricum, R. Kreiter, H.M. van Veen, D.H.A. Blank, J.F. Vente, J.E. ten Elshof, J. Memb. Sci.
2008, 324, 111–118. 15. H.M. van Veen, M.D.A. Rietkerk, D.P. Shanahan, M.M.A. van Tuel, R. Kreiter, H.L. Castricum, J.E. ten
Elshof, J.F. Vente, J. Memb. Sci. 2011, 380, 124–131.

6 | Introduction

Abstract | 7
1
1
1
1
1
1
Hydrothermal stability
of organosilicas
This chapter is published as:
A.P. Dral, C. Lievens, J.E. ten Elshof, Influence of monomer connectivity, network flexibility and hydrophobicity on the hydrothermal stability of organosilicas, Langmuir 2017, 33, 5527-5536.

8 | Hydrothermal stability of organosilicas
1
1
1
1
1

Abstract | 9
1
1
1
1
1
Abstract It is generally assumed that the hydrothermal stability of organically modified silica networks is promoted by high monomer connectivity, network flexibility and the presence of hydrophobic groups in the network. In this study a range of organosilica compositions is synthesized to explore the extent to which these factors play a role in the hydrothermal dissolution of these materials. Compositions were synthesized from hexafunctional organically bridged silsesquioxanes (R’O)3Si-R-Si(OR’)3 (R = -CH2-, -C2H4-, -C6H12-, -C8H16-, -p-C6H4-; R’ = -CH3, -C2H5), tetrafunctional (EtO)2Si(CH3)-C2H4-Si(CH3)(OEt)2 and Si(OEt)4, trifunctional silsesquioxanes R”-Si(OMe)3 (R”=CH3, n-C3H7, cyclo-C6H11, phenyl), and bifunctional Si(i-C3H7)2(OMe)2. The bond strain, connectivity and hydroxyl concentration of all networks were estimated using 29Si cross-polarized magic angle spinning nuclear magnetic resonance and Fourier-transform infrared spectroscopy. The hydrophilicity was characterized by monitoring the water uptake of the materials in moisture treatments with thermogravimetric analysis, differential scanning calorimetry and Fourier-transform infrared spectroscopy. The resistance of each network against hydrothermal dissolution in a water/1,5-pentanediol mixture at 80 °C and pH 1, 7 and 13 was analyzed with inductively coupled plasma optical emission spectroscopy and X-ray fluorescence analysis. Bond strain appears to significantly increase the dissolution under hydrothermal conditions. The stabilizing influences of increased connectivity and hydrophobicity were found to be weak.
Introduction The mixed organic-inorganic nature of organosilica materials, i.e. glasses in which part of the Si-O-Si linkages are replaced by Si-R or Si-R-Si linkages, provides an interesting combination of material properties. The silica moieties provide mechanical rigidity and high thermal and chemical stability, while the organic groups can introduce e.g. flexibility, hydrophobicity and a variety of functional groups. The effect of the organic moieties strongly depends on the molecular arrangement of the network. Organic groups in terminal positions (Si-R) reduce the network connectivity and tend to stick out at the (internal and external) surface. This results in denser packing, easy access to functional groups and strong surface hydrophobicity.1–3 Organic groups in bridging positions (Si-R-Si) are part of the network backbone and are more encapsulated by the surrounding siloxane bonds, affecting the micropore structure by acting as spacers.4–7 An important advantage of bridged organosilicas is their superior hydrothermal stability as compared to terminal methylated silica and inorganic silica (amorphous SiO2).8–10 Stability under hydrothermal conditions is relevant for various applications, including liquid and gas separation membranes and catalyst supports. Though a variety of factors has been identified that contributes to the hydrothermal stability, the molecular origin is not fully understood.

10 | Hydrothermal stability of organosilicas
1
1
1
1
1
Reports on the hydrothermal stability of bridged organosilica materials use a variety of definitions and analysis methods. In the area of microporous membranes for molecular separation of gases and liquids (micropores have a pore diameter <2 nm according to the IUPAC definition), hydrothermal stability is defined in terms of stable separation performance under hydrothermal conditions. The incorporation of organic bridges between Si atoms leads to massive improvement of this micropore stability as compared to methylated or inorganic silica, as first reported in 2008,8–10 and enables stable separation performance under hydrothermal conditions for years.9 The increased hydrothermal stability has been reported for microporous organosilica membranes with methylene11,12 and ethylene8–10,12–16 bridges and is assumed to hold for a wide variety of other organically bridged systems as well. Very small amounts of material dissolution are still observed occasionally.16 Recently, doping of ethylene-bridged membranes with Zr has been suggested to further increase the hydrothermal stability, though without demonstrating the improvement compared to the undoped ethylene-bridged network.17 In another recent report doping with nm-sized Pd particles was claimed to further improve the hydrothermal stability of ethylene-bridged membranes by limiting the migration of monomeric moieties.18 This was based on the assumption that O1.5Si-R-SiO1.5 moieties migrate in a similar way as SiO2 moieties do in silica matrices and thereby ignored the large differences in monomer size, mass and connectivity. The observed effects on membrane flux and selectivity were not established to be of hydrothermal origin.
In the field of periodic mesoporous organosilica (PMO) structures, hydrothermal stability is considered on a somewhat larger length scale and focuses on the structural integrity of the ordered mesopores. Stability is generally evaluated by boiling PMO networks in water or exposing them to steam above 100 °C for up to several days and monitoring the mesostructural order by X-ray diffraction. Where the performance of microporous membranes can already be affected by subtle structural evolution without compromising the structural integrity, collapse of mesoporous structures usually requires extensive material dissolution. The stabilizing effect of organic bridges in the context of mesoporous structures has been reported from 199919 and includes methylene-bridged,20 ethylene-bridged,19–25 ethenylene-bridged,23,26 phenylene-bridged20,24,25,27 and biphenylene-bridged24 PMO structures. However, partial or complete degradation of these mesostructures has also been reported.19,24,28–31
The introduction of organic bridges between Si atoms clearly reduces the net effect of water on the overall network to an impressive extent as compared to inorganic silica and silica with organic terminal groups. However, the majority of the network backbone still consists of siloxane bonds that are by nature susceptible to rehydrolysis. Some level of bond breakage and reformation is to be expected and can

Introduction | 11
1
1
1
1
1
lead to significant evolution of the microstructure on long time scales. For example, the long-term stable separation performance of microporous organosilica membranes under hydrothermal conditions is generally accompanied by a subtle change in the flux.8,10,12 A detailed study on this phenomenon is presented in Chapter 2,32 showing that structural (micropore) evolution can be linked to ongoing chemical condensation. On the other hand, intentional water-induced network rearrangements (termed ‘hydrothermal restructuring’ or ‘steam firing’) are widely used to tune the properties of inorganic silica networks.33–38 In organically bridged silica hydrothermal restructuring has been reported to e.g. increase the condensation degree22 and improve the microstructural order.20 Other forms of restructuring, either with or without elevated temperatures, involve post-synthesis catalyst treatments such as liquid-phase NH3 or HCl treatment of mesoporous inorganic silica structures39–41 and vapor-phase HCl or NH3 treatment of microporous ethylene-bridged membranes.42–44 It is important to realize that hydrolysis and condensation reactions have a destructive as well as a facilitating function in the structural organization of silica-based networks. This complicated hydrothermal reality involves interconnected and counteracting effects occurring on various length and time scales.
A variety of factors that suppress structural degradation under hydrothermal conditions has been put forward in literature. Hydrophobicity or non-polarity introduced by organic groups is suggested to have a stabilizing effect via partial shielding of the siloxane bonds from water molecules.8,13,22,29 However, the role of hydrophobic stabilization tends to be overestimated, since many organosilica materials that are classified as hydrothermally stable (especially those with short or rigid organic bridges) have a clear affinity for water.7,23,45–47 Immersion calorimetry data indicate similar surface hydrophilicities for mesoporous ethylene-bridged, phenylene-bridged and inorganic silica materials.25 A more elaborate discussion on the influence of hydrophobic organic segments is given in our recent review on sol-gel processed organosilica membranes.48
A suggested stabilizing factor that specifically holds for networks with the organic groups in bridging configuration is the increased theoretical connectivity of a monomer with the surrounding network from 4-fold for conventional Si(OR)4 monomers to 6-fold for organically bridged silica monomers.8,10 The chance that all Si-O bonds of a monomer unit are hydrolyzed and the monomer disconnects from the network decreases with increasing connectivity. Switching from terminal to bridging organic groups while keeping the total carbon concentration constant indeed yields a significant improvement of the long-term membrane separation performance under hydrothermal conditions,8 despite the accompanying increase in microporosity and surface hydrophilicity.

12 | Hydrothermal stability of organosilicas
1
1
1
1
1
Another suggested stabilizing factor that specifically holds for organically bridged silicas is their structural flexibility, which leads to relaxation of strained siloxane bonds.8,9 The Si-O-Si bond angle can vary roughly between 134° and 180°.49 This allows a wide range of network configurations without compromising structural integrity, but not all bonds are in the lowest energy state. Additional rotational freedom and empty space introduced by organic bridges can help relieve the strain on the siloxane bonds and thereby increase their resistance against hydrolysis. Terminal organic groups give even more rotational freedom to the network, but they generally do not act as spacers and yield a denser packing of the network that sterically hinders reorganization after solidification. Bond relaxation may also be the underlying factor in stabilization trends known from inorganic silica, where silica dissolution can be suppressed by introducing crystallinity50 or increasing the condensation degree.51,52 Crystalline networks are expected to have more optimal bond configurations than amorphous systems. An increasing condensation degree as such does not necessarily increase bond relaxation, but post-treatments aiming at a higher condensation degree induce structural rearrangements on a larger scale as well, including network relaxation. Though all these factors have been proposed as origins for hydrothermal stability, their effects have not been studied systematically.
This chapter presents a systematic study on the influence of monomer connectivity, network flexibility and water uptake on the hydrothermal dissolution of a series of organosilica materials prepared via sol-gel processing. Materials were prepared from the precursors listed in Figure 1. The bond strain, connectivity and hydroxyl concentration of each network were estimated with 29Si cross-polarized magic angle
Figure 1. Chemical structures and abbreviations of the used (organo)silica precursors.

Experimental | 13
1
1
1
1
1
spinning nuclear magnetic resonance (29Si CP-MAS-NMR) and Fourier-transform infrared spectroscopy (FTIR). The water uptake was analysed with moisture treatments with thermogravimetric analysis and differential scanning calorimetry (TGA-DSC) and FTIR monitoring. The resistance against hydrothermal dissolution was tested at pH 1, 7 and 13 with inductively coupled plasma optical emission spectroscopy (ICP-OES) and X-ray fluorescence (XRF) analyses. All in all, a strong correlation between bond strain and hydrothermal dissolution is presented and the stabilizing effect of increased connectivity and hydrophobicity is shown to be weak. Routes to further stability improvement are proposed.
Experimental Chemicals. Bis(triethoxysilyl)methane (97% purity), 1,2-bis(triethoxysilyl)ethane (97% purity), 1,6-bis(trimethoxysilyl)hexane (97% purity), 1,8-bis(triethoxysilyl)octane (97% purity), 1,4-bis(triethoxysilyl)benzene (95% purity), 1,2-bis(methyldiethoxysilyl)-ethane (purity unknown), methyltrimethoxysilane (97% purity), n-propyltrimethoxy-silane (98% purity), cyclohexyltrimethoxysilane (97% purity), phenyltrimethoxysilane (97% purity), diisopropyldimethoxysilane (95% purity) and tetraethoxysilane (99% purity) were obtained from ABCR. Nitric acid was obtained from Sigma Aldrich (70 wt% aqueous solution) and Acros (65 wt% aqueous solution). Ethanol (dehydrated, 99.99% purity) was obtained from VWR and SeccoSolv. Sodium hydroxide (98.5% purity) was obtained from Sigma Aldrich. 1,5-pentanediol (98% purity) was obtained from Acros. Certipur silicon ICP standard (1000 mg L-1 Si, 2% NaOH) was obtained from Merck.
Sample preparation. (Organo)silica materials were synthesized by adding demi water and aqueous HNO3 (65 wt%) to dry ethanol at room temperature, followed by adding the (organo)silica precursor under stirring. All quantities are listed in Table 1. The mixture was then heated to 60 °C in an oil bath for the time periods listed in Table 1,
Table 1. Reactant quantities and reaction times for the synthesis of the (organo)silica materials.
ethanol [mL] water [mL] HNO3 65 wt% [mL] precursor [mL] reaction time [min] TEOS 30.0 6.06 1.492 18.76 180 BTESM 29.0 3.67 0.903 11.86 180 BTESE 25.0 3.24 0.798 11.12 180 BTMSH 60.0 2.35 0.579 7.04 50 BTESO 50.0 1.59 0.390 6.95 55 BTESB 30.0 1.21 0.298 4.48 50 BMDESE 27.0 2.09 0.515 9.31 180 MTMS 35.0 4.11 1.01 10.87 180 PTMS 60.0 2.38 0.585 7.73 50 CHTMS 70.0 1.57 0.387 5.95 50 PHTMS 80.0 1.78 0.439 6.17 50 DPDMS 70.0 1.04 0.255 5.80 180

14 | Hydrothermal stability of organosilicas
1
1
1
1
1
cooled to room temperature in a water bath and poured in petri dishes to dry. BMDESE- and PTMS-derived materials were dried further in an oven at 140 °C. The resulting samples were used in millimiter-sized pieces for hydrothermal treatment and were ground to powder by ball milling for 29Si CP-MAS-NMR, FTIR and TGA-DSC analyses. Reactant ratios (for all syntheses the HNO3 : H2O : alkoxy ratio was 0.064 : 1.1 : 1.0) and reaction times were derived from synthesis conditions reported elsewhere.53 Precursor concentrations were adjusted to prevent premature gelation. All samples were stored under ambient conditions.
Hydrothermal treatment. Millimeter-sized sample pieces were consolidated at 300 °C in N2 for 3 h, except for DPDMS-derived material due to evaporation below 200 °C. For every sample a total of 1.0 mmol Si (59-135 mg sample assuming 100% condensation) was soaked in 10 mL of demi water with 15 vol% 1,5-pentanediol at pH 1 (0.1 M HCl), pH 7 and pH 13 (0.1 M NaOH). The mixtures were kept at 80 °C under stirring for 46 h, subsequently filtered with 0.2 µm cellulose filters and analyzed with ICP-OES and XRF within 8 h.
29Si nuclear magnetic resonance spectroscopy. 29Si nuclear magnetic resonance spectra of powder samples were obtained with cross-polarization and magic angle spinning on a Bruker Avance 300 system. Spectra were recorded with a contact time of 3 ms (optimized for BTESE-derived material), a recycle delay of 2 s and 1000 scans per sample. To estimate the condensation degrees the Q, T and D peaks were smoothened (averaging over 5 data points) and fitted with near-Gaussian components. Fitting was based on optimization of the peak location, the full width at half maximum (asymmetric), the Gaussian/Lorentzian mix (asymmetric) and the baseline.
Infrared spectroscopy. Fourier-transform infrared spectra of powder samples were obtained with a Bruker Tensor 27 machine and a room temperature DLaTGS detector. The spectra in Figure 3 were measured in attenuated total reflection mode with a Pike Technologies GladiATR accessory. Spectra were recorded with a resolution of 2 cm-1 and 78 scans per measurement. The spectra in Figure 4 were measured in diffuse reflectance mode with a Harrick Praying Mantis accessory and a high temperature reaction chamber with ZnSe windows. The reaction chamber was flushed continuously with humidified N2 during the experiments and the gas outlet was located directly underneath the sample with KBr background, ensuring proper gas flow through the powder. The N2 was humidified to a constant level by bubbling through demi water at room temperature. The KBr background was stabilized at 30 °C for at least 45 min before recording the background spectrum, after which a small amount of sample powder was put on top and the atmosphere was stabilized again for at least 45 min. The sample was then heated to 300 °C, kept there for 3 h, cooled to 50 °C, kept there for 3 h and heated again to 300 °C. Heating and cooling rates

Results and discussion | 15
1
1
1
1
1
were 1 °C min-1. Spectra were recorded in-situ every 10 min with a resolution of 2 cm-1 and 78 scans per measurement.
Thermogravimetric analysis and differential scanning calorimetry. Thermogravi-metric and differential scanning calorimetry data of powder samples were recorded with a Netzsch STA 449 F3 Jupiter machine and platinum crucibles. The sample was heated to 300 °C for 3 h, followed by three cycles of cooling to 50 °C and heating to 300 °C. Heating and cooling rates were 1 °C min-1 and the sample was kept at each target temperature for 3 h. The sample was kept under a N2 flow of 60 mL min-1, humidified to a constant level by bubbling through demi water at room temperature. Data were recorded every 15 s.
Inductively coupled plasma optical emission spectroscopy. Inductively coupled plasma optical emission spectra of hydrothermal solutions were obtained with a PerkinElmer Optima DV8300 machine with 1.5 mL min-1 sample inlet and 0.65 L min-1 nebulizer gas flow. Si concentrations were measured axially (Si lines 251.611 nm, 212.412 nm, 288.158 nm, 252.851 nm) and averaged over three replicates. Calibration curves from a Si standard were obtained for each pH to exclude matrix effects. A calibration curve at pH 7 was made for the pH 1 series due to precipitation of the standard at low pH. The hydrothermal solutions were diluted with demi water at the corresponding pH to reduce the 1,5-pentanediol concentration from 15 vol% to 9 vol% for plasma stability.
X-ray fluorescence spectroscopy. X-ray fluorescence spectra of undiluted hydrothermal solutions were obtained with a Bruker S8 Tiger machine equipped with a rhodium tube and measuring at approximately 4 kW.
Results and discussion
Network state and hydroxyl concentration
The network state and hydroxyl concentration of the organosilica materials were investigated with 29Si CP-MAS-NMR spectroscopy. Spectra of the as-prepared materials are shown in Figure 2. The chemical shifts may have been affected by non-hydrolyzed alkoxy residues, but differences between alkoxy- and hydroxyl-substituted Si signals are reported to be very small.54 When looking at the peak positions of the T signals, the magnetic shielding of the Si nucleus increases (decreasing chemical shift) in the order BTESE < BTMSH ≈ BTESO ≈ MTMS ≈ PTMS < BTESM ≈ CHTMS << PHTMS < BTESB. The almost identical chemical shifts for BTMSH-, BTESO-, MTMS- and PTMS-derived networks correspond with them all having a high network flexibility (the organic bridges are either long and flexible or absent) that enables close-to-optimal network organizations with minimal bond strain. This is also

16 | Hydrothermal stability of organosilicas
1
1
1
1
1
observed in the FTIR spectra in Figure 3, where the Si-O-Si stretching band (1150-1000 cm-1)55,56 occurs at a similar low frequency for BTMSH-, BTESO- and MTMS- derived material. For excluded samples the spectra were too complicated to pinpoint the Si-O-Si stretching band. For BTESE-derived powder, only its T3 signal had a higher chemical shift than in BTMSH-, BTESO-, MTMS- and PTMS-derived networks. This can be explained with its T1 and T2 centers being in a similar relaxed state and the formation of a third siloxane bond on the same Si atom introducing some bond strain. Increasing bond strain leading to higher chemical shifts (deshielding of the Si nucleus) is reported for cyclic siloxane species.57 The BTESM-derived network is
Figure 2. 29Si CP-MAS-NMR spectra of all (organo)silica materials.
Figure 3. FTIR spectra (attenuated total reflection) of part of the (organo)silica materials. The dots indicate the Si-O-Si stretching vibration.
-30 -40 -50 -60 -70 -80 -90
Inte
nsity
[a.u
.]
BTESM
BTESE
BTMSH
BTESO
BTESB
MTMS
PTMS
CHTMS
PHTMS
20 10 0 -10 -20 -30 -40
Chemical shift [ppm]
DPDMS
BMDESE
-70 -80 -90 -100 -110 -120 -130
TEOS Q2
T1
T1
T1
T1
T1
D1
T1
Q3
T2
T2
T2
T2
T2
T2
T2
T2
T2
D2
Q4
T3
T3
T3
T3
T3
T3
T3
T3
T3
D1 D2
90095010001050110011501200
Abso
rban
ce [a
.u.]
Wavenumber [cm-1]
TEOS
BTESM
BTESE
BTMSH
BTESO
BTESB
MTMS

Results and discussion | 17
1
1
1
1
1
expected to be significantly strained, as also indicated by the FTIR Si-O-Si stretching vibration shifting to higher frequency for BTESM- as well as BTESB- and TEOS-derived material in Figure 3. However, the chemical shift of BTESM-derived material was lower than that of the other alkylene-bridged networks. This could be due to the close proximity of surrounding atoms that offer increased magnetic shielding to the Si nuclei as a result of the shorter bridges. The CHTMS-derived network, also closely packed due to the bulky hexyl rings filling up empty spaces, had a similar high magnetic shielding. The observed lower chemical shift of PHTMS- and BTESB-derived materials as compared to the other T compounds corresponds with phenyl substitution providing better magnetic shielding of the Si nucleus than alkyl substitution does.58 The slightly lower shielding for the PHTMS-derived network as compared to the BTESB-derived network can be explained with increased bond strain due to twice as many bulky phenyl rings that have to be accommodated in the network. The reduced magnetic shielding in DPDMS-derived material as compared to BMDESE-derived material can be explained by increased steric hindrance of the double isopropyl groups yielding more strained siloxane bonds. Bond strain indicated by 29Si CP-MAS-NMR is expected to mainly represent X-Si stretching or X-Si-X bending; though Si-O-Si bending occurs more readily, this distortion affects the electron density around Si less.
The overall condensation degrees of all materials were estimated from the deconvoluted 29Si CP-MAS-NMR spectra and are listed in Table 2. An overview of all deconvolutions is shown in supplementary material published online.59 The condensation degrees indicate the as-prepared state without thermal consolidation and reflect intrinsic as well as processing-dependent material properties. From these condensation degrees the hydroxyl concentration and actual connectivity (number of siloxane bonds per monomer) were calculated. CP-MAS-NMR is not a quantitative technique in principle, because the cross-polarization efficiency and rate depend on
Table 2. Condensation degree, hydroxyl concentration and actual connectivity of all (organo)silica materials as derived from 29Si CP-MAS-NMR spectra.
material condensation degree [%] OH per Si SiOSi per monomer TEOS >80 <0.8 >3.2 BTESM 79 0.6 4.7 BTESE 82 0.5 4.9 BTMSH 85 0.5 5.1 BTESO 84 0.5 5.0 BTESB 78 0.7 4.7 MTMS 98 0.1 2.9 PTMS 88 0.4 2.6 CHTMS 66 1.0 2.0 PHTMS 83 0.5 2.5 BMDESE 82 0.4 3.3 DPDMS 98 0.0 2.0

18 | Hydrothermal stability of organosilicas
1
1
1
1
1
the local chemistry. In practice, 29Si CP-MAS-NMR results have been shown to offer good quantitative approximations for organosilica materials with arylene and alkylene bridges.46,60 The organic protons neighboring the T-type Si nuclei in these materials are in the same configurations as all the ones in the present study, excluding MTMS-derived material. The obtained values and trends are thus expected to be reasonably accurate. Q4-type Si resonance is known to be hindered by a low cross-polarization efficiency,61 yielding an underestimation of the condensation degree and an overestimation of the hydroxyl concentration for TEOS-derived material.
For the networks with flexible organic bridges the condensation degree slightly increased with increasing bridge length, probably due to increased rotational freedom of the monomers. As for steric hindrance, bridges also act as spacers and in this range of relatively short bridges (up to eight CH2 units) the increased spacing for longer bridges accommodated their larger volume. Networks with terminal organic groups and thus more organizational freedom had somewhat higher condensation degrees than networks with equivalent bridging groups (MTMS vs. BTESE, PTMS vs. BTMSH). On the other hand, the condensation degree in networks with terminal organic groups significantly decreased for increasingly bulky groups. The high condensation degree of MTMS-derived powder (98%) suggests a densely packed network in which the methyl group fits well, as also indicated by the ability of methylated silica to crystallize.62,63 Interestingly, the addition of terminal methyl groups in BMDESE-derived material as compared to BTESE-derived powder increased the rotational freedom of molecular segments but did not increase the condensation degree. The methyl groups did not preferentially replace non-condensed hydroxyl groups, suggesting that the hydroxyl groups had little freedom to rearrange or that the ethylene bridges introduced too much spacing to enable higher condensation degrees. PHTMS-derived networks had a significantly higher condensation degree than CHTMS-derived networks, which could be due to the rigidity and π-π stacking tendency of phenyl rings. The average number of hydroxyl groups per Si atom varied between 0.5 and 0.7 for the organically bridged networks, indicating significant hydrophilicity. For the networks with terminal organic groups the number of hydroxyl groups per Si atom varied between 0.0 and 1.0, with MTMS- and DPDMS-derived materials being strongly hydrophobic and CHTMS-derived material having a high concentration of hydrophilic sites. The actual connectivity was around 5 for the organically bridged networks and around 2-3 for the networks with terminal organic groups. The materials with the lowest actual connectivity were derived from DPDMS and CHTMS.

Results and discussion | 19
1
1
1
1
1
Water uptake
The hydrophilicity of the networks is related to their hydroxyl concentrations listed in Table 2 above. In addition, the water uptake of a network also depends on the presence of microporosity and the accessibility of hydrophilic groups. Microporosity is generally present in TEOS-derived networks as well as in networks with rigid phenylene bridges or flexible alkylene bridges of up to eight CH2 units (with acid-catalyzed syntheses).53 The overall extent of water uptake is an indication of the scale at which hydrolysis may take place. Furthermore, the uptake of water proves close contact between the organosilica matrix and aqueous species and thus can rule out hydrophobicity as main origin of hydrothermal stability. The water uptake of the samples was measured by subjecting them to repeated temperature cycles from 300 °C to 50 °C under a humidified N2 flow with in-situ TGA-DSC and FTIR monitoring. The results reflect intrinsic as well as processing-dependent material properties, but variations in processing parameters are not expected to affect the qualitative observations discussed here. Results are shown in Figure 4, except for DPDMS-derived material due to its complete evaporation below 200 °C.
The TGA curves for TEOS-, BTESM-, BTESE- and BTESB-derived networks show a clear uptake of mass on cooling below 100 °C and the DSC signals (not shown) indicate an exothermic process, corresponding with physical condensation of water. Their FTIR spectra show increasing H-O-H scissoring vibrations (1611 cm-1 in silica glass),64 confirming the uptake of molecular water. Increasing Si-O stretching vibrations of silanol groups (~900 cm-1)55,56,64 indicate that some siloxane bonds were hydrolyzed. Furthermore, the O-H stretching vibrations in hydrogen-bonded hydroxyl groups (3600-3200 cm-1)55,56,64 increased and the O-H stretching vibrations in isolated silanol groups (~3690 cm-1)55 decreased. All this corresponds with networks having significant hydroxyl concentrations and open microporosity. BTMSH- and BTESO-derived networks had hydroxyl concentrations similar to those of the other bridged networks, but their relatively long alkylene bridges tend to fill up empty spaces and make the pore surfaces hydrophobic. The TGA curves indeed show only minor mass uptake. Their FTIR spectra indicate a clear increase in O-H stretching vibrations in hydrogen-bonded hydroxyl groups (3600-3200 cm-1). Minor increases in the H-O-H scissoring vibrations (1611 cm-1) (though barely distinguishable for BTMSH) and Si-O stretching vibrations in silanol groups (~900 cm-1) indicate the uptake of some molecular water and hydrolysis of siloxane bonds, respectively. The TGA curves indicate no mass uptake for PTMS-, CHTMS- and BMDESE-derived networks, despite their significant hydroxyl concentrations of 0.4, 1.0 and 0.4 hydroxyl groups per Si, respectively. The increase of their O-H stretching vibrations in hydrogen-bonded hydroxyl groups (3600-3200 cm-1) does suggest an increasing hydroxyl concentration and for the PTMS-derived network also the H-O-H scissoring vibrations (1611 cm-1)

20 | Hydrothermal stability of organosilicas
1
1
1
1
1
Figure 4. a) TGA data of all (organo)silica materials under humidified N2 flow. The curves are plotted as water uptake per mol Si atoms, with a vertical offset to facilitate comparison. The listed values denote the uptake at the end of the 50 °C segment averaged over three consecutive cycles. b) FTIR spectra (diffuse reflectance) of all (organo)silica materials under humidified N2 flow at the end of the 300 °C segment (black curves) and at the end of the 50 °C segment (colored curves).
increased. Apparently, the terminal alkyl groups filled up most of the space in between the network backbones. For MTMS- and PHTMS-derived networks both their TGA curves and FTIR spectra show no uptake of water and the increase in hydroxyl vibrations was minimal. All in all, the abundantly microporous networks
-2200
-2100
-2000
-1900
-1800
-1700
-1600
-1500
-1400
-1300
-1200
-1100
-1000
-900
-800
-700
-600
-500
-400
-300
-200
-100
0
100
200
300
-16
-15
-14
-13
-12
-11
-10
-9
-8
-7
-6
-5
-4
-3
-2
-1
0
1
2
3
5678910111213141516
Tem
pera
ture
[°C]
Wat
er u
ptak
e +
offs
et [m
olH
2O/m
olSi]
Time [h]
TEOS (0.26)
BTESM (1.12)
BTESE (0.58)
BTMSH (0.08)
BTESO (0.10)
BTESB (1.31)
MTMS (0.01)
PTMS (0.01)
CHTMS (0.02)
PHTMS (0.01)
BMDESE (0.02)
a)
0 3 6 9
-0.95873 -1.92996 -1.93439 -2.87243 -2.88002 -3.7427 -3.76031 -4.76283 -4.7821-0.95846 -1.92924 -1.93343 -2.87258 -2.88041 -3.74255 -3.76052 -4.76348 -4.7824-0.95761 -1.92887 -1.93295 -2.87213 -2.8801 -3.74195 -3.76023 -4.76396 -4.7829-0.95656 -1.92816 -1.93319 -2.87117 -2.87935 -3.74075 -3.75976 -4.76382 -4.7828-0.95635 -1.92724 -1.93349 -2.87027 -2.87888 -3.74002 -3.7593 -4.76312 -4.7823-0.95688 -1.92702 -1.93353 -2.86974 -2.87856 -3.74025 -3.75904 -4.76248 -4.781-0.95721 -1.92748 -1.9333 -2.86951 -2.87833 -3.74072 -3.75908 -4.76246 -4.7817-0.95756 -1.92792 -1.93322 -2.86957 -2.87865 -3.74121 -3.75902 -4.76263 -4.7820-0.95791 -1.92828 -1.93346 -2.87023 -2.87934 -3.7416 -3.75872 -4.76253 -4.7823-0.95739 -1.92852 -1.93332 -2.87109 -2.87973 -3.74117 -3.75851 -4.76267 -4.7825
-0.9565 -1.92813 -1.93274 -2.87126 -2.87972 -3.7403 -3.75846 -4.76305 -4.7821-0.95615 -1.927 -1.93268 -2.87086 -2.87939 -3.74007 -3.75861 -4.76311 -4.7816
-0.9562 -1.9261 -1.93331 -2.87018 -2.87868 -3.74061 -3.75927 -4.76282 -4.7817-0.95635 -1.92624 -1.93379 -2.86943 -2.87828 -3.74153 -3.7602 -4.76225 -4.78-0.95673 -1.9269 -1.93341 -2.86936 -2.87892 -3.74197 -3.76026 -4.76158 -4.7819-0.95721 -1.92709 -1.93243 -2.86983 -2.87953 -3.74135 -3.75932 -4.7615 -4.7817-0.95705 -1.92631 -1.93204 -2.86975 -2.87882 -3.74083 -3.7588 -4.76209 -4.7815-0.95612 -1.92517 -1.93275 -2.86903 -2.8779 -3.74109 -3.75914 -4.76242 -4.7813
-0.9553 -1.92473 -1.93362 -2.86855 -2.87811 -3.74132 -3.75916 -4.76229 -4.7813-0.95502 -1.92513 -1.93386 -2.86856 -2.87868 -3.741 -3.75851 -4.76204 -4.7815-0.95495 -1.92566 -1.93384 -2.86874 -2.87858 -3.74031 -3.75797 -4.7615 -4.7818-0.95494 -1.92552 -1.93356 -2.86907 -2.87809 -3.73972 -3.75771 -4.76116 -4.7820-0.95499 -1.92448 -1.9325 -2.86938 -2.87788 -3.73956 -3.75764 -4.7613 -4.7822-0.95478 -1.92303 -1.93156 -2.86931 -2.87799 -3.73974 -3.75792 -4.76131 -4.7827-0.95454 -1.92183 -1.93178 -2.86833 -2.87802 -3.73995 -3.75819 -4.7614 -4.7834-0.95487 -1.9209 -1.93181 -2.86676 -2.87773 -3.73995 -3.75819 -4.76175 -4.7839-0.95519 -1.92018 -1.93076 -2.86626 -2.87746 -3.73971 -3.75837 -4.76171 -4.7837-0.95472 -1.92015 -1.92983 -2.86733 -2.87765 -3.73953 -3.75887 -4.76159 -4.7832-0.95413 -1.92056 -1.92998 -2.86888 -2.87815 -3.73943 -3.75923 -4.76188 -4.782-0.95409 -1.92042 -1.93107 -2.86973 -2.8783 -3.73899 -3.75924 -4.76194 -4.7830-0.95394 -1.9196 -1.93182 -2.86948 -2.87799 -3.73827 -3.75886 -4.76156 -4.7833-0.95323 -1.91912 -1.9316 -2.86865 -2.87785 -3.73759 -3.758 -4.76109 -4.7831-0.95277 -1.91955 -1.9316 -2.86756 -2.87784 -3.73714 -3.75729 -4.76075 -4.7824-0.95292 -1.92005 -1.93203 -2.86674 -2.87732 -3.73766 -3.75762 -4.76081 -4.7819-0.95297 -1.91965 -1.93203 -2.86669 -2.87636 -3.7387 -3.75847 -4.76088 -4.7817-0.95282 -1.91898 -1.93186 -2.86673 -2.87589 -3.73879 -3.75859 -4.76052 -4.7813-0.95283 -1.919 -1.93171 -2.86665 -2.87621 -3.73795 -3.75784 -4.75999 -4.7806-0.95294 -1.91902 -1.93135 -2.86686 -2.87709 -3.73726 -3.75696 -4.7594 -4.7802-0.95341 -1.91859 -1.93128 -2.86726 -2.87836 -3.73724 -3.75647 -4.75913 -4.7802-0.95406 -1.91835 -1.93179 -2.86748 -2.87935 -3.73783 -3.75674 -4.75947 -4.7806-0.95374 -1.91862 -1.93235 -2.86751 -2.87953 -3.73852 -3.75753 -4.75983 -4.781-0.95268 -1.91922 -1.93245 -2.86761 -2.87916 -3.73855 -3.75763 -4.75964 -4.7820-0.95228 -1.91964 -1.9321 -2.86766 -2.87868 -3.7379 -3.75707 -4.7593 -4.7816-0.95255 -1.91937 -1.93185 -2.8671 -2.8783 -3.73746 -3.75722 -4.75934 -4.7812-0.95259 -1.91878 -1.93233 -2.866 -2.87811 -3.73768 -3.75796 -4.75936 -4.7811-0 95202 -1 91834 -1 93307 -2 86515 -2 87812 -3 73809 -3 7582 -4 75895 -4 7810
5007501000125015001750200022502500275030003250350037504000
Abso
rban
ce [a
.u.]
Wavenumber [cm-1]
b)KBr
TEOS
BTESM
BTESE
BTMSH
BTESO
BTESB
BMDESE
MTMS
PTMS
CHTMS
PHTMS

Results and discussion | 21
1
1
1
1
1
with short or rigid bridges showed a large uptake of water. However, the water uptake does not seem to be correlated to the carbon concentration or the hydroxyl concentration of the networks.
Hydrothermal dissolution
The dissolution tendency of the (organo)silica materials was assessed by soaking millimeter-sized sample pieces, after consolidation at 300 °C for 3 h, in aqueous solutions at 80 °C and varying pH. The aqueous solutions contained 15 vol% 1,5-pentanediol to improve the solvability and solubility of organosilica molecules with significant hydrophobic character. The elemental Si concentration after soaking for 46 h was analyzed by ICP-OES and XRF. ICP-OES analysis is preferred for such low concentrations due to its higher sensitivity than XRF, but ICP-OES requires atomization of Si. This atomization may be influenced by the different organic groups in the networks, possibly resulting in misinterpretation. XRF analysis does not involve atomization and therefore XRF measurements were done to seek confirmation of trends observed with ICP-OES. Results are shown in Figure 5. Note that the results indicate the degree of Si dissolution after soaking for 46 h and do not represent varying dissolution rates or equilibrium values. Since the available sample surface area was not controlled during hydrothermal treatment, care should be taken in interpreting small differences in degrees of dissolution.
When comparing the organically bridged networks at pH 13, significant concentrations of dissolved Si were found for BTESB > BTESM > BTESE and only a low degree of dissolution was observed for the BTMSH- and BTESO-derived networks. This corresponds with the order in network rigidity and Si-O-Si bond strain BTESB
Figure 5. Si concentrations measured in solution after soaking of (organo)silica pieces in demi water with 15 vol% 1,5-pentanediol and varying pH at 80 °C for 46 h. The darker colored bars with corresponding numeric values represent ICP-OES data recorded at 252.851 nm with a detection limit of 0.8 mg L-1 (concentrations below the detection limit are shown as zero) and a standard deviation of <3% for all values. The lighter colored bars represent XRF data with an estimated detection limit of 500 mg L-1.
49 3 0 0 0 2 0 0 0 0 0
653
088
7 3 2 2 3 0 0 0 0 15
933
1
2072
631
1103 2
1175
276
2 2
960
2
1244
00
500
1000
1500
2000
TEOS BTESM BTESE BTMSH BTESO BTESB MTMS PTMS CHTMS PHTMS BMDESE DPDMS blank
Si d
isso
lutio
n [m
g L-1
]
total Si per experiment: 2.8 g L-1
pH 1 | pH 7 | pH 13

22 | Hydrothermal stability of organosilicas
1
1
1
1
1
> BTESM > BTESE > BTMSH ≈ BTESO as expected based on bridge flexibility and length and as corroborated by the 29Si CP-MAS-NMR (Figure 2) and FTIR (Figure 3) spectra. The same order was found for the water uptake (Figure 4) and microporosity is indeed related to the rigidity and length of the organic bridge (spacing effect). This makes it difficult to distinguish between the effects of Si-O-Si bond strain and water concentration inside the network on hydrothermal dissolution. However, comparing the extensive dissolution of PHTMS-derived material to the absent dissolution of CHTMS-derived material does confirm the importance of bond strain; both networks have a negligible water uptake and the same carbon concentration and maximum possible connectivity, but the PHTMS-derived network is expected to have significantly more bond strain due to the rigid phenyl rings.
Although the organically bridged networks had high connectivities, this did not prevent significant dissolution of BTESB-, BTESM- and BTESE-derived material. On the other hand, the MTMS-derived network was unstrained, non-porous and hydrophobic and thus only had a low connectivity (2.9 siloxane bonds per monomer, see Table 2) to explain its dissolution. The DPDMS-derived material had a low connectivity (2.0 siloxane bonds per monomer) but also possible bond strain as indicated by the 29Si CP-MAS-NMR chemical shift, both of which may explain its extreme instability. The poorly connected PTMS- and CHTMS-derived networks (2.6 and 2.0 siloxane bonds per monomer, respectively) showed no Si dissolution, suggesting that low connectivity in turn can be compensated by hydrophobic shielding. Also, the large number of hydroxyl groups ‘standing by’ in networks such as the one derived from CHTMS facilitates rapid bond reformation after bond breakage. This increases the resistance to complete disconnection despite the low number of actual siloxane bonds. The effectiveness of hydrophobic shielding is expected to depend significantly on the positioning of the organic segments in the network. Note that organic shielding of siloxane bonds is not directly related to the water uptake of a material; the networks with the lowest water uptake (MTMS- and PHTMS-derived) had small and rigid organic groups with little shielding capability and showed extensive hydrothermal dissolution. In addition to shielding effects, large organic groups may provide stabilization via physical entanglement and their solvation is expected to be somewhat suppressed by the polar nature of the solvent mixture (85/15 vol% water/1,5-pentanediol).
As for the pH dependence of dissolution, Si concentrations were lower at pH 1 than at pH 7 throughout the series of compositions. This underlines that the occurrence of hydrolysis reactions as such does not necessarily lead to net material dissolution. Hydrolysis as well as recondensation are catalyzed by acidic species, but the rate of recondensation apparently outweighed hydrolysis in the experiments discussed here. Possibly, the acidic treatment may even have improved the resistance against

Results and discussion | 23
1
1
1
1
1
dissolution via network restructuring. The extensive dissolution of DPDMS-derived material at pH 13 was only slightly lower at pH 7 and pH 1, indicating that this network was so labile that increasing catalyst concentrations did not affect the dissolution strongly. For TEOS-, BTESM-, BTESE-, BTESB-, MTMS- and PHTMS-derived networks the dissolved Si concentration after 46 h was reduced by at least two orders of magnitude from pH 13 to pH 7 and pH 1, indicating a more kinetically limited degradation. For the BMDESE-derived network, minor dissolution was observed at pH 7 and even less dissolution occurred at pH 13. A possible explanation for this unusual trend is the electron induction effect of each Si atom being bound to two C atoms instead of one or none. Organic groups are less electron-withdrawing than O atoms in bonds with Si and thus leave the Si atom less susceptible to nucleophilic attack (the mechanism of base-catalyzed hydrolysis, predominant at pH 13). Acid-catalyzed hydrolysis (increasingly dominant at lower pH) involves electrophilic attack of the O atom and is less directly affected by electron density variations on Si.
As for the XRF results of the series, most of the ICP-OES values above the estimated XRF detection limit of about 500 mg L-1 were confirmed by similar XRF values. The ICP-OES values were not consistently lower than the XRF results, indicating no errors due to atomization effects. All in all, the results indicate a complicated balance between various stabilizing and destabilizing factors. Bond strain appears to be an important destabilizing force, while the stabilizing effect of higher connectivity is weak. No correlation is observed between hydrothermal dissolution and carbon concentration, hydroxyl concentration or monomer mass (diffusivity after disconnection). Limited correlation is observed between hydrothermal dissolution and water uptake.
Hydrothermal stability is an important issue for the application of organosilica materials in water-containing environments, e.g. as separation membranes or catalyst supports. Materials and devices are usually tested on structural integrity in terms of maintaining separation performance in microporous membranes and maintaining mesoporous order in PMOs. Changes herein can be more subtle than the material dissolution process investigated in the present study. Nevertheless, hydrothermal dissolution is the extreme outcome of similar interactions with aqueous species. The results presented here show that extensive contact between the organosilica network and water is not problematic as long as the network flexibility and connectivity, space and shielding are properly balanced. Networks with organic groups in bridging positions are not necessarily more stable than materials with terminal organics. Even a network with an actual connectivity of 2 siloxane bonds per monomer can be fully resistant to dissolution (CHTMS-derived network) and almost absent hydrophilicity does not prevent it (MTMS-derived network).

24 | Hydrothermal stability of organosilicas
1
1
1
1
1
Conclusion The network state, water uptake and hydrothermal dissolution of a series of organosilica materials with bridging and terminal organic groups was studied. 29Si CP-MAS-NMR and FTIR indicated decreasing bond strain and a slightly increasing condensation degree with increasing bridge length, due to increased rotational freedom and sufficient microporosity to accommodate increasing bulkiness of the organic groups. Networks with small terminal organic groups had higher condensation degrees than the equivalent bridged networks, while bulky terminal groups sterically hindered condensation. The average number of hydroxyl groups per Si atom varied between 0.5 and 0.7 for the organically bridged networks, indicating significant hydrophilicity. For the networks with terminal organic groups the number of hydroxyl groups per Si atom varied between 0.0 and 1.0. TGA-DSC and FTIR monitoring during moisture treatments indicated a large water uptake in microporous networks with short or rigid bridges. The water uptake was not directly related to the carbon concentration or hydroxyl concentration of the networks. ICP-OES and XRF analyses after hydrothermal treatment indicated that sensitivity to hydrothermal dissolution was significantly increased by bond strain. The stabilizing effect of increased connectivity was weak and no correlation was observed between hydrothermal dissolution and carbon concentration or hydroxyl concentration. Extensive contact between the organosilica network and water is not problematic as long as network flexibility and connectivity, space and shielding are properly balanced. Networks with organic groups in bridging positions are not necessarily more stable than materials with terminal organic groups.
The observed increase in hydrothermal dissolution with increasing bond strain indicates that the hydrothermal stability of a given material can be improved by relaxing the network. This can be done by further optimization of the fabrication process; the gelation and drying phases in sol-gel procedures are expected to introduce significant internal strain and more gradual transitions may be beneficial in this respect. Synthesizing materials via base catalysis instead of acid catalysis is not expected to benefit hydrothermal stability, because the generally obtained higher density and connectivity may easily increase the bond strain. After synthesis, hydrothermal restructuring or catalyst post-treatments can be employed to relieve internal strain. Inducing condensation and hydrolysis in an alternating fashion may stimulate evolution of the network into a more favorable configuration via iterative reconnections, which may ultimately enable total structural relaxation. A study on this iterative stabilization approach is presented in Chapter 3. All in all, controlling the balance between all factors for customized material performance is an intricate challenge, but the possibilities of molecular design and network optimization reach far.

Acknowledgements | 25
1
1
1
1
1
Acknowledgements Financial support from the Advanced Dutch Energy Materials (ADEM) program of the Dutch Ministry of Economic Affairs, Agriculture and Innovation is gratefully acknowledged. Pieter de Waard and the Wageningen NMR Centre (The Netherlands) are acknowledged for the 29Si CP-MAS-NMR measurements. Michiel Hamer is acknowledged for the preparation of several samples.
References 1. S.S. Latthe, H. Imai, V. Ganesan, A.V. Rao, Microporous Mesoporous Mater. 2010, 130, 115–121. 2. V. Purcar, I. Stamatin, O. Cinteza, C. Petcu, V. Raditoiu, M. Ghiurea, T. Miclaus, A. Andronie, Surf.
Coatings Technol. 2012, 206, 4449–4454. 3. Y. Ma, H.R. Lee, K. Okahana, M. Kanezashi, T. Yoshioka, T. Tsuru, Desalin. Water Treat. 2013, 51, 5149–
5154. 4. M. Kanezashi, K. Yada, T. Yoshioka, T. Tsuru, J. Memb. Sci. 2010, 348, 310–318. 5. K.S. Chang, T. Yoshioka, M. Kanezashi, T. Tsuru, K.-L. Tung, Chem. Commun. 2010, 46, 9140–9142. 6. K.S. Chang, T. Yoshioka, M. Kanezashi, T. Tsuru, K.L. Tung, J. Memb. Sci. 2011, 381, 90–101. 7. T. Shimoyama, T. Yoshioka, H. Nagasawa, M. Kanezashi, T. Tsuru, Desalin. Water Treat. 2013, 51,
5248–5253. 8. H.L. Castricum, A. Sah, R. Kreiter, D.H.A. Blank, J.F. Vente, J.E. ten Elshof, J. Mater. Chem. 2008, 18,
2150–2158. 9. H.L. Castricum, A. Sah, R. Kreiter, D.H.A. Blank, J.F. Vente, J.E. ten Elshof, Chem. Commun. 2008,
1103–1105. 10. H.L. Castricum, R. Kreiter, H.M. van Veen, D.H.A. Blank, J.F. Vente, J.E. ten Elshof, J. Memb. Sci.
2008, 324, 111–118. 11. R. Kreiter, M.D.A. Rietkerk, H.L. Castricum, H.M. van Veen, J.E. ten Elshof, J.F. Vente, ChemSusChem
2009, 2, 158–160. 12. H.M. van Veen, M.D.A. Rietkerk, D.P. Shanahan, M.M.A. van Tuel, R. Kreiter, H.L. Castricum, J.E. ten
Elshof, J.F. Vente, J. Memb. Sci. 2011, 380, 124–131. 13. M. Kanezashi, K. Yada, T. Yoshioka, T. Tsuru, J. Am. Chem. Soc. 2009, 131, 414–415. 14. R. Xu, J. Wang, M. Kanezashi, T. Yoshioka, T. Tsuru, Langmuir 2011, 27, 13996–13999. 15. R. Xu, J. Wang, M. Kanezashi, T. Yoshioka, T. Tsuru, Am. Inst. Chem. Eng. J. 2013, 59, 1298–1307. 16. H.L. Castricum, G.G. Paradis, M.C. Mittelmeijer-Hazeleger, W. Bras, G. Eeckhaut, J.F. Vente, G.
Rothenberg, J.E. ten Elshof, Microporous Mesoporous Mater. 2014, 185, 224–234. 17. H. Song, S. Zhao, J. Chen, H. Qi, Microporous Mesoporous Mater. 2016, 224, 277–284. 18. H. Song, S. Zhao, J. Lei, C. Wang, H. Qi, J. Mater. Sci. 2016, 51, 6275–6286. 19. B.J. Melde, B.T. Holland, C.F. Blanford, A. Stein, Chem. Mater. 1999, 11, 3302–3308. 20. M.C. Burleigh, M.A. Markowitz, S. Jayasundera, M.S. Spector, C.W. Thomas, B.P. Gaber, J. Phys.
Chem. B 2003, 107, 12628–12634. 21. Q. Yang, Y. Li, L. Zhang, J. Yang, J. Liu, C. Li, J. Phys. Chem. B 2004, 108, 7934–7937. 22. W. Guo, X. Li, X.S. Zhao, Microporous Mesoporous Mater. 2006, 93, 285–293. 23. F. Goethals, C. Vercaemst, V. Cloet, S. Hoste, P. van der Voort, I. van Driessche, Microporous
Mesoporous Mater. 2010, 131, 68–74. 24. D. Esquivel, C. Jiménez-Sanchidrián, F.J. Romero-Salguero, Mater. Lett. 2011, 65, 1460–1462. 25. G. Smeulders, V. Meynen, A. Silvestre-Albero, K. Houthoofd, M. Mertens, J. Silvestre-Albero, J.A.
Martens, P. Cool, Mater. Chem. Phys. 2012, 132, 1077–1088. 26. Y. Xia, W. Wang, R. Mokaya, J. Am. Chem. Soc. 2005, 127, 790–798.

26 | Hydrothermal stability of organosilicas
1
1
1
1
1
27. S. Inagaki, S. Guan, T. Ohsuna, O. Terasaki, Nature 2002, 416, 304–307. 28. E.B. Cho, K. Char, Chem. Mater. 2004, 16, 270–275. 29. M.A. Wahab, H. Chaobin, J. Nanosci. Nanotechnol. 2011, 11, 8481–8487. 30. Y. Xia, R. Mokaya, Microporous Mesoporous Mater. 2005, 86, 231–242. 31. M.I. López, D. Esquivel, C. Jiménez-Sanchidrián, P. van der Voort, F.J. Romero-Salguero, J. Phys.
Chem. C 2014, 118, 17862–17869. 32. A.P. Dral, K. Tempelman, E.J. Kappert, L. Winnubst, N.E. Benes, J.E. ten Elshof, J. Mater. Chem. A
2017, 5, 1268–1281. 33. L. López Pérez, E.R.H. van Eck, I. Melián-Cabrera, Microporous Mesoporous Mater. 2016, 220, 88–
98. 34. A. Sayari, P. Liu, M. Kruk, M. Jaroniec, Chem. Mater. 1997, 9, 2499–2506. 35. M. Kruk, M. Jaroniec, A. Sayari, Microporous Mesoporous Mater. 1999, 27, 217–229. 36. K. Yoshida, Y. Hirano, H. Fujii, T. Tsuru, M. Asaeda, J. Chem. Eng. Japan 2001, 34, 523–530. 37. H.-P. Lin, C.-Y. Mou, Microporous Mesoporous Mater. 2002, 55, 69–80. 38. J.H. Lei, D. Liu, L.P. Guo, X.M. Yan, H. Tong, J. Sol-Gel Sci. Technol. 2006, 39, 169–174. 39. H.P. Lin, C.Y. Mou, S.B. Liu, Chem. Lett. 1999, 28, 1341–1342. 40. H.P. Lin, C.Y. Mou, S.B. Liu, Adv. Mater. 2000, 12, 103–106. 41. I.V. Melnyk, Y.L. Zub, E. Véron, D. Massiot, T. Cacciaguerra, B. Alonso, J. Mater. Chem. 2008, 18,
1368–1382. 42. J. Wang, G. Gong, M. Kanezashi, T. Yoshioka, K. Ito, T. Tsuru, Chem. Lett. 2012, 41, 1663–1665. 43. J. Wang, G. Gong, M. Kanezashi, T. Yoshioka, K. Ito, T. Tsuru, J. Memb. Sci. 2013, 441, 120–128. 44. G. Gong, H. Nagasawa, M. Kanezashi, T. Tsuru, ACS Appl. Mater. Interfaces 2016, 8, 11060–11069. 45. W. Wang, D. Grozea, S. Kohli, D.D. Perovic, G.A. Ozin, ACS Nano 2011, 5, 1267–1275. 46. G. Cerveau, R.J.P. Corriu, C. Lepeytre, P.H. Mutin, J. Mater. Chem. 1998, 8, 2707–2713. 47. G. Cerveau, R.J.P. Corriu, J. Dabosi, C. Fischmeister-Lepeytre, R. Combarieu, Rapid Commun. mass
Spectrom. 1999, 13, 2183–2190. 48. J.E. ten Elshof, A.P. Dral, J. Sol-Gel Sci. Technol. 2016, 79, 279–294. 49. D.S. Wragg, R.E. Morris, A.W. Burton, Chem. Mater. 2008, 20, 1561–1570. 50. P. Mohanty, B. Kokoszka, C. Liu, M. Weinberger, M. Mandal, V. Stagno, Y. Fei, K. Landskron,
Microporous Mesoporous Mater. 2012, 152, 214–218. 51. D. Li, Y. Han, J. Song, L. Zhao, X. Xu, Y. Di, F.-S. Xiao, Chem. Eur. J. 2004, 10, 5911–5922. 52. R. Viitala, M. Jokinen, S. Tuusa, J.B. Rosenholm, H. Jalonen, J. Sol-Gel Sci. Technol. 2005, 36, 147–
156. 53. H.L. Castricum, G.G. Paradis, M.C. Mittelmeijer-Hazeleger, R. Kreiter, J.F. Vente, J.E. ten Elshof, Adv.
Funct. Mater. 2011, 21, 2319–2329. 54. H.E. Bergna, W.O. Roberts, (ed.) Colloidal Silica: Fundamentals and Applications. CRC Press, Taylor
& Francis Group: Boca Raton, 2005; pp 69. 55. P.J. Launer, Infrared Analysis of Organosilicon Compounds: Spectra-Structure Correlations. In
Silicone Compounds Register and Review; 1987; pp 100–103. 56. G. Socrates, Infrared Characteristic Group Frequencies: Tables and Charts, 2nd ed.; Wiley:
Chichester, 1994. 57. A.L. Smith, (ed.) The Analytical Chemistry of Silicones. Wiley: New York, 1991; pp 373-374. 58. E. Liepins, I. Zicmane, E. Lukevics, J. Organomet. Chem. 1986, 306, 167–182. 59. Supplementary material of A.P. Dral, C. Lievens, J.E. ten Elshof, Langmuir 2017, 33, 5527–5536,
accessible via http://pubs.acs.org/doi/suppl/10.1021/acs.langmuir.7b00971. 60. H.W. Oviatt, K.J. Shea, J.H. Small, Chem. Mater. 1993, 5, 943–950. 61. R.H. Glaser, G.L. Wilkes, C.E. Bronnimann, J. Non. Cryst. Solids 1989, 113, 73–87. 62. B. Handke, W. Jastrzebski, W. Mozgawa, A. Kowalewska, J. Mol. Struct. 2008, 887, 159–164. 63. T. Iwamura, K. Adachi, Y. Chujo, Chem. Lett. 2010, 39, 354–355. 64. K.M. Davis, M. Tomozawa, J. Non. Cryst. Solids 1996, 201, 177–198.

Abstract | 27
2
2
2
2
2
2
Long-term structural evolution
and condensation in microporous
organosilica membranes
This chapter is published as:
A.P. Dral, K. Tempelman, E.J. Kappert, L. Winnubst, N.E. Benes, J.E. ten Elshof, Long-term flexibility-based structural evolution and condensation in microporous organosilica membranes for gas separation, Journal of Materials Chemistry A 2017, 5, 1268-1281.

28 | Long-term structural evolution and condensation in microporous organosilica membranes
2
2
2
2
2

Abstract | 29
2
2
2
2
2
Abstract Hybrid organosilica molecular sieving membranes with ethylene bridges are generally consolidated at 250-300 °C for 2-3 hours, after which the material structure is assumed to be stabilized. This study shows that the consolidation process still continues at these temperatures after days to weeks. Ongoing condensation and structural evolution are studied in powders, films and gas permeation membranes derived from 1,2-bis(triethoxysilyl)ethane (BTESE). The materials are kept at temperatures up to 300 °C for days and analyzed with in-situ Fourier-transform infrared spectroscopy, 29Si cross-polarized magic angle spinning nuclear magnetic resonance, in-situ spectroscopic ellipsometry, in-situ gas permeation and in-situ X-ray reflectivity. A continuously ongoing decrease in both silanol concentration and film thickness is observed, accompanied by changes in density, thermal expansion and micropore structure. The changes in the micropore structure are found to depend on pore size and affect the gas permeation performance of membranes. An important factor in the structural evolution is the network flexibility. Materials containing no organic bridges, short flexible bridges or long rigid bridges (derived from tetraethoxysilane, bis(triethoxysilyl)methane and 1,4-bis(triethoxysilyl)benzene, respectively) also show ongoing condensation, but their shrinkage rate is smaller as compared to BTESE-derived networks. A BTESE-derived film kept at 236 °C for 12 days still shows no signs of approaching a structurally stabilized state.
Introduction The mixed organic-inorganic nature of hybrid organosilica materials, glasses in which part of the Si-O-Si linkages are replaced by Si-R-Si linkages, provides an interesting combination of material properties. The silica moieties provide mechanical rigidity and high thermal and chemical stability, while the organic groups can introduce flexibility, hydrophobicity and a variety of functional groups. Furthermore, organic bridges act as spacers and can increase the micropore size and volume, though highly flexible and bulky bridges may collapse and fill the empty spaces. An extensively studied example of hybrid organosilica is the ethylene-bridged network, usually derived from the precursor 1,2-bis(triethoxysilyl)ethane (BTESE). The introduction of these ethylene bridges between Si atoms improves the fracture resistance of the material as compared to both pure silica and silica with organic terminal groups1,2 and a high Young’s modulus is maintained at high porosities.1 The ethylene bridge tends to enhance the average micropore size as compared to pure silica,3–6 but despite the addition of hydrophobic organic segments the material keeps on having a significant affinity for water.6–10 Ethylene-bridged organosilica in mesoporous architectures is particularly interesting as low-k material,1,11 is UV-responsive upon metal doping12 and has been used in chiral thermochromic composites.13 An

30 | Long-term structural evolution and condensation in microporous organosilica membranes
2
2
2
2
2
important application of microporous BTESE-derived organosilica is in molecular sieving membranes,14–16 which are being employed industrially.
Hybrid organosilica molecular sieving membranes can be used e.g. for H2 or CO2 gas separation,3,17–21 pervaporation dehydration of alcohols14–17,22 and pervaporation or reverse osmosis desalination of water.23–25 BTESE-derived membranes have replaced pure silica membranes due to their superior stability under hydrothermal operation conditions.14,15 However, this new generation of membranes displays a slow ongoing flux decline during operation at 95-150 °C for more than a year,14,15,26 which causes practical difficulties in industrial processes. To date, this problem of ongoing evolution of the pore structure and resulting time-dependent flux has not been understood or solved.
Insight in the origin of this subtle but relevant long-term change in the material may be obtained by studying the role of ongoing hydrolysis and condensation reactions. The flux decline in organically bridged molecular sieving membranes appears to be enhanced by the presence of nitric acid in the feed stream.15,26 A similar slow flux decline in dimethoxydiphenylsilane-derived membranes has been shown to depend on the presence of water in the feed stream.27 The overall degrading effect of water on organically bridged silica membranes is impressively reduced as compared to the extreme instability of pure silica materials under hydrothermal conditions.14,15 However, there still is close contact between the organosilica network and aqueous species and this can lead to chemical and structural changes over time.7,8,28 The condensation state also depends on preceding consolidation treatments, which are generally limited to heating to 250-300 °C for a few hours for BTESE-derived materials. The bridging ethylene group is stable at these temperatures when kept in a N2 atmosphere,3,14,29–31 but the actual process of consolidation in organosilica materials is a largely unexplored area. Chemically it involves condensation of residual silanol groups into siloxane bonds and this process has been studied extensively for pure silica, but in organosilica the surrounding matrix in which the condensation reactions occur is significantly different. Little is known about how the organic bridges affect the rate and extent of ongoing condensation, and how this in turn alters the network organization. For amorphous silica, temperatures around 1000 °C are required to approach complete removal of internal silanol groups,32 which leads to closure of micropores and appears to be irreversible.32 Silica surfaces generally require temperatures up to 750 °C to yield only isolated silanol groups32 and ambient water rehydrolyses the surface upon cooling. The incorporation of organic segments in silica shifts the balance of all these interactions, but the glassy network remains dynamic. Organic bridges significantly reduce the thermal stability of the material, making it impossible to fully dehydroxylate the network by thermal consolidation. Furthermore, introducing flexible organic bridges enhances the network flexibility

Experimental | 31
2
2
2
2
2
and makes the material to some degree polymer-like. Even if no chemical bonds are broken or formed, the network may still slowly rearrange into a more relaxed configuration. Occurrence of such processes over long periods of time can yield significant changes in the internal micropore structure of these materials. Improved understanding of these molecular-scale processes is important not only from a scientific viewpoint, but also to ensure stable long-term operation of applications based on this type of hybrid organosilica materials, such as H2 gas separation.
Two difficulties in the analysis of many organosilica materials are their poorly defined structure and their reactivity with atmospheric water. The Si-O-Si bond angle can vary roughly between 134° and 180°,33 causing a wide distribution in bond conformations. The challenge of probing the micropores in organosilica gets increasingly difficult as their sizes approach molecular dimensions, since the clear distinction between pore and wall vanishes and the system practically becomes a homogeneous material. To complicate things further, micropores tend to fill with atmospheric water and the accessible surface partially rehydrolyses. This inevitably causes some changes in the structure whenever the sample is transferred from analytical atmospheres and elevated temperatures to ambient conditions and vice versa. To monitor subtle changes in these materials in time, in-situ analyses are of critical importance. Such in-situ analyses form the core of the present study.
This chapter presents a study on ongoing chemical and structural changes in BTESE-derived films, powders and gas permeation membranes while kept at elevated temperatures for 10 h up to several days. The common assumption that the material reaches a stabilized structural state after treatment at 250-300 °C for a few hours is shown to be incorrect. The state of the material was monitored with in-situ Fourier-transform infrared spectroscopy (FTIR), 29Si cross-polarized magic angle spinning nuclear magnetic resonance spectroscopy (29Si-CP-MAS-NMR), in-situ spectroscopic ellipsometry (SE), in-situ gas permeation (GP) and in-situ X-ray reflectivity (XRR). A relation between chemical and structural changes was demonstrated by the effect of catalyst treatment. The role of the organic bridge was investigated by comparing BTESE-derived materials with materials prepared from tetraethoxysilane (TEOS), bis(triethoxysilyl)methane (BTESM) and 1,4-bis(triethoxysilyl)benzene (BTESB). The temperature dependence of the observed processes was investigated and their time span was explored. All in all, a better understanding of the origin of subtle ongoing flux decline in molecular separation membranes is presented and solutions to this problem are proposed.
Experimental Chemicals. 1,2-bis(triethoxysilyl)ethane (97% purity), tetraethoxysilane (99% purity), bis(triethoxysilyl)methane (97% purity) and 1,4-bis(triethoxysilyl)benzene (95%

32 | Long-term structural evolution and condensation in microporous organosilica membranes
2
2
2
2
2
purity) were obtained from ABCR. Nitric acid was obtained from Sigma Aldrich (70 wt% aqueous solution) and Acros (65 wt% aqueous solution). Hydrochloric acid (37 wt% aqueous solution) was obtained from Acros. Ethanol (dehydrated, 99.99% purity) was obtained from VWR and SeccoSolv. 1-butanol (99.8% purity), Mowiol 8-88 polyvinyl alcohol (PVA, Mw ~67.000) and aluminum-tri-sec-butoxide (97% purity) were obtained from Sigma Aldrich. Demi water with a resistivity of >5 MΩ·cm at room temperature was used.
Powder preparation. BTESE-derived powder was obtained by adding 3.24 mL demi water and 0.798 mL aqueous HNO3 (65 wt%) to 50 mL dry ethanol at room temperature, followed by adding 11.12 mL BTESE under stirring. The mixture was then heated to 333 K in an oil bath for 3 h, cooled to room temperature in a water bath and poured in plastic petri dishes to dry overnight. The resulting glass was ground to powder by ball milling. Powders of multiple synthesis batches were mixed to obtain one homogeneous stock for all experiments reported here. TEOS-derived powder was prepared identically with 30 mL dry ethanol, 6.06 mL demi water, 1.492 mL aqueous HNO3 (65 wt%) and 18.76 mL TEOS. BTESM-derived powder was prepared identically with 29 mL dry ethanol, 3.67 mL demi water, 0.903 mL aqueous HNO3 (65 wt%) and 11.86 mL BTESM. BTESB-derived powder was prepared identically with 30 mL dry ethanol, 1.21 mL demi water, 0.298 mL aqueous HNO3 (65 wt%), 4.48 mL BTESB and a reaction time of 50 min. For all syntheses the HNO3 : H2O : alkoxy ratio was 0.064 : 1.1 : 1.0. All powders were stored under ambient conditions.
Film preparation. Thin BTESE-derived films (45-50 nm) were made with the sol recipe for powders. After cooling to room temperature, part of the sol was mixed with 1-butanol in a 1:2 volume ratio and spin coated on silicon wafer substrates. Each substrate was coated with 20 µL solution at a spinning rate of 10.000 rpm for 10 s. Thick BTESE-derived films (ca. 175 nm) were made with a more concentrated sol. 25 mL dry ethanol was used instead of 50 mL, the other volumes and conditions remained unchanged. This sol was mixed with 1-butanol in a 1:1 volume ratio and each substrate was coated with 100 µL solution at a spinning rate of 4000 rpm for 10 s. The sol for TEOS-derived films (ca. 145 nm) was made with 25 mL dry ethanol, 2.91 mL demi water, 0.614 mL aqueous HNO3 (65 wt%) and 13.2 mL TEOS under otherwise identical conditions. The sol was mixed with 1-butanol in a 5:4 volume ratio and each substrate was coated with 100 µL solution at a spinning rate of 2500 rpm for 10 s. The sol for BTESM-derived films (ca. 150 nm) was made with 35 mL dry ethanol, 2.91 mL demi water, 0.614 mL aqueous HNO3 (65 wt%) and 10.4 mL BTESM under otherwise identical conditions. The sol was mixed with 1-butanol in a 1:0.8 volume ratio and each substrate was coated with 100 µL solution at a spinning rate of 2500 rpm for 10 s. The sol for BTESB-derived films (ca. 130 nm) was made with 4.0 mL dry ethanol, 0.201 mL demi water, 0.050 mL aqueous HNO3 (65 wt%), 0.735 mL BTESB

Experimental | 33
2
2
2
2
2
and a reaction time of 50 min under otherwise identical conditions. The sol was mixed with 1-butanol in a 10:7 volume ratio and each substrate was coated with 100 µL solution at a spinning rate of 5000 rpm for 10 s. All films were stored under ambient conditions.
Membrane preparation. Polished AKP30 α-alumina disks were obtained from Cobra Technologies BV and used as membrane supports. The supports were coated with a mesoporous γ-alumina layer and a BTESE-derived top layer, both applied under cleanroom 1000 conditions with a Velterop DA 3960/02 dip coater with a dipping speed of 1.4 cm/s. The preparation of the mesoporous γ-alumina coating was derived from the method described by Uhlhorn et al.34 2.25 g PVA was added to 75 g 0.05 M aqueous HNO3 solution and the mixture was heated under stirring to 80 °C for 2 h. 20 mL of the resulting PVA solution was filtered with a 0.8 µm filter and added to 30 mL 0.8 µm filtered boehmite sol prepared according to Uhlhorn et al.,34 followed by stirring and coating. The mesoporous γ-alumina layers were calcined at 650 °C in air for 3 h with heating and cooling rates of 1 °C min-1. BTESE-derived top layers with >0.4 nm pores were made with the sol recipe for powders. BTESE-derived top layers with ~0.3 nm pores were made as reported by Castricum et al.35 with a sol of 35 mL dry ethanol, 2.91 mL demi water, 0.614 mL aqueous HNO3 (65 wt%) and 11.0 mL BTESE prepared under otherwise identical conditions. Both sols were diluted with dry ethanol in a 1:1 volume ratio and filtered with a 0.2 µm filter before coating. The BTESE-derived top layers were consolidated at 300 °C in N2 for various times with heating and cooling rates of 5 °C min-1. All membranes were stored under ambient conditions.
Infrared spectroscopy. Fourier-transform infrared spectra were obtained with a Bruker Tensor 27 machine equipped with a Harrick Praying Mantis diffuse reflectance accessory, a high temperature reaction chamber and a room temperature DLaTGS detector. The reaction chamber was flushed continuously with humidified N2 during the experiments and the gas outlet was located directly underneath the sample with KBr background, ensuring proper gas flow through the powder. The N2 was humidified to a constant level by bubbling through demi water at room temperature. This was necessary to keep the KBr background stable in time, since KBr heated in dry N2 showed signs of slow dehydration that disturbed the hydroxyl signals. No alternative background material was available that performed better under the required conditions. As a precaution, the background stability was checked prior to each new experiment by heating the KBr to the target temperature and monitoring it for at least 15 h in the case of 60 h sample measurements and for at least 6 h in the case of 15 h sample measurements. The KBr was then cooled to 30 °C and a small amount of sample powder was put on top. After stabilizing the atmosphere for at least 45 min, the sample was heated to the target temperature in a few minutes and

34 | Long-term structural evolution and condensation in microporous organosilica membranes
2
2
2
2
2
spectra were recorded in-situ every 30 min with a resolution of 2 cm-1 and 78 or 116 scans per measurement.
29Si nuclear magnetic resonance spectroscopy. 29Si nuclear magnetic resonance spectra were obtained ex-situ with cross-polarization and magic angle spinning on a Bruker Avance 300 system. Spectra were recorded with a contact time of 3 ms, a recycle delay of 2 s and 1000 scans per sample. The -60 ppm T peak was fitted with three near-Gaussian components to obtain the condensation degree. Fitting was based on optimization of the peak location, the full width at half maximum (asymmetric), the Gaussian/Lorentzian mix (asymmetric) and the baseline.
Spectroscopic ellipsometry. Thickness and refractive index measurements of films were done with spectroscopic ellipsometry on a J.A. Woollam Co. M2000X spectroscopic ellipsometer equipped with a heating stage with quartz windows at 70° incident angle. The data in Figure 3, Table 1, Figure 9 and Figure 10 were collected with an HCS621V INSTEC heating stage. The data in Figure 8 and Table 2 were collected with a Linkam heating stage. The measurements were performed under ultrapure N2 at a flow rate of 100 mL min-1. A temperature correction was performed according to the procedure described by Kappert et al.36 (the difference between set point and actual temperature was up to 17 °C for the INSTEC stage and less than 1 °C for the Linkam stage). The optical retardance of the cell windows was included using calibrated delta off-sets. Prior to heating, the samples were dried at 25 °C under N2 flow for 3 h. To monitor the thermal expansion in time, the sample was heated instantly to 300 °C (set point). After every 3 h at 300 °C the temperature was temporarily and instantly decreased with steps of 25 °C and hold times of 10 min down to 25 °C. The coefficient of thermal expansion (CTE) was determined by the slope of the measured thickness as a function of the temperature. The CTE was then normalized with respect to the thickness at 25 °C of the corresponding temperature decrease. For measurements at constant temperature, the samples were heated to the set point temperature instantly (25 °C – 300 °C) and kept there for 10 h. In-situ data was recorded at least once every 2 min. The data was modelled using the J.A. Woollam Co. CompleteEase software package in the wavelength range of 370-1000 nm. The substrate was modelled using the built-in temperature-dependent optical properties of silicon and a 2 nm native oxide layer was added on top. The refractive index of the (organo)silica film was modelled at 632.8 nm wavelength using a Cauchy dispersion (fit parameters: A, B and thickness). The thickness and refractive index of the BTESE-derived samples at different temperatures were normalized to the thickness and refractive index obtained at 25 °C after drying under N2 flow for 180 min. The thickness and refractive index of the different (organo)silica samples were normalized to the thickness and refractive index after 10 min at 300 °C.

Results and discussion | 35
2
2
2
2
2
X-ray reflectivity. Thickness measurements of thin films were done with X-ray reflectivity on a PANalytical X’Pert PRO system equipped with an Empyrean tube with Cu anode, a parabolic W/Si mirror, an Anton Paar Domed Hot Stage 900 and a PIXcel3D detector. The films were kept under N2 flow at room temperature for 10 min before being heated to the target temperature with 60 °C min-1. Reflectivity curves were measured in-situ at 0.1-2° 2θ every 20 min. Thickness values were obtained by fitting the reflectivity oscillations in X’Pert Reflectivity software.
Gas permeation. Single-gas permeation measurements were performed with a Convergence Poseidon Inspector. The top layer of the membrane was positioned at the feed side. After heating to 200 °C the permeance was measured for He, N2, CH4, H2 and CO2 (measured in this order). This was repeated three times with intervals of 24 h under continuous permeance of H2 in between. The pressure difference for all measurements was 2 bar, the permeate side was at atmospheric pressure and the system was flushed for approximately 5 min after changing gases. The membrane was kept at 200 °C during the entire experiment.
Hydrochloric acid treatment. Thin films were dried on a hot plate at 200 °C for 30 min and then analyzed with in-situ XRR at 300 °C under N2 flow for 3 h. After cooling to room temperature the films were put on a plateau in a closed 200 mL vessel with 10 mL demi water or aqueous HCl (37 wt%). The bottom part of the vessel was immersed in an oil bath at 70 °C to generate a high vapor concentration inside. For safety considerations the HCl treatment was done inside a glove bag to contain escaping vapor. The films were kept in the vapor atmosphere for 4 h and then analyzed with in-situ XRR at 300 °C under N2 flow for 14 h.
Results and discussion
Condensation state
The chemical structure of BTESE-derived powder was monitored with in-situ FTIR while kept at 300 °C for 60 h. The absorption spectra in Figure 1 show a small but ongoing decrease of O-H stretching vibrations in hydrogen-bonded hydroxyl groups (3600-3200 cm-1) and Si-O stretching vibrations in silanol groups (~900 cm-1).37–39 This indicates an ongoing loss of silanol groups. The decrease of the left hand side of the ~900 cm-1 signal was partially reversible upon cooling in a moist atmosphere. This confirms its assignment to silanol groups as the condensation of surface silanol groups is known to be reversible. During treatment at 300 °C no spectral changes occurred around 1611 cm-1, the location of H-O-H scissoring vibrations in silica glass.38 This indicates that there was no loss of molecular water that could otherwise have been responsible for the decreasing hydroxyl signal at 3600-3200 cm-1. There was also no increase of molecular water, indicating that water formed by ongoing

36 | Long-term structural evolution and condensation in microporous organosilica membranes
2
2
2
2
2
Figure 1. In-situ FTIR spectra of BTESE-derived powder at 300 °C in humidified N2 atmosphere.
condensation could diffuse out of the film. The peak around 1375 cm-1 was assigned to in-plane O-H bending vibrations and kept on increasing. Since the overall amount of hydroxyl groups in any configuration (silanol, water, related species, with and without hydrogen bonds) decreased as indicated by the 3600-3200 cm-1 signal, the increase around 1375 cm-1 probably indicated an increase in freedom for hydroxyl groups to bend in-plane rather than a net increase of the amount of hydroxyl groups. The O-H in-plane bending vibration can occur over a wide range of wavenumbers (1440-1260 cm-1)39 and thus other possible assignments for the 1375 cm-1 peak were considered. However, the signal occurred at the same location in pure silica as well as in a variety of other organosilica compounds, indicating that the vibration did not originate from organic moieties and was insensitive to changes therein. Furthermore, it was consistently correlated to ongoing condensation. These indications all match assignment of the vibration to hydroxyl groups at Si. The increasing intensity of this peak accompanying the net loss of hydroxyl groups may be attributed to reduced steric hindrance of the bending vibrations of the remaining hydroxyl groups, which could indicate micropore widening.
No spectral changes were observed that indicate an increasing amount of siloxane bonds. The signal of Si-O-Si stretching vibrations (1150-1000 cm-1)37,39 is broad and strong and has a complicated shape due to longitudinal-optical-transverse-optical splitting.40,41 This, in combination with expected overlap with unstrained Si-CH2CH2-Si vibrations (1180-1120 cm-1)37 and Si-O-H bending vibrations (1030 cm-1),39 may render small changes invisible. Spectra recorded under attenuated total reflection tend to have better defined peaks in the siloxane region. However, the present
0
0.5
4000 3800 3601 3401 3201 3002 2802 2603 2403 2203 2004 1804 1605
Abso
rban
ce [-
]
Wavenumber [cm-1]
3704
2807
2891
a)
0.4
0.9
1.4
1500 1400 1300 1200 1099 999 899 798 698 598
Abso
rban
ce [-
]
Wavenumber [cm-1]
1405
1459
1270 ~915~1375 836 ~770 ~700b)
3 h6 h9 h12 h24 h36 h48 h60 h

Results and discussion | 37
2
2
2
2
2
spectra were recorded under diffuse reflection (required in combination with the temperature chamber) and thus probe more of the bulk of the material. Bulk regions are expected to be less well-defined than surface regions, explaining why no clear peaks could be obtained even at low intensities. Also no increasing intensity was observed around 800 cm-1, the expected location of Si-O-Si symmetric stretching vibrations.37,42
The integrity of the ethylene bridges throughout the thermal treatment was shown by the 3000-2800 cm-1 C-H stretching vibrations,39 the 1459 cm-1 H-C-H scissoring vibrations,39 the 1405 cm-1 C-H bending vibrations in Si-CH2CH2-Si,43–46 the 1270 cm-1 C-H bending vibrations in Si-CH2CH2-Si43,45,46 and the 770 cm-1 and 700 cm-1 Si-C stretching vibrations.45,46 The latter two are critically discussed elsewhere but were shown to be compatible with theoretical DFT calculations.44 A small decrease in the 3000-2800 cm-1 and 700 cm-1 signals hinted towards minor ongoing degradation, but the large majority of ethylene bridges remained intact. According to older literature reports the 1270 cm-1 absorption would correspond better to the methyl deformation in Si-CH3 (near the high end of 1280-1250 cm-1 for O3Si-CH3, instead of over the high end of 1250-1170 cm-1 for O3Si-CH2 with short alkyl chains37,39). However, it was similarly present in as-prepared BTESE-derived powder and did not change upon prolonged heat treatments. Since it is unlikely that many of the ethylene bridges were broken into terminal methyl groups during the mild synthesis procedure, the 1270 cm-1 peak was assigned to O3Si-CH2 groups (thus following the assignment of refs.43,45,46). All peak assignments were cross-checked with various other organosilica and pure silica materials, but the multitude and complexity of possible vibrations for BTESE-derived powder in the fingerprint region does leave uncertainty in various peak assignments. Furthermore, distinguishing spectral features is hindered by the intrinsically strong absorbance of silica moieties and the disordered nature of the network. Nevertheless, the results indicated an ongoing loss of silanol groups and thus most likely an increase in network connectivity. This occurred without a build-up of molecular water inside the network or degradation of the ethylene bridges.
The condensation of BTESE-derived powders as a function of time at 300 °C was analyzed ex-situ with 29Si CP-MAS-NMR. Spectra are shown in Figure 2. The relative intensity of the T3 component was the largest for the 48 h treated sample, indicating that more siloxane bonds were formed upon prolonged heat treatment. For the other samples no significant trend was observed. The overall condensation degree was approximately 82% as derived from deconvolution of the main signal into its T1, T2 and T3 components. Although CP-MAS-NMR is not a quantitative technique since the cross-polarization efficiency and rate depend on the local chemistry, 29Si CP-MAS-NMR results have been shown to offer good quantitative approximations for

38 | Long-term structural evolution and condensation in microporous organosilica membranes
2
2
2
2
2
Figure 2. Ex-situ 29Si CP-MAS-NMR spectra of BTESE-derived powder treated at 300 °C in N2 atmosphere for different times. The spectra were standardized at the T2 peak to facilitate comparison and the insets are magnifications.
organically bridged silica materials.9,47 The condensation degree represents the condensation state after cooling to room temperature and uptake of atmospheric water, during which partial rehydrolysis occurs at the (internal) surface. The relative amount of Si atoms in the T1 configuration (2%) was smaller than expected statistically (8% for a condensation degree of 82%). This indicated favored spreading of hydroxyl groups over multiple Si atoms or the tendency of two residual hydroxyl groups on the same Si atom to condense into Si=O or related species. The weak but constant signal around -100 ppm corresponds to Q2, Q3 and/or Q4 groups. Since no Q signal was present in as-prepared powder before heat treatment, this indicates minor degradation of the ethylene bridges. However, the degradation was independent of the duration of the heat treatment and this suggested that it involved only easily accessible bridges exposed at the surface. The vast majority of Si-C bonds remained intact, confirming the stability of the ethylene bridges as indicated by the in-situ FTIR results discussed above.
Film thickness, refractive index and thermal expansion
The thickness, refractive index and thermal expansion of a supported BTESE-derived film as a function of treatment time at 283 °C (set point 300 °C) were monitored with in-situ spectroscopic ellipsometry (SE). SE analysis is based on the change in polarization of light (amplitude and phase) due to interaction with the sample. After every 3 h at 283 °C the temperature was temporarily decreased to measure the thermal expansion. The results are shown in Figure 3 and Table 1. The combined and ongoing decrease of both film thickness and refractive index indicates an ongoing loss of material, a decrease of overall film volume and an increase of internal empty volume. Here, the empty volume is defined as the sum of (micro)pore volume and interstitial volume, since the measured refractive index includes both without
0
1
-30 -50 -70 -90 -110
Inte
nsity
[a.u
.]
Chemical shift [ppm]
3 h6 h9 h24 h48 h
T1
T2
T3
Q2/Q3/Q4
-56 -66
-85 -100 -115

Results and discussion | 39
2
2
2
2
2
Figure 3. In-situ SE thickness and refractive index (λ = 632.8 nm) data of a BTESE-derived film at 283 °C in N2 atmosphere.
Table 1. Thermal expansion coefficients (CTE) derived from in-situ SE data of a BTESE-derived film after varying periods of time at elevated temperature in N2 atmosphere.
Exp. time [h] 6 8 14 18 23 28 33 38 42 47 52 57 62 67 CTE [10-6 K-1] 38.8 36.1 31.3 27.2 25.9 24.0 23.4 21.7 21.7 19.1 22.1 21.0 n.a. 16.3 Standard error [10-6 K-1] 1.1 0.3 0.7 0.6 0.4 0.3 0.3 0.9 0.4 0.4 0.5 0.5 n.a. 0.4
distinction. The observed ongoing loss of material agrees with the in-situ FTIR results discussed above, where an ongoing loss of silanol groups was observed without a build-up of molecular water inside the network. The apparent thermal expansion initially decreased with longer times at 283 °C and the temperature dependence of the refractive index changed accordingly (less negative for longer times at 283 °C). A decreasing thermal expansion is in agreement with the observed ongoing condensation and thus progressive immobilization of the network, but it can also result from progressing relaxation. The Si-O-Si bond angles are known to be able to vary over a 40° range and thus form significant numbers of non-optimal network linkages that can take on more favorable conformations if the required energy is supplied to overcome the intermediate transient conformation.33 The observed (apparent) thermal response thus reflects both the intrinsic material properties and the sample history. In addition, the increasing amount of empty volume in the network may have accommodated the thermal expansion to an increasing extent internally, thereby reducing the need to increase the overall volume.
To further investigate the relation between ongoing condensation and structural evolution, the influence of a hydrochloric acid (HCl) containing gas atmosphere on film shrinkage was explored. Such treatment has been reported by Wang et al.48,49 to increase condensation and reduce micropore sizes in BTESE-derived membranes. HCl catalyzes hydrolysis and condensation reactions and elucidates the significance of ongoing condensation for film shrinkage. Figure 4 shows the thickness of two BTESE-

40 | Long-term structural evolution and condensation in microporous organosilica membranes
2
2
2
2
2
derived films at 300 °C, monitored with in-situ XRR. After 3 h at 300 °C, both films were cooled to room temperature and were then exposed to a vapor of either pure demi water or concentrated aqueous HCl at 70 °C for 4 h. The films were then heated again to 300 °C for 14 h. Exposure to HCl vapor led to significant additional film shrinkage while exposure to water vapor did not, indicating that film shrinkage can indeed result from ongoing condensation and hydrolysis reactions. The HCl treatment likely improved the overall condensation degree by catalyzing both condensation and hydrolysis reactions, allowing local rearrangements into more favorable configurations. Interestingly, the shrinkage after HCl treatment still continued with a similar or even higher rate than after pure demi water treatment. This indicates that in addition to yielding newly condensed bonds, the HCl treatment also yielded newly hydrolysed bonds that could condense upon subsequent heat treatment. Alternatively, HCl treatment and heat treatment may target condensation on different sites, making both processes complementary.
At this point, some practical experimental issues must be discussed. Since condensation states are sensitive to environmental water, all experimental atmospheres should ideally contain the same level of humidity. All data from 29Si CP-MAS-NMR, in-situ SE, in-situ XRR and in-situ GP in this report are based on heat treatment in a pure N2 or H2 atmosphere. However, the in-situ FTIR measurements were conducted in a humidified N2 atmosphere. This was necessary to keep the KBr background of these measurements stable in time. The added water may have shifted the balance of condensation reactions and any induced hydrolysis may have facilitated local reorganization. The presence of water during thermal treatments is known to enhance densification of silica-zirconia membranes50 and similar effects are to be expected for organosilica. Another relevant aspect is how the gas flow comes into contact with the sample. The gas flow was led through the powders during in- situ FTIR measurements, over the powders and films for ex-situ 29Si CP-MAS-NMR measurements and in-situ SE and XRR measurements, and through the micropore
Figure 4. In-situ XRR thickness data of BTESE-derived films at 300 °C in N2 atmosphere before and after exposure to 70 °C vapor of pure demi water or concentrated aqueous HCl.
32
33
34
35
36
0 2 4 6 8 10 12 14 16 18
Thic
knes
s [nm
]
Time at 300 °C [h]
HCl vapor
H2O vapor
exposure to 70 °C vapor

Results and discussion | 41
2
2
2
2
2
structure of membranes during in-situ GP measurements. This means that the transport of species inside the pore structure of the material will be affected differently from case to case. Furthermore, the different drying processes for powders (overnight), spin-coated films (seconds) and dip-coated membranes (minutes) will have induced variations in the material structure. Structural reorganization will be affected by the films and membranes being laterally constrained on their rigid supports, while the powder could contract freely in three dimensions. This must be kept in mind when comparing all data given in this study. Nevertheless, the main trends are still expected to be the same under all experimental conditions.
Pore structure
The evolution of the internal micropore structure upon prolonged heat treatment was investigated with gas permeation (GP) measurements on BTESE-derived membranes with He, H2, N2 and CH4 as permeating gases. It must be kept in mind that the information obtained from GP data primarily reflects the situation at the bottlenecks along the pathways through the membrane. Less transport-resistive pores, dead-end pathways and closed pores can evolve without affecting the permeation process. Furthermore, though gas permeation data are discussed here in terms of ‘micropores’ (instead of ‘empty volume’, the term used in the discussion of SE data and defined as the sum of (micro)pore volume and interstitial volume), this does not mean that these micropores are well-defined channels inside the material. As micropore sizes approach molecular dimensions, the clear distinction between pore and wall vanishes and the system practically becomes a homogeneous material with a large amount of empty space.
Two sets of membranes with different pore sizes were prepared. The membranes were preheated at 300 °C for 3, 6, 24 or 60 h in an oven under N2 flow and were then kept at 200 °C in the gas permeation setup for 4 days under continuous steady-state permeation. Figure 5 shows the permeance versus kinetic diameter of the permeating gas molecule for both sets of membranes. One set showed H2/N2 and H2/CH4 selectivities (α) of 14-15, comparable to values reported elsewhere51,52 and well above the Knudsen values (theoretical values 3.6 for H2/N2 and 2.8 for H2/CH4). This indicates that the permeance of N2 and CH4 molecules was hindered by a size exclusion mechanism. Based on the kinetic diameters of the gas molecules (He 0.26 nm, H2 0.29 nm, N2 0.36 nm, CH4 0.38 nm)53 the effective pore size was estimated to be around 0.3 nm. The other set of membranes showed selectivities of H2/N2 and H2/CH4 around the Knudsen values, indicating absence of size exclusion and an effective pore size larger than 0.4 nm.

42 | Long-term structural evolution and condensation in microporous organosilica membranes
2
2
2
2
2
Figure 5. Gas permeance versus kinetic diameter for BTESE-derived membranes with varying pore sizes, measured after preheating at 300 °C in an oven for varying periods of time and heating at 200 °C in the gas permeation setup for 30 h.
Figure 6a shows the permeance of H2 during 24 h intervals for the membranes with effective pore sizes >0.4 nm. The permeance of all four Knudsen-type membranes kept on decreasing throughout the entire experiment at 200 °C, regardless of the preceding treatment time at 300 °C. Differences in absolute permeance values were within the range of common membrane-to-membrane variations. Figure 6b shows the relative permeance of He, H2, N2 and CH4 after each 24 h interval, indicating that the changes in permeance were identical for all gases. The absolute permeance values are published online.54 The subtle but ongoing decrease in permeance was roughly 1% per day and can be explained with a slowly increasing number of network linkages and a slow effective densification of the pore structure. This is in agreement with the ongoing condensation and film shrinkage observed with in-situ FTIR, SE and XRR. Effective densification of the pore structure may involve pore shrinkage, pore closure or a combination of both. However, this should not be confused with sintering effects as reported for amorphous silica membranes at temperatures above 650 °C.55 Sintering involves internal mass transport over relatively long distances, activated by relatively high temperatures, and results in overall densification. Treatment of BTESE-derived samples did not exceed 300 °C and yielded an overall opening structure instead of densification at this temperature (see Figure 3 above). The observed effective densification of membranes only applies to the pores through which gas permeation took place and may even be the result of solely narrowing bottleneck pore openings without significant loss of pore volume. As for the ongoing condensation, this is facilitated when multiple hydroxyl groups are in close proximity to each other and thus pore closure and size reduction may occur more readily at bottlenecks in the pore structure. However, no transition from Knudsen diffusion to size exclusion was observed, indicating that any densification around bottlenecks did not lead to significant formation of small size-selective pores ~0.3 nm.
1.0E-09
1.0E-08
1.0E-07
1.0E-06
1.0E-05
0.25 0.30 0.35 0.40
Kinetic diameter [nm]
α > Knudsen
α ≈ Knudsen
He H2 N2 CH410-5
10-6
10-7
10-8
10-9
Perm
eanc
e [m
ol m
-2s-1
Pa-1
]
preheated at 300 °C:3 h 6 h 24 h 60 h
200 °C

Results and discussion | 43
2
2
2
2
2
Figure 6. In-situ GP data of BTESE-derived membranes measured at 200 °C with effective pore sizes of >0.4 nm and ~0.3 nm and preheated at 300 °C in N2 for 3 h (blue), 6 h (green), 24 h (red) or 60 h (black). a) Permeance of H2 through membranes with effective pore sizes >0.4 nm during three consecutive continuous periods of 24 h. b) Relative permeance of He, H2, N2 and CH4 through membranes with effective pore sizes >0.4 nm. c) Permeance of H2 through membranes with effective pore sizes ~0.3 nm during three consecutive continuous periods of 24 h. d) Relative permeance of He, H2, N2 and CH4 through membranes with effective pore sizes ~0.3 nm.
Figure 6c shows the permeance of H2 during the 24 h intervals for all membranes with effective pore sizes ~0.3 nm. Interestingly, the permeances increased with increasing residence time at 200 °C, which suggests that these smaller pores somehow widened or opened. Pores ~0.3 nm are already so narrow that hydroxyl groups at the pore surface are likely to sterically hinder passing gas molecules. In this situation, the net loss of bulky oxygen atoms due to ongoing condensation reactions (replacing two pendant hydroxyl groups by one bridging oxygen atom) would increase the permeance of inert gas molecules through those small pores. Therefore, despite the opposite trend in permeance as compared to larger pores >0.4 nm, the observed changes in pores ~0.3 nm can be explained within the same framework of ongoing condensation. An alternative explanation could be removal of blocking adsorbent molecules and atmospheric water, but these physical processes were expected to complete in the earlier stages of the experiments. Minor defect formation could also be responsible for the increasing permeances, but the selectivities were maintained. The increase in permeance was significantly smaller for the membranes preheated at 300 °C for 6-60 h than for the membrane preheated for 3 h, indicating that prolonged heat treatment stabilizes the pore structure at least to some extent.
Time at 200 °C [h]
Time at 200 °C [h]
1180
1080
980
H 2 p
erm
eanc
e x
10-9
[mol
m-2
s-1 P
a-1]
500
450
400
H 2 p
erm
eanc
e x
10-9
[mol
m-2
s-1 P
a-1]
0 30 60
0 30 60
α ≈ Knudsen
α > Knudsen
a)
c)
60 h
24 h
3 h
6
60 h
6 h
24 h
3 h
0.94
0.97
1
1.03
1.06
0 30 60 90Time at 200 °C [h]
M27 60h HeH2N2CH4
α ≈ Knudsen
60 h
He, H2, N2, CH4
0.94
0.97
1
1.03
1.06
0 30 60 90Time at 200 °C [h]
α > Knudsen
He
N2H2
CH4
60 h
0.94
0.97
1
1.03
1.06
0 30 60 90Time at 200 °C [h]
M26 24h HeH2N2CH4
α ≈ Knudsen
24 h
H2,N2,CH4
He
0.94
0.97
1
1.03
1.06
0 30 60 90Time at 200 °C [h]
α > Knudsen
He
N2
H2
24 h
0.94
0.97
1
1.03
1.06
0 30 60 90Time at 200 °C [h]
M24 6h HeH2N2CH4
α ≈ Knudsen
6 h
He, H2, N2, CH4
0.94
0.97
1
1.03
1.06
0 30 60 90Time at 200 °C [h]
α > Knudsen
HeCH4
6 h
Rela
tive
perm
eanc
e [-
]Re
lativ
epe
rmea
nce
[-] H2,N2
H2,N2
CH4
0.94
0.97
1
1.03
1.06
0 30 60 90Time at 200 °C [h]
M25 3h HeH2N2CH4
α ≈ Knudsen
He, H2, N2, CH4
3 h
0.94
0.97
1
1.03
1.06
0 30 60 90Time at 200 °C [h]
α > Knudsen
He
CH4
3 h
H2,N2
b)
d)
44 | Long-term structural evolution and condensation in microporous organosilica membranes
2
2
2
2
2
Figure 6d shows the relative permeance of He, H2, N2 and CH4 through the membranes with effective pore sizes ~0.3 nm after each 24 h interval. The absolute permeance values are published online.54 Some discrimination occurred between larger and smaller molecules, suggesting that larger pores are more sensitive to overall densification. Such overall densification also occurred in the Knudsen-type membranes with effective pore sizes >0.4 nm. Apparently, the removal of blocking species (pendant hydroxyl groups) outweighed densification for the smallest pores. Furthermore, larger molecules may benefit less from the widening or opening of the smallest pores.
BTESE-derived microporous membranes are known to show slow ongoing flux declines during operation at 95-150 °C for more than a year14,15,26 that appear to be enhanced by the presence of nitric acid.15,26 A similar slow flux decline in dimethoxy-diphenylsilane-derived membranes has been shown to depend on the presence of water.27 These indications reported in literature together with the changes in membrane performance observed in the present study, demonstrate the relevance of ongoing condensation and hydrolysis reactions during membrane operation in an intriguing two-fold fashion. Progressing condensation can cause a flux decline due to network densification, but hydrolysis can cause a flux decline as well since it facilitates network rearrangement for overall densification and it introduces pendant hydroxyl groups that can effectively block very small pores. Especially hydrolysis reactions will significantly depend on the water content and acidity of the feed stream. Regardless of the balance between all interactions, both literature data and the results reported here indicate that the pore structures need very long times to truly stabilize. The observed flux decline for the membranes with effective pore sizes >0.4 nm was around 1% per day, implying significant performance changes in this pore size range on a time scale of months as long as full stabilization is not reached.
Influence of network flexibility
The extent to which structural changes can occur, partially depends on the overall network flexibility. This was further investigated by comparing the condensation and shrinkage behavior of BTESE-derived materials with various other (organo)silica networks. Materials without organic bridges were prepared from TEOS, materials with shorter flexible alkylene bridges were prepared from BTESM and materials with longer rigid phenylene bridges were prepared from BTESB. The overall flexibility of these networks is expected to depend both on the flexibility of the various molecular segments and on the amount of empty volume. As for the flexibility, SiO2 consists of corner-sharing silicon oxide tetrahedra with O atoms at the corners. The tetrahedra are relatively rigid, but the Si-O-Si bond angle between neighboring tetrahedra can vary roughly between 134° and 180°.33 This allows the tetrahedra to tilt and rearrange significantly without compromising the chemical bonds. In addition to

Results and discussion | 45
2
2
2
2
2
changing the intertetrahedral angle, neighboring tetrahedra can also rotate with respect to each other at these corners. This connection point is thus expected to be the main origin of the molecular flexibility. TEOS, BTESM, BTESE and BTESB tetrahedra all have three identical corner configurations (Si-O-Si). The fourth tetrahedral corner varies for each network, as is schematically depicted in Figure 7. TEOS tetrahedra have again one O atom at this corner, BTESM tetrahedra have one CH2 segment, BTESE tetrahedra have a C2H4 segment and BTESB tetrahedra have a rigid phenylene unit in para configuration. Si-C-Si and Si-C-C bonds are not expected to have the same impressive freedom in bond angle as Si-O-Si bonds. The molecular flexibility due to angle variations will thus be somewhat less for BTESM-, BTESE- and BTESB-derived networks as compared to TEOS-derived networks. However, when considering the rotational freedom of neighboring tetrahedra, TEOS and BTESM have two rotational axes, BTESE has three rotational axes and BTESB has only one effective rotational axis. Thus, the order in rotational freedom of tetrahedra is BTESB < TEOS ≈ BTESM < BTESE.
The amount of empty volume (sum of (micro)porosity and interstitial volume) in the materials is also expected to affect the overall network flexibility. Empty volume can facilitate internal movement, making it easier for the network to take on a more favorable configuration. The micropore size tends to increase in the order TEOS < BTESM < BTESE < BTESB,4,51,55 suggesting that the volume of empty space surrounding each network tetrahedron follows the same trend. However, the amount and distribution of empty volume are also significantly affected by the synthesis and processing details and this was not optimized for the materials prepared in the present study. A larger amount of empty volume in excess of the theoretical minimum leaves a larger potential for network densification. An increasing flexibility of the molecular segments may enhance their packing, but is also expected to increase the effect of changes in synthesis and processing. In general, loss of material due to chemical condensation is increasingly compensated by structural reorganization for increasingly flexible networks. Ultimately flexible networks shrink without changing density, while ultimately rigid networks open up without changing geometry.
Figure 7. Schematic representation of the rotational freedom of silicon oxide tetrahedra in TEOS-, BTESM-, BTESE- and BTESB-derived networks.
O C C C
TEOS BTESM BTESE BTESB

46 | Long-term structural evolution and condensation in microporous organosilica membranes
2
2
2
2
2
In-situ FTIR measurements of TEOS-, BTESM- and BTESB-derived powders confirmed that all materials underwent ongoing condensation at 300 °C similar to BTESE-derived networks. Figure 8a shows the changes in Si-O stretching vibrations of silanol groups (~900 cm-1). Figure 8b and 8c show the thickness and refractive index of TEOS-, BTESM-, BTESE- and BTESB-derived films at 300 °C measured with in-situ SE. The thickness and refractive index graphs are normalized with respect to the values after 180 min at 300 °C to facilitate comparison, excluding network-dependent drying effects and initial compaction. Non-normalized graphs are shown in Figure S1 in the supplementary information. Table 2 lists the change in amount of material (Δm) present in each network and the changes in thickness (Δd) and refractive index (Δn) relative to Δm. Normalized graphs of m in time are shown in Figure S2 in the supplementary information. m was calculated by multiplying d with (n2-1)/(n2+2), which is proportional to the film density according to the Lorentz-Lorenz equation.
Figure 8. a) In-situ FTIR spectra of TEOS-, BTESM-, BTESE- and BTESB-derived powder at 300 °C in humidified N2 atmosphere. b) In-situ SE thickness data of TEOS-, BTESM-, BTESE- and BTESB-derived films at 300 °C in N2 atmosphere. The curves are normalized with respect to their values after 180 min at 300 °C to facilitate comparison. c) In-situ SE refractive index data (λ = 632.8 nm) of TEOS-, BTESM-, BTESE- and BTESB-derived films at 300 °C in N2 atmosphere. The curves are normalized with respect to their values after 180 min at 300 °C to facilitate comparison.
Table 2. Change in amount of material (Δm) and resulting response in film thickness (Δd/Δm) and refractive index (Δn/Δm) for TEOS-, BTESM-, BTESE- and BTESB-derived films between 180 min and 600 min at 300 °C in N2 atmosphere.
Δm [%]
Δd/Δm [-]
Δn/Δm [-]
TEOS -0.64 1.24 -0.11 BTESM -1.51 0.60 0.14 BTESE -1.80 0.88 0.04 BTESB -1.19 1.08 -0.02
021 -0.33097 0.009673 0.0078955 -0.33047 0.010046 0.0081897 -0.33004 0.010384 0.0085867 -0.32959 0.010613 0.0089845 -0.32906 0.010942 0.0093805 -0.32851 0.011483 0.0098733 -0.32764 0.012022 0.0102669 -0.32684 0.01236 0.0104631 -0.3263 0.012556 0.0106584 -0.32568 0.01278 0.0107512 -0.32495 0.013073 0.0109451 -0.32434 0.013451 0.0111379 -0.32362 0.013966 0.0113303 -0.32287 0.014473 0.0115244 -0.32212 0.014844 0.011
1060 980 900 820
Abso
rban
ce [-
]
Wavenumber [cm-1]
BTESE
BTESM
TEOS
BTESB
3 h6 h9 h12 h
24 h36 h48 h60 h
200 400 600
0.998
0.999
1.000
1.001
BTESB N
orm
aliz
ed re
fract
ive
inde
x [-]
Time at 300°C [min]
BTESE
BTESM
TEOS
200 400 6000.98
0.99
1.00
TEOS
BTESMBTESB
Nor
mal
ized
thic
knes
s [-]
Time at 300°C [min]
BTESE
a) b) c)

Results and discussion | 47
2
2
2
2
2
The relative film shrinkage in Figure 8b increased in the order TEOS ≈ BTESM < BTESB < BTESE. The shrinkage of the TEOS-derived film did not exceed that of BTESM, indicating that the higher flexibility in bond angle of the fourth tetrahedral corner in TEOS-derived networks (Si-O-Si) as compared to the other materials was not important for the network reorganization. Furthermore, for TEOS-, BTESM- and BTESE-derived films, the observed shrinkage followed the order of increasing rotational freedom of the network tetrahedra. The changes in refractive indices in Figure 8c indicate that the structure opened more for the BTESM-derived film than for the BTESE-derived film, which corresponds with the larger flexibility of BTESE-derived networks enabling more structural adaptation to the loss of material. This is further confirmed by the change in film thickness and refractive index upon loss of material as listed in Table 2; loss of material manifested itself more strongly in reduced refractive index in the BTESM-derived film and more strongly in reduced thickness in the BTESE-derived film. The increasing refractive index of the TEOS-derived film in Figure 8c can be explained by the higher mobility of its tetrahedra due to the dynamic nature of siloxane bonds (ongoing rehydrolysis and recondensation). The monomeric unit in TEOS-derived materials consists of one tetrahedron (SiO2) that is connected to the surrounding network by a maximum of four siloxane bonds. The monomeric units in the organically bridged systems are larger and more immobilized, since they consist of two tetrahedra (O1.5SiRSiO1.5) that can form up to six siloxane bonds with the surrounding network. Therefore, the tetrahedra in TEOS-derived materials are more mobile (defining mobility as displacement involving bond breakage and reformation) than those in the other materials and can easier reorganize into a denser packing.
The BTESB-derived film displayed more shrinkage than BTESM- and TEOS-derived films and an overall densification instead of opening. This seemingly disproves the relationship between network flexibility and structural response. However, it must be kept in mind that the bridging phenylene units not only rigidify the network but also introduce a driving force for ordering. If sterically possible, increasing π-π stacking is expected to help increase the overall density of the network and thus obscure the effect of reduced flexibility. The increasing refractive index indeed suggests some sort of additional ordering, because loss of material usually cannot be fully compensated by compaction and would thus always lead to a slightly decreasing refractive index unless there is an additional driving force for structural rearrangement. Furthermore, the relative loss of material in Table 2 decreased in the order BTESE > BTESM > BTESB. These values are not corrected for variations in concentration of actual or theoretically possible hydroxyl sites (Si-O groups). However, it appears that network flexibility not only affects structural rearrangement resulting from condensation but also the occurrence of condensation itself. The observed structural reorganization in the BTESB-derived film (both shrinkage and densification) were thus most likely

48 | Long-term structural evolution and condensation in microporous organosilica membranes
2
2
2
2
2
enhanced by internal ordering of the phenylene units apart from ongoing condensation. The overall results indicate that structural reorganization both leading to and resulting from chemical condensation is enhanced by increasing network flexibility.
Influence of temperature
To get more insight in the temperature dependence of the observed ongoing condensation and shrinkage process, the temperature at which BTESE-derived powders and films were thermally treated was varied. In-situ FTIR spectra at various temperatures are shown in Figure 9a with the Si-O stretching vibrations of silanol groups around 900 cm-1. An ongoing loss of silanol groups was observed for all temperatures. Figure 9b and 9c show the change in film thickness and refractive index at various temperatures as measured with in-situ SE (the actual temperatures, noted in the graphs, were somewhat lower than the set point temperatures). All curves are normalized with respect to their values at 25 °C after drying under a N2 flow prior to heating. After instantaneous thermal expansion at elevated temperature and rapid removal of solvent and adsorbed water, the film thickness kept on decreasing in time at all temperatures. The refractive index only decreased in time at 283 °C, but the total amount of material kept on decreasing in time at all temperatures as shown in Figure S3 in the supplementary information. The overall densification at lower temperatures may have resulted from hindered diffusion of formed water out of the network, though this was not observed in the in-situ FTIR spectra. Alternatively, a denser packing occurred due to lower condensation and
Figure 9. a) In-situ FTIR spectra of BTESE-derived powder at varying temperatures in humidified N2 atmosphere. b) In-situ SE thickness data of BTESE-derived films at varying temperatures in N2 atmosphere. The graphs are normalized with respect to the values at 25 °C prior to heating. c) In-situ SE refractive index (λ = 632.8 nm) data of BTESE-derived films at varying temperatures in N2 atmosphere. The graphs are normalized with respect to the values at 25 °C prior to heating.
8 0.32999 0.88398 0.8 -0.32975 -0.88357 -0.6 -0.32952 -0.88317 -0.4 -0.3293 -0.88281 -0.2 -0.3291 -0.88246 -0.1 -0.32892 -0.88212 -0.1 -0.32877 -0.8818 -0.3 -0.32863 -0.88151 -0.9 -0.32853 -0.88123 -0.1 -0.32846 -0.88095 -0.6 -0.32843 -0.88069 -0.2 -0.32841 -0.88047 -0.1 0 32842 0 88024 0
980 900 820
Abso
rban
ce [-
]
Wavenumber [cm-1]
3 h 15 h
190 °C
225 °C
250 °C
300 °C
0 200 400 600
0.986
0.988
0.990
179 °C
283 °C
236 °C
212 °C
Nor
mal
ized
refra
ctiv
e in
dex
[-]
Time at elevated temperature [min]
0 200 400 600
0.94
0.96
0.98
1.00
283 °C
236 °C
212 °C
179 °C
Nor
mal
ized
thic
knes
s [-]
Time at elevated temperature[min]
a) b) c)

Results and discussion | 49
2
2
2
2
2
shrinkage rates. In addition to the in-situ SE measurements of BTESE-derived films of approximately 190 nm thick, thinner films of approximately 45 nm were analyzed with in-situ XRR during treatment at similar temperatures for 60 h and showed similar temperature-dependent shrinkage (data not shown). For all temperatures the shrinkage was permanent under ambient conditions; it was not reversed after storage in air for months nor after soaking in water for days.
The results above indicate that the kinetics of both ongoing condensation and ongoing structural changes depend on the temperature, but no onset temperature was observed. Any temperature down to 190 °C and probably even lower can yield significant changes in the network over time. Preceding heat treatment at 300 °C may reduce subsequent changes at lower temperatures (this was not done prior to these measurements) and the maximum achievable condensation of silanol groups may be somewhat smaller at lower temperatures. The hydroxyl groups present inside the network are located at many qualitatively different positions with different distances to neighboring hydroxyl groups. Hydroxyl groups at shielded or remote locations may have higher activation energies for condensation, requiring higher temperatures. The total potential for structural change may be temperature-dependent to some extent. Nevertheless, these results do show that low temperatures are sufficient to enable ongoing changes with a rate observable in hours.
Stabilization period
To explore the end of the ongoing condensation and structural changes, a BTESE-derived film was kept at 236 °C and monitored with in-situ SE for 12 days. The thickness and refractive index are shown in Figure 10 and kept on decreasing throughout the experiment, indicating that the film kept on losing material and the structure was still not stabilized. This underlines the relevance of this ongoing consolidation process for long-term material applications at moderately elevated temperatures.
Figure 10. In-situ SE thickness and refractive index (λ = 632.8 nm) data of a BTESE-derived film at 236 °C in N2 atmosphere.
1.430
1.435
1.440
1.445
165
170
175
180
0 2 4 6 8 10 12
Refr
activ
e in
dex [
-]
Thic
knes
s [nm
]
Time at 236°C [days]

50 | Long-term structural evolution and condensation in microporous organosilica membranes
2
2
2
2
2
The inability to reach a truly stable structural state at common consolidation temperatures within the experimental time span of days to weeks raises the question into what state the organosilica networks are evolving. The network organization as it is must somehow be unfavorable, stimulating a gradual transition throughout the material. Though in the present study this transition was accompanied by a net increasing condensation and could be enhanced by catalyst treatment, strain relaxation may also play a role. The Si-O-Si bond angles are known to be able to vary over 40° and thus form significant amounts of non-optimal network linkages that have the potential to take on energetically more favorable conformations when the required energy is supplied.33 Both types of long-term structural transitions are facilitated by back-and-forth hydrolysis and condensation reactions as these dynamics increase the adaptive potential of the network.
Conclusion In-situ monitoring of chemical bonds, film thickness, refractive index and micropore structure in BTESE-derived powders, films and gas permeation membranes at temperatures up to 300 °C demonstrates a subtle but persistent structural instability. Ongoing chemical condensation was accompanied by network shrinkage and decreasing density. This led to a decreasing gas permeance through relatively large pores >0.4 nm but an increasing gas permeance through small pores ~0.3 nm, which illustrated competing consequences of ongoing condensation. For the smallest pores, the removal of blocking species (pendant hydroxyl groups) became more important than increasing network connectivity. The structural changes were speeded up by treatment with hydrochloric acid vapor. Furthermore, structural reorganization was facilitated by the presence of flexible molecular segments, as indicated by comparison of BTESE-derived networks with TEOS-, BTESM- and BTESB-derived networks.
No truly stable structural state could be reached within the experimental time span of days to weeks at 236-300 °C, demonstrating that common consolidation treatments of a few hours are clearly not sufficient to reach a fully stabilized material. Though subtle, the ongoing structural evolution can significantly affect long-term material performance when employing a fine-tuned micropore structure such as in the case of molecular sieving membranes. The process observed in this study may well be the origin of the known but to-date not understood problem of slow flux decline of industrially employed organosilica membranes over periods of months to years.
As for solutions to this instability issue, mere completion of chemical condensation is expected to be impossible as well as insufficient and unwanted. Many industrial membrane applications involve water-containing feed streams at temperatures

Acknowledgements | 51
2
2
2
2
2
mostly below 200 °C, which will induce local rehydrolysis reactions regardless of preceding consolidation treatments. Furthermore, in various applications water is the permeating species and this probably requires a certain amount of internal hydroxyl groups to maintain sufficient hydrophilicity of the network. Net structural stability is expected to be enhanced best via treatments inducing both condensation and hydrolysis in a combined or alternating fashion, to drive the network into a more favorable configuration based on iterative reconnections. Using a catalyst will speed up the process and may enable total physical relaxation. Further research on this iterative stabilization approach is presented in Chapter 3. The chemical balance between hydrolysis and condensation during membrane operation depends on the specific operation conditions (temperature, feed stream components etc.) and thus a slow equilibration process may be inevitable. Such equilibration may be speeded up by treatments involving a catalyst or water as well. Alternatively, regenerative treatments can be applied e.g. to periodically remove slowly increasing amounts of hydroxyl groups that block very small pores. To further unravel the balance between the interconnected and mutually facilitating processes of (reversible) condensation, (reversible) hydrolysis and physical relaxation, more insight in the details of a truly stable structural state would be useful. This could be obtained via experimental as well as theoretical approaches.
Acknowledgements Financial support from the Advanced Dutch Energy Materials (ADEM) program of the Dutch Ministry of Economic Affairs, Agriculture and Innovation is gratefully acknowledged. Pieter de Waard and the Wageningen NMR Centre (The Netherlands) are gratefully acknowledged for the 29Si CP-MAS-NMR measurements.
References 1. G. Dubois, W. Volksen, T. Magbitang, R.D. Miller, D.M. Gage, R.H. Dauskardt, Adv. Mater. 2007, 19,
3989–3994. 2. E.J. Kappert, D. Pavlenko, J. Malzbender, A. Nijmeijer, N.E. Benes, P.A. Tsai, Soft Matter 2015, 11,
882–888. 3. M. Kanezashi, K. Yada, T. Yoshioka, T. Tsuru, J. Memb. Sci. 2010, 348, 310–318. 4. K.S. Chang, T. Yoshioka, M. Kanezashi, T. Tsuru, K.-L. Tung, Chem. Commun. 2010, 46, 9140–9142. 5. K.S. Chang, T. Yoshioka, M. Kanezashi, T. Tsuru, K.L. Tung, J. Memb. Sci. 2011, 381, 90–101. 6. T. Shimoyama, T. Yoshioka, H. Nagasawa, M. Kanezashi, T. Tsuru, Desalin. Water Treat. 2013, 51,
5248–5253. 7. W. Wang, D. Grozea, S. Kohli, D.D. Perovic, G.A. Ozin, ACS Nano 2011, 5, 1267–1275. 8. F. Goethals, C. Vercaemst, V. Cloet, S. Hoste, P. van der Voort, I. van Driessche, Microporous
Mesoporous Mater. 2010, 131, 68–74. 9. G. Cerveau, R.J.P. Corriu, C. Lepeytre, P.H. Mutin, J. Mater. Chem. 1998, 8, 2707–2713. 10. G. Cerveau, R.J.P. Corriu, J. Dabosi, C. Fischmeister-Lepeytre, R. Combarieu, Rapid Commun. mass
Spectrom. 1999, 13, 2183–2190.

52 | Long-term structural evolution and condensation in microporous organosilica membranes
2
2
2
2
2
11. F. Goethals, E. Levrau, G. Pollefeyt, M.R. Baklanov, I. Ciofi, K. Vanstreels, C. Detavernier, I. van Driessche, P. van der Voort, J. Mater. Chem. C 2013, 1, 3961.
12. S.S. Park, B. An, C.S. Ha, Microporous Mesoporous Mater. 2008, 111, 367–378. 13. M. Giese, J.C. de Witt, K.E. Shopsowitz, A.P. Manning, R.Y. Dong, C.A. Michal, W.Y. Hamad, M.J.
Maclachlan, ACS Appl. Mater. Interfaces 2013, 5, 6854–6859. 14. H.L. Castricum, A. Sah, R. Kreiter, D.H.A. Blank, J.F. Vente, J.E. ten Elshof, J. Mater. Chem. 2008, 18,
2150–2158. 15. H.L. Castricum, R. Kreiter, H.M. van Veen, D.H.A. Blank, J.F. Vente, J.E. ten Elshof, J. Memb. Sci.
2008, 324, 111–118. 16. H.L. Castricum, A. Sah, R. Kreiter, D.H.A. Blank, J.F. Vente, J.E. ten Elshof, Chem. Commun. 2008,
1103–1105. 17. R. Kreiter, M.D.A. Rietkerk, H.L. Castricum, H.M. van Veen, J.E. ten Elshof, J.F. Vente, J. Sol-Gel Sci.
Technol. 2011, 57, 245–252. 18. M. Kanezashi, K. Yada, T. Yoshioka, T. Tsuru, J. Am. Chem. Soc. 2009, 131, 414–415. 19. H.L. Castricum, H.F. Qureshi, A. Nijmeijer, L. Winnubst, J. Memb. Sci. 2015, 488, 121–128. 20. R. Besselink, H.F. Qureshi, L. Winnubst, J.E. ten Elshof, Microporous Mesoporous Mater. 2015, 214,
45–53. 21. X. Ren, K. Nishimoto, M. Kanezashi, H. Nagasawa, T. Yoshioka, T. Tsuru, Ind. Eng. Chem. Res. 2014,
53, 6113–6120. 22. R. Kreiter, M.D.A. Rietkerk, H.L. Castricum, H.M. van Veen, J.E. ten Elshof, J.F. Vente, ChemSusChem
2009, 2, 158–60. 23. R. Xu, P. Lin, Q. Zhang, J. Zhong, T. Tsuru, Ind. Eng. Chem. Res. 2016, 55, 2183–2190. 24. G. Gong, H. Nagasawa, M. Kanezashi, T. Tsuru, J. Memb. Sci. 2015, 494, 104–112. 25. R. Xu, J. Wang, M. Kanezashi, T. Yoshioka, T. Tsuru, Am. Inst. Chem. Eng. J. 2013, 59, 1298–1307. 26. H.M. van Veen, M.D.A. Rietkerk, D.P. Shanahan, M.M.A. van Tuel, R. Kreiter, H.L. Castricum, J.E. ten
Elshof, J.F. Vente, J. Memb. Sci. 2011, 380, 124–131. 27. M. Seshimo, K. Akamatsu, S. Furuta, S. Nakao, Ind. Eng. Chem. Res. 2013, 52, 17257–17262. 28. W. Guo, X. Li and X.S. Zhao, Microporous Mesoporous Mater. 2006, 93, 285–293. 29. E.J. Kappert, H.J.M. Bouwmeester, N.E. Benes, A. Nijmeijer, J. Phys. Chem. B 2014, 118, 5270–5277. 30. W.J. Hunks, G.A. Ozin, J. Mater. Chem. 2005, 15, 764–771. 31. W.J. Hunks, G.A. Ozin, Adv. Funct. Mater. 2005, 15, 259–266. 32. R.K. Iler, The Chemistry of Silica, John Wiley & Sons, Inc., New York, 1979. 33. D.S. Wragg, R.E. Morris, A.W. Burton, Chem. Mater. 2008, 20, 1561–1570. 34. R.J.R. Uhlhorn, M.H.B.J. Huis in ’t Veld, K. Keizer, A.J. Burggraaf, J. Mater. Sci. 1992, 27, 527–537. 35. H.L. Castricum, G.G. Paradis, M.C. Mittelmeijer-Hazeleger, R. Kreiter, J.F. Vente, J.E. ten Elshof, Adv.
Funct. Mater. 2011, 21, 2319–2329. 36. E.J. Kappert, M.J.T. Raaijmakers, W. Ogieglo, A. Nijmeijer, C. Huiskes, N.E. Benes, Thermochim. Acta
2015, 601, 29–32. 37. P.J. Launer, in Silicone Compounds Register and Review, 1987, pp. 100–103. 38. K.M. Davis, M. Tomozawa, J. Non. Cryst. Solids 1996, 201, 177–198. 39. G. Socrates, Infrared characteristic group frequencies: tables and charts, Wiley, Chichester, 2nd
edn., 1994. 40. F.L. Galeener, G. Lucovsky, Phys. Rev. Lett. 1976, 37, 1474–1478. 41. M.C. Payne, J.C. Inkson, J. Non. Cryst. Solids 1984, 68, 351–360. 42. P. Innocenzi, J. Non. Cryst. Solids 2003, 316, 309–319. 43. Y. Kayaba, F. Nishiyama, Y. Seino, T. Kikkawa, J. Phys. Chem. C 2011, 115, 12981–12989. 44. F. Hoffmann, M. Güngerich, P.J. Klar, M. Fröba, J. Phys. Chem. C 2007, 111, 5648–5660. 45. U. Díaz-Morales, G. Bellussi, A. Carati, R. Millini, W. O’Neil Parker Jr., C. Rizzo, Microporous
Mesoporous Mater. 2006, 87, 185–191. 46. V. Rebbin, M. Jakubowski, S. Pötz, M. Fröba, Microporous Mesoporous Mater. 2004, 72, 99–104.

References | 53
2
2
2
2
2
47. H.W. Oviatt, K.J. Shea, J.H. Small, Chem. Mater. 1993, 5, 943–950. 48. J. Wang, G. Gong, M. Kanezashi, T. Yoshioka, K. Ito, T. Tsuru, Chem. Lett. 2012, 41, 1663–1665. 49. J. Wang, G. Gong, M. Kanezashi, T. Yoshioka, K. Ito, T. Tsuru, J. Memb. Sci. 2013, 441, 120–128. 50. K. Yoshida, Y. Hirano, H. Fujii, T. Tsuru, M. Asaeda, J. Chem. Eng. Japan 2001, 34, 523–530. 51. H.F. Qureshi, A. Nijmeijer, L. Winnubst, J. Memb. Sci. 2013, 446, 19–25. 52. D.W. Breck, Zeolite molecular sieves: structure, chemistry and use, John Wiley & Sons, Inc., New
York, 1974. 53. M. Kanezashi, T. Sasaki, H. Tawarayama, T. Yoshioka, T. Tsuru, J. Am. Ceram. Soc. 2013, 96, 2950–
2957. 54. A.P. Dral, K. Tempelman, E.J. Kappert, L. Winnubst, N.E. Benes, J.E. ten Elshof, J. Mater. Chem. A.
2017, 5, 1268-1281. 55. M. Kanezashi, M. Kawano, T. Yoshioka, T. Tsuru, Ind. Eng. Chem. Res. 2012, 51, 944–953.

54 | Long-term structural evolution and condensation in microporous organosilica membranes
2
2
2
2
2
Supplementary information
Figure S1. In-situ SE thickness and refractive index data of a) TEOS-derived, b) BTESM-derived, c) BTESE-derived and d) BTESB-derived films at 300 °C in N2 atmosphere.
Figure S2. Normalized amount of material in TEOS-, BTESM-, BTESE- and BTESB-derived films at 300 °C in N2 atmosphere, calculated from in-situ SE thickness and refractive index data.
Figure S3. Normalized amount of material in BTESE-derived films at various temperatures in N2 atmosphere, calculated from in-situ SE thickness and refractive index data.

Abstract | 55
3
3
3
3
3
3
Micropore structure stabilization
in organosilica membranes by
gaseous catalyst post-treatment
This chapter is submitted for publication as:
A.P. Dral, E.R.H. van Eck, L. Winnubst, J.E. ten Elshof, Micropore structure stabilization in organosilica membranes by gaseous catalyst post-treatment.

56 | Micropore structure stabilization in organosilica membranes by gaseous catalyst post-treatment
3
3
3
3
3

Abstract | 57
3
3
3
3
3
Abstract A post-treatment involving repeated exposure to gaseous HCl alternated with heating, is demonstrated to strongly accelerate the structural evolution in organically bridged silica networks as reported in Chapter 2. Films, powders and membranes derived from 1,2-bis(triethoxysilyl)ethane were exposed to in-situ synthesized HCl gas alternated with heat treatments at 150-300 °C in air or N2. The film thickness, network condensation, chemical integrity and micropore structure were monitored with X-ray reflectivity, 29Si direct excitation magic angle spinning nuclear magnetic resonance, Fourier-transform infrared spectroscopy and gas permeation. Treatment with HCl was found to predominantly catalyze hydrolysis, enabling network optimization via iterative bond breakage and reformation. Network shrinkage, widening or opening of the smallest pores and densification of the overall pore structure were accelerated while the ethylene bridges remained intact. The achieved acceleration of material evolution makes iterative hydrolysis and condensation a promising approach for increasing the long-term micropore stability of molecular sieving membranes.
Introduction Hybrid organosilica networks, in which part of the Si-O-Si linkages are replaced by Si-R-Si, provide a valuable combination of inorganic and organic material properties. For membrane applications, the introduction of organic bridging segments to microporous silica yields networks with tunable pore sizes and affinities and a highly superior hydrothermal stability.1-8 Organically bridged silica membranes have therefore replaced inorganic silica membranes in various molecular sieving applications. However, this new generation of membranes displays a slow ongoing flux decline during operation at 95-150 °C for more than a year.1,2,9 This causes practical difficulties in industrial processes and to date this problem has not been solved.
Chapter 2 presented a detailed study on long-term consolidation in powders, films and membranes derived from 1,2-bis(triethoxysilyl)ethane (BTESE).10 Subtle but persistent chemical and structural changes were demonstrated to continue for days to weeks at temperatures up to 300 °C without approaching an end state. Ongoing chemical condensation was accompanied by network shrinkage and decreasing density. This led to a decreasing gas permeance through relatively large pores >0.4 nm but an increasing gas permeance through small pores ~0.3 nm. The structural changes were speeded up by exposure to HCl vapor, which was previously reported as a method to increase condensation and reduce micropore sizes in BTESE-derived membranes by Wang et al.11,12 The process observed in Chapter 2 was proposed to

58 | Micropore structure stabilization in organosilica membranes by gaseous catalyst post-treatment
3
3
3
3
3
be the origin of the problem of slow flux decline in industrially employed organically bridged silica membranes. As for solutions to this instability issue, a post-synthesis treatment was proposed to catalyze both condensation and hydrolysis in a combined or alternating fashion. This facilitates evolution of the network into a more favorable configuration via iterative reconnections. This iterative approach differs from the single-step catalyst post-treatments generally reported in literature for (organo)silica materials. Liquid-phase hydrothermal treatments with NH4OH and HCl have been reported to increase the structural stability and condensation degree and tune textural properties of mesoporous inorganic silica.13-15 Vapor-phase HCl treatment has been used to tune the micropore size and increase the condensation degree of microporous ethylene-bridged membranes.11,12,16
The present study introduces a post-treatment involving iterative hydrolysis and condensation to achieve extensive reorganization and stabilization of organosilica networks in a controlled fashion. BTESE-derived films, powders and membranes were repeatedly exposed to in-situ synthesized HCl gas alternated with heat treatments. Several process parameters were varied to study the mechanism of network evolution and to commence process optimization. The film thickness, network condensation, chemical integrity and micropore structure were monitored with X-ray reflectivity (XRR), 29Si direct excitation magic angle spinning nuclear magnetic resonance (29Si DE-MAS-NMR), Fourier-transform infrared spectroscopy (FTIR) and gas permeation (GP). Though some water is required, this gas-phase catalyst treatment involves much lower quantities of water (i.e. only atmospheric and adsorbed moisture) than previously reported liquid-phase and vapor-phase catalyst treatments. This eliminates the risk of material dissolution and pinhole formation in either the organosilica top layer or its support when applied to molecular sieving membranes.
Experimental Chemicals. 1,2-bis(triethoxysilyl)ethane (97% purity) was obtained from ABCR. Nitric acid (70 wt% aqueous solution), 1-butanol (99.8% purity) and Mowiol 8-88 polyvinyl alcohol were obtained from Sigma Aldrich. Ethanol (dehydrated, 99.99% purity) was obtained from VWR. Sulfuric acid (≥95% purity) was obtained from Fluka. Sodium chloride (99.7% purity) was obtained from J.T. Baker.
Powder and film preparation. BTESE-derived powder was prepared as reported in Chapter 2.10 BTESE-derived films (50-55 nm) were prepared by mixing part of the sol for powder with 1-butanol in a 2:3 volume ratio and spin coating on silicon wafer substrates. Each substrate was coated with 20 µL solution at a spinning rate of 10.000 rpm for 10 s. The films were dried on a hot plate in air at 200 °C for 30 min. All samples were stored under ambient conditions.

Experimental | 59
3
3
3
3
3
Membrane preparation. Membranes with BTESE-derived top layers having effective pore sizes of either >0.4 nm or ~0.3 nm were prepared as reported in Chapter 2.10 The BTESE-derived top layers were consolidated at 300 °C in N2 for 24 h with heating and cooling rates of 5 °C min-1. All membranes were stored under ambient conditions.
X-ray reflectivity. Thickness measurements of films at 300 °C were done with X-ray reflectivity on a PANalytical X’Pert PRO system equipped with an Empyrean tube with Cu anode, a parabolic W/Si mirror, an Anton Paar Domed Hot Stage 900 and a proportional Xe point detector. The films were kept under N2 flow and were heated to 300 °C for varying periods of time with heating and cooling rates of 60 °C min-1. Reflectivity curves were measured in-situ every 10 min. Thickness measurements of films at room temperature were done on a PANalytical X’Pert PRO system equipped with an Empyrean tube with Cu anode, a parallel beam mirror and a PIXcel1D detector. Thickness values were obtained by fitting the reflectivity oscillations between θ = 0.5-1° in X’Pert Reflectivity software.
29Si nuclear magnetic resonance spectroscopy. 29Si nuclear magnetic resonance spectra were obtained ex-situ at a field of 7.05 T with direct excitation and magic angle spinning using a Chemagnetics 9.5 mm pencil probe, resonant for 1H at 300.15 MHz and 29Si at 59.595 MHz. Spectra were acquired with a 3.8 µs pulse, 25 kHz proton decoupling (Spinal), 4 kHz spinning rate, 320 scans per sample and a recycle delay of 500 s, ensuring that the acquired data was quantitative (29Si relaxation time T1 x 5 < 500 s, determined via a Torchia experiment with cross-polarization). The T1, T2 and T3 ratios and the Q2, Q3 and Q4 ratios were determined by spectrum deconvolution. First the cross-polarization spectra were fitted with three Gaussian components, because the signal-to-noise ratio of these spectra was significantly higher than that of the direct excitation spectra. Peak parameters thus determined were used to deconvolute the direct excitation spectra, fixing the width and position of the components but not the amplitude. The ratio of T to Q species was determined by integrating the direct excitation spectra over the relevant regions (spinning side bands were added to the T peaks).
Gas permeation. Single-gas permeation measurements were performed with a Poseidon Convergence Inspector. The top layer of the membrane was positioned at the feed side. After heating to 200 °C the permeance was measured for H2 during 10 h. Then the permeance was measured for He, He, H2, He, N2, He, CH4, He and CO2 (measured in this order), all during 40 min. He segments were inserted to remove residues of the preceding gas. Some membranes were then subjected to a HCl treatment and/or heating to 300 °C outside the permeation set-up and placed back in the set-up to measure H2 during 19 h and the series of gases for 40 min each, both repeated three times (78 h permeation in total). The membranes were then again

60 | Micropore structure stabilization in organosilica membranes by gaseous catalyst post-treatment
3
3
3
3
3
Figure 1. Schematic representation of the experimental set-up for HCl treatments.
heated to 300 °C outside the permeation set-up and placed back again to measure H2 during 19 h and the series of gases for 40 min each, both repeated three times (78 h permeation in total). The pressure difference for all measurements was 2 bar and the system was flushed for approximately 5 min after changing gases. The membranes were kept at 200 °C during all measurements.
HCl treatment. All samples were consolidated at 300 °C in N2 for at least 3 h prior to HCl treatment. Samples were exposed to HCl gas in a closed square 500 mL glass bottle equipped with two glass petri dishes as schematically shown in Figure 1. For safety, the experiments were done inside a glove bag in a fume hood. The sample was placed in the inner petri dish and 2.88 mL H2SO4 was added on the bottom of the bottle outside the petri dishes. A stoichiometric amount of NaCl (3.15 g) was added to the H2SO4 and the glass bottle was closed. The bottle was swirled gently and was then placed in a slightly tilted fashion to enhance mixing of H2SO4 and NaCl. After exposure of the sample to the generated HCl gas, the petri dish with the sample was taken out of the bottle and out of the glove bag. The sample was heated instantly to 150 °C in air, 200 °C in air or 300 °C in N2 and was then rehydrated at room temperature in the ambient (powders and films) or in a humidified atmosphere (membranes). The periods of time for HCl exposure, waiting before heating, heating and rehydration were varied. The procedure was repeated up to 15 times. The details of each individual sample are given in the text and figure captions of the corresponding results.
Results and discussion BTESE-derived materials were consolidated at 300 °C in N2 for at least 3 h and were then repeatedly exposed to HCl. A complete HCl treatment cycle involved three stages, as schematically shown in Figure 2. First, the sample in its usual hydrated state was exposed to gaseous HCl at room temperature. HCl was formed in-situ from NaCl and liquid H2SO4. Second, the sample was heated to promote dehydration and
HCl gas
NaCl H
2SO
4 sample
glove bag

Results and discussion | 61
3
3
3
3
3
Figure 2. Schematic representation of a HCl treatment cycle. The sample in hydrated state was exposed to gaseous HCl (1), heated (2) and rehydrated (3).
dehydroxylation. Third, the sample was placed in the ambient or a humidified atmosphere to allow rehydration and rehydroxylation.
Film thickness and hydroxyl concentration
The effect of HCl treatments on the structural evolution in BTESE-derived films was investigated by monitoring the film thickness. Figure 3a shows the shrinkage behavior in time at 300 °C as measured in-situ with XRR. After 3 h at 300 °C the films were taken out for HCl treatment and were then heated to 300 °C again for 14 h. Exposure to HCl gas for one period of 24 h led to about 1% additional shrinkage and repeated exposure for four times 1 h with intermediate heating to 200 °C for 10 min increased the shrinkage with 6%. Reference experiments with only liquid H2SO4 (not in direct contact with the sample) indicated no effect of H2SO4 fumes.
29Si DE-MAS-NMR measurements were done to investigate the chemistry underlying the HCl effect. HCl can catalyze both hydrolysis and condensation reactions and either of them can induce film shrinkage. Hydrolysis can facilitate network compaction by reducing its connectivity and thus increasing its mobility, enabling a transition towards a more optimal packing. Condensation can drive network compaction by increasing the connectivity and thus pulling network segments close to each other. Figure 3b shows the hydroxyl concentration in BTESE-derived powders after repeated cycles of exposure to HCl gas for 10 min with intermediate heating to 300 °C for 10 min, as well as repeated cycles of only HCl exposure and repeated cycles of only 300 °C heating. The hydroxyl concentration increased upon repeated exposure to HCl gas without intermediate heating, demonstrating that HCl led to significant hydrolysis. Heating steps after the HCl exposure largely reversed the HCl-driven hydrolysis. The trends for the HCl-treated samples with and without intermediate heating approached each other after a final heating step to bring all samples on a total of 16 h at 300 °C. In both cases, part of the HCl-driven hydrolysis was preserved despite heating. This possibly indicates the existence of a non-zero optimal hydroxyl concentration for BTESE-derived materials. Incomplete condensation may be favorable for network relaxation.
1
+ heat
2
3

62 | Micropore structure stabilization in organosilica membranes by gaseous catalyst post-treatment
3
3
3
3
3
Figure 3. Thickness of BTESE-derived films as measured with XRR and hydroxyl concentration of BTESE-derived powders as measured with 29Si DE-MAS-NMR. a) Thickness monitored at 300 °C in N2 before (t < 3 h) and after (t > 3 h) exposure to HCl gas at room temperature for either one period of 24 h (triangles) or four cycles of 1 h exposure to HCl gas, 20 min waiting, 10 min heating to 200 °C in air and >45 min rehydration in the ambient (circles). b) Hydroxyl concentration measured at room temperature during five cycles of 10 min heating to 300 °C in N2 and >3 h rehydration in the ambient (blue), five cycles of 10 min exposure to HCl gas and >3 h waiting in the ambient (yellow) and five cycles of 10 min exposure to HCl gas, 10 min waiting, 10 min heating to 300 °C in N2 and >3 h rehydration in the ambient (red). A final heating step was done to bring all samples on a total of 16 h at 300 °C. c) Thickness monitored at room temperature during five cycles of 10 min heating to 300 °C in N2 and >3 h rehydration in the ambient (blue), five cycles of 10 min exposure to HCl gas and >3 h waiting in the ambient (yellow) and five cycles of 10 min exposure to HCl gas, 10 min waiting, 10 min heating to 300 °C in N2 and >3 h rehydration in the ambient (red). The dotted line represents film shrinkage under constant heating at 300 °C. The inset shows shrinkage after cycles of heating to 300 °C for 30 min. d) Thickness monitored at 300 °C before (t < 3 h) and after (t > 3 h) four cycles of 1 h exposure to HCl gas, 20 min waiting, 10 min heating to 200 °C in air and 10 min or >45 min rehydration in the ambient.
Figure 3c shows the shrinkage of BTESE-derived films after repeated cycles of exposure to HCl gas for 10 min with intermediate heating to 300 °C for 10 min, as well as repeated cycles of only HCl exposure and repeated cycles of only 300 °C heating. The shrinkage caused by constant heating at 300 °C is shown as reference.
0.91
0.94
0.97
1.00
1.03
0 3 6 9 12 15 18
Rela
tive t
hick
ness
[-]
Time at 300 °C [h]
>45 min
10 min
taken out for4x exposure HCl gas
intermediaterehydration
x0.95
0.96
0.97
0.98
0.99
1.00
0 1 2 3 4 5
Rela
tive t
hick
ness
[-]
Cycles [-]
300 °C
300 °C constant
HCl + 300 °C
HCl
0.48
0.50
0.52
0.54
0.56
0.58
after0 cycles
after2 cycles
after5 cycles
aftertotal 16h
300 °CO
H pe
r Si [
-]
300 °CHClHCl + 300 °C
0.91
0.94
0.97
1.00
1.03
0 3 6 9 12 15 18
Rela
tive t
hick
ness
[-]
Time at 300 °C [h]
taken out forexposure HCl gas
4x 1h
1x 24h
x
a) b)
c) d)
0 1 2 3 4 5
300 °C
300 °C constant

Results and discussion | 63
3
3
3
3
3
Repetitive heating to 300 °C led to somewhat more shrinkage as compared to constant heating. The increase was mainly visible after the first cycle, but the same cycling experiment executed with 30 min heating steps instead of 10 min (allowing more distinction) is shown in the inset of the graph and indicated repeatedly increased film shrinkage during alternate cooling and heating. Apparently, repetitive hydration and dehydration without a catalyst is already sufficient to induce network reorganization. This underlines the possibility of large-scale network evolution via back-and-forth bond breakage and reformation. Repetitive exposure to HCl gas without intermediate heating initially increased shrinkage, but the effect seemed to saturate after several cycles. The increase of film shrinkage by combining repeated HCl exposure with intermediate heating to 300 °C was more than the sum of the increased shrinkage of either step repeated separately. This synergetic effect of HCl exposure and heating corresponds with network optimization occurring in an iterative fashion, involving hydrolysis as well as condensation.
Figure 3d shows the shrinkage of BTESE-derived films after four cycles of HCl exposure for 1 h and heating to 200 °C for 10 min, with varying periods of time in between heating and subsequent HCl exposure. Though the amount of moisture taken up by the organosilica material in this period was not controlled, the film with only 10 min rehydration time was expected to be less hydrated and indeed showed significantly less shrinkage than the film with >45 min rehydration time. This observation corresponds with hydrolysis being the main contribution of HCl as observed with 29Si DE-MAS-NMR. All in all, HCl treatments were found to significantly increase film shrinkage by catalyzing network hydrolysis. The treatments were most effective when applied in a repetitive fashion with intermediate heating and sufficient rehydration.
Chemical integrity
The integrity of the ethylene bridges throughout the HCl treatments was analyzed by 29Si DE-MAS-NMR and FTIR. The relative intensity of the Q peak in the 29Si DE-MAS-NMR spectra was 3-4% for all samples and did not increase, indicating no significant breakage of Si-C bonds during the post-treatments. The FTIR spectra confirmed the stability of the ethylene bridges by showing no changes in the 3000-2800 cm-1 C-H stretching vibrations,17 the 1459 cm-1 H-C-H scissoring vibrations17 and the 1405 cm-1 and 1270 cm-1 C-H bending vibrations in Si-CH2CH2-Si.18-21 Also, no HCl residues were observed. The 29Si DE-MAS-NMR and FTIR spectra are shown in Figures S1 and S2 in the supplementary information.

64 | Micropore structure stabilization in organosilica membranes by gaseous catalyst post-treatment
3
3
3
3
3
Effect of process variables
To investigate how the HCl-driven network evolution progresses in time, BTESE-derived films were repeatedly exposed to HCl gas for varying periods of time, kept in ambient atmosphere for varying periods of time and heated to 300 °C or 150 °C for 30 min. The results are shown in Figure 4a and indicate a close to instantaneous effect of HCl with no benefit of exposure times longer than 10 min. This suggests deactivation of the catalyst or immobilization of the active species. Very short waiting periods between taking the sample out of the HCl atmosphere and heating it increased the shrinkage. Possibly, HCl residues were still present in the film and catalyzed reactions with increasing rates upon heating. This would also suggest that most HCl diffuses out of the film within minutes. Rapid heating to 150 °C yielded almost the same degree of shrinkage as rapid heating to 300 °C.
Figure 4b shows the shrinkage of a film during 15 cycles of HCl exposure for 10 min and intermediate heating to 300 °C for 30 min. After about 10 cycles the shrinkage largely stopped. However, no complete stabilization of the structure was achieved; subsequent heating to 300 °C for 60 h still led to about 4% additional shrinkage.
The progress of condensation during the intermediate heating steps was investigated by repeatedly exposing films to HCl for 10 min with varying periods of heating to 300 °C in between. A final heat treatment was done to bring all samples at the same total period of time at 300 °C to enable fair comparison. Results are shown in Figure 4c. Remarkably, the sample without intermediate heating (0 min) initially stayed behind in shrinkage but achieved the same effect as the other samples once it was heated at
Figure 4. Relative thickness of BTESE-derived films as measured with XRR at room temperature. Each data point represents one treatment cycle. a) Thickness monitored during five cycles of exposure to HCl gas for varying periods of time, waiting for varying periods of time, 30 min heating to 300 °C in N2 or 150 °C in air and >3 h rehydration in the ambient. b) Thickness monitored during 15 cycles of 10 min exposure to HCl gas, 45 s waiting, 30 min heating to 300 °C in N2 and >3 h rehydration in the ambient. The dotted line represents film shrinkage under constant heating. c) Thickness monitored during five cycles of 10 min exposure to HCl gas, 10 min waiting and heating to 300 °C in N2 for varying periods of time.
0.90
0.92
0.94
0.96
0.98
1.00
3 4 5
Rela
tive
thic
knes
s [-]
Time at elevated temperature [h]
120m HCl - 30m waiting -30m 300C
30m HCl - 30m waiting -30m 300C
10m HCl - 10m waiting -30m 300C
10m HCl - 2m waiting -30m 300C
10m HCl - 2mH waiting -30m 300C
1.5#18 150C120 min HCl - 30 min waiting - 300 °C30 min HCl - 30 min waiting - 300 °C10 min HCl - 10 min waiting - 300 °C10 min HCl - 2 min waiting - 300 °C10 min HCl - 45 s waiting - 300 °C10 min HCl - 45 s waiting - 150 °C 0.90
0.92
0.94
0.96
0.98
1.00
3 5 7 9 11
Rela
tive
thic
knes
s [-]
Time at 300 °C [h]
10m HCl -2mH waiting -30m 300C
blankconstant 300 °C
HCl + 300 °C
0.90
0.92
0.94
0.96
0.98
1.00
3 6 9 12 15 18
Rela
tive
thic
knes
s [-]
Time at 300 °C [h]
10m HCl - 10m
10m HCl - 10m
10m HCl - 10m
10m HCl - 10m
0 min10 min30 min120 min
10 min HCl - 10 min waiting -300 °C
a) b) c)

Results and discussion | 65
3
3
3
3
3
the end. This can be explained by accumulating HCl-driven hydrolysis that yields some initial shrinkage but then requires condensation to achieve the full potential of network reorganization. All in all, HCl-driven hydrolysis was found to be approximately instantaneous and accumulative, though reaching full network stabilization is a challenge.
Micropore structure
Single-gas permeation measurements were done on BTESE-derived membranes with He, H2, N2 and CH4 as permeating gases to analyze the evolution of the micropore structure. Two sets of membranes were prepared with different pore sizes. All membranes were preheated in an oven at 300 °C in N2 for 24 h. Gas permeation was measured at 200 °C under continuous steady-state conditions for 16 h. Figure 5 shows the permeance versus kinetic diameter of the permeating gas molecules for both sets of membranes. One set showed H2/N2 and H2/CH4 selectivities of 17-22, comparable to values reported elsewhere6,22 and well above the Knudsen values (theoretical values 3.6 for H2/N2 and 2.8 for H2/CH4). This indicates that the permeance of N2 and CH4 molecules was hindered by a size exclusion mechanism. Based on the kinetic diameters of the gas molecules (He 0.26 nm, H2 0.29 nm, N2 0.36 nm, CH4 0.38 nm)23 the effective pore size was estimated to be around 0.3 nm. The other set of membranes showed H2/N2 and H2/CH4 selectivities around the Knudsen values, indicating absence of size exclusion and an effective pore size larger than 0.4 nm.
Following the first 16 h of gas permeation, some membranes were taken out of the permeation set-up, subjected to either a HCl treatment and heating to 300 °C in N2 for 60 h or only heating to 300 °C in N2 for 60 h, and placed back in the permeation set-up for continuous steady-state permeation at 200 °C for a total of 78 h. The
Figure 5. Gas permeance versus kinetic diameter for BTESE-derived membranes with varying pore sizes, measured after consolidation at 300 °C in N2 for 24 h and equilibration at 200 °C in the gas permeation set-up for 10 h.
1.0E-08
1.0E-07
1.0E-06
1.0E-05
0.25 0.30 0.35 0.40
Kinetic diameter [nm]
α > Knudsen
α ≈ Knudsen
He H2 N2 CH410-5
10-6
10-7
10-8Perm
eanc
e [m
ol m
-2s-1
Pa-1
] 200 °C

66 | Micropore structure stabilization in organosilica membranes by gaseous catalyst post-treatment
3
3
3
3
3
membranes were then taken out of the permeation set-up again for a second heating step at 300 °C for 60 h and the permeation was measured again at 200 °C for a total of 78 h. The HCl treatment involved eight cycles of exposure to HCl for 30 min, immediate heating to 150 °C in air for 30 min and rehydration in a humidified atmosphere for at least 2 h.
Figure 6a shows the permeance of H2 during 10-19 h intervals for the membranes with effective pore sizes >0.4 nm. The permeance of the membrane without intermediate HCl treatment or heating to 300 °C decreased throughout the entire experiment time at 200 °C. This demonstrates the subtle but persistent structural instability of the material after synthesis and consolidation at 300 °C for 24 h. As discussed in Chapter 2,10 the ongoing decrease in permeance can be explained with a slowly increasing number of network linkages and a slow effective densification of the pore structure. The permeance of the membrane with additional intermediate heating to 300 °C showed an ongoing decrease that was enforced by both treatments. The even stronger permeance decay of the membrane with intermediate HCl treatment and heating to 300 °C showed the catalyzing effect of HCl on the pore evolution. It demonstrated the potential result of the subtle instability; a permeance reduction of about 45% occurred in the second and third stage of the experiment. Differences in absolute permeance values at the beginning of the experiments are within the range of common membrane-to-membrane variations. In the first hours at 200 °C (before additional treatments) the flux decay varied somewhat for the different membranes. This could be due to removal of varying extents of adsorbed water from the pores, but may also indicate that the membrane subjected to HCl treatment started with the largest instability and that the apparent influence of HCl was somewhat smaller in reality. Figure 6b shows the relative permeance of He, H2, N2 and CH4 after each 10-19 h H2 interval, indicating that the changes in permeance were identical for all gases. No transition from Knudsen diffusion to size exclusion was observed, indicating that any densification around bottlenecks did not lead to significant formation of small size-selective pores ~0.3 nm.
Figure 6c shows the permeance of H2 during the 10-19 h intervals for all membranes with effective pore sizes ~0.3 nm. The permeance of the membrane without intermediate HCl treatment or heating to 300 °C increased throughout the entire experiment time at 200 °C, indicating that these smaller pores widened or opened. As discussed in Chapter 2,10 pores ~0.3 nm are so narrow that hydroxyl groups at the pore surface are likely to sterically hinder passing gas molecules. In this situation the net loss of bulky oxygen atoms due to ongoing condensation reactions (replacing two pendant hydroxyl groups by one bridging oxygen atom) can increase the permeance of inert gas molecules through those small pores. Therefore, despite the opposite trend in permeance as compared to larger pores >0.4 nm, the observed changes in

Results and discussion | 67
3
3
3
3
3
Figure 6. In-situ GP data at 200 °C of BTESE-derived membranes with effective pore sizes of >0.4 nm and ~0.3 nm after consolidation at 300 °C in N2 for 24 h. After 16 h of continuous permeation, some membranes were temporarily taken out of the permeation set-up for a HCl treatment and heating to 300 °C for 60 h (red) or for only heating to 300 °C for 60 h (blue). The HCl treatment involved eight cycles of exposure to HCl for 30 min, immediate heating to 150 °C in air for 30 min and rehydration in a humidified atmosphere for at least 2 h. After another 78 h of continuous permeation, the membranes were heated again to 300 °C for 60 h. The treatments are indicated in the graphs by crosses on the x-axis and vertical dotted lines. a) Permeance of H2 through membranes with effective pore sizes >0.4 nm during consecutive continuous periods of 10-19 h. b) Relative permeance of He, H2, N2 and CH4 through membranes with effective pore sizes >0.4 nm. c) Permeance of H2 through membranes with effective pore sizes ~0.3 nm during consecutive continuous periods of 10-19 h. d) Relative permeance of He, H2, N2 and CH4 through membranes with effective pore sizes ~0.3 nm.
pores ~0.3 nm can be explained within the same framework of ongoing condensation. A similar widening of pores ~0.3 nm has been observed by means of positron annihilation spectroscopy in purely inorganic silica (amorphous SiO2) for increasing calcination temperatures.24 The permeance of the membrane with additional intermediate heating to 300 °C showed an ongoing increase that was enforced by both heating steps. The permeance of the membrane with intermediate HCl treatment and heating to 300 °C demonstrated the catalyzing effect of HCl; the smaller pores rapidly widened or opened (removal of pendant hydroxyl groups) and then showed a transition towards a decreasing permeance due to overall pore structure densification. Such overall densification also occurred in the Knudsen-type membranes with effective pore sizes >0.4 nm and affected the permeation channels on a longer time scale than pore widening.
0.5
0.6
0.7
0.8
0.9
1
0 30 60 90 120 150 180Time at 200 °C [h]
M34 large HCl He H2 N
α ≈ Knudsen
HCl + 300 °C 300 °C
H2,N2,CH4
He
0.5
0.6
0.7
0.8
0.9
1
0 30 60 90 120 150 180Time at 200 °C [h]
M32 large 300C He H2
N2 CH4
α ≈ Knudsen
300 °C 300 °C
He,H2,N2,CH4
Rela
tive
perm
eanc
e [-]
Rela
tive
perm
eanc
e [-]
H2,N2
0.50
0.60
0.70
0.80
0.90
1.00
0 30 60 90Time at 200 °C [h]
M30 large He
H2
N2
CH4
α ≈ Knudsen
He,H2,N2,CH4
no treatment
H2He,N2CH4
0.6
0.7
0.8
0.9
1
1.1
0 30 60 90 120 150 180Time at 200 °C [h]
α > Knudsen
HeN2
H2
HCl + 300 °C 300 °C0.6
0.7
0.8
0.9
1
1.1
0 30 60 90 120 150 180Time at 200 °C [h]
α > Knudsen
He
300 °C 300 °C
N2
0.60
0.70
0.80
0.90
1.00
1.10
0 30 60 90Time at 200 °C [h]
α > Knudsen
no treatment
CH4
CH4
H2H2He,N2CH4
x x x x
x x x x
Time at 200 °C [h] 0 30 60 90 120 150
Time at 200 °C [h] 0 30 60 90 120 150 H 2
per
mea
nce
x 10
-9 [m
ol m
-2 s-1
Pa-1
] H 2
per
mea
nce
x 10
-9 [m
ol m
-2 s-1
Pa-1
] 1250
1050
850
650
450
670
600
530
460
390
α ≈ Knudsen
α > Knudsen
no treatment
300 °C 300 °C
HCl +300 °C 300 °C
HCl +300 °C 300 °C
no treatment
300 °C 300 °C
a) b)
c) d)

68 | Micropore structure stabilization in organosilica membranes by gaseous catalyst post-treatment
3
3
3
3
3
Figure 6d shows the relative permeance of He, H2, N2 and CH4 through the membranes with effective pore sizes ~0.3 nm after each 10-19 h H2 interval. Significant discrimination between larger and smaller molecules occurred. The larger pores appeared to be more sensitive to overall densification and larger molecules may benefit less from the widening or opening of the smallest pores. The increasing selectivity for smaller molecules corresponds with previous reports on vapor-phase HCl treatments of BTESE-derived membranes.11,12 All in all, HCl treatments could accelerate both the widening or opening of the smallest pores and the densification of the overall pore structure, unveiling a remarkable potential for change in the material. Though ongoing changes in permeance of the membrane with HCl treatment are hardly visible after the second heating step, complete stabilization of the pore structure may not be achieved. Nevertheless, the acceleration of the pore evolution demonstrates the effectiveness of the approach of iterative hydrolysis and condensation. Optimization of this process for specific membrane devices enables improving the long-term performance stability.
The ongoing reorganization of the material structure raises the question to what end state the network is evolving. The Si-O-Si bond angles are known to be able to vary over 40° and thus form significant amounts of non-optimal network linkages.25 These have the potential to take on energetically more favorable conformations when the required energy is supplied. The non-reversible nature of the observed network evolution indeed points towards relaxation and not only to a shift in the equilibrium between condensation and hydrolysis due to changing environments. The observations of a possible non-zero optimum in hydroxyl concentration (Figure 3b) and of pores ~0.3 nm widening or opening while the overall pore structure densifies (Figure 6) also correspond with network relaxation. The ideal connectivity and pore size may be dictated by the spacing ethylene bridges. Molecular dynamics simulations of ethylene-bridged silica are reported to yield networks with a relatively broad pore size distribution with a maximum at approximately 0.25 nm, a shoulder at approximately 0.37 nm and reaching zero around 0.5-0.6 nm.26,27 The ethylene bridges in these studies were randomly spread throughout the network and did not exactly mimic the experimental situation of each Si atom being bound to one ethylene bridge. The presence of the largest and smallest pores is thus probably overestimated. Nevertheless, the bimodal distribution does suggest the existence of preferential pore sizes and shows a local maximum in between ~0.3 nm and >0.4 nm.
As for the industrial applications of microporous organosilica membranes, these often involve liquid separation processes with retentate molecules of larger size than the gases used in the present study. This can cause identical membrane evolution to manifest differently in performance. Larger molecules may experience less additional hinder of ongoing pore shrinkage and the hinder for smaller molecules may become

Conclusion | 69
3
3
3
3
3
more important. This can result in a stable or even decreasing selectivity accompanying the flux decline instead of the increasing selectivity observed in the present study. Furthermore, industrial feed streams often contain water and depending on the operation conditions (temperature, acidity etc.) this will induce local rehydrolysis. This could then increase the steric hindrance of permeating species through the smallest pores, which could also be responsible for a slow (additional) flux decline. Such environment-dependent equilibration issues may be solved by periodical regenerative treatments.
Conclusion Structural evolution of BTESE-derived networks is strongly accelerated by repeated exposure to HCl gas alternated with heating, which induces iterative hydrolysis and condensation. XRR indicated increased shrinkage in BTESE-derived films. 29Si DE-MAS-NMR and FTIR of BTESE-derived powders indicated no degradation of the ethylene bridges and increasing hydroxyl concentrations upon exposure to HCl, demonstrating that HCl predominantly catalyzed hydrolysis of siloxane bonds. GP of BTESE-derived membranes indicated accelerated widening or opening of the smallest pores and densification of the overall pore structure. This yielded changes of as much as 45% in permeance. The networks were not fully stabilized after being at 200-300 °C for up to 12 days, but material evolution was pushed significantly further towards its end state. The approach of iterative hydrolysis and condensation is effective for network relaxation and enables improvement of the long-term performance stability of BTESE-derived molecular sieving membranes. Using gaseous HCl eliminates the risk of material dissolution and pinhole formation related to wet- or vapor-phase catalyst treatments.
Acknowledgements Financial support from the Advanced Dutch Energy Materials (ADEM) program of the Dutch Ministry of Economic Affairs, Agriculture and Innovation is gratefully acknowledged. Support from the Dutch organization of scientific research (NWO) for the solid-state NMR facility for advanced materials science in Nijmegen is gratefully acknowledged.
References 1. H.L. Castricum, A. Sah, R. Kreiter, D.H.A. Blank, J.F. Vente, J.E. ten Elshof, J. Mater. Chem. 2008, 18,
2150–2158. 2. H.L. Castricum, R. Kreiter, H.M. van Veen, D.H.A. Blank, J.F. Vente, J.E. ten Elshof, J. Memb. Sci.
2008, 324, 111–118. 3. H.L. Castricum, A. Sah, R. Kreiter, D.H.A. Blank, J.F. Vente, J.E. ten Elshof, Chem. Commun. 2008,
1103–1105.

70 | Micropore structure stabilization in organosilica membranes by gaseous catalyst post-treatment
3
3
3
3
3
4. R. Kreiter, M.D.A. Rietkerk, H.L. Castricum, H.M. van Veen, J.E. ten Elshof, J.F. Vente, ChemSusChem. 2009, 2, 158–160.
5. M. Kanezashi, K. Yada, T. Yoshioka, T. Tsuru, J. Am. Chem. Soc. 2009, 131, 414–415. 6. H.L. Castricum, G.G. Paradis, M.C. Mittelmeijer-Hazeleger, R. Kreiter, J.F. Vente, J.E. ten Elshof, Adv.
Funct. Mater. 2011, 21, 2319–2329. 7. M. Kanezashi, S. Miyauchi, H. Nagasawa, T. Yoshioka, T. Tsuru, RSC Adv. 2013, 3, 12080–12083. 8. R. Xu, M. Kanezashi, T. Yoshioka, T. Okuda, J. Ohshita, T. Tsuru, ACS Appl. Mater. Interfaces 2013, 5,
6147–6154. 9. H.M. van Veen, M.D.A. Rietkerk, D.P. Shanahan, M.M.A. van Tuel, R. Kreiter, H.L. Castricum, J.E. ten
Elshof, J.F. Vente, J. Memb. Sci. 2011, 380, 124–131. 10. A.P. Dral, K. Tempelman, E.J. Kappert, L. Winnubst, N.E. Benes, J.E. ten Elshof, J. Mater. Chem. A.
2017, 5, 1268–1281. 11. J. Wang, G. Gong, M. Kanezashi, T. Yoshioka, K. Ito, T. Tsuru, Chem. Lett. 2012, 41, 1663–1665. 12. J. Wang, G. Gong, M. Kanezashi, T. Yoshioka, K. Ito, T. Tsuru, J. Memb. Sci. 2013, 441, 120–128. 13. H.P. Lin, C.Y. Mou, S.B. Liu, Chem. Lett. 1999, 28, 1341–1342. 14. I. V. Melnyk, Y.L. Zub, E. Véron, D. Massiot, T. Cacciaguerra, B. Alonso, J. Mater. Chem. 2008, 18,
1368–1382. 15. H.P. Lin, C.Y. Mou, S. Bin Liu, Adv. Mater. 2000, 12, 103–106. 16. G. Gong, H. Nagasawa, M. Kanezashi, T. Tsuru, ACS Appl. Mater. Interfaces 2016, 8, 11060–11069. 17. G. Socrates, Infrared characteristic group frequencies: tables and charts, 2nd ed., Wiley, Chichester,
1994. 18. Y. Kayaba, F. Nishiyama, Y. Seino, T. Kikkawa, J. Phys. Chem. C 2011, 115, 12981–12989. 19. F. Hoffmann, M. Güngerich, P.J. Klar, M. Fröba, J. Phys. Chem. C 2007, 111, 5648–5660. 20. U. Díaz-Morales, G. Bellussi, A. Carati, R. Millini, W. O’Neil Parker Jr., C. Rizzo, Microporous
Mesoporous Mater. 2006, 87, 185–191. 21. V. Rebbin, M. Jakubowski, S. Pötz, M. Fröba, Microporous Mesoporous Mater. 2004, 72, 99–104. 22. H.F. Qureshi, A. Nijmeijer, L. Winnubst, J. Memb. Sci. 2013, 446, 19–25. 23. D.W. Breck, Zeolite molecular sieves: structure, chemistry and use, John Wiley & Sons, Inc., New
York, 1974, pp. 593-724. 24. M.C. Duke, S.J. Pas, A.J. Hill, Y.S. Lin, J.C. Diniz da Costa, Adv. Funct. Mater. 2008, 18, 3818–3826. 25. D.S. Wragg, R.E. Morris, A.W. Burton, Chem. Mater. 2008, 20, 1561–1570. 26. K.-S. Chang, T. Yoshioka, M. Kanezashi, T. Tsuru, K.-L. Tung, J. Memb. Sci. 2011, 381, 90–101. 27. T. Shimoyama, T. Yoshioka, H. Nagasawa, M. Kanezashi, T. Tsuru, Desalin. Water Treat. 2013, 51,
5248–5253.

Supplementary information | 71
3
3
3
3
3
Supplementary information
Figure S1. 29Si DE-MAS-NMR spectra of BTESE-derived powder measured at room temperature during five cycles of 10 min heating to 300 °C in N2 and >3 h rehydration in the ambient (blue series), five cycles of 10 min exposure to HCl gas and >3 h waiting in the ambient (green series) and five cycles of 10 min exposure to HCl gas, 10 min waiting, 10 min heating to 300 °C in N2 and >3 h rehydration in the ambient (red series). A final heating step was done to bring the samples on a total of 16 h at 300 °C.
Figure S2. FTIR spectra of BTESE-derived powder measured at room temperature during five cycles of 10 min heating to 300 °C in N2 and >3 h rehydration in the ambient (blue series), five cycles of 10 min exposure to HCl gas and >3 h waiting in the ambient (green series) and five cycles of 10 min exposure to HCl gas, 10 min waiting, 10 min heating to 300 °C in N2 and >3 h rehydration in the ambient (red series). A final heating step was done to bring the HCl-treated samples on a total of 16 h at 300 °C.
3.82E+03 2.99E+03 2.29E+03 2.03E+03 2.38E+03 3.33E+03 4.65E+03 6.04E+03 7.18.42E+02 6.36E+02 2.94E+02 -1.55E+02 -6.76E+02 -1.23E+03 -1.77E+03 -2.27E+03 -2.63.08E+03 2.84E+03 2.42E+03 1.86E+03 1.21E+03 5.06E+02 -1.91E+02 -8.34E+02 -1.34.83E+03 4.58E+03 4.39E+03 4.27E+03 4.22E+03 4.23E+03 4.31E+03 4.44E+03 4.67.91E+03 8.16E+03 8.21E+03 8.08E+03 7.82E+03 7.49E+03 7.16E+03 6.89E+03 6.7
+05
+00
+05
+05
+05
+05
+06
+06
+06
+06
+06
-120-110-100-90-80-70-60-50-40-30
Inte
nsity
[a.u
.]
Chemical shift [ppm]
no post-treatment2x 10 min heating5x 10 min heating5x 10 min heating + total 16 h heating2x 10 min HCl5x 10 min HCl5x 10 min HCl + total 16 h heating2x 10 min HCl, 10 min waiting, 10 min heating5x 10 min HCl, 10 min waiting, 10 min heating5x 10 min HCl, 10 min waiting, 10 min heating
+ total 16 h heatingT1
T2T3
Q2 / Q3 / Q4
250026002700280029003000310032003300340035003600370038003900
Abso
rban
ce [-
]
Wavenumber [cm-1]
9001000110012001300140015001600170018001900
Abso
rban
ce [-
]
Wavenumber [cm-1]
no post-treatment2x 10 min heating5x 10 min heating2x 10 min HCl5x 10 min HCl5x 10 min HCl + total 16 h heating2x 10 min HCl, 10 min waiting, 10 min heating5x 10 min HCl, 10 min waiting, 10 min heating5x 10 min HCl, 10 min waiting, 10 min heating + total
16 h heating

72 | Micropore structure stabilization in organosilica membranes by gaseous catalyst post-treatment
3
3
3
3
3

Abstract | 73
4
4
4
4
4
4
Analyzing microporosity
with vapor thermogravimetry
and gas pycnometry
This chapter is published as:
A.P. Dral, J.E. ten Elshof, Analyzing microporosity with vapor thermogravimetry and gas pycnometry, Microporous and Mesoporous Materials 2018, 258, 197-204.

74 | Analyzing microporosity with vapor thermogravimetry and gas pycnometry
4
4
4
4
4

Abstract | 75
4
4
4
4
4
Abstract The complementary use of thermogravimetry and pycnometry is demonstrated to expand the toolbox for experimental micropore analysis <1 nm. Thermogravimetry is employed to assess the uptake of water, methanol, ethanol, 1-propanol and cyclohexane vapors in microporous structures at room temperature and derive quantitative micropore volumes and minimum pore entrance sizes together with qualitative information on surface chemistries. Pycnometry is employed to measure the uptake and adsorption of helium, argon and nitrogen gas in microporous structures at room temperature and derive semi-quantitative surface-to-volume ratios, surface areas and micropore cavity sizes and qualitative information on the surface chemistries. The method is validated and calibrated by applying it to a series of zeolites with known micropore structures. The results are compared with data from conventional N2 adsorption at -196 °C and CO2 adsorption at 0 °C. Main advantages of the demonstrated method are that diffusion limitations due to cryogenic temperatures are eliminated, adsorption is studied with non-polar gases, micropore cavity sizes are probed separate from micropore entrances and data can be interpreted in a straightforward fashion without requiring theoretical models on molecular behavior. Micropores <1 nm can thus be analyzed with increased accuracy as compared to conventional adsorption isotherm analysis.
Introduction Analyzing microporosity is important for the design and implementation of materials for e.g. molecular sieving membranes, catalysts, adsorbents and pharmaceutics.1-4 Microporosity originates from intrinsic material properties as well as material synthesis and processing, which yields extensive tunability but also requires a high level of control during preparation. In addition to the field of material engineering, micropore analysis is also relevant in the areas of e.g. natural resources and food to evaluate material characteristics.5-8 A wide range of experimental analysis techniques is employed to obtain information on micropore size, volume, surface chemistry and surface area that can roughly be divided into three classes: radiation porosimetry, permeation porosimetry and adsorption porosimetry. Though not exhaustive, various experimental techniques are shortly discussed below to sketch the possibilities of commonly used methods and the added value of the approach presented in this study.
Radiation porosimetry analyzes micropore characteristics via radiation events inside micropores or at the interface between micropore and wall. Small-angle and wide-angle X-ray scattering employs scattering of X-rays at the interface between micropore and wall and provides information on micropore surface areas and

76 | Analyzing microporosity with vapor thermogravimetry and gas pycnometry
4
4
4
4
4
micropore sizes down to 0.3 nm.9-12 Small-angle neutron scattering provides similar information and is also sensitive to light elements.13 Interpretation of scattering data usually requires sample details such as the particle shape and structure factor of the system to be known. Positron annihilation spectroscopy monitors the lifetime and decay of positronium inside micropores. This yields depth-resolved information on micropore size and volume and the electronic structure of the pore walls, being able to probe pores as small as positronium (Bohr radius = 0.053 nm).14-18 A drawback is that it requires a radioactive positron source. Radiation porosimetry targets all micropores regardless of them being interconnected or isolated.
Permeation porosimetry evaluates micropore characteristics more tangibly via gaseous or liquid probe molecules that permeate through the micropore structure. It probes the bottlenecks along continuous permeation paths from one side to the other; dead-end and isolated porosity is neglected. Molecular sieving membrane permeation gives information on pore entrance sizes in the range of the probe molecules, which is 0.3-0.4 nm for commonly used gases such as He, H2, N2 and CH4 and can reach somewhat larger sizes for liquid separations.4,19,20 Especially for liquid separations, permeation selectivities can also give information on micropore surface chemistries.4 A combination of permeation and adsorption porosimetry is nanopermporometry. Nanopermporometry is commonly based on the Kelvin equation which should not be applied to pores <2 nm, but the technique has been reported to show reasonable correlation with membrane separation performance for pore sizes down to 0.5 nm.21 Nanopermporometry can discriminate between hydrophilic and hydrophobic pore surfaces,22,23 though for very small pores such distinctions are complicated by other effects.21 A drawback of permeation porosimetry is that it requires the fabrication of defect-free membranes and the obtained information only represents a small part of the pore structure.
Adsorption porosimetry evaluates micropore characteristics on a larger scale via gaseous or liquid probe molecules that adsorb on the micropore surface. This adsorption is affected by the geometry of the micropore structure as well as the surface chemistry and analyzes all pores that are accessible to the probe molecules. Adsorption calorimetry24,25 and temperature-programmed desorption measure-ments26 provide information on surface chemistry. Gas adsorption isotherms provide more diverse information and are routinely obtained, e.g. for N2 at -196 °C or Ar at -186 °C, to determine surface areas based on the Brunauer-Emmett-Teller theory and determine pore volumes and sizes based on fitting to various models (e.g. non-local density functional theory, Saito-Foley, Dubinin-Radushkevich).9,14,27-29 For micropores approaching molecular dimensions, the gas mobility diminishes at cryogenic temperatures and CO2 adsorption at 0 °C can be used as alternative. The validity and limitations of gas adsorption isotherm analysis in the micropore regime

Introduction | 77
4
4
4
4
4
have been discussed in literature extensively.9,14,27-29 Adsorption isotherms of vapors (solvents) in microporous materials yield additional information on surface chemistry and can be obtained with e.g. ellipsometric porosimetry,30-32 though this method is not widely used. Furthermore, microporosity is occasionally revealed by adsorption isotherms of vapors in mesoporous materials obtained with X-ray reflection porosimetry33 and quartz crystal microbalance porosimetry,34 indicating possibilities for these techniques to be developed further for microporous materials. As for analyzing micropore volumes, complete pore filling allows a more straightforward physical interpretation than partial pore filling, since no theoretical models on molecular behavior are needed for extrapolation. When using vapors instead of gases, complete pore filling can be achieved at room temperature and diffusion limitations due to cryogenic temperatures are thus eliminated. This more crude version of adsorption porosimetry (solvent-wall interactions are still highly relevant when filling pores of molecular dimensions) has been reported in literature for decades using gravimetry.2,35-38 Despite its simplicity, (thermo)gravimetric porosimetry with vapors is not widely employed in materials research and engineering nowadays.
In the present study, the long known technique of vapor thermogravimetry (TG) is combined with a newly developed procedure for gas pycnometry (PM) to provide an experimental method for micropore analysis with improved accuracy in the size range <1 nm as compared to conventional adsorption isotherms. Gas PM is generally used for density analysis, which in materials engineering tends to be done with He as probe gas because of its inertness and small size. Literature studies using PM in other fields, e.g. the coal, food and pharmaceutical industries, include other gases such as N2 and H2
1,5-8 and occasionally revealed signs of gas adsorption in PM data.5,6 In the present study, the use of PM to measure gas adsorption in porous materials is further developed. Firstly, vapor uptake in microporous materials is monitored with TG for direct and quantitative measurement of the accessible pore volume at room temperature. Information on micropore entrance sizes and surface chemistries is also obtained with vapor TG. Secondly, analyzing gas uptake in microporous materials with PM is shown to allow direct and semi-quantitative measurement of the surface-to-volume ratio and surface area at room temperature. Low degrees of pore filling are achieved with non-polar gases, eliminating the need for cryogenic temperatures and reducing complications due to confinement, surface curvature and enhanced adsorbent-adsorbate interactions. Information on surface chemistries is also obtained with gas PM. Thirdly, analyzing competitive uptake of multiple gases with PM allows probing of micropore cavity sizes separate from micropore entrances. The analytical method is validated and calibrated by characterizing a series of zeolites with known micropore structures. Water, methanol, ethanol, 1-propanol and cyclohexane were used as vapor probe molecules for TG. He, Ar and N2 were used as

78 | Analyzing microporosity with vapor thermogravimetry and gas pycnometry
4
4
4
4
4
gas probe molecules for PM. The results are compared with data from conventional N2 adsorption isotherms at -196 °C and CO2 adsorption isotherms at 0 °C.
Experimental Chemicals. Zeolite A in calcium form with SiO2:Al2O3 2:1 (certification BCR-705, 1-2% clay binder) was obtained from Sigma Aldrich. Zeolite ZSM5 in ammonium form with SiO2:Al2O3 30:1, zeolite ZSM5 in ammonium form with SiO2:Al2O3 200-400:1, zeolite β in hydrogen form with SiO2:Al2O3 360:1, zeolite Y in hydrogen form with SiO2:Al2O3 5.1:1, zeolite Y in hydrogen form with SiO2:Al2O3 80:1 and anhydrous methanol (purity 99.8%, <0.005% H₂O) were obtained from VWR. Anhydrous ethanol (purity 99.8%, <0.01% H2O) was obtained from SeccoSolv. Anhydrous 1-propanol (purity 99.9%) and cyclohexane (purity >99%) were obtained from Alfa Aesar.
Sample preparation. The millimeter-sized zeolite A pellets were ground with a mortar and pestle and then ball-milled to obtain powder. The ZSM5 zeolites in ammonium form were heated to 550 °C under N2 flow for 6 h (heating rate 450 °C h-1) to obtain the hydrogen form.26
Thermogravimetry. Thermogravimetric data was recorded with a Netzsch STA 449 F3 Jupiter machine and platinum crucibles. The sample was dried at 200 °C in synthetic air (N2:O2 80:20) for 4 h, stabilized at 30 °C in synthetic air for 1 h, filled with vapor at 30 °C in humidified N2 for 18 h, flushed at 30 °C in synthetic air for 1 h and dried at 200 °C in synthetic air for 4 h. Heating and cooling rates were 5 °C min-1. The supplied gases were dried with SGE packed column moisture traps and the N2 was subsequently humidified by bubbling through a solvent at room temperature (40 mL, bubble path length approximately 12 cm). The relative vapor pressure was assumed to reach the saturation value at room temperature and remain slightly below the saturation value at 30 °C, reducing the risk on unwanted condensation during the measurement. The gas flow rate was 60 mL min-1 and data were recorded every 10 s.
Pycnometry. Pycnometry measurements were done with a Quantachrome Instruments Multipycnometer in the microcell configuration and gases of >99.999% purity (He, Ar) and >99.996% purity (N2) that were led through an SGE packed column moisture trap before entering the pycnometer. The sample was loaded in the sample cell and then dried in an oven at 150 °C under N2 flow for 3 h. Immediately afterwards, the sample was weighed and loaded in the pycnometer. The apparent sample volume was analyzed with He, He+He, He+N2, Ar, N2 and N2+N2 (measured in this order). For the measurements with a single gas, approximately 0.30 mmol gas was added (Δpref ≈ 1.2 x 10⁵ Pa) and the cell pressure was monitored for 10 min. The cell was then slowly vented to atmospheric pressure in approximately 1 min and the next measurement was started immediately afterwards (for adsorbing gases the

Results and discussion | 79
4
4
4
4
4
desorption time may affect the subsequent adsorbing amount and should be kept constant). This was repeated until the system was equilibrated and yielded consistent results for three consecutive runs. For the measurements with two gases, 0.15 mmol of the first gas was added (Δpref ≈ 6 x 10⁴ Pa), then the cell pressure was monitored for 10 min, then 0.15 mmol of the second gas was added (Δpref ≈ 6 x 10⁴ Pa) and the cell pressure was monitored again for 10 min.
Adsorption isotherms. Adsorption isotherms were collected with a Quantachrome Instruments Autosorb-1 and the gases were led through a moisture trap before entering the set-up. The sample was outgassed at 300 °C for 3 h. Adsorption isotherms were collected for CO2 at 0 °C and for N2 at -196 °C. Brunauer-Emmett-Teller (BET) curves derived from CO2 adsorption were based on at least 4 data points.
Results and discussion A list of variables used in this study is given in Table 1. Structural information of the used zeolites is listed in Table 2, including the average tetrahedral unit molecular weight mT, theoretical framework density ρfr,th, theoretical accessible volume Vacc,th, theoretical accessible surface area Aacc,th and maximum sphere size d that can be included in or pass through the micropores. The framework density (envelope density) includes both the skeleton and the pores. A schematic representation of the vapor TG and gas PM experiments and definitions of various parameters is shown in Figure 1. The accessible volume as listed in the Database of Zeolite Structures39 is defined as the pore volume that can be reached by the center of a hard sphere with a radius of 1.4 Å, thus excluding the regions within 1.4 Å from the pore surface and systematically underestimating the real accessible volume to a large extent. No accurate volume estimations could be obtained mathematically due to the
Figure 1. a) Schematic representation of the vapor TG and gas PM experiments. With vapor TG all micropores are completely filled by the vapor. With gas PM the micropores are partially filled by the gas. In the case of Ar and N2, significant adsorption occurs on the micropore surfaces. This causes an accumulation of gas molecules inside the micropores (Nfr) as compared to gas molecules outside the sample (Nc). b) Schematic definition of the zeolite skeleton volume, pore volume and framework volume.
measurement cell
vapor Ar or N2 gas
zeolite
micropore
measurement cell Nc Nfr
skeleton, He sample volume
accessible pore volume Vacc
framework volume Vfr
a) b) He gas
measurement cell
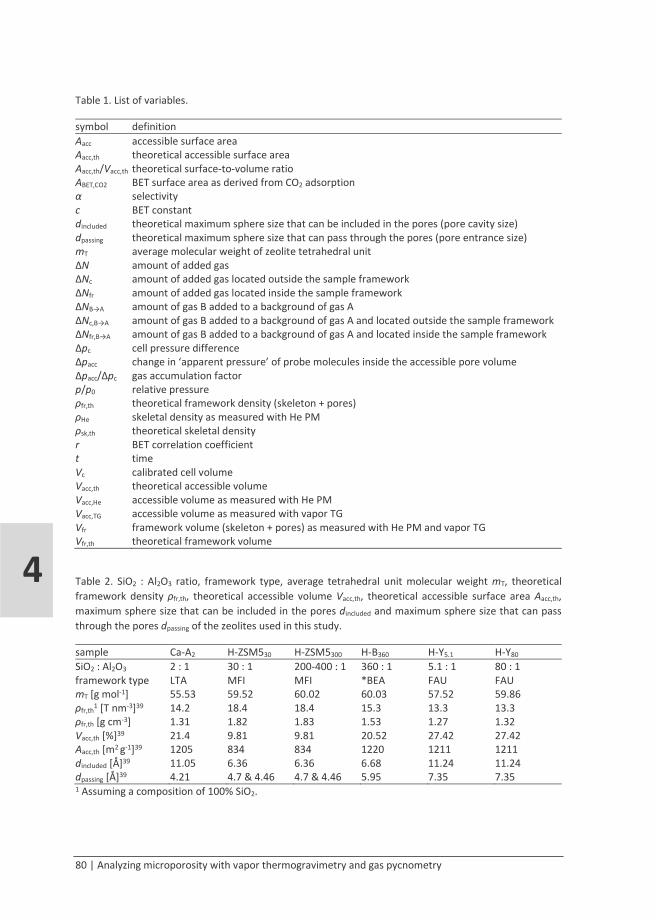
80 | Analyzing microporosity with vapor thermogravimetry and gas pycnometry
4
4
4
4
4
Table 1. List of variables.
symbol definition Aacc accessible surface area Aacc,th theoretical accessible surface area Aacc,th/Vacc,th theoretical surface-to-volume ratio ABET,CO2 BET surface area as derived from CO2 adsorption α selectivity c BET constant dincluded theoretical maximum sphere size that can be included in the pores (pore cavity size) dpassing theoretical maximum sphere size that can pass through the pores (pore entrance size) mT average molecular weight of zeolite tetrahedral unit ΔN amount of added gas ΔNc amount of added gas located outside the sample framework ΔNfr amount of added gas located inside the sample framework ΔNB→A amount of gas B added to a background of gas A ΔNc,B→A amount of gas B added to a background of gas A and located outside the sample framework ΔNfr,B→A amount of gas B added to a background of gas A and located inside the sample framework Δpc cell pressure difference Δpacc change in ‘apparent pressure’ of probe molecules inside the accessible pore volume Δpacc/Δpc gas accumulation factor p/p0 relative pressure ρfr,th theoretical framework density (skeleton + pores) ρHe skeletal density as measured with He PM ρsk,th theoretical skeletal density r BET correlation coefficient t time Vc calibrated cell volume Vacc,th theoretical accessible volume Vacc,He accessible volume as measured with He PM Vacc,TG accessible volume as measured with vapor TG Vfr framework volume (skeleton + pores) as measured with He PM and vapor TG Vfr,th theoretical framework volume
Table 2. SiO2 : Al2O3 ratio, framework type, average tetrahedral unit molecular weight mT, theoretical framework density ρfr,th, theoretical accessible volume Vacc,th, theoretical accessible surface area Aacc,th, maximum sphere size that can be included in the pores dincluded and maximum sphere size that can pass through the pores dpassing of the zeolites used in this study.
sample Ca-A2 H-ZSM530 H-ZSM5300 H-B360 H-Y5.1 H-Y80
SiO2 : Al2O3 2 : 1 30 : 1 200-400 : 1 360 : 1 5.1 : 1 80 : 1 framework type LTA MFI MFI *BEA FAU FAU mT [g mol-1] 55.53 59.52 60.02 60.03 57.52 59.86 ρfr,th1 [T nm-3]39 14.2 18.4 18.4 15.3 13.3 13.3 ρfr,th [g cm-3] 1.31 1.82 1.83 1.53 1.27 1.32 Vacc,th [%]39 21.4 9.81 9.81 20.52 27.42 27.42 Aacc,th [m2 g-1]39 1205 834 834 1220 1211 1211 dincluded [Å]39 11.05 6.36 6.36 6.68 11.24 11.24 dpassing [Å]39 4.21 4.7 & 4.46 4.7 & 4.46 5.95 7.35 7.35 1 Assuming a composition of 100% SiO2.

Results and discussion | 81
4
4
4
4
4
complexity of the pore structures. The accessible surface area as listed in the Database of Zeolite Structures39 is defined as the surface area that can be covered by the center of a hard sphere with a radius of 1.4 Å, thus also underestimating the real accessible surface area.
Vapor TG and He PM
Vapor TG measurements were done to measure the accessible pore volume of the zeolites for water, methanol, ethanol, 1-propanol and cyclohexane. The samples were dried in-situ at 200 °C and then exposed to a flow of N2 with one of the vapors at 30 °C for 18 h. The mass uptake was divided by the bulk liquid density to estimate the uptake in volume, though the solvents do not necessarily maintain their bulk densities inside the micropores due to the small micropore sizes and significant wall-solvent interactions. Dehydrated alcohols were used and the carrier gases were led through a moisture trap before entering the set-up. Reference measurements with dried gases indicated that traces of water were still present in the gases after drying, which may have caused an overestimation of the organic solvent uptake by a few percent. Results are shown in Figure 2. For most samples no significant differences were observed between the total uptake of methanol, ethanol, 1-propanol and cyclohexane, indicating that all micropore structures were accessible to all molecules. It also indicates that no significant interparticle adsorption occurred, since interparticle adsorption is expected to scale with vapor volatility. Only the hydrophobic zeolites H-Y80 and to a lesser extent H-ZSM5300 showed, unlike their hydrophilic counterparts, a slightly decreasing vapor uptake in the order ethanol > methanol ≈ 1-propanol > cyclohexane. This can be explained by larger molecules leaving larger packing voids (which may have been filled with traces of water from the carrier gases in the hydrophilic structures) and methanol showing hindered
Figure 2. Vapor uptake in the zeolites as measured with TG during exposure to a flow of N2 with a vapor. The uptake was averaged between 10 and 18 h filling time and the error bars indicate two times the standard deviation.
0.00
0.10
0.20
0.30
A H-ZSM530 H-ZSM5300 H-B360 H-Y5.1 H-Y80
vapo
r upt
ake
[cm
3g-1
]
watermethanolethanol1-propanolcyclohexane
Ca-A2 H-ZSM530 H-ZSM5300 H-B360 H-Y5.1 H-Y80

82 | Analyzing microporosity with vapor thermogravimetry and gas pycnometry
4
4
4
4
4
uptake because of its high polarity. For most samples the water uptake was significantly lower than the organic solvent uptake and the uptake decreased with increasing SiO2 : Al2O3 ratio (increasing hydrophobicity). Water/methanol uptake ratios are listed in Table 3 to facilitate comparison, though it should be kept in mind that the influence of surface chemistry on vapor uptake increases with the surface-to-volume ratio. Simultaneous differential scanning calorimetry monitoring (data not shown) indicated that alcoholic pore filling was increasingly exothermic for increasing micropore hydrophilicity, likely due to the formation of hydrogen bonds between solvent and zeolite. All zeolites showed rapid filling by all vapors and an increasing filling rate with increasing vapor pressure. No dependency on micropore size was observed.
The accessible pore volume Vacc,TG of each sample was taken as the average of the methanol, ethanol and 1-propanol uptakes. The results are listed in Table 3 together with PM data. PM measurements with He as probe gas were done to obtain a second experimental value for the accessible pore volume, Vacc,He, and the He density ρHe. Vacc,He was obtained by subtracting the sample volume as measured with He from the sample framework volume as derived from the sample mass and the theoretical framework density ρfr,th. An experimental value for the framework volume, Vfr, was derived from Vacc,TG and ρHe to further check the validity of the data. The theoretical accessible volume Vacc,th, theoretical skeletal density ρsk,th and theoretical framework volume Vfr,th are added in Table 3 as references. As mentioned above, the accessible volume as listed in the Database of Zeolite Structures39 systematically underestimates both the real accessible volume and the skeletal density to a large extent. Indeed, Vacc,TG and Vacc,He are significantly larger than Vacc,th, and ρHe is significantly larger than ρsk,th for zeolites H-ZSM5, H-B and H-Y. The values of Vacc,TG and Vacc,He correspond reasonably for these zeolites, indicating no gas pressure build-up due to confinement in narrow pores (for interactions of gas molecules with the pore walls becoming increasingly dominant over collisions between neighboring gas
Table 3. Water/methanol uptake selectivity αwater/methanol, accessible pore volume Vacc,TG based on vapor TG, accessible pore volume Vacc,He based on He PM, theoretical accessible pore volume Vacc,th, He density ρHe, theoretical skeletal density ρsk,th, sample framework volume Vfr based on He PM and vapor TG and theoretical framework volume Vfr,th of the zeolites. The error in vapor TG data is within 1 digit (two times the standard deviation). The error in He PM data is within 1 digit or 5%.
sample Ca-A2 H-ZSM530 H-ZSM5300 H-B360 H-Y5.1 H-Y80 αwater/methanol [-] 1.2 0.6 0.1 0.7 0.9 0.5 Vacc,TG [cm3 g-1] 0.15 0.15 0.16 0.21 0.29 0.29 Vacc,He [cm3 g-1] 0.31 0.12 0.13 0.21 0.35 0.32 Vacc,th [cm3 g-1] 0.16 0.05 0.05 0.13 0.22 0.21 ρHe [g cm-3] 2.2 2.3 2.4 2.2 2.3 2.3 ρsk,th [g cm-3] 1.7 2.0 2.0 1.9 1.8 1.8 Vfr [cm3 g-1] 0.61 0.59 0.58 0.66 0.72 0.73 Vfr,th [cm3 g-1] 0.76 0.55 0.55 0.66 0.79 0.76

Results and discussion | 83
4
4
4
4
4
molecules, the effective pressure is ultimately expected to decrease and cause a net pressure build-up). For zeolite Ca-A2, Vacc,TG is not larger than Vacc,th and is only half of Vacc,He. This suggests that Vacc,TG is an underestimation, possibly due to poor packing of vapor molecules in the narrowest parts of the pore structure. As for the framework volumes, for zeolite Ca-A2 the expected underestimation in Vacc,TG also yields an underestimation in Vfr. For the other zeolites Vfr and Vfr,th correspond reasonably. This further confirms the reliability of the analytical method. The He cell pressure stabilized well within the measurement time for all zeolites, indicating no size hinder via slow diffusion. Recalculation of the PM results with calibration shifts as observed throughout the measurements and with duplicate measurements yielded only minor deviations (within 1 digit or 5%).
The results above demonstrate that vapor TG can be used to directly determine quantitative accessible micropore volumes at room temperature based on pore filling from approximately zero to 100% of the pore volume. This makes it a robust method that eliminates the need for theoretical models on molecular behavior to extrapolate from partial pore filling, though errors from deviations in packing density cannot be fully excluded. Comparing the uptake of polar and non-polar vapors indicates differences in micropore surface chemistries. The accessibility to molecules with specific molecular sizes gives information on pore entrance sizes. With He PM the accessible pore volume can only be calculated if the framework volume (skeleton + pores) of the sample is known.
Ar and N2 PM
PM measurements with Ar and N2 as probe gases were done to measure the uptake of molecules that are more polarizable than He and extract information on the surface-to-volume ratio and surface area of the samples. The sample framework volume Vfr (volume of skeleton + pores) present in the measurement cell can be derived from the sample mass, accessible volume Vacc,TG and He density ρHe. The ideal gas law, calibrated cell volume Vc, amount of added gas ΔN and resulting cell pressure difference Δpc can then be used to calculate the amount of added gas located outside the sample framework ΔNc and the amount of added gas located inside the sample framework ΔNfr according to
Δ𝑁𝑁𝑐𝑐 =Δ𝑝𝑝𝑐𝑐 ∙ �𝑉𝑉𝑐𝑐 − 𝑉𝑉𝑓𝑓𝑓𝑓�
𝑅𝑅𝑅𝑅 (1)
Δ𝑁𝑁𝑓𝑓𝑓𝑓 = Δ𝑁𝑁 − Δ𝑁𝑁𝑐𝑐 (2)
with ΔNx in mole, Δpc in Pa, Vx in m3, the ideal gas constant R (8.314 J K-1 mol-1) and the temperature T in K. Now ΔNfr can be expressed as a change in concentration or

84 | Analyzing microporosity with vapor thermogravimetry and gas pycnometry
4
4
4
4
4
‘apparent pressure’ of probe molecules inside the accessible pore volume, Δpacc, based on Vacc,TG and the ideal gas law. The ratio of Δpacc over the pressure change outside the sample, Δpc, yields a dimensionless gas accumulation factor Δpacc/Δpc. Note that Δpacc is only a measure for the number of probe molecules per unit pore volume and does not consider their physical state as free or adsorbed gas. The gas uptake inside the sample is assumed not to be limited by gas depletion outside the sample.
Results are listed in Table 4. Though cell pressure stabilization took longer for Ar and N2 than for He, equilibrium was approached within the measurement time for all zeolites. The uptake of Ar and N2 was much larger than the uptake of He for all zeolites, which indicates adsorption of Ar and N2 on the pore surfaces. The highest absolute gas concentration inside the micropores was the equivalent of about 34 bar (N2 in H- ZSM5300 based on Vacc,TG, pc ≈ 1.3 bar), i.e. the pressure would be 34 bar if all molecules existed as free gas rather than being adsorbed. This corresponds with about 2% of the pore volume being occupied by N2 molecules. Converting this to the number of pore cavities per N2 yields more than 8 cavities per molecule (VN2 ≈ 25 Å3, Vcavity ≈ 135 Å3). For such low gas concentrations no significant multilayer adsorption or curvature-related packing problems due to crowded monolayers are expected. The gas accumulation factor of He, Ar and N2 is plotted against the theoretical surface-to-volume ratio Aacc,th/Vacc,th in Figure 3. Though both Aacc,th and Vacc,th significantly underestimate the reality, their errors are related and are assumed to compensate each other. For monolayer-like adsorption with low coverage a linear relation is expected between the gas accumulation factor and the surface-to-volume ratio. This is indeed observed for zeolites H-ZSM5, H-B and H-Y, suggesting reasonable accuracy. The uptake of Ar and N2 per unit surface-to-volume in zeolite Ca-A2 was lower in comparison with the other zeolites, which can be explained by the measurement conditions. Ar and N2 uptake in zeolite Ca-A2 reached approximately 80% of the end value in 1 min (in contrast to 97-100% for the other zeolites). This indicates that the venting time between measurements, which was set to approximately 1 min, did not allow fully equilibrated desorption. The subsequently measured uptake values thus underestimated the adsorption capacity. Increasing the venting time to 10 min increased Δpacc/Δpc to 5.2 for N2 in zeolite Ca-A2, though now the uptake did not
Table 4. Gas accumulation factor Δpacc/Δpc, accessible surface area Aacc and selectivity α for He, Ar and N2 uptake in the zeolites.
zeolite Ca-A2 H-ZSM530 H-ZSM5300 H-B360 H-Y5.1 H-Y80 Δpacc/Δpc [-] He 1.0 1.0 1.0 1.0 1.0 1.0
Ar 3.5 23.8 26.0 13.8 7.3 7.3 N2 3.5 25.1 26.4 14.3 8.5 7.5
Aacc [m2 g-1] Ar 539 2291 2507 1928 1612 1652 αN2/Ar [-] 1.0 1.1 1.0 1.0 1.2 1.0

Results and discussion | 85
4
4
4
4
4
equilibrate anymore within 10 min measurement time, still yielding an underestimation. The slow adsorption and desorption kinetics in zeolite Ca-A2 may be due to its very small pore entrance size. Another important factor is particle size (diffusion path lengths); scanning electron microscopy imaging of the powders (data not shown) indicated that zeolite Ca-A2 was the only sample containing a significant number of particles >3 µm.
The trend line in Figure 3 can be used as semi-quantitative calibration for unknown samples, provided that similar measurement conditions are applied and the micropores are not too small. From the trend line and Vacc,TG the accessible surface area Aacc was derived, as expected indicating significantly larger surface areas for zeolites H-ZSM5, H-B and H-Y than the underestimated theoretical values in Table 2. Aacc being lower than Aacc,th for zeolite Ca-A2 can be explained with the previously discussed underestimations in both Vacc,TG and the uptake of Ar. For zeolites H-ZSM5 and H-Y the N2/Ar selectivity αN2/Ar increased with increasing hydrophilicity. This corresponds with N2 having a quadrupolar moment and a higher electric polarizability than Ar,40 which makes N2 more sensitive to polar adsorption sites.
PM measurements with competitive gas filling were done to obtain more information on the micropore cavity dimensions. When filling a micropore structure with a single type of probe molecules, equilibrium can be reached without probe molecules needing to pass each other inside the pore structure and the filling rate is mostly determined at the pore entrances (bottlenecks). When a micropore structure is filled with gas A and then filled further with another gas B, molecules of A and B have to pass each other inside the pores in order to mix and reach equilibrium. Since passing of molecules will occur mostly at the widest positions in the pores, the equilibration rate of gas B depends mostly on the cavity size in between the bottlenecks and much less on the size of the pore entrances. Comparing the equilibration behavior of gas B added to a background of gas A with the equilibration behavior of gas B added to a
Figure 3. Gas accumulation of He, Ar and N2 in the zeolite pore structures plotted against their theoretical surface-to-volume ratios. The trend line is based on the data of Ar excluding Ca-A.
0
10
20
30
5000 10000 15000
Δpac
c/Δp
c[-]
Aacc,th/Vacc,th [m2 cm-3]
HeArN2
H-YCa-A
H-B H-ZSM5

86 | Analyzing microporosity with vapor thermogravimetry and gas pycnometry
4
4
4
4
4
background of gas B thus provides information specifically on the cavity size. When adding an amount ΔNB→A of gas B to a background of gas A (or B), at time t = 0 all added gas is in the cell outside the sample, yielding ΔNc,B→A(0) = ΔNB→A and ΔNfr,B→A(0) = 0. With progressing time gas B diffuses into the sample and ΔNc,B→A(t) and ΔNfr,B→A(t) can be calculated as a function of the changing cell pressure difference Δpc(t) with Equations 1 and 2. The equilibrium uptake of gas B inside the sample is ΔNfr,B→B(∞)/ΔNB→B for gas B being added to a background of gas B. Now the filling progress in time of gas B being added to a background of gas A (or B) can be calculated by
𝑓𝑓𝑓𝑓𝑓𝑓𝑓𝑓𝑓𝑓𝑓𝑓𝑓𝑓 𝑝𝑝𝑝𝑝𝑝𝑝𝑓𝑓𝑝𝑝𝑝𝑝𝑝𝑝𝑝𝑝 (𝑡𝑡) = 𝛥𝛥𝑁𝑁𝑓𝑓𝑓𝑓,B→A(𝑡𝑡)
𝛥𝛥𝑁𝑁𝑓𝑓𝑓𝑓,B→B(∞)𝛥𝛥𝑁𝑁B→B
∙ 𝛥𝛥𝑁𝑁B→A∙ 100% (3)
Monitoring mixing behavior is facilitated by choosing an adsorbing species as gas B to create a large flux into the sample. A non-adsorbing species is preferred as gas A to minimize temporary excess uptake of gas A in the first stage of increased cell pressure before gas B has reached the sample.
Figure 4a shows the filling progress in time after the addition of N2 to a background of either N2 or He for zeolites H-ZSM5, H-B and H-Y. For N2 being added to a background of N2 (solid curves) the cell pressure equilibrated equally rapid, indicating no effect of variations in the pore entrance size on the diffusion of N2 into these samples. Data of zeolite Ca-A2 are excluded because the cell pressure did not stabilize within the measurement time, providing no suitable reference point for further
Figure 4. a) Pore filling curves for N2 added to a background of N2 (solid curves) and for N2 added to a background of He (dotted curves) for zeolites H-ZSM5, H-B and H-Y. b) Time at 30% filling and filling at t = 600 s for N2 added to a background of He in zeolites H-ZSM5, H-B and H-Y, plotted against the micropore cavity sizes.
32
36
40
44
0
100
200
300
400
500
6 8 10 12
Filli
ng at
t =
600
s [%
]
t 30%
[s]
Cavity size [Å]
H-ZS
M5
H-B
H-Y
N2 added to He
0102030405060708090
100
0 200 400 600
Filli
ng p
rogr
ess [
%]
Time [s]
adding N2 to N2 backgroundadding N2 to He background
increasingcavity size
H-ZSM530H-ZSM5300H-B360H-Y5.1H-Y80
a) b)

Results and discussion | 87
4
4
4
4
4
calculations. For N2 being added to a background of He (dotted curves) the cell pressure equilibrated significantly slower, indicating that mixing of N2 and He inside the pore structures was hindered. The filling rates followed the order in micropore cavity size H-ZSM5 (dincluded = 6.36 Å) < H-B (dincluded = 6.68 Å) < H-Y (dincluded = 11.24 Å). Figure 4b shows the time it takes to reach 30% filling and the achieved filling at t = 600 s plotted against the micropore cavity sizes.
The results above demonstrate that PM with various gases can be used to probe surface-to-volume ratios, surface areas and micropore cavity sizes. The observed relations between the gas accumulation factor and the surface-to-volume ratio in Figure 3 and between the competitive filling rate and micropore cavity size in Figure 4b can be used as semi-quantitative calibrations for unknown samples. The data also shows some differentiation between pore chemistries. The demonstrated approach is expected to be valid for micropore structures with entrance sizes down to about 0.45 nm when using Ar and N2 as probe gases, though smaller probe molecules and longer equilibration times may enable analysis of even smaller pores. Larger probe molecules that only barely have access to the pores hinder the measurements due to very slow equilibration and the same holds for strongly adsorbing species. For these reasons SF6 was found unsuitable as PM probe gas for the series of zeolites studied here.
Conventional N2 and CO2 adsorption isotherms
Isothermal adsorption curves of N2 at -196 °C and CO2 at 0 °C were recorded to compare with the results obtained by vapor TG and gas PM. For N2 adsorption no complete isotherms were obtained due to very slow pressure equilibration. The N2 isotherms at relative pressure p/p0 < 5x10⁻⁵ and the CO2 isotherms are shown in Figure 5. As for qualitative information directly deductible from the adsorption isotherms, the more discrete adsorption at lower p/p0 in zeolites H-ZSM5 as compared to zeolites H-Y corresponds with smaller micropore sizes yielding increased adsorbent-adsorbate interactions.41 Furthermore, the increased uptake in zeolite H-Y5.1 as compared to H-Y80 in the first stage corresponds with increasing hydrophilicity facilitating adsorption. However, correlating such subtle isotherm features with one of several competing origins is tricky for unknown micropore structures and in this pore size range the information obtained with vapor TG and gas PM at room temperature appears more robust. BET surface areas ABET,CO2 as derived from the CO2 isotherms are listed in Table 5. The obtained surface areas are significantly smaller than the theoretical values (Table 2), which already underestimate the reality, and thus appear significantly less accurate than the values obtained by vapor TG and gas PM (Table 4).
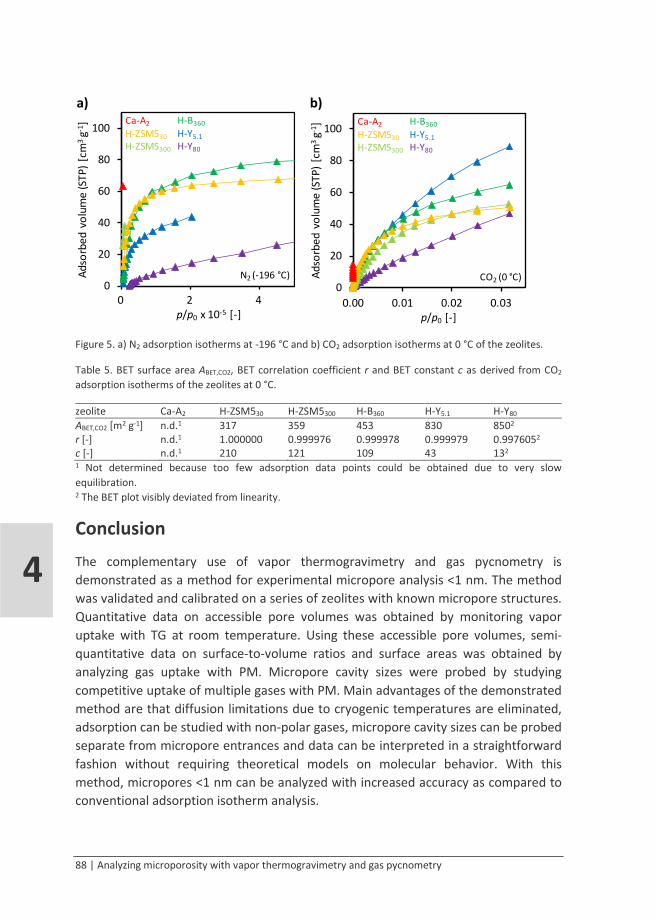
88 | Analyzing microporosity with vapor thermogravimetry and gas pycnometry
4
4
4
4
4
Figure 5. a) N2 adsorption isotherms at -196 °C and b) CO2 adsorption isotherms at 0 °C of the zeolites.
Table 5. BET surface area ABET,CO2, BET correlation coefficient r and BET constant c as derived from CO2 adsorption isotherms of the zeolites at 0 °C.
zeolite Ca-A2 H-ZSM530 H-ZSM5300 H-B360 H-Y5.1 H-Y80 ABET,CO2 [m2 g-1] n.d.1 317 359 453 830 8502 r [-] n.d.1 1.000000 0.999976 0.999978 0.999979 0.9976052 c [-] n.d.1 210 121 109 43 132 1 Not determined because too few adsorption data points could be obtained due to very slow equilibration. 2 The BET plot visibly deviated from linearity.
Conclusion The complementary use of vapor thermogravimetry and gas pycnometry is demonstrated as a method for experimental micropore analysis <1 nm. The method was validated and calibrated on a series of zeolites with known micropore structures. Quantitative data on accessible pore volumes was obtained by monitoring vapor uptake with TG at room temperature. Using these accessible pore volumes, semi-quantitative data on surface-to-volume ratios and surface areas was obtained by analyzing gas uptake with PM. Micropore cavity sizes were probed by studying competitive uptake of multiple gases with PM. Main advantages of the demonstrated method are that diffusion limitations due to cryogenic temperatures are eliminated, adsorption can be studied with non-polar gases, micropore cavity sizes can be probed separate from micropore entrances and data can be interpreted in a straightforward fashion without requiring theoretical models on molecular behavior. With this method, micropores <1 nm can be analyzed with increased accuracy as compared to conventional adsorption isotherm analysis.
0
20
40
60
80
100
0.0E+00 2.0E-05 4.0E-05
Adso
rbed
vol
ume
(STP
) [cm
3g-1
]
p/p0 x 10-5 [-]
N2 (-196 °C)
0 2 4
H-B360H-Y5.1H-Y80
Ca-A2H-ZSM530H-ZSM5300
a) b)
0
20
40
60
80
100
0.00 0.01 0.02 0.03Ad
sorb
ed v
olum
e (S
TP) [
cm3
g-1]
p/p0 [-]
CO2 (0 °C)
H-B360H-Y5.1H-Y80
Ca-A2H-ZSM530H-ZSM5300
Acknowledgements | 89
4
4
4
4
4
Acknowledgements Financial support from the Advanced Dutch Energy Materials (ADEM) program of the Dutch Ministry of Economic Affairs, Agriculture and Innovation is gratefully acknowledged. Thanks to Cindy Huiskes and the Inorganic Membranes group of the University of Twente for providing the Autosorb equipment.
References 1. U. Stange, M. Scherf-Clavel, H. Gieseler, J. Pharm. Sci. 2013, 102, 4087–4099. 2. H. Du, M. Kalyanaraman, M.A. Camblor, D.H. Olson, Microporous Mesoporous Mater. 2000, 40,
305–312. 3. S.H. Jhung, J.W. Yoon, J.S. Lee, J.S. Chang, Chem. Eur. J. 2007, 13, 6502–6507. 4. H.L. Castricum, G.G. Paradis, M.C. Mittelmeijer-Hazeleger, R. Kreiter, J.F. Vente, J.E. ten Elshof, Adv.
Funct. Mater. 2011, 21, 2319–2329. 5. S. Saha, B.K. Sharma, S. Kumar, G. Sahu, Y.P. Badhe, S.S. Tambe, B.D. Kulkarni, Fuel 2007, 86, 1594–
1600. 6. H. Huang, K. Wang, D.M. Bodily, V.J. Hucka, Energy & Fuels 1995, 9, 20–24. 7. D.L. Moreau, M. Rosenberg, J. Food Sci. 1998, 63, 819–823. 8. D.L. Moreau, M. Rosenberg, J. Food Sci. 1999, 64, 405–409. 9. D. Fairén-Jiménez, F. Carrasco-Marín, D. Djurado, F. Bley, F. Ehrburger-Dolle, C. Moreno-Castilla, J.
Phys. Chem. B 2006, 110, 8681–8688. 10. A.G. McDermott, P.M. Budd, N.B. McKeown, C.M. Colina, J. Runt, J. Mater. Chem. A 2014, 2,
11742–11752. 11. A. Gibaud, J.S. Xue, J.R. Dahn, Carbon 1996, 34, 499–503. 12. J.M. Calo, P.J. Hall, Carbon 2004, 42, 1299–1304. 13. J.M. Calo, P.J. Hall, M. Antxustegi, Colloids Surf. A Physicochem. Eng. Asp. 2001, 187–188, 219–232. 14. M.C. Duke, S.J. Pas, A.J. Hill, Y.S. Lin, J.C. Diniz Da Costa, Adv. Funct. Mater. 2008, 18, 3818–3826. 15. M.P. Petkov, M.H. Weber, K.G. Lynn, K.P. Rodbell, S.A. Cohen, Appl. Phys. Lett. 1999, 74, 2146–
2148. 16. T.H.Y. Tran, H. Schut, W.G. Haije, J. Schoonman, Thin Solid Films 2011, 520, 30–34. 17. J. Wang, G. Gong, M. Kanezashi, T. Yoshioka, K. Ito, T. Tsuru, J. Memb. Sci. 2013, 441, 120–128. 18. M. Lépinay, N. Djourelov, H. Marinov, L. Broussous, K. Courouble, C. Licitra, F. Bertin, V. Rouessac,
A. Ayral, J. Porous Mater. 2014, 21, 475–484. 19. M. Kanezashi, K. Yada, T. Yoshioka, T. Tsuru, J. Memb. Sci. 2010, 348, 310–318. 20. M. Kanezashi, W.N. Shazwani, T. Yoshioka, T. Tsuru, J. Memb. Sci. 2012, 415–416, 478–485. 21. T. Tsuru, T. Hino, T. Yoshioka, M. Asaeda, J. Memb. Sci. 2001, 186, 257–265. 22. X. Ren, M. Kanezashi, H. Nagasawa, T. Tsuru, RSC Adv. 2015, 5, 59837–59844. 23. X. Ren, M. Kanezashi, H. Nagasawa, T. Tsuru, J. Memb. Sci. 2015, 496, 156–164. 24. J. Parmentier, S. Schlienger, M. Dubois, E. Disa, F. Masin, T.A. Centeno, Carbon 2012, 50, 5135–
5147. 25. D. Meloni, R. Monaci, D. Perra, M.G. Cutrufello, E. Rombi, I. Ferino, J. Therm. Anal. Calorim. 2015,
121, 1139–1149. 26. A.S. Al-Dughaither, H. De Lasa, Ind. Eng. Chem. Res. 2014, 53, 15303–15316. 27. K.C. Kim, T.-U. Yoon, Y.-S. Bae, Microporous Mesoporous Mater. 2016, 224, 294–301. 28. D. Cazorla-Amorós, J. Alcañiz-Monge, M.A. De La Casa-Lillo, A. Linares-Solano, Langmuir 1998, 14,
4589–4596.

90 | Analyzing microporosity with vapor thermogravimetry and gas pycnometry
4
4
4
4
4
29. R. Rouquerol, J. Rouquerol, K.S.W. Sing, P. Llewellyn, G. Maurin, Adsorption by Powders and Porous Solids. Principles, Methodology and Applications, 2nd ed., Academic Press, Elsevier Ltd, Oxford, 2014.
30. M.R. Baklanov, K.P. Mogilnikov, V.G. Polovinkin, F.N. Dultsev, J. Vac. Sci. Technol. B 2000, 18, 1385–1391.
31. A. Bourgeois, A. Bondaz, L. Kitzinger, C. Defranoux, ECS Trans. 2008, 16, 221–229. 32. M. Lépinay, L. Broussous, C. Licitra, F. Bertin, V. Rouessac, A. Ayral, B. Coasne, Microporous
Mesoporous Mater. 2015, 217, 119–124. 33. R.C. Hedden, H.-J. Lee, C.L. Soles, B.J. Bauer, Langmuir 2004, 20, 6658–6667. 34. V. Rouessac, A. van der Lee, F. Bosc, J. Durand, A. Ayral, Microporous Mesoporous Mater. 2008,
111, 417–428. 35. J.R. Anderson, K. Foger, T. Mole, R.A. Rajadhyaksha, J. V. Sanders, J. Catal. 1979, 58, 114–130. 36. S. V. Awate, P.N. Joshi, V.P. Shiralkar, A.N. Kotasthane, J. Incl. Phenom. Mol. Recognit. Chem. 1992,
13, 207–218. 37. J.D. Moyer, T.R. Gaffney, J.N. Armor, C.G. Coe, Microporous Mater. 1994, 2, 229–236. 38. A. Corma, C. Corell, J. Pérez-Pariente, J.M. Guil, R. Guil-López, S. Nicolopoulos, J. Gonzalez-Calbet,
M. Vallet-Regi, Zeolites 1996, 16, 7–14. 39. International Zeolite Association Structure Commision, Database of Zeolite Structures,
http://www.iza-structure.org/databases/, accessed Dec 2016. 40. L.W. Beegle, I. Kanik, L. Matz, H.H. Hill, Int. J. Mass Spectrom. 2002, 216, 257–268. 41. R. Rouquerol, J. Rouquerol, K.S.W. Sing, P. Llewellyn, G. Maurin, in: Adsorption by Powders and
Porous Solids. Principles, Methodology and Applications, 2nd ed., Academic Press, Elsevier Ltd, Oxford, 2014, pp. 303–320.

Abstract | 91
5
5
5
5
5
5
Organic groups influencing
microporosity in organosilicas
This chapter is submitted for publication as:
A.P. Dral, J.E. ten Elshof, Organic groups influencing microporosity in organosilicas.

92 | Organic groups influencing microporosity in organosilicas
5
5
5
5
5

Abstract | 93
5
5
5
5
5
Abstract The micropore structure of a series of organosilica materials with various organic groups in bridging (methylene, ethylene, hexylene, octylene, p-phenylene) and terminal (methyl, n-propyl) positions was analyzed and compared to that of inorganic amorphous silica. Vapor thermogravimetry with water, methanol, 1-propanol and cyclohexane vapors was used to measure accessible pore volumes, pore entrance sizes and surface chemistries. Gas pycnometry with He, Ar and N2 was used to measure skeletal densities, semi-quantitative surface-to-volume ratios and surface areas, pore entrance sizes and semi-quantitative pore cavity sizes. Conventional adsorption isotherms were measured for N2 at -196 °C to check for mesoporosity and for CO2 at 0 °C to obtain Brunauer-Emmett-Teller surface areas for comparison. The known classification of 1) short or rigid organic bridges that open up the pore structure, 2) longer and more flexible bridges that cause pore filling and 3) terminal organic groups that reduce pore formation is further specified. The incorporation of any organic group in the silica network increased the dispersity in micropore entrance sizes as compared to inorganic silica in the probed size range. A critical discussion is given of the commonly accepted ‘spacing concept’ of organic bridges.
Introduction The incorporation of organic groups in amorphous silica networks, i.e. replacement of Si-O-Si linkages with Si-R or Si-R-Si linkages, influences various functional properties such as mechanical flexibility and fracture resistance,1,2 hydrophobicity3–5 and hydrothermal stability.5–8 For applications that make use of the microporosity of organosilica materials, such as separation membranes, varying the nature and location of the organic groups allows tuning of micropore sizes and surface chemistries. Organic groups in bridging position (Si-R-Si) are part of the network backbone and act as spacers when they are short or rigid such as methylene (-CH2-), ethylene (-C2H4-), ethenylene (-C2H2-) and phenylene (-C6H4-) groups.9–15 Though methylene-bridged silica networks have only single-atom spacers between neighboring Si atoms, similar to inorganic silica, the network opens up because Si-C bonds (1.97 Å) are longer than Si-O bonds (1.57-1.59 Å).16 Si-C-Si bonds are also more rigid because they do not have the impressive freedom of over 40° variation in bond angle that Si-O-Si bonds have.17 Long and flexible bridges such as hexylene (-C6H12-) and octylene (-C8H16-) groups tend to collapse and fill up the empty space.12,13,18–20 The bulkiness of these bridges is still sufficiently low to allow high network condensation degrees as reported in Chapter 1,5 but they transform the network towards a flexible polymer-like structure through which molecules can pass based on affinity rather than through pre-existing pore channels.12,20 Membrane permeation data have shown that the effective pore entrance size generally increases for bridges

94 | Organic groups influencing microporosity in organosilicas
5
5
5
5
5
in the order O (inorganic silica) < CH2 < C2H4 < C3H6 < C6H12 < C8H16 and C2H4 < p-C6H4 < C8H16.9,12,20,21 If organic groups are placed in terminal position (Si-R), they do not act as spacers between adjacent Si atoms and easily fill up the pores created by the silica backbone. However, terminal methyl (-CH3) and phenyl (-C6H5) groups have also been reported to increase the effective pore opening size in membrane applications as compared to inorganic silica22 and methyl groups can increase the total pore volume.3 Organic groups in terminal position increase the network hydrophobicity by sticking out at the pore surface.3,4,22,23
Although the incorporation of short or rigid organic bridges between Si atoms clearly increases the size of part of the micropore entrances and/or cavities, this ‘spacing concept’ requires a closer look. Firstly, the effect of organic bridges acting as spacers between Si atoms tends to be generalized to the expansion of all micropores. However, it should be kept in mind that about 75% of the bridging units still remains the same (Si-O-Si) as in inorganic silica networks when using trialkoxysilyl precursors. The formation of small rings with only Si-O-Si linkages is still possible. Molecular dynamics simulation studies on inorganic and ethylene-bridged silica networks predict a reduction of the number of smallest pores but not their disappearance,11,24 though the random distribution of ethylene bridges in these models differs from reality. The generally observed superiority of inorganic silica membranes in terms of reaching the highest permeation selectivities for very small molecules such as H2O and H2 is thus not self-evident.
Secondly, the pore size expansion in organically bridged networks that is achieved in reality, does not only result from the bridges acting as spacers between Si atoms but also results from altered kinetics during network compaction in sol-gel processing. The incorporation of organic bridges changes the size, shape, flexibility and connectivity of the monomer unit. These properties affect the monomer mobility during drying and consolidation of the material after synthesis. For example, methylene- and ethylene-bridged silica monomers are about twice as large as inorganic silica monomers, have six connection points to the surrounding network instead of four and have a linear shape instead of spherical. This yields a lower monomer mobility during compaction, which in turn increases the number of pores that are kinetically trapped at larger sizes and also different shapes than preferred thermodynamically. Some experimental results on these effects can be found in the consolidation study of Chapter 2.25 Elaborate data sets of entire micropore structures in organosilica materials to further evaluate these issues are scarce. Commonly used membrane permeation measurements mainly probe the bottlenecks along permeation pathways and cryogenic adsorption (N2, Ar) excludes the smallest micropores due to diffusion limitations.

Experimental | 95
5
5
5
5
5
Figure 1. Chemical structures and abbreviations of the used (organo)silica precursors.
In the present study, in-depth comparative data on the microporous networks of a range of organosilica materials is obtained via the method of vapor thermogravimetry (TG) and gas pycnometry (PM) reported in Chapter 4.26 This method uses a range of solvents and non-polar gases to probe micropore volumes, sizes and surfaces at room temperature. (Organo)silica materials were prepared from the precursors listed in Figure 1 by sol-gel processing. The presence of mesoporosity was analyzed with conventional N2 adsorption isotherms at -196 °C. Vapor TG was used to measure accessible pore volumes, pore entrance sizes and surface chemistries. Gas PM was used to measure skeletal densities, semi-quantitative surface-to-volume ratios and surface areas, pore entrance sizes and semi-quantitative pore cavity sizes. Water, methanol, 1-propanol and cyclohexane were used as vapor probe molecules for TG. He, Ar and N2 were used as gas probe molecules for PM. The above discussed classification of 1) short or rigid organic bridges that open up the pore structure, 2) longer and more flexible bridges that cause pore filling and 3) terminal organic groups that reduce pore formation is used as framework for the discussion and is further specified. A relation between the incorporation of organic groups and the dispersity in pore entrance sizes is presented.
Experimental Chemicals. Bis(triethoxysilyl)methane (97% purity), 1,2-bis(triethoxysilyl)ethane (97% purity), 1,6-bis(trimethoxysilyl)hexane (97% purity), 1,8-bis(triethoxysilyl)octane (97% purity), 1,4-bis(triethoxysilyl)benzene (95% purity), 1,2-bis(methyldiethoxysilyl)-

96 | Organic groups influencing microporosity in organosilicas
5
5
5
5
5
ethane (purity unknown), methyltrimethoxysilane (97% purity), n-propyltrimethoxy-silane (98% purity) and tetraethoxysilane (99% purity) were obtained from ABCR. Nitric acid was obtained from Sigma Aldrich (70 wt% aqueous solution) and Acros (65 wt% aqueous solution). Anhydrous ethanol (purity 99.8%, <0.01% H2O) was obtained from VWR and SeccoSolv. Anhydrous methanol (purity 99.8%, <0.005% H₂O) was obtained from VWR. Anhydrous 1-propanol (purity 99.9%) and cyclohexane (purity >99%) were obtained from Alfa Aesar.
Sample preparation. (Organo)silica materials were synthesized as reported in Chapter 1.5 The HNO3 : H2O : alkoxy ratio was 0.064 : 1.1 : 1.0. The resulting materials were ground to powder by ball milling and all samples were stored under ambient conditions.
Thermogravimetry. Thermogravimetric data was recorded as reported in Chapter 4.26 In short, the sample was dried at 200 °C in synthetic air (N2:O2 80:20) for 4 h, stabilized at 30 °C in synthetic air for 1 h, filled with vapor at 30 °C in humidified N2 for 18 h, flushed at 30 °C in synthetic air for 1 h and dried at 200 °C in synthetic air for 4 h. The supplied gases were dried with SGE packed column moisture traps and the N2 was subsequently humidified by bubbling through a solvent at room temperature.
Pycnometry. Pycnometry measurements were done as reported in Chapter 4.26 In short, the sample was loaded in the sample cell and dried in an oven at 150 °C under N2 flow for 3 h. Immediately afterwards, the sample was weighed and loaded in the pycnometer. The apparent sample volume was analyzed with He, He+He, He+N2, Ar, N2 and N2+N2 (measured in this order).
Adsorption isotherms. Adsorption isotherms were collected with a Quantachrome Instruments Autosorb-1 and the gases were led through a moisture trap before entering the set-up. The sample was outgassed at 300 °C for 3 h. Adsorption isotherms were collected for CO2 at 0 °C and for N2 at -196 °C. Brunauer-Emmett-Teller (BET) curves derived from CO2 adsorption were based on at least 4 data points.
Results and discussion
Mesoporosity
Isothermal adsorption and desorption curves of N2 at -196 °C were recorded for the (organo)silica materials to determine whether the networks contained mesopores. Results are shown in Figure 2. The curves for BTESM-, BTESE-, BTESB-, BTMSH- and MTMS-derived networks correspond to microporous type I isotherms of the IUPAC classification and indicate no significant mesoporosity. The observed hysteresis over the entire pressure range may be related to slow penetration of N2 in very narrow cavities or packing transitions. TEOS- and BTESO-derived materials yielded a

Results and discussion | 97
5
5
5
5
5
Figure 2. N2 adsorption isotherms at -196 °C for TEOS-, BTESM-, BTESE-, BTMSH-, BTESO-, BTESB-, MTMS- and PTMS-derived materials.
combination of type I and type IV isotherms, indicating that these pore structures contained micropores and mesopores. Hardly any porosity was measured for PTMS-derived networks. BMDESE-derived material could not be outgassed sufficiently to obtain adsorption data.
Pore volume, entrance size and surface chemistry
Vapor TG measurements were done to determine the uptake of water, methanol, 1-propanol and cyclohexane in the (organo)silica networks. The mass uptake was divided by the bulk liquid density to estimate the uptake in terms of volume, though the solvents do not necessarily maintain their bulk densities inside the micropores due to the small micropore sizes and significant wall-solvent interactions. The volume uptake of methanol was taken as the accessible pore volume Vacc. The ratio between water uptake and methanol uptake, αwater/methanol, was taken as a measure for the pore hydrophobicity. Gas PM measurements were done with He to obtain the He density ρHe and calculate the porosity Φ. Results are shown in Figure 3 and Table 1. Interparticle adsorption of any solvent was not observed in the analysis of a series of zeolites in Chapter 426 and was thus not expected for the (organo)silicas either. Recalculation of the PM results with calibration shifts as observed throughout the measurements and with duplicate measurements yielded only minor deviations (within 1 digit or 5%).
The obtained pore volumes roughly correspond with the classification of materials based on spacer type as discussed in the introduction. The short and rigid spacers in BTESM-, BTESE- and BTESB-derived materials increased the pore volume per Si atom
E-05 0.061246 0.572483 0.232277 3.48E-05 0.0071E-05 0.066355 0.547376 0.231086 4.53E-05 0.0074964 0.161118 0.519257 0.230684 5.84E-05 0.00869928 0.175882 0.499657 0.229862 7.47E-05 0.0094
156 0.186057 0.472432 0.228631 9.33E-05 0.01020711 0.191567 0.450594 0.2276 0.00012 0.01104526 0.195313 0.423365 0.226106 0.000153 0.01199248 0.201573 0.394674 0.225431 0.000194 0.01244145 0.204081 0.374931 0.224503 0.000247 0.0134
731 0.205788 0.350845 0.223291 0.000312 0.01444941 0.206639 0.323124 0.221716 0.000395 0.01540537 0.210839 0.298181 0.220118 0.000504 0.01646441 0.212206 0.271143 0.219069 0.00064 0.01749396 0.21323 0.250706 0.217884 0.000806 0.0184
748 0.213959 0.223676 0.215984 0.001006 0.0202118 0.214346 0.199079 0.213993 0.001287 0.0211
6155 0.217752 0.174643 0.211697 0.001621 0.02219632 0.218664 0.149829 0.209112 0.002011 0.0234962 0.219475 0.124904 0.206437 0.002553 0.02430382 0.220172 0.09923 0.202231 0.003172 0.0257165 0.220167 0.07557 0.197182 0.004024 0.0266
0
0.1
0.2
0.3
0.0 0.2 0.4 0.6 0.8 1.0
Adso
rbed
vol
ume (
liqui
d N
2) [c
m3
g-1]
p/p0 [-]
N2 (-196 °C)
BTESM
BTESE
TEOS
BTESB
BTMSH
BTESOPTMS
adsorptiondesorption
MTMS

98 | Organic groups influencing microporosity in organosilicas
5
5
5
5
5
Figure 3. Vapor uptake in the (organo)silicas as measured with TG during exposure to a flow of N2 with a vapor. The uptake was averaged between 6 and 18 h filling time and the error bars indicate two times the standard deviation.
Table 1. Accessible pore volume Vacc, He density ρHe, porosity Φ and water/methanol uptake ratio αwater/methanol of the (organo)silicas as derived from vapor TG and He PM.
(organo)silica TEOS BTESM BTESE BTMSH BTESO BTESB BMDESE MTMS PTMS Vacc [cm3 g-1] 0.13 0.21 0.19 0.09 0.01 (0.04)b 0.14 0.01 0.02 0.04 Vacc [Å3 Si-1]a 13 20 21 14 3 (7)b 21 1 3 7 ρHe [g cm-3] 2.0 1.8 1.6 1.3 1.2 1.5 1.2 1.3 1.1 ρHe [Å3 Si-1]a 49 55 71 119 151 97 106 85 148 Φ [%] 21 27 23 11 2 (4)b 18 1 3 4 αwater/methanol [-] 0.97 0.94 0.60 0.30 0.73 (0.27)b 0.72 0.16 0.25 0.62 a Volume per Si atom, calculated assuming 100% condensation. b Value in parentheses is based on the uptake of 1-propanol instead of methanol.
as compared to TEOS-derived material. However, the more rigid and longer phenylene bridges in BTESB-derived material as compared to ethylene bridges in BTESE-derived material did not cause an increase in empty volume; the total porosity was smaller in BTESB-derived material and the accessible volumes per Si atom were similar. This suggests that some phenylene rings aligned due to π-π stacking, counteracting their spacing effect. In BTMSH- and BTESO-derived material the bridges are too long and flexible to increase the pore volume as compared to inorganic silica and indeed yielded a lower porosity that decreased with increasing bridge length. The terminal organic groups in MTMS- and PTMS-derived material do not expand the network backbone and can increase the packing density as compared to inorganic silica, corresponding with the observed smaller pore volumes. However, the significantly lower He densities of MTMS- and PTMS- as compared to BTESE- and BTMSH-derived networks indicates that the first ones contained larger pore fractions that are inaccessible to He. This has also been reported for methylated silica elsewhere.3 The He volumes per Si atom are plotted against the number of C atoms for the networks with alkylene bridges or terminal alkyl groups in Figure 4. The linear increase of He volume with increasing alkylene bridge length indicates that the more densely packed BTMSH- and BTESO-derived networks did not contain larger volumes of He-excluding pores than the open BTESM- and BTESE-derived networks. As for
0.00
0.10
0.20
TEOS BTESM BTESE BTMSH BTESO BTESB BMDESE MTMS PTMS
Vapo
r upt
ake
[cm
3g-1
] watermethanol1-propanolcyclohexane

Results and discussion | 99
5
5
5
5
5
Figure 4. He volume plotted against the number of C atoms for organosilicas with bridging alkylene or terminal alkyl groups as measured with He PM.
BMDESE-derived material, the addition of terminal methyl groups as compared to BTESE-derived material filled or blocked practically all ethylene-bridge-induced porosity. The accessible pore volumes obtained by vapor TG at room temperature varied from those obtained by N2 adsorption at -196 °C (Figure 2).
Information on the pore entrance sizes can be obtained by comparing the uptake of methanol, 1-propanol and cyclohexane in Figure 3. These molecules are at least partially hydrophobic and their uptake is therefore not expected to depend on pore chemistry; hydrophobic molecules can enter hydrophilic and hydrophobic channels with the same ease due to the lack of polar interaction. For TEOS-derived material the uptake of cyclohexane was approximately the same as the uptake of methanol and 1-propanol. This indicates that all probed micropores had entrance sizes larger than the minimum size of cyclohexane. Cyclohexane has a kinetic diameter Dkin of 0.60 nm27 but can pass pore entrances down to at least 0.42 nm as reported in Chapter 4.26 Interestingly, for BTESM- and BTESE-derived networks the uptake of cyclohexane was significantly smaller than the uptake of methanol and 1-propanol; the incorporation of short organic spacers yielded smaller entrance sizes for part of the pores in the probed size range. The average pore entrance size cannot be deducted from these measurements as they provide only cut-off values, and it is possible that pore entrance expansion occurred on a larger scale than shrinkage. Also, the exclusion of cyclohexane in the materials with short or rigid bridges decreased with increasing spacer length in the order BTESM > BTESE > BTESB. Nevertheless, in the probed size range the incorporation of short organic bridges increased the dispersity in pore entrance sizes as compared to TEOS-derived material. This can be explained with the lower symmetry and mobility of methylene- and ethylene-bridged monomers. Their linear shape is expected to increase the intrinsic variation in micropore sizes and shapes as compared to the tetrahedral symmetry of TEOS-derived monomers. The lower mobility of BTESM- and BTESE-derived monomers during drying and consolidation, as discussed in the introduction,
21
#DIV/0!22
#DIV/0!
40
60
80
100
120
140
160
0 1 2 3 4
He v
olum
e pe
r Si [
Å3 Si
-1]
C per Si [-]
bridging alkyleneterminal alkyl

100 | Organic groups influencing microporosity in organosilicas
5
5
5
5
5
is expected to increase pore deformation in these stages of material processing. As for the networks with long and flexible organic bridges or terminal organic groups, only BTMSH- and PTMS-derived networks showed significant exclusion of cyclohexane as compared to the alcohol uptake. The small accessible pore volumes in BTESO- and MTMS-derived networks were equally accessible to cyclohexane and 1-propanol.
Information on pore hydrophilicity can be obtained by comparing the uptake of water with that of the organic vapors. Water is not expected to cover non-polar surface areas (fill hydrophobic pores) because this reduces hydrogen bonding. However, water molecules are significantly smaller than methanol and can access all pores probed by methanol but also smaller ones. From this perspective it is surprising that the uptake of water did not exceed that of methanol for any of the networks, especially the one derived from TEOS. A possible explanation is that there were too few very small pores to cause a significant contribution to the total pore volume; the volume contribution of cylindrical pores increases cubically with their radius. An alternative explanation is that fully condensed, relatively hydrophobic surface areas in the pores of TEOS-derived material (and others) suppressed filling with water. Filling of very small pores would then compensate the non-filled parts of larger (hydrophobic) pores. In general, if water entered significant volumes of very small pores inaccessible to methanol, this would cause an underestimation of the hydrophobic character of the (organo)silica networks. Water/methanol uptake ratios αwater/methanol are listed in Table 1 to facilitate comparison.
The uptake of water increasingly stayed behind compared to the uptake of organic vapors in the order TEOS < BTESM < BTESE < BTMSH, corresponding with increasing hydrophobicity of the pore surfaces for longer alkylene bridge lengths. BTESO-derived material showed a methanol uptake equal to that of water and smaller than the uptake of 1-propanol and cyclohexane. This suggests that the uptake of water as well as methanol is suppressed by the hydrophobicity of the network. Swelling may have occurred for 1-propanol, but is not expected for cyclohexane due to its high vapor pressure. Values based on the uptake of 1-propanol in BTESO-derived material are therefore added in parentheses in Table 1. The lower relative uptake of water in MTMS-derived material as compared to BTESE-derived material, with the same C:Si ratio of 1, indicated increasing surface hydrophobicity when switching from bridging to equivalent terminal groups. BTMSH-derived material had a similarly low water uptake as PTMS-derived material with the same C:Si ratio of 3. This indicates that for such long organic segments their overall exposure does not depend on their configuration. The lower water uptake in MTMS-derived material with smaller organic groups as compared to PTMS-derived material can be explained by the lower hydroxyl concentration of the MTMS-derived material as reported in Chapter 1.5

Results and discussion | 101
5
5
5
5
5
All in all, the incorporation of alkylene bridges of up to six CH2 units in silica networks increased the dispersity in pore entrance sizes in the probed size range. The porosity only exceeded that of inorganic silica for the incorporation of methylene and ethylene bridges. The incorporation of terminal alkyl groups yielded higher levels of porosity inaccessible to He as compared to alkylene-bridged networks with equivalent C:Si ratios. For low carbon concentrations the pore surface hydrophobicity increased with increasing alkylene bridge length or by switching from bridging to terminal groups.
Surface area and pore entrance size
PM measurements with Ar and N2 as probe gases were done to measure the uptake of molecules that are more polarizable than He and extract the surface-to-volume ratio and surface area of the samples. The distribution of added gas between outside and inside the sample framework (skeleton + pores) was calculated as described in Chapter 4.26 The amount of added gas inside the sample framework was converted to a change in concentration or ‘apparent pressure’ of probe molecules inside the accessible pore volume, Δpacc. Δpacc was then divided by the pressure change outside the sample, Δpc, to obtain a gas accumulation factor Δpacc/Δpc. Note that Δpacc is only a measure for the number of probe molecules per unit pore volume and does not consider their physical state as free or adsorbed gas. The gas uptake inside the sample is assumed not to be limited by gas depletion outside the sample. The ratio of N2 accumulation over Ar accumulation, αN2/Ar, was calculated to assess the accessibility of pores to both gases. The relation between Δpacc/Δpc and the surface-to-volume ratio of zeolites as reported in Chapter 426 was used to determine the semi-quantitative surface-to-volume ratios Aacc/Vacc of the (organo)silica materials. These surface-to-volume ratios provide information on the average pore size when assuming similar pore shapes. Multiplying Aacc/Vacc with the accessible volume Vacc as determined by vapor TG yields semi-quantitative surface areas Aacc. Results are listed in Table 2. Brunauer-Emmett-Teller (BET) surface areas ABET as derived from conventional CO2 adsorption isotherms at 0 °C are added for comparison. Though PM cell pressure stabilization took longer for Ar and N2 than for He, equilibrium was approached within the measurement time for all (organo)silicas.
The uptake of Ar and N2 is larger than the uptake of He for all samples except BMDESE-derived material and this indicates adsorption of Ar and N2 on the pore surfaces. The highest absolute gas concentration inside the micropores was the equivalent of about 48 bar (Ar in BTESO-derived material, pc ≈ 1.3 bar) and this corresponds with about 3% of the pore volume being occupied by N2 molecules. For such low gas concentrations no significant multilayer adsorption or curvature-related packing problems due to crowded monolayers are expected. As for the N2/Ar accumulation ratio, αN2/Ar > 1 indicates hydrophilic pore surfaces because N2 is

102 | Organic groups influencing microporosity in organosilicas
5
5
5
5
5
Table 2. Gas accumulation factor Δpacc/Δpc, N2/Ar accumulation ratio αN2/Ar, semi-quantitative surface-to-volume ratio Aacc/Vacc and semi-quantitative surface area Aacc of the (organo)silicas as derived from He, Ar and N2 PM. BET surface area ABET of the (organo)silicas as derived from CO2 adsorption isotherms at 0 °C.
(organo)silica TEOS BTESM BTESE BTMSH BTESO BTESB BMDESE MTMS PTMS Δpacc/Δpc [-] He 1.0 1.0 1.0 1.0 1.0 (1.0)a 1.0 1.0 1.0 1.0 Δpacc/Δpc [-] Ar 8.6 7.7 7.9 7.4 37 (14)a 11 3.0 21 3.5 Δpacc/Δpc [-] N2 8.6 7.3 7.2 5.7 26 (10)a 9.9 0.0 12 1.1 αN2/Ar [-] 1.00 0.94 0.91 0.78 0.70 0.92 n.a. 0.61 0.30 Aacc/Vacc [m2 cm-3] 6369 5864 5953 5667 22067 (9515)a 7542 3257 12964 3515 Aacc [m2 g-1] 832 1205 1148 514 310 (361)a 1076 29 323 154 ABET [m2 g-1] 300 495 415 166 139 371 n.d. 169 83 a Value in parentheses is based on the accessible pore volume from the uptake of 1-propanol instead of methanol.
more sensitive to polar adsorption sites than Ar, see Chapter 4.26 For all organosilica networks αN2/Ar < 1, indicating that these materials contained a significant number of pores that were large enough to be entered by Ar but too small for N2. The exclusion of N2 increased with increasing alkylene bridge length and was the largest for terminal alkyl groups. These Ar-selective pores were not observed in TEOS-derived material, indicating that the incorporation of any organic group increased the dispersity in pore entrance sizes in the probed size range. This was also observed for most organosilica networks in the pore size range of the organic vapors as discussed above (Figure 3).
The trend in semi-quantitative surface areas of the (organo)silica materials roughly corresponds with the trend in porosity and spacer type; the surface area decreased in the order BTESM, BTESE, BTESB > TEOS > BTMSH, BTESO, MTMS, PTMS. This trend also follows from the BET surface areas derived from CO2 adsorption isotherms. Assuming similar pore shapes, including similar cavity/entrance size ratios, the increasing surface-to-volume ratios indicate decreasing average pore sizes in the order PTMS >> BTMSH ≈ BTESM ≈ BTESE > TEOS > BTESB >> MTMS > BTESO. Apparently, the bulky organic groups in PTMS- and BTMSH-derived material that led to moderate or low porosity (Figure 3 and Table 1), did not reduce the average pore size. The smallest average pore sizes for MTMS- and BTESO-derived networks contrast with these materials showing no exclusion of cyclohexane over 1-propanol (Figure 3). Significant differences in pore shapes between these materials as compared to the networks with short and rigid bridges are plausible.
Cavity size
PM measurements with competitive gas filling were done to obtain more information on the micropore cavity dimensions. When filling a micropore structure with a single type of probe molecules, equilibrium can be reached without probe molecules needing to pass each other inside the pore structure and the filling rate is mostly

Results and discussion | 103
5
5
5
5
5
determined at the pore entrances (bottlenecks). When a micropore structure is filled with gas A and then filled further with another gas B, molecules of A and B have to pass each other inside the pores in order to mix and reach equilibrium. Since passing of molecules will occur mostly at the widest positions in the pores, the equilibration rate of gas B depends mostly on the cavity sizes and less on the size of the pore entrances. Comparing the equilibration behavior of gas B added to a background of gas A with the equilibration behavior of gas B added to a background of gas B thus provides information specifically on the cavity size.
Figure 5a shows the filling progress in time after the addition of N2 to a background of either N2 or He for TEOS-, BTESM-, BTESE-, BTMSH-, BTESO-, BTESB- and MTMS-derived networks. Calculations were done as described in Chapter 4.26 For N2 being added to a background of N2 (solid curves) the cell pressure equilibrated slowest for MTMS-, BTMSH- and BTESO-derived networks, indicating somewhat smaller pore entrance sizes than for the other materials. For N2 being added to a background of He(dotted curves) the cell pressure equilibrated significantly slower for all networks, indicating that mixing of N2 and He inside the pore structures was hindered. The time until 30% filling and the filling after 600 s are plotted in Figures 5b and 5c, with the values for zeolites with known cavity sizes serving as semi-quantitative calibration points, see Chapter 4.26 The precision of the results scales with the internal surface
Figure 5. a) Pore filling curves for N2 added to a background of N2 (solid curves) and for N2 added to a background of He (dotted curves) for TEOS-, BTESM-, BTESE-, BTMSH-, BTESO-, BTESB- and MTMS-derived networks. b) Time at 30% filling of N2 added to a background of He. The semi-quantitative calibration data was obtained from a series of zeolites in Chapter 4.26 c) Degree of filling at t = 600 s for N2 added to a background of He. The semi-quantitative calibration data was obtained from a series of zeolites in Chapter 4.26
a For BTESO-derived material the crosses are based on the accessible pore volume from the uptake of 1-propanol instead of methanol.
50
150
250
350
450
550
0.0 0.2 0.4 0.6 0.8 1.0 1.2
t 30%
[s]
Cavity size [nm]
BTESO
MTMS
BTESOa
BTMSHBTESBTEOSBTESEBTESM
calibration data zeolites
31
34
37
40
43
46
0.0 0.2 0.4 0.6 0.8 1.0 1.2
Filli
ng a
t t =
600
s [%
]
Cavity size [nm]
calibration data zeolites
BTESM
BTESETEOSBTESBBTMSH
BTESOa
MTMSBTESO
35.7093836.3993137.4342238.1241538.8140839.1590539.8489940.1939540.5389240.8838941.5738241.9187942.2637642.6087242.9536943.2986643.6436343.9885944.3335644.67853
0
10
20
30
40
50
60
70
80
90
100
0 200 400 600
Filli
ng p
rogr
ess [
%]
Time [s]
adding N2 to N2adding N2 to He
TEOSBTESMBTESEBTMSHBTESOa
BTESBMTMS
a) b) c)

104 | Organic groups influencing microporosity in organosilicas
5
5
5
5
5
area of the sample; BMDESE- and PTMS- derived material could not be accurately analyzed. The results reflect only those pores that are accessible to N2, excluding the smallest micropores. The mesopores observed in TEOS- and BTESO-derived materials (Figure 2) are one or two orders of magnitude larger than the probe molecules and are thus expected to enable unhindered passing. Also, their contribution to the total uptake of N2 is relatively low because their surface-to-volume ratio is much smaller than for micropores. Therefore, the mesopores are not expected to influence the results in Figure 5 significantly.
The apparent cavity sizes increased in the order BTESO ≈ MTMS < BTMSH ≈ BTESB ≈ TEOS ≈ BTESE < BTESM, roughly following the classification based on spacer type as discussed in the introduction. The equilibration rates for BTESO- and MTMS-derived material were similar to that of zeolites with a cavity size of 0.6 nm. BTMSH-, BTESB-, TEOS- and BTESE-derived material showed equilibration rates similar to zeolites with a cavity size of 1.1 nm. This does not correspond with reports on molecular dynamics simulation of inorganic and ethylene-bridged silica predicting only cavity sizes below 0.5-0.6 nm.11,24 However, the simulated networks were constructed by melting and quenching an inorganic silica crystal and thus have a very high packing density. The experimental PM results reflect sol-gel-derived networks including larger cavities due to imperfect packing and compaction. The theoretically predicted cavity expansion of about 0.05 nm from TEOS- to BTESE-derived networks24 is within the error margin of the experimental PM technique.
Conclusion The micropore structure of a series of organosilica materials with various organic groups in bridging and terminal positions was analyzed and compared to that of inorganic amorphous silica. The obtained pore volumes, semi-quantitative surface areas and semi-quantitative cavity sizes generally correspond with the known classification of 1) short or rigid organic bridges that open up the pore structure, 2) longer and more flexible bridges that cause pore filling and 3) terminal organic groups that reduce pore formation. However, phenylene-bridged material showed a lower porosity and smaller average pore size than ethylene-bridged material despite having more rigid and longer bridges; alignment of the phenylene rings probably counteracted their spacing effect. Also, the bulky terminal propyl and bridging hexylene groups did not appear to decrease the average pore size.
The general trend is observed that the incorporation of any organic group in the silica network increases the dispersity in micropore entrance sizes in the probed size range. While the pore structure of inorganic silica was equally accessible to all probe molecules, the incorporation of organic groups resulted in partial exclusion of cyclohexane over 1-propanol and partial exclusion of N2 over Ar. This can be

Acknowledgements | 105
5
5
5
5
5
explained with the lower symmetry and mobility of especially organically bridged silica monomers as compared to inorganic silica monomers, yielding more intrinsic as well as processing-related variations in micropore dimensions.
More refined micropore structure analyses may be achieved by using Ne as additional probe molecule for gas PM to fill the size gap between He and Ar. Ne is preferred over H2 because of its spherical shape and inertness; its high price is compensated by the small amount required per sample. As for organically bridged molecular sieving membranes, the large similarity between inorganic and organically bridged silica in terms of siloxane bond concentrations and (theoretical) micropore size distributions suggests that there is still room to improve their size-selective behavior. This may be done by adding post-treatments or re-optimizing the common synthesis and processing (drying) protocols. Alternatively, smaller pores may be obtained by using a mixture of short and longer alkylene bridges. The short bridges (i.e. methylene) can provide a rigid backbone with small pore openings, while the longer bridges (i.e. hexylene) partially fill up the micropore cavities and may enhance relaxation and compaction of the network.
Acknowledgements Financial support from the Advanced Dutch Energy Materials (ADEM) program of the Dutch Ministry of Economic Affairs, Agriculture and Innovation is gratefully acknowledged. Thanks to Cindy Huiskes and the Inorganic Membranes group of the University of Twente for providing the Autosorb equipment.
References 1. G. Dubois, W. Volksen, T. Magbitang, R.D. Miller, D.M. Gage, R.H. Dauskardt, Adv. Mater. 2007, 19,
3989–3994. 2. E.J. Kappert, D. Pavlenko, J. Malzbender, A. Nijmeijer, N.E. Benes, P.A. Tsai, Soft Matter 2015, 11,
882–888. 3. H.L. Castricum, A. Sah, M.C. Mittelmeijer-Hazeleger, C. Huiskes, J.E. ten Elshof, J. Mater. Chem.
2007, 17, 1509–1517. 4. S.S. Latthe, H. Imai, V. Ganesan, A.V. Rao, Microporous Mesoporous Mater. 2010, 130, 115–121. 5. A.P. Dral, C. Lievens, J.E. ten Elshof, Langmuir 2017, 33, 5527–5536. 6. H.L. Castricum, A. Sah, R. Kreiter, D.H.A. Blank, J.F. Vente, J.E. ten Elshof, J. Mater. Chem. 2008, 18,
2150–2158. 7. H.L. Castricum, A. Sah, R. Kreiter, D.H.A. Blank, J.F. Vente, J.E. ten Elshof, Chem. Commun. 2008,
1103–1105. 8. H.L. Castricum, R. Kreiter, H.M. van Veen, D.H.A. Blank, J.F. Vente, J.E. ten Elshof, J. Memb. Sci.
2008, 324, 111–118. 9. M. Kanezashi, M. Kawano, T. Yoshioka, T. Tsuru, Ind. Eng. Chem. Res. 2012, 51, 944–953. 10. K.S. Chang, T. Yoshioka, M. Kanezashi, T. Tsuru, K.-L. Tung, Chem. Commun. 2010, 46, 9140–9142. 11. K.-S. Chang, T. Yoshioka, M. Kanezashi, T. Tsuru, K.-L. Tung, J. Memb. Sci. 2011, 381, 90–101.

106 | Organic groups influencing microporosity in organosilicas
5
5
5
5
5
12. H.L. Castricum, G.G. Paradis, M.C. Mittelmeijer-Hazeleger, R. Kreiter, J.F. Vente, J.E. ten Elshof, Adv. Funct. Mater. 2011, 21, 2319–2329.
13. H.W. Oviatt, K.J. Shea, J.H. Small, Chem. Mater. 1993, 5, 943–950. 14. R. Xu, M. Kanezashi, T. Yoshioka, T. Okuda, J. Ohshita, T. Tsuru, ACS Appl. Mater. Interfaces 2013, 5,
6147–6154. 15. R. Xu, P. Lin, Q. Zhang, J. Zhong, T. Tsuru, Ind. Eng. Chem. Res. 2016, 55, 2183–2190. 16. J.M. Rimsza, L. Deng, J. Du, J. Non. Cryst. Solids 2016, 431, 103–111. 17. D.S. Wragg, R.E. Morris, A.W. Burton, Chem. Mater. 2008, 20, 1561–1570. 18. K.J. Shea, D.A. Loy, Chem. Mater. 2001, 13, 3306–3319. 19. X. Ren, K. Nishimoto, M. Kanezashi, H. Nagasawa, T. Yoshioka, T. Tsuru, Ind. Eng. Chem. Res. 2014,
53, 6113–6120. 20. M. Kanezashi, Y. Yoneda, H. Nagasawa, T. Tsuru, K. Yamamoto, J. Ohshita, Am. Inst. Chem. Eng. J.
2017, 63, 4491-4498. 21. L. Meng, M. Kanezashi, J. Wang, T. Tsuru, J. Memb. Sci. 2015, 496, 211–218. 22. G. Li, M. Kanezashi, T. Tsuru, J. Memb. Sci. 2011, 379, 287–295. 23. G.G. Paradis, D.P. Shanahan, R. Kreiter, H.M. van Veen, H.L. Castricum, A. Nijmeijer, J.F. Vente, J.
Memb. Sci. 2013, 428, 157–162. 24. T. Shimoyama, T. Yoshioka, H. Nagasawa, M. Kanezashi, T. Tsuru, Desalin. Water Treat. 2013, 51,
5248–5253. 25. A.P. Dral, K. Tempelman, E.J. Kappert, L. Winnubst, N.E. Benes, J.E. ten Elshof, J. Mater. Chem. A
2017, 5, 1268–1281. 26. A.P. Dral, J.E. ten Elshof, Microporous Mesoporous Mater. 2017, in press. 27. K. Akamatsu, S. Nakao, in Handbook of advanced ceramics, Academic Press, Elsevier Ltd, Waltham,
USA, 2nd edn., 2013, p. 332.

107
Err
Err
Err
Err
Conclusion: Just relax!
Summary | Samenvatting
Dankwoord | Acknowledgements
List of publications

108
Err
Err
Err
Err

109
Err
Err
Err
Err
Conclusion: Just relax! The research in this dissertation focused on the understanding of water sensitivity and microporosity in organosilica glasses to improve their capabilities as molecular sieving membranes. The eternally dynamic nature of these materials and the multitude of different and counteracting effects of a single chemical reaction with water are fascinating. As for concrete results for membrane development, it is explained why these membranes perform as well as they do (Chapter 1), a still remaining problem is identified, explained and solved (Chapters 2-3) and capabilities beyond the current state-of-the-art are predicted (Chapters 4-5). For every issue the solution comes down to relaxation of the network. Network relaxation increases hydrothermal stability, increases structural and micropore stability and is expected to increase membrane selectivity for very small molecules.
To achieve network relaxation after material synthesis and processing, the method described in Chapter 3 can be used. The method involves iterative hydrolysis and condensation and this can be achieved both with and without a catalyst. Catalyst-free procedures involving only heat and moisture may be developed for industrial application, to circumvent practical issues related to the use of acids in gaseous state or otherwise. Another method to increase network relaxation may be to subject the material to high pressures or mechanical motion, depending on the type of organosilica and the device structure.
As alternative to releasing stresses afterwards, their initial build-up can be decreased. This can be done by adjusting the sol-gel fabrication process. Stopping the sol maturation at an earlier stage and drying the material more gradually may allow the molecular segments to take on more favorable positions in their green shape before they are immobilized too much by ongoing condensation. Furthermore, minimizing the electrical repulsion between network segments during drying, i.e. neutralizing the charge on the Si moieties by reducing the acid concentration after sol maturation, is expected to help. In principle, replacing sol-gel processing by a vapor deposition process may also be a solution. Though the scalability and flexibility of sol-gel processing may be favored for most applications, vapor deposition enables network formation in a more subtle fashion. It ideally approaches a situation where the monomer units are connected to the network one by one in their optimal configuration. Preliminary experimental results showed proof-of-principle, i.e. a film was successfully formed from a vaporized organosilica precursor and moisture and showed no structural compaction at 300 °C for 15 h. This approach can also reveal the intrinsic preference of the material system and give more fundamental insight.

110
Err
Err
Err
Err

111
Err
Err
Err
Err
Summary The aim of the research presented in this dissertation is to gain more insight in the water sensitivity and microporosity of organosilica glasses. The research primarily focuses on fundamental material understanding, but stands in close relation with the industrial application of organically bridged silicas as molecular sieving membranes. All organosilica materials were synthesized from alkoxy-substituted precursors via sol-gel chemistry. All chemical reactions studied in this thesis involve either hydrolysis of siloxane bonds (Si-O-Si) into silanol groups (Si-OH) or its reverse, i.e. condensation of silanol groups into siloxane bonds.
Chapter 1 presents a systematic study on the influence of various molecular factors on hydrothermal dissolution of organosilicas. Materials were synthesized with various organic groups in bridging (methylene, ethylene, hexylene, octylene, p-phenylene) and terminal (methyl, n-propyl, phenyl, cyclohexane) positions. The bond strain, connectivity and hydroxyl concentration of all networks were estimated using
29Si CP-MAS-NMR and FTIR. The hydrophilicity was characterized by monitoring the water uptake of the materials in moisture treatments with TGA-DSC and FTIR. The resistance of each network against hydrothermal dissolution in a water/1,5-pentanediol mixture at 80 °C and pH 1, 7 and 13 was analyzed with ICP-OES and XRF. Bond strain appears to significantly increase the tendency to dissolve under hydrothermal conditions. The stabilizing influences of increased connectivity and hydrophobicity were found to be weak. Chapter 2 zooms in on subtle effects of condensation reactions in ethylene-bridged silica when kept at temperatures up to 300 °C. An explanation is presented for the previously not understood problem of slow flux decline in industrially employed organosilica membranes over periods of months to years. Chemical and structural (micropore) evolution were studied in powders, films and gas permeation membranes with in-situ FTIR, 29Si CP-MAS-NMR, in-situ SE, in-situ GP and in-situ XRR. The common assumption that ethylene-bridged materials reach a stabilized structural state after treatment at 250-300 °C for a few hours is shown to be incorrect. A continuously ongoing decrease in both silanol concentration and film thickness were observed, accompanied by changes in density, thermal expansion and micropore structure. The material evolution continued for days to weeks without approaching an end state and was related to network flexibility. Changes in the micropore structure depended on the pore size, yielding an increasing gas permeance through small pores ~0.3 nm but a decreasing permeance through relatively large pores >0.4 nm.

112
Err
Err
Err
Err
Chapter 3 presents a route to solve the subtle material instability reported in Chapter 2. Ethylene-bridged silica films, powders and membranes were exposed to in-situ synthesized HCl gas alternated with heat treatments at 150-300 °C. The film thickness, network condensation, chemical integrity and micropore structure were monitored with XRR, 29Si DE-MAS-NMR, FTIR and GP. Treatment with HCl was found to predominantly catalyze hydrolysis of siloxane bonds, enabling network optimization via iterative bond breakage and reformation. Network shrinkage, widening or opening of the smallest pores and densification of the overall pore structure were accelerated while the ethylene bridges remained intact. The achieved acceleration of material evolution makes iterative hydrolysis and condensation a promising approach for increasing the long-term micropore stability of organically bridged molecular sieving membranes.
Chapter 4 presents a new method for characterization of micropores <1 nm with increased accuracy as compared to conventional adsorption isotherm analysis. Thermogravimetry was employed to assess the uptake of water, methanol, ethanol, 1-propanol and cyclohexane vapors in microporous structures at room temperature and derive quantitative micropore volumes and minimum pore entrance sizes together with qualitative information on surface chemistries. Pycnometry was employed to measure the uptake and adsorption of He, Ar and N2 gas at room temperature and derive semi-quantitative surface-to-volume ratios, surface areas and micropore cavity sizes. The method was validated and calibrated by applying it to a series of zeolites with known micropore structures. The results were compared with data from conventional N2 adsorption at -196 °C and CO2 adsorption at 0 °C. Main advantages of the demonstrated method are that diffusion limitations due to cryogenic temperatures are eliminated, adsorption is studied with non-polar gases, micropore cavity sizes are probed separate from micropore entrances and data can be interpreted in a straightforward fashion without requiring theoretical models on molecular behavior.
Chapter 5 presents a systematic study on the micropore properties of a series of organosilica materials based on the method reported in Chapter 4. Materials were prepared with various organic groups in bridging (methylene, ethylene, hexylene, octylene, p-phenylene) and terminal (methyl, n-propyl) positions. Accessible pore volumes, entrance sizes and surface chemistries were measured with vapor TG using water, methanol, 1-propanol and cyclohexane vapors. Skeletal densities, semi-quantitative surface-to-volume ratios and surface areas, pore entrance sizes and semi-quantitative pore cavity sizes were measured with gas PM using He, Ar and N2. The known classification of 1) short or rigid organic bridges that open up the pore structure, 2) longer and more flexible bridges that cause pore filling and 3) terminal organic groups that reduce pore formation is further specified. The incorporation of

113
Err
Err
Err
Err
any organic group in the silica network increased the dispersity in micropore entrance sizes as compared to inorganic silica in the probed size range. A critical discussion is given of the commonly accepted ‘spacing concept’ of organic bridges.
Samenvatting Het doel van het onderzoek in dit proefschrift is meer inzicht te krijgen in de watergevoeligheid en microporositeit van organosilica glazen. Het onderzoek focust voornamelijk op fundamenteel begrip van de materialen, maar is nauw verbonden aan de industriële toepassing van organisch gebrugde silica’s in membranen die functioneren als moleculaire zeef.
Hoofdstuk 1 bevat een studie over de invloed van verschillende moleculaire factoren op de hydrothermale oplossing (afbraak) van organosilica materialen. De resultaten laten zien dat de gevoeligheid voor hydrothermale oplossing waarschijnlijk wordt vergroot door stress in de chemische bindingen. De stabiliserende invloeden van meer netwerkverbindingen en waterafstotende oppervlakken zijn zwak.
Hoofdstuk 2 zoomt in op subtiele chemische en structurele veranderingen in organisch gebrugde silica’s bij temperaturen tot 300 °C. De resultaten laten zien dat de algemene aanname dat deze materialen structureel stabiel zijn na verhitting voor enkele uren, niet klopt. Een verklaring wordt gegeven voor het eerder niet begrepen probleem van langzame fluxafname in industriële organosilica membranen.
Hoofdstuk 3 presenteert een route om de materiaalinstabiliteit uit Hoofdstuk 2 op te lossen. Door organisch gebrugde organosilica’s afwisselend te behandelen met zuur gas en met warmte, worden de netwerkverbindingen herhaaldelijk gebroken en opnieuw gevormd. Dit leidt tot een gunstigere ordening in het materiaal.
Hoofdstuk 4 presenteert een nieuwe methode om microporiën kleiner dan 1 nanometer te analyseren met een hogere nauwkeurigheid dan andere veelgebruikte methoden. Door de microporiën te vullen met specifieke dampen en gassen worden het porievolume, de poriegrootte en het porieoppervlak gemeten.
Hoofdstuk 5 bevat een studie over de invloed van organische groepen op de microporiën in organosilica materialen met de methode uit Hoofdstuk 4. De resultaten laten zien dat alle soorten organische groepen de variatie in poriegrootte in het materiaal vergroten. De algemene aanname dat korte organische bruggen tussen siliciumatomen alle poriën doen uitzetten wordt kritisch besproken.

114
Err
Err
Err
Err

115
Err
Err
Err
Err
Dankwoord Ik ben dankbaar voor het uitdagende project, de inspirerende universiteitsomgeving en de vele prettige collega’s die de afgelopen jaren hebben gekleurd. Ik heb genoten van het totaalpakket aan werkzaamheden. Ik kon er mijn ei in kwijt en ik heb ervan geleerd.
André, hoewel ik een aantal opties kreeg in het jaar voor mijn afstuderen, ben ik met overtuiging een project bij jouw groep gaan doen. Ik heb er geen seconde spijt van gehad. Bedankt voor alles waarin we met elkaar te maken hadden. Ook dank aan de andere chemici, co-auteurs, paranimfen, stagiairs, IMS’ers, UT’ers, inspirerende wetenschappers wereldwijd en dierbare mensen in mijn persoonlijke leven. Hans, dankjewel voor je liefde en aanwezigheid.
Voor mij heeft het doen van wetenschappelijk onderzoek niet alleen een ‘wiskundige’ dimensie maar ook een spirituele. Ik ervaar het als een voorrecht om mijn intellectuele en andere vermogens te kunnen gebruiken om dat wat bestaat te ontdekken en te vieren. Wat een mogelijkheden, wat een schoonheid, wat een kracht, wat een creativiteit… Mijn diepste dank gaat uit naar God. Hoewel volgens sommigen (natuur)wetenschap en Godsgeloof elkaar uitsluiten, vormen ze in mijn ogen een geweldige harmonie.
Acknowledgements I am grateful for the challenging project, the inspiring university environment and the many pleasant colleagues who have coloured these years. I have enjoyed the versatile package of activities. I could express myself in it and I have learnt from it.
André, although I received several options in the year before obtaining my master’s degree, with conviction I chose a project in your group. I have never regretted it. Thanks for all the parts of our collaboration. Also thanks to the other chemists, co-authors, paranymphs, interns, IMS’ers, UT’ers, inspiring scientists worldwide and dear people in my personal life. Hans, thank you for your love and presence.
For me doing scientific research has not only a ‘mathematical’ dimension but also a spiritual one. I experience it as a privilege to be able to use my intellectual and other capacities to discover and celebrate that what exists. What a possibilities, what a beauty, what a power, what a creativity… My deepest gratitude goes to God. Though according to some people (natural) science and belief in God exclude each other, in my eyes they make an amazing harmony.

116
Err
Err
Err
Err

117
Err
Err
Err
Err
List of publications
(10.) Dral, A.P., Elshof, J.E. ten. 2D metal oxide nanoflakes for sensing applications: Review and perspective. (to be submitted)
(9.) Dral, A.P., Elshof, J.E. ten. Organic groups influencing microporosity in organosilicas. (submitted, dissertation Chapter 5)
(8.) Dral, A.P., Winnubst, A.J.A., Elshof, J.E. ten. Micropore structure stabilization in organosilica membranes by gaseous catalyst post-treatment. (submitted, dissertation Chapter 3)
(7.) Gonzalez Rodriguez, P., Dral, A.P., Lette, W., Schipper, D.J., Elshof, J.E. ten. Thermochemical stability and friction properties of soft organosilica networks for solid lubrication. (submitted)
6. Dral, A.P., Elshof, J.E. ten. Analyzing microporosity with vapor thermogravi-metry and gas pycnometry. Microporous and Mesoporous Materials 258 (2018) 197-204. (dissertation Chapter 4)
5. Dral, A.P., Lievens, C., Elshof, J.E. ten. Influence of monomer connectivity, network flexibility, and hydrophobicity on the hydrothermal stability of organosilicas. Langmuir 33 (2017) 5527-5536. (dissertation Chapter 1)
4. Dral, A.P., Tempelman, K., Kappert, E.J., Winnubst, A.J.A., Benes, N.E., Elshof, J.E. ten. Long-term flexibility-based structural evolution and condensation in microporous organosilica membranes for gas separation. Journal of Materials Chemistry A 5 (2017) 1268-1281. (dissertation Chapter 2)
3. Elshof, J.E. ten, Dral, A.P. Structure-property tuning in hydrothermally stable sol-gel-processed hybrid organosilica molecular sieving membranes. Journal of Sol-Gel Science and Technology 79 (2016) 279-294.
2. Dral, A.P., Nijland, M., Koster, G., Elshof, J.E. ten. Film transfer enabled by nanosheet seed layers on arbitrary sacrificial substrates. APL Materials 3 (2015) 056102.
1. Dral, A.P., Dubbink, D., Nijland, M., Elshof, J.E. ten, Rijnders, G., Koster, G. Atomically defined templates for epitaxial growth of complex oxide thin films. Journal of Visualized Experiments 94 (2014) e52209.

118
Err
Err
Err
Err