water quality status of maharashtra 2016-17 · water quality status of maharashtra 2016-17 water...
TRANSCRIPT

Water Quality Status of Maharashtra 2016-17
WATER QUALITY
STATUS OF
MAHARASHTRA
2016-17
The Energy & Resources
Institute


Water Quality Status of Maharashtra 2016-17
Water Quality Status of
Maharashtra 2016-17
(Compilation of Water Quality Data Recorded by MPCB)
November 2017
Prepared by


Water Quality Status of Maharashtra 2016-17
iii


Water Quality Status of Maharashtra 2016-17
v
Abbreviations
BIS Bureau of Indian Standards
BOD Biochemical Oxygen Demand
CGWB Central Ground Water Board
CPCB Central Pollution Control Board
CWC Central Water Commission
DO Dissolved Oxygen
FC Fecal Coliform
GEMS Global Environment Monitoring System
GIS Geographical Information System
GSDA Groundwater Surveys & Development Agency
MINARS Monitoring of Indian National Aquatic Resources System
MoEF Ministry of Environment and Forests
MPCB Maharashtra Pollution Control Board
NSFWQI National Sanitation Foundation Water Quality Index
NWMP National Water Monitoring Program
pH Power of Hydrogen
RO Regional Office
SD Standards Deviation
Shp Shape files
SPCBs State Pollution Control Boards
SW Surface Water
WHO World Health Organisation
WQMS Water Quality Monitoring Stations
YAP Yamuna Action Plan


Water Quality Status of Maharashtra 2016-17
vii
Table of Contents
ABBREVIATIONS ............................................................................................................................ V
TABLE OF CONTENTS .................................................................................................................. VII
LIST OF FIGURES ............................................................................................................................ X
LIST OF MAPS ............................................................................................................................. XIII
LIST OF TABLES .......................................................................................................................... XIII
EXECUTIVE SUMMARY ................................................................................................................... 1
Surface Water Quality ..................................................................................................... 2
Ground water Quality ..................................................................................................... 6
INTRODUCTION ............................................................................................................................. 9
GEMS ................................................................................................................................. 9
MINARS .......................................................................................................................... 10
Water Quality Monitoring in Maharashtra ................................................................ 10
METHODOLOGY AND CALCULATION ....................................................................................... 13
Spatial Maps .......................................................................................................................... 14
Sub -basin level maps .................................................................................................... 14
MPCB Regional Office (RO) maps ............................................................................... 14
Organizing and presentation of the data sets ................................................................... 14
Water Quality Index ............................................................................................................. 14
WQI for surface water ................................................................................................... 15
WQI for groundwater .................................................................................................... 19
CAGR: Compound Annual Growth Rate .................................................................. 23
INTER BASIN ANALYSIS .............................................................................................................. 25
Tapi Basin .............................................................................................................................. 25
Water Quality Index for WQMS in Tapi Basin .......................................................... 26
Godavari Basin (1 of 2): Godavari upper, Godavari Middle and Manjra Sub basin .. 31
Water Quality Index for WQMS in Godavari Basin (1 of 2): Sub-Basin - Godavari Upper ........................................................................................................................ 32
Water Quality Index for WQMS in Godavari Basin (1 of 2): Sub-Basin - Godavari Middle and Manjra .................................................................................................. 34
Spatial map of SurfaceWQI at Godavari Basin (1 of 2) (April 2016) ....................... 36
Godavari Basin (2 of 2): Wardha, Weinganga and Pranhita Sub basin ........................ 39
Water Quality Index for WQMS at Godavari Basin (2 of 2): Sub-basin- Wardha. 40
Water Quality Index for WQMS at Godavari Basin (2 of 2): Sub-basin- Weinganga and Pranhita ............................................................................................................. 42
Spatial map of Surface WQI in Godavari Basin (2 of 2) (April 2016)...................... 44
Spatial map of Surface WQI in Godavari Basin (2 of 2) (December 2016) ............. 45
Krishna Basin ........................................................................................................................ 47

Water Quality Status of Maharashtra 2016-17
viii
Water Quality Index for WQMS at Krishna Basin (1 of 2): Sub-basin - Bhima upper (1 of 2) ............................................................................................................................ 48
Water Quality Index for WQMS at Krishna Basin (1 of 2): Sub-basin - Bhima upper (2 of 2) ............................................................................................................................ 50
Spatial map of Surface WQI at Krishna Basin (April 2016) ...................................... 54
Spatial map of Surface WQI at Krishna Basin (December 2016) ............................. 55
West Flowing Rivers ............................................................................................................ 57
Water Quality Index of WQMS on West Flowing rivers (1 of 2) ............................ 58
Water Quality Index of WQMS on West Flowing rivers (Coastal basin) (2 of 2) 60
Spatial map of Surface WQI of West Flowing rivers (April 2016) .......................... 62
Spatial map of Surface WQI of West Flowing rivers (December 2016) .................. 63
NALLAHS ...................................................................................................................................... 65
Water Quality Index of WQMS on Nallahs (Coastal basin) .................................... 66
SALINE (SEA AND CREEK) WATER QUALITY ............................................................................ 71
Water Quality Index of WQMS on Saline/Creek (Coastal basin) (1 of 2) ............ 72
Water Quality Index of WQMS on Saline/Creek (Coastal basin) (2 of 2) ............ 74
Spatial map of WQI for Sea /Creek (April 2016)...................................................... 76
Spatial map of WQI for Sea /Creek (December 2016) .............................................. 77
GROUNDWATER QUALITY .......................................................................................................... 79
Water Quality Index for ground water at Kalyan, Navi Mumbai, Raigad and Thane. .................................................................................................................................... 80
Water Quality Index for ground water at Amravati, Aurangabad and Nashik. .. 81
Water Quality Index for ground water at Chandrapur and Nagpur. .................... 82
Water Quality Index for ground water at Kolhapur and Pune. .............................. 84
Spatial map for Ground WQI in Kalyan, Navi Mumbai, Raigad and Thane 2016-17 (April 2016) ............................................................................................................... 86
Spatial map for Ground WQI in Amravati, Aurangabad and Nashik 2016-17 (April 2016) ........................................................................................................................... 88
Spatial map for Ground WQI in Chandrapur and Nagpur 2016-17 (April 2016) . 90
Spatial map for Ground WQI in Kolhapur and Pune 2016-17 (April 2016) .......... 92
CONCLUSION ................................................................................................................................ 95
ANNEXURE –I: PARAMETRIC GRAPHS – SURFACE WATER AND GROUND WATER ............... 96
ANNEX II– RO WISE SUMMARY OF WQI IN 2016-17 .............................................................. 155
RO – Amravati .................................................................................................................... 156
RO – Aurangabad ............................................................................................................... 158
RO – Chandrapur ............................................................................................................... 160
RO – Kalyan ......................................................................................................................... 162
RO – Kolhapur .................................................................................................................... 164
RO – Mumbai ...................................................................................................................... 168
RO – Nagpur ....................................................................................................................... 170
Water Quality Status of Maharashtra 2016-17
ix
RO – Nashik ........................................................................................................................ 174
RO – Navi Mumbai ............................................................................................................ 178
RO – Pune ............................................................................................................................ 180
RO – Raigad ......................................................................................................................... 184
RO – Thane .......................................................................................................................... 186
ANNEX III – LIST OF PENDING WRIT PETITIONS ................................................................... 189
ANNEX IV– LIST OF POLLUTED STRETCHES ACROSS MAHARASHTRA ............................... 190
ANNEX V – STATUS OF SEWAGE TREATMENT IN MUNICIPAL CORPORATIONS OF
MAHARASHTRA .................................................................................................................. 191
ANNEX VI – DATA SETS OF WATER QUALITY MONITORED IN 2016-17 ............................. 205
RIVERWISE TREND OF WQI (2016-17) ..................................................................................... 206
STATION WISE TREND IN WQI (2007-17) ................................................................................ 245
Surface water Trend of WQI -2016-17 ............................................................................. 245
Saline water Trend of WQI -2016-17 ................................................................................ 256
Water Quality Status of Maharashtra 2016-17
x
List of Figures
Figure No. 1: Average occurrence of different category of WQI across WQMS in respective sub basins of Maharashtra ......................................................................................................... 3
Figure No. 2: Trend of average occurrence for different category of WQI in Tapi basin ........ 25
Figure No. 3: Trend of average occurrence for different category of WQI in Godavari basin (1 of 2) .............................................................................................................................................. 31
Figure No. 4: Trend of average occurrence for different category of WQI in Godavari basin (2 of 2) .............................................................................................................................................. 39
Figure No. 5: Trend of average occurrence for different category of WQI in Krishna basin .. 47
Figure No. 6: Trend of average occurrence for different category of WQI in West flowing ... 57
Figure No. 7: Trend of average occurrence for different category of WQI Coastal basin ....... 71
Figure No. 8: Trend of Dissolved Oxygen (DO) levels recorded at WQMS at Tapi basin ...... 96
Figure No. 9: Trend of BOD levels recorded at WQMS at Tapi basin ........................................ 97
Figure No. 10: Trend of pH levels recorded at WQMS at Tapi basin ......................................... 98
Figure No. 11: Trend of Fecal Coliform levels recorded at WQMS at Tapi basin ..................... 99
Figure No. 12: Trend of Dissolved Oxygen (DO) levels recorded at WQMS at Godavari basin (1of 2) ......................................................................................................................................... 100
Figure No. 13: Trend of BOD levels recorded at WQMS at Godavari basin (1 of 2) .............. 101
Figure No. 14: Trend of pH levels recorded at WQMS at Godavari basin (1 of 2) ................. 102
Figure No. 15: Trend of Fecal Coliform levels recorded at WQMS at Godavari basin (1 of 2) Figure No. 16: Trend of Dissolved Oxygen (DO) levels recorded at WQMS at Godavari basin (2 of 2) ............................................................................................................................. 103
Figure No. 17: Trend of BOD levels recorded at WQMS at Godavari basin (2 of 2) .............. 104
Figure No. 18: Trend of pH levels recorded at WQMS at Godavari basin (2 of 2) ................. 105
Figure No. 19: Trend of Fecal Coliform levels recorded at WQMS at Godavari basin (2 of 2) .................................................................................................................................................... 106
Figure No. 20: Trend of Dissolved Oxygen (DO) levels recorded at WQMS at Bhima upper sub basin -Krishna Basin (1 of 2) ........................................................................................... 107
Figure No. 21: Trend of Biological Oxygen Demand (BOD) levels recorded at WQMS at Bhima upper sub basin -Krishna Basin (1 of 2) ................................................................... 108
Figure No. 22: Trend of pH levels recorded at WQMS at Bhima upper sub basin -Krishna Basin (1 of 2) ............................................................................................................................. 109
Figure No. 23: Trend of Fecal Coliform levels recorded at WQMS at Bhima upper sub basin -Krishna Basin (1 of 2) .............................................................................................................. 110
Figure No. 24: Trend of Dissolved Oxygen (DO) levels recorded at WQMS at Bhima upper sub basin -Krishna Basin (2 of 2) ........................................................................................... 111
Figure No. 25: Trend of Biological Oxygen Demand (BOD) levels recorded at WQMS at Bhima upper sub basin -Krishna Basin (2 of 2) ................................................................... 112

Water Quality Status of Maharashtra 2016-17
xi
Figure No. 26: Trend of pH levels recorded at WQMS at Bhima upper sub basin -Krishna Basin (2 of 2) ............................................................................................................................. 113
Figure No. 27: Trend of Fecal Coliform levels recorded at WQMS at Bhima upper sub basin -Krishna Basin (2 of 2) .............................................................................................................. 114
Figure No. 28: Trend of Dissolved Oxygen (DO) levels recorded at WQMS at Krishna upper sub basin -Krishna Basin ........................................................................................................ 115
Figure No. 29: Trend of Biological Oxygen Demand (BOD) levels recorded at WQMS at Krishna upper sub basin - Krishna Basin ............................................................................. 116
Figure No. 30: Trend of pH levels recorded at WQMS at Krishna upper sub basin -Krishna Basin .......................................................................................................................................... 117
Figure No. 31: Trend of Fecal Coliform recorded at WQMS at Krishna upper sub basin -Krishna Basin ........................................................................................................................... 118
Figure No. 32: Trend of Dissolved Oxygen (DO) levels recorded at WQMS at West flowing s (Coastal basin) (1 OF 2) ........................................................................................................... 119
Figure No. 33: Trend of Biological Oxygen Demand (BOD) levels recorded at WQMS at West flowing riverss (Coastal basin) (1 of 2) ................................................................................. 120
Figure No. 34: Trend of pH levels recorded at WQMS at West flowing rivers (Coastal basin) (1 of 2) ........................................................................................................................................ 121
Figure No. 35: Trend of Fecal Coliform recorded at WQMS at West flowing rivers (Coastal basin) (1 of 2) ............................................................................................................................ 122
Figure No. 36: Trend of Dissolved Oxygen (DO) levels recorded at WQMS at West flowing riverss (Coastal basin) (2 of 2) ................................................................................................ 123
Figure No. 37: Trend ofBiological Oxygen Demand (BOD) levels recorded at WQMS at West flowing rivers (Coastal basin) (2 of 2) ................................................................................... 124
Figure No. 38 : Trend of pH levels recorded at WQMS at West flowing s (Coastal basin) (2 of 2) ................................................................................................................................................ 125
Figure No. 39: Trend of Fecal Coliform recorded at WQMS at West flowing rivers (Coastal basin) (2 of 2) ............................................................................................................................ 126
Figure No. 40 : Trend of Dissolved Oxygen (DO) levels recorded at WQMS at Nallah (Coastal basin) .......................................................................................................................... 127
Figure No. 41 : Trend of Biological Oxygen Demand (BOD) levels recorded at WQMS at Nallah (Coastal basin) ............................................................................................................. 128
Figure No. 42: Trend of pH levels recorded at WQMS at Nallah (Coastal basin) .................. 129
Figure No. 43: Trend of Fecal Coliform levels recorded at WQMS at Nallah (Coastal basin) ......................................................................................................................................... 130
Figure No. 44: Trend of Dissoved Oxygen (DO) levels recorded at WQMS monitoring sea and creek water (1 of 2) .......................................................................................................... 131
Figure No. 45: Trend of Dissoved Oxygen (DO) levels recorded at WQMS monitoring sea and creek water (2 of 2) .......................................................................................................... 132
Figure No. 46: Trend ofBiological Oxygen Demand (BOD) levels recorded at WQMS monitoring sea and creek water (1 of 2) ............................................................................... 133

Water Quality Status of Maharashtra 2016-17
xii
Figure No. 47: Trend ofBiological Oxygen Demand (BOD) levels recorded at WQMS monitoring sea and creek water (2 of 2) ............................................................................... 134
Figure No. 48: Trend of pH levels recorded at WQMS monitoring sea and creek water (1 of 2) ................................................................................................................................................ 135
Figure No. 49: Trend of pH levels recorded at WQMS monitoring sea and creek water (2 of 2) ........................................................................................................................................ 136
Figure No. 50: Trend of Fecal coliform levels recorded at WQMS monitoring sea and creek water (1 of 2)............................................................................................................................. 137
Figure No. 51: Trend of Fecal coliform levels recorded at WQMS monitoring sea and creek water (2 of 2)............................................................................................................................. 138
Figure No.52: Parametric values of pH recorded at WQMS monitoring ground water at Kalyan, Navi Mumbai, Raigad and Thane. ......................................................................... 139
Figure No.53: Parametric values of pH recorded at WQMS monitoring ground water at Amravati, Aurangabad and Nashik. .................................................................................... 140
Figure No.54: Parametric values of pH recorded at WQMS monitoring ground water at Chandrapur and Nagpur. ...................................................................................................... 141
Figure No.55: Parametric values of pH recorded at WQMS monitoring ground water at Kolhapur and Pune ................................................................................................................. 142
Figure No.56: Parametric values of Nitrate recorded at WQMS monitoring ground water at Kalyan, Navi Mumbai, Raigad and Thane. ......................................................................... 143
Figure No.57: Parametric values of Nitrate recorded at WQMS monitoring ground water at Amravati, Aurangabad and Nashik. .................................................................................... 144
Figure No.58: Parametric values of Nitrate recorded at WQMS monitoring ground water at Chandrapur and Nagpur. ...................................................................................................... 145
Figure No.59: Parametric values of Nitrate recorded at WQMS monitoring ground water at Kolhapur and Pune. ................................................................................................................ 146
Figure No.60: Parametric values of Hardness at CaCo3 recorded at WQMS monitoring ground water at Kalyan, Navi Mumbai, Raigad and Thane. ............................................ 147
Figure No. 61: Parametric values of Hardness at CaCo3 recorded at WQMS monitoring ground water at Amrawati, Aurangabad and Nashik. ...................................................... 148
Figure No. 62: Parametric values of Hardness at CaCo3 recorded at WQMS monitoring ground water at Chandrapur and Nagpur. ......................................................................... 149
Figure No. 63: Parametric values of Hardness at CaCo3 recorded at WQMS monitoring ground water at Kolhapur and Pune. ................................................................................... 150
Figure No. 64: Parametric values of Fluoride recorded at WQMS monitoring ground water at Kalyan, Navi Mumbai, Raigad and Thane .......................................................................... 151
Figure No. 65: Parametric values of Fluoride recorded at WQMS monitoring ground water at Amravati, Aurangabad and Nashik ..................................................................................... 152
Figure No. 66: Parametric values of Fluoride recorded at WQMS monitoring ground water at Chandrapur and Nagpur. ...................................................................................................... 153
Figure No. 67: Parametric values of Fluoride recorded at WQMS monitoring ground water at Kolhapur and Pune. ................................................................................................................ 154

Water Quality Status of Maharashtra 2016-17
xiii
List of Maps
Map No. 1: Spatial representation surface WQMS which recorded WQI as polluted for more than 50% of the observations ..................................................................................................... 4
Map No. 2: Spatial representation for average groundwater WQI ............................................... 7
Map No. 3: Spatial representation of network of WQMS monitored by MPCB across Maharashtra 2016-17 ................................................................................................................. 11
Map No. 4: Water monitoring network across Nallahs ................................................................ 65
Map No. 5: Network of ground water quality monitoring stations in Maharashtra ............... 79
List of Tables
Table No. 1: Formula and classification of Water quality indices for surface and groundwater ........................................................................................................................................................ 1
Table No. 2: Annual Average WQI for surface WQMS in various basins and sub basins ........ 2
Table No. 3: WQMS which recorded WQI as polluted for more than 50% observations in 2016-17 .......................................................................................................................................... 5
Table No. 4: List of WQMS which recorded WQI in ‘Water not suitable for drinking’............. 7
Table No. 5 : List of parameters tested and analyzed by CPCB and SPCB ................................ 10
Table No. 6: Basin and water body typewise tally of WQMS in Maharashtra .......................... 11
Table No. 7: Classification of the rivers considered under basins and sub basins in the report ...................................................................................................................................................... 13
Table No. 8: Modified weights for computation of WQI based on DO, FC, pH and BOD ..... 15
Table No. 9: Sub index equation used to calculate NSF WQI for DO, FC, pH and BOD ........ 16
Table No. 10: Water Quality Classification and Best Designated use ........................................ 16
Table No. 11: Relative Weight of chemical parameters used for calculating WQI for Ground water ............................................................................................................................................ 19
Table No. 12: Groundwater classification based on the Water Quality Index .......................... 20
Table No. 13: Surface water quality monitoring stations in Tapi basin ..................................... 27
Table No. 14: Surface water quality monitoring stations in Godavari Basin (1 of 2) ............... 33
Table No. 15: Surface water quality monitoring stations in Godavari Basin (1 of 2) ............... 35
Table No. 16: Surface water quality monitoring stations in Godavari Basin (2 of 2) ............... 41
Table No. 17: Surface water quality monitoring stations in Godavari Basin (2 of 2) ............... 43
Table No. 18: Surface water quality monitoring stations in Krishna Basin (1 of 2) Sub Basin –Bhima Upper (1 of 2) ................................................................................................................. 49
Table No. 19: Surface water monitoring stations at Krishna Basin (1 of 2) Sub Basin Bhima Upper (2 of 2) ............................................................................................................................. 51

Water Quality Status of Maharashtra 2016-17
xiv
Table No. 20: Surface water quality monitoring stations in Krishna Basin (1 of 2): Sub basin Bhima upper (1 of 3).................................................................................................................. 53
Table No. 21: Surface water monitoring stations at West Flowing rivers (1 of 2)..................... 59
Table No. 22: Surface water quality monitoring stations on West flowing s (2 of 2) ............... 61
Table No. 23 : Surface water quality monitoring stations monitoring at Nallahs along the Coastal Basin. ............................................................................................................................. 67
Table No. 24: Surface water quality monitoring stations monitoring Sea/Creek water (1 of 2) ...................................................................................................................................................... 73
Table No. 25: Surface water quality monitoring stations monitoring Sea/Creek water (2 of 2) ...................................................................................................................................................... 75
Table No. 26: Groundwater quality monitoring stations at Kalyan, Navi Mumbai, Raigad and Thane. .................................................................................................................................. 80
Table No. 27: Groundwaterquality monitoring stations at Amravati, Aurangabad and Nashik. ........................................................................................................................................ 81
Table No. 28: Groundwater quality monitoring stations at Chandrapur and Nagpur. .......... 82
Table No. 29: Groundwater quality monitoring stations at Kolhapur and Pune. .................... 84
Table No. 30: Water quality Index for surface and ground water monitoring at Amravati-RO – 2016-17 ................................................................................................................................... 157
Table No. 31: Water quality Index for surface and ground water monitoring at Aurangabad-RO – 2016-17 ............................................................................................................................. 159
Table No. 32: Water quality Index for surface and ground water monitoring at Chandrapur RO – 2016-17 ............................................................................................................................. 161
Table No. 33: Water quality Index for surface and ground water monitoring at Kalyan-RO – 2016-17 ...................................................................................................................................... 163
Table No. 34 Water quality Index for surface and ground water monitoring at Kolhapur-RO – 2016-17 ................................................................................................................................... 165
Table No. 35: Water quality Index for surface and ground water monitoring at Mumbai-RO – 2016-17 ...................................................................................................................................... 169
Table No. 36: Water quality Index for surface and ground water monitoring at Nagpur-RO – 2016-17 ...................................................................................................................................... 171
Table No. 37: Water quality Index for surface and ground water monitoring at Nashik -RO – 2016-17 ...................................................................................................................................... 175
Table No. 38: Water quality Index for surface and ground water monitoring at Navi Mumbai-RO – 2016-17 ............................................................................................................ 179
Table No. 39: Water quality Index for surface and ground water monitoring at Pune-RO – 2016-17 ...................................................................................................................................... 181
Table No. 40: Water quality Index for surface and ground water monitoring at Raigad RO – 2016-17 ...................................................................................................................................... 185
Table No. 41: Water quality index for surface and groundwater monitoring at Thane RO -2016-17 ...................................................................................................................................... 187

Water Quality Status of Maharashtra 2016-17
1
Executive Summary
Maharashtra Pollution Control Board (MPCB), being the state nodal agency under Central
Pollution Control Board (CPCB), regularly monitors the water quality across 294 WQMS
(Water Quality Monitoring Stations) for both surface (176 on rivers, 36 on sea/creeks, 12 on
drains, 4 dams) and ground water (29 Borewells, 35 Dugwell, 1 Handpump, 1 Tubewell)
under two programs of National Water Quality Monitoring Program (NWMP) and State
Water Quality Monitoring Program (SWMP). Surface water samples are monitored once
every month whereas the ground water samples are monitored bi-anually.
This report presents the statistical analysis of the data representing water quality monitored
in the year 2016-17, along with illustrations and spatial representations to have an overview
on the performance for quality of surface and ground water in the state. The report further
discusses the highlights on the annual and seasonal performance of the Water quality Index
(WQI) for major basins (Tapi, Godavari, Krishna, and West Flowing) as well as for the water
samples representing saline (sea/creek) and groundwater for general classification (Table
No. 1) The WQI has been determined based on the formula developed by National
Sanitation Foundation (NSF) and modified by CPCB1 (Table No. 1) which depicts the water
quality in simple and easy way for general public at large.
Table No. 1: Formula and classification of Water quality indices for surface and groundwater
Surface Water Quality Index Ground Water Quality Index
WQI =∑WiIi
p
i=1
WQI = ∑ 𝑞𝑖.𝑤𝑖𝑛=9𝑖=1
Where; Ii = sub index for water quality parameter Wi = weight (in terms of importance) associated with
water quality parameter P = number of water quality parameters
Where; qi = quality rating wi = relative of each weight
WQI Quality classification Remarks Colour code
Surface Water Quality
63 - 100 Good to Excellent Non Polluted
50 - 63 Medium to Good Non Polluted
38 - 50 Bad Polluted
38 and less Bad to Very Bad Heavily Polluted
Ground Water Quality
<50 Excellent Non Polluted
50-100 Good water Non Polluted
100-200 Poor Water Polluted
200-300 Very Very Poor Polluted
>300 Water Unsuitable for drinking Heavily Polluted
1 Maharashtra Pollution Control Board, Methodology for Data Interpretation

Water Quality Status of Maharashtra 2016-17
2
Surface Water Quality
In the year 2016-17, surface (rivers, sea, creek and nallahs) water quality was monitored at
about 228 locations (WQMS). The four major basins namely Tapi, Godavari, Krishna and
West flowing rivers were considered to categorize the rivers in respective basins and sub
basins (Table No. 2). Based on the annual average WQI for the 228 WQMS, it was recorded
that 127 WQMS were recorded to be in the ‘Good to Excellent’ category while 58 WQMS
were in ‘Medium to Good’ category. As for the polluted categories around 34 and 9 WQMS
were recorded in ‘Bad’ and ‘Bad to Very Bad’ categories respectively.
Table No. 2: Annual Average WQI for surface WQMS in various basins and sub basins
Basin Sub basins Name of Rivers Category wise No. of WQMS
G2E M2G B B2V Total
Tapi
Tapi Upper Tapi, Purna, Pedhi 4 1 5
Tapi Middle
Tapi, Girna, Rangavali, Amravati, Bori, Burai, Gomai, Hiwara, Kan, Mor, Panzara, Titur, Waghur,
15 15
Godavari 1
Godavari Upper
Godavari, Darna 20 20
Godavari Middle
Godavari, Bindusara 11 11
Manjra Godavari, Manjra 2 2
Godavari 2
Wardha Wardha, Penganga 3 9 12
Weinganga Kolar, Kanhan, Weinganga 9 2 3 1 15
Pranhita and others
Wainganga 1 1
Krishna
Bhima Upper
Bhima, Nira, Chandrabhaga, Mutha, Ghod, Indrayani,Pawana, Sina, Vel, Nalla, Mula-Mutha
7 12 18 37
Krishna Upper
Krishna, Panchganga, Koyna, Urmodi, Venna
15 6 21
West Flowing s
Kalu, Ulhas, Patalganga, Bhatsa, Vashishti, Mithi, Kundalika, Savitri, Amba, Kundalik, Muchkundi, Surya, Tansa, Vaitarna,
37 3 1 41
Nallah
Rabodi nalla, Colour Chem nalla, Sandoz nalla, BPT Navapur, Tarapur MIDC nalla, Pimpal-Paneri nalla
3 2 7 12
Saline 1 22 13 36
Total 127 58 34 9 228
Legend
G2E: Good to Excellent M2G: Medium to Good B: Bad B2V: Bad to Very bad
Water Quality Status of Maharashtra 2016-17
3
The quality of water is affected by various factors like rate of precipitation, flow rate of
water, high evaporation rate during the summers, sporadic pollution loads from various
anthropogenic activities and so on. Hence, there could be varied fluctuations in the quality
of water at the same monitoring location leading to seasonal and monthly variations. Thus
to eliminate this shortcoming an interbasin analysis for the occurrence and share of water
quality index across the basins has been developed without averaging any values.
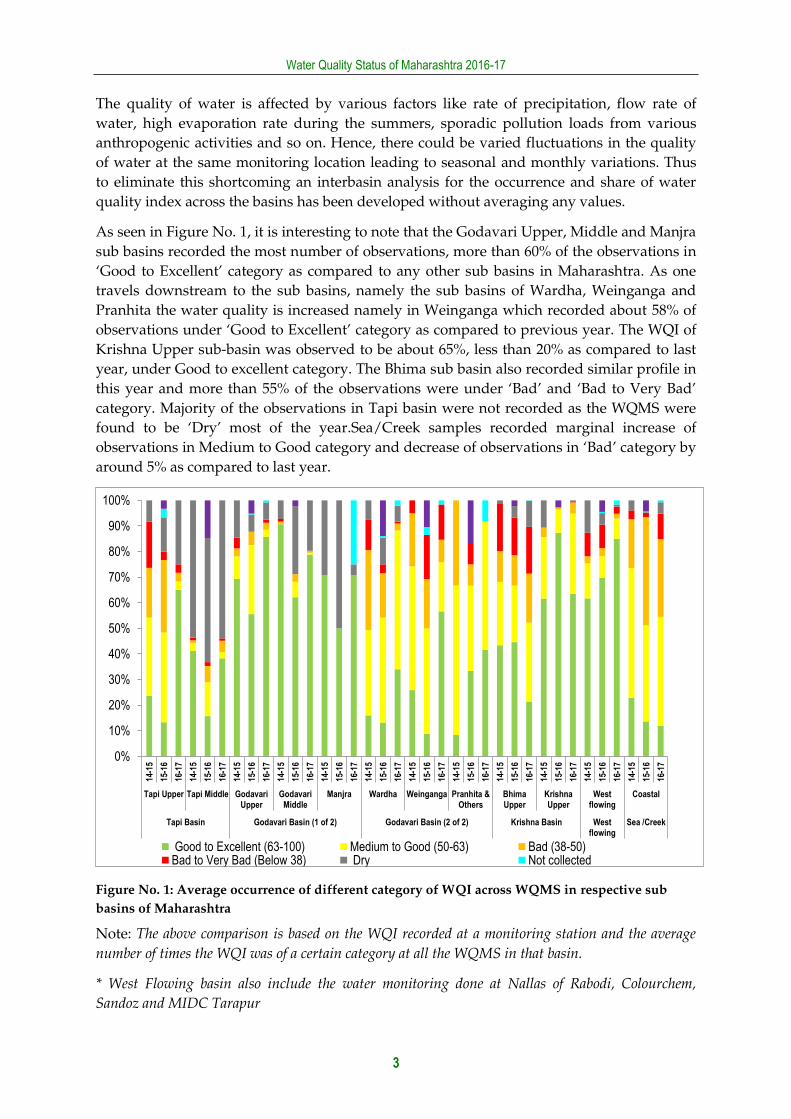
As seen in Figure No. 1, it is interesting to note that the Godavari Upper, Middle and Manjra
sub basins recorded the most number of observations, more than 60% of the observations in
‘Good to Excellent’ category as compared to any other sub basins in Maharashtra. As one
travels downstream to the sub basins, namely the sub basins of Wardha, Weinganga and
Pranhita the water quality is increased namely in Weinganga which recorded about 58% of
observations under ‘Good to Excellent’ category as compared to previous year. The WQI of
Krishna Upper sub-basin was observed to be about 65%, less than 20% as compared to last
year, under Good to excellent category. The Bhima sub basin also recorded similar profile in
this year and more than 55% of the observations were under ‘Bad’ and ‘Bad to Very Bad’
category. Majority of the observations in Tapi basin were not recorded as the WQMS were
found to be ‘Dry’ most of the year.Sea/Creek samples recorded marginal increase of
observations in Medium to Good category and decrease of observations in ‘Bad’ category by
around 5% as compared to last year.
Figure No. 1: Average occurrence of different category of WQI across WQMS in respective sub
basins of Maharashtra
Note: The above comparison is based on the WQI recorded at a monitoring station and the average
number of times the WQI was of a certain category at all the WQMS in that basin.
* West Flowing basin also include the water monitoring done at Nallas of Rabodi, Colourchem,
Sandoz and MIDC Tarapur
0%
10%
20%
30%
40%
50%
60%
70%
80%
90%
100%
14-1
5
15-1
6
16-1
7
14-1
5
15-1
6
16-1
7
14-1
5
15-1
6
16-1
7
14-1
5
15-1
6
16-1
7
14-1
5
15-1
6
16-1
7
14-1
5
15-1
6
16-1
7
14-1
5
15-1
6
16-1
7
14-1
5
15-1
6
16-1
7
14-1
5
15-1
6
16-1
7
14-1
5
15-1
6
16-1
7
14-1
5
15-1
6
16-1
7
14-1
5
15-1
6
16-1
7
Tapi Upper Tapi Middle GodavariUpper
GodavariMiddle
Manjra Wardha Weinganga Pranhita &Others
BhimaUpper
KrishnaUpper
Westflowing
Coastal
Tapi Basin Godavari Basin (1 of 2) Godavari Basin (2 of 2) Krishna Basin Westflowing
Sea /Creek
Good to Excellent (63-100) Medium to Good (50-63) Bad (38-50)Bad to Very Bad (Below 38) Dry Not collected

Water Quality Status of Maharashtra 2016-17
4
A spatial representation of the polluted locations, WQI<50 for more than 50% of the
observations, has been presented in Map No. 1 and the corresponding details of the WQMS
have been enlisted in Table No. 3. The disctricts of Mumbai, Thane, Pune, and Nagpur have
been detected to have polluted rivers.
In the year 2016-17, saline water quality was monitored at around 36 locations across the
720km long coastline of the state. In terms of the monitoring done for sea and creek water
along the coastline of the state, a majority of the WQMS are located in Mumbai (8), Mumbai
Suburban (2) and Thane (19) districts. The Raigad and Ratnagiri districts have 3 and 4
WQMS respectively while there is no WQMS in the Sindhudurg district.
Sea water samples from Mumbai and Thane were recorded to be polluted throughout the
year and the WQI at these locations was in the category of ‘Medium to Bad’. This could be
attributed to release of semi-treated sewage directly into the sea and creek water in Mumbai
and Thane.
Map No. 1: Spatial representation surface WQMS which recorded WQI as polluted for more than
50% of the observations

Water Quality Status of Maharashtra 2016-17
5
Table No. 3: WQMS which recorded WQI as polluted for more than 50% observations in 2016-17
Station
code
Water Body Station Name Village Taluka District
186 Nag River Nag River Near, Bhandewadi Bridge, Nagpur
Nagpur Nagpur Nagpur
187 Nag River Nag River Near, Asoli Bridge, Bhandara Road, Nagpur
Nagpur Nagpur Nagpur
188 Pill River Pill River Near, Wanjra Layout Kamptee Road, Nagpur
Nagpur Nagpur Nagpur
189 Pill River Pill River Near, Mankapur on Koradi Road, Nagpur
Nagpur Nagpur Nagpur
191 Sea Water Arabian Sea behind ONGC Uran
Uran Uran Raigad
1189 Bhima river Bhima river at Pune( Mutha river) at U/s of Vithalwadi near Sankar Mandir
Vithalwadi Haweli Pune
1190 Bhima river Bhima river at D/s of Bundgarden, Pune
Yerwada Haweli Pune
1192 Bhima river Bhima river at Daund near Mahadev temple
Daund Daund Pune
2165 Sea Sea Water at Gateway of India Colaba Colaba Mumbai
2166 Sea Sea Water at Charni Road Choupathy
Girgaon Mumbai Mumbai
2167 Sea Sea Water at Worli Seaface Worli Worli Mumbai
2168 Mithi river Mithi River at near bridge Mahim Bandra Mumbai
2169 Sea Sea Water at Varsova Beach Versova Andheri Mumbai
2191 Mutha river Mutha River at Sangam Bridge Near Ganpathi Ghat
Shivaji Nagar Pune Pune
2192 Mula-Mutha river
Mula-Mutha River at Mundhwa Bridge
Mundhawa Haweli Pune
2193 Mula river Mula River at Aundh Bridge -Aundgaon
Aundhgaon Haweli Pune
2194 Mula river Mula River at Harrison Bridge near Mula -Pawana Sangam
Bopodi Haweli Pune
2195 Nira river Nira River at D/s of Jubilant Organosis Pune
Nimbut Baramati Pune
2196 Pawana river
Pawana River at Sangavigaon, Pune
Sangavigaon Haweli Pune
2665 Ghod river Ghod River at Shirur, Pune Shirur Shirur Pune
2677 Mula-Mutha river
Mula-Mutha River at D/s of Theur, Pune
Theur Haweli Pune
2678 Mutha river Mutha River near Veer Savarkar Bhavan
Pune M.C Pune Pune
2679 Mutha river Mutha River at Deccan Bridge, Pune
Deccan Pune Pune
2690 Pawana river
Pawana River at Kasarwadi Pune
Kasarwadi Haweli Pune
2691 Pawana river
Pawana River at Dapodi Bridge at Pawana-Mulla Sangan Pune
Dapodi Haweli Pune
2693 Pawana river
Pawana River at Chinchwadgaon, Pune
Chinchwadgaon Haweli Pune
Water Quality Status of Maharashtra 2016-17
6
Station
code
Water Body Station Name Village Taluka District
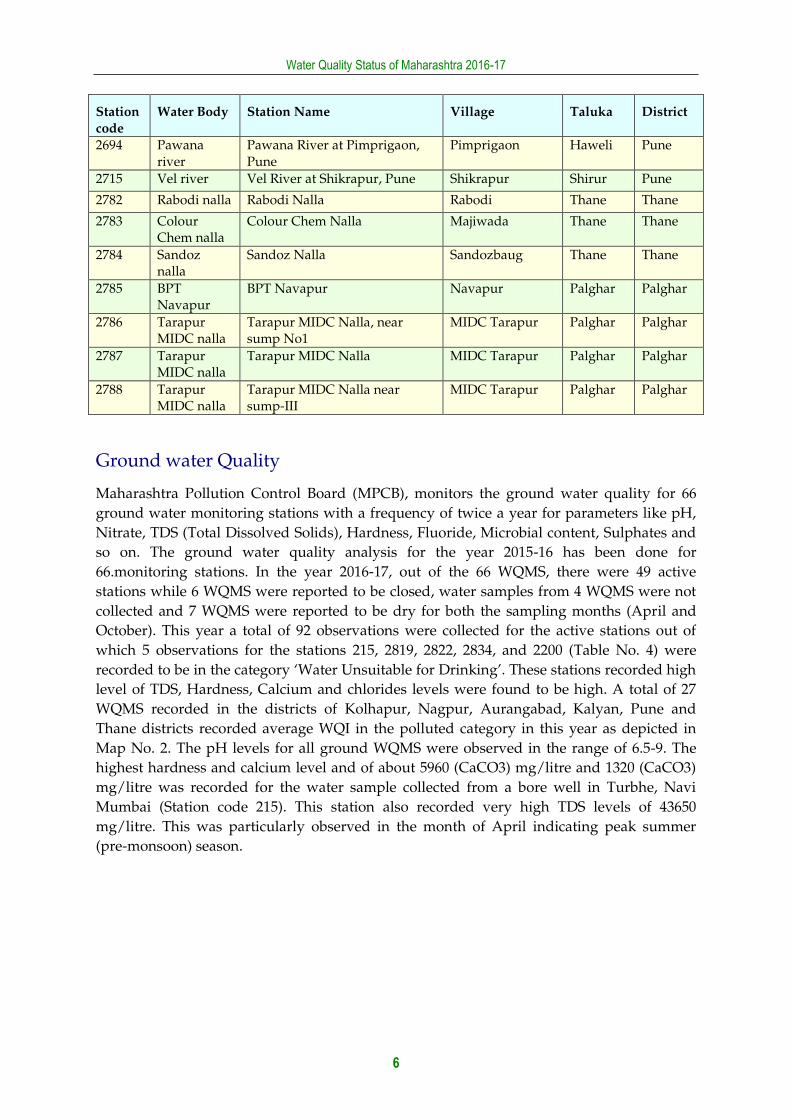
2694 Pawana river
Pawana River at Pimprigaon, Pune
Pimprigaon Haweli Pune
2715 Vel river Vel River at Shikrapur, Pune Shikrapur Shirur Pune
2782 Rabodi nalla Rabodi Nalla Rabodi Thane Thane
2783 Colour Chem nalla
Colour Chem Nalla Majiwada Thane Thane
2784 Sandoz nalla
Sandoz Nalla Sandozbaug Thane Thane
2785 BPT Navapur
BPT Navapur Navapur Palghar Palghar
2786 Tarapur MIDC nalla
Tarapur MIDC Nalla, near sump No1
MIDC Tarapur Palghar Palghar
2787 Tarapur MIDC nalla
Tarapur MIDC Nalla MIDC Tarapur Palghar Palghar
2788 Tarapur MIDC nalla
Tarapur MIDC Nalla near sump-III
MIDC Tarapur Palghar Palghar
Ground water Quality
Maharashtra Pollution Control Board (MPCB), monitors the ground water quality for 66
ground water monitoring stations with a frequency of twice a year for parameters like pH,
Nitrate, TDS (Total Dissolved Solids), Hardness, Fluoride, Microbial content, Sulphates and
so on. The ground water quality analysis for the year 2015-16 has been done for
66.monitoring stations. In the year 2016-17, out of the 66 WQMS, there were 49 active
stations while 6 WQMS were reported to be closed, water samples from 4 WQMS were not
collected and 7 WQMS were reported to be dry for both the sampling months (April and
October). This year a total of 92 observations were collected for the active stations out of
which 5 observations for the stations 215, 2819, 2822, 2834, and 2200 (Table No. 4) were
recorded to be in the category ‘Water Unsuitable for Drinking’. These stations recorded high
level of TDS, Hardness, Calcium and chlorides levels were found to be high. A total of 27
WQMS recorded in the districts of Kolhapur, Nagpur, Aurangabad, Kalyan, Pune and
Thane districts recorded average WQI in the polluted category in this year as depicted in
Map No. 2. The pH levels for all ground WQMS were observed in the range of 6.5-9. The
highest hardness and calcium level and of about 5960 (CaCO3) mg/litre and 1320 (CaCO3)
mg/litre was recorded for the water sample collected from a bore well in Turbhe, Navi
Mumbai (Station code 215). This station also recorded very high TDS levels of 43650
mg/litre. This was particularly observed in the month of April indicating peak summer
(pre-monsoon) season.

Water Quality Status of Maharashtra 2016-17
7
Table No. 4: List of WQMS which recorded WQI in ‘Water not suitable for drinking’
Station
ID
Regional
Office
Water
Body
Station Name Village Talu
ka
District
215 Navi Mumbai
Dug well
Well water at Turbhe Store, Turbhe
Turbhe Thane
Thane
2200 Aurangabad
Bore well
Bore Well at Katpur, Near Z.P.School
Katpur Paithan
Aurangabad
2818 Nashik Bore well
Bore Well at M/s. Spectron Ethers Rasegaon near Siddeshwar Mahadev Mandir
Rasegaon
Dindori
Nashik
2834 Kolhapur Dug well
Dug Well No.2 at Arketwadi Arketwadi
Khed Ratnagiri
2822 Pune Bore well
Bore Well near Chincholi Chincholi
Mohol
Solapur
Map No. 2: Spatial representation for average groundwater WQI
*Station No. 206, 218, 1984, 1990, 2000 and 2827 were non-functional in reporting year


Water Quality Status of Maharashtra 2016-17
9
Introduction
As per WHO, any change in the physical, chemical and biological properties of water that
has a harmful effect on living things is termed as water pollution2. Rapid growth of population, urbanization and industrialization exerts pressure on water resources and
unregulated or illegal discharge of effluents results in water pollution. Central Pollution
Control Board (CPCB) reports that, the major sources of water pollution in India are release of untreated sewage from urban centres, the release of industrial effluents and organic
runoffs from agricultural fields3. Along with human activities, various micro-biological
agents like bacteria, viruses and protozoa also cause water pollution which may cause various water-borne diseases like amoebiasis dysentery, typhoid, jaundice, cholera. Water
contaminated with heavy meatsls like arsenic, lead, cadmium can cause skin cancer,
anaemia, headache, suppression on immune system, softening of the bones and kidney
failure4,5,6. Physical deformaties such as hooked beaks in birds and thinning of egg shell can
occur in avifauna due to contaminated water.7
Growing demand for water in agriculture, industrial and domestic sectors has led to over-exploitation of the groundwater resource resulting in decline in groundwater levels.
Dumping of solid wastes is also an important factor resulting in deterioration of the
groundwater quality. About 90% of Municipal Solid waste is dumped on land. During rainfall, the surface water percolates from waste gets dissolve or leach out with harmful
chemicals through the soil and reaches the groundwater thus contaminating it. Dumping of
sewage into water bodies directly results in accumulation of toxic substances which not only affects the water quality by depleting of oxygen in the water affecting the aquatic life
resulting in algal bloom but affects the food chain of birds and animals8.
In order to provide prevention and control of water pollution, MoEF (Ministry of
Environment and Forests), Government of India, under a policy decision enacted The Water
(Prevention and Control of Pollution) Act in 1974. Under the Act, MoEF has established and
delegated the powers and functions to CPCB which in collaboration with State Pollution
Control Board (SPCB) has established a network of monitoring stations on rivers across the
country. Presently, water quality-monitoring network is operated under a three-tier
programme i.e. Global Environmental Monitoring System (GEMS), Monitoring of Indian
National Aquatic Resources System (MINARS) and Yamuna Action Plan (YAP). The water
samples are analysed for 9 core parameters and 19 general parameters, 10 trace metals
(Table No. 5).
GEMS
CPCB has been identified as the Government of India’s agency to carry out water quality
monitoring under the United Nation’s, Global Environment Monitoring System (GEMS)
Water Programme under World Health Organisation (WHO). The GEMS programme is
2 R.Gambhir, Water Pollution: Impact of Pollutants and New Promising Techniques in Purification Process 3 Central Pollution Control Board, Status of Sewage treatment plant in Ganga basin 4http://www.yourarticlelibrary.com/essay/water-pollution-effects-and-health-hazards-of-water-pollution/28280/ 5 http://www.who.int/mediacentre/factsheets/fs372/en/ 6 http://www.who.int/water_sanitation_health/dwq/chemicals/cadmium.pdf 7 A.Agrawal & R.Pandey, Water Pollution with Special Reference to Pesticide Contamination in India, 2010 8 N.Raman & D.Narayan, Impact of solid waste effect on groundwater and soil qualitynearer to Pallavaram solid waste landfill site in Chennai, 2008

Water Quality Status of Maharashtra 2016-17
10
dedicated to provide water quality data and information of the highest integrity,
accessibility and interoperability.
MINARS
A national programme titled Monitoring of Indian National Aquatic Resources (MINARS)
was started in 1984, with a total of 113 stations spread over 10 basins. Water samples are being analysed for 28 parameters consisting of physico-chemical and bacteriological
parameters for ambient water samples apart from field observations.
Table No. 5: List of parameters tested and analyzed by CPCB and SPCB
Sr
No Field observations Core parameters General parameters
Micropollutants
(Trace metals &
Pesticides)
1 Weather Temperature Turbidity Cadmium
2 Depth of Water Body Dissolved Oxygen Phenophthalein alkalinity Copper
3 Human activities pH Total Alkalinity Lead
4 Floating Matter (Visible Effluent discharge)
Conductivity Chlorides Chromium total
5 Color BOD COD Nickel
6 Odour Nitrate Total Kjeldahl-N Zinc
7
Nitrite Ammonia-N as N mg/l Iron
8
Fecal Coliform Hardness as CaCO3 Arsenic
9
Total coliform Calcium CaCO3 Mercury
10
Magnesium CaCO3
11
Sulphate
12
Sodium
13
Total dissolved solids
14
Total fixed solids
15
Total suspended solids
16
Phosphate
17
Boron
18
Potassium
19 Fluoride
Water Quality Monitoring in Maharashtra
As per provisions made by Water Quality Assessment Authority constituted under sub
sections (1) and (3) of section 3 of the Environment (Protection) Act, 1986 (Act No.29 of 1986)
water quality in Maharashtra is monitored by various agencies namely Hydrology Project
(SW), Groundwater Surveys & Development Agency (GSDA), CPCB, Maharashtra Pollution
Control Board (MPCB), Central Water Commission (CWC) and Central Ground Water
Board (CGWB). The water quality testing under the GEMS and MINARS program under
NWMP in Maharashtra is monitored by MPCB (state nodal agency). Maharashtra has
highest number of monitoring stations (250 WQMS) under NWMP across all the states in
India. MPCB has infrastructure to monitor 44 parameters covering field observations,
general parameters, core parameters and trace metals (Table No. 5) and the samples are
monitored with a monthly and six monthly frequency for surface and groundwater stations
respectively. In order to have contionous vigilance check on water quality across the state,
MPCB has installed WQMS (Water Quality Monitoring Stations) across the state. The
network of WQMS for year 2016-17 are represented in the Map No. 3 and Table No.6.

Water Quality Status of Maharashtra 2016-17
11
Table No. 6: Basin and water body typewise tally of WQMS in Maharashtra
Type Water bodies/Basin
Programme
NWMP SWMP Total
Coastal Godavari Krishna Tapi Coastal Godavari Krishna Tapi
Surface water
Rivers 34 48 53 20 6 11 4
176
Creek 19
1
20
Dam 1
1 2
4
Nalla 8 1 1
2 12
Sea 15
1
16
Groundwater
Dug well 6 12 5 1 7 3 1 0 35
Bore well 5 8 10 1 3 2 0 0 29
Tube well
1
1
Hand pump
1
1
Grand Total 88 70 69 23 19 18 5 2 294
Source: Maharashtra Pollution Control Board
Map No. 3: Spatial representation of network of WQMS monitored by MPCB across Maharashtra
2016-17
Water quality is monitored per month across all the stations. The spatial presence of the
stations is presented basin wise in the respective sections. Basin wise water quality index is
presented in this section for the basins of Krishna, Godvari, Tapi and West flowing. Annex I presents the illustrations of the parameters pH, DO, BOD and FC recorded across the 228
surface water quality monitoring stations of MPCB in a lucid format.
Water Quality Status of Maharashtra 2016-17
12

Water Quality Status of Maharashtra 2016-17
13
Methodology and Calculation
The comprehensive data sets recorded by WQMS across the state were organised basin wise
for evaluation for both surface and groundwater quality. The water monitoring stations were further arranged from upstream to downstream in order to study basin wise trend of
water quality. The classification of the various rivers, their basins and subbasins considered
in this report is presented in Table No. 7. The Water quality index is determined by calculating the basic parameters like pH, BOD (mg/l), DO (mg/l to %) and FC
(MPN/100ml). The WQI has been calculated separately for surface water and groundwater
water samples using the formula provided by National Sanitation Foundation (NSF) and the relative weights modified by CPCB. To present the data in a spatial format GIS
(Geographical Information System) maps were generated.
Table No. 7: Classification of the rivers considered under basins and sub basins in the report
Basin Sub basins Name of rivers Number of WQM stations
Tapi
Tapi Upper Tapi, Purna, Pedhi 8
Tapi Middle
Tapi, Girna, Rangavali, Amravati, Bori, Burai, Gomai, Hiwara, Kan, Mor, Panzara, Titur, Waghur, Waghur
17
Godavari 1
Godavari Upper Godavari, Chikhali nalla, Darna
28
Godavari Middle Godavari, Bindusara 14
Manjra Godavari, Manjra 2
Godavari 2
Wardha Wardha, Penganga 17
Weinganga Kolar, Kanhan, Wainganga 26
Pranhita and others
Wainganga 1
Krishna
Bhima Upper
Bhima, Nira, Chandrabhaga, Mutha, Ghod, Indrayani, Pawana, Sina, Vel, Nalla, Mula-Mutha
45
Krishna Upper Krishna, Panchganga, Koyna, Urmodi, Venna
29
West Flowing rivers
Kalu, Ulhas, Patalganga, Bhatsa, Vashishti, Mithi, Kundalika, Savitri, Amba, Kundalik, Muchkundi, Surya, Tansa, Vaitarna, Rabodi nalla, Colour Chem nalla, Sandoz nalla, BPT Navapur, Tarapur MIDC nalla, Pimpal-Paneri nalla
71
Saline 36
Total 294

Water Quality Status of Maharashtra 2016-17
14
Spatial Maps
Sub -basin level maps
Of the 5 major basin, Narmada basin comprises of just 0.5%9 of the total area. Hence, it was
included in the Tapi basin for ease and convenience, while the remaining WQMS were
divided into the remaining four basins. Since the basins are huge and have many WQMS within them, the sub basin level map was generated as per data and demarcation published
by CGWB10 (Central Ground Water Board), Ministry of Water Resources Government of
India. The imageries, for the basins of Tapi, Krishna and Godavari, were downloaded and upon geo-referencing those, the maps were digitized on GIS platform to generate shape
(.shp) files.
MPCB Regional Office (RO) maps
Maps depicting the jurisdiction of the regional offices of MPCB, superimposed with district
boundaries have been generated as part of this report. The peak season water quality index
for the stations in each RO have been compiled for the necessary action by the respective
RO’s of MPCB.
Organizing and presentation of the data sets The data sets for water quality parameters like temperature, dissolved oxygen, pH,
conductivity, BOD, COD, and Fecal Coliform and so on were shared by MPCB in soft copy
for the years 2008 to 2012. The data sets were organised in spread sheets for further analysis
and illustrative presentation. Stock graphs have been generated to depict the minimum,
maximum, 25th and 75th percentile values along with the mean values observed for
parameters namely pH, BOD, DO and FC. The standard deviation (SD) values were
calculated and have been presented along with the data sets in the spread sheets.
Water Quality Index A water quality index provides a single number (like a grade) that expresses overall water
quality of a certain water sample (location and time specific) for several water quality
parameters. The objective of developing an index is to simplify the complex water quality
parametric data into comprehensive information for easy understanding. A water index
based on important parameters provides a simple indicator of water quality and a general
idea on the possible problems with the water in the region.
In 1970, the National Sanitation Foundation, USA developed the Water Quality Index
(NSFWQI), a standardized method for comparing the water quality of various water bodies.
NSFWQI is one of the most respected and utilized water quality index in the United States.
Nine water quality parameters selected for calculating the index included
9 Maharashtra Water Resources Regulatory Authority, http://www.mwrra.org/introduction.php?link=wr 10 Central Ground Water Board, http://cgwb.gov.in/watershed/list-ws.html

Water Quality Status of Maharashtra 2016-17
15
Dissolved Oxygen (DO)
Faecal Coliform (FC)
pH
Biochemical Oxygen Demand (BOD) (5-day)
Temperature change (from 1 mile upstream)
Total phosphate
Nitrate
Turbidity
Total Solids
The expression for calculation the NSFWQI is expressed as;
NSFWQI =∑WiIi
p
i=1
Where;
Ii= sub index for ith water quality parameter
Wi= weight (in terms of importance) associated with water quality parameter
P= number of water quality parameters
WQI for surface water
Given the parameters monitored in India under the NWMP and to maintain the uniformity
while comparing the WQI across the nation, the NSF WQI has been modified and relative weights been assigned by CPCB. The modified weights as per CPCB are given in Table No. 8
and the equations used to determine the sub index values are given Table No. 9. Upon
determining the Water Quality Index, the water quality is described for easy understanding and interpretation. The description used in the report for classifying and the describing the
water quality is presented in Table No. 10.
Table No. 8: Modified weights for computation of WQI based on DO, FC, pH and BOD
Parameters Original Weights from NSF WQI
Modified Weights by CPCB
Dissolved Oxygen (DO) 0.17 0.31
Fecal Coliform (FC) 0.15 0.28
pH 0.12 0.22
BOD 0.1 0.19
Total 0.54 1

Water Quality Status of Maharashtra 2016-17
16
Table No. 9: Sub index equation used to calculate NSF WQI for DO, FC, pH and BOD
Water Quality Parameters (units)
Range Applicable Equation
Dissolved Oxygen (DO)(% Saturation)
0-40 0.18 + 0.66 X % Saturation DO
40-100 (-13.55) + 1.17 X % Saturation DO
100-140 163.34 - 0.62 X % Saturation DO
Fecal Coliform (FC) (counts/100 ml)
1 - 103 97.2 - 26.6 X log FC
103 - 105 42.33 - 7.75 X log FC
>105 2
pH 02 - 05 16.1 + 7.35 X (pH)
05 - 7.3 (-142.67) + 33.5 X (pH)
7.3 - 10 316.96 - 29.85 X (pH)
10 – 12 96.17 - 8.0 X (pH)
<2, >12 0
BOD (mg/l) 0 – 10 96.67 - 7 X (BOD)
10 – 30 38.9 - 1.23 X (BOD
>30 2
Table No. 10: Water Quality Classification and Best Designated use
WQI Quality
classification
Class by
CPCB
Class by
MPCB
Remarks Colour code
63 - 100 Good to
Excellent
A A-I Non Polluted
50 - 63 Medium to
Good
B Not
Prescribed
Non Polluted
38 - 50 Bad C A-II Polluted
38 and
less
Bad to Very
Bad
D, E A-III, A-IV Heavily Polluted
Water Quality Status of Maharashtra 2016-17
17
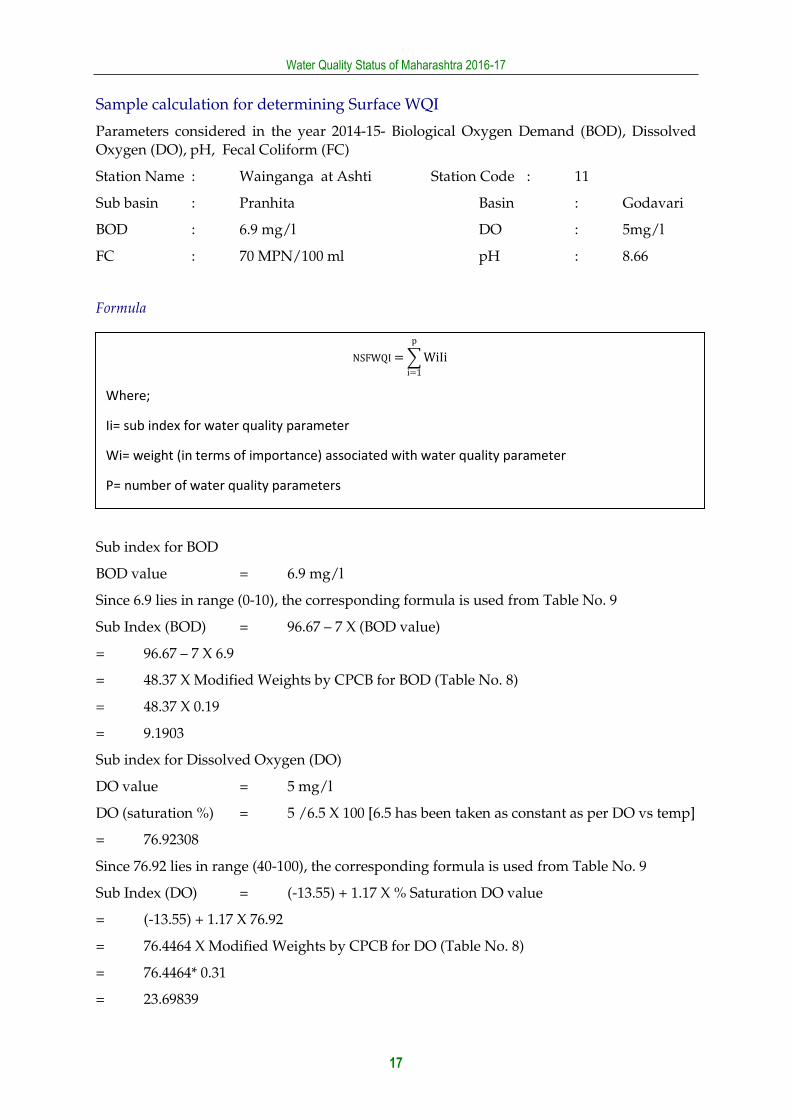
Sample calculation for determining Surface WQI
Parameters considered in the year 2014-15- Biological Oxygen Demand (BOD), Dissolved Oxygen (DO), pH, Fecal Coliform (FC)
Station Name : Wainganga at Ashti Station Code : 11
Sub basin : Pranhita Basin : Godavari
BOD : 6.9 mg/l DO : 5mg/l
FC : 70 MPN/100 ml pH : 8.66
Formula
Sub index for BOD
BOD value = 6.9 mg/l
Since 6.9 lies in range (0-10), the corresponding formula is used from Table No. 9
Sub Index (BOD) = 96.67 – 7 X (BOD value)
= 96.67 – 7 X 6.9
= 48.37 X Modified Weights by CPCB for BOD (Table No. 8)
= 48.37 X 0.19
= 9.1903
Sub index for Dissolved Oxygen (DO)
DO value = 5 mg/l
DO (saturation %) = 5 /6.5 X 100 [6.5 has been taken as constant as per DO vs temp]
= 76.92308
Since 76.92 lies in range (40-100), the corresponding formula is used from Table No. 9
Sub Index (DO) = (-13.55) + 1.17 X % Saturation DO value
= (-13.55) + 1.17 X 76.92
= 76.4464 X Modified Weights by CPCB for DO (Table No. 8)
= 76.4464* 0.31
= 23.69839
NSFWQI=∑WiIi
p
i=1
Where;
Ii= sub index for water quality parameter
Wi= weight (in terms of importance) associated with water quality parameter
P= number of water quality parameters

Water Quality Status of Maharashtra 2016-17
18
Sub index for Fecal Coliform (FC)
Fecal Coliform value = 70 MPN/100ml
Since 70 lies in range (0-103), the corresponding formula is used from Table No. 9
Sub Index (FC) = 97.2 - 26.6 X log FC
= 97.2-26.6 X log 70
= 48.12039 X Modified Weights by CPCB for FC (Table No. 8)
= 48.12039 X 0.28
= 13.47371
Sub Index for pH
pH value = 8.66
Since 8.6 lies in range (7.3-10), the corresponding formula is used from Table No. 9
Sub Index (pH) = 316.96 - 29.85 X (pH)
= 316.96-29.85 X 8.66
= 58.459 X Modified Weights by CPCB for pH (Table No. 8)
= 58.459 X 0.22
= 12.86098
WQI of Wainganga at Ashti
WQI = ∑ (sub –index of all parameters)
= ∑ (9.1903+23.69839+13.47371+12.86098)
= 59
Quality Classification: Medium to Good

Water Quality Status of Maharashtra 2016-17
19
WQI for groundwater
MPCB monitors ground water quality for parameters like pH, total hardness, Calcium, Magnesium, Chloride, total dissolved solids, Fluoride, Manganese, Nitrate, Sulphates and so
on once in six months. Based on the stringency of the parameters and its relative importance
in the overall quality of water for drinking purposes each parameter has been assigned specific weightage11. The relative weights of the same have been determined (
Table No. 11) for the parameters monitored and recorded by MPCB for the water samples
monitored in the year 2014-15.These weights indicate the relative harmfulness when present in water. The maximum weight assigned is 5 and minimum is 1.
Table No. 11: Relative Weight of chemical parameters used for calculating WQI for Ground water
Chemical
Parameters
Indian Standards for
Drinking Water Quality12 Weight (Wi)
Acceptable
Limit
Permissible
Limits Weight
Relative
Weight
Weight w/o
Iron,
Manganese
and
Bicarbonate
Relative
Weight
w/o Iron,
Manganese
and
Bicarbonate
pH 6.5-8.5 No relaxation 4 0.09756 4 0.13333
Total Hardness (TH)
300 600 2 0.04878 2 0.06667
Calcium 75 200 2 0.04878 2 0.06667
Magnesium 30 No relaxation 2 0.04878 2 0.06667
Bicarbonate 244 732 3 0.07317 - -
Chloride 250 1000 3 0.07317 3 0.10000
Total Dissolved Solids (TDS)
500 2000 4 0.09756 4 0.13333
Fluoride 1 1.5 4 0.09756 4 0.13333
Manganese 0.1 0.3 4 0.09756 - -
Nitrate 45 No relaxation 5 0.12195 5 0.16667
Iron 0.3 No relaxation 4 0.09756 - -
Sulphate 200 400 4 0.09756 4 0.13333
41 1 30 1
Source: BIS 10500 and CPCB 2001
11 C. R. Ramakrishnaiah, Assessment of Water Quality Index for the Groundwater , E-Journal of Chemistry, 2009, 6(2), 523-530; ISSN: 0973-4945 12 Bureau of Indian Standards, Draft Indian Standard Drinking Water – Specification; Second Revision of IS 10500, ICS No. 13.060.20

Water Quality Status of Maharashtra 2016-17
20
The maximum weight of 5 has been assigned to the parameter nitrate due to its major importance in water
quality while, magnesium is given the minimum weight of 1 as may notbe harmful.
The relative weight is then computed from the following equation
𝑊𝑖 =𝑤𝑖
∑ 𝑤𝑖𝑛𝑖=1
Where;
Wi = the relative weight
wi = the weight of each parameter
n = number of parameters
In the next step a quality rating scale (qi) for each parameter is assigned by dividing its
concentration in each water sample by its respective standard according to the guidelines published by BIS (Bureau of Indian Standards) and the result thus obtained is multiplied by
100.
qi= (Ci/Si) x 100
Where;
Qi = quality rating
Ci = the concentration of each chemical parameter in each water sample in mg/L
Si = the Indian drinking water standard for each chemical parameter in mg/L
according to the guidelines of the BIS 10500, (2004-2005).
Based on the absolute value of the index determined from the calculations, water quality is
classified as presented below in Table No. 12.
Table No. 12: Groundwater classification based on the Water Quality Index
WQI Value Water Quality Colour code used in this report
<50 Excellent
50-100 Good water
100-200 Poor Water
200-300 Very Very Poor water
>300 Water Unsuitable for drinking

Water Quality Status of Maharashtra 2016-17
21
Sample Calculation for determining Ground WQI
Station name : Bore well at Parvati Industrial Estate, Yadrav, Kolhapur
Station code : 2004 Sub basin : Krishna Upper Basin : Krishna
Calcium : 235 mg/l Chlorides : 473 mg/l Fluoride: BDL
Magnesium : 925 mg/l Nitrate : 0.62 mg/l Sulphate: 278.5 mg/l
pH : 6.9 TDS : 2166 mg/l TH : 1160 mg/l
Formula
Parameters considered for groundwater monitoring: pH, Total hardness, Calcium, Magnesium, Chloride, Total Dissolved Solids, Fluoride and Sulphate.
*The relative weight (wi) without iron, manganese and Bicarbonate has been considered in
calculation.
Sub Index for pH
pH = 6.9
Sub index (pH) = Concentration /Standard X 100
= 6.9/7.5 X 100
= 92 X relative weight (Table No. 11)
= 92 X 0.13333
= 12.26636
Sub index for Total hardness
Total hardness = 1160
Sub index (TH) = Concentration /Standard X 100
= 1160/ 300*100
WQI = ∑ 𝑞𝑖. 𝑤𝑖𝑛=9𝑖=1
Where;
Wi = relative weight
qi = quality rating
wi = relative of each weight
qi= (Ci/Si) X 100
Where;
Ci = the concentration of each chemical parameter in each water sample in mg/l
Si = the Indian drinking water standard for each chemical parameter in mg/l
according to the guidelines of the BIS 10500, (2004-2005)

Water Quality Status of Maharashtra 2016-17
22
= 386.6667 X relative weight (Table No. 11)
= 386.667 X 0.06667
= 25.77907
Sub index Calcium
Calcium = 235
Sub index (Calcium) = Concentration /Standard *100
= 235/ 75 X 100
= 313.3333 X relative weight (Table No. 11)
= 313.3333 X 0.0666
= 20.88993
Sub index for Chloride
Chloride = 473
Sub index (Chloride) = Concentration /Standard X 100
= 473/ 250 X 100
= 189.2 X relative weight (Table No. 11)
= 189.2 X 0.1
= 18.92
Sub index for Fluoride
Fluoride = 0
Sub index (Fluoride) = Concentration /Standard X 100
= 0/ 1 X 100
= 0 X relative weight (Table No. 11)
= 0 X 0.1333
= 0
Sub index for Magnesium
Magnesium = 925
Sub index (Mg) = Concentration/ Standard X 100
= 925/ 30*100
= 3083.333 X relative weight (Table No. 11)
= 3083.333 X 0.06667
= 205.5658
Sub index for Nitrate
Nitrate = 0.62
Sub index (Nitrate) = Concentration/ Standard X 100
= 0.62/45 *100

Water Quality Status of Maharashtra 2016-17
23
= 1.377778 X relative weight (Table No. 11)
= 1.377778 X 0.16667
= 0.229634
Sub index for Sulphate
Sulphate = 278.5
Sub index (Sulphate) = Concentration/ Standard X 100
= 278.5/ 200 X 100
= 139.25 X relative weight (Table No. 11)
= 139.25 X 0.13333
= 18.5662
Total Dissolved Solids
Total Dissolved Solids= 2166
Sub index (TDS) = Concentration/ Standard X 100
= 2166/ 500 X 100
= 433.2 X relative weight (Table No. 11)
= 433.2 X 0.13333
= 57.75856
WQI of Bore well at Parvati Industrial Estate, Yadrav, Kolhapur
WQI = ∑ (sub –index of all parameters)
= ∑ (12.26636 + 25.77907 + 20.88993+ 18.92 + 0+ 205.5658 + 0.229634+ 18.5662 + 57.75856)
= 360
Quality Classification: Water Unsuitable for drinking
CAGR: Compound Annual Growth Rate
Compound Annual Growth Rate= ((End value/Start value) ^ (1/Number of intervals) )- 1
Number of intervals = (Number of observations)-1 *100
Sample Calculation for determining CAGR
Example Station code: 1317
WQI
(End value) : 48; WQI of 2007-
CAGR % = ((End value/Start Value) ^1/Number of intervals)) - 1 X 100
= ((48/57) ^ (1/8)-1 *100
= -2.29%
=Quality Deteriorated


Water Quality Status of Maharashtra 2016-17
25
Inter Basin Analysis
Tapi Basin
In Maharashtra, the Tapi Basin could be divided into two sub-basins Tapi Upper and Tapi Middle and there are a total of 22 surface water monitoring stations (5 on upper and 15 on
middle) in Tapi basin in Maharashtra.
As seen in Figure No. 2, the interbasin anlaysis for Tapi Basin, one may observe that The occurrence of “Medium to Good” and “Bad” categories of WQI are more than double in the
Tapi Upper compared to Tapi Middle indicating that the water quality in Tapi Upper is
better compared to Tapi Middle. In the year 2016-17 more than 50% & 35% of observations of readings were recorded Dry in Tapi Middle and Tapi Upper respectively.
Figure No. 2: Trend of average occurrence for different category of WQI in Tapi basin
0%
10%
20%
30%
40%
50%
60%
70%
80%
90%
100%
07-0
8
08-0
9
09-1
0
10-1
1
11-1
2
12-1
3
13-1
4
14-1
5
15-1
6
16-1
7
07-0
8
08-0
9
09-1
0
10-1
1
11-1
2
12-1
3
13-1
4
14-1
5
15-1
6
16-1
7Tapi Upper Tapi Middle
Tapi Basin
Good to Excellent (63-100) Medium to Good (50-63) Bad (38-50)
Bad to Very Bad (Below 38) Dry Not collected
No data

Water Quality Status of Maharashtra 2016-17
26
Water Quality Index for WQMS in Tapi Basin
Apr
49
69 85
81 87
May
49
74 91
88 87
Jun
71
76 87
88 81
Jul 71 73 70 79 75
80 86
Aug 68 70 69 68 92 78 81 91 72 70 90 87 63 66 76 89
Sep 76 75 66 75 87 90 89 87 89 90 88 88 89 90 87
Oct 65 66 69 75 83 86 88 91 88 89 86 83 87 91 90 90 85 87 81
Nov
52 77 77 91 91 79 91 88 86 91 88 89 91 90 91
Dec
69
72 92
91 92 91 90 90 88
Jan
36
35 92
91 89 90 89 86
Feb
68
70 62
61 61 72
Mar
69
73 90
88 82
Station
code 2700 2695 2155 1913 1313 2718 2710 1251 1252 1253 1314 1907 2652 2658 2659 2666 2667 2670 2674 2684
Sub basin Tapi Upper Tapi Middle
Basin Tapi
Good to Excellent Medium to good Bad Bad to Very Bed Dry Not collected

Water Quality Status of Maharashtra 2016-17
27
Table No. 13: Surface water quality monitoring stations in Tapi basin
Prog Station
code River/Nalla Station Name Village Taluka District
NWMP 2700 Purna river Purna River near Achalpur-Amravati Road Bridge, Asegaon Asegaon Chandur bazaar
Amravati
NWMP 2695 Pedhi river Pedhi River near Road Bridge at Dadhi-Pedhi village Asegaon Chandur Bazar
Amravati
NWMP 2155 Purna river Purna River at D/s of confluence of Morna & Purna at Andhura village
Andura Balapur Akola
NWMP 1913 Purna river Purna River at Dhupeshwar at U/s of Malkapur Water works Malkapur Akola Akola
NWMP 1313 Tapi river Tapi River at Ajnad Ajnad Raver Jalgaon
NWMP 2718 Waghur river Waghur River at Sakegaon before Confluence with Tapi River Sakegaon Jalgaon Jalgaon
NWMP 2710 Titur river Titur River D/s of Chalisgaon Chalisgaon Jalgaon Jalgaon
NWMP 1251 Tapi river Tapi River at Bhusawal Bhusawal Railway Colony
Bhusawal Jalgaon
NWMP 1252 Girna river Girna river at Jalgaon at intake of Girna pump house Girna pump house area
Jalgaon Jalgaon
NWMP 1253 Girna river Girna river at Malegaon at Malegaon road bridge Malegaon Malegaon Nashik
NWMP 1314 Tapi river Tapi river at Ubad village near Gujrat border Ubad Shahada Nandurbar
NWMP 1907 Rangavali river Rangavali river at D/s of Navapur near Rangavali bridge Navapur Navapur Nandurbar
NWMP 2652 Amravati river Amravati River D/s of Dondaicha Dondaicha Dhule Dhule
NWMP 2658 Bori river Bori River D/s of Amalner Amalner Jalgaon Jalgaon
NWMP 2659 Burai river Burai River before confluece to Tapi River Mukudas Dhule Dhule
NWMP 2666 Gomai river Gomai River D/s of Shahada Shahada Dhule Dhule
NWMP 2667 Hiwara river Hiwara River D/s of Pachora Pachora Jalgaon Jalgaon
NWMP 2670 Kan river Kan River near Sakri water works Sakri Dhule Dhule
NWMP 2674 Mor river Mor River near Padalshe Padalashe Jalgaon Jalgaon
NWMP 2684 Panzara river Panzara River near Panzarakan SSK Ltd Panzare Dhule Dhule

Water Quality Status of Maharashtra 2016-17
28
Spatial map of Surface WQI at Tapi Basin (April -2016)

Water Quality Status of Maharashtra 2016-17
29
Spatial map of Surface WQI at Tapi Basin (December-2016)


Water Quality Status of Maharashtra 2016-17
31
Godavari Basin (1 of 2): Godavari upper, Godavari Middle
and Manjra Sub basin
The Godavari basin passes through six states (third largest basin in India) and drains about 10% of the total geographical area of the country13. Approximately 50 percent of the
catchment area comes under the state of Maharashtra. In Maharashtra the Godavari Basin
could be divided into six sub-basins Godavari Upper, Godavari Middle, Manjra, Wardha, Weinganga, Indravati and Pranhita. In this report for the ease of analysis the sub-basins
have been categorized into two, Godavari 1 Basin covering Upper, middle and Manjra sub-
basin and Godavari 2 basin covering Wardha, Weinganga, Indravati and Pranhita. The highlights of both the basins have been discussed in two separate sections below.
In basin 1 there are a total of 34 surface water monitoring stations (21 on upper, 11 on
middle and 2 on Manjra). The list of the station and the codes has been provided below in Table No. 14 and Table No. 15. The intra basin performance of Godavari (1 of 2) is depicted
in Figure No. 3. The majority of observations (60%) for the year 2016-17 within Godavari
Basin (1 of 2) were recorded under ‘Good to Excellent’ category. The maximum occurrence of’Moderate to Good’ category of WQI was recorded in Godavari Upper as compared to
Godavari Middle and Manjra. About 2-3 % of observations were recorded under ‘Bad’
category in Godavari Upper. Thus water pollution in Godavari Upper is more as compared to other subbasins (Godavari middle and Manjra) of Godavari sub basin.Manjra recorded
35% of observations are under ‘Not collected’ category while 5% under ‘Dry’ category.
Similarly 20% of observations were for Godavari middle and 5% observations for Godavari Upper Sub basin.
Figure No. 3: Trend of average occurrence for different category of WQI in Godavari basin (1 of 2)
13 http://www.kgbo-cwc.ap.nic.in/About%20Basins/About%20Godavari%20Basin.pdf
0%
10%
20%
30%
40%
50%
60%
70%
80%
90%
100%
07-0
8
08-0
9
09-1
0
10-1
1
11-1
2
12-1
3
13-1
4
14-1
5
15-1
6
16-1
7
07-0
8
08-0
9
09-1
0
10-1
1
11-1
2
12-1
3
13-1
4
14-1
5
15-1
6
16-1
7
07-0
8
08-0
9
09-1
0
10-1
1
11-1
2
12-1
3
13-1
4
14-1
5
15-1
6
16-1
7
Godavari Upper Godavari Middle Manjra
Godavari Basin (1 of 2)
Good to Excellent (63-100) Medium to Good (50-63) Bad (38-50)Bad to Very Bad (Below 38) Dry Not collectedNo data

Water Quality Status of Maharashtra 2016-17
32
Water Quality Index for WQMS in Godavari Basin (1 of 2): Sub-Basin - Godavari Upper
Apr
80 77 80 91 81 75 66 83 77 70 89 93 85 90 89 89 87 92 89
May
81 72 82
90 84
83 90 78 89 85 90 90 90 91 87
Jun
81 76 80 83 88 82
82 87 90 92 86 89 90 89 78 81
Jul
82 60 84 84 80 78 83 86 82 78 69 78 86 91 92 90 89 89
Aug 85 86 42 83 88 88 87 78 86 85 92 88 93 88 90 89 86 86 90 90
Sep 84
85 85 90 89 88 87 87 92 89 87 88 90 88 88 89 91 90 87
Oct 76 72 78 78 91 90 90 91 86 86 90 92 90 91 86 90 90 90 91
Nov 82 61 64 77 89 91 83 78 87 86 79 85 85 87 89 89 86 86 83 83
Dec 84 60 65 81 92 92 65 80 86 88 89 82 83 89 92 92 90 92 91 89
Jan 83 56 38 78 89 88 91 92 82 88 85 73 92 86 87 90 88 82 90 89
Feb 83 35 35 80 86 87 54 57 85 43 32 43 42 85 85 90 88 87 88 91
Mar
41 83 83 86 84 88 86 86 87 83 85 86 87 87 87 87 70 87
Station
code 178 180 181 184 194 1095 1096 1211 2160 2177 2179 2180 2181 2182 2183 2660 2661 2662 2663 2664
Sub basin Godavari Upper
Basin Godavari
Good to Excellent Medium to good Bad Bad to Very Bed Dry Not collected

Water Quality Status of Maharashtra 2016-17
33
Table No. 14: Surface water quality monitoring stations in Godavari Basin (1 of 2)
Progra
m
Statio
n
code
River/Nalla Station Name Village Taluka District
SWMP 178 Shivna River Kannad - D/S of Kannad near Bridge Kannad Kannad Aurangabad
SWMP 180 Kham River Aurangabad - Near Holly cross bridge Aurangabad Aurangabad Aurangabad
SWMP 181 Kham River Aurangabad - Near Patoda Village Aurangabad Aurangabad Aurangabad
SWMP 184 Harsool Dam Aurangabad - Harsool Dam Aurangabad Aurangabad Aurangabad
SWMP 194 Kadwa River Kadwa River at Awankhed Village, Taluka - Dindori, District - Nashik
Awankhed Village Dindori Nashik
NWMP 1095 Godavari river Godavari River at U/s of Gangapur Dam Gangapur Nashik Nashik
NWMP 1096 Godavari river Godavari River at Panchavati at Ramkund Panchavati Nashik Nashik
NWMP 1211 Godavari river Godavari River at Nashik D/s of near Amardham Gadgebaba Maharaj Nagar
Nashik Nashik
NWMP 2160 Godavari river Godavari River at U/s of Aurangabad Reservoir Kaigaon Tokka near, Kaigaon Bridge
Kaigaon Gangapur Aurangabad
NWMP 2177 Godavari river Godavari River near Someshwar Temple Someshwar Nashik Nashik
NWMP 2179 Godavari river Godavari River at Hanuman Ghat Nashik city Nashik Nashik
NWMP 2180 Godavari river Godavari River at near Tapovan Tapovan Nashik Nashik
NWMP 2181 Godavari river Godavari River at Kapila -Godavari confluence point Tapovan Nashik Nashik
NWMP 2182 Godavari river Godavari River at Saikheda Saikheda Niphad Nashik
NWMP 2183 Godavari river Godavari River at Nandur-Madhameshwar Dam Nandur Niphad Nashik
NWMP 2660 Darna river Darna River at Chehedi pumping station Chehedi Nashik Nashik
NWMP 2661 Darna river Darna River at Aswali (Darna Dam) Aswali Igatpuri Nashik
NWMP 2662 Darna river Darna River at MES site Pumping station Bhagur Nashik Nashik
NWMP 2663 Darna river Darna River at Bhagur Pumping station near Pandhurli Bridge Bhagur Nashik Nashik
NWMP 2664 Darna river Darna River at Sansari Sansari Nashik Nashik

Water Quality Status of Maharashtra 2016-17
34
Water Quality Index for WQMS in Godavari Basin (1 of 2): Sub-Basin - Godavari Middle and Manjra
Apr 78 82 80 81 83 83 84 80
May 69 80 82 85 86 81 82 80
Jun 79 80 80 83 79 79 79
Jul
83 86 81 83 83 75 80
Aug
82 81 81 83 85 88 86 89 86 87
Sep 85 84 81 86 88 85 78 86 88 84 87
Oct 51 82 63 69 82 84 93 88 88 84 80 80 82
Nov 84 76 49 66 82 85 88 85 83 82 85 83 85
Dec 92 82 65 81 84 82 83 85 84 80 82 84 85
Jan 84 78 83 84 85 86 83 81 82 83 81
Feb 88 79 86 86 86 86 83 83 85 84 84
Mar 86 67 86 86 85 82 84 83 85 84 85
Station
code 12 179 182 183 1209 1210 1312 2158 2159 2161 2657 2157 2673
Sub basin
Godavari Middle Manjra
Basin Godavari
Good to Excellent Medium to good Bad Bad to Very Bed Dry Not collected

Water Quality Status of Maharashtra 2016-17
35
Table No. 15: Surface water quality monitoring stations in Godavari Basin (1 of 2)
Program Station code River/Nalla Station Name Village Taluka District
NWMP 12 Godavari river Godavari River at Dhalegaon Dhalegaon Pathari Parbhani
SWMP 179 Purna River Sillod - D/S of Sillod near bridge at bhavan Sillod Sillod Aurangabad
SWMP 182 Sukhna River Aurangabad - Near Chikhalthana Bridge Aurangabad Aurangabad Aurangabad
SWMP 183 Sukhna Dam Aurangabad - At Sukhna Dam Aurangabad Aurangabad Aurangabad
NWMP 1209 Godavari river Godavari River at Raher Raher Nayagaon Nanded
NWMP 1210 Godavari river Godavari River at Intake of pump house Vishnupuri Nanded Nanded
NWMP 1312 Godavari river Godavari river at Jaikwadi Dam, Paithan Paithan Paithan Aurangabad
NWMP 2158 Godavari river Godavari River at Paithan U/s of Paithan Intake pump house Jayakwadi Paithan Aurangabad
NWMP 2159 Godavari river Godavari River at D/s of Paithan at Pathegaon bridge Pathegaon Paithan Aurangabad
NWMP 2161 Godavari river Godavari River at Jalna Intake water pump house Shahagad Shahabad Ambad Jalna
NWMP 2657 Bindusara river Bindusara River at Beed, near Intake water pump house at Dam Paligaon Beed Beed
NWMP 2157 Godavari river Godavari River at Latur Water intake near pump house Dhamegaon Kalumb Osmanabad
NWMP 2673 Manjra river Manjra River at D/s of Latur, near Latur-Nanded Bridge Bhatkheda Latur Latur

Water Quality Status of Maharashtra 2016-17
36
Spatial map of SurfaceWQI at Godavari Basin (1 of 2) (April 2016)

Water Quality Status of Maharashtra 2016-17
37
Spatial map of Surface WQI at Godavari Basin (1 of 2) (December 2016)


Water Quality Status of Maharashtra 2016-17
39
Godavari Basin (2 of 2): Wardha, Weinganga and Pranhita
Sub basin
In basin 2 there are a total of 29 surface water monitoring stations (12 on Wardha, 16 on
Weinganga and 1 on Pranhita). The list of stations and codes has been provided below in
Table No. 16 and Table No. 17 .The trend of intra sub basin wise water quality for Godavari
(2 of 2) basin shows that occurrence of ‘Moderate to Good’ catergory of WQI was highest in
Pranhita and others compared to Weinganga and Wardha. Almost 25% observations were
recorded under Bad to Very Bad category for Wardha while 13% observations for
Weinganga.
The Weinganga recorded the highest occurrence of Good to Excellent category of WQI as
compared to Wardha.In current year 2016-17 , Pranhita and others did not record any
observations under Good to Excellent category. 10-15% of observations were noted to be
under Bad category for each of the subbasin of Godavari (2 of 2) Data not collected
accounted for about 10% of the total observations for Pranhita and others while 2% for
Wardha and Weinganga.
Figure No. 4: Trend of average occurrence for different category of WQI in Godavari basin (2 of 2)
0%
10%
20%
30%
40%
50%
60%
70%
80%
90%
100%
07-0
8
08-0
9
09-1
0
10-1
1
11-1
2
12-1
3
13-1
4
14-1
5
15-1
6
16-1
7
07-0
8
08-0
9
09-1
0
10-1
1
11-1
2
12-1
3
13-1
4
14-1
5
15-1
6
16-1
7
07-0
8
08-0
9
09-1
0
10-1
1
11-1
2
12-1
3
13-1
4
14-1
5
15-1
6
16-1
7
Wardha Weinganga Pranhita & Others
Godavari Basin (2 of 2)
Good to Excellent (63-100) Medium to Good (50-63) Bad (38-50)Bad to Very Bad (Below 38) Dry Not collected
No data

Water Quality Status of Maharashtra 2016-17
40
Water Quality Index for WQMS at Godavari Basin (2 of 2): Sub-basin- Wardha
Apr 62 65 64 62 59 64 60
60 61 64 75
May 54 69
57
57 58
57 58 58 71
Jun 47 72 50 58
54 53
55 58 60 70
Jul 47 59 63 54 77 65 65 76 62 68 57 61
Aug 63 74 53 56 62 65 65 67 61 66 62 72
Sep 65 75 63 58 65 66 65 80 61 65 65 76
Oct 62 69 61 57 72 60 59 76 62 63 61 68
Nov 62 72 60 56 56 62 61 50 56 62 63 74
Dec 60
58 57 74 58 58
56 59 61
Jan 53 70 56 55 30 55 54
54 56 57 70
Feb 56 70 55 52 67 57 55
55 58 57 71
Mar 60 74 60 56 66 59 60
57 60 60 79
Station
code 1212 1315 2156 2174 2675 2697 2698 2699 2719 2720 2721 2723
Sub basin
Wardha
Basin
Godavari
Good to Excellent Medium to good Bad Bad to Very Bed Dry Not collected

Water Quality Status of Maharashtra 2016-17
41
Table No. 16: Surface water quality monitoring stations in Godavari Basin (2 of 2)
Program Station
code
River/Nalla Station Name Village Taluka District
NWMP 1212 Wardha river
Wardha river at Rajura bridge Rajura Chandrapur Chandrapur
NWMP 1315 Wardha river
Wardha River at Pulgaon Railway Bridge Pulgaon Wardha Wardha
NWMP 2156 Wardha river
Wardha River at confluence point of Penganga & Wardha Jugad Wani Yavatmal
NWMP 2174 Wardha river
Wardha River at D/s of ACC Ghuggus Ghuggus Chandrapur Chandrapur
NWMP 2675 Morna river Morna River at D/s of Railway Bridge Akola Akola Akola
NWMP 2697 Penganga river
Penganga River near water supply scheme of Umarkhed MC
Belkhed Umarkhed Yavatmal
NWMP 2698 Penganga river
Penganga River D/s of Isapur Dam Isapur Pusad Yavatmal
NWMP 2699 Penganga river
Penganga River at Mehkar-Buldana Road Bridge Mehkar Mehkar Buldana
NWMP 2719 Wardha river
Wardha River at D/s of Erai River Hadasti Chandrapur Chandrapur
NWMP 2720 Wardha river
Wardha River at U/s of Erai River Hadasti Chandrapur Chandrapur
NWMP 2721 Wardha river
Wardha River at U/s of ACC Ghuggus Ghuggus Chandrapur Chandrapur
NWMP 2723 Wena river Wena River at D/s of Mohata Mills, near Bridge on Hinganghat-Wadner Road
Hinganghat
Hinganghat Wardha

Water Quality Status of Maharashtra 2016-17
42
Water Quality Index for WQMS at Godavari Basin (2 of 2): Sub-basin- Weinganga and Pranhita
Apr 78 34 39 62 59 75 69 74 84 79 76 71 60 61 82 62
May 69 50 64 39 70 71 69 71 75 68 56 58 57 56 76
Jun 74 37 38 33 37 81 63 69 83 79 60 61 60 60 74 60
Jul 55 37 32 32 40 73 63 64 77 67 54 60 66 57 72 67
Aug 78 34 38 34 33 72 71 70 72 63 63 64 65 64 81 66
Sep 71 35 38 43 52 79 71 76 83 76 64 67 66 55 81 67
Oct 72 33 41 45 48 74 68 75 79 70 60 62 61 60 77 66
Nov 69 48 43 38 41 75 72 78 77 74 77 79 62 57 80 63
Dec 74 51 40 56 46 68 76 73 70 75 57 55
56
Jan 66 32 31 47 46 64 68 73 71 65 72 76 56 54 74 55
Feb 71 32 34 34 35 70 72 66 75 72 69 77 54 56 76 57
Mar 70 32 37 35 37 65 73 75 76 73 75 78 63 58 82 63
Station
code 185 186 187 188 189 1908 1909 1910 2170 2171 2172 2173 2175 2176 2722 11
Sub basin
Weinganga Pranhita & Others
Basin Godavari
Good to Excellent Medium to good Bad Bad to Very Bed Dry Not collected

Water Quality Status of Maharashtra 2016-17
43
Table No. 17: Surface water quality monitoring stations in Godavari Basin (2 of 2)
Program Station
code
River/Nalla Station Name Village Taluka District
SWMP 185 Nag River Nag River Near, Ambazari Lake, Nagpur Nagpur Nagpur Nagpur
SWMP 186 Nag River Nag River Near, Bhandewadi Bridge, Nagpur Nagpur Nagpur Nagpur
SWMP 187 Nag River Nag River Near, Asoli Bridge, Bhandara Road, Nagpur Nagpur Nagpur Nagpur
SWMP 188 Pill River Pill River Near, Wanjra Layout Kamptee Road, Nagpur Nagpur Nagpur Nagpur
SWMP 189 Pill River Pill River Near, Mankapur on Koradi Road, Nagpur Nagpur Nagpur Nagpur
NWMP 1908 Kolar river Kolar river before confluence with Kanhan river at Waregaon Bridge
Waregaon Kamptee Nagpur
NWMP 1909 Kanhan river Kanhan river at D/s of Nagpur Agargaon Kuhi Nagpur
NWMP 1910 Wainganga river
Wainganga river after confluence with Kanhan river Ambhora Kuhi Nagpur
NWMP 2170 Kanhan river Kanhan River (Wainganga basin) at U/s of M/s Vidharba Paper Mill
Sinora Parseoni Nagpur
NWMP 2171 Kanhan river Kanhan River (Wainganga basin) at D/s of M/s Vidharbha Paper Mills
Sinora Parseoni Nagpur
NWMP 2172 Wainganga river
Wainganga River at D/s of Ellora Paper Mill Tumsar Tumsar Bandara
NWMP 2173 Wainganga river
Wainganga River at U/s of Ellora Paper Mills Tumsar Tumsar Bandara
NWMP 2175 Wainganga river
Wainganga at U/s of Gaurav Paper Mills near Jack Well Bramhpuri Chandrapur Chandrapur
NWMP 2176 Wainganga river
Wainganga River at D/s of Gaurav Paper Mills Near Jackwell Bramhpuri Chandrapur Chandrapur
NWMP 2722 Wena river Wena River at U/s of Mohata Mills, nearby Brigde on Hinganghat Wadner Road
Hinganghat
Hinganghat Wardha
NWMP 11 Wainganga river
Wainganga River at Ashti Ashti Gondpipri Chandrapur

Water Quality Status of Maharashtra 2016-17
44
Spatial map of Surface WQI in Godavari Basin (2 of 2) (April 2016)
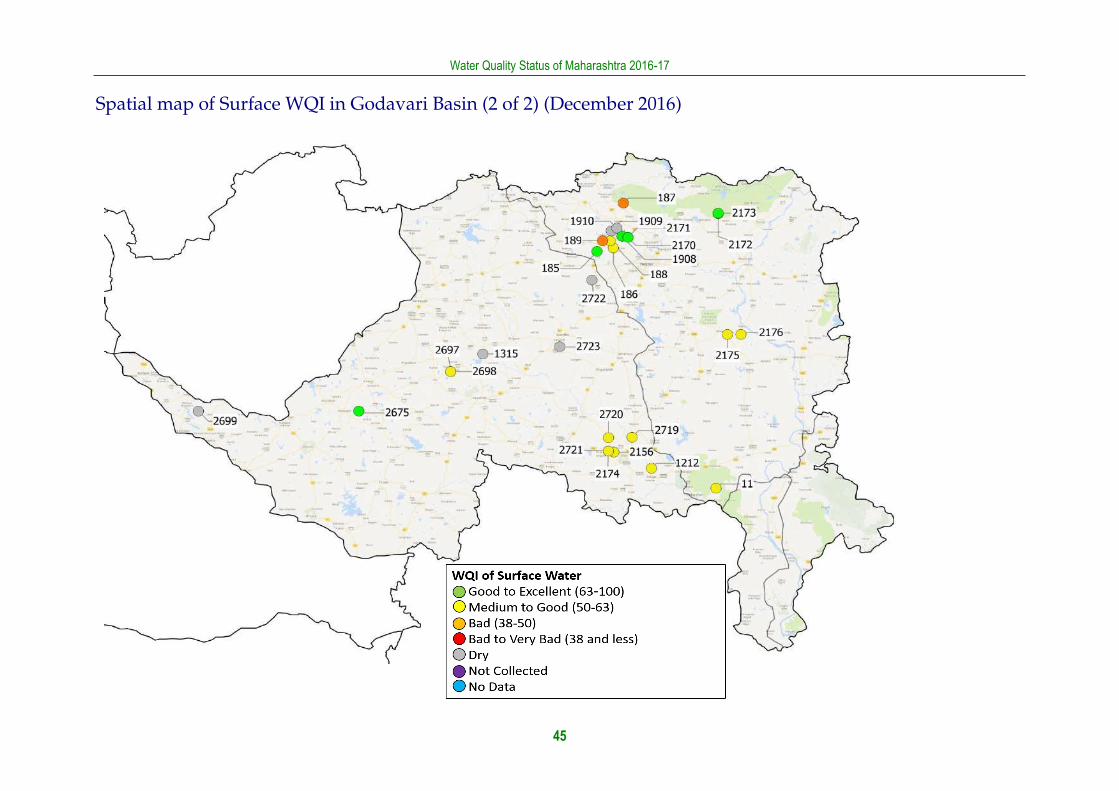
Water Quality Status of Maharashtra 2016-17
45
Spatial map of Surface WQI in Godavari Basin (2 of 2) (December 2016)


Water Quality Status of Maharashtra 2016-17
47
Krishna Basin The Krishna river originates as the Upper Krishna basin in the Western Ghats of Maharashtra and Karnataka, drains the Deccan Plateau, and discharges into the Bay of Bengal. The Krishna basin spreads across the states of Maharashtra(69,425sq km), Karnataka (113,271 sq km) and Andhra Pradesh (76,252 sq km) covering total area of 2,58,948 sq km which is about 8% of total geographical area of country. The principal tributaries joining Krishna are the Ghataprabha, the Malaprabha, the Bhima, the Tungabhadra and the Musi14. The Krishna basin is divided into Krishna upper (21 stations) and Bhima Upper (37 stations) for analysis in this report.
Intra sub basins results for Krishna basin are depicted in Figure No. 5. The maximum
occurrence of Bad category is recorde in Bhima Upper (30%) as compared to Krishna Upper
sub basin. About 25% of observations for Bhima Upper and 20% observation for Krishna
Upper are recorded in current yaer 2016-17. About 10% observations for bhima upper are
recorded as while only 0.5 % observations are for krishna upper sub basin.krishna upper
basin has hmaximum observations under moderate category as compared to bhima upper.The overall preview for Krishna Upper is better in terms of WQI as compared to
Bhima Upper.
Figure No. 5: Trend of average occurrence for different category of WQI in Krishna basin
14India,WRIS
0%
10%
20%
30%
40%
50%
60%
70%
80%
90%
100%
07-0
8
08-0
9
09-1
0
10-1
1
11-1
2
12-1
3
13-1
4
14-1
5
15-1
6
16-1
7
07-0
8
08-0
9
09-1
0
10-1
1
11-1
2
12-1
3
13-1
4
14-1
5
15-1
6
16-1
7
Bhima Upper Krishna Upper
Krishna Basin
Good to Excellent (63-100) Medium to Good (50-63) Bad (38-50)
Bad to Very Bad (Below 38) Dry Not collected
No data

Water Quality Status of Maharashtra 2016-17
48
Water Quality Index for WQMS at Krishna Basin (1 of 2): Sub-basin - Bhima upper (1 of 2)
Apr 53 34 30 36 47 38 40 45
70 30 33 62 39 41 62 43 42
May 38 32 29 33 37 32 33 39 38 50 31 29 65 42 38 58 39 43
Jun 32 30 28 41 51 42 45 76 77 78 30 30 62 38 57 63 43 36
Jul 38 43 41 54 56 52 43 82 71 74 30 36 67 31 31 55 47 55
Aug 68 62 62 64 62 59 60 61 58 68 64 58 65 60 62 57 48 61
Sep 68 65 72 76 80 66 42 56 54 57 63 56 64 39 41 49 37 48
Oct 74 74 75 75 76 69 76 58 59 64 69 60 62 76 68 61 59 61
Nov 62 56 56 69 46 69 58 49 52 57 68 62 60 55 63 62 52 58
Dec 22 23 20 24 25 23 32 57
44 23 22 67 33 30 54 62 22
Jan 22 23 18 20 24 23 37 44 41 45 19 19 62 37 28 76 56 41
Feb 28 42 37 40 27 27 38 57 44 49 33 33 61 40 41 59 51 37
Mar 30 27 24 21 36 31 32 55 53 57 26 29 63 32 30 61 46 33
Station
code 1189 1190 2191 2192 2193 2194 2196 2197 2668 2669 2678 2679 2680 2690 2691 2692 2693 2694
Sub basin
Bhima Upper (1 of 2)
Basin Krishna
Good to Excellent Medium to good Bad Bad to Very Bed Dry Not collected

Water Quality Status of Maharashtra 2016-17
49
Table No. 18: Surface water quality monitoring stations in Krishna Basin (1 of 2) Sub Basin –Bhima Upper (1 of 2)
Progra
m
Station
code
River/Nalla Station Name Village Taluka District
NWMP 1189 Bhima river Bhima river at Pune( Mutha river) at U/s of Vithalwadi near Sankar Mandir
Vithalwadi Haweli Pune
NWMP 1190 Bhima river Bhima river at D/s of Bundgarden, Pune Yerwada Haweli Pune
NWMP 2191 Mutha river Mutha River at Sangam Bridge Near Ganpathi Ghat Shivaji Nagar Pune Pune
NWMP 2192 Mula-Mutha river Mula-Mutha River at Mundhwa Bridge Mundhawa Haweli Pune
NWMP 2193 Mula river Mula River at Aundh Bridge -Aundgaon Aundhgaon Haweli Pune
NWMP 2194 Mula river Mula River at Harrison Bridge near Mula -Pawana Sangam Bopodi Haweli Pune
NWMP 2196 Pawana river Pawana River at Sangavigaon, Pune Sangavigaon Haweli Pune
NWMP 2197 Indrayani river Indrayani River at D/s of Alandigaon, Pune Alandigaon Haweli Pune
NWMP 2668 Indrayani river Indrayani River at D/s of Moshi village Moshi Haveli Pune
NWMP 2669 Indrayani river Indrayani River at U/s of Moshigaon, Pune Moshigaon Haweli Pune
NWMP 2678 Mutha river Mutha River near Veer Savarkar Bhavan Pune M.C Pune Pune
NWMP 2679 Mutha river Mutha River at Deccan Bridge, Pune Deccan Pune Pune
NWMP 2680 Mutha river Mutha River at Khadakvasla Dam Pune Kadakvasla Haweli Pune
NWMP 2690 Pawana river Pawana River at Kasarwadi Pune Kasarwadi Haweli Pune
NWMP 2691 Pawana river Pawana River at Dapodi Bridge at Pawana-Mulla Sangan Pune Dapodi Haweli Pune
NWMP 2692 Pawana river Pawana River at Ravet Weir, Pune Ravet Haweli Pune
NWMP 2693 Pawana river Pawana River at Chinchwadgaon, Pune Chinchwadgaon Haweli Pune
NWMP 2694 Pawana river Pawana River at Pimprigaon, Pune Pimprigaon Haweli Pune

Water Quality Status of Maharashtra 2016-17
50
Water Quality Index for WQMS at Krishna Basin (1 of 2): Sub-basin - Bhima upper (2 of 2)
Apr 67 76
43 40 48 69 58 38 60 72
48 57 58 54
May 82 82
66 63 47 71 47 33 61 78
52 62 49 71
47
Jun 72
56
58 77 58 24 76 51
63 33 35 35
Jul 72 67
49
62 80 60 47 79 57
64 46 50 48
Aug 66 77 72 64 49 62 74 65 54 47 63 50 53 60 55 65
47
Sep 38 65 56 76 50 58 60 56 42 51 63 46 44 75 46 85
43
Oct 72 46 74 56 51 60 65 64 60 57 52 54 59 58 58 59 76 52
Nov 78 64
54 60 70 82 56 67 51 51 52 43 52 66 60 80
Dec 73 55
35 51 62 69 70 47 55 57 46 51 61 59 84
Jan 48 63
24 25 53 69 62 47 47 45 42 34 44 49 53
Feb 74 27
54 54 58 76 76 47 53 55 41 31 66 54 80
Mar 62 43
43 49 54 75 67 48 58 54 50 44 63 47 79
56
Station
code 28 195 1188 1191 1192 1463 1911 1912 2195 2655 2656 2665 2677 2681 2682 2683 2705 2715
Sub basin Bhima Upper (2 of 2)
Basin Krishna
Good to Excellent Medium to good Bad Bad to Very Bed Dry Not collected

Water Quality Status of Maharashtra 2016-17
51
Table No. 19: Surface water monitoring stations at Krishna Basin (1 of 2) Sub Basin Bhima Upper (2 of 2)
Program Station
code
River/Nalla Station Name Village Taluka District
NWMP 28 Bhima river Bhima River at Takli Takali South Solapur Solapur
SWMP 195 Sina River Sina River Bridge At Burudgaon Road, A/P Ahmednagar, Taluka & District Ahmednagar
Burudgaon Ahmednagar Ahmednagar
NWMP 1188 Bhima river Bhima River at Narshingpur near Sangam Bridge after confluence with Nira
Narsingpur Malshiros Solapur
NWMP 1191 Bhima river Bhima river after confluence with Mula-Mutha at Pargaon near Vasant Bandara
Pargaon Daund Pune
NWMP 1192 Bhima river Bhima river at Daund near Mahadev temple Daund Daund Pune
NWMP 1463 Nira river Nira river at Sarola bridge Sarola Bhor Pune
NWMP 1911 Chandrabhaga river
Chandrabhaga river at U/s of Pandharpur town Gursale Pandarpur Solapur
NWMP 1912 Chandrabhaga river
Chandrabhaga river at D/s of Pandharpur town near Vishnupant Mandir
Gopalpur Pandarpur Solapur
NWMP 2195 Nira river Nira River at D/s of Jubilant Organosis Pune Nimbut Baramati Pune
NWMP 2655 Bhima river Bhima River at Koregaon near Koregaon Bridge, Pune Koregaon Shirur Pune
NWMP 2656 Bhima river Bhima River Backwater of Ujani Dam near raw water pump house Kumbargaon Indapur Pune
NWMP 2665 Ghod river Ghod River at Shirur, Pune Shirur Shirur Pune
NWMP 2677 Mula-Mutha river
Mula-Mutha River at D/s of Theur, Pune Theur Haweli Pune
NWMP 2681 Nira river Nira River at Sangavi Sangavi Phaltan Satara
NWMP 2682 Nira river Nira River at U/s of Jubilant Organosis Pune Nira( Datta ghat)
Baramati Pune
NWMP 2683 Nira river Nira River at Shindewadi Shindewadi, Shirwal
Khandala Satara
NWMP 2705 Sina river Sina River near Laboti till naka Solapur Laboti Mohal Solapur
NWMP 2715 Vel river Vel River at Shikrapur, Pune Shikrapur Shirur Pune

Water Quality Status of Maharashtra 2016-17
52
Water Quality Index for WQMS at Krishna Basin (2 of 2): Sub-Basin - Krishna upper
Apr 53 65 63 65 66 66 67 67 66 67 68 66 66 73 54 77 55 70 56 74 42
May 65 64 56 58 60 58 52 55 53 57 58 63 58 67 62 63 63 78 78
72
Jun 64 62 58 56 58 63 65 56 48 63 51 60 51 59 63 62 59 58 61 60 64
Jul 62 66 65 64 64 64 64 65 66 67 66 65 64 56 37 40 56 43 57 62 49
Aug 53 66 69 67 68 68 60 69 68 68 69 67 67 53 63 63 62 64 48 65 59
Sep 75 66 64 67 66 66 67 65 66 68 69 64 68 71 72 78 69 81 62 85 62
Oct 55 68 67 66 66 67 66 63 65 59 59 66 65 57 57 58 54 55 61 65 58
Nov 58 65 68 66 67 63 82 64 66 68 67 67 68 57 56 58 55 79 63 87 59
Dec 79 68 65 69 64 65 85 64 63 64 63 66 63 75 69 77 72 66 75 80 73
Jan 72 64 61 61 62 61 79 62 50 61 62 67 50 51 46 48 72 66 54 74 46
Feb 77 68 67 66 66 65 79 64 66 64 66 66 67 72 74 71 71 78 70 77 76
Mar 80 64 63 66 66 55 80 59 56 55 63 63 56 76 71 73 74 75 67 86 50
Station
code 36 37 198 199 200 1153 1194 1310 1311 1904 1905 1906 2163 2186 2187 2188 2189 2190 2711 2716 2717
Sub basin
Krishna Upper
Basin Krishna
Good to Excellent
Medium to good Bad Bad to Very Bed Dry Not collected

Water Quality Status of Maharashtra 2016-17
53
Table No. 20: Surface water quality monitoring stations in Krishna Basin (1 of 2): Sub basin Bhima upper (1 of 3)
Prog Station
code
River/Nalla Station Name Village Taluka District
NWMP 36 Krishna river Krishna River at Krishna Bridge, Karad Karad Karad Satara
NWMP 37 Krishna river Krishna River at Maighat, Sangli Gawali gally Miraj Sangli
SWMP 198 Krishna River Bahe KT Weir, Bahe, Taluka - Walwa, District - Sangli Bahe Walwa Sangli
SWMP 199 Krishna River Borgaon KT Weir, Borgaon, Taluka - Walwa, District - Sangli Borgaon Walwa Sangli
SWMP 200 Warna River (After Confluence of Morna River)
Mangle Bridge, Mangle, Taluka - Shirala, District - Sangli Mangle Shirala Sangli
NWMP 1153 Krishna river Krishna River at Rajapur Weir Rajapur Shirol Kolhapur
NWMP 1194 Krishna river Krishna river at Dhom Dam Wai Mahabaleshwar
Satara
NWMP 1310 Krishna river Krishna River at Kurundwad Narshingwadi, Kurundwad
Shirol Kolhapur
NWMP 1311 Panchganga river Panchganga River at Ichalkaranji near MIDC intake well Shiradhwad (Ichalkaranji ghat)
Hatkanangale
Kolhapur
NWMP 1904 Panchganga river Panchganga River at U/s of Kolhapur town near Balinga Pumping Station
Balinga Karvir Kolhapur
NWMP 1905 Panchaganga river Panchaganga river at D/s of Kolhapur town at Gandhi nagar near NH-4 bridge and MIDC intake well
Uchegaon Kolhapur Kolhapur
NWMP 1906 Krishna river Krishna river at Walwa, D/s of Islampur near Vithal Temple Walwa Walwa Sangli
NWMP 2163 Panchganga river Panchganga River at Shirol near Shirol intake well Shirol Shirol Kolhapur
NWMP 2186 Venna river Venna River at Varya, Satara Varye Satara Satara
NWMP 2187 Krishna river Krishna River at Kshetra Mahuli Satara Kshetra Mahuli Mahuli Satara
NWMP 2188 Krishna river Krishna River at Krishna-Venna Sangam, Mahuli Mahuli Mahuli Satara
NWMP 2189 Koyna river Koyna River at Karad Karad Karad Satara
NWMP 2190 Krishna river Krishna River at Wai Wai Wai Satara
NWMP 2711 Urmodi river Urmodi River at Nagthane Satara Nagthane Satara Satara
NWMP 2716 Venna river Venna River at Mahabaleshwar Mahabaleshwar Mahabaleshwar
Satara
NWMP 2717 Venna river Venna River at Mahuli Mahuli Satara Satara
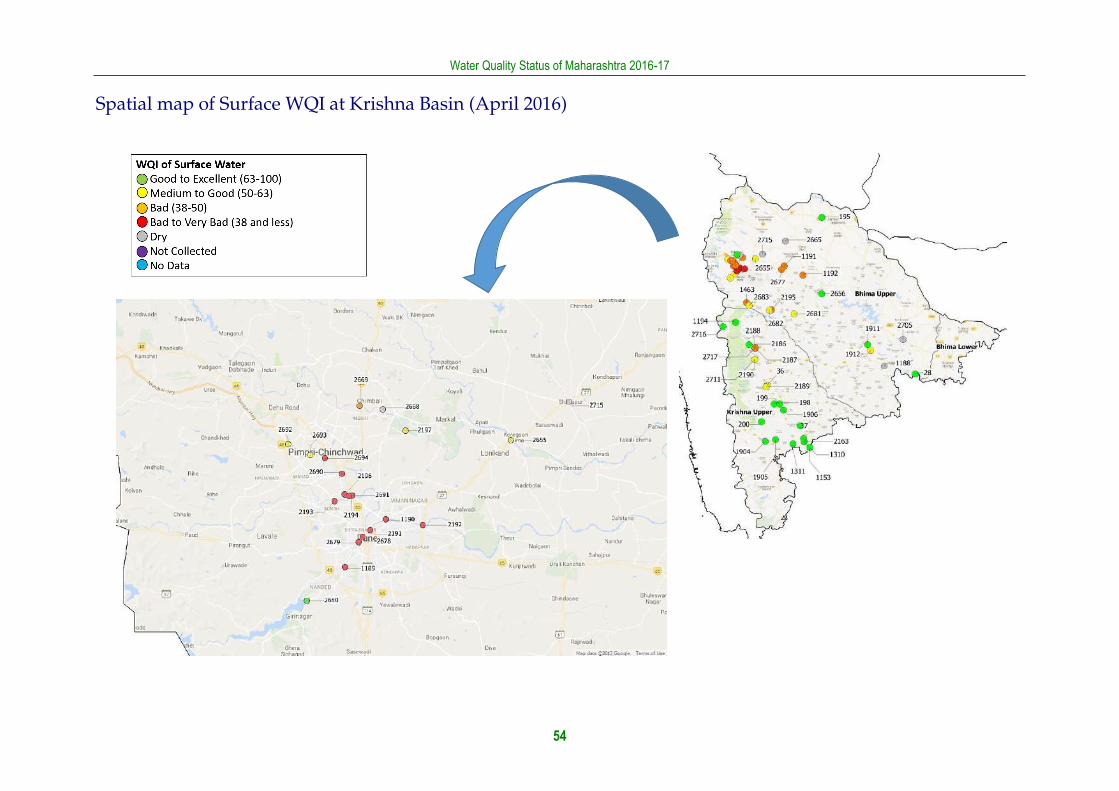
Water Quality Status of Maharashtra 2016-17
54
Spatial map of Surface WQI at Krishna Basin (April 2016)

Water Quality Status of Maharashtra 2016-17
55
Spatial map of Surface WQI at Krishna Basin (December 2016)


Water Quality Status of Maharashtra 2016-17
57
West Flowing Rivers Maharashtra has many westwards flowing rivers originating from the Western Ghats like
Damanganga, Surya, Vaitarna, Ulhas, Savitri, Kundalika, Patalganga, Vashisti, Shastri, Karli,
Terekhol and so on15. These are an important source of drinking water, agricultural
applications and industrial purposes and are known to contribute about 44.54% of the yield
at 75% dependability of Maharashtra. Rivers like Vaitarna, Patalganga, Ulhas, and Balganga
and so on with tributaries such as Tansa, Bhasta and Barvi are used as sources of drinking
water. While Rivers like Ulhas, Patalganga, Panvel, Bhogeshwari and Amba & few other
tributaries like Vashishthi and Kundalika lie very close to industrial areas and are thus
prone to water pollution due to release of industrial effluents. Total 41 WQMS are installed
by MPCB along the west flowing rivers.
From Figure No. 6 , it is observed that in 2016-17, 48% of observation were noted under
‘Good to Excellent’ category as against more than 70% observations in the year 2015-16 in
the same category. Thi was followed by followed by 20% of the observations under
‘Medium to good’ category and 20 % observations under bad to Very bad category. Almost
8% observations of water quality is ‘Bad’ while remaining 12% of observations is noted to be
‘’. Only 2% of readings fall under ‘Not Collected’ category.
Figure No. 6: Trend of average occurrence for different category of WQI in West flowing
15 http://sandrp.in/rivers/Rivers_of_Maharashtra_Dec_2011.PDF
0%
10%
20%
30%
40%
50%
60%
70%
80%
90%
100%
07-08 08-09 09-10 10-11 11-12 12-13 13-14 14-15 15-16 16-17
West flowing
West flowing
Good to Excellent (63-100) Medium to Good (50-63) Bad (38-50)
Bad to Very Bad (Below 38) Dry Not collected
No data

Water Quality Status of Maharashtra 2016-17
58
Water Quality Index of WQMS on West Flowing rivers (1 of 2)
Apr 67 66 66 63 82 82 81 85 68 31 81 79 67 83 82 84 77 79 76 66 65
May 65 69 68 48 78 79 80 80 70 35 81 79 68 80 88 86 83 74 76 68 63
Jun 63 63 65 54 84 83 80 81 66 30 84 82 56 85 82 84 78 72 74 67 63
Jul 66 63 63 64 46 82 83 81 83 66 51 70 73 63 80 85 81 80 79 80 65 66
Aug 45 68 67 67 64 83 81 81 83 68 47 70 69 67 78 83 84 82 79 80 66 66
Sep 66 68 66 68 65 83 83 81 84 67 25 79 70 66 83 83 80 84 88 87 68 67
Oct 65 64 66 63 75 82 85 83 86 66 31 83 83 61 63 84 90 84 80 84 66 67
Nov 67 67 67 68 72 81 83 88 85 67 24 77 83 68 91 70 76 91 83 68 68
Dec 66 64 65 64 53 77 86 84 80 65 27 79 81 61 74 85 83 82 79 68 66
Jan 68 61 64 62 42 82 79 83 86 61 27 79 83 62 84 87 83 82 61 63
Feb 68 65 66 67 33 84 80 80 80 66 26 84 85 67 80 85 82 83 66 68
Mar 68 63 63 65 38 93 87 85 89 62 25 71 79 59 81 85 79 81 64 64
Station
code 201 202 203 204 1092 1093 1094 1461 2162 2164 2168 2653 2654 2676 2696 2706 2707 2708 2709 2712 2713 2714
Sub basin
West Flowing Rivers (1 of 2)
Basin Coastal
Good to Excellent Medium to good Bad Bad to Very Bed Dry Not collected

Water Quality Status of Maharashtra 2016-17
59
Table No. 21: Surface water monitoring stations at West Flowing rivers (1 of 2)
Progra
m
Statio
n code
River/Nalla Station Name Village Taluka District
SWMP 201 Sonpatra River Sonpatra River At Kotwali Village, Taluka - Khed, District - Ratnagiri Kotwali Khed Ratnagiri
SWMP 202 Vashisti River Vashisti River At Khadpoli, Taluka Chiplun, District - Ratnagiri Khadpoli Chiplun Ratnagiri
SWMP 203 Jagbudi River Jagbudi River, D/S of Khed City, Taluka - Khed, District Ratnagiri Khed City Khed Ratnagiri
SWMP 204 Jog River Jog river at Dapoli, Taluka Dapoli, District - Rantnagiri Dapoli Dapoli Ratnagiri
NWMP 1092 Kalu river Kalu River at Atale village Atale Kalyan Thane
NWMP 1093 Ulhas river Ulhas river at U/s of NRC Bund Mohane Kalyan Thane
NWMP 1094 Ulhas river Ulhas River at U/s of Badlapur water works Kulgaon Ambernath Thane
NWMP 1461 Bhatsa river Bhatsa river at D/s of Pise Dam Pise Bhiwandi Thane
NWMP 2162 Ulhas river Ulhas River at Jambhul water works Jambhul Ambernath Thane
NWMP 2164 Vashishti river Vashishti River at U/s of Three M Paper Mills near M/s Multifilms Plastic Pvt Ltd
Kherdi Chiplun Ratnagiri
NWMP 2168 Mithi river Mithi River at near bridge Mahim Bandra Mumbai
NWMP 2653 Bhatsa river Bhatsa River at D/s of Liberty Oil Mills Satne Shahapur Thane
NWMP 2654 Bhatsa river Bhatsa River at D/s of Liberty Oil Mills Satne Shahapur Thane
NWMP 2676 Muchkundi river
Muchkundi River at Waked Ratnagiri near M/s Asahi India Glass Waked Lanja Ratnagiri
NWMP 2696 Dam Pelhar dam Pelhar Vasai Palghar
NWMP 2706 Surya river Surya River U/s of Surya Dam Dhamni Vikramgad Thane
NWMP 2707 Surya river Surya River at MIDC pumping station Garvashet Palghar Thane
NWMP 2708 Surya river Surya River at Intake of Vasai-Virar water scheme Masvan Palghar Thane
NWMP 2709 Tansa river Tansa River near road bridge Dakewali Wada Thane
NWMP 2712 Vaitarna river Vaitarna River near Road Bridge Gandhare Wada Thane
NWMP 2713 Vashishti river Vashishti River at D/s of Three M Paper Mills near Chiplun water intake Jackwell
Kherdi Chiplun Ratnagiri
NWMP 2714 Vashishti river Vashishti River at U/s of Pophali near Konphansawane Bridge Pophali Chiplun Ratnagiri

Water Quality Status of Maharashtra 2016-17
60
Water Quality Index of WQMS on West Flowing rivers (Coastal basin) (2 of 2)
Apr 83 86 68 82 80 81 76 63 82 59 78 68 86 84 78 82 67 66 64 64
May 84 80 75 75 76 74 65 65 78 68 82 80 78 76 76 74 69 67 64 65
Jun 85 85 52 77 82 87 81 60 80 54 83 84 85 80 83 77 67 66 59 62
Jul 80 79 77 80 83 79 78 65 72 79 83 81 83 82 81 82 66 66 64 65
Aug 81 82 82 80 72 81 36 67 75 32 79 78 82 83 72 79 67 67 66 67
Sep 85 82 74 76 78 78 81 68 78 63 73 82 84 82 82 83 66 66 67 68
Oct 86 85 67 86 86 75 83 64 82 55 85 81 84 82 79 83 65 67 65 65
Nov 81 80 45 80 73 78 60 67 78 65 75 76 80 82 75 77 68 67 66 65
Dec 87 90 39 75 84 73 73 53 79 83 85 45 79 80 75 73 60 60 64 64
Jan 69 52 59 84 80 79 64 63 76 70 81 79 86 85 77 80 66 65 67 64
Feb 87 87 72 83 78 75 75 66 81 54 80 77 83 83 78 81 67 68 65 65
Mar 89 77 36 79 78 79 66 63 81 55 81 61 81 80 73 86 65 64 66 67
Station
code 192 193 216 1151 1152 1462 2198 2199 2651 2671 2672 2685 2686 2687 2688 2689 2701 2702 2703 2704
Sub basin
West Flowing Rivers (2 of 2)
Basin Coastal
Good to Excellent Medium to good Bad Bad to Very Bed Dry Not collected

Water Quality Status of Maharashtra 2016-17
61
Table No. 22: Surface water quality monitoring stations on West flowing s (2 of 2)
Program Station code River/Nalla Station Name Village Taluka District
SWMP 192 Dam Morbe Dam, Taluka - Khalapur, District - Raigad Khalapur Khalapur Raigad
SWMP 193 Balganga River Balganga River, Village Ransai, Taluka - Khalapur, District - Raigad Ransai Khalapur Raigad
SWMP 216 River Kasardi River near Ganesh Ghat Taloja Panvel Raigad
NWMP 1151 Patalganga river Patalganga River at Shilphata Bridge Khopoli Khalapur Raigad
NWMP 1152 Kundalika river Kundalika River at Roha Bridge Roha Roha Raigad
NWMP 1462 Patalganga river Patalganga near intake of MIDC water works( Turade w/w) Turade Khalapur Raigad
NWMP 2198 Kundalika river Kundalika River at Are Khurd (Saline Zone) Are Khurd Roha Raigad
NWMP 2199 Savitri river Savitri River at Ovale village Ovale Mahad Raigad
NWMP 2651 Amba river Amba River at D/s of Waken Bridge Waken Phata Roha Raigad
NWMP 2671 Kundalik river Kundalik River near Salav Bridge (Saline Zone) Salav Roha Raigad
NWMP 2672 Kundalika river Kundalika River at Dhatav at Jackwell Dhatav Roha Raigad
NWMP 2685 Patalganga river Patalganga River at D/s of Kharpada Bridge Kharpada Khalapur Raigad
NWMP 2686 Patalganga river Patalganga River at Vyal pump house Vyal Khalapur Raigad
NWMP 2687 Patalganga river Patalganga River at Khalapur pumping house Khalapur Khalapur Raigad
NWMP 2688 Patalganga river Patalganga River at Savroli Bridge Savroli Khalapur Raigad
NWMP 2689 Patalganga river Patalganga River at Gagangiri Maharaj Temple Khopoli Khalapur Raigad
NWMP 2701 Savitri river Savitri River Jackwell at Upsa kendra Nangalwadi Mahad Raigad
NWMP 2702 Savitri river Savitri River at Shedav Doh Shedav Dov Mahad Raigad
NWMP 2703 Savitri river Savitri River at Dadli Bridge Dadli Mahad Raigad
NWMP 2704 Savitri river Savitri River at Muthavali village Muthavali Mahad Raigad

Water Quality Status of Maharashtra 2016-17
62
Spatial map of Surface WQI of West Flowing rivers (April 2016)

Water Quality Status of Maharashtra 2016-17
63
Spatial map of Surface WQI of West Flowing rivers (December 2016)


Water Quality Status of Maharashtra 2016-17
65
Nallahs
There are 12 water monitoring stations across nallahs in the state .The majority of nallahs of
coastal basin are located in Thane district. The BPT Navpur, Sandoz nalla and Rabodi nalla
of Thane are noted to be polluted throughout the year.
Map No. 4: Water monitoring network across Nallahs

Water Quality Status of Maharashtra 2016-17
66
Water Quality Index of WQMS on Nallahs (Coastal basin)
Apr 54 83 40 56 27 28 56
May 55 74 47 51 28 21 63
Jun 45 40 45 42 29 24 52
Jul 38 55 60 73 47 31 22 23 23 23
Aug 35 62 46 84 35 57 23 36 34 36
Sep 27 81 79 56 26 24 27 22 15 15
Oct 31 77 78 81 70 36 26 24 67 25 29
Nov 28 76 35 87 31 29 26 61
Dec 32 49 70 64 28 26 24 57
Jan 24 46 70 89 27 27 26 59
Feb 23 47 48 40 24 27 24 60
Mar 27 86 35 27 29 47 62
Station
code 2782 196 197 2178 2789 2783 2784 2785 2786 2787 2788 2790
Sub basin
Nallah
Basin Coastal
Good to Excellent Medium to good Bad Bad to Very Bed Dry Not collected

Water Quality Status of Maharashtra 2016-17
67
Table No. 23 : Surface water quality monitoring stations monitoring at Nallahs along the Coastal Basin.
Progra
m
Station
code
River/Nall
a
Station Name Village Taluka District
SWMP 196 Nalla Lowki Nalla At Khedi, Taluka & District - Jalgaon Khedi Khedi Jalgaon
SWMP 197 Nalla Moti Nalla before Confluence with Panjara river Dhule, Taluka & District - Dhule
Dhule Dhule Dhule
NWMP 2178 Nalla Chikhali Nalla Meets Godavari River Chikhali Nashik Nashik
NWMP 2789 Nalla Nalla at D/s of Alkai Mandir, Solapur Aklai Malshiras
Solapur
NWMP 2782 Nalla Rabodi Nalla Rabodi Thane Thane
NWMP 2783 Nalla Colour Chem Nalla Majiwada Thane Thane
NWMP 2784 Nalla Sandoz Nalla Sandozbaug Thane Thane
NWMP 2785 Nalla BPT Navapur Navapur Palghar Palghar
NWMP 2786 Nalla Tarapur MIDC Nalla, near sump No1 MIDC Tarapur
Palghar Palghar
NWMP 2787 Nalla Tarapur MIDC Nalla MIDC Tarapur
Palghar Palghar
NWMP 2788 Nalla Tarapur MIDC Nalla near sump-III MIDC Tarapur
Palghar Palghar
NWMP 2790 Nalla Pimpal-Paneri Nalla at Ratnagiri near Finolex Industries Yahganigaon Ratnagiri Ratnagiri

Water Quality Status of Maharashtra 2016-17
68
Spatial map of WQI for Nallahs (April 2016)

Water Quality Status of Maharashtra 2016-17
69
Spatial map of WQI for Nallahs (Dec 2016)


Water Quality Status of Maharashtra 2016-17
71
Saline (Sea and Creek) Water Quality
Maharashtra is bestowed with a coast line of about 720 kms. Thane, Mumbai, Raigad,
Ratnagiri and Sindhudurg districts are all located along the coastal front in Maharashtra. These districts are blessed with beaches, mangroves, migratory birds, corals and a lot of
unique marine biodiversity. Rapid industrialization has taken place along the coastline
which adds to water pollution. These have direct impact on marine ecosystem and humans, hence it is important to monitor the sea water quality.
MPCB has 45 monitoring stations (36 stations on sea/creek and 9 stations along nallahs)
along the sensitive and pollution prone areas of coastline of the state. Regular monitoring for basic parameters like DO, FC, pH and BOD data is conducted at these monitoring stations.
The trend in average occurrence for WQI across the WQMS was noted and it is observed
that 64% of observations are recorded under Bad category. The occurrence of ‘Bad to very
bad’ category has increased as compared to previous three years by almost 10%. This year
more than 70% of the observatiosn for water quality of coastal basin water samples was
recorded in ‘Bad’ category. ‘Medium to Good’ category accounted for 19% of observations
while only 2% of observations were under ‘Good to Excellent’ category.
Figure No. 7: Trend of average occurrence for different category of WQI Coastal basin
0%
10%
20%
30%
40%
50%
60%
70%
80%
90%
100%
07-08 08-09 09-10 10-11 11-12 12-13 13-14 14-15 15-16 16-17
Coastal
Sea /Creek
Good to Excellent (63-100) Medium to Good (50-63) Bad (38-50)
Bad to Very Bad (Below 38) Dry Not collected
No data
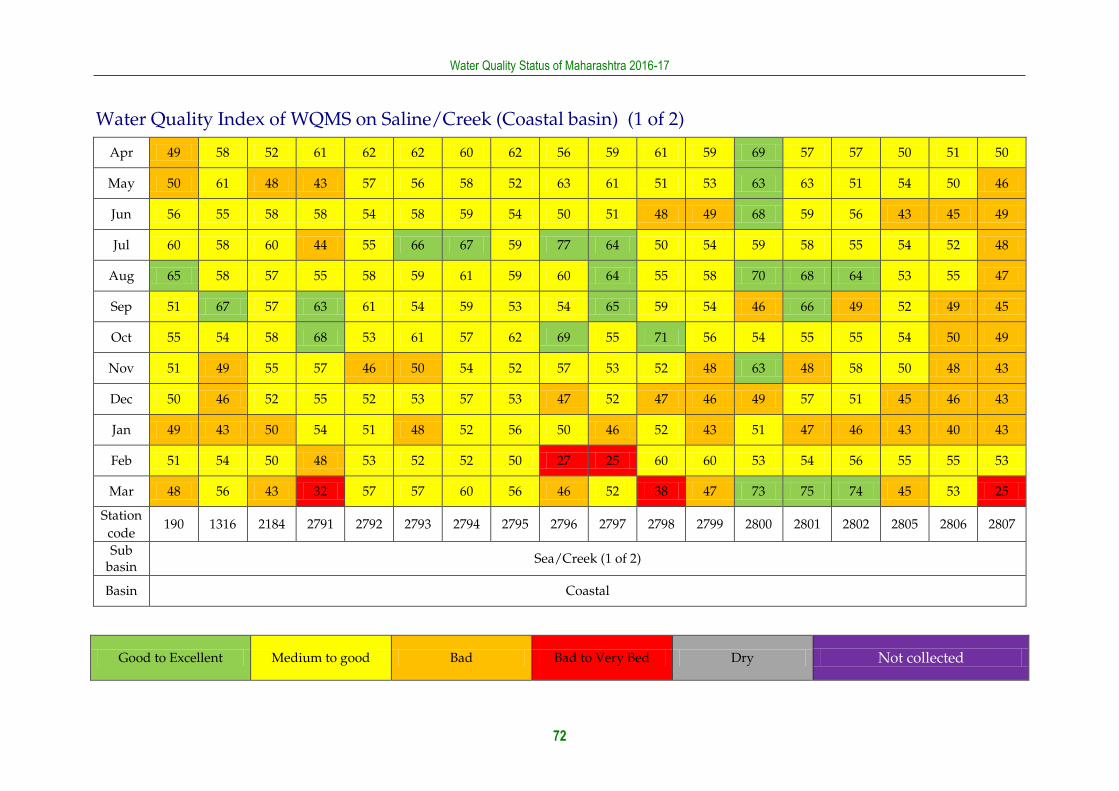
Water Quality Status of Maharashtra 2016-17
72
Water Quality Index of WQMS on Saline/Creek (Coastal basin) (1 of 2)
Apr 49 58 52 61 62 62 60 62 56 59 61 59 69 57 57 50 51 50
May 50 61 48 43 57 56 58 52 63 61 51 53 63 63 51 54 50 46
Jun 56 55 58 58 54 58 59 54 50 51 48 49 68 59 56 43 45 49
Jul 60 58 60 44 55 66 67 59 77 64 50 54 59 58 55 54 52 48
Aug 65 58 57 55 58 59 61 59 60 64 55 58 70 68 64 53 55 47
Sep 51 67 57 63 61 54 59 53 54 65 59 54 46 66 49 52 49 45
Oct 55 54 58 68 53 61 57 62 69 55 71 56 54 55 55 54 50 49
Nov 51 49 55 57 46 50 54 52 57 53 52 48 63 48 58 50 48 43
Dec 50 46 52 55 52 53 57 53 47 52 47 46 49 57 51 45 46 43
Jan 49 43 50 54 51 48 52 56 50 46 52 43 51 47 46 43 40 43
Feb 51 54 50 48 53 52 52 50 27 25 60 60 53 54 56 55 55 53
Mar 48 56 43 32 57 57 60 56 46 52 38 47 73 75 74 45 53 25
Station
code 190 1316 2184 2791 2792 2793 2794 2795 2796 2797 2798 2799 2800 2801 2802 2805 2806 2807
Sub basin
Sea/Creek (1 of 2)
Basin Coastal
Good to Excellent Medium to good Bad Bad to Very Bed Dry Not collected

73
Table No. 24: Surface water quality monitoring stations monitoring Sea/Creek water (1 of 2)
Program Station code River/Nalla Station Name Village Taluka District
SWMP 190 Creek water TTC Creek At Ghansoli Jetty Ghansoli Thane Thane
NWMP 1316 Bassein creek Bassein creek at Vasai Fort, Thane Bassein Vasai Thane
NWMP 2184 Vashi creek Vashi Creek at Airoli Bridge Airoli Thane Thane
NWMP 2791 Ulhas creek Ulhas Creek at Reti Bunder, D/s of Kalyan-Bhiwandi Bridge Kalyan Kalyan Thane
NWMP 2792 Ulhas creek Ulhas Creek at Mumbra Reti Bunder Mumbra Thane Thane
NWMP 2793 Thane creek Thane Creek at Kalwa Road Bridge Kalwa Thane Thane
NWMP 2794 Ulhas creek Ulhas Creek at Kolshet Reti Bunder Kolshet Thane Thane
NWMP 2795 Ulhas creek Ulhas Creek at Gaimukh at Nagla Bunder on Ghod Bunder Road Nagla Thane Thane
NWMP 2796 Ulhas creek Ulhas Creek at Versova Bridge Versova Vasai Thane
NWMP 2797 Bhayander creek Bhayander Creek at D/s of Railway Bridge at Jasal Park Choupathy Navghar Bhayander Thane
NWMP 2798 Kharekuran Murbe creek Kharekuran Murbe Creek Kharekuran Palghar Thane
NWMP 2799 Dandi creek Dandi Creek Dandi Palghar Thane
NWMP 2800 Sarwali creek Sarwali Creek Sarwali Palghar Thane
NWMP 2801 Savta creek Savta Creek Savta Dahanu Thane
NWMP 2802 Dahanu creek Dahanu Creek at Dahanu Fort Danugaon Dahanu Thane
NWMP 2805 Arnala sea Arnala Sea Arnala Vasai Thane
NWMP 2806 Uttan sea Uttan Sea at Bhayander Uttan Bhayander Thane
NWMP 2807 Navapur sea Navapur Sea Navapur Palghar Thane

74
Water Quality Index of WQMS on Saline/Creek (Coastal basin) (2 of 2)
Apr 46 50 51 48 47 54 52 75 65 61 49 51 55 50 50 60 60 63
May 52 49 53 48 51 41 49 55 57 67 48 50 50 48 48 65 64 65
Jun 48 51 51 45 43 45 42 58 62 52 44 47 44 44 43 56 53 51
Jul 54 60 58 50 54 50 50 62 64 67 51 50 50 50 53 61 61 59
Aug 54 65 59 50 51 50 53 67 68 66 49 49 53 50 49 65 65 63
Sep 50 55 55 50 50 48 50 51 49 66 48 51 54 57 50 55 53 50
Oct 51 52 44 51 50 49 47 54 76 67 53 48 45 47 48 63 63 63
Nov 44 53 47 41 46 42 42 44 38 67 40 43 45 49 42 67 65 65
Dec 47 50 46 41 45 44 47 54 43 66 44 44 50 44 50 58 56 57
Jan 40 43 44 41 42 45 47 52 70 64 42 44 40 43 46 56 53 53
Feb 45 51 45 47 45 43 38 51 64 66 50 49 44 46 44 58 58 59
Mar 44 49 46 46 43 48 50 45 41 54 49 49 47 48 43 55 53 51
Station
code 191 1317 1318 2165 2166 2167 2169 2185 2803 2804 2808 2809 2810 2811 2812 2813 2814 2815
Sub basin
Sea/Creek (2 of 2)
Basin Coastal
Good to Excellent Medium to good Bad Bad to Very Bed Dry Not collected

75
Table No. 25: Surface water quality monitoring stations monitoring Sea/Creek water (2 of 2)
Progra
m
Station
code
River/Nalla Station Name Village Taluka District
SWMP 191 Sea Water Arabian Sea behind ONGC Uran Uran Uran Raigad
NWMP 1317 Thane creek Thane creek at Elephanta Island Gharapuri, Elephanta Island Uran Raigad
NWMP 1318 Mahim creek Mahim creek at Mahim Bay Mahim Bandra Mumbai
NWMP 2165 Sea Sea Water at Gateway of India Colaba Colaba Mumbai
NWMP 2166 Sea Sea Water at Charni Road Choupathy Girgaon Mumbai Mumbai
NWMP 2167 Sea Sea Water at Worli Seaface Worli Worli Mumbai
NWMP 2169 Sea Sea Water at Varsova Beach Versova Andheri Mumbai
NWMP 2185 Vashi creek Vashi Creek at Vashi Bridge Vashi Thane Thane
NWMP 2803 Panvel creek Panvel Creek at Kopra Bridge Kopra Panvel Raigad
NWMP 2804 Karambavane creek
Karambavane Creek at Chiplun Karambavane Chiplun Ratnagiri
NWMP 2808 Sea Sea Water at Nariman Point Colaba Colaba Mumbai
NWMP 2809 Sea Sea Water at Malabar Hill Walkeshwar Mumbai Mumbai
NWMP 2810 Sea Sea Water at Haj Ali Worli Worli Mumbai
NWMP 2811 Sea Sea Water at Shivaji Park (Dadar Choupathy) Dadar Dadar Mumbai
NWMP 2812 Sea Sea Water at Juhu Beach Juhugaon Santacruz Mumbai
NWMP 2813 Sea Sea Water at Ganapatipule Ganapatipule Ratnagiri Ratnagiri
NWMP 2814 Sea Sea Water at Bhagwati Bunder, Ratnagiri near Ultra Tech Cement Jetty
Mirkarwada Ratnagiri Ratnagiri
NWMP 2815 Madvi sea Madvi Sea Water at Ratnagiri near Jodhale Maruti Temple
Madvigaon Ratnagiri Ratnagiri

Water Quality Status of Maharashtra 2016-17
76
Spatial map of WQI for Sea /Creek (April 2016)
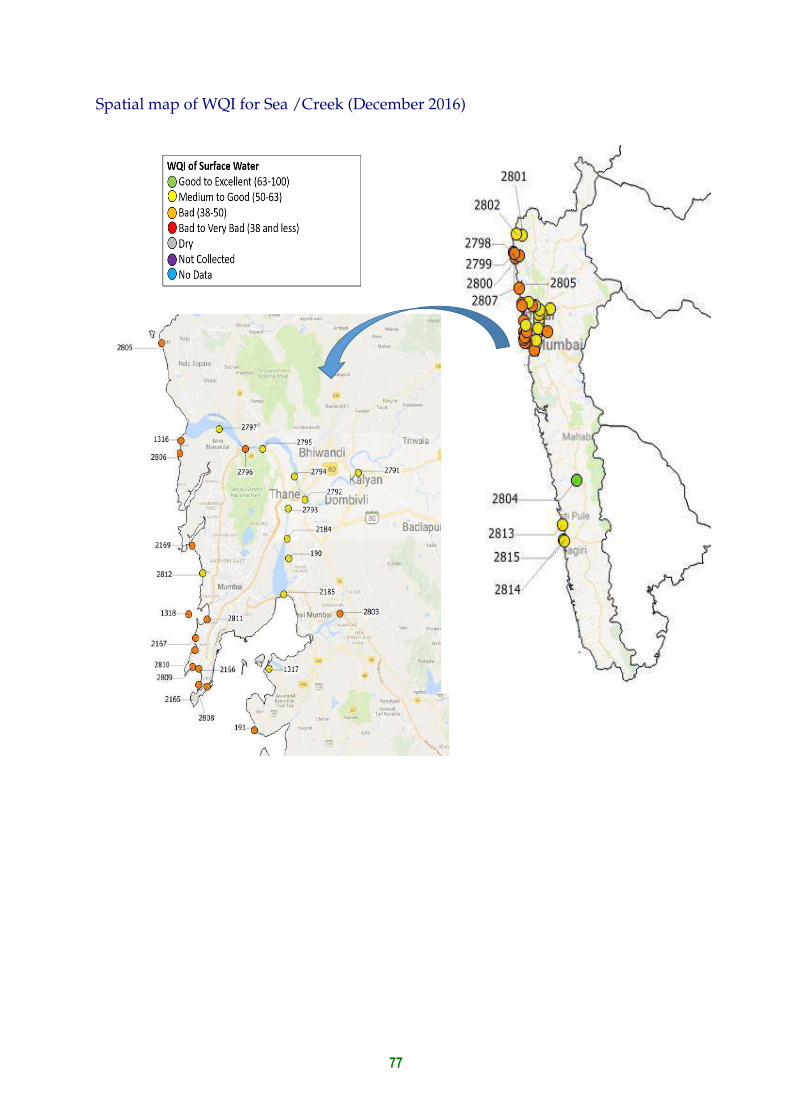
77
Spatial map of WQI for Sea /Creek (December 2016)


79
Groundwater Quality
Water located beneath the earth’s surface in soil pore spaces and aquifers formed due to
formation of cracks in the rocks is termed as Groundwater. It is recharged from rain and surface water and at times the only source for water supply in many regions. Groundwater
constitutes about two thirds of the freshwater resources of the world16 and accounts for
nearly 80 per cent of the rural and 50 per cent of the urban water needs in India17. Groundwater is intensively drawn for agricultural, irrigationand industrial purposes. The
accumulation and inadequade disposal of waste generated by the industries leads to
groundwater pollution. The overall estimates of ground water resources of the entire country shows a marginal decrease about 2 bcm as compared to 200418. In Maharashtra,
CGWB (Central Ground Water Board), GSDA (Groundwater Survey and Development
Agency) and MPCB, monitor the ground water quality across various districts of the state.
MPCB has 65 ground water monitoring stations which monitor water quality twice a year
for parameters like pH, Nitrate, TDS, Hardness, Fluoride, microbial content, Sulphates and
so on. The network of ground water monitoring stations is spatially presented in Map No. 5.
Map No. 5: Network of ground water quality monitoring stations in Maharashtra
16UNESCO/WHO/UNEP, Water Quality Assessments - A Guide to Use of Biota, Sediments and Water in Environmental Monitoring - Second Edition 17M. Dinesh Kumar and Tushaar Shah, Groundwater Pollution and Contamination in India: The Emerging Challenge 18 Central ground water committee,Groundwater Year Book –India 2013-14

80
Water Quality Index for ground water at Kalyan, Navi Mumbai, Raigad and Thane.
Apr 37 3662 46 135 31 42 39 65
Oct 174 115 82 50 27 50 49 64 93 201 97
Station code 205 206 207 208 214 215 217 218 1989 1984 1985 1986 1987 1988
Region Kalyan Navi Mumbai Raigad Thane
Legend
Excellent Good Poor Very Poor Not suitable for drinking Dry Not
collected Closed
Table No. 26: Groundwater quality monitoring stations at Kalyan, Navi Mumbai, Raigad and Thane.
Programm
e
Regional
Office
Statio
n ID
Station Name District Taluka Type of well Village
SWMP Kalyan 205 Dug well opp. KAMA office, MIDC Ph-I, Dombivali Kalyan Dombivali Dug well MIDC,Dombivali
SWMP Kalyan 206 Dug well near Mamta Hospital, Milap Nagar, Dombivali Kalyan Dombivali Dug well MIDC,Dombivali
SWMP Kalyan 207 Dug well at pimpleshwar Temple, MIDC Ph-II, Dombivali
Kalyan Dombivali Dug well MIDC,Dombivali
SWMP Kalyan 208 Dug well addjusent to M/S. Altra pure chem., Sr. No. 45, Hissa No. 3, MIDC Ph-II, Dombivali.
Kalyan Dombivali Dug well MIDC,Dombivali
SWMP Navi Mumbai 214 Borewell at TTCWMA, Mahape Thane Thane Borewell TTCWMA,Mahape
SWMP Navi Mumbai 215 Well water at Turbhe Store, Turbhe Thane Thane Well Turbhe
SWMP Raigad 217 Borewell water at village Milgaon, Taluka - Khalapur, District - Raigad.
Raigad Khalapur Borewell Milgaon
SWMP Raigad 218 Borewell water near MSW site, Murud -Janjira.
Borewell Murud Janjira
NWMP Raigad 1989 Bore well at MWML Site at Taloja Raigad Panvel Bore well Karawla- Taloja
NWMP Thane 1984 Bore well at M/s Tata Iron {} Steel Co. Ltd, S-76 Thane Palghar Bore well
MIDCTarapur, Industrial Estate, Tarapur
NWMP Thane 1985 Dug well at 5 Star Industrial Estate Thane Mira-Bhayander Dug well Kashimira
NWMP Thane 1986 Bore well at Motapada Thane Dahanu Bore well Motapada
NWMP Thane 1987 Bore well at Vasai Thane Vasai Bore well Gokhiware
NWMP Thane 1988 Bore well at Gharatwadi, Palghar Thane Palghar Bore well Aliyali

81
Water Quality Index for ground water at Amravati, Aurangabad and Nashik.
Apr 164 69 137 244 74
Oct 79 12 310 242 96
Station code 2001 2002 2003 1993 2200 2201 2824 2825 221 1990 1991 2204 2816 2817 2818
Region Amravati Aurangabad Nashik
Legend
Excellent Good Poor Very Poor Not suitable for drinking Dry Not collected Closed
Table No. 27: Groundwaterquality monitoring stations at Amravati, Aurangabad and Nashik.
Program
me
Station
ID
GW
Type
Station Name District Taluka Village
NWMP 2001 Tube well
Tube well at water treatment plant of M.C.Achalpur near Post Office. Amravati Achalpur Paratwada
NWMP 2002 Bore well Bore well Opp. Gajanan Maharaj Temple at Anjangaon road. Akola Akot Anjangaon
NWMP 2003 Dug well Dug well at Plot No- 4, Street No. 49-C, at Nehru Bal Udyan Azad Maidan, owned by Yavatmal M.C.
Yavatmal Yavatmal Nehru Bal Udyan Azad Maidan
NWMP 1993 Dug well Dug well at Pandarpur, Gangapur, Aurangabad Aurangabad Gangapur Pandharpur
NWMP 2200 Bore well Bore Well at Katpur, Near Z.P.School Aurangabad Paithan Katpur
NWMP 2201 Dug well Dug Well at Ranjangaon Aurangabad Gangapur Ranjangaon
NWMP 2824 Dug well Dug Well at Naregaon Aurangabad Aurangabad
Naregaon
NWMP 2825 Bore well Bore Well at Wahegaon, near Zilla Parishet School Aurangabad Paithan Wahegaon
SWMP 221 Well Well water of Bappaji, Akolner, Ahmadnagar, Nashik Nashik Ahmadnagar
Akolner
NWMP 1990 Bore well Bore well at BMW Site , Burudgaon Ahmadnagar Ahmednagar
Burudgaon
NWMP 1991 Bore well Bore well at MSW Site, Pathardi, Nashik Nashik Nashik Pathardi
NWMP 2204 Dug well Dug well at Gunjalwadi, Sangamner near Primary Health Care Center.
Ahmadnagar Sangamner Gunjalwadi
NWMP 2816 Dug well Dug Well of Mr. Sampat Walunj, near M/s. Mahajeet Clayton Nashik Nashik Shinde village

Water Quality Status of Maharashtra 2016-17
82
Program
me
Station
ID
GW
Type
Station Name District Taluka Village
NWMP 2817 Bore well Bore Well at Chitali near Wagh vasthi Ahmadnagar Rahata Chitali
NWMP 2818 Bore well Bore Well at M/s. Spectron Ethers Rasegaon near Siddeshwar Mahadev Mandir
Nashik Dindori Rasegaon
Water Quality Index for ground water at Chandrapur and Nagpur.
Apr 71 56 77 128 132 103 136 83
Oct 113 136 146 151 134 112 103 40 86 106 41 71
Station code 2828 209 210 211 212 213 1994 1995 1996 1997 1998 1999 2000 2203 2826 2827
Region Chandrapur Nagpur
Excellent Good Poor Very Poor Not suitable for drinking Dry Not collected Closed
Table No. 28: Groundwater quality monitoring stations at Chandrapur and Nagpur.
Program
me Station
ID
GW Type Station Name District Taluka Village
NWMP 2828 Dug well
Dug Well near Jilla Parishad Primary School Visapur Chandrapur Ballarpur Visapur
SWMP 209 Borewell
Bore well near Pardhi House, Bhandewadi, Nagpur Nagpur Mouda Bhandewadi
SWMP 210 Bore well
Bore well near Dearao Kale House, Bhandewadi, Nagpur Nagpur Mouda Bhandewadi
SWMP 212 Dug well
Grampanchayat Mhasala, Dugwell On Nalla At Mhasala, Taluka - Kamptee, District - Nagpur
Nagpur Kamptee Mhasala
SWMP 213 Dug well
Grampanchayat Kawtha, Dugwell At Kawtha, Taluka - Kamptee, District - Nagpur
Nagpur Kamptee Kawtha
NWMP 1994 Dug well
Dug well At TPS Durgapur near Naseeb Kirana {} general Store.
Chandrapur Chandrapur Durgapur
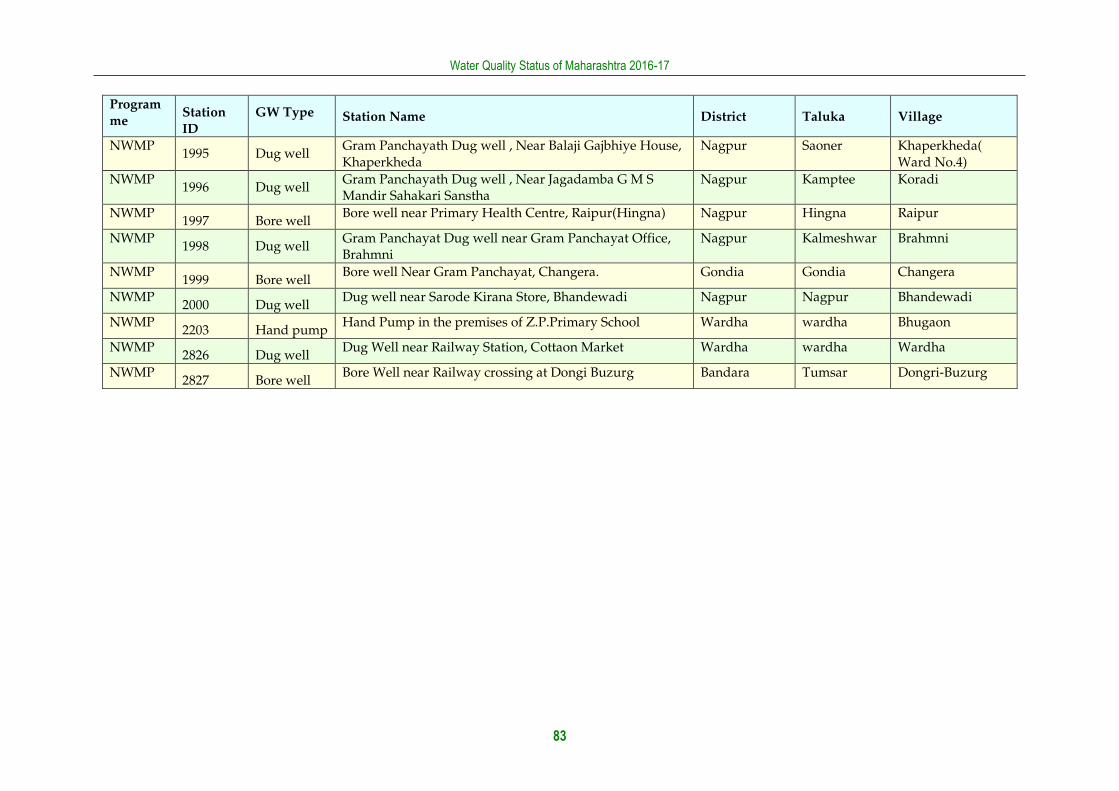
Water Quality Status of Maharashtra 2016-17
83
Program
me Station
ID
GW Type Station Name District Taluka Village
NWMP 1995 Dug well
Gram Panchayath Dug well , Near Balaji Gajbhiye House, Khaperkheda
Nagpur Saoner Khaperkheda( Ward No.4)
NWMP 1996 Dug well
Gram Panchayath Dug well , Near Jagadamba G M S Mandir Sahakari Sanstha
Nagpur Kamptee Koradi
NWMP 1997 Bore well
Bore well near Primary Health Centre, Raipur(Hingna) Nagpur Hingna Raipur
NWMP 1998 Dug well
Gram Panchayat Dug well near Gram Panchayat Office, Brahmni
Nagpur Kalmeshwar Brahmni
NWMP 1999 Bore well
Bore well Near Gram Panchayat, Changera. Gondia Gondia Changera
NWMP 2000 Dug well
Dug well near Sarode Kirana Store, Bhandewadi Nagpur Nagpur Bhandewadi
NWMP 2203 Hand pump
Hand Pump in the premises of Z.P.Primary School Wardha wardha Bhugaon
NWMP 2826 Dug well
Dug Well near Railway Station, Cottaon Market Wardha wardha Wardha
NWMP 2827 Bore well
Bore Well near Railway crossing at Dongi Buzurg Bandara Tumsar Dongri-Buzurg

Water Quality Status of Maharashtra 2016-17
84
Water Quality Index for ground water at Kolhapur and Pune.
Apr 27 33 158 152 135 128 132 25 56 135 140 38 24 497 28 126 310 51 96 414 205
Oct 62 19 182 112 157 145 191 23 198 101 117 20 35 36 19 125 133 132 222 133 142
Station code 219 220 2004 2005 2006 2007 2008 2202 2829 2830 2831 2832 2833 2834 2835 1992 2819 2820 2821 2822 2823
Region Kolhapur Pune
Excellent Good Poor Very Poor Not suitable for drinking Dry Not collected Closed
Table No. 29: Groundwater quality monitoring stations at Kolhapur and Pune.
Programme
Regional Office
Station ID
Station Name District Taluka Village
SWMP Kolhapur 219 Commen well Water At Patwardhan, Lote, Taluka - Khed, District - Rantnagiri
Ratnagiri Khed Well Lote
SWMP Kolhapur 220 Dugwell backside Excel India At Chalkewadi, Taluka - Khed, District - Ratnagiri.
Ratnagiri Khed Dug well Chalkewadi
NWMP Kolhapur 2004 Bore well at Parvati Industrial Estate, Yadrav, Kolhapur
Kolhapur Shirol Bore well Yadrav
NWMP Kolhapur 2005 Bore well at Khanjirenagar, Kolhapur Kolhapur Hatkanangale
Bore well Khanjirenagar
NWMP Kolhapur 2006 Bore well at Shinoli near M/s Aqua Alloy Steel. Kolhapur Chandgad
Bore well Shinoli
NWMP Kolhapur 2007 Bore well at Savali, near Gram Panchayat office. Sangli Miraj Bore well Savali
NWMP Kolhapur 2008 Dug well at Sambarwadi, owned by Shri. Kishan Hali Rajput.
Sangli Miraj Dug well Sambarwadi
NWMP Kolhapur 2202 Dug Well at Ghane Kunt, near Awashi, onwed by shri Rajendra Amre
Ratnagiri Khed Dug well Ghane Kunt

Water Quality Status of Maharashtra 2016-17
85
Progra
mme
Regional
Office
Statio
n ID
Station Name District Taluka Village
NWMP Kolhapur 2829 Bore Well at MIDC Shiroli near M/s. Pratibha Enterprises
Kolhapur Hatkanangale
Bore well Shiroli
NWMP Kolhapur 2830 Bore Well at MIDC Gokul Shirgaon Kolhapur Karvir Bore well Gokul-Shirgaon
NWMP Kolhapur 2831 Dug Well at Sakharali near MIDC Islampur near Krishna Milk Industry
Sangli Walwa Dug well Sakharali
NWMP Kolhapur 2832 Dug Well No.1 at Brahmanwadi-Anjanwel, owned by Shri Vaidya
Ratnagiri Guhagar Dug well Anjanwel
NWMP Kolhapur 2833 Dug Well No.1 at Group Gram Panchayat at Arketwadi, near Masjid
Ratnagiri Khed Dug well Arketwadi
NWMP Kolhapur 2834 Dug Well No.2 at Arketwadi Ratnagiri Khed Dug well Arketwadi
NWMP Kolhapur 2835 Dug Well No.2 at owned by Group Gram Panchayat, Brahmanwadi-Anjanwel
Ratnagiri Guhagar Dug well Anjanwel
NWMP Pune 1992 Dug well at MSW Site, owned by Shri.Dattu Kondiba Borate at Borate Vasthi.
Pune Haveli Dug well Moshi
NWMP Pune 2819 Dug Well Owned by Shri Deshmukh Pune Baramati Dug well Malegaon
NWMP Pune 2820 Dug Well Owned by Shri Shivaji Baban Darekar Pune Shirur Dug well Sanaswadi
NWMP Pune 2821 Bore Well at Bale Railway Station premises Owned by Shri Digambar Joshi
Solapur North Solapur
Bore well Dahegaon
NWMP Pune 2822 Bore Well near Chincholi Solapur Mohol Bore well Chincholi
NWMP Pune 2823 Bore Well at Shete Vasti near old Tuljapur Road Solapur Solapur Dug well Shete vasthi, Tuljapur Naka

86
Spatial map for Ground WQI in Kalyan, Navi Mumbai, Raigad and Thane 2016-17 (April 2016)
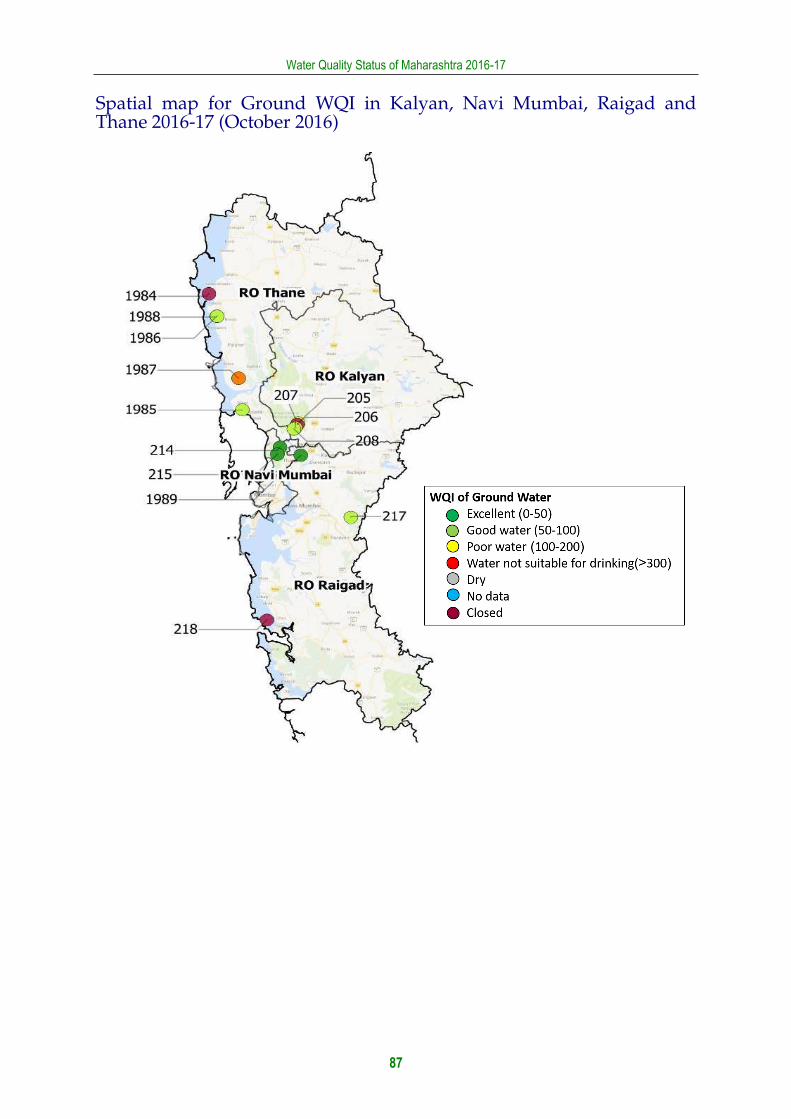
Water Quality Status of Maharashtra 2016-17
87
Spatial map for Ground WQI in Kalyan, Navi Mumbai, Raigad and Thane 2016-17 (October 2016)

Water Quality Status of Maharashtra 2016-17
88
Spatial map for Ground WQI in Amravati, Aurangabad and Nashik 2016-17 (April 2016)

Water Quality Status of Maharashtra 2016-17
89
Spatial map for Ground WQI in Amravati, Aurangabad and Nashik 2016-17 (October 2016)

Water Quality Status of Maharashtra 2016-17
90
Spatial map for Ground WQI in Chandrapur and Nagpur 2016-17 (April 2016)

Water Quality Status of Maharashtra 2016-17
91
Spatial map for Ground WQI in Chandrapur and Nagpur 2016-17 (October 2016)
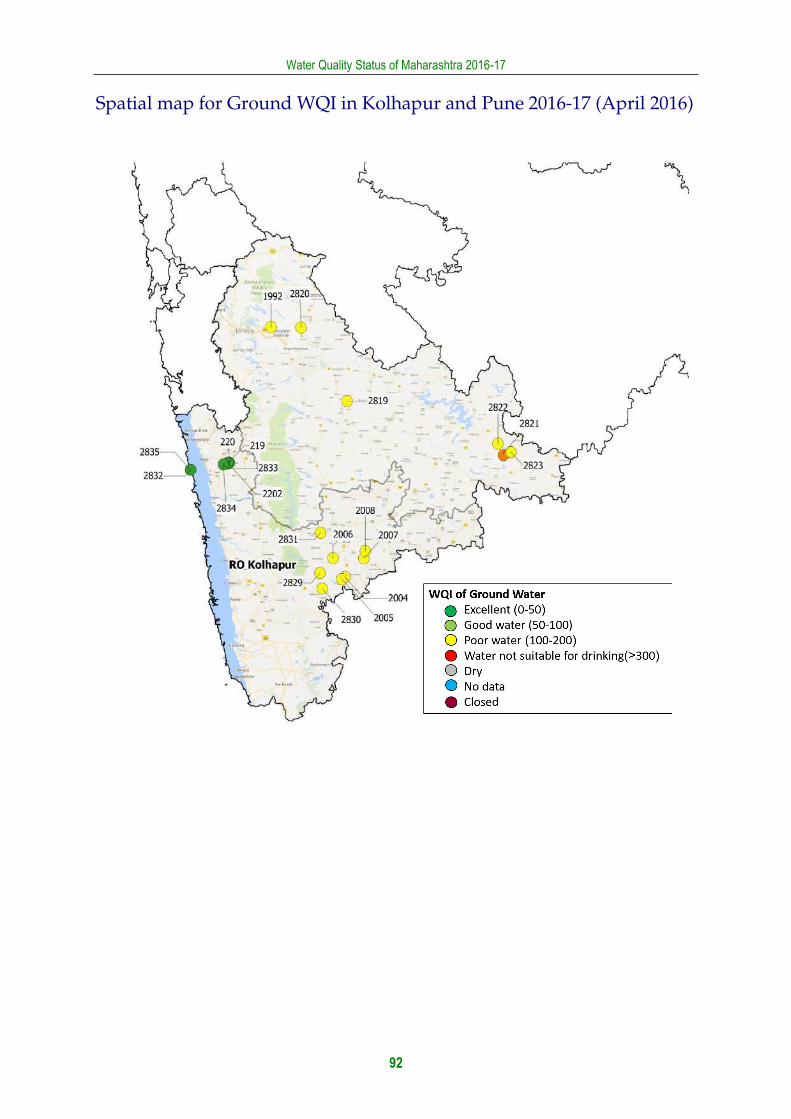
Water Quality Status of Maharashtra 2016-17
92
Spatial map for Ground WQI in Kolhapur and Pune 2016-17 (April 2016)

Water Quality Status of Maharashtra 2016-17
93
Spatial map for Ground WQI in Kolhapur and Pune 2016-17 (October 2016


95
Conclusion
In the year 2016-17, polluted rivers were found in districts of Pune, Mumbai, Nagpur and
Thane. Pawana river, Mutha river, Mithi river, Nag river were polluted throughout the year. Most of the stations were recorded with the dry category which could be attributed to low
rainfall in the year. Whereas few of the samples, 37 observations (10 ground water and 27
surface water), were recorded as Not collected accounting to about 1.3% of the total observations (2882).
The annual average Water Quality Index (WQI) along the basins in Maharashtra shows
increasing trend as compared to previous year except Krishna Basin. The WQI of Krishna Upper sub-basin was observed to be about 65%, less than 20% as compared to last year,
under Good to Excellent category. Also most of the observations of Bhima Upper were noted
under ‘Bad’ and ‘Bad to Very Bad’ category. As compared to other sub basins across
Maharashtra, Godavari Upper, Middle and Manjra sub basins recorded the most number of
observations (greater than 60%) in ‘Good to Excellent’ category. The water samples of sea at
Mumbai and Thane were noted WQI in the category of ‘Medium to Bad’ and noted to be polluted throughout the year.
Out of 66 WQMS of groundwater, 5 WQMS (215, 2819, 2822, 2834, and 2200) recorded WQI
in the category ‘Water Unsuitable for Drinking’ due to high levels of TDS, Hardness, Calcium and chlorides. The bore well in Turbhe, Navi Mumbai (Station code 215) recorded
highest hardness (5960 (CaCO3) mg/litre) and calcium level (1320 (CaCO3) mg/litre) and
TDS levels (43650 mg/litre).

96
Annexure –I: Parametric graphs – Surface water and Ground water
Figure No. 8: Trend of Dissolved Oxygen (DO) levels recorded at WQMS at Tapi basin
2700 2695 1913 2155 1313 2659 1251 2674 2718 196 1252 2667 2658 2710 197 2652 1253 2666 1314 2684 2670 1907
Tapi Upper Tapi Middle
Tapi
Max 6.9 7.5 7.8 7.4 7.2 7.1 7.1 6.8 7.0 6.8 7.0 7.0 6.9 6.7 7.0 7.0 7.0 6.8 7.0 6.9 7.1 7.0
75 perc' 6.9 6.9 7.0 6.5 6.9 7.1 6.9 6.7 6.7 6.0 6.7 6.7 6.8 6.3 5.1 7.0 6.9 6.8 6.9 6.8 7.0 6.9
Average 6.6 5.5 6.1 6.3 6.6 7.1 6.7 6.2 6.1 4.7 6.1 5.8 5.8 6.0 3.7 7.0 6.2 6.8 6.5 6.3 6.9 6.9
25 perc' 6.3 4.0 5.9 5.9 6.4 7.1 6.6 5.7 5.7 3.3 6.0 5.3 5.6 5.5 2.1 7.0 6.2 6.8 5.9 6.1 6.8 6.8
Min 6.1 1.2 1.1 5.5 5.4 7.1 5.4 5.2 4.9 1.7 4.4 3.6 2.9 5.4 1.2 7.0 4.2 6.8 5.4 5.3 6.6 6.7
0
1
2
3
4
5
6
7
8
9
10
mg/
l
Dissolved Oxygen - Tapi Basin

Water Quality Status of Maharashtra 2016-17
97
Figure No. 9: Trend of BOD levels recorded at WQMS at Tapi basin
2700 2695 1913 2155 1313 2659 1251 2674 2718 196 1252 2667 2658 2710 197 2652 1253 2666 1314 2684 2670 1907
Tapi Upper Tapi Middle
Tapi
Max 10.2 11.2 18.4 10.0 8.0 3.0 8.0 8.2 7.4 80.0 9.0 8.6 9.2 5.6 108.0 4.0 6.6 4.0 12.0 6.0 3.2 5.0
75 perc' 8.6 8.5 5.8 8.0 5.0 3.0 4.3 5.8 5.6 17.8 4.0 5.2 5.3 5.2 45.0 4.0 4.7 4.0 4.4 4.8 3.0 4.8
Average 7.3 7.7 6.3 7.4 4.1 3.0 3.8 5.3 4.9 18.6 4.6 4.9 5.0 4.7 38.2 4.0 4.2 4.0 4.4 4.3 2.9 3.9
25 perc' 6.6 6.7 4.7 7.0 3.0 3.0 3.0 4.0 3.8 6.0 3.7 3.8 3.7 4.0 15.5 4.0 3.3 4.0 3.0 4.0 2.7 3.3
Min 3.0 3.5 3.2 4.5 2.4 3.0 2.0 4.0 3.0 4.0 3.0 3.0 2.6 4.0 2.6 4.0 2.4 4.0 3.0 3.0 2.6 2.6
0
15
30
45
60
75
90
mg/
lBOD - Tapi Basin

Water Quality Status of Maharashtra 2016-17
98
Figure No. 10: Trend of pH levels recorded at WQMS at Tapi basin
2700 2695 1913 2155 1313 2659 1251 2674 2718 196 1252 2667 2658 2710 197 2652 1253 2666 1314 2684 2670 1907
Tapi Upper Tapi Middle
Tapi
Max 7.9 8.8 8.2 7.8 8.2 7.4 8.1 7.8 7.5 8.3 8.1 7.8 7.6 7.8 8.4 7.4 8.1 7.2 8.2 7.8 7.8 7.9
75 perc' 7.8 8.0 7.9 7.4 7.8 7.4 8.0 7.5 7.4 7.9 7.9 7.7 7.6 7.7 8.2 7.4 8.0 7.2 8.0 7.6 7.6 7.7
Average 7.7 7.8 7.6 7.3 7.5 7.4 7.6 7.5 7.3 7.7 7.6 7.6 7.4 7.7 7.9 7.4 7.6 7.2 7.7 7.4 7.5 7.5
25 perc' 7.5 7.5 7.2 7.0 7.2 7.4 7.3 7.4 7.2 7.4 7.4 7.6 7.4 7.6 7.4 7.4 7.4 7.2 7.4 7.3 7.3 7.3
Min 7.5 7.3 7.0 7.0 7.2 7.4 7.1 7.4 7.1 7.3 7.2 7.3 7.1 7.6 7.3 7.4 7.0 7.2 7.2 7.0 7.1 7.2
6.5
7.5
8.5
pHpH - Tapi Basin

Water Quality Status of Maharashtra 2016-17
99
Figure No. 11: Trend of Fecal Coliform levels recorded at WQMS at Tapi basin
2700 2695 1913 2155 1313 2659 1251 2674 2718 196 1252 2667 2658 2710 197 2652 1253 2666 1314 2684 2670 1907
Tapi Upper Tapi Middle
Tapi
Max 240.0 540.0 140.0 130.0 4.0 0.0 4.0 2.0 2.0 21.0 2.0 2.0 4.0 4.0 22.0 4.0 2.0 2.0 6.0 4.0 2.0 4.0
75 perc' 157.5 170.0 130.0 120.0 2.0 0.0 2.0 2.0 2.0 14.0 2.0 2.0 3.0 2.5 17.0 4.0 2.0 2.0 2.0 3.5 2.0 4.0
Average 142.3 179.5 81.3 103.8 2.3 0.0 2.3 2.0 2.0 10.4 2.0 2.0 2.7 2.5 12.3 4.0 2.0 2.0 2.4 3.0 2.0 3.5
25 perc' 109.8 117.5 49.0 110.0 2.0 0.0 2.0 2.0 2.0 7.0 2.0 2.0 2.0 2.0 7.0 4.0 2.0 2.0 2.0 2.5 2.0 3.5
Min 79.0 94.0 33.0 49.0 2.0 0.0 2.0 2.0 2.0 4.0 2.0 2.0 2.0 2.0 4.0 4.0 2.0 2.0 2.0 2.0 2.0 2.0
1
26
51
76
101
126
151
176
201
226
251
276
C.F
.U /
100
ml
Fecal Coliform - Tapi Basin

Water Quality Status of Maharashtra 2016-17
100
Figure No. 12: Trend of Dissolved Oxygen (DO) levels recorded at WQMS at Godavari basin (1of 2)
1095 2177 2178 2661 2179 1096 1211 2180 2181 2662 2663 2664 194 2660 2182 2183 2160 178 181 180 184 1312 2158 2159 182 183 179 2161 2657 12 1210 1209 2157 2673
Godavari Upper Godavari Middle Manjra
Godavari
Max 7.1 6.9 7.0 7.5 7.5 7.1 7.1 6.9 6.9 7.5 7.0 7.5 7.0 7.0 7.0 7.6 7.4 7.2 6.8 7.2 7.3 7.8 7.4 7.3 7.5 7.1 7.0 7.2 7.2 7.2 7.6 7.4 7.8 7.3
75 perc' 7.0 6.7 6.6 6.9 6.8 6.9 6.7 6.8 6.6 6.9 6.9 6.9 7.0 6.9 6.7 6.9 7.1 7.1 6.2 6.9 7.2 7.2 7.2 7.1 7.1 6.6 6.9 7.1 7.1 7.1 7.2 7.2 7.0 7.2
Average 6.7 6.3 5.4 6.8 6.1 6.1 5.6 6.2 6.2 6.7 6.3 6.6 6.6 6.7 6.3 6.7 7.0 6.8 5.0 5.9 6.9 7.1 7.1 7.0 5.5 6.0 6.7 6.9 7.0 7.0 7.1 7.0 6.8 7.1
25 perc' 6.7 6.2 4.5 6.8 5.9 5.8 5.3 6.1 6.3 6.4 6.1 6.5 6.3 6.7 6.0 6.7 6.9 6.8 5.0 5.2 6.9 6.9 7.0 6.9 4.9 5.5 6.5 6.9 6.9 6.9 7.0 7.1 6.2 7.0
Min 5.4 5.4 3.2 6.2 2.6 2.1 2.4 4.2 4.2 5.4 4.2 5.4 5.8 6.2 5.1 5.8 6.8 6.2 1.2 3.5 6.3 6.1 6.8 6.8 3.1 4.8 6.4 5.8 6.8 6.8 6.2 5.8 6.2 6.9
0.0
1.0
2.0
3.0
4.0
5.0
6.0
7.0
8.0
9.0
10.0
11.0
12.0
13.0
14.0
15.0
mg/
lDissolved Oxygen - Godavari Basin ( 1 of 2 )

Water Quality Status of Maharashtra 2016-17
101
Figure No. 13: Trend of BOD levels recorded at WQMS at Godavari basin (1 of 2)
1095 2177 2178 2661 2179 1096 1211 2180 2181 2662 2663 2664 194 2660 2182 2183 2160 178 181 180 184 1312 2158 2159 182 183 179 2161 2657 12 1210 1209 2157 2673
Godavari Upper Godavari Middle Manjra
Godavari
Max 8.0 60.0 90.0 4.0 26.0 30.0 22.0 80.0 70.0 6.0 9.0 6.4 6.0 4.0 6.0 5.0 5.0 8.0 85.0 65.0 8.0 4.0 5.0 6.0 90.0 38.0 14.0 8.0 8.0 4.0 7.0 7.0 7.0 5.0
75 perc' 5.0 6.0 18.5 3.7 6.3 6.0 6.8 5.0 5.5 5.0 3.6 4.1 3.5 3.8 5.0 4.0 3.3 5.5 37.0 38.0 6.5 3.0 4.0 4.3 48.0 18.0 6.0 6.0 5.0 4.0 4.0 5.0 7.0 4.0
Average 3.8 9.5 19.7 3.2 7.0 6.6 7.0 11.8 10.9 3.9 3.8 3.6 3.6 3.2 4.1 3.5 3.2 4.7 26.8 24.4 5.2 2.9 3.6 3.8 33.8 14.3 6.9 4.8 4.7 3.4 3.5 4.0 4.8 3.5
25 perc' 3.0 3.8 5.2 3.0 3.8 2.6 3.3 3.0 3.3 2.9 3.0 3.0 3.0 3.0 3.0 3.0 3.0 3.5 9.3 6.0 4.0 3.0 3.0 3.0 7.0 8.0 5.0 4.0 3.3 3.0 2.8 3.0 3.8 3.0
Min 2.0 2.0 4.0 2.0 2.0 2.0 2.4 3.0 3.0 2.0 2.0 2.5 3.0 2.5 3.0 2.4 2.0 2.0 5.0 4.0 3.0 2.0 3.0 2.0 4.0 3.8 4.0 3.0 3.0 2.0 2.0 2.0 3.0 3.0
0.0
15.0
30.0
45.0
60.0
75.0
90.0
mg/
lBOD - Godavari Basin ( 1 of 2 )

Water Quality Status of Maharashtra 2016-17
102
Figure No. 14: Trend of pH levels recorded at WQMS at Godavari basin (1 of 2)
1095 2177 2178 2661 2179 1096 1211 2180 2181 2662 2663 2664 194 2660 2182 2183 2160 178 181 180 184 1312 2158 2159 182 183 179 2161 2657 12 1210 1209 2157 2673
Godavari Upper Godavari Middle Manjra
Godavari
Max 8.7 8.2 7.9 8.0 8.1 8.2 8.2 8.7 8.2 8.1 8.0 8.1 8.2 8.0 8.1 8.2 8.7 8.3 7.9 7.9 8.4 9.0 8.8 9.0 8.0 8.0 8.0 8.4 8.4 8.3 8.6 8.5 8.3 8.4
75 perc' 7.8 7.8 7.6 7.8 7.8 8.0 7.9 8.1 7.9 7.7 7.7 7.8 7.8 7.7 7.8 8.0 8.3 8.1 7.8 7.8 8.2 8.3 8.2 8.2 7.9 7.8 8.0 8.3 8.3 8.1 8.3 8.2 8.2 8.2
Average 7.6 7.7 7.4 7.6 7.7 7.7 7.7 7.8 7.6 7.6 7.6 7.6 7.7 7.5 7.6 7.7 8.1 7.9 7.6 7.7 8.0 8.1 8.1 8.1 7.8 7.5 7.8 8.1 8.1 7.9 8.1 8.1 8.1 8.0
25 perc' 7.3 7.5 7.1 7.4 7.5 7.3 7.4 7.4 7.3 7.5 7.4 7.4 7.5 7.4 7.4 7.5 7.8 7.8 7.6 7.7 7.9 7.8 7.9 7.9 7.8 7.3 7.8 8.0 8.0 7.7 7.9 7.9 7.9 7.8
Min 7.1 7.2 6.7 7.0 7.2 7.1 7.3 7.3 6.8 7.2 7.3 7.3 7.3 7.1 7.2 7.1 7.6 7.5 6.9 7.6 7.7 7.2 7.7 7.7 7.5 6.9 7.5 7.5 7.8 7.4 7.4 7.6 7.9 7.5
5.0
6.0
7.0
8.0
9.0
10.0
pHpH - Godavari Basin ( 1 of 2 )

Water Quality Status of Maharashtra 2016-17
103
Figure No. 15: Trend of Fecal Coliform levels recorded at WQMS at Godavari basin (1 of 2) Figure No. 16: Trend of Dissolved Oxygen (DO) levels
recorded at WQMS at Godavari basin (2 of 2)
1095 2177 2178 2661 2179 1096 1211 2180 2181 2662 2663 2664 194 2660 2182 2183 2160 178 181 180 184 1312 2158 2159 182 183 179 2161 2657 12 1210 1209 2157 2673
Godavari Upper Godavari Middle Manjra
Godavari
Max 2.0 2.0 11.0 2.0 4.0 4.0 7.0 7.0 4.0 2.0 2.0 2.0 2.0 2.0 4.0 2.0 6.0 6.0 35.0 35.0 6.0 4.0 4.0 6.0 25.0 6.0 6.0 6.0 4.0 4.0 6.0 6.0 6.0 4.0
75 perc' 2.0 2.0 7.5 2.0 4.0 3.0 4.0 2.5 2.0 2.0 2.0 2.0 2.0 2.0 2.0 2.0 4.0 5.0 35.0 15.5 6.0 4.0 2.0 2.5 6.0 6.0 6.0 4.5 2.0 4.0 4.0 4.0 4.0 4.0
Average 2.0 2.0 5.9 2.0 2.7 2.5 3.9 2.9 2.3 2.0 2.0 2.0 2.0 2.0 2.3 2.0 2.8 4.6 17.6 12.5 4.9 3.0 2.2 2.7 9.8 4.9 5.2 3.8 2.3 2.9 3.3 3.2 3.3 2.8
25 perc' 2.0 2.0 4.0 2.0 2.0 2.0 2.0 2.0 2.0 2.0 2.0 2.0 2.0 2.0 2.0 2.0 2.0 4.0 5.5 5.0 4.0 2.0 2.0 2.0 6.0 4.0 4.0 2.0 2.0 2.0 2.0 2.0 2.0 2.0
Min 2.0 2.0 2.0 2.0 2.0 2.0 2.0 2.0 2.0 2.0 2.0 2.0 2.0 2.0 2.0 2.0 2.0 4.0 4.0 4.0 4.0 2.0 2.0 2.0 6.0 4.0 4.0 2.0 2.0 2.0 2.0 2.0 2.0 2.0
0.0
15.0
30.0
45.0
60.0
75.0
90.0
C.F
.U /
100
ml
Fecal Coliform - Godavari Basin ( 1 of 2 )
2699 2675 2697 2698 1315 2723 2174 2721 2720 2156 2719 1212 2722 185 189 188 1909 186 1910 1908 187 2170 2171 2173 2172 2175 2176 11
Wardha Weinganga Pranhita & Others
Godavari
Max 6.7 7.6 8.0 7.9 7.7 7.0 7.8 8.0 8.0 8.0 8.0 8.0 7.8 7.8 5.9 5.1 7.0 4.1 7.4 8.7 4.0 8.0 8.0 8.8 7.9 8.0 8.0 8.0
75 perc' 6.6 6.3 7.5 7.5 7.1 6.3 6.8 7.3 7.2 7.6 6.8 7.4 7.3 6.8 3.7 3.0 6.6 3.2 6.7 6.8 2.5 7.6 7.1 7.4 6.9 7.2 7.0 7.4
Average 5.3 5.6 6.9 6.9 6.6 6.0 6.5 6.9 6.8 6.9 6.5 6.5 6.8 6.5 2.7 2.5 6.0 2.3 6.3 6.6 2.1 6.8 6.5 7.0 6.7 6.9 6.6 7.0
25 perc' 4.7 4.5 6.4 6.3 6.5 6.0 6.0 6.4 6.4 6.4 6.1 6.0 6.3 6.3 1.2 1.5 5.7 1.4 5.9 6.0 1.6 6.3 6.0 6.5 6.5 6.6 6.0 6.6
Min 2.5 3.9 6.0 6.0 4.4 4.3 6.0 6.0 6.0 5.6 6.0 4.5 5.7 4.4 0.4 0.6 4.8 0.9 5.2 5.6 1.2 5.5 5.1 6.1 5.9 6.1 5.4 6.4
0.0
1.0
2.0
3.0
4.0
5.0
6.0
7.0
8.0
9.0
10.0
11.0
12.0
13.0
14.0
15.0
mg/
lDissolved Oxygen - Godavari Basin ( 2 of 2 )

Water Quality Status of Maharashtra 2016-17
104
Figure No. 17: Trend of BOD levels recorded at WQMS at Godavari basin (2 of 2)
2699 2675 2697 2698 1315 2723 2174 2721 2720 2156 2719 1212 2722 185 189 188 1909 186 1910 1908 187 2170 2171 2173 2172 2175 2176 11
Wardha Weinganga Pranhita & Others
Godavari
Max 12.6 39.0 8.6 9.0 12.0 11.0 10.0 6.8 6.4 10.8 9.2 12.2 6.0 12.4 60.0 42.0 9.8 42.0 10.4 9.6 47.6 9.8 16.4 6.4 10.0 8.6 9.8 6.8
75 perc' 8.0 9.2 5.9 6.3 7.2 9.0 9.1 5.6 5.8 6.4 7.8 6.9 5.4 8.8 19.7 24.5 7.8 32.0 7.8 7.7 23.3 5.2 7.7 5.6 7.1 6.2 8.1 5.7
Average 7.7 10.6 5.1 5.6 6.3 7.8 8.1 5.2 4.7 6.3 7.1 6.7 4.8 6.7 20.7 19.3 7.3 23.6 6.7 5.9 22.2 5.0 7.4 4.6 6.7 5.4 7.3 4.9
25 perc' 5.5 6.8 3.9 5.0 5.0 6.8 7.0 4.6 3.7 4.9 6.4 5.5 4.2 5.5 10.3 13.0 6.4 15.8 5.1 4.4 16.6 3.7 6.0 3.6 6.0 4.0 6.5 4.2
Min 5.0 3.4 3.0 3.0 3.5 5.0 5.8 4.4 3.0 4.0 5.4 3.4 3.0 3.0 6.4 5.6 5.1 12.0 4.5 3.0 6.4 3.0 3.4 2.5 5.0 3.6 4.6 2.0
0.0
15.0
30.0
45.0
60.0
75.0
90.0
mg/
lBOD - Godavari Basin ( 2 of 2 )

Water Quality Status of Maharashtra 2016-17
105
Figure No. 18: Trend of pH levels recorded at WQMS at Godavari basin (2 of 2)
2699 2675 2697 2698 1315 2723 2174 2721 2720 2156 2719 1212 2722 185 189 188 1909 186 1910 1908 187 2170 2171 2173 2172 2175 2176 11
Wardha Weinganga Pranhita & Others
Godavari
Max 7.9 8.0 8.0 8.0 8.0 8.0 8.0 8.0 8.0 8.0 8.0 8.0 8.0 8.4 7.5 7.9 8.4 7.9 8.0 8.6 7.9 8.5 8.5 8.8 8.2 8.0 8.0 8.0
75 perc' 7.0 7.9 7.9 7.9 8.0 7.8 7.9 7.9 7.9 7.9 8.0 7.8 8.0 7.7 7.3 7.1 7.8 7.4 7.8 8.0 7.2 8.0 8.0 8.0 8.0 7.9 7.7 7.9
Average 7.2 7.5 7.6 7.5 7.6 7.4 7.5 7.4 7.5 7.5 7.5 7.6 7.5 7.5 7.0 7.0 7.6 7.0 7.5 7.8 7.1 7.7 7.6 7.7 7.7 7.5 7.4 7.5
25 perc' 7.0 7.0 7.4 7.0 7.5 7.2 7.0 7.0 7.2 7.3 7.0 7.5 7.2 7.3 6.9 6.9 7.5 6.7 7.4 7.5 6.9 7.4 7.0 7.5 7.5 7.0 7.1 7.3
Min 7.0 6.9 7.0 7.0 6.9 6.7 6.8 6.6 7.0 7.0 7.0 7.2 6.7 7.0 6.6 6.0 6.5 6.5 6.7 7.0 6.6 7.0 6.7 6.8 6.8 7.0 7.0 7.0
5.0
6.0
7.0
8.0
9.0
10.0
pHpH - Godavari Basin ( 2 of 2 )

Water Quality Status of Maharashtra 2016-17
106
Figure No. 19: Trend of Fecal Coliform levels recorded at WQMS at Godavari basin (2 of 2)
2699 2675 2697 2698 1315 2723 2174 2721 2720 2156 2719 1212 2722 185 189 188 1909 186 1910 1908 187 2170 2171 2173 2172 2175 2176 11
Wardha Weinganga Pranhita & Others
Godavari
Max 33.0 240.0 0.0 0.0 240.0 170.0 0.0 0.0 0.0 0.0 0.0 0.0 33.0 240.0 280.0 540.0 140.0 280.0 240.0 140.0 920.0 33.0 170.0 31.0 79.0 0.0 0.0 0.0
75 perc' 33.0 125.0 0.0 0.0 135.0 64.0 0.0 0.0 0.0 0.0 0.0 0.0 24.5 140.0 170.0 225.0 110.0 187.5 130.0 80.3 220.0 22.3 70.0 17.0 62.8 0.0 0.0 0.0
Average 24.6 111.4 0.0 0.0 122.3 59.7 0.0 0.0 0.0 0.0 0.0 0.0 21.3 132.7 143.6 191.2 87.7 170.0 103.4 68.6 218.1 20.6 54.5 19.3 43.5 0.0 0.0 0.0
25 perc' 23.0 72.3 0.0 0.0 79.0 33.0 0.0 0.0 0.0 0.0 0.0 0.0 17.0 106.0 110.0 125.0 59.5 130.0 39.5 40.5 71.5 17.0 23.0 17.0 23.8 0.0 0.0 0.0
Min 10.8 23.0 0.0 0.0 33.0 17.0 0.0 0.0 0.0 0.0 0.0 0.0 13.0 49.0 33.0 94.0 49.0 110.0 13.0 23.0 30.0 11.0 13.0 17.0 22.0 0.0 0.0 0.0
0.0
15.0
30.0
45.0
60.0
75.0
90.0
C.F
.U /
100
ml
Fecal Coliform - Godavari Basin ( 2 of 2 )

Water Quality Status of Maharashtra 2016-17
107
Figure No. 20: Trend of Dissolved Oxygen (DO) levels recorded at WQMS at Bhima upper sub basin -Krishna Basin (1 of 2)
2692 2680 2693 2694 2193 2690 2196 1189 2691 2194 2679 2669 2678 2191 2668 1190 2197 2192
Bhima Upper
Krishna
Max 6.2 6.8 5.8 6.0 6.2 6.1 5.9 6.3 5.9 5.7 5.4 6.3 6.0 5.9 6.0 6.0 6.0 6.3
75 perc' 5.8 6.5 5.0 5.1 5.6 4.7 4.9 5.3 5.3 5.0 4.7 5.9 5.8 5.8 5.8 5.3 5.9 5.4
Average 5.6 6.2 4.2 3.3 3.6 3.3 3.5 3.3 3.5 3.2 3.5 5.0 3.7 4.2 5.1 3.2 5.0 3.5
25 perc' 5.4 5.9 4.0 1.5 2.0 1.7 1.8 1.6 1.5 1.2 2.5 4.4 2.3 2.7 4.7 1.6 4.9 1.5
Min 4.5 5.5 1.1 0.5 0.7 1.0 1.0 0.6 0.8 0.5 1.0 2.6 0.5 2.0 4.0 0.8 0.9 1.0
0.0
1.0
2.0
3.0
4.0
5.0
6.0
7.0
8.0
9.0
10.0
mg/
lDissolved Oxygen - Bhima Upper Sub Basin ( 1 of 2 )

Water Quality Status of Maharashtra 2016-17
108
Figure No. 21: Trend of Biological Oxygen Demand (BOD) levels recorded at WQMS at Bhima upper sub basin -Krishna Basin (1 of 2)
2692 2680 2693 2694 2193 2690 2196 1189 2691 2194 2679 2669 2678 2191 2668 1190 2197 2192
Bhima Upper
Krishna
Max 6.8 4.5 20.0 22.0 33.0 22.0 24.0 30.0 22.0 35.0 35.0 12.5 40.0 46.0 18.5 32.0 22.0 20.0
75 perc' 5.7 4.0 12.5 13.1 13.4 15.0 15.1 15.1 15.1 14.3 18.5 6.5 20.5 22.0 8.3 18.0 7.3 18.3
Average 4.6 3.3 10.9 10.2 11.3 12.5 12.4 12.7 12.0 12.2 17.0 5.8 16.9 18.0 7.5 13.5 6.9 11.9
25 perc' 3.2 2.6 8.9 6.2 6.6 10.2 9.0 6.9 5.7 4.8 9.2 3.8 6.4 4.2 5.3 4.8 4.4 3.5
Min 2.8 2.2 3.6 3.0 3.6 3.0 3.4 2.9 4.4 3.8 6.2 2.8 3.8 3.6 3.2 3.6 2.8 2.8
0.0
15.0
30.0
45.0
60.0
75.0
90.0
mg/
lBOD - Bhima Upper Sub Basin ( 1 of 2 )

Water Quality Status of Maharashtra 2016-17
109
Figure No. 22: Trend of pH levels recorded at WQMS at Bhima upper sub basin -Krishna Basin (1 of 2)
2692 2680 2693 2694 2193 2690 2196 1189 2691 2194 2679 2669 2678 2191 2668 1190 2197 2192
Bhima Upper
Krishna
Max 8.6 8.2 8.4 8.2 8.5 8.3 8.2 8.3 8.5 8.5 8.2 8.4 8.2 8.3 8.4 8.4 8.5 8.8
75 perc' 7.9 8.1 8.0 7.9 7.9 7.9 7.8 7.6 7.8 7.8 7.5 7.7 7.4 7.6 8.1 7.8 8.0 8.0
Average 7.7 7.6 7.6 7.6 7.6 7.6 7.5 7.5 7.6 7.5 7.4 7.5 7.4 7.4 7.8 7.5 7.7 7.7
25 perc' 7.5 7.3 7.4 7.4 7.2 7.3 7.3 7.2 7.3 7.2 7.2 7.1 7.1 7.2 7.5 7.3 7.3 7.4
Min 6.7 7.0 6.8 7.0 7.0 7.1 6.9 6.9 7.0 6.8 7.0 7.0 7.0 7.0 7.2 6.8 7.1 6.9
5.0
6.0
7.0
8.0
9.0
10.0
pHpH - Bhima Upper Sub Basin ( 1 of 2 )

Water Quality Status of Maharashtra 2016-17
110
Figure No. 23: Trend of Fecal Coliform levels recorded at WQMS at Bhima upper sub basin -Krishna Basin (1 of 2)
2692 2680 2693 2694 2193 2690 2196 1189 2691 2194 2679 2669 2678 2191 2668 1190 2197 2192
Bhima Upper
Krishna
Max 12.0 0.0 175.0 120.0 50.0 275.0 350.0 1600.0 550.0 900.0 350.0 25.0 550.0 350.0 35.0 350.0 40.0 425.0
75 perc' 12.0 0.0 126.3 120.0 50.0 140.0 275.0 70.0 200.0 225.0 350.0 25.0 343.8 350.0 35.0 350.0 40.0 406.3
Average 12.0 0.0 101.0 93.3 37.0 126.0 193.0 350.0 235.0 289.0 262.0 22.5 275.0 288.0 33.3 205.0 37.5 248.3
25 perc' 12.0 0.0 77.3 80.0 20.0 70.0 140.0 25.0 170.0 80.0 225.0 20.0 181.3 350.0 32.5 110.0 35.0 90.0
Min 12.0 0.0 24.0 40.0 20.0 65.0 50.0 25.0 80.0 40.0 110.0 20.0 50.0 40.0 30.0 45.0 35.0 20.0
0.0
15.0
30.0
45.0
60.0
75.0
90.0
C.F
.U /
100
ml
Fecal Coliform - Bhima Upper Sub Basin ( 1 of 2 )
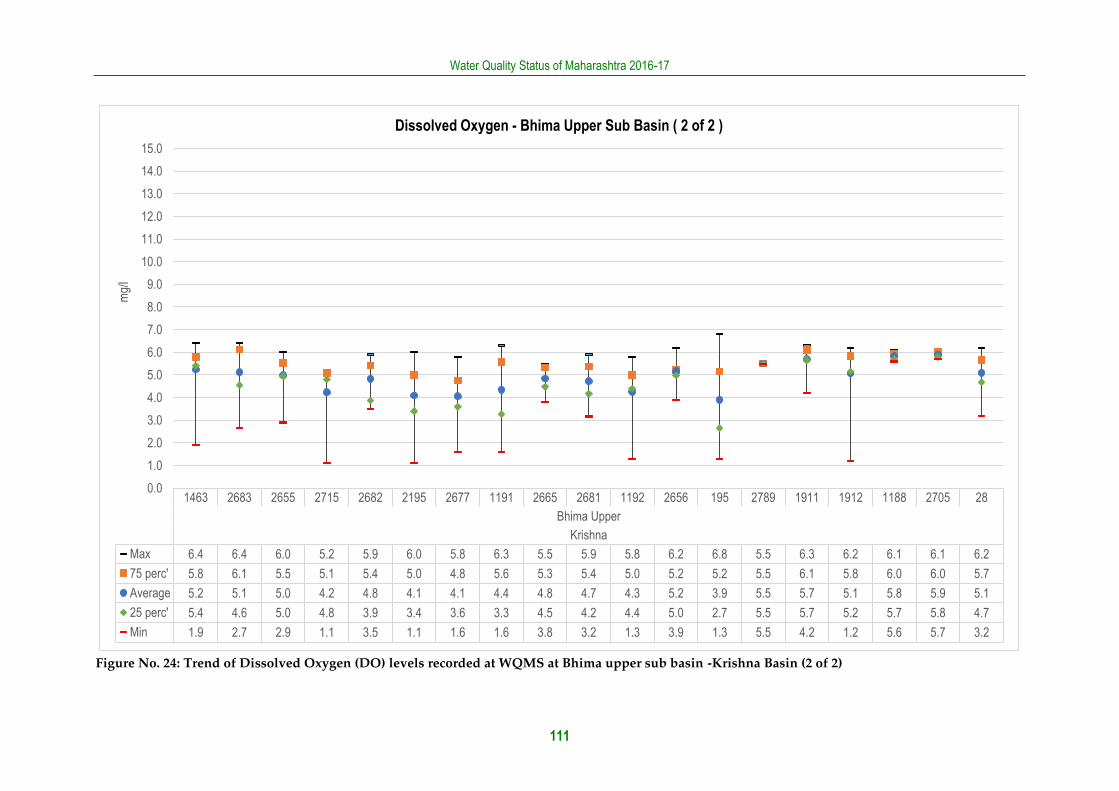
Water Quality Status of Maharashtra 2016-17
111
Figure No. 24: Trend of Dissolved Oxygen (DO) levels recorded at WQMS at Bhima upper sub basin -Krishna Basin (2 of 2)
1463 2683 2655 2715 2682 2195 2677 1191 2665 2681 1192 2656 195 2789 1911 1912 1188 2705 28
Bhima Upper
Krishna
Max 6.4 6.4 6.0 5.2 5.9 6.0 5.8 6.3 5.5 5.9 5.8 6.2 6.8 5.5 6.3 6.2 6.1 6.1 6.2
75 perc' 5.8 6.1 5.5 5.1 5.4 5.0 4.8 5.6 5.3 5.4 5.0 5.2 5.2 5.5 6.1 5.8 6.0 6.0 5.7
Average 5.2 5.1 5.0 4.2 4.8 4.1 4.1 4.4 4.8 4.7 4.3 5.2 3.9 5.5 5.7 5.1 5.8 5.9 5.1
25 perc' 5.4 4.6 5.0 4.8 3.9 3.4 3.6 3.3 4.5 4.2 4.4 5.0 2.7 5.5 5.7 5.2 5.7 5.8 4.7
Min 1.9 2.7 2.9 1.1 3.5 1.1 1.6 1.6 3.8 3.2 1.3 3.9 1.3 5.5 4.2 1.2 5.6 5.7 3.2
0.0
1.0
2.0
3.0
4.0
5.0
6.0
7.0
8.0
9.0
10.0
11.0
12.0
13.0
14.0
15.0
mg/
lDissolved Oxygen - Bhima Upper Sub Basin ( 2 of 2 )

Water Quality Status of Maharashtra 2016-17
112
Figure No. 25: Trend of Biological Oxygen Demand (BOD) levels recorded at WQMS at Bhima upper sub basin -Krishna Basin (2 of 2)
1463 2683 2655 2715 2682 2195 2677 1191 2665 2681 1192 2656 195 2789 1911 1912 1188 2705 28
Bhima Upper
Krishna
Max 12.5 24.0 9.2 11.5 25.0 35.0 14.0 17.5 10.0 20.0 19.0 8.5 48.0 4.0 7.5 9.5 8.0 4.0 15.0
75 perc' 6.5 7.0 6.8 10.0 7.8 11.6 11.0 8.7 8.7 7.1 8.4 6.1 21.5 4.0 5.1 7.1 6.0 3.8 11.1
Average 5.5 6.6 6.3 8.4 8.1 11.1 9.5 6.6 7.4 7.0 8.1 5.1 18.9 4.0 4.4 5.9 5.0 3.6 7.8
25 perc' 4.2 3.7 5.9 7.0 5.5 6.2 8.3 3.8 6.2 4.7 5.1 3.9 11.5 4.0 3.2 4.4 3.5 3.4 5.0
Min 3.0 2.6 3.2 4.5 3.4 3.0 3.4 2.8 4.0 3.2 4.6 3.2 7.0 4.0 3.0 3.4 3.0 3.2 3.2
0.0
15.0
30.0
45.0
60.0
75.0
90.0
mg/
lBOD - Bhima Upper Sub Basin ( 2 of 2 )

Water Quality Status of Maharashtra 2016-17
113
Figure No. 26: Trend of pH levels recorded at WQMS at Bhima upper sub basin -Krishna Basin (2 of 2)
1463 2683 2655 2715 2682 2195 2677 1191 2665 2681 1192 2656 195 2789 1911 1912 1188 2705 28
Bhima Upper
Krishna
Max 9.0 8.0 8.5 8.4 9.0 8.7 8.4 8.5 8.6 8.9 8.5 8.6 8.2 7.4 8.7 8.7 8.4 8.1 8.7
75 perc' 8.2 7.7 8.2 8.4 8.3 8.2 8.0 8.2 8.4 8.3 8.2 8.1 8.1 7.4 8.4 8.3 8.3 8.0 8.4
Average 7.9 7.6 7.9 7.8 8.1 8.0 7.6 7.9 8.1 8.2 7.9 7.9 7.8 7.4 8.2 8.2 8.1 7.9 8.1
25 perc' 7.5 7.6 7.5 7.3 7.9 7.7 7.4 7.6 7.8 8.1 7.7 7.7 7.5 7.4 7.9 8.0 8.0 7.7 7.9
Min 7.0 6.9 7.2 7.3 7.3 7.1 7.1 7.1 7.4 7.6 7.1 7.2 7.3 7.4 7.7 7.5 7.9 7.6 7.7
5.0
6.0
7.0
8.0
9.0
10.0
pHpH - Bhima Upper Sub Basin ( 2 of 2 )

Water Quality Status of Maharashtra 2016-17
114
Figure No. 27: Trend of Fecal Coliform levels recorded at WQMS at Bhima upper sub basin -Krishna Basin (2 of 2)
1463 2683 2655 2715 2682 2195 2677 1191 2665 2681 1192 2656 195 2789 1911 1912 1188 2705 28
Bhima Upper
Krishna
Max 35.0 25.0 20.0 30.0 95.0 50.0 20.0 80.0 0.0 35.0 45.0 2.0 22.0 275.0 225.0 275.0 70.0 40.0 20.0
75 perc' 32.5 18.3 17.8 30.0 67.5 47.5 20.0 60.0 0.0 33.8 43.8 2.0 7.0 275.0 20.0 38.8 55.3 32.8 17.0
Average 28.3 13.7 13.3 30.0 55.0 45.0 17.8 51.7 0.0 27.2 42.5 2.0 6.1 275.0 40.5 60.3 40.5 25.5 13.3
25 perc' 25.0 11.0 11.0 30.0 35.0 42.5 16.3 37.5 0.0 25.0 41.3 2.0 2.0 275.0 10.0 23.8 25.8 18.3 10.0
Min 20.0 2.0 2.1 30.0 30.0 40.0 14.0 35.0 0.0 13.0 40.0 2.0 2.0 275.0 5.0 7.0 11.0 11.0 4.0
0.0
15.0
30.0
45.0
60.0
75.0
90.0
C.F
.U /
100
ml
Fecal Coliform - Bhima Upper Sub Basin ( 2 of 2 )

Water Quality Status of Maharashtra 2016-17
115
Figure No. 28: Trend of Dissolved Oxygen (DO) levels recorded at WQMS at Krishna upper sub basin -Krishna Basin
2716 1194 2186 2190 2711 2717 2188 2187 200 1904 2189 36 198 1905 199 1906 1311 37 2163 1310 1153
Krishna Upper
Krishna
Max 6.3 6.4 6.9 6.3 6.3 6.2 6.3 6.2 7.1 7.1 6.5 6.5 7.1 7.1 7.1 7.1 7.1 7.1 6.9 7.0 7.2
75 perc' 6.2 6.3 5.7 5.9 6.0 5.9 6.0 6.1 6.8 6.9 5.6 5.8 6.7 6.9 6.9 6.8 6.8 7.0 6.8 6.9 6.9
Average 5.8 5.9 5.5 5.3 5.1 5.5 5.4 5.2 6.3 6.4 5.1 5.3 6.2 6.2 6.4 6.3 5.9 6.5 5.9 6.2 6.4
25 perc' 5.8 5.9 5.4 4.8 5.0 5.1 5.4 4.7 5.9 6.4 5.0 5.3 5.8 5.7 6.3 5.9 4.7 5.9 4.8 5.8 6.2
Min 4.6 4.1 3.9 3.7 2.5 4.2 3.4 2.6 5.0 4.5 2.4 2.5 4.5 4.7 4.6 5.2 4.0 5.8 4.5 4.2 4.8
0.0
1.0
2.0
3.0
4.0
5.0
6.0
7.0
8.0
9.0
10.0
11.0
12.0
13.0
14.0
15.0
mg/
lDissolved Oxygen - Krishna Upper Sub Basin

Water Quality Status of Maharashtra 2016-17
116
Figure No. 29: Trend of Biological Oxygen Demand (BOD) levels recorded at WQMS at Krishna upper sub basin - Krishna Basin
2716 1194 2186 2190 2711 2717 2188 2187 200 1904 2189 36 198 1905 199 1906 1311 37 2163 1310 1153
Krishna Upper
Krishna
Max 5.0 5.0 6.5 10.0 10.0 12.5 12.0 14.0 3.0 3.2 8.6 8.8 3.4 5.2 3.2 3.0 5.8 3.0 5.2 3.4 3.4
75 perc' 4.8 4.1 6.3 5.9 7.9 7.6 6.9 6.5 2.8 2.7 6.7 6.1 3.0 2.8 2.7 2.7 3.3 2.7 3.3 2.9 2.7
Average 3.9 3.5 5.5 5.0 6.1 5.8 5.4 5.6 2.5 2.4 5.9 5.3 2.6 2.7 2.5 2.4 3.1 2.4 2.9 2.6 2.5
25 perc' 3.0 2.8 5.0 3.7 3.9 4.2 3.4 3.1 2.2 2.2 4.8 4.2 2.4 2.2 2.2 2.2 2.2 2.2 2.2 2.2 2.2
Min 2.6 2.6 3.5 2.6 2.8 2.8 2.8 2.8 2.0 2.0 4.5 2.8 2.0 2.0 2.0 2.0 2.0 2.0 2.2 2.0 2.0
0.0
15.0
30.0
45.0
60.0
75.0
90.0
mg/
lBOD - Krishna Upper Sub Basin

Water Quality Status of Maharashtra 2016-17
117
Figure No. 30: Trend of pH levels recorded at WQMS at Krishna upper sub basin -Krishna Basin
2716 1194 2186 2190 2711 2717 2188 2187 200 1904 2189 36 198 1905 199 1906 1311 37 2163 1310 1153
Krishna Upper
Krishna
Max 8.3 8.4 8.4 8.6 8.5 8.5 8.4 8.7 8.1 8.2 8.3 8.4 8.3 8.1 8.3 7.8 8.2 7.6 8.2 8.1 8.3
75 perc' 7.4 7.8 8.1 8.0 8.2 8.1 8.1 8.3 7.8 8.0 7.9 7.9 7.6 7.8 7.7 7.6 7.7 7.5 7.9 7.9 7.9
Average 7.3 7.6 7.9 7.8 7.9 7.9 7.9 8.1 7.5 7.7 7.7 7.6 7.5 7.6 7.6 7.4 7.6 7.3 7.6 7.7 7.6
25 perc' 7.0 7.4 7.8 7.5 7.8 7.8 7.8 7.9 7.3 7.3 7.4 7.3 7.4 7.4 7.4 7.2 7.3 7.2 7.3 7.4 7.4
Min 6.8 7.1 7.5 7.1 7.1 7.4 7.4 7.5 7.2 7.2 7.2 6.9 7.1 7.2 7.2 7.1 7.2 6.8 7.2 7.2 7.1
5.0
6.0
7.0
8.0
9.0
10.0
11.0
12.0
13.0
14.0
15.0
pHpH - Krishna Upper Sub Basin

Water Quality Status of Maharashtra 2016-17
118
Figure No. 31: Trend of Fecal Coliform recorded at WQMS at Krishna upper sub basin -Krishna Basin
2716 1194 2186 2190 2711 2717 2188 2187 200 1904 2189 36 198 1905 199 1906 1311 37 2163 1310 1153
Krishna Upper
Krishna
Max 25.0 20.0 35.0 35.0 45.0 900.0 35.0 250.0 0.0 0.0 45.0 40.0 0.0 0.0 0.0 0.0 0.0 0.0 0.0 0.0 0.0
75 perc' 11.5 20.0 32.5 21.3 31.0 25.0 17.0 67.5 0.0 0.0 37.5 35.0 0.0 0.0 0.0 0.0 0.0 0.0 0.0 0.0 0.0
Average 10.4 12.4 21.0 17.6 21.4 194.6 17.0 68.3 0.0 0.0 28.3 25.6 0.0 0.0 0.0 0.0 0.0 0.0 0.0 0.0 0.0
25 perc' 7.5 7.0 11.8 10.3 10.0 17.0 11.5 17.8 0.0 0.0 22.5 15.0 0.0 0.0 0.0 0.0 0.0 0.0 0.0 0.0 0.0
Min 2.0 2.0 6.0 5.0 9.0 14.0 9.0 13.0 0.0 0.0 8.0 4.0 0.0 0.0 0.0 0.0 0.0 0.0 0.0 0.0 0.0
0.0
15.0
30.0
45.0
60.0
75.0
90.0
C.F
.U /
100
ml
Fecal Coliform - Krishna Upper Sub Basin

Water Quality Status of Maharashtra 2016-17
119
Figure No. 32: Trend of Dissolved Oxygen (DO) levels recorded at WQMS at West flowing s (Coastal basin) (1 OF 2)
2654 2653 1094 1093 2162 1461 1092 2712 2709 2707 2706 2696 2168 2714 2676 202 2164 2713 201 203 204
West Flowing Rivers
Coastal
Max 7.6 7.5 7.5 7.5 7.3 7.5 6.2 7.3 7.3 7.4 7.6 7.5 3.9 7.2 7.2 7.1 7.1 7.1 7.1 7.3 7.1
75 perc' 7.0 6.9 7.2 7.0 6.8 7.3 4.9 6.8 7.2 7.0 7.1 6.8 3.8 7.1 7.1 7.0 7.1 7.0 6.9 7.0 7.1
Average 6.7 6.6 6.8 6.6 6.6 6.8 3.9 6.7 6.7 6.8 6.8 6.8 3.0 6.8 6.7 6.9 6.9 6.8 6.4 6.7 6.9
25 perc' 6.5 6.3 6.5 6.4 6.4 6.4 2.7 6.5 6.4 6.6 6.4 6.6 2.5 6.8 6.6 6.9 6.7 6.8 6.1 6.5 6.9
Min 6.0 5.4 6.2 5.6 6.1 6.2 1.9 6.3 5.9 6.3 6.0 6.3 1.3 5.5 5.4 6.2 6.4 6.3 3.4 5.8 6.1
0.0
1.0
2.0
3.0
4.0
5.0
6.0
7.0
8.0
9.0
10.0
11.0
12.0
13.0
14.0
15.0
mg/
lDissolved Oxygen - West Flowing Rivers ( 1 of 2 )

Water Quality Status of Maharashtra 2016-17
120
Figure No. 33: Trend of Biological Oxygen Demand (BOD) levels recorded at WQMS at West flowing riverss (Coastal basin) (1 of 2)
2654 2653 1094 1093 2162 1461 1092 2712 2709 2707 2706 2696 2168 2714 2676 202 2164 2713 201 203 204
West Flowing Rivers
Coastal
Max 4.0 6.0 4.6 5.0 4.0 4.8 75.0 4.0 6.0 4.4 4.6 7.0 250.0 3.0 2.8 2.4 2.4 2.6 7.2 3.0 3.0
75 perc' 3.9 3.5 4.0 3.9 4.0 3.6 22.3 4.0 4.0 3.4 4.0 3.7 74.0 2.3 2.5 2.1 2.2 2.2 2.5 2.4 2.2
Average 3.4 3.5 3.4 3.5 3.6 3.4 19.5 3.6 3.6 3.3 3.6 3.7 70.0 2.2 2.4 2.1 2.1 2.2 2.7 2.3 2.2
25 perc' 3.0 3.0 3.0 3.0 3.2 3.0 7.5 3.3 3.0 3.0 3.0 3.0 39.5 2.0 2.0 2.0 2.0 2.0 2.0 2.0 2.0
Min 2.4 2.6 2.8 3.0 3.0 2.6 3.0 2.6 2.8 2.6 3.0 2.6 16.0 2.0 2.0 2.0 2.0 2.0 2.0 2.0 2.0
0.0
15.0
30.0
45.0
60.0
75.0
90.0
mg/
lBOD - West Flowing Rivers ( 1 of 2 )

Water Quality Status of Maharashtra 2016-17
121
Figure No. 34: Trend of pH levels recorded at WQMS at West flowing rivers (Coastal basin) (1 of 2)
2654 2653 1094 1093 2162 1461 1092 2712 2709 2707 2706 2696 2168 2714 2676 202 2164 2713 201 203 204
West Flowing Rivers
Coastal
Max 8.4 8.1 8.2 8.0 7.8 8.3 8.2 8.9 8.9 8.4 8.3 8.3 8.2 8.0 8.8 8.2 8.2 8.2 7.7 8.0 8.1
75 perc' 7.8 7.6 7.9 7.4 7.6 8.0 7.5 8.6 8.0 8.0 8.0 8.0 7.3 7.5 8.2 7.9 7.4 7.5 7.4 7.7 7.8
Average 7.5 7.4 7.6 7.3 7.4 7.9 7.3 7.9 7.8 7.7 7.7 7.7 7.3 7.3 7.8 7.6 7.4 7.4 7.3 7.5 7.4
25 perc' 7.0 7.2 7.4 7.1 7.4 7.8 7.0 7.5 7.4 7.4 7.3 7.5 7.1 7.2 7.4 7.3 7.3 7.3 7.2 7.3 7.3
Min 6.4 6.5 6.9 6.4 6.6 7.3 6.5 6.8 6.8 7.1 6.8 7.0 6.9 6.7 7.1 7.1 6.5 6.8 6.8 6.9 6.7
0.0
1.0
2.0
3.0
4.0
5.0
6.0
7.0
8.0
9.0
10.0
pHpH - West Flowing Rivers ( 1 of 2 )

Water Quality Status of Maharashtra 2016-17
122
Figure No. 35: Trend of Fecal Coliform recorded at WQMS at West flowing rivers (Coastal basin) (1 of 2)
2654 2653 1094 1093 2162 1461 1092 2712 2709 2707 2706 2696 2168 2714 2676 202 2164 2713 201 203 204
West Flowing Rivers
Coastal
Max 430.0 920.0 43.0 49.0 33.0 46.0 110.0 34.0 49.0 130.0 220.0 110.0 920.0 0.0 0.0 0.0 0.0 0.0 0.0 0.0 0.0
75 perc' 62.8 91.8 21.3 22.3 23.0 23.5 79.0 33.0 31.0 18.0 10.3 22.5 920.0 0.0 0.0 0.0 0.0 0.0 0.0 0.0 0.0
Average 83.4 141.7 15.9 19.5 16.3 16.3 73.6 20.9 23.4 21.9 26.1 24.4 566.7 0.0 0.0 0.0 0.0 0.0 0.0 0.0 0.0
25 perc' 15.8 16.0 8.5 16.5 8.9 5.9 68.3 10.5 11.0 7.6 3.9 11.0 270.0 0.0 0.0 0.0 0.0 0.0 0.0 0.0 0.0
Min 7.0 6.8 4.5 2.0 2.0 2.0 34.0 4.0 4.5 1.8 1.8 4.0 220.0 0.0 0.0 0.0 0.0 0.0 0.0 0.0 0.0
0.0
15.0
30.0
45.0
60.0
75.0
90.0
C.F
.U /
100
ml
Fecal Coliform - West Flowing Rivers ( 1 of 2 )

Water Quality Status of Maharashtra 2016-17
123
Figure No. 36: Trend of Dissolved Oxygen (DO) levels recorded at WQMS at West flowing riverss (Coastal basin) (2 of 2)
2701 2702 2703 2704 2689 2199 1151 2688 2687 192 193 2686 1462 2672 2651 1152 216 2685 2198 2671
West Flowing Rivers
Coastal
Max 7.2 7.1 7.0 7.1 7.5 7.2 7.6 7.5 6.9 7.3 7.3 6.9 7.6 7.3 7.0 7.6 7.6 7.1 6.8 6.9
75 perc' 7.0 6.9 6.9 6.9 6.7 7.0 7.0 6.9 6.7 6.8 6.5 6.6 6.6 7.0 6.9 7.0 6.2 6.7 6.4 5.2
Average 6.8 6.7 6.5 6.6 6.5 6.2 6.7 6.5 6.5 6.5 6.3 6.5 6.4 6.7 6.6 6.6 4.9 6.0 5.8 4.9
25 perc' 6.6 6.4 6.1 6.4 6.3 5.8 6.3 6.0 6.2 6.4 6.5 6.3 6.2 6.5 6.3 6.3 3.0 5.7 5.4 4.0
Min 6.2 5.9 5.3 5.5 5.7 4.2 5.8 5.5 5.7 4.9 3.3 6.2 5.5 6.4 5.9 6.1 2.6 3.6 4.8 3.7
0.0
1.0
2.0
3.0
4.0
5.0
6.0
7.0
8.0
9.0
10.0
11.0
12.0
13.0
14.0
15.0
mg/
lDissolved Oxygen - West Flowing Rivers ( 2 of 2 )

Water Quality Status of Maharashtra 2016-17
124
Figure No. 37: Trend ofBiological Oxygen Demand (BOD) levels recorded at WQMS at West flowing rivers (Coastal basin) (2 of 2)
2701 2702 2703 2704 2689 2199 1151 2688 2687 192 193 2686 1462 2672 2651 1152 216 2685 2198 2671
West Flowing Rivers
Coastal
Max 2.6 3.0 3.0 3.0 5.0 3.4 5.0 6.0 4.8 10.0 18.0 4.4 5.0 3.8 16.0 5.0 28.0 18.0 60.0 65.0
75 perc' 2.2 2.4 2.7 2.5 4.0 2.8 4.3 4.0 4.0 4.0 4.1 4.0 4.1 3.3 4.1 4.1 20.0 5.3 8.3 16.5
Average 2.2 2.3 2.4 2.3 3.6 2.5 3.7 4.0 3.8 4.0 5.0 3.7 3.8 3.1 4.6 3.6 13.0 5.5 10.6 15.2
25 perc' 2.0 2.0 2.2 2.2 3.0 2.2 3.0 3.8 3.2 3.0 3.2 3.2 3.4 2.8 3.2 3.0 4.9 3.9 3.9 7.8
Min 2.0 2.0 2.0 2.0 2.8 2.0 2.6 3.0 3.0 3.0 3.0 3.0 3.0 2.6 2.6 2.8 3.8 3.0 3.0 4.0
0.0
15.0
30.0
45.0
60.0
75.0
90.0
mg/
lBOD - West Flowing Rivers ( 2 of 2 )

Water Quality Status of Maharashtra 2016-17
125
Figure No. 38 : Trend of pH levels recorded at WQMS at West flowing s (Coastal basin) (2 of 2)
2701 2702 2703 2704 2689 2199 1151 2688 2687 192 193 2686 1462 2672 2651 1152 216 2685 2198 2671
West Flowing Rivers
Coastal
Max 7.9 7.9 7.8 7.8 8.2 8.0 7.9 7.5 7.5 7.7 7.6 7.6 8.3 8.4 8.0 7.9 7.8 7.5 8.1 8.0
75 perc' 7.5 7.6 7.5 7.7 7.9 7.5 7.4 7.1 7.2 7.6 7.6 7.1 7.2 8.1 7.8 7.6 7.1 7.2 7.7 7.8
Average 7.4 7.4 7.3 7.4 7.3 7.4 7.1 7.0 7.0 7.2 7.3 7.0 7.1 7.7 7.5 7.4 6.9 7.0 7.4 7.5
25 perc' 7.3 7.3 7.2 7.4 6.8 7.3 6.8 6.9 6.8 6.8 7.1 6.9 6.8 7.5 7.4 7.3 6.6 6.8 7.2 7.2
Min 6.2 6.2 6.7 6.8 6.5 6.8 6.6 6.6 6.6 6.6 6.8 6.6 6.6 6.5 6.3 6.2 6.1 6.1 6.8 6.7
5.0
6.0
7.0
8.0
9.0
10.0
pHpH - West Flowing Rivers ( 2 of 2 )

Water Quality Status of Maharashtra 2016-17
126
Figure No. 39: Trend of Fecal Coliform recorded at WQMS at West flowing rivers (Coastal basin) (2 of 2)
2701 2702 2703 2704 2689 2199 1151 2688 2687 192 193 2686 1462 2672 2651 1152 216 2685 2198 2671
West Flowing Rivers
Coastal
Max 0.0 0.0 0.0 0.0 110.0 0.0 110.0 140.0 32.0 26.0 70.0 33.0 110.0 58.0 70.0 94.0 540.0 540.0 110.0 110.0
75 perc' 0.0 0.0 0.0 0.0 31.3 0.0 46.0 97.3 26.0 18.3 27.3 18.0 61.0 46.0 49.0 67.0 64.8 49.0 84.0 70.0
Average 0.0 0.0 0.0 0.0 29.4 0.0 37.1 62.9 19.9 10.6 24.4 16.3 42.6 27.3 36.2 46.4 92.2 78.3 52.9 53.7
25 perc' 0.0 0.0 0.0 0.0 16.3 0.0 16.0 22.8 16.3 3.5 13.8 11.0 21.5 13.0 29.5 22.5 33.5 24.8 30.5 38.0
Min 0.0 0.0 0.0 0.0 2.0 0.0 7.8 13.0 7.8 1.8 2.0 7.8 10.0 7.8 6.8 11.0 17.0 10.0 11.0 11.0
0.0
15.0
30.0
45.0
60.0
75.0
90.0
C.F
.U /
100
ml
Fecal Coliform - West Flowing Rivers ( 2 of 2 )

Water Quality Status of Maharashtra 2016-17
127
Figure No. 40 : Trend of Dissolved Oxygen (DO) levels recorded at WQMS at Nallah (Coastal basin)
2784 2782 2783 2708 2786 2787 2788 2785 2790
Nallah
Coastal
Max 5.1 4.4 4.2 7.5 5.8 1.9 2.3 3.3 7.1
75 perc' 4.3 4.3 3.8 7.1 4.9 1.9 2.1 3.3 6.9
Average 3.4 3.3 2.7 6.7 4.0 1.9 1.9 3.3 6.5
25 perc' 2.6 2.6 1.7 6.4 3.0 1.9 1.6 3.3 6.4
Min 1.7 2.2 1.0 6.0 2.1 1.9 1.4 3.3 5.4
0.0
1.0
2.0
3.0
4.0
5.0
6.0
7.0
8.0
9.0
10.0
11.0
12.0
13.0
14.0
15.0m
g/l
Dissolved Oxygen - Nallah

Water Quality Status of Maharashtra 2016-17
128
Figure No. 41 : Trend of Biological Oxygen Demand (BOD) levels recorded at WQMS at Nallah (Coastal basin)
2784 2782 2783 2708 2786 2787 2788 2785 2790
Nallah
Coastal
Max 300.0 90.0 110.0 5.0 800.0 825.0 750.0 875.0 3.0
75 perc' 120.0 75.0 53.8 4.1 417.5 408.8 397.5 625.0 2.8
Average 91.5 51.4 43.8 3.7 281.8 294.5 273.0 464.0 2.5
25 perc' 50.0 30.5 18.0 3.0 25.3 43.3 31.5 342.5 2.0
Min 12.0 15.0 8.0 3.0 5.0 38.0 30.0 18.0 2.0
0.0
15.0
30.0
45.0
60.0
75.0
90.0
mg/
lBOD - Nallah

Water Quality Status of Maharashtra 2016-17
129
Figure No. 42: Trend of pH levels recorded at WQMS at Nallah (Coastal basin)
2784 2782 2783 2708 2786 2787 2788 2785 2790
Nallah
Coastal
Max 8.1 7.9 8.0 8.6 7.7 6.9 7.0 8.3 8.6
75 perc' 7.3 7.5 7.2 7.9 7.1 6.9 6.9 7.7 8.1
Average 7.2 7.3 7.1 7.6 6.7 6.5 6.5 7.3 6.6
25 perc' 7.1 7.0 6.9 7.3 6.4 6.4 6.3 6.8 5.4
Min 6.8 6.6 6.8 7.0 5.7 5.6 5.5 6.5 4.7
5.0
6.0
7.0
8.0
9.0
10.0
pHpH - Nallah

Water Quality Status of Maharashtra 2016-17
130
Figure No. 43: Trend of Fecal Coliform levels recorded at WQMS at Nallah (Coastal basin)
2784 2782 2783 2708 2786 2787 2788 2785 2790
Nallah
Coastal
Max 920.0 920.0 920.0 70.0 920.0 920.0 920.0 1600.0 0.0
75 perc' 920.0 540.0 920.0 24.5 492.5 920.0 920.0 1600.0 0.0
Average 666.7 387.5 594.2 21.7 412.5 777.5 777.5 1052.5 0.0
25 perc' 540.0 235.0 350.0 7.8 215.0 777.5 777.5 920.0 0.0
Min 350.0 110.0 240.0 1.8 140.0 350.0 350.0 170.0 0.0
0.0
50.0
100.0
150.0
200.0
250.0
300.0
350.0
400.0
450.0
500.0
550.0
600.0
650.0
700.0
750.0
800.0
850.0
900.0
950.0
1000.0
C.F
.U /
100
ml
Fecal Coliform - Nallah
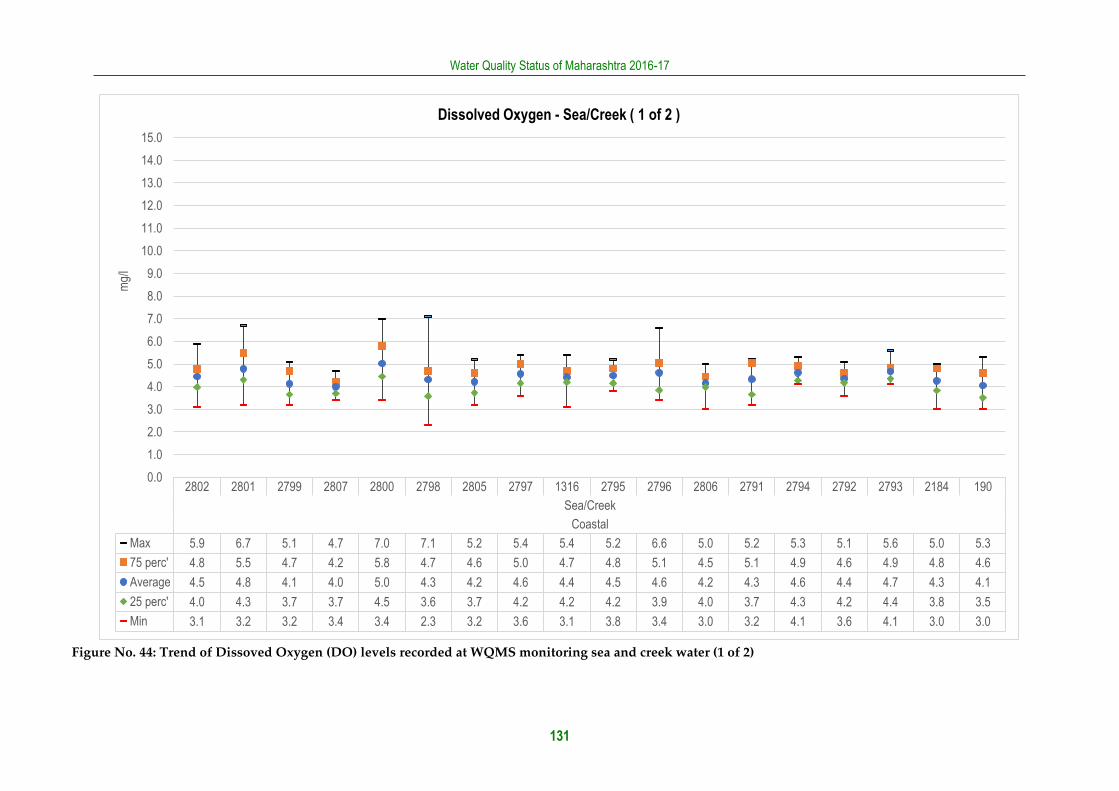
Water Quality Status of Maharashtra 2016-17
131
Figure No. 44: Trend of Dissoved Oxygen (DO) levels recorded at WQMS monitoring sea and creek water (1 of 2)
2802 2801 2799 2807 2800 2798 2805 2797 1316 2795 2796 2806 2791 2794 2792 2793 2184 190
Sea/Creek
Coastal
Max 5.9 6.7 5.1 4.7 7.0 7.1 5.2 5.4 5.4 5.2 6.6 5.0 5.2 5.3 5.1 5.6 5.0 5.3
75 perc' 4.8 5.5 4.7 4.2 5.8 4.7 4.6 5.0 4.7 4.8 5.1 4.5 5.1 4.9 4.6 4.9 4.8 4.6
Average 4.5 4.8 4.1 4.0 5.0 4.3 4.2 4.6 4.4 4.5 4.6 4.2 4.3 4.6 4.4 4.7 4.3 4.1
25 perc' 4.0 4.3 3.7 3.7 4.5 3.6 3.7 4.2 4.2 4.2 3.9 4.0 3.7 4.3 4.2 4.4 3.8 3.5
Min 3.1 3.2 3.2 3.4 3.4 2.3 3.2 3.6 3.1 3.8 3.4 3.0 3.2 4.1 3.6 4.1 3.0 3.0
0.0
1.0
2.0
3.0
4.0
5.0
6.0
7.0
8.0
9.0
10.0
11.0
12.0
13.0
14.0
15.0m
g/l
Dissolved Oxygen - Sea/Creek ( 1 of 2 )

Water Quality Status of Maharashtra 2016-17
132
Figure No. 45: Trend of Dissoved Oxygen (DO) levels recorded at WQMS monitoring sea and creek water (2 of 2)
2185 2169 2812 1318 2811 2167 2810 2809 2166 2808 2165 2803 1317 191 2804 2813 2814 2815
Sea/Creek
Coastal
Max 5.9 4.8 4.5 4.8 4.8 4.5 4.7 4.6 5.0 4.9 4.4 5.8 5.6 5.3 7.2 6.7 6.6 6.4
75 perc' 4.8 4.4 4.3 4.3 4.5 3.9 4.4 4.3 4.3 4.3 4.3 5.3 4.8 4.3 7.0 5.8 5.9 5.9
Average 4.5 3.9 3.8 3.9 4.0 3.7 3.9 3.9 4.0 3.9 3.8 4.5 4.3 3.9 6.4 5.4 5.4 5.4
25 perc' 4.1 3.4 3.2 3.7 3.7 3.5 3.6 3.6 3.4 3.6 3.5 3.4 4.0 3.3 6.1 4.8 4.8 4.9
Min 3.1 3.1 3.0 3.0 3.1 3.2 3.0 3.2 3.2 3.0 3.1 3.0 3.0 3.1 4.6 4.5 4.6 4.4
0.0
1.0
2.0
3.0
4.0
5.0
6.0
7.0
8.0
9.0
10.0
11.0
12.0
13.0
14.0
15.0m
g/l
Dissolved Oxygen - Sea/Creek ( 2 of 2 )

Water Quality Status of Maharashtra 2016-17
133
Figure No. 46: Trend ofBiological Oxygen Demand (BOD) levels recorded at WQMS monitoring sea and creek water (1 of 2)
2802 2801 2799 2807 2800 2798 2805 2797 1316 2795 2796 2806 2791 2794 2792 2793 2184 190
Sea/Creek
Coastal
Max 18.0 18.0 18.0 525.0 18.0 22.0 20.0 220.0 18.0 20.0 160.0 20.0 44.0 14.0 16.0 14.0 26.0 22.0
75 perc' 14.3 14.0 18.0 18.0 12.0 17.0 16.5 16.0 16.0 14.0 15.5 16.0 16.0 12.0 14.0 13.0 15.8 17.8
Average 12.1 11.4 13.8 58.0 9.3 13.1 14.3 33.6 12.6 12.2 23.5 14.4 14.8 10.3 12.2 10.8 13.9 15.1
25 perc' 9.0 8.8 10.0 14.8 6.8 8.8 11.8 8.8 8.8 8.0 8.8 11.8 8.8 8.8 12.0 8.0 10.0 12.5
Min 5.0 4.0 9.0 9.0 4.0 4.0 9.0 7.0 7.0 8.0 4.0 9.0 6.0 6.0 6.0 7.0 8.0 8.0
0.0
15.0
30.0
45.0
60.0
75.0
90.0
mg/
lBOD - Sea/Creek ( 1 of 2 )

Water Quality Status of Maharashtra 2016-17
134
Figure No. 47: Trend ofBiological Oxygen Demand (BOD) levels recorded at WQMS monitoring sea and creek water (2 of 2)
2185 2169 2812 1318 2811 2167 2810 2809 2166 2808 2165 2803 1317 191 2804 2813 2814 2815
Sea/Creek
Coastal
Max 18.0 20.0 22.0 19.0 20.0 22.0 20.0 20.0 20.0 20.0 20.0 20.0 20.0 21.0 5.2 5.4 5.2 6.0
75 perc' 15.3 18.3 18.5 17.3 18.0 18.5 19.3 18.3 17.5 18.0 18.3 15.0 18.5 20.0 2.8 3.9 4.0 3.9
Average 12.4 16.0 16.2 14.3 15.4 16.7 15.1 16.5 15.1 16.7 16.6 11.3 14.3 16.4 2.8 3.5 3.6 3.7
25 perc' 9.8 14.8 14.0 12.0 13.2 14.5 12.0 14.8 11.0 16.4 15.0 7.0 12.0 14.0 2.2 3.2 3.2 3.2
Min 5.0 9.0 9.0 8.0 8.0 9.0 8.0 9.0 10.0 10.0 10.0 6.0 8.0 8.0 2.0 2.2 2.4 2.6
0.0
15.0
30.0
45.0
60.0
75.0
90.0
mg/
lBOD - Sea/Creek ( 2 of 2 )

Water Quality Status of Maharashtra 2016-17
135
Figure No. 48: Trend of pH levels recorded at WQMS monitoring sea and creek water (1 of 2)
2802 2801 2799 2807 2800 2798 2805 2797 1316 2795 2796 2806 2791 2794 2792 2793 2184 190
Sea/Creek
Coastal
Max 8.2 8.2 8.4 8.4 8.6 8.4 8.0 7.9 7.9 8.0 7.9 8.0 8.0 8.1 8.2 8.1 8.1 7.7
75 perc' 7.8 7.8 7.9 8.0 8.2 7.9 7.7 7.6 7.7 7.5 7.6 7.8 7.4 7.4 7.6 7.4 7.5 7.5
Average 7.6 7.5 7.6 7.8 7.9 7.7 7.6 7.4 7.5 7.4 7.5 7.6 7.2 7.4 7.4 7.3 7.3 7.3
25 perc' 7.4 7.4 7.3 7.6 7.8 7.3 7.6 7.1 7.5 7.2 7.3 7.4 6.9 7.3 7.2 7.1 7.2 7.2
Min 7.0 6.8 6.9 7.2 7.1 6.9 7.2 6.9 6.7 6.9 6.9 7.1 6.6 6.9 6.8 6.8 6.8 6.6
5.0
6.0
7.0
8.0
9.0
10.0
pHpH - Sea / Creek ( 1 of 2 )

Water Quality Status of Maharashtra 2016-17
136
Figure No. 49: Trend of pH levels recorded at WQMS monitoring sea and creek water (2 of 2)
2185 2169 2812 1318 2811 2167 2810 2809 2166 2808 2165 2803 1317 191 2804 2813 2814 2815
Sea/Creek
Coastal
Max 8.0 8.1 8.0 8.7 8.4 8.0 8.0 8.0 8.0 8.0 8.0 7.6 8.0 8.5 7.8 7.9 8.1 8.3
75 perc' 7.5 7.9 7.9 7.8 7.7 7.7 7.7 7.8 7.9 7.8 7.7 7.3 7.6 8.0 7.5 7.6 7.9 7.9
Average 7.3 7.6 7.6 7.7 7.6 7.6 7.6 7.6 7.7 7.6 7.5 7.0 7.4 7.7 7.3 7.4 7.6 7.7
25 perc' 7.1 7.4 7.4 7.5 7.4 7.5 7.4 7.4 7.5 7.4 7.4 6.8 7.2 7.4 7.1 7.3 7.5 7.5
Min 6.7 6.3 7.3 7.1 7.1 7.4 7.1 7.3 7.1 6.8 6.8 6.0 6.7 6.9 6.7 6.9 6.8 7.2
5.0
6.0
7.0
8.0
9.0
10.0
pHpH - Sea / Creek ( 2 of 2 )

Water Quality Status of Maharashtra 2016-17
137
Figure No. 50: Trend of Fecal coliform levels recorded at WQMS monitoring sea and creek water (1 of 2)
2802 2801 2799 2807 2800 2798 2805 2797 1316 2795 2796 2806 2791 2794 2792 2793 2184 190
Sea/Creek
Coastal
Max 540.0 240.0 540.0 1600.0 280.0 540.0 1600.0 920.0 920.0 920.0 920.0 920.0 920.0 920.0 540.0 920.0 540.0 540.0
75 perc' 182.5 182.5 345.0 920.0 160.0 240.0 920.0 397.5 397.5 540.0 397.5 920.0 240.0 350.0 350.0 920.0 397.5 252.5
Average 194.2 157.0 264.2 746.7 145.6 223.3 665.0 346.2 308.3 350.0 324.0 662.5 262.5 290.8 261.7 495.0 304.9 241.7
25 perc' 130.0 117.5 110.0 540.0 106.0 130.0 350.0 170.0 160.0 170.0 125.0 492.5 137.5 130.0 140.0 170.0 207.5 137.5
Min 110.0 94.0 70.0 130.0 79.0 79.0 220.0 94.0 130.0 120.0 79.0 220.0 110.0 110.0 110.0 140.0 79.0 130.0
0.0
50.0
100.0
150.0
200.0
250.0
300.0
350.0
400.0
450.0
500.0
550.0
600.0
650.0
700.0
750.0
800.0
850.0
900.0
950.0
1000.0C
.F.U
/ 1
00 m
lFecal Coliform - Sea / Creek ( 1 of 2 )

Water Quality Status of Maharashtra 2016-17
138
Figure No. 51: Trend of Fecal coliform levels recorded at WQMS monitoring sea and creek water (2 of 2)
2185 2169 2812 1318 2811 2167 2810 2809 2166 2808 2165 2803 1317 191 2804 2813 2814 2815
Sea/Creek
Coastal
Max 920.0 920.0 1600.0 920.0 1600.0 920.0 920.0 920.0 1600.0 920.0 1600.0 920.0 920.0 920.0 0.0 0.0 0.0 0.0
75 perc' 397.5 635.0 695.0 540.0 920.0 920.0 920.0 920.0 920.0 920.0 920.0 215.0 540.0 540.0 0.0 0.0 0.0 0.0
Average 303.3 563.3 640.0 382.0 805.8 599.2 727.5 604.2 778.3 624.2 845.8 230.9 443.3 470.8 0.0 0.0 0.0 0.0
25 perc' 137.5 492.5 492.5 140.0 540.0 492.5 492.5 540.0 540.0 540.0 540.0 103.5 265.0 220.0 0.0 0.0 0.0 0.0
Min 110.0 170.0 220.0 94.0 280.0 220.0 130.0 110.0 170.0 220.0 130.0 8.0 170.0 170.0 0.0 0.0 0.0 0.0
0.0
50.0
100.0
150.0
200.0
250.0
300.0
350.0
400.0
450.0
500.0
550.0
600.0
650.0
700.0
750.0
800.0
850.0
900.0
950.0
1000.0C
.F.U
/ 1
00 m
lFecal Coliform - Sea / Creek ( 2 of 2 )
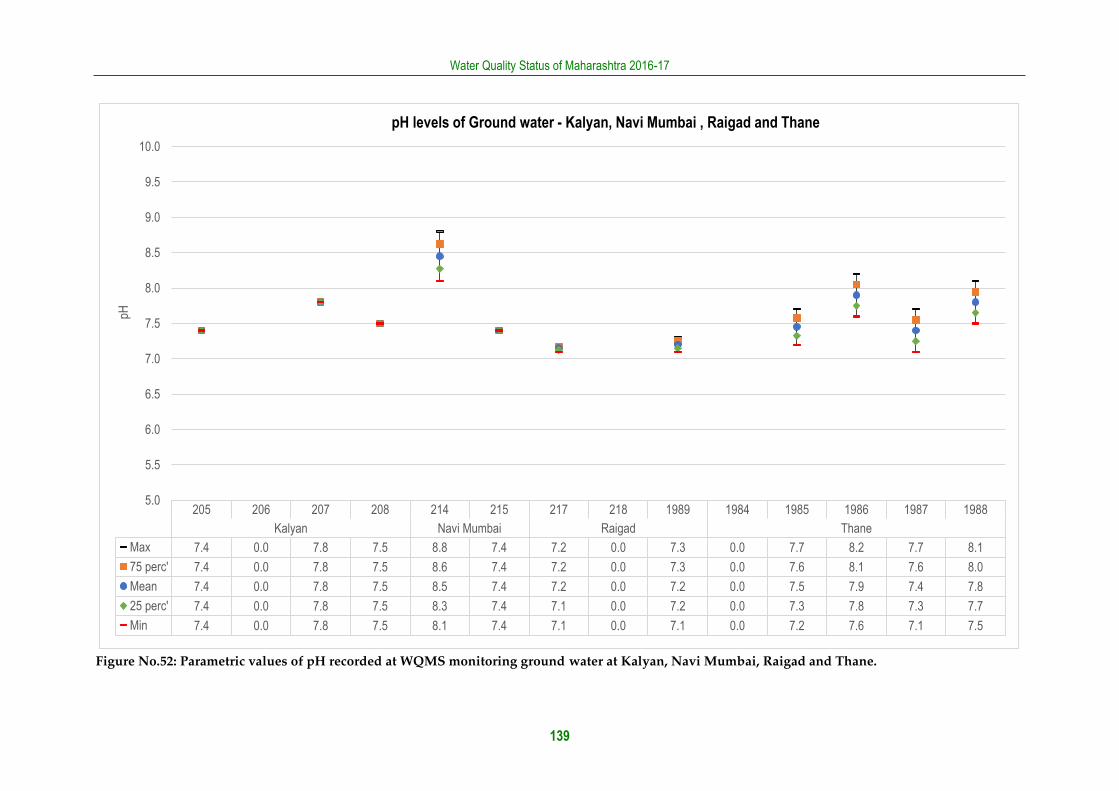
Water Quality Status of Maharashtra 2016-17
139
Figure No.52: Parametric values of pH recorded at WQMS monitoring ground water at Kalyan, Navi Mumbai, Raigad and Thane.
205 206 207 208 214 215 217 218 1989 1984 1985 1986 1987 1988
Kalyan Navi Mumbai Raigad Thane
Max 7.4 0.0 7.8 7.5 8.8 7.4 7.2 0.0 7.3 0.0 7.7 8.2 7.7 8.1
75 perc' 7.4 0.0 7.8 7.5 8.6 7.4 7.2 0.0 7.3 0.0 7.6 8.1 7.6 8.0
Mean 7.4 0.0 7.8 7.5 8.5 7.4 7.2 0.0 7.2 0.0 7.5 7.9 7.4 7.8
25 perc' 7.4 0.0 7.8 7.5 8.3 7.4 7.1 0.0 7.2 0.0 7.3 7.8 7.3 7.7
Min 7.4 0.0 7.8 7.5 8.1 7.4 7.1 0.0 7.1 0.0 7.2 7.6 7.1 7.5
5.0
5.5
6.0
6.5
7.0
7.5
8.0
8.5
9.0
9.5
10.0
pHpH levels of Ground water - Kalyan, Navi Mumbai , Raigad and Thane

Water Quality Status of Maharashtra 2016-17
140
Figure No.53: Parametric values of pH recorded at WQMS monitoring ground water at Amravati, Aurangabad and Nashik.
2001 2002 2003 1993 2200 2201 2824 2825 221 1990 1991 2204 2816 2817 2818
Amravati Aurangabad Nashik
Max 7.7 8.0 0.0 0.0 7.9 0.0 0.0 8.0 7.7 0.0 0.0 0.0 0.0 0.0 0.0
75 perc' 7.7 7.8 0.0 0.0 7.9 0.0 0.0 8.0 7.7 0.0 0.0 0.0 0.0 0.0 0.0
Mean 7.7 7.5 0.0 0.0 7.9 0.0 0.0 8.0 7.7 0.0 0.0 0.0 0.0 0.0 0.0
25 perc' 7.6 7.3 0.0 0.0 7.8 0.0 0.0 8.0 7.6 0.0 0.0 0.0 0.0 0.0 0.0
Min 7.6 7.0 0.0 0.0 7.8 0.0 0.0 8.0 7.6 0.0 0.0 0.0 0.0 0.0 0.0
0.0
1.0
2.0
3.0
4.0
5.0
6.0
7.0
8.0
9.0
10.0pH
pH levels of Ground water - Amravati, Aurangabad and Nashik

Water Quality Status of Maharashtra 2016-17
141
Figure No.54: Parametric values of pH recorded at WQMS monitoring ground water at Chandrapur and Nagpur.
2828 209 210 211 212 213 1994 1995 1996 1997 1998 1999 2000 2203 2826 2827
Chandrapur Nagpur
Max 0.0 7.7 7.7 7.8 8.8 8.6 0.0 7.2 7.2 6.7 7.2 6.7 0.0 6.7 6.5 0.0
75 perc' 0.0 7.4 7.5 7.7 8.3 8.3 0.0 7.1 7.1 6.7 7.0 6.7 0.0 6.7 6.5 0.0
Mean 0.0 7.2 7.3 7.6 7.9 8.0 0.0 7.0 7.0 6.7 6.9 6.7 0.0 6.7 6.5 0.0
25 perc' 0.0 6.9 7.0 7.4 7.4 7.6 0.0 6.9 6.9 6.7 6.7 6.7 0.0 6.7 6.5 0.0
Min 0.0 6.7 6.8 7.3 6.9 7.3 0.0 6.8 6.8 6.7 6.5 6.7 0.0 6.7 6.5 0.0
0.0
1.0
2.0
3.0
4.0
5.0
6.0
7.0
8.0
9.0
10.0pH
pH levels of Ground water - Chandrapur and Nagpur

Water Quality Status of Maharashtra 2016-17
142
Figure No.55: Parametric values of pH recorded at WQMS monitoring ground water at Kolhapur and Pune
219 220 2004 2005 2006 2007 2008 2202 2829 2830 2831 2832 2833 2834 2835 1992 2819 2820 2821 2822 2823
Kolhapur Pune
Max 7.3 7.4 7.3 7.2 7.4 7.3 7.4 7.7 7.1 7.5 7.5 7.6 7.4 7.2 7.5 7.5 8.1 8.3 7.9 7.5 7.8
75 perc' 7.3 7.2 7.3 7.2 7.4 7.2 7.3 7.5 7.1 7.4 7.3 7.5 7.3 7.1 7.4 7.5 8.1 8.3 7.7 7.5 7.7
Mean 7.2 7.0 7.3 7.2 7.4 7.1 7.2 7.3 7.1 7.3 7.2 7.5 7.3 7.0 7.3 7.4 8.1 8.2 7.5 7.5 7.7
25 perc' 7.2 6.7 7.3 7.2 7.3 6.9 7.0 7.1 7.1 7.2 7.0 7.4 7.2 6.9 7.2 7.4 8.0 8.2 7.2 7.4 7.6
Min 7.1 6.5 7.3 7.2 7.3 6.8 6.9 6.9 7.1 7.1 6.8 7.3 7.1 6.8 7.1 7.3 8.0 8.1 7.0 7.4 7.5
5.0
6.0
7.0
8.0
9.0
10.0pH
pH levels of Ground water - Kolhapur and Pune

Water Quality Status of Maharashtra 2016-17
143
Figure No.56: Parametric values of Nitrate recorded at WQMS monitoring ground water at Kalyan, Navi Mumbai, Raigad and Thane.
205 206 207 208 214 215 217 218 1989 1984 1985 1986 1987 1988
Kalyan Navi Mumbai Raigad Thane
Max 2.6 0.0 1.1 2.9 0.9 2.3 1.0 0.0 1.3 0.0 0.7 2.7 2.6 2.9
75 perc' 2.6 0.0 1.1 2.9 0.8 2.0 0.9 0.0 1.3 0.0 0.7 2.1 2.1 2.3
Mean 2.6 0.0 1.1 2.9 0.8 1.6 0.8 0.0 1.2 0.0 0.7 1.6 1.6 1.6
25 perc' 2.6 0.0 1.1 2.9 0.7 1.3 0.7 0.0 1.2 0.0 0.6 1.0 1.0 1.0
Min 2.6 0.0 1.1 2.9 0.6 0.9 0.6 0.0 1.1 0.0 0.6 0.4 0.5 0.3
0.0
0.5
1.0
1.5
2.0
2.5
3.0
3.5
4.0
4.5
5.0m
g/l
Nitrate levels of Ground water - Kalyan, Navi Mumbai , Raigad and Thane

Water Quality Status of Maharashtra 2016-17
144
Figure No.57: Parametric values of Nitrate recorded at WQMS monitoring ground water at Amravati, Aurangabad and Nashik.
2001 2002 2003 1993 2200 2201 2824 2825 221 1990 1991 2204 2816 2817 2818
Amravati Aurangabad Nashik
Max 9.8 3.9 0.0 0.0 0.8 0.0 0.0 0.8 0.0 0.0 0.0 0.0 0.0 0.0 0.0
75 perc' 7.3 3.3 0.0 0.0 0.6 0.0 0.0 0.8 0.0 0.0 0.0 0.0 0.0 0.0 0.0
Mean 4.9 2.7 0.0 0.0 0.5 0.0 0.0 0.8 0.0 0.0 0.0 0.0 0.0 0.0 0.0
25 perc' 2.5 2.1 0.0 0.0 0.3 0.0 0.0 0.8 0.0 0.0 0.0 0.0 0.0 0.0 0.0
Min 0.0 1.5 0.0 0.0 0.1 0.0 0.0 0.8 0.0 0.0 0.0 0.0 0.0 0.0 0.0
0.0
0.5
1.0
1.5
2.0
2.5
3.0
3.5
4.0
4.5
5.0m
g/l
Nitrate levels of Ground water - Amravati, Aurangabad and Nashik

Water Quality Status of Maharashtra 2016-17
145
Figure No.58: Parametric values of Nitrate recorded at WQMS monitoring ground water at Chandrapur and Nagpur.
2828 209 210 211 212 213 1994 1995 1996 1997 1998 1999 2000 2203 2826 2827
Chandrapur Nagpur
Max 0.0 4.3 4.3 0.0 4.3 3.4 0.0 6.2 10.1 0.1 2.9 4.8 0.0 0.0 0.1 0.0
75 perc' 0.0 3.9 3.9 0.0 3.6 3.1 0.0 5.5 8.4 0.1 2.2 4.8 0.0 0.0 0.1 0.0
Mean 0.0 3.5 3.5 0.0 2.9 2.8 0.0 4.8 6.7 0.1 1.5 4.8 0.0 0.0 0.1 0.0
25 perc' 0.0 3.0 3.1 0.0 2.2 2.4 0.0 4.1 5.0 0.1 0.8 4.8 0.0 0.0 0.1 0.0
Min 0.0 2.6 2.7 0.0 1.5 2.1 0.0 3.4 3.2 0.1 0.1 4.8 0.0 0.0 0.1 0.0
0.0
0.5
1.0
1.5
2.0
2.5
3.0
3.5
4.0
4.5
5.0m
g/l
Nitrate levels of Ground water - Chandrapur and Nagpur

Water Quality Status of Maharashtra 2016-17
146
Figure No.59: Parametric values of Nitrate recorded at WQMS monitoring ground water at Kolhapur and Pune.
219 220 2004 2005 2006 2007 2008 2202 2829 2830 2831 2832 2833 2834 2835 1992 2819 2820 2821 2822 2823
Kolhapur Pune
Max 1.4 0.6 2.9 3.0 6.0 3.6 1.2 0.5 4.0 6.0 2.5 0.6 0.6 0.5 0.7 0.6 0.6 0.4 0.3 0.6 0.8
75 perc' 1.2 0.6 2.4 2.4 4.7 2.9 1.1 0.4 3.2 4.7 2.0 0.5 0.5 0.4 0.6 0.5 0.5 0.4 0.3 0.5 0.7
Mean 1.0 0.6 1.9 1.9 3.4 2.2 1.0 0.4 2.4 3.4 1.5 0.4 0.4 0.4 0.5 0.5 0.4 0.4 0.3 0.4 0.5
25 perc' 0.8 0.5 1.3 1.3 2.0 1.4 0.9 0.3 1.6 2.1 1.0 0.3 0.3 0.3 0.3 0.4 0.3 0.3 0.2 0.3 0.4
Min 0.6 0.5 0.8 0.7 0.7 0.7 0.8 0.2 0.8 0.8 0.6 0.3 0.2 0.2 0.2 0.3 0.2 0.3 0.2 0.2 0.2
0.0
0.5
1.0
1.5
2.0
2.5
3.0
3.5
4.0
4.5
5.0
mg/
lNitrate levels of Ground water - Kolhapur and Pune

Water Quality Status of Maharashtra 2016-17
147
Figure No.60: Parametric values of Hardness at CaCo3 recorded at WQMS monitoring ground water at Kalyan, Navi Mumbai, Raigad and Thane.
205 206 207 208 214 215 217 218 1989 1984 1985 1986 1987 1988
Kalyan Navi Mumbai Raigad Thane
Max 358.0 0.0 290.0 196.0 0.0 5960.0 148.0 0.0 148.0 0.0 192.0 174.0 384.0 190.0
75 perc' 358.0 0.0 290.0 196.0 0.0 5960.0 126.0 0.0 121.5 0.0 160.0 152.0 301.5 161.5
Mean 358.0 0.0 290.0 196.0 0.0 5960.0 104.0 0.0 95.0 0.0 128.0 130.0 219.0 133.0
25 perc' 358.0 0.0 290.0 196.0 0.0 5960.0 82.0 0.0 68.5 0.0 96.0 108.0 136.5 104.5
Min 358.0 0.0 290.0 196.0 0.0 5960.0 60.0 0.0 42.0 0.0 64.0 86.0 54.0 76.0
0.0
50.0
100.0
150.0
200.0
250.0
300.0
350.0
400.0
450.0
500.0m
g/l
Hardness ( as CaCO3 ) of Ground water - Kalyan, Navi Mumbai , Raigad and Thane
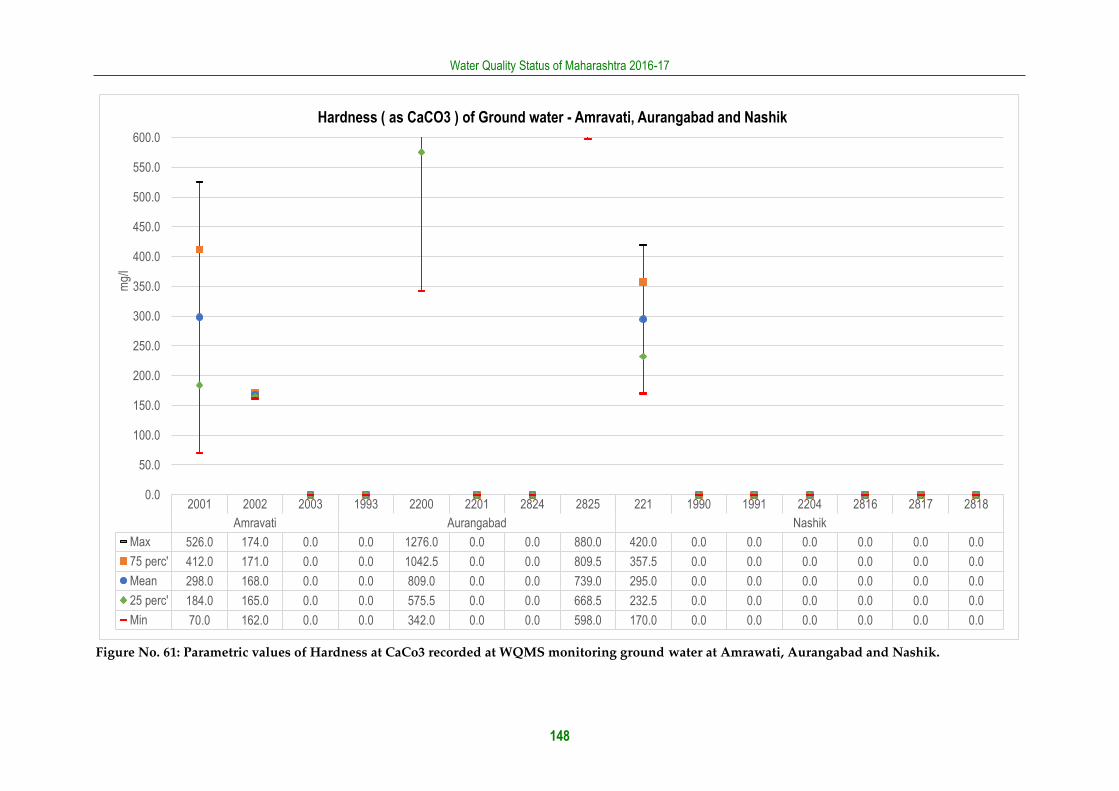
Water Quality Status of Maharashtra 2016-17
148
Figure No. 61: Parametric values of Hardness at CaCo3 recorded at WQMS monitoring ground water at Amrawati, Aurangabad and Nashik.
2001 2002 2003 1993 2200 2201 2824 2825 221 1990 1991 2204 2816 2817 2818
Amravati Aurangabad Nashik
Max 526.0 174.0 0.0 0.0 1276.0 0.0 0.0 880.0 420.0 0.0 0.0 0.0 0.0 0.0 0.0
75 perc' 412.0 171.0 0.0 0.0 1042.5 0.0 0.0 809.5 357.5 0.0 0.0 0.0 0.0 0.0 0.0
Mean 298.0 168.0 0.0 0.0 809.0 0.0 0.0 739.0 295.0 0.0 0.0 0.0 0.0 0.0 0.0
25 perc' 184.0 165.0 0.0 0.0 575.5 0.0 0.0 668.5 232.5 0.0 0.0 0.0 0.0 0.0 0.0
Min 70.0 162.0 0.0 0.0 342.0 0.0 0.0 598.0 170.0 0.0 0.0 0.0 0.0 0.0 0.0
0.0
50.0
100.0
150.0
200.0
250.0
300.0
350.0
400.0
450.0
500.0
550.0
600.0m
g/l
Hardness ( as CaCO3 ) of Ground water - Amravati, Aurangabad and Nashik
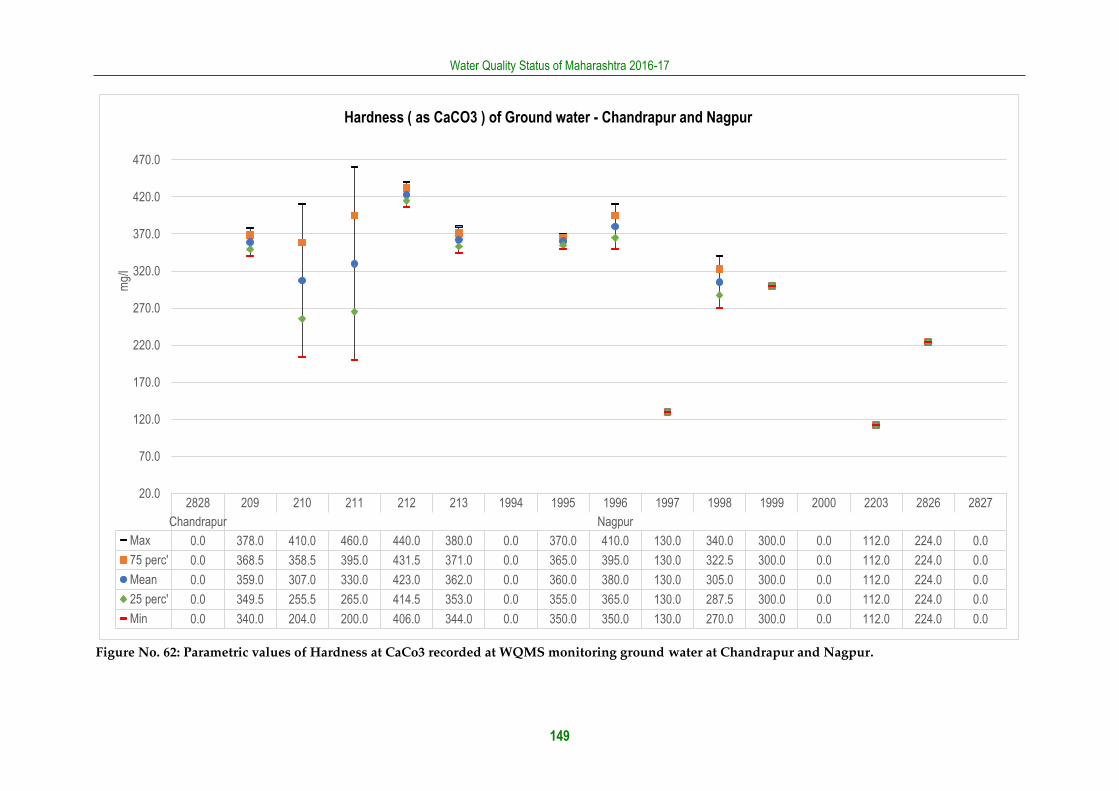
Water Quality Status of Maharashtra 2016-17
149
Figure No. 62: Parametric values of Hardness at CaCo3 recorded at WQMS monitoring ground water at Chandrapur and Nagpur.
2828 209 210 211 212 213 1994 1995 1996 1997 1998 1999 2000 2203 2826 2827
Chandrapur Nagpur
Max 0.0 378.0 410.0 460.0 440.0 380.0 0.0 370.0 410.0 130.0 340.0 300.0 0.0 112.0 224.0 0.0
75 perc' 0.0 368.5 358.5 395.0 431.5 371.0 0.0 365.0 395.0 130.0 322.5 300.0 0.0 112.0 224.0 0.0
Mean 0.0 359.0 307.0 330.0 423.0 362.0 0.0 360.0 380.0 130.0 305.0 300.0 0.0 112.0 224.0 0.0
25 perc' 0.0 349.5 255.5 265.0 414.5 353.0 0.0 355.0 365.0 130.0 287.5 300.0 0.0 112.0 224.0 0.0
Min 0.0 340.0 204.0 200.0 406.0 344.0 0.0 350.0 350.0 130.0 270.0 300.0 0.0 112.0 224.0 0.0
20.0
70.0
120.0
170.0
220.0
270.0
320.0
370.0
420.0
470.0
mg/
lHardness ( as CaCO3 ) of Ground water - Chandrapur and Nagpur

Water Quality Status of Maharashtra 2016-17
150
Figure No. 63: Parametric values of Hardness at CaCo3 recorded at WQMS monitoring ground water at Kolhapur and Pune.
219 220 2004 2005 2006 2007 2008 2202 2829 2830 2831 2832 2833 2834 2835 1992 2819 2820 2821 2822 2823
Kolhapur Pune
Max 110.0 74.0 640.0 524.0 490.0 394.0 740.0 40.0 850.0 404.0 440.0 84.0 90.0 1460.0 54.0 414.0 1030.0 380.0 404.0 1450.0 656.0
75 perc' 95.0 63.5 619.0 468.0 476.5 389.5 657.0 37.5 671.5 403.0 372.0 69.5 74.0 1121.0 47.0 407.0 866.5 317.0 369.5 1185.0 588.5
Mean 80.0 53.0 598.0 412.0 463.0 385.0 574.0 35.0 493.0 402.0 304.0 55.0 58.0 782.0 40.0 400.0 703.0 254.0 335.0 920.0 521.0
25 perc' 65.0 42.5 577.0 356.0 449.5 380.5 491.0 32.5 314.5 401.0 236.0 40.5 42.0 443.0 33.0 393.0 539.5 191.0 300.5 655.0 453.5
Min 50.0 32.0 556.0 300.0 436.0 376.0 408.0 30.0 136.0 400.0 168.0 26.0 26.0 104.0 26.0 386.0 376.0 128.0 266.0 390.0 386.0
20.0
70.0
120.0
170.0
220.0
270.0
320.0
370.0
420.0
470.0
520.0
570.0
620.0
670.0
720.0
770.0
820.0
870.0
920.0
970.0
mg/
lHardness ( as CaCO3 ) of Ground water - Kolhapur and Pune

Water Quality Status of Maharashtra 2016-17
151
Figure No. 64: Parametric values of Fluoride recorded at WQMS monitoring ground water at Kalyan, Navi Mumbai, Raigad and Thane
205 206 207 208 214 215 217 218 1984 1985 1986 1987 1988 1989
Kalyan Navi Mumbai Raigad Thane
Max 1.1 0.0 1.1 0.8 0.6 1.4 1.4 0.0 0.0 0.9 0.8 1.2 2.4 8.1
75 perc' 1.1 0.0 1.1 0.8 0.6 1.4 1.4 0.0 0.0 0.7 0.8 1.1 2.0 8.1
Mean 1.1 0.0 1.1 0.8 0.6 1.4 1.4 0.0 0.0 0.5 0.8 1.1 1.7 8.1
25 perc' 1.1 0.0 1.1 0.8 0.5 1.4 1.4 0.0 0.0 0.3 0.7 1.0 1.3 8.1
Min 1.1 0.0 1.1 0.8 0.5 1.4 1.4 0.0 0.0 0.1 0.7 0.9 0.9 8.1
0.0
0.5
1.0
1.5
2.0
2.5
3.0
3.5
4.0
4.5
5.0m
g/l
Fluoride levels of Ground water - Kalyan, Navi Mumbai , Raigad and Thane

Water Quality Status of Maharashtra 2016-17
152
Figure No. 65: Parametric values of Fluoride recorded at WQMS monitoring ground water at Amravati, Aurangabad and Nashik
2001 2002 2003 1993 2200 2201 2824 2825 221 1990 1991 2204 2816 2817 2818
Amravati Aurangabad Nashik
Max 0.7 0.1 0.0 0.0 2.1 0.0 0.0 2.7 0.0 0.0 0.0 0.0 0.0 0.0 0.0
75 perc' 0.6 0.1 0.0 0.0 1.8 0.0 0.0 2.2 0.0 0.0 0.0 0.0 0.0 0.0 0.0
Mean 0.5 0.1 0.0 0.0 1.5 0.0 0.0 1.8 0.0 0.0 0.0 0.0 0.0 0.0 0.0
25 perc' 0.4 0.1 0.0 0.0 1.1 0.0 0.0 1.3 0.0 0.0 0.0 0.0 0.0 0.0 0.0
Min 0.3 0.1 0.0 0.0 0.8 0.0 0.0 0.8 0.0 0.0 0.0 0.0 0.0 0.0 0.0
0.0
0.5
1.0
1.5
2.0
2.5
3.0
3.5
4.0
4.5
5.0m
g/l
Fluoride levels of Ground water - Amravati, Aurangabad and Nashik

Water Quality Status of Maharashtra 2016-17
153
Figure No. 66: Parametric values of Fluoride recorded at WQMS monitoring ground water at Chandrapur and Nagpur.
2828 209 210 211 212 213 1994 1995 1996 1997 1998 1999 2000 2203 2826 2827
Chandrapur Nagpur
Max 0.0 0.1 0.1 0.3 0.4 0.5 0.0 0.2 0.3 0.2 0.3 0.6 0.0 0.1 0.1 0.0
75 perc' 0.0 0.1 0.1 0.2 0.4 0.5 0.0 0.1 0.3 0.2 0.3 0.6 0.0 0.1 0.1 0.0
Mean 0.0 0.1 0.1 0.2 0.4 0.5 0.0 0.1 0.3 0.2 0.2 0.6 0.0 0.1 0.1 0.0
25 perc' 0.0 0.1 0.1 0.2 0.4 0.5 0.0 0.1 0.3 0.2 0.2 0.6 0.0 0.1 0.1 0.0
Min 0.0 0.1 0.1 0.1 0.4 0.5 0.0 0.1 0.3 0.2 0.2 0.6 0.0 0.1 0.1 0.0
0.0
0.5
1.0
1.5
2.0
2.5
3.0
3.5
4.0
4.5
5.0m
g/l
Fluoride levels of Ground water - Chandrapur and Nagpur
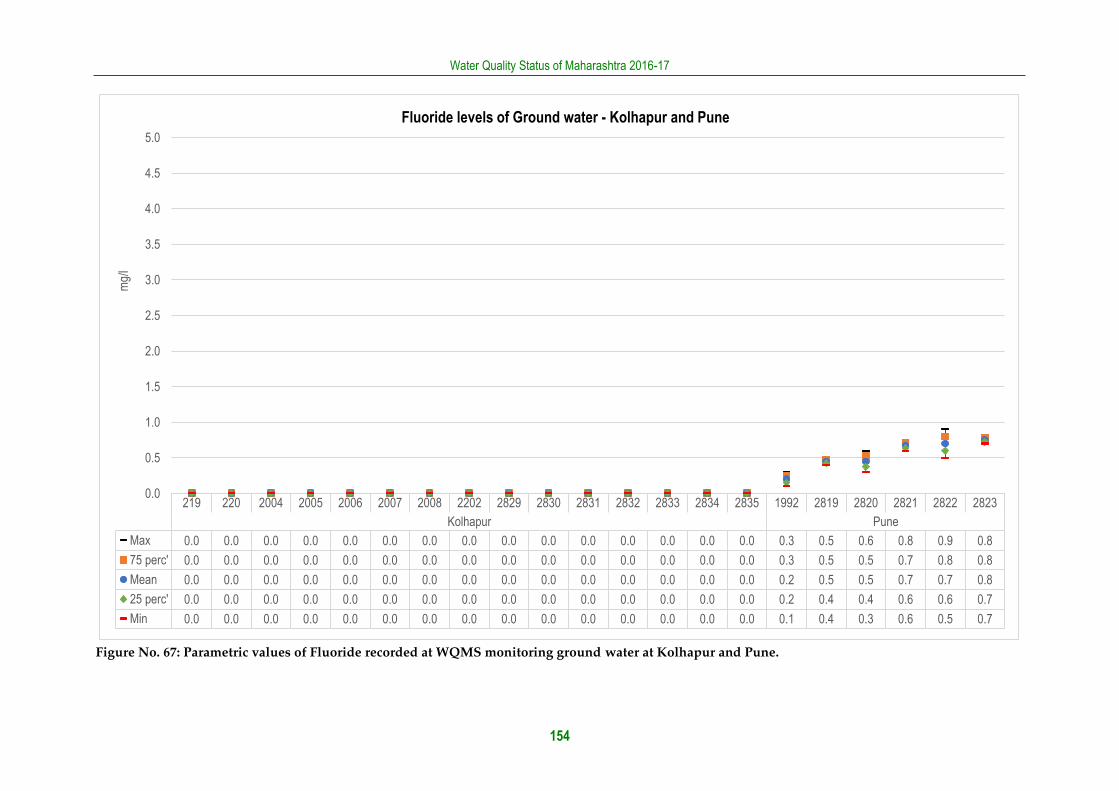
Water Quality Status of Maharashtra 2016-17
154
Figure No. 67: Parametric values of Fluoride recorded at WQMS monitoring ground water at Kolhapur and Pune.
219 220 2004 2005 2006 2007 2008 2202 2829 2830 2831 2832 2833 2834 2835 1992 2819 2820 2821 2822 2823
Kolhapur Pune
Max 0.0 0.0 0.0 0.0 0.0 0.0 0.0 0.0 0.0 0.0 0.0 0.0 0.0 0.0 0.0 0.3 0.5 0.6 0.8 0.9 0.8
75 perc' 0.0 0.0 0.0 0.0 0.0 0.0 0.0 0.0 0.0 0.0 0.0 0.0 0.0 0.0 0.0 0.3 0.5 0.5 0.7 0.8 0.8
Mean 0.0 0.0 0.0 0.0 0.0 0.0 0.0 0.0 0.0 0.0 0.0 0.0 0.0 0.0 0.0 0.2 0.5 0.5 0.7 0.7 0.8
25 perc' 0.0 0.0 0.0 0.0 0.0 0.0 0.0 0.0 0.0 0.0 0.0 0.0 0.0 0.0 0.0 0.2 0.4 0.4 0.6 0.6 0.7
Min 0.0 0.0 0.0 0.0 0.0 0.0 0.0 0.0 0.0 0.0 0.0 0.0 0.0 0.0 0.0 0.1 0.4 0.3 0.6 0.5 0.7
0.0
0.5
1.0
1.5
2.0
2.5
3.0
3.5
4.0
4.5
5.0m
g/l
Fluoride levels of Ground water - Kolhapur and Pune

155
Annex II– RO wise summary of WQI in 2016-17
The Maharashtra State government in 1981 adopted the Water (Prevention and Control of
Pollution) Act 1974 and under this MPCB (Maharashtra Pollution Control Board) was
established in the year 1981.
The main functions of MPCB are:
To plan a comprehensive program for the prevention, control or abatement of
pollution and secure executions thereof,
To collect and disseminate information relating to pollution and the prevention,
control or abatement thereof,
To inspect sewage or trade effluent treatment and disposal facilities, and air
pollution control systems and to review plans, specification or any other data
relating to the treatment plants, disposal systems and air pollution control systems in
connection with the consent granted,
Supporting and encouraging the developments in the fields of pollution control,
waste recycle reuse, eco-friendly practices etc.
To educate and guide the entrepreneurs in improving environment by suggesting
appropriate pollution control technologies and techniques
To create public awareness about clean and healthy environment and attending the
public complaints regarding pollution.
Being a highly industrialized, populated and urbanized state, Maharashtra has numerous
sources which lead to water pollution, which have deteriorated the water quality of many,
seas, creeks, drains ground water and so on. Release of sewage, industrial waste water, and
dumping of solid waste are the three major causes of water pollution.
Hence, to keep a constant vigilance MPCB has established 12 RO (Regional Offices) across
the state to check and regulate the pollution levels with necessary control measures. MPCB
implements a range of environmental legislation in the state and functions under the
administrative control of Environment Department, Government of Maharashtra.
The following section presents the RO wise highlights on the status of the water quality
monitoring network for the year 2015-16 and presents the gist of the water quality index for
the respective stations for months of May and December.

156
RO – Amravati

157
Table No. 30: Water quality Index for surface and ground water monitoring at Amravati-RO – 2016-17
Type Station
code
Regional
Office Station Name April
Dec/
Oct Average District Taluka Village
SW 1913 Amravati Purna River at Dhupeshwar at U/s of Malkapur Water works
69 72 70 Akola Akola Malkapur
SW 2155 Amravati Purna River at D/s of confluence of Morna & Purna at Andhura village
70 Akola Balapur Andura
SW 2675 Amravati Morna River at D/s of Railway Bridge 59 74 63 Akola Akola Akola
SW 2695 Amravati Pedhi River near Road Bridge at Dadhi-Pedhi village
49 69 62 Amravati
Chandur Bazar
Asegaon
SW 2697 Amravati Penganga River near water supply scheme of Umarkhed MC
64 58 60 Yavatmal
Umarkhed Belkhed
SW 2698 Amravati Penganga River D/s of Isapur Dam 60 58 59 Yavatmal
Pusad Isapur
SW 2699 Amravati Penganga River at Mehkar-Buldana Road Bridge
70 Buldana Mehkar Mehkar
SW 2700 Amravati Purna River near Achalpur-Amravati Road Bridge, Asegaon
70 Amravati
Chandur bazaar
Asegaon
GW 2001 Amravati Tube well at water treatment plant of M.C.Achalpur near Post Office.
164 79 121 Amravati
Achalpur Paratwada
GW 2002 Amravati Bore well Opp. Gajanan Maharaj Temple at Anjangaon road.
69 12 41 Akola Akot Anjangaon
GW 2003 Amravati Dug well at Plot No- 4, Street No. 49-C, at Nehru Bal Udyan Azad Maidan, owned by Yavatmal M.C.
Yavatmal
Yavatmal Nehru Bal Udyan Azad Maidan
Surface Water
Good to Excellent Medium to Good Bad Bad to Very Bad
Not collected
Ground Water Excellent Good Poor Very Poor Not suitable for drinking
Not collected

158
RO – Aurangabad

159
Table No. 31: Water quality Index for surface and ground water monitoring at Aurangabad-RO – 2016-17
Type Station code
Regional Office Station Name April Dec/Oct Average District Taluka Village
SW 12 Aurangabad Godavari River at Dhalegaon
92 81 Parbhani Pathari Dhalegaon
SW 178 Aurangabad Kannad - D/S of Kannad near Bridge
84 82 Aurangabad Kannad Kannad
SW 179 Aurangabad Sillod - D/S of Sillod near bridge at bhavan
82 81 Aurangabad Sillod Sillod
SW 180 Aurangabad Aurangabad - Near Holly cross bridge 80 60 67 Aurangabad Aurangabad Aurangabad
SW 181 Aurangabad Aurangabad - Near Patoda Village 77 65 65 Aurangabad Aurangabad Aurangabad
SW 182 Aurangabad Aurangabad - Near Chikhalthana Bridge
65 68 Aurangabad Aurangabad Aurangabad
SW 183 Aurangabad Aurangabad - At Sukhna Dam 78 81 76 Aurangabad Aurangabad Aurangabad
SW 184 Aurangabad Aurangabad - Harsool Dam 80 81 81 Aurangabad Aurangabad Aurangabad
SW 1209 Aurangabad Godavari River at Raher 82 84 83 Nanded Nayagaon Raher
SW 1210 Aurangabad Godavari River at Intake of pump house 80 82 84 Nanded Nanded Vishnupuri
SW 1312 Aurangabad Godavari river at Jaikwadi Dam, Paithan 81 83 85 Aurangabad Paithan Paithan
SW 2157 Aurangabad Godavari River at Latur Water intake near pump house 80 84 82 Osmanabad Kalumb Dhamegaon
SW 2158 Aurangabad Godavari River at Paithan U/s of Paithan Intake pump house
83 85 85 Aurangabad Paithan Jayakwadi
SW 2159 Aurangabad Godavari River at D/s of Paithan at Pathegaon bridge 83 84 84 Aurangabad Paithan Pathegaon
SW 2160 Aurangabad Godavari River at U/s of Aurangabad Reservoir Kaigaon Tokka near, Kaigaon Bridge
83 86 85 Aurangabad Gangapur Kaigaon
SW 2161 Aurangabad Godavari River at Jalna Intake water pump house Shahagad
84 80 82 Jalna Ambad Shahabad
SW 2657 Aurangabad Bindusara River at Beed, near Intake water pump house at Dam
82 83 Beed Beed Paligaon
SW 2673 Aurangabad Manjra River at D/s of Latur, near Latur-Nanded Bridge Not
collected 85 85 Latur Latur Bhatkheda
GW 1993 Aurangabad Dug well at Pandarpur, Gangapur, Aurangabad
Aurangabad Gangapur Pandharpur
GW 2200 Aurangabad Bore Well at Katpur, Near Z.P.School 137 310 224 Aurangabad Paithan Katpur
GW 2201 Aurangabad Dug Well at Ranjangaon
Aurangabad Gangapur Ranjangaon
GW 2824 Aurangabad Dug Well at Naregaon
Aurangabad Aurangabad Naregaon
GW 2825 Aurangabad Bore Well at Wahegaon, near Zilla Parishet School 244 242 243 Aurangabad Paithan Wahegaon
Surface Water
Good to Excellent Medium to Good Bad Bad to Very Bad Dry Not collected
Ground Water Excellent Good Poor Very Poor Not suitable for drinking Dry Not collected

160
RO – Chandrapur

161
Table No. 32: Water quality Index for surface and ground water monitoring at Chandrapur RO – 2016-17
Type Statio
n code
Regional
Office Station Name April Dec/Oct Average District Taluka Village
SW 11 Chandrapur Wainganga River at Ashti 62 56 62 Chandrapur Gondpipri Ashti
SW 1212 Chandrapur Wardha river at Rajura bridge 62 60 57 Chandrapur Chandrapur Rajura
SW 2156 Chandrapur Wardha River at confluence point of Penganga & Wardha
64 58 58 Yavatmal Wani Jugad
SW 2174 Chandrapur Wardha River at D/s of ACC Ghuggus 62 57 57 Chandrapur Chandrapur Ghuggus
SW 2175 Chandrapur Wainganga at U/s of Gaurav Paper Mills near Jack Well
60 57 61 Chandrapur Chandrapur Bramhpuri
SW 2176 Chandrapur Wainganga River at D/s of Gaurav Paper Mills Near Jackwell
61 55 58 Chandrapur Chandrapur Bramhpuri
SW 2719 Chandrapur Wardha River at D/s of Erai River 60 56 58 Chandrapur Chandrapur Hadasti
SW 2720 Chandrapur Wardha River at U/s of Erai River 61 59 61 Chandrapur Chandrapur Hadasti
SW 2721 Chandrapur Wardha River at U/s of ACC Ghuggus 64 61 60 Chandrapur Chandrapur Ghuggus
GW 2828 Chandrapur Dug Well near Jilla Parishad Primary School Visapur
Not collected
Not collected
Not collected
Chandrapur Ballarpur Visapur
GW 1994 Chandrapur Dug well At TPS Durgapur near Naseeb Kirana {} general Store.
Not Collected
Not collected
Not collected
Chandrapur Chandrapur Durgapur
Surface Water
Good to Excellent Medium to Good Bad Bad to Very Bad No Data
Ground Water Excellent Good Poor Very Poor Not suitable for drinking No data
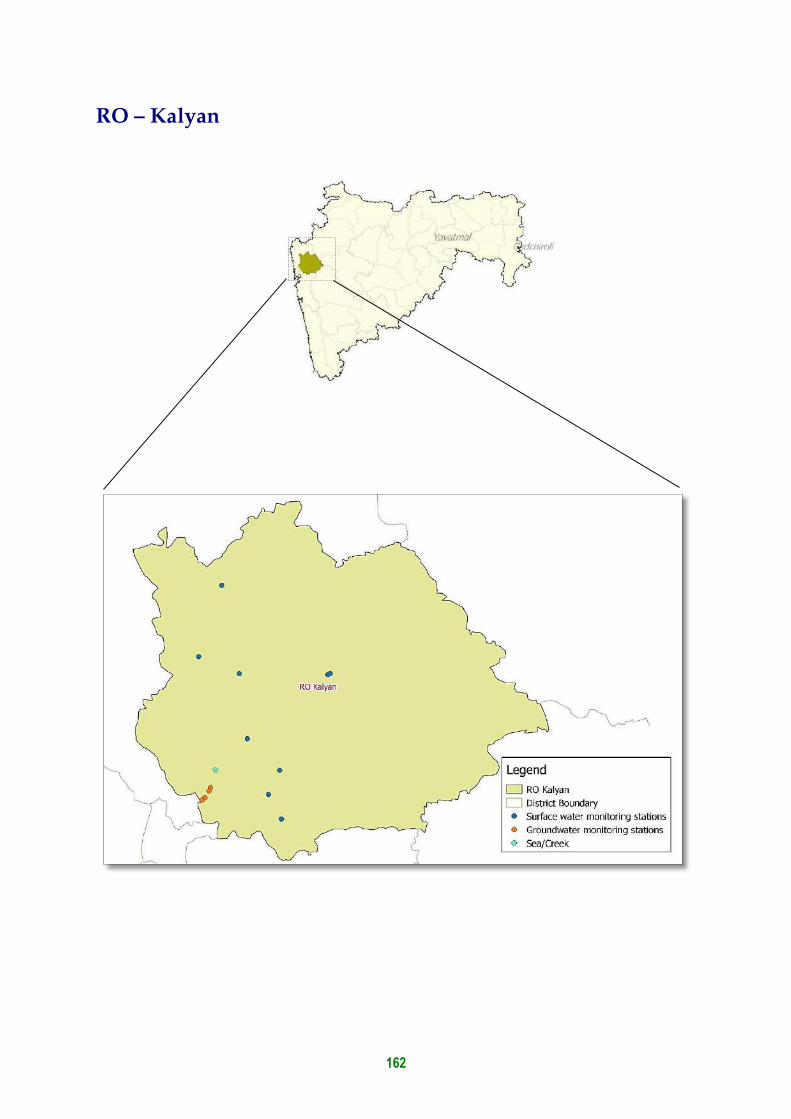
162
RO – Kalyan

163
Table No. 33: Water quality Index for surface and ground water monitoring at Kalyan-RO – 2016-17
Type Station
code
Regional
Office Station Name April Dec/Oct Average District Taluka Village
SW 1092 Kalyan Kalu River at Atale village 63 53 54 Thane Kalyan Atale
SW 1093 Kalyan Ulhas river at U/s of NRC Bund 82 77 82 Thane Kalyan Mohane
SW 1094 Kalyan Ulhas River at U/s of Badlapur water works 82 86 82 Thane Ambernath Kulgaon
SW 1461 Kalyan Bhatsa river at D/s of Pise Dam 81 84 82 Thane Bhiwandi Pise
SW 2162 Kalyan Ulhas River at Jambhul water works 85 80 84 Thane Ambernath Jambhul
SW 2653 Kalyan Bhatsa River at D/s of Liberty Oil Mills 81 79 78 Thane Shahapur Satne
SW 2654 Kalyan Bhatsa River at D/s of Liberty Oil Mills 79 81 79 Thane Shahapur Satne
SW 2709 Kalyan Tansa River near road bridge 79 79 79 Thane Wada Dakewali
SW 2712 Kalyan Vaitarna River near Road Bridge 76 Not
collected
80 Thane Wada Gandhare
Saline
2791 Kalyan Ulhas Creek at Reti Bunder, D/s of Kalyan-Bhiwandi Bridge 61 55 53 Thane Kalyan Kalyan
GW 205 Kalyan Dug well opp. KAMA office, MIDC Ph-I, Dombivali Not
Collected 174 174 Kalyan Dombivali
MIDC,Dombivali
GW 206 Kalyan Dug well near Mamta Hospital, Milap Nagar, Dombivali Not
Collected Closed Closed Kalyan Dombivali
MIDC,Dombivali
GW 207 Kalyan Dug well at pimpleshwar Temple, MIDC Ph-II, Dombivali Not
Collected 115 115 Kalyan Dombivali
MIDC,Dombivali
GW 208 Kalyan Dug well addjusent to M/S. Altra pure chem., Sr. No. 45, Hissa
No. 3, MIDC Ph-II, Dombivali. Not
Collected 82 82 Kalyan Dombivali
MIDC,Dombivali
Surface Water
Good to Excellent Medium to Good Bad Bad to Very Bad No
Data
Ground Water
Excellent Good Poor Very Poor Not suitable for drinking No
data

164
RO – Kolhapur

165
Table No. 34 Water quality Index for surface and ground water monitoring at Kolhapur-RO – 2016-17
Type Station code
Regional Office
Station Name April Dec/Oct Average District Taluka Village
SW 37 Kolhapur Krishna River at Maighat, Sangli 65 68 66 Sangli Miraj Gawali gally
SW 198 Kolhapur Bahe KT Weir, Bahe, Taluka - Walwa, District - Sangli 63 65 64 Sangli Walwa Bahe
SW 199 Kolhapur Borgaon KT Weir, Borgaon, Taluka - Walwa, District - Sangli 65 69 64 Sangli Walwa Borgaon
SW 200 Kolhapur Mangle Bridge, Mangle, Taluka - Shirala, District - Sangli 66 64 64 Sangli Shirala Mangle
SW 201 Kolhapur Sonpatra River At Kotwali Village, Taluka - Khed, District - Ratnagiri 67 66 65 Ratnagiri Khed Kotwali
SW 202 Kolhapur Vashisti River At Khadpoli, Taluka Chiplun, District - Ratnagiri 66 64 65 Ratnagiri Chiplun Khadpoli
SW 203 Kolhapur Jagbudi River, D/S of Khed City, Taluka - Khed, District Ratnagiri 66 65 66 Ratnagiri Khed Khed City
SW 204 Kolhapur Jog river at Dapoli, Taluka Dapoli, District - Rantnagiri
64 65 Ratnagiri Dapoli Dapoli
SW 1153 Kolhapur Krishna River at Rajapur Weir 66 65 63 Kolhapur Shirol Rajapur
SW 1310 Kolhapur Krishna River at Kurundwad 67 64 63 Kolhapur Shirol Narshingwadi, Kurundwad
SW 1311 Kolhapur Panchganga River at Ichalkaranji near MIDC intake well 66 63 61 Kolhapur Hatkanangale
Shiradhwad (Ichalkaranji ghat)
SW 1904 Kolhapur Panchganga River at U/s of Kolhapur town near Balinga Pumping Station
67 64 63 Kolhapur Karvir Balinga
SW 1905 Kolhapur Panchaganga river at D/s of Kolhapur town at Gandhi nagar near NH-4 bridge and MIDC intake well
68 63 63 Kolhapur Kolhapur
Uchegaon
SW 1906 Kolhapur Krishna river at Walwa, D/s of Islampur near Vithal Temple 66 66 65 Sangli Walwa Walwa
SW 2163 Kolhapur Panchganga River at Shirol near Shirol intake well 66 63 62 Kolhapur Shirol Shirol
SW 2164 Kolhapur Vashishti River at U/s of Three M Paper Mills near M/s Multifilms Plastic Pvt Ltd
68 65 66 Ratnagiri Chiplun Kherdi
SW 2676 Kolhapur Muchkundi River at Waked Ratnagiri near M/s Asahi India Glass 67 61 64 Ratnagiri Lanja Waked
SW 2713 Kolhapur Vashishti River at D/s of Three M Paper Mills near Chiplun water intake Jackwell
66 68 66 Ratnagiri Chiplun Kherdi
SW 2714 Kolhapur Vashishti River at U/s of Pophali near Konphansawane Bridge 65 66 65 Ratnagiri Chiplun Pophali
Nalla 2790 Kolhapur Pimpal-Paneri Nalla at Ratnagiri near Finolex Industries 56 57 59 Ratnagiri Ratnagiri
Yahganigaon
Saline 2804 Kolhapur Karambavane Creek at Chiplun 61 66 64 Ratnagiri Chiplun Karambavane
Saline 2813 Kolhapur Sea Water at Ganapatipule 60 58 60 Ratnagiri Ratnagiri
Ganapatipule
Saline 2814 Kolhapur Sea Water at Bhagwati Bunder, Ratnagiri near Ultra Tech Cement Jetty 60 56 59 Ratnagiri Ratnagiri
Mirkarwada
Saline 2815 Kolhapur Madvi Sea Water at Ratnagiri near Jodhale Maruti Temple 63 57 58 Ratnagiri Ratnagiri
Madvigaon
GW 2004 Kolhapur Bore well at Parvati Industrial Estate, Yadrav, Kolhapur 158 182 170 Kolhapur Shirol Yadrav
GW 2005 Kolhapur Bore well at Khanjirenagar, Kolhapur 152 112 132 Kolhapur Hatkanangale
Khanjirenagar
GW 2006 Kolhapur Bore well at Shinoli near M/s Aqua Alloy Steel. 135 157 146 Kolhapur Chandgad
Shinoli

166
GW 2007 Kolhapur Bore well at Savali, near Gram Panchayat office. 128 145 136 Sangli Miraj Savali
GW 2008 Kolhapur Dug well at Sambarwadi, owned by Shri. Kishan Hali Rajput. 132 191 161 Sangli Miraj Sambarwadi
GW 2202 Kolhapur Dug Well at Ghane Kunt, near Awashi, onwed by shri Rajendra Amre 25 23 24 Ratnagiri Khed Ghane Kunt
GW 2829 Kolhapur Bore Well at MIDC Shiroli near M/s. Pratibha Enterprises 56 198 127 Kolhapur Hatkanangale
Shiroli
GW 2830 Kolhapur Bore Well at MIDC Gokul Shirgaon 135 101 118 Kolhapur Karvir Gokul-Shirgaon
GW 2831 Kolhapur Dug Well at Sakharali near MIDC Islampur near Krishna Milk Industry 140 117 128 Sangli Walwa Sakharali
GW 2832 Kolhapur Dug Well No.1 at Brahmanwadi-Anjanwel, owned by Shri Vaidya 38 20 29 Ratnagiri Guhagar
Anjanwel
GW 2833 Kolhapur Dug Well No.1 at Group Gram Panchayat at Arketwadi, near Masjid 24 35 29 Ratnagiri Khed Arketwadi
GW 2834 Kolhapur Dug Well No.2 at Arketwadi 497 36 267 Ratnagiri Khed Arketwadi
GW 2835 Kolhapur Dug Well No.2 at owned by Group Gram Panchayat, Brahmanwadi-Anjanwel
28 19 23 Ratnagiri Guhagar
Anjanwel
GW 219 Kolhapur Commen well Water At Patwardhan, Lote, Taluka - Khed, District - Rantnagiri
27 62 44 Ratnagiri Khed Lote
GW 220 Kolhapur Dugwell backside Excel India At Chalkewadi, Taluka - Khed, District - Ratnagiri.
33 19 26 Ratnagiri Khed Chalkewadi
Surface Water
Good to Excellent Medium to Good Bad Bad to Very Bad No
Data
Ground Water Excellent Good Poor Very Poor Not suitable for drinking No data


168
RO – Mumbai

169
Table No. 35: Water quality Index for surface and ground water monitoring at Mumbai-RO – 2016-17
Type
Stati
on code
Regional Office
Station Name April Dec/Oct Average District Taluka Village
Saline 1318 Mumbai Mahim creek at Mahim Bay 51 46 50 Mumbai Bandra Mahim
Saline 2165 Mumbai Sea Water at Gateway of India 48 41 47 Mumbai Colaba Colaba
Saline 2166 Mumbai Sea Water at Charni Road Choupathy 47 45 47 Mumbai Mumbai Girgaon
Saline 2167 Mumbai Sea Water at Worli Seaface 54 44 47 Mumbai Worli Worli
SW 2168 Mumbai Mithi River at near bridge 31 27 32 Mumbai Bandra Mahim
Saline 2169 Mumbai Sea Water at Varsova Beach 52 47 47 Mumbai Andheri Versova
Saline 2808 Mumbai Sea Water at Nariman Point 49 44 47 Mumbai Colaba Colaba
Saline 2809 Mumbai Sea Water at Malabar Hill 51 44 48 Mumbai Mumbai Walkeshwar
Saline 2810 Mumbai Sea Water at Haj Ali 55 50 48 Mumbai Worli Worli
Saline 2811 Mumbai Sea Water at Shivaji Park (Dadar Choupathy)
50 44 48 Mumbai Dadar Dadar
Saline 2812 Mumbai Sea Water at Juhu Beach 50 50 47 Mumbai Santacruz Juhugaon
Surface Water
Good to Excellent Medium to Good Bad Bad to Very Bad Dry No Data
Ground Water Excellent Good Poor Very Poor Not suitable for drinking Dry No data

170
RO – Nagpur

171
Table No. 36: Water quality Index for surface and ground water monitoring at Nagpur-RO – 2016-17
Typ
e
Station
code
Regional
Office Station Name April Dec/Oct Average District Taluka Village
SW 185 Nagpur Nag River Near, Ambazari Lake, Nagpur 78 74 71 Nagpur Nagpur Nagpur
SW 186 Nagpur Nag River Near, Bhandewadi Bridge, Nagpur 34 51 38 Nagpur Nagpur Nagpur
SW 187 Nagpur Nag River Near, Asoli Bridge, Bhandara Road, Nagpur 39 40 40 Nagpur Nagpur Nagpur
SW 188 Nagpur Pill River Near, Wanjra Layout Kamptee Road, Nagpur 62 56 41 Nagpur Nagpur Nagpur
SW 189 Nagpur Pill River Near, Mankapur on Koradi Road, Nagpur 59 46 45 Nagpur Nagpur Nagpur
SW 1315 Nagpur Wardha River at Pulgaon Railway Bridge 65 Not collected
70 Wardha wardha Pulgaon
SW 1908 Nagpur Kolar river before confluence with Kanhan river at Waregaon Bridge
75 68 72 Nagpur Kamptee Waregaon
SW 1909 Nagpur Kanhan river at D/s of Nagpur 69 Not collected
69 Nagpur Kuhi Agargaon
SW 1910 Nagpur Wainganga river after confluence with Kanhan river 74 Not collected
72 Nagpur Kuhi Ambhora
SW 2170 Nagpur Kanhan River (Wainganga basin) at U/s of M/s Vidharba Paper Mill
84 76 77 Nagpur Parseoni Sinora
SW 2171 Nagpur Kanhan River (Wainganga basin) at D/s of M/s Vidharbha Paper Mills
79 73 72 Nagpur Parseoni Sinora
SW 2172 Nagpur Wainganga River at D/s of Ellora Paper Mill 76 70 66 Bandara Tumsar Tumsar
SW 2173 Nagpur Wainganga River at U/s of Ellora Paper Mills 71 75 69 Bandara Tumsar Tumsar
SW 2722 Nagpur Wena River at U/s of Mohata Mills, nearby Brigde on Hinganghat Wadner Road
82 Not collected
78 Wardha Hinganghat
Hinganghat
SW 2723 Nagpur Wena River at D/s of Mohata Mills, near Bridge on Hinganghat-Wadner Road
75 Not collected
71 Wardha Hinganghat
Hinganghat
GW 1995 Nagpur Gram Panchayath Dug well , Near Balaji Gajbhiye House, Khaperkheda
103 112 107 Nagpur Saoner Khaperkheda( Ward No.4)
GW 1996 Nagpur Gram Panchayath Dug well , Near Jagadamba G M S Mandir Sahakari Sanstha
136 103 120 Nagpur Kamptee Koradi
GW 1997 Nagpur Bore well near Primary Health Centre, Raipur(Hingna) 40 40 Nagpur Hingna Raipur
GW 1998 Nagpur Gram Panchayat Dug well near Gram Panchayat Office, Brahmni
83 86 85 Nagpur Kalmeshwar
Brahmni

172
GW 1999 Nagpur Bore well Near Gram Panchayat,Changera. 106 106 Gondia Gondia Changera
GW 2000 Nagpur Dug well near Sarode Kirana Store, Bhandewadi, Nagpur Closed Closed Closed Nagpur Nagpur Bhandewadi
GW 2203 Nagpur Hand Pump in the premises of Z.P.Primary School 41 41 Wardha wardha Bhugaon
GW 2826 Nagpur Dug Well near Railway Station, Cottaon Market 71 71 Wardha wardha Wardha
GW 2827 Nagpur Bore Well near Railway crossing at Dongi Buzurg Closed Closed Closed Bandara Tumsar Dongri-Buzurg
GW 209 Nagpur Bore well near Pardhi House, Bhandewadi, Nagpur 71 113 92 Nagpur #N/A Bhandewadi
GW 210 Nagpur Bore well near Dearao Kale House, Bhandewadi, Nagpur 56 136 96 Nagpur #N/A Bhandewadi
GW 212 Nagpur Grampanchayat Mhasala, Dugwell On Nalla At Mhasala, Taluka - Kamptee, District - Nagpur
128 151 139 Nagpur Kamptee Mhasala
GW 213 Nagpur Grampanchayat Kawtha, Dugwell At Kawtha, Taluka - Kamptee, District - Nagpur
132 134 133 Nagpur Kamptee Kawtha
Surface Water
Good to Excellent Medium to Good Bad Bad to Very Bad No Data Not
collected
Ground Water Excellent Good Poor Very Poor Not suitable for drinking No data Not
collected


174
RO – Nashik

175
Table No. 37: Water quality Index for surface and ground water monitoring at Nashik -RO – 2016-17
Type Station code Station Name April Dec/Oct Average District Taluka Village
SW 194 Kadwa River at Awankhed Village, Taluka - Dindori, District - Nashik
91 92 88 Nashik Dindori Awankhed Village
SW 195 Sina River Bridge At Burudgaon Road, A/P Ahmednagar, Taluka & District Ahmednagar
76 55 60 Ahmednagar
Ahmednagar
Burudgaon
SW 196 Lowki Nalla At Khedi, Taluka & District - Jalgaon 83 49 65 Jalgaon Khedi Khedi
SW 197 Moti Nalla before Confluence with Panjara river Dhule, Taluka & District - Dhule
40 70 54 Dhule Dhule Dhule
SW 1095 Godavari River at U/s of Gangapur Dam 81 92 88 Nashik Nashik Gangapur
SW 1096 Godavari River at Panchavati at Ramkund 75 65 80 Nashik Nashik Panchavati
SW 1211 Godavari River at Nashik D/s of near Amardham 66 80 79 Nashik Nashik Gadgebaba Maharaj Nagar
SW 1251 Tapi River at Bhusawal 81 91 86 Jalgaon Bhusawal
Bhusawal Railway Colony
SW 1252 Girna river at Jalgaon at intake of Girna pump house
92 81 Jalgaon Jalgaon Girna pump house area
SW 1253 Girna river at Malegaon at Malegaon road bridge
91 84 Nashik Malegaon
Malegaon
SW 1313 Tapi River at Ajnad 85 92 85 Jalgaon Raver Ajnad
SW 1314 Tapi river at Ubad village near Gujrat border 87 90 86 Nandurbar Shahada
Ubad
SW 1907 Rangavali river at D/s of Navapur near Rangavali bridge
90 88 Nandurbar Navapur
Navapur
SW 2177 Godavari River near Someshwar Temple 77 88 83 Nashik Nashik Someshwar
SW 2178 Chikhali Nalla Meets Godavari River
64 72 Nashik Nashik Chikhali
SW 2179 Godavari River at Hanuman Ghat 70 89 80 Nashik Nashik Nashik city
SW 2180 Godavari River at near Tapovan 89 82 80 Nashik Nashik Tapovan
SW 2181 Godavari River at Kapila -Godavari confluence point 93 83 82 Nashik Nashik Tapovan
SW 2182 Godavari River at Saikheda 85 89 87 Nashik Niphad Saikheda
SW 2183 Godavari River at Nandur-Madhameshwar Dam 90 92 87 Nashik Niphad Nandur
SW 2652 Amravati River D/s of Dondaicha
87 Dhule Dhule Dondaicha
SW 2658 Bori River D/s of Amalner
83 Jalgaon Jalgaon Amalner
SW 2659 Burai River before confluece to Tapi River
90 Dhule Dhule Mukudas

176
SW 2660 Darna River at Chehedi pumping station 89 92 89 Nashik Nashik Chehedi
SW 2661 Darna River at Aswali (Darna Dam) 89 90 89 Nashik Igatpuri
Aswali
SW 2662 Darna River at MES site Pumping station 87 92 88 Nashik Nashik Bhagur
SW 2663 Darna River at Bhagur Pumping station near Pandhurli Bridge
92 91 87 Nashik Nashik Bhagur
SW 2664 Darna River at Sansari 89 89 88 Nashik Nashik Sansari
SW 2666 Gomai River D/s of Shahada
90 Dhule Dhule Shahada
SW 2667 Hiwara River D/s of Pachora
83 Jalgaon Jalgaon Pachora
SW 2670 Kan River near Sakri water works
89 Dhule Dhule Sakri
SW 2674 Mor River near Padalshe
86 Jalgaon Jalgaon Padalashe
SW 2684 Panzara River near Panzarakan SSK Ltd
88 87 Dhule Dhule Panzare
SW 2689 Patalganga River at Gagangiri Maharaj Temple 82 73 80 Raigad Khalapur
Khopoli
SW 2710 Titur River D/s of Chalisgaon
84 Jalgaon Jalgaon Chalisgaon
SW 2718 Waghur River at Sakegaon before Confluence with Tapi River
86 Jalgaon Jalgaon Sakegaon
GW 1990 Bore well at BMW Site , Burudgaon Closed Closed Closed Ahmadnagar
Ahmednagar
Burudgaon
GW 1991 Bore well at MSW Site, Pathardi, Nashik
Nashik Nashik Pathardi
GW 2204 Dug well at Gunjalwadi, Sangamner near Primary Health Care Center.
Ahmadnagar
Sangamner
Gunjalwadi
GW 2816 Dug Well of Mr. Sampat Walunj, near M/s. Mahajeet Clayton
Nashik Nashik Shinde village
GW 2817 Bore Well at Chitali near Wagh vasthi
Ahmadnagar
Rahata Chitali
GW 2818 Bore Well at M/s. Spectron Ethers Rasegaon near Siddeshwar Mahadev Mandir
Not collected
Not collected
Nashik Dindori Rasegaon
GW 221 well water of Bappaji, Akolner, Ahmadnagar, Nashik 74 96 85 Nashik Ahmadnagar
Akolner
Surface Water
Good to Excellent Medium to Good Bad Bad to Very Bad No
Data
Not collect
ed
Ground Water
Excellent Good Poor Very Poor Not suitable for drinking No data Not
collected


178
RO – Navi Mumbai

179
Table No. 38: Water quality Index for surface and ground water monitoring at Navi Mumbai-RO – 2016-17
Type Station
code
Regional
Office Station Name April Dec/Oct Average District Taluka Village
Saline 190 Navi Mumbai TTC Creek At Ghansoli Jetty 49 50 53 Thane Thane Ghansoli
Saline 191 Navi Mumbai Arabian Sea behind ONGC Uran
46 47 48 Raigad Uran Uran
SW 216 Navi Mumbai Kasardi River near Ganesh Ghat
68 39 62 Raigad Panvel Taloja
Saline 1317 Navi Mumbai Thane creek at Elephanta Island
50 50 52 Raigad Uran
Gharapuri, Elephanta Island
Saline 2184 Navi Mumbai Vashi Creek at Airoli Bridge 52 52 53 Thane Thane Airoli
Saline 2185 Navi Mumbai Vashi Creek at Vashi Bridge 75 54 56 Thane Thane Vashi
GW 214 Navi Mumbai Borewell at TTCWMA, Mahape 37 50 43 Thane Thane TTCWMA,Mahape
GW 215 Navi Mumbai Well water at Turbhe Store, Turbhe
3662 27 1845 Thane Thane Turbhe
Surface Water
Good to Excellent Medium to Good Bad Bad to Very Bad
No Data Not collected
Ground Water Excellent Good Poor Very Poor Not suitable for drinking
No data Not collected
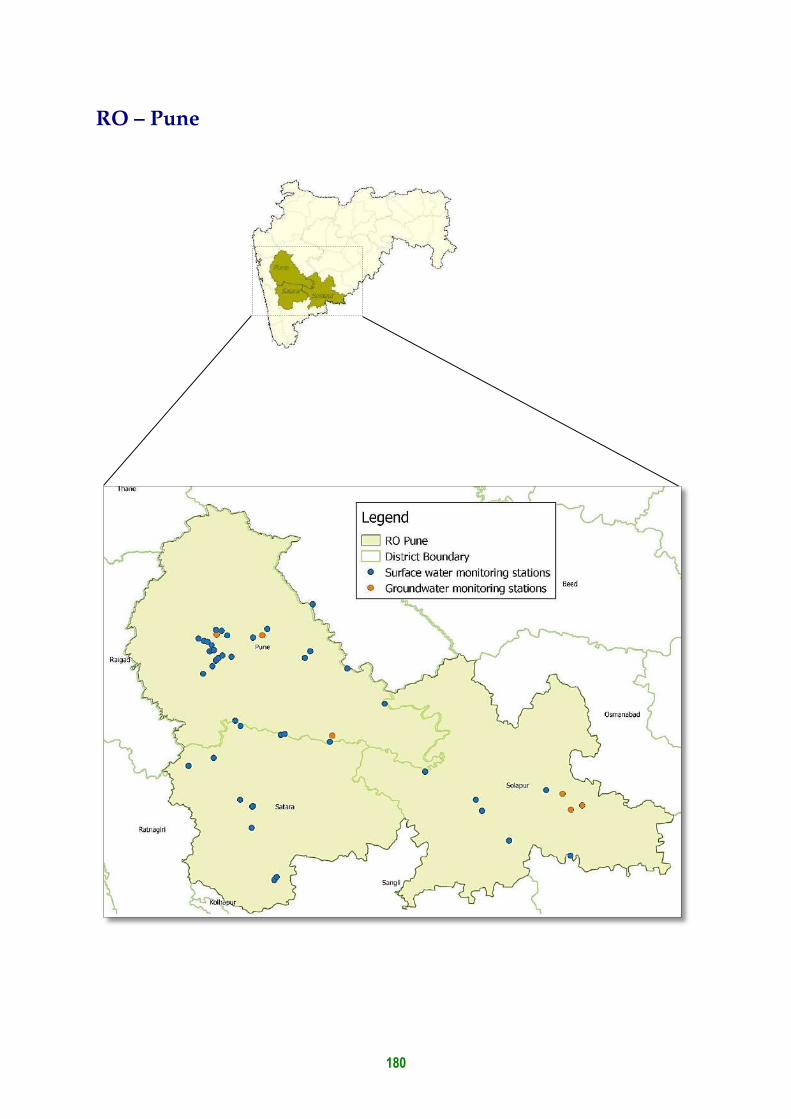
180
RO – Pune

181
Table No. 39: Water quality Index for surface and ground water monitoring at Pune-RO – 2016-17
Typ
e
Station
code Station Name
Apri
l Dec/Oct
Averag
e
Distri
ct Taluka Village
SW 28 Bhima River at Takli 67 73 67 Solapur
South Solapur
Takali
SW 36 Krishna River at Krishna Bridge, Karad 53 79 66 Satara Karad Karad
SW 1188 Bhima River at Narshingpur near Sangam Bridge after confluence with Nira
67 Solapur
Malshiros Narsingpur
SW 1189 Bhima river at Pune( Mutha river) at U/s of Vithalwadi near Sankar Mandir
53 22 45 Pune Haweli Vithalwadi
SW 1190 Bhima river at D/s of Bundgarden, Pune 34 23 43 Pune Haweli Yerwada
SW 1191 Bhima river after confluence with Mula-Mutha at Pargaon near Vasant Bandara
43 35 52 Pune Daund Pargaon
SW 1192 Bhima river at Daund near Mahadev temple 40 51 49 Pune Daund Daund
SW 1194 Krishna river at Dhom Dam 67 85 70 Satara Mahabaleshwar
Wai
SW 1463 Nira river at Sarola bridge 48 62 58 Pune Bhor Sarola
SW 1911 Chandrabhaga river at U/s of Pandharpur town 69 69 72 Solapur
Pandarpur Gursale
SW 1912 Chandrabhaga river at D/s of Pandharpur town near Vishnupant Mandir
58 70 62 Solapur
Pandarpur Gopalpur
SW 2186 Venna River at Varya, Satara 73 75 64 Satara Satara Varye
SW 2187 Krishna River at Kshetra Mahuli Satara 54 69 60 Satara Mahuli Kshetra Mahuli
SW 2188 Krishna River at Krishna-Venna Sangam, Mahuli 77 77 64 Satara Mahuli Mahuli
SW 2189 Koyna River at Karad 55 72 64 Satara Karad Karad
SW 2190 Krishna River at Wai 70 66 68 Satara Wai Wai
SW 2191 Mutha River at Sangam Bridge Near Ganpathi Ghat 30 20 41 Pune Pune Shivaji Nagar
SW 2192 Mula-Mutha River at Mundhwa Bridge 36 24 46 Pune Haweli Mundhawa
SW 2193 Mula River at Aundh Bridge -Aundgaon 47 25 47 Pune Haweli Aundhgaon
SW 2194 Mula River at Harrison Bridge near Mula -Pawana Sangam 38 23 44 Pune Haweli Bopodi
SW 2195 Nira River at D/s of Jubilant Organosis Pune 38 47 46 Pune Baramati Nimbut
SW 2196 Pawana River at Sangavigaon, Pune 40 32 45 Pune Haweli Sangavigaon
SW 2197 Indrayani River at D/s of Alandigaon, Pune 45 57 57 Pune Haweli Alandigaon
SW 2655 Bhima River at Koregaon near Koregaon Bridge, Pune 60 55 58 Pune Shirur Koregaon
SW 2656 Bhima River Backwater of Ujani Dam near raw water pump house 72 57 58 Pune Indapur Kumbargaon
SW 2665 Ghod River at Shirur, Pune
46 48 Pune Shirur Shirur
SW 2668 Indrayani River at D/s of Moshi village
Not collected
55 Pune Haveli Moshi

182
SW 2669 Indrayani River at U/s of Moshigaon, Pune 70 44 59 Pune Haweli Moshigaon
SW 2677 Mula-Mutha River at D/s of Theur, Pune 48 51 49 Pune Haweli Theur
SW 2678 Mutha River near Veer Savarkar Bhavan 30 23 40 Pune Pune Pune M.C
SW 2679 Mutha River at Deccan Bridge, Pune 33 22 39 Pune Pune Deccan
SW 2680 Mutha River at Khadakvasla Dam Pune 62 67 63 Pune Haweli Kadakvasla
SW 2681 Nira River at Sangavi 57 61 56 Satara Phaltan Sangavi
SW 2682 Nira River at U/s of Jubilant Organosis Pune 58 59 52 Pune Baramati Nira( Datta ghat)
SW 2683 Nira River at Shindewadi 54 84 64 Satara Khandala Shindewadi, Shirwal
SW 2690 Pawana River at Kasarwadi Pune 39 33 44 Pune Haweli Kasarwadi
SW 2691 Pawana River at Dapodi Bridge at Pawana-Mulla Sangan Pune 41 30 44 Pune Haweli Dapodi
SW 2692 Pawana River at Ravet Weir, Pune 62 54 60 Pune Haweli Ravet
SW 2693 Pawana River at Chinchwadgaon, Pune 43 62 49 Pune Haweli Chinchwadgaon
SW 2694 Pawana River at Pimprigaon, Pune 42 22 45 Pune Haweli Pimprigaon
SW 2705 Sina River near Laboti till naka Solapur
78 Solapur
Mohal Laboti
SW 2711 Urmodi River at Nagthane Satara 56 75 63 Satara Satara Nagthane
SW 2715 Vel River at Shikrapur, Pune
49 Pune Shirur Shikrapur
SW 2716 Venna River at Mahabaleshwar 74 80 74 Satara Mahabaleshwar
Mahabaleshwar
SW 2717 Venna River at Mahuli 42 73 59 Satara Satara Mahuli
SW 2789 Nalla at D/s of Alkai Mandir, Solapur
70 Solapur
Malshiras Aklai
GW 2823 Bore Well at Shete Vasti near old Tuljapur Road 205 142 173 Solapur
Solapur Shete vasthi, Tuljapur Naka
GW 1992 Dug well at MSW Site,owned by Shri.Dattu Kondiba Borate at Borate Vasthi.
126 125 125 Pune Haveli Moshi
GW 2819 Dug Well Owned by Shri Deshmukh 310 133 221 Pune Baramati Malegaon
GW 2820 Dug Well Owned by Shri Shivaji Baban Darekar 51 132 92 Pune Shirur Sanaswadi
GW 2821 Bore Well at Bale Railway Station premises Owned by Shri Digambar Joshi
96 222 159 Solapur
North Solapur
Dahegaon
GW 2822 Bore Well near Chincholi 414 133 273 Solapur
Mohol Chincholi
Surface Water
Good to Excellent Medium to Good Bad Bad to Very Bad No
Data
Not
collected
Ground Water Excellent Good Poor Very Poor Not suitable for drinking No data Not
collected

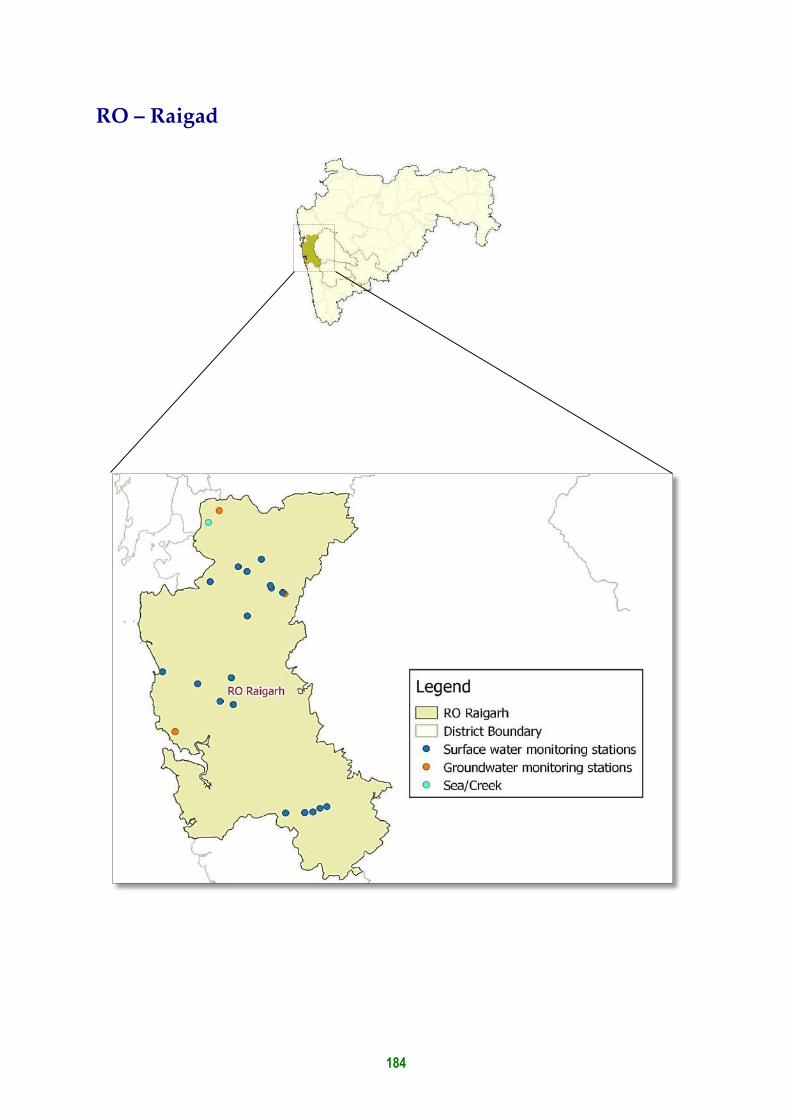
184
RO – Raigad

185
Table No. 40: Water quality Index for surface and ground water monitoring at Raigad RO – 2016-17
Type Station code Station Name April Dec/Oct Average District Taluka Village
SW 192 Morbe Dam, Taluka - Khalapur, District - Raigad 83 87 83 Raigad Khalapur Khalapur
SW 193 Balganga River, Village Ransai, Taluka - Khalapur, District - Raigad 86 90 81 Raigad Khalapur Ransai
SW 1151 Patalganga River at Shilphata Bridge 82 75 80 Raigad Khalapur Khopoli
SW 1152 Kundalika River at Roha Bridge 80 84 79 Raigad Roha Roha
SW 1462 Patalganga near intake of MIDC water works( Turade w/w) 81 73 78 Raigad Khalapur Turade
SW 2198 Kundalika River at Are Khurd (Saline Zone) 76 73 70 Raigad Roha Are Khurd
SW 2199 Savitri River at Ovale village 63 53 64 Raigad Mahad Ovale
SW 2651 Amba River at D/s of Waken Bridge 82 79 78 Raigad Roha Waken Phata
SW 2671 Kundalik River near Salav Bridge (Saline Zone) 59 83 61 Raigad Roha Salav
SW 2672 Kundalika River at Dhatav at Jackwell 78 85 80 Raigad Roha Dhatav
SW 2685 Patalganga River at D/s of Kharpada Bridge 68 45 74 Raigad Khalapur Kharpada
SW 2686 Patalganga River at Vyal pump house 86 79 83 Raigad Khalapur Vyal
SW 2687 Patalganga River at Khalapur pumping house 84 80 82 Raigad Khalapur Khalapur
SW 2688 Patalganga River at Savroli Bridge 78 75 77 Raigad Khalapur Savroli
SW 2701 Savitri River Jackwell at Upsa kendra 67 60 66 Raigad Mahad Nangalwadi
SW 2702 Savitri River at Shedav Doh 66 60 66 Raigad Mahad Shedav Dov
SW 2703 Savitri River at Dadli Bridge 64 64 65 Raigad Mahad Dadli
SW 2704 Savitri River at Muthavali village 64 64 65 Raigad Mahad Muthavali
Saline 2803 Panvel Creek at Kopra Bridge 65 43 58 Raigad Panvel Kopra
GW 1989 Bore well at MWML Site at Taloja 135 49 92 Raigad Panvel Karawla- Taloja
GW 217 Borewell water at village Milgaon, Taluka - Khalapur, District - Raigad. 46 50 48 Raigad Khalapur Milgaon
GW 218 Borewell water near MSW site, Murud - Janjira. Closed Closed Closed
Murud Janjira
Surface Water Good to Excellent Medium to Good Bad Bad to Very Bad
Not collected
No data
Ground Water Excellent Good Poor Very Poor Not suitable for
drinking Not collected
No data

186
RO – Thane

187
Table No. 41: Water quality index for surface and groundwater monitoring at Thane RO -2016-17
Typ
e
Station
code
Regional
Office Station Name
Apri
l
Dec/
Oct
Avera
ge
Distri
ct Taluka Village
Saline
1316 Thane Bassein creek at Vasai Fort, Thane 58 46 55 Thane
Vasai Bassein
SW 2696 Thane Pelhar dam 83 74 80 Thane
Vasai Pelhar
SW 2706 Thane Surya River U/s of Surya Dam 82 85 83 Thane
Vikramgad Dhamni
SW 2707 Thane Surya River at MIDC pumping station 84 83 83 Thane
Palghar Garvashet
Nalla
2708 Thane Surya River at Intake of Vasai-Virar water scheme 77 82 82 Thane
Palghar Masvan
Nalla
2782 Thane Rabodi Nalla 54 32 35 Thane
Thane Rabodi
Nalla
2783 Thane Colour Chem Nalla 56 28 36 Thane
Thane Majiwada
Nalla
2784 Thane Sandoz Nalla 27 26 30 Thane
Thane Sandozbaug
Nalla
2785 Thane BPT Navapur 28 24 26 Palghar
Palghar Navapur
Nalla
2786 Thane Tarapur MIDC Nalla, near sump No1
37 Palghar
Palghar MIDC Tarapur
Nalla
2787 Thane Tarapur MIDC Nalla
24 Palghar
Palghar MIDC Tarapur
Nalla
2788 Thane Tarapur MIDC Nalla near sump-III
26 Palghar
Palghar MIDC Tarapur
Saline
2792 Thane Ulhas Creek at Mumbra Reti Bunder 62 52 55 Thane
Thane Mumbra
Saline
2793 Thane Thane Creek at Kalwa Road Bridge 62 53 56 Thane
Thane Kalwa
Saline
2794 Thane Ulhas Creek at Kolshet Reti Bunder 60 57 58 Thane
Thane Kolshet
Saline
2795 Thane Ulhas Creek at Gaimukh at Nagla Bunder on Ghod Bunder Road
62 53 56 Thane
Thane Nagla
Saline
2796 Thane Ulhas Creek at Versova Bridge 56 47 55 Thane
Vasai Versova

188
Saline
2797 Thane Bhayander Creek at D/s of Railway Bridge at Jasal Park Choupathy
59 52 54 Thane
Bhayander Navghar
Saline
2798 Thane Kharekuran Murbe Creek 61 47 54 Thane
Palghar Kharekuran
Saline
2799 Thane Dandi Creek 59 46 52 Thane
Palghar Dandi
Saline
2800 Thane Sarwali Creek 69 49 60 Thane
Palghar Sarwali
Saline
2801 Thane Savta Creek 57 57 59 Thane
Dahanu Savta
Saline
2802 Thane Dahanu Creek at Dahanu Fort 57 51 56 Thane
Dahanu Danugaon
Saline
2805 Thane Arnala Sea 50 45 50 Thane
Vasai Arnala
Saline
2806 Thane Uttan Sea at Bhayander 51 46 49 Thane
Bhayander Uttan
Saline
2807 Thane Navapur Sea 50 43 45 Thane
Palghar Navapur
GW 1984 Thane Bore well at M/s Tata Iron {} Steel Co. Ltd, S-76 Closed
Closed
Closed
Thane
Palghar MIDCTarapur, Industrial Estate, Tarapur
GW 1985 Thane Dug well at 5 Star Industrial Estate 31 64 47 Thane
Mira-Bhayander
Kashimira
GW 1986 Thane Bore well at Motapada 42 93 68 Thane
Dahanu Motapada
GW 1987 Thane Bore well at Vasai 39 201 120 Thane
Vasai Gokhiware
GW 1988 Thane Bore well at Gharatwadi, Palghar 65 97 81 Thane
Palghar Aliyali
Surface Water Good to Excellent Medium to Good Bad Bad to Very Bad
Not collected No data
Ground Water
Excellent Good Poor Very Poor Not suitable for
drinking Not collected
No data

189
Annex III – List of Pending Writ petitions
List of writ petition / PIL pending before the honb’le high court of judicature Mumbai , Nagpur,
Aurangabad7 bench
Sr
No
Name of the parties Pil no. Region Subject matter
1 Vikas Raghunath Patil V/s. The State of Maharashtra & Ors
21204 of 2010
Pune River of Indrayani
2 Lalit Vathade V/s MPCB 85/2015 Aurangabad Bank of Panzra
3 Bombay Environment Action Group V/s. Union of India
Writ Petition no. 4564/88
Regarding pollution of Patalganga
4 Shri Prakash Jadhav Writ Petition no. 3366/08
Nagpur Wardha, Painganga & Wainganga major water polluting sources.
5 Daattatraya Hari Mane V/s. The state of Maharashtra & Ors
183/2012 Kolhapur Pollution of Panchganga
6 Narsinh S/o Laxmanrao Jadhav V/s. The State of Maharashtra & Ors
130/2014 Aurangabad Sukhna and Kham
7 Shri Atal Dubey v/s MCGM & Ors
PIL 27/2016
Mumbai
Issue to water logging in
the city of Mumbai
including Mithi river
pollution
Application Pending National Green Tribunal Wz, Pune, Regd . Pollution Matters Before Ngt, Nagpur &
Pune
Sr
No.
Name Of The Parties Application /
Appeal No.
Region Subject Matter
1 Court In Own Motion V/s. The State of Maharashtra & Ors
114/2014 Nagpur Pollution in Vidarbha Region
2 M/s. Janardhan Kundlikrao Pharande & Anr V/s. M.O.E.F & Ors
07/2014 (wz) Pune Regarding Nira Pollution
3 Mrs. Indu Gupta & Ors V/s. Goel Ganga Group & Ors
39/2015 Pune Regarding Ram Nadi Pollution
4 Subhash Ramkrishna Patil V/s. MPCB 55/2015 Pune Reg. RRZ policy
5 Chief Executive Officer,Zilha Parishad, Ahmednagar v/s Commissioner Municipal Corpn,Ahmednagar
110/2015
Pune
Regarding water pollution in Seena river
6 Akhil Bhartiya Mangela Samaj v/s MPCB &Ors
64/2016
Pune
Regd.Discharge of untreated effluent into Arbian sea at Navapur
7 Shewalewadi Gram Panchayat v/s Pune Municipal Corpn & Ors
37/2016
Pune
Not to release untreated sewage water in river bed
Shaikh Rashid Charitable Foundation ,Malegaon v/s Union of India & Ors
232/2016
Nagpur
To take immediate steps for preventing water pollution in the rivers due to dumping of municipal solid waste

190
Annex IV– List of Polluted Stretches across
Maharashtra
Priority Rank
1 2 3 4 5 Non polluted Mithi Morna Bhima Amba Krishna
Mula Ghod Amravati Panchganga Mula-Mutha Godavari Bhatsa Kan Pawana Indrayani Bindusara Savitri Kanhan Chandrabhaga Vashishti Nira Darna Pedhi Girna Purna Gomai Urmodi Hiwara Vel Koyna Wardha Kundalika Manjra Mor Mutha Panzara Patalganga Pelhar Penganga Rangavali Sina Surya Tapi Ulhas Vaitarna Venna Waghur Wainganga Wena
Note: BOD less than 3mg/l are considered as non polluted
Observations:
The overall increase in water quality is recorded as:
Only 1 (Mithi) is noted to be in Priority 1 category in the year 2016-17.
No river is recorded in Priority 2.
Priority 3 records decrease in number of rivers from 6 rivers (2015-16) to 4 rivers.
As for priority 4 the number of stretches have decrease from 18 (2015-16) to 11 in the year 2016-17.
The number of rivers in priority 5 have increase from 10 river to 28 rivers.
Total 5 rivers were observed to be non polluted The decrease in number of polluted stretches categorised under from Priority 3 and 4, and increase in number of polluted stretches in Priority 5 indicates improvement in river water quality.

191
Annex V – Status of Sewage Treatment in Municipal Corporations of
Maharashtra
Name of Municipal
Corporation Class District Sewage
Generation
MLD
Sewage
Treatment
MLD
Percentage
Treatment
(%)
Disposal Type of Treatment
1 Ahmednagar Corporation
B Ahmednagar Seena 60 0 0 Open Nalla -
2 Akola Corporation D Akola Morna - Tapi 48 0 0 Morna No any treatment facility i.e. STP not provided.
3 Amravati Corporation D Amaravati Pedhi - Tapi 92 30.5 33.15 Amba Nalla to Pedhi
ASP
4 Aurangabad Corporation
D Aurangabad Godavari 107 9 8.41 Sukhna ASP, SBR
Dr. Salim ali Lake
Kham
5 Bhiwandi-Nizampur Corporation
D Thane Creek 84 17 20.24 Kamavari Creek
6 Chandrapur Corporation
D Chandrapur Irai - Wardha
30 30 100 Erai
7 Dhule Corporation D Dhule Panjara 48 0 0 Panzara -
8 Jalgaon Corporation D Jalgaon Tapi 48 0 0 Nalla to Girna -
9 Kalyan-Dombivli Corporation
D Thane Creek 200 30 15 Ulhas creek Primary Clarifier
10 Kolhapur Corporation D Kolhapur Panchganga 96 43.5 45.31 Panchaganga Primary, Trickling Filter, SBR

192
Name of Municipal
Corporation Class District Sewage
Generation
MLD
Sewage
Treatment
MLD
Percentage
Treatment
(%)
Disposal Type of Treatment
11 Latur Corporation D Latur Manjara 24 0 0 Local Nalla to Manjara
-
12 Malegaon Corporation C Nashik Mousam & Girana
28 0 0 Mausam Local to Girna
-
13 Mira-Bhayander Corporation
C Thane Creek 93 3.5 3.76 Creek Primary,
14 Municipal Corporation of Grater Mumbai
A Mumbai Creek 2671 2028 75.93 Marine outfall Partly Primary Treatment (Bar Screen, Grit Chamber/sedimentation). And Partly Primary Treatment followed by Aerated Lagoons
Malad Creek
Thane Creek
Gorai Creek
15 Nagpur Corporation B Nagpur Nag 345 85 24.64 Nag Full fledged STP based on ASP with bio gas generation
16 Nanded-Waghala Corporation
D Nanded Godavari 48 38 80 Local Nalla to Godavari
1) Bondar STP-Anaerobic Lagoons, Facultative Tank. 2) Elichpur STP- ASP
17
Nashik Corporation A Nashik
Godavari
280 210 75 Godavari UASB Reactor & ASP
Darna
18 Navi Mumbai Corporation
C Thane 280 230 82.14 Creek SBR

193
Name of Municipal
Corporation Class District Sewage
Generation
MLD
Sewage
Treatment
MLD
Percentage
Treatment
(%)
Disposal Type of Treatment
19 Parbhani Corporation D Parbhani Purna - Godavari
10 0 0 Godavari -
20 Pimpri-Chinchwad Corporation
C Pune Mula, Pavana and Indrayani
291 230 79.03 Pawana SBR
21 Pune Corporation B Pune
Ram 744 567 76.21 Mutha ASP, SBR
Mula Mula
Mutha Ram
22 Sangali-Miraj Kupwad Corporation
D Sangali Krishna 52.5 27 68.57 Krishna Primary + Oxidation Pond
23 Solapur Corporation D Solapur Seena 88 0 0 Nalla to Seena -
24 Thane Corporation C Thane Creek 350 120 34.29 Thane creek SBR
25 Ulhasnagar Corporation
D Thane Creek 90 28 31.11 Waldhuni Primary Clarifier
26 Vasai Virar Region Corporation
D Thane Creek 175.4 0 0 - -
Total Total 6382.9 3726.5 58.38

194
Status of Sewage Treatment in A class Municipal Council in Maharashtra
Sr No. A Class Municipal
Council
Effluent
Generated
Effluent
treated
(MLD)
Treatment (%) Disposal
1 Achalpur 8.5 0 0 Local nalla to chandrabhaga
2 Bhusaval 11.4 0 0 Nalla to Tapi
3 Wardha 18 0 0 Dham
4 Gondia 18.28 0 0 Weinganga
5 Ichalkaranji 32 14 37.35% Panchganga
6 Ambernath 30 28 93.33% Local nalla to Waldhuni
7 Barshi 15 0 0 Lendi nalla
Total 133.18 42 1.3068
Status of Sewage Treatment in B – Class Council in Maharashtra
Sr No. B-Class Municipal Council
Effluent generated (MLD)
Effluent treated (MLD)
Treatment (%) Disposal
1 Anjangaon 2.28 0 0.00% Local nalla to Sahanura
2 Warud 2.4 0 0.00% Local nalla to Wardha
3 Washim 4 0 0.00% Local nalla to Katepurna
4 Karanja 4 0 0.00% Local nalla to Wardha

195
Status of Sewage Treatment in B – Class Council in Maharashtra
5 Akot 0.8 0 0.00% local nalla to Purna
6 Buldhana 0.62 0 0.00% Local nalla to Penganga
7 Khamgoan 0.886 0 0.00% local nalla to Purna
8 Shegoan 4 2 50.00% Local nalla to Mann
9 Malkapur 0.5 0 0.00% Local nalla to Nalganga
10 Chikhali 0.485 0 0.00% Local nalla to Penganga
11 Sangamner 3.8 0 0.00% Pavara
12 Kopargaan 7 0 0.00% Darna and Nandur Madhmeshwar Dam
13 Shrirampur 2.5 0 0.00% Bhandadara Dam
14 Pochara 32 0 0.00% Girna
15 Amalner 3.15 0 0.00% Bori
16 Chalisgoan 7.21 0 0.00% Girna
17 Sawadha 0.57 0 0.00% Tubewell
18 Chopada 3.2 0 0.00% Tapi
19 Shirpur 32 0 0.00% Karanvada Tapi and dam
20 Daudai 18 0 0.00% Tapi and Amravati
21 Nandurbar 45 0 0.00% Chivan and Jharali dam
22 Kamthi 8 0 0.00% Kanhan
23 Hinganghat 1.53 0 0.00% Wena r
24 Umred 4.5 0 0.00% Aam
25 Bhandara 13.52 0 0.00% Weinganga
26 Tumsar 6.35 0 0.00% Weinganga
27 Chiplun 7 0 0.00% Vashishthi
28 Vita 4.87 0 0.00% Krishna
29 Islampur 9 0 0.00% Krishna
30 Khudgoan Badlapur 18 0 0.00% Ulhas
31 Gangakhed 2 0 0.00% Godavari

196
Status of Sewage Treatment in B – Class Council in Maharashtra
32 Hingoli 4.2 0 0.00% Kayadhu
33 Wasmat 2.5 0 0.00% Ughadi
34 Degalura 15 0 0.00% Sharaj nalla
35 Udgir 5.4 0 0.00% Local nalla to lendhi
36 Osmanabad 5.3 0 0.00% Local nalla to Bhogawati
37 Dhaud 4.2 0 0.00% Bhima
38 Baramati 4.2 0 0.00% Kanha
39 Pandharpur 12 15 100.00% Irrigation
Total 301.971 17 1.5
Status of Sewage Treatment in C class Municipal Council Nagar in Maharashtra
Sr No. C-Class Municipal
Council
Effluent
generated
(MLD)
Effluent
treated
(MLD)
Treatment (%) Disposal
1 Chandur Railway 1.8 0 0.00% Local Nalla to Wardha
2 Chilakhadara 0.4 0 0.00% Local Nalla to Chandrabhaga
3 Daryapur 2 0 0.00% Local Nalla to Chandrabhaga
4 Chandur Bazaar 1.2 0 0.00% Local Nalla to Purna
5 Dhamangaon Railway 1.8 0 0.00% Local Nalla to Wardha
6 Sedurajana Ghat 1.6 0 0.00% Local Nalla to Wardha
7 Morshi 3.2 0 0.00% Local Nalla to Wardha
8 Mangarularpir 2.4 0 0.00% Local Nalla to Wardha
9 Risod 1.6 0 0.00% Local Nalla to Penganga
10 Murtizapur 0.388 0 0.00% Local Nalla to Purna
11 Patur 0.22 0 0.00% Local Nalla to Bordi

197
Status of Sewage Treatment in C class Municipal Council Nagar in Maharashtra
12 Balapur 0.39 0 0.00% Local Nalla to Mann
13 Telhara 0.18 0 0.00% Local Nalla to Purna
14 Jalgoan Jamod 0.26 0 0.00% Local Nalla to Purna
15 Mehekar 0.377 0 0.00% Local Nalla to Penganga
16 Deulgoan raja 1.4 0 0.00% Local Nalla to Amana
17 Sindkhed Raja 0.13 0 0.00% Local Nalla to Khadakpurna
18 Nandura 1.5 0 0.00% Local Nalla to Gyan ganga
19 Lonar 0.2 0 0.00% Lendhi/Ambar Lake to Lonar dam
20 Alibaug 4.4 0 0.00% Sea
21 Khopoli 5.6 0 0.00% Patalganga
22 Pen 4.8 0 0.00% Bhogeshwari
23 Murud -Janjhira 1.3 0 0.00% Sea
24 Satana 1.47 0 0.00% Local nalla to Girna
25 Nandagoan 1.2 0 0.00% Local nalla to Girna
26 Sinnar 4.3 0 0.00% Local nalla to Darna
27 Bhagur 0.87 0 0.00% Local nalla to Darna
28 Tribakeshwar 1 0.7 70.00% Local nalla to Godavari
29 Yeola 2.8 0 0.00% Local nalla to Palkhed dam
30 Manmad 6 0 0.00% Local nalla to Waghad dam
31 Igatpuri 4.2 0 0.00% Local nalla to Darna
32 Shrigonda 1.9 0 0.00% Local nalla to Ghod canal
33 Pathardi 2 0 0.00% Local nalla to Jayakwadi dam
34 Rahata 6 0 0.00% Local nalla to Darna dam
35 Rahuri 2.7 0 0.00% Mula dam
36 Devlali pravaha 3 0 0.00% Mula dam
37 Erandol 9.1 0 0.00% Local Nalla to Anjani and Girna
38 Parola 3.49 0 0.00% Local Nalla to Bori

198
Status of Sewage Treatment in C class Municipal Council Nagar in Maharashtra
39 Raver 11 0 0.00% Local Nalla toTapi
40 Faizpur 0.7 0 0.00% Local Nalla to Suki
41 Yawal 0.28 0 0.00% Local Nalla to Borewell
42 Dharangaon 8.4 0 0.00% Local Nalla to Anjani /Tapi
43 Jamner 11 0 0.00% Local Nalla to Kang
44 Bhadgaon 9.5 0 0.00% Local Nalla to Girna
45 Navapur 10.02 0 0.00% Local Nalla to Rangawali
46 Shahada 12 0 0.00% Local Nalla to Gomati
47 Taloda 12 0 0.00% Local Nalla to Vihiri
48 Arvi 0.41 0 0.00% Bakadi
49 Pulgoan 0.36 0 0.00% Wardha
50 Deoli 0.15 0 0.00% Yashoda
51 Sindhi 0.15 0 0.00% Wena
52 Wadi 1 0 0.00% Nag
53 Tiroda 3.4 0 0.00% Weinganga
54 Paoni 3.41 0 0.00% Weinganga
55 Kurundwad 0.8 0 0.00% Panchganga
56 Kagal 2.4 0 0.00% Irrigation
57 Gadhinglaj 2.4 0 0.00% Irrigation
58 Murgud 0.64 0 0.00% Irrigation
59 Malkapur 0.2 0 0.00% Irrigation
60 Panhala 0.45 0 0.00% Irrigation
61 Wadgoan 0.9 0 0.00% Irrigation
62 Jaisinghpur 4.64 0 0.00% Irrigation
63 Tasgoan 2.63 0 0.00% Irrigation
64 Ashta 2.1 0 0.00% Krishna
65 Jaat 1.5 0 0.00% Irrigation
66 Purna 1.45 0 0.00% Local Nalla to Thuna

199
Status of Sewage Treatment in C class Municipal Council Nagar in Maharashtra
67 Selu 2.1 0 0.00% Local Nalla to Dudhana
68 Jintur 0.537 0 0.00% Local Nalla to Ullti
69 Pathri 2.2 0 0.00% Local Nalla to Godavari
70 Manvat 0.66 0 0.00% Local Nalla to Laghu lake
71 Sonpeth 0.3 0 0.00% Local Nalla to Weinganga
72 Kalamnuri 1.8 0 0.00% Local Nalla to Weinganga
73 Ausa 3.6 0 0.00%
74 Ahmedpur 1.8 0 0.00% Local Nalla to Manyara
75 Nilanga 1.7 0 0.00%
76 Kalamb 1.55 0 0.00% Local Nalla to Manjara
77 Murum 1.25 0 0.00% Local Nalla to Benitura
78 Naldurg 1.2 0 0.00% Local Nalla to Bori
79 Tuljapur 1.9 0 0.00% Local Nalla to Bori
80 Paranda 1 0 0.00% Local Nalla to Sinna
81 Bhum 1.3 0 0.00% Local Nalla to Banganga
82 Umerga 2.4 0 0.00% Local Nalla to Benitura
83 Paithan 2.4 1.7 0.00% Local Nalla to Godavari
84 Kannad 2.4 1.7 0.00% Local Nalla to Shivana
85 Sillod 3 2.2 0.00% Local Nalla to Dudhana
86 Gangapur 1.5 1.1 0.00% Local Nalla to Godavari
87 Vaijapur 2.6 1.85 0.00% Local Nalla to Godavari
88 Khuldabad 0.9 0.65 0.00% Local Nalla to Godavari
89 Indapur 2.4 0 0.00% Bhima
90 Jejuri 2.4 0 0.00% Kahna
91 Saswad 4 0 0.00% Kahna
92 Bhor 0.9 0 0.00% Neera
93 Wai 4.8 0 0.00%
94 Karmala 1.4 0 0.00% Irrigation

200
Status of Sewage Treatment in C class Municipal Council Nagar in Maharashtra
95 Akkalkot 0.4 0 0.00% Irrigation
96 Mangalwedha 1.22 0 0.00% Irrigation
97 Kurduwadi 1.45 0 0.00% Local Nalla
98 Dudhani 0.56 0 0.00% Irrigation
99 Maidargi 0.77 0 0.00% Irrigation
100 Junnar 2.2 0 0.00% Mina
Total 251.662 9.9 0.7
Status of Sewage Treatment in A class Nagar Panchayat in Maharashtra
Sr No. A Class Municipal
Council
Effluent
Generated
(MLD)
Effluent
treated
(MLD)
Treatment (%) Disposal
1 Warora 4.5 0 0 Local nalla to Wardha
2 Yavatmal 8.69 0 0 Local nalla to Jamwadi lake
3 Jalna 18.5 0 0 Local Nalla
4 Beed 11 0 0 Local Nalla
5 Satara 12.8 0 0
Total 55.49 0 0
Staus of Sewage Treatment in B class Nagar Panchayat in Maharashtra
Sr No. B class Nagar
Panchayat
Effluent
generated
(MLD)
Effluent
treated
(MLD)
Treatment (%) Disposal
1 Dahanu 4 0 0.00% Nalla
2 Palghar 2.4 0 0.00% Nalla
3 Ratnagiri ८ .८ 0 0.00% Sea
4 Ballarpur 8.4 0 0.00% Local nalla to Wardha
5 Bhadrawati 2.1 0 0.00% Local nalla to Wardha

201
Staus of Sewage Treatment in B class Nagar Panchayat in Maharashtra
6 Pusad 4.02 0 0.00% Local nalla to Pus
7 Wani 4.11 0 0.00% Local nalla to Nirguda
8 Gircholi 2.8 0 0.00% Local nalla to Weinganga
9 Ambajogai 5 0 0.00% Local Nalla
10 Karad 10.5 7.5 40.00% Irrigation
11 Phaltan 5 0 0.00% Girna
12 Talegoan 8.5 0 0.00% Indrayani
Total 65.63 7.5 0.4
Status of Sewage Treatment in C- Class Nagar Panchayat in Maharashtra
Sr No. C- Class Nagar Panchayat
Effluent generated (MLD)
Effluent treated (MLD)
Treatment (%) Disposal
1 Matharen 1.1 0 0.00% Matheran valley
2 Karjat 4.8 0 0.00% Ulhas
3 Roha nagar 2.8 0 0.00% Kundalika
4 Shrivardhan 1.09 0 0.00% Sea
5 Panvel 18 0 0.00% Panvel creek
6 Jawhar 1.5 0 0.00% Creek
7 Katol 5.6 0 0.00% Local Nalla
8 Khapa 0.61 0 0.00% Local Nalla
9 Narkhed 1.4 0 0.00% Kolar
10 Ramtek 0.835 0 0.00% Local Nalla
11 Kalmeshwar 2.2 0 0.00% Local Nalla
12 Saoner 4 0 0.00% Kanhan

202
Status of Sewage Treatment in C- Class Nagar Panchayat in Maharashtra
13 Mohapa 0.52 0 0.00% Local Nalla
14 Mowad 0.56 0 0.00% Kolar
15 Khed 2.5 0 0.00% Jagbudi
16 Malvan 0.5 0 0.00% Sea
17 Sawantwadi 2.5 0 0.00% Palankande lake
18 Rajapur 2.0 0 0.00% Arjuna
19 Rajura 2.1 0 0.00% Local Nalla to Wardha
20 Mul 1.4 0 0.00% Local Nalla to Mul
21 Bramhapuri 2.8 0 0.00% Local Nalla to Weinganga
22 Dwarka 1.82 0 0.00% Local Nalla to Kupati
23 Digras 2.02 0 0.00% Local Nalla to Penganga
24 Pandharkavda 1.99 0 0.00% Local Nalla to Khoni
25 Ghatanji 1.16 0 0.00% Local Nalla to Waghali
26 Ner Nawabpur 1.5 0 0.00% Local Nalla to Weinganga
27 Loha 0.5 0 0.00% Nalla
28 Kandhar 0.5 0 0.00% Nalla
29 Mudkhed 1.6 0 0.00% Nalla
30 Dharmabad 2.5 0 0.00% Nalla

203
Status of Sewage Treatment in C- Class Nagar Panchayat in Maharashtra
31 Bhokar 20 0 0.00% Nalla
32 Hadgoan 0.35 0 0.00% Nalla
33 Mukhed 12 0 0.00% Nalla
34 Kinwat 0.3 0 0.00% Nalla
35 Kundalwadi 0.5 0 0.00% Nalla
36 Biloli 1 0 0.00% Nalla
37 Ambad 2.5 0 0.00% Local Nalla
38 Bhokardan 0.7 0 0.00% Local Nalla
39 Partur 2.3 0 0.00% Local Nalla
40 Dharur 1.4 0 0.00% Local Nalla
41 Georai 2.2 0 0.00% Local Nalla
42 Majalgoan 2.8 0 0.00% Local Nalla
43 Mahabaleshwar 6 2.5 90.00% Irrigation & Hotel gardening
44 Panchgani 0.975 1.3 90.00% Irrigation & Hotel gardening
45 Rahimatpur 0.8 0 0.00%
46 Mhaswad 2.1 0 0.00%
47 Sangola 1.79 0 0.00% Local Nalla

204
Status of Sewage Treatment in C- Class Nagar Panchayat in Maharashtra
48 Lonavala 18 3.69 20.50% Indrayani
49 Alandi 2.5 0 0.00% Indrayani
50 Shirur 3.5 3.5 100.00% Ghodnadi
51 Uran 2.8 0 0.00% Uran creek
52 Vengurla 2.5 0 0.00% Sea
53 Umar khed 2.04 0 0.00% Local Nalla to Penganga
54 Wadsa-Desaiganj 8.4 0 0.00% Local Nalla to Weinganga
55 Umri 0.3 0 0.00% Nalla
56 Mahad 3.3 0 0.00% Savitri
Total 173.46 10.99 3.005

205
Annex VI – Data Sets of Water Quality
Monitored in 2016-17

206
Riverwise trend of WQI (2016-17)
0
10
20
30
40
50
60
70
80
90
100
07-08 08-09 09-10 10-11 11-12 12-13 13-14 14-15 15-16 16-17 07-08 08-09 09-10 10-11 11-12 12-13 13-14 14-15 15-16 16-17
2651 2652
Amba river Amravati river
Riverwise Trend (2007-16) - Amba ,Amravati River
Max Average Min

207
0
10
20
30
40
50
60
70
80
90
1000
7-0
8
08-0
9
09-1
0
10-1
1
11-1
2
12-1
3
13-1
4
14-1
5
15-1
6
16-1
7
07-0
8
08-0
9
10-1
1
11-1
2
12-1
3
13-1
4
14-1
5
15-1
6
16-1
7
07-0
8
08-0
9
10-1
1
11-1
2
12-1
3
13-1
4
14-1
5
15-1
6
16-1
7
1461 2653 2654
Bhatsa river
Riverwise Trend (2007-16) - Bhatsa River
Max Average Min

208
0
10
20
30
40
50
60
70
80
90
100
07-0
8
08-0
9
09-1
0
10-1
1
11-1
2
12-1
3
13-1
4
14-1
5
15-1
6
16-1
7
07-0
8
08-0
9
09-1
0
10-1
1
11-1
2
12-1
3
13-1
4
14-1
5
15-1
6
16-1
7
07-0
8
08-0
9
09-1
0
10-1
1
11-1
2
12-1
3
13-1
4
14-1
5
15-1
6
16-1
7
07-0
8
08-0
9
09-1
0
10-1
1
11-1
2
12-1
3
13-1
4
14-1
5
15-1
6
16-1
7
28 1188 1189 1190
Bhima river
Riverwise Trend (2007-16) - Bhima River ( 1 of 2)
Max Average Min

209
0
10
20
30
40
50
60
70
80
900
7-0
8
08-0
9
09-1
0
10-1
1
11-1
2
12-1
3
13-1
4
14-1
5
15-1
6
16-1
7
07-0
8
08-0
9
09-1
0
10-1
1
11-1
2
12-1
3
13-1
4
14-1
5
15-1
6
16-1
7
07-0
8
08-0
9
09-1
0
10-1
1
11-1
2
12-1
3
13-1
4
14-1
5
15-1
6
16-1
7
07-0
8
08-0
9
09-1
0
10-1
1
11-1
2
12-1
3
13-1
4
14-1
5
15-1
6
16-1
7
1191 1192 2655 2656
Bhima river
Riverwise Trend (2007-16) - Bhima River ( 2 of 2)
Max Average Min

210
0
10
20
30
40
50
60
70
80
90
100
07-0
8
08-0
9
09-1
0
10-1
1
11-1
2
12-1
3
13-1
4
14-1
5
15-1
6
16-1
7
07-0
8
08-0
9
09-1
0
10-1
1
11-1
2
12-1
3
13-1
4
14-1
5
15-1
6
16-1
7
07-0
8
08-0
9
09-1
0
10-1
1
11-1
2
12-1
3
13-1
4
14-1
5
15-1
6
16-1
7
07-0
8
08-0
9
09-1
0
10-1
1
11-1
2
12-1
3
13-1
4
14-1
5
15-1
6
16-1
7
07-0
8
08-0
9
09-1
0
10-1
1
11-1
2
12-1
3
13-1
4
14-1
5
15-1
6
16-1
7
2657 2658 2659 1911 1912
Bindusara river Bori river Burai river Chandrabhaga river
Riverwise Trend (2007-16) - Bindusara, Bori, Burai & Chandrabhaga River
Max Average Min
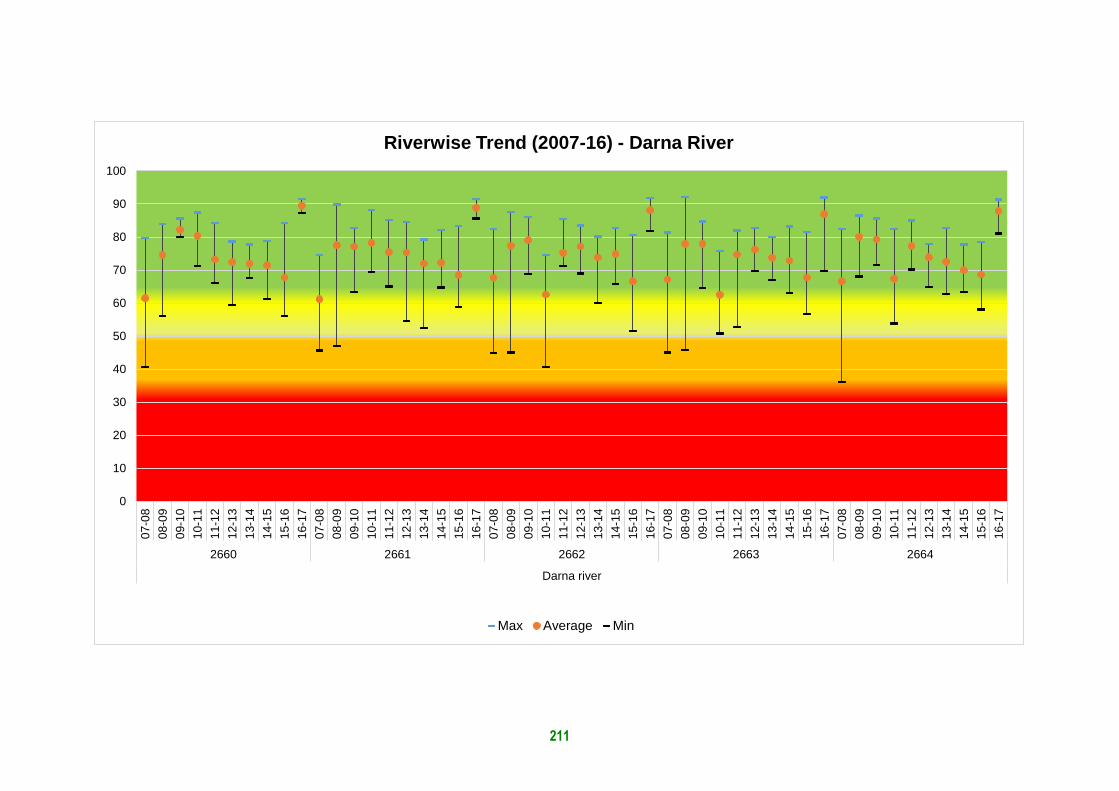
211
0
10
20
30
40
50
60
70
80
90
100
07-0
8
08-0
9
09-1
0
10-1
1
11-1
2
12-1
3
13-1
4
14-1
5
15-1
6
16-1
7
07-0
8
08-0
9
09-1
0
10-1
1
11-1
2
12-1
3
13-1
4
14-1
5
15-1
6
16-1
7
07-0
8
08-0
9
09-1
0
10-1
1
11-1
2
12-1
3
13-1
4
14-1
5
15-1
6
16-1
7
07-0
8
08-0
9
09-1
0
10-1
1
11-1
2
12-1
3
13-1
4
14-1
5
15-1
6
16-1
7
07-0
8
08-0
9
09-1
0
10-1
1
11-1
2
12-1
3
13-1
4
14-1
5
15-1
6
16-1
7
2660 2661 2662 2663 2664
Darna river
Riverwise Trend (2007-16) - Darna River
Max Average Min

212
0
10
20
30
40
50
60
70
80
90
100
07-0
8
08-0
9
09-1
0
10-1
1
11-1
2
12-1
3
13-1
4
14-1
5
15-1
6
16-1
7
07-0
8
08-0
9
09-1
0
10-1
1
11-1
2
12-1
3
13-1
4
14-1
5
15-1
6
16-1
7
07-0
8
08-0
9
09-1
0
10-1
1
11-1
2
12-1
3
13-1
4
14-1
5
15-1
6
16-1
7
07-0
8
08-0
9
09-1
0
10-1
1
11-1
2
12-1
3
13-1
4
14-1
5
15-1
6
16-1
7
2665 1252 1253 2666
Ghod river Girna river Gomai river
Riverwise Trend (2007-17) - Ghod, Girna & Gomai River
Max Average Min

213
0
10
20
30
40
50
60
70
80
90
1000
7-0
8
08-0
9
09-1
0
10-1
1
11-1
2
12-1
3
13-1
4
14-1
5
15-1
6
16-1
7
07-0
8
08-0
9
09-1
0
10-1
1
11-1
2
12-1
3
13-1
4
14-1
5
15-1
6
16-1
7
07-0
8
08-0
9
09-1
0
10-1
1
11-1
2
12-1
3
13-1
4
14-1
5
15-1
6
16-1
7
07-0
8
08-0
9
09-1
0
10-1
1
11-1
2
12-1
3
13-1
4
14-1
5
15-1
6
16-1
7
12 1095 1096 1209
Godavari river
Riverwise Trend (2007-16) - Godavari River (1 of 4)
Max Average Min

214
0
10
20
30
40
50
60
70
80
90
1000
7-0
8
08-0
9
09-1
0
10-1
1
11-1
2
12-1
3
13-1
4
14-1
5
15-1
6
16-1
7
07-0
8
08-0
9
09-1
0
10-1
1
11-1
2
12-1
3
13-1
4
14-1
5
15-1
6
16-1
7
07-0
8
08-0
9
09-1
0
10-1
1
11-1
2
12-1
3
13-1
4
14-1
5
15-1
6
16-1
7
09-1
0
10-1
1
11-1
2
12-1
3
13-1
4
14-1
5
15-1
6
16-1
7
1210 1211 1312 2157
Godavari river
Riverwise Trend (2007-16) - Godavari River (2 of 4)
Max Average Min

215
0
10
20
30
40
50
60
70
80
90
1000
7-0
8
08-0
9
09-1
0
10-1
1
11-1
2
12-1
3
13-1
4
14-1
5
15-1
6
16-1
7
07-0
8
08-0
9
09-1
0
10-1
1
11-1
2
12-1
3
13-1
4
14-1
5
15-1
6
16-1
7
07-0
8
08-0
9
09-1
0
10-1
1
11-1
2
12-1
3
13-1
4
14-1
5
15-1
6
16-1
7
07-0
8
08-0
9
09-1
0
10-1
1
11-1
2
12-1
3
13-1
4
14-1
5
15-1
6
16-1
7
07-0
8
08-0
9
09-1
0
10-1
1
11-1
2
12-1
3
13-1
4
14-1
5
15-1
6
16-1
7
2158 2159 2160 2161 2177
Godavari river
Riverwise Trend (2007-16) - Godavari River (3 of 4)
Max Average Min

216
0
10
20
30
40
50
60
70
80
90
100
07-0
8
08-0
9
09-1
0
10-1
1
11-1
2
12-1
3
13-1
4
14-1
5
15-1
6
16-1
7
07-0
8
08-0
9
09-1
0
10-1
1
11-1
2
12-1
3
13-1
4
14-1
5
15-1
6
16-1
7
07-0
8
08-0
9
09-1
0
10-1
1
11-1
2
12-1
3
13-1
4
14-1
5
15-1
6
16-1
7
07-0
8
08-0
9
09-1
0
10-1
1
11-1
2
12-1
3
13-1
4
14-1
5
15-1
6
16-1
7
07-0
8
08-0
9
09-1
0
10-1
1
11-1
2
12-1
3
13-1
4
14-1
5
15-1
6
16-1
7
2179 2180 2181 2182 2183
Godavari river
Riverwise Trend (2007-16) - Godavari River (4 of 4)
Max Average Min

217
0
10
20
30
40
50
60
70
80
90
100
07-0
8
08-0
9
09-1
0
10-1
1
11-1
2
12-1
3
13-1
4
14-1
5
15-1
6
16-1
7
07-0
8
08-0
9
09-1
0
10-1
1
11-1
2
12-1
3
13-1
4
14-1
5
15-1
6
16-1
7
07-0
8
08-0
9
09-1
0
10-1
1
11-1
2
12-1
3
13-1
4
14-1
5
15-1
6
16-1
7
07-0
8
08-0
9
09-1
0
10-1
1
11-1
2
12-1
3
13-1
4
14-1
5
15-1
6
16-1
7
2667 2197 2668 2669
Hiwara river Indrayani river
Riverwise Trend (2007-16) - Hiwara & Indrayani River)
Max Average Min

218
0
10
20
30
40
50
60
70
80
90
100
07-0
8
08-0
9
09-1
0
10-1
1
11-1
2
12-1
3
13-1
4
14-1
5
15-1
6
16-1
7
07-0
8
08-0
9
09-1
0
10-1
1
11-1
2
12-1
3
13-1
4
14-1
5
15-1
6
16-1
7
07-0
8
08-0
9
09-1
0
10-1
1
11-1
2
12-1
3
13-1
4
14-1
5
15-1
6
16-1
7
07-0
8
08-0
9
09-1
0
10-1
1
11-1
2
12-1
3
13-1
4
14-1
5
15-1
6
16-1
7
07-0
8
08-0
9
09-1
0
10-1
1
11-1
2
12-1
3
13-1
4
14-1
5
15-1
6
16-1
7
1092 2670 1909 2170 2171
Kalu river Kan river Kanhan river
Riverwise Trend (2007-16) - Kalu, Kan & Kanhan River)
Max Average Min

219
0
10
20
30
40
50
60
70
80
90
100
10-11 11-12 12-13 13-14 14-15 15-16 16-17 07-08 08-09 10-11 11-12 12-13 13-14 14-15 15-16 16-17
2804 2798
Karambavane creek Kharekuran Murbe creek
Riverwise Trend (2007-16) - Karambavane & Kharekuran Murbe Creek
Max Average Min

220
0
10
20
30
40
50
60
70
80
90
07-08 08-09 09-10 10-11 11-12 12-13 13-14 14-15 15-16 16-17 07-08 08-09 09-10 10-11 11-12 12-13 13-14 14-15 15-16 16-17
1908 2189
Kolar River Koyna river
Riverwise Trend (2007-16) - Kolar & Koyna River
Max Average Min

221
0
10
20
30
40
50
60
70
80
90
1000
7-0
8
08-0
9
09-1
0
10-1
1
11-1
2
12-1
3
13-1
4
14-1
5
15-1
6
16-1
7
07-0
8
08-0
9
09-1
0
10-1
1
11-1
2
12-1
3
13-1
4
14-1
5
15-1
6
16-1
7
07-0
8
08-0
9
09-1
0
10-1
1
11-1
2
12-1
3
13-1
4
14-1
5
15-1
6
16-1
7
07-0
8
08-0
9
09-1
0
10-1
1
11-1
2
12-1
3
13-1
4
14-1
5
15-1
6
16-1
7
07-0
8
08-0
9
09-1
0
10-1
1
11-1
2
12-1
3
13-1
4
14-1
5
15-1
6
16-1
7
36 37 1153 1194 1310
Krishna river
Riverwise Trend (2007-16) - Krishna River (1 of 2)
Max Average Min

222
0
10
20
30
40
50
60
70
80
90
100
07-0
8
08-0
9
09-1
0
10-1
1
11-1
2
12-1
3
13-1
4
14-1
5
15-1
6
16-1
7
07-0
8
08-0
9
09-1
0
10-1
1
11-1
2
12-1
3
13-1
4
14-1
5
15-1
6
16-1
7
07-0
8
08-0
9
09-1
0
10-1
1
11-1
2
12-1
3
13-1
4
14-1
5
15-1
6
16-1
7
07-0
8
08-0
9
09-1
0
10-1
1
11-1
2
12-1
3
13-1
4
14-1
5
15-1
6
16-1
7
1906 2187 2188 2190
Krishna river
Riverwise Trend (2007-16) - Krishna River (2 of 2)
Max Average Min

223
0
10
20
30
40
50
60
70
80
90
1000
7-0
8
08-0
9
09-1
0
10-1
1
11-1
2
12-1
3
13-1
4
14-1
5
15-1
6
16-1
7
07-0
8
08-0
9
09-1
0
10-1
1
11-1
2
12-1
3
13-1
4
14-1
5
15-1
6
16-1
7
07-0
8
08-0
9
09-1
0
10-1
1
11-1
2
12-1
3
13-1
4
14-1
5
15-1
6
16-1
7
07-0
8
08-0
9
09-1
0
10-1
1
11-1
2
12-1
3
13-1
4
14-1
5
15-1
6
16-1
7
2671 1152 2198 2672
Kundalik river
Riverwise Trend (2007-16) - Kundalik River
Max Average Min

224
0
10
20
30
40
50
60
70
80
90
100
07-0
8
09-1
0
10-1
1
11-1
2
12-1
3
13-1
4
14-1
5
15-1
6
16-1
7
08-0
9
09-1
0
10-1
1
11-1
2
12-1
3
13-1
4
14-1
5
15-1
6
16-1
7
07-0
8
08-0
9
09-1
0
10-1
1
11-1
2
12-1
3
13-1
4
14-1
5
15-1
6
16-1
7
07-0
8
08-0
9
10-1
1
11-1
2
12-1
3
13-1
4
14-1
5
15-1
6
16-1
7
2673 2168 2674 2675
Manjra river Mithi river Mor river Morna river
Riverwise Trend (2007-16) - Manjra, Mithi, Mor & Morna River
Max Average Min

225
0
10
20
30
40
50
60
70
80
90
1000
7-0
8
08-0
9
09-1
0
10-1
1
11-1
2
12-1
3
13-1
4
14-1
5
15-1
6
16-1
7
07-0
8
08-0
9
09-1
0
10-1
1
11-1
2
12-1
3
13-1
4
14-1
5
15-1
6
16-1
7
07-0
8
08-0
9
09-1
0
10-1
1
11-1
2
12-1
3
13-1
4
14-1
5
15-1
6
16-1
7
07-0
8
08-0
9
09-1
0
10-1
1
11-1
2
12-1
3
13-1
4
14-1
5
15-1
6
16-1
7
07-0
8
08-0
9
09-1
0
10-1
1
11-1
2
12-1
3
13-1
4
14-1
5
15-1
6
16-1
7
2676 2193 2194 2192 2677
Muchkundi river Mula river Mula-Mutha river
Riverwise Trend (2007-16) - Muchkundi, Mula & Mula-Mutha River
Max Average Min

226
0
10
20
30
40
50
60
70
80
900
7-0
8
08-0
9
09-1
0
10-1
1
11-1
2
12-1
3
13-1
4
14-1
5
15-1
6
16-1
7
07-0
8
08-0
9
09-1
0
10-1
1
11-1
2
12-1
3
13-1
4
14-1
5
15-1
6
16-1
7
09-1
0
10-1
1
11-1
2
12-1
3
13-1
4
14-1
5
15-1
6
16-1
7
07-0
8
08-0
9
09-1
0
10-1
1
11-1
2
12-1
3
13-1
4
14-1
5
15-1
6
16-1
7
2191 2678 2679 2680
Mutha river
Riverwise Trend (2007-16) - Mutha River
Max Average Min
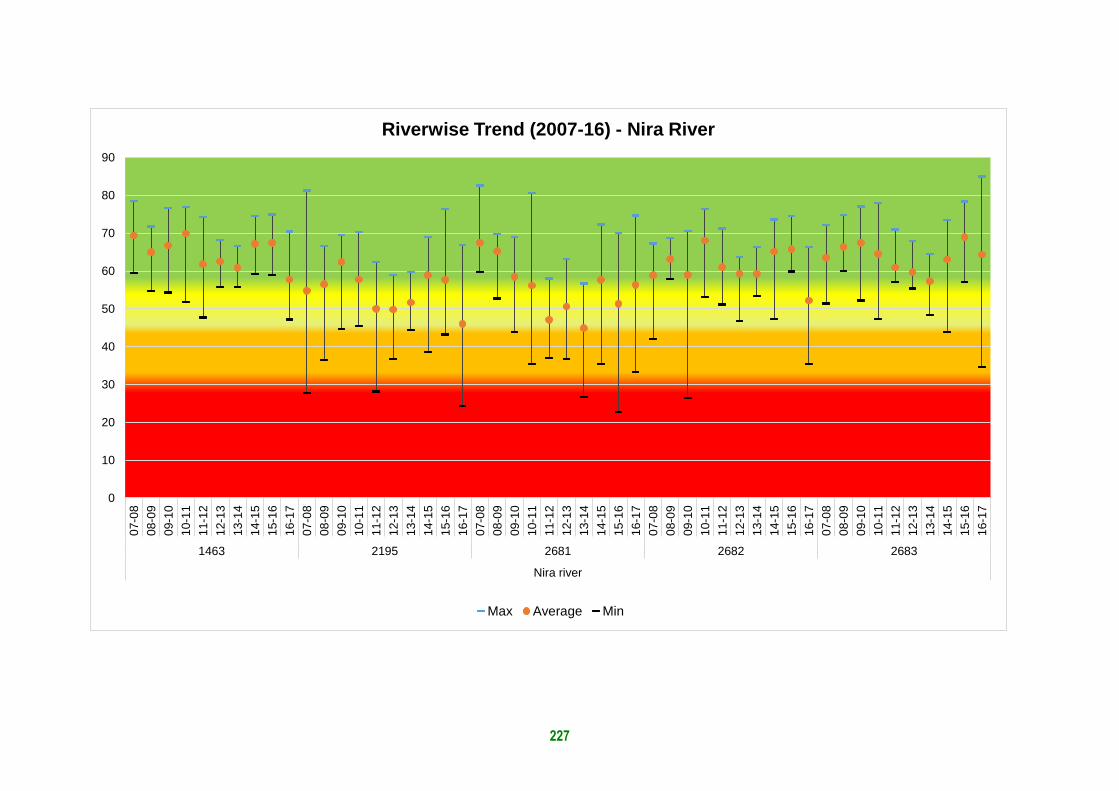
227
0
10
20
30
40
50
60
70
80
90
07-0
8
08-0
9
09-1
0
10-1
1
11-1
2
12-1
3
13-1
4
14-1
5
15-1
6
16-1
7
07-0
8
08-0
9
09-1
0
10-1
1
11-1
2
12-1
3
13-1
4
14-1
5
15-1
6
16-1
7
07-0
8
08-0
9
09-1
0
10-1
1
11-1
2
12-1
3
13-1
4
14-1
5
15-1
6
16-1
7
07-0
8
08-0
9
09-1
0
10-1
1
11-1
2
12-1
3
13-1
4
14-1
5
15-1
6
16-1
7
07-0
8
08-0
9
09-1
0
10-1
1
11-1
2
12-1
3
13-1
4
14-1
5
15-1
6
16-1
7
1463 2195 2681 2682 2683
Nira river
Riverwise Trend (2007-16) - Nira River
Max Average Min
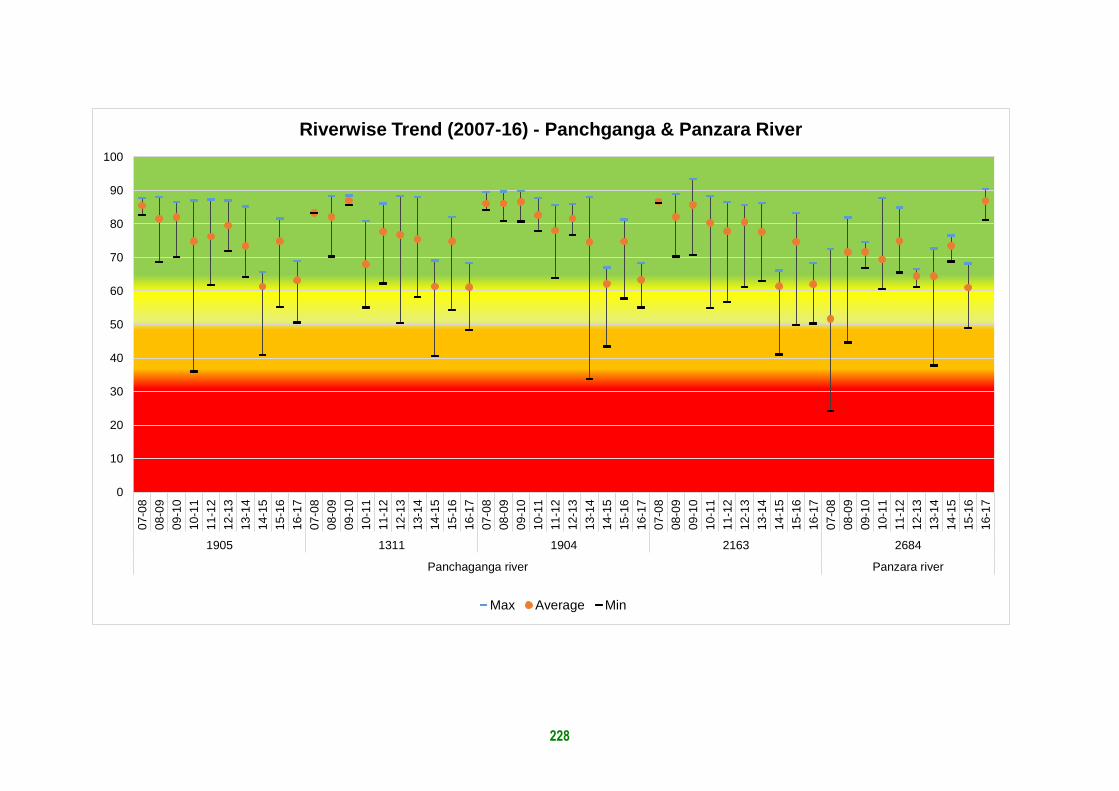
228
0
10
20
30
40
50
60
70
80
90
100
07-0
8
08-0
9
09-1
0
10-1
1
11-1
2
12-1
3
13-1
4
14-1
5
15-1
6
16-1
7
07-0
8
08-0
9
09-1
0
10-1
1
11-1
2
12-1
3
13-1
4
14-1
5
15-1
6
16-1
7
07-0
8
08-0
9
09-1
0
10-1
1
11-1
2
12-1
3
13-1
4
14-1
5
15-1
6
16-1
7
07-0
8
08-0
9
09-1
0
10-1
1
11-1
2
12-1
3
13-1
4
14-1
5
15-1
6
16-1
7
07-0
8
08-0
9
09-1
0
10-1
1
11-1
2
12-1
3
13-1
4
14-1
5
15-1
6
16-1
7
1905 1311 1904 2163 2684
Panchaganga river Panzara river
Riverwise Trend (2007-16) - Panchganga & Panzara River
Max Average Min

229
0
10
20
30
40
50
60
70
80
90
1000
7-0
8
08-0
9
09-1
0
10-1
1
11-1
2
12-1
3
13-1
4
14-1
5
15-1
6
16-1
7
07-0
8
08-0
9
09-1
0
10-1
1
11-1
2
12-1
3
13-1
4
14-1
5
15-1
6
16-1
7
07-0
8
08-0
9
09-1
0
10-1
1
11-1
2
12-1
3
13-1
4
14-1
5
15-1
6
16-1
7
07-0
8
08-0
9
09-1
0
10-1
1
11-1
2
12-1
3
13-1
4
14-1
5
15-1
6
16-1
7
1151 1462 2685 2686
Patalganga river
Riverwise Trend (2007-16) - Patalganga River (1 of 2)
Max Average Min

230
0
10
20
30
40
50
60
70
80
90
100
07-0
8
08-0
9
09-1
0
10-1
1
11-1
2
12-1
3
13-1
4
14-1
5
15-1
6
16-1
7
07-0
8
08-0
9
09-1
0
10-1
1
11-1
2
12-1
3
13-1
4
14-1
5
15-1
6
16-1
7
07-0
8
08-0
9
09-1
0
10-1
1
11-1
2
12-1
3
13-1
4
14-1
5
15-1
6
16-1
7
2687 2688 2689
Patalganga river
Riverwise Trend (2007-16) - Pantalganga River ( 2 of 2)
Max Average Min

231
0
10
20
30
40
50
60
70
80
900
7-0
8
08-0
9
09-1
0
10-1
1
11-1
2
12-1
3
13-1
4
14-1
5
15-1
6
16-1
7
07-0
8
08-0
9
09-1
0
10-1
1
11-1
2
12-1
3
13-1
4
14-1
5
15-1
6
16-1
7
07-0
8
08-0
9
09-1
0
10-1
1
11-1
2
12-1
3
13-1
4
14-1
5
15-1
6
16-1
7
2196 2690 2691
Pawana river
Riverwise Trend (2007-16) - Pawana River (1 of 2)
Max Average Min

232
0
10
20
30
40
50
60
70
80
90
1000
7-0
8
08-0
9
09-1
0
10-1
1
11-1
2
12-1
3
13-1
4
14-1
5
15-1
6
16-1
7
07-0
8
08-0
9
09-1
0
10-1
1
11-1
2
12-1
3
13-1
4
14-1
5
15-1
6
16-1
7
07-0
8
08-0
9
09-1
0
10-1
1
11-1
2
12-1
3
13-1
4
14-1
5
15-1
6
16-1
7
2692 2693 2694
Pawana river
Riverwise Trend (2007-16) - Pawana River (2 of 2)
Max Average Min

233
0
10
20
30
40
50
60
70
80
90
1000
7-0
8
08-0
9
09-1
0
10-1
1
11-1
2
12-1
3
13-1
4
14-1
5
15-1
6
16-1
7
10-1
1
11-1
2
12-1
3
13-1
4
14-1
5
15-1
6
16-1
7
07-0
8
08-0
9
10-1
1
11-1
2
12-1
3
13-1
4
14-1
5
15-1
6
16-1
7
07-0
8
08-0
9
10-1
1
11-1
2
12-1
3
13-1
4
14-1
5
15-1
6
16-1
7
10-1
1
11-1
2
12-1
3
13-1
4
14-1
5
15-1
6
16-1
7
2695 2696 2697 2698 2699
Pedhi river Pelhar River Penganga river
Riverwise Trend (2007-16) - Pedhi, Pelhar & Penganga River
Max Average Min

234
0
10
20
30
40
50
60
70
80
900
7-0
8
08-0
9
09-1
0
10-1
1
11-1
2
12-1
3
13-1
4
14-1
5
15-1
6
16-1
7
07-0
8
08-0
9
09-1
0
10-1
1
11-1
2
12-1
3
13-1
4
14-1
5
15-1
6
16-1
7
08-0
9
10-1
1
11-1
2
12-1
3
13-1
4
14-1
5
15-1
6
16-1
7
1913 2155 2700
Purna River
Riverwise Trend (2007-16) - Purna River
Max Average Min

235
0
10
20
30
40
50
60
70
80
90
100
07-0
8
08-0
9
09-1
0
10-1
1
11-1
2
12-1
3
13-1
4
14-1
5
15-1
6
16-1
7
07-0
8
08-0
9
09-1
0
10-1
1
11-1
2
12-1
3
13-1
4
14-1
5
15-1
6
16-1
7
07-0
8
08-0
9
09-1
0
10-1
1
11-1
2
12-1
3
13-1
4
14-1
5
15-1
6
16-1
7
07-0
8
08-0
9
09-1
0
10-1
1
11-1
2
12-1
3
13-1
4
14-1
5
15-1
6
16-1
7
07-0
8
08-0
9
09-1
0
10-1
1
11-1
2
12-1
3
13-1
4
14-1
5
15-1
6
16-1
7
1907 2705 2706 2707 2708
Rangavali river Sina river Surya river
Riverwise Trend (2007-16) - Rangavali, Sina & Surya River
Max Average Min

236
0
10
20
30
40
50
60
70
80
90
1000
7-0
8
08-0
9
09-1
0
10-1
1
11-1
2
12-1
3
13-1
4
14-1
5
15-1
6
16-1
7
07-0
8
08-0
9
09-1
0
10-1
1
11-1
2
12-1
3
13-1
4
14-1
5
15-1
6
16-1
7
07-0
8
08-0
9
09-1
0
10-1
1
11-1
2
12-1
3
13-1
4
14-1
5
15-1
6
16-1
7
07-0
8
08-0
9
09-1
0
10-1
1
11-1
2
12-1
3
13-1
4
14-1
5
15-1
6
16-1
7
07-0
8
08-0
9
09-1
0
10-1
1
11-1
2
12-1
3
13-1
4
14-1
5
15-1
6
16-1
7
2199 2701 2702 2703 2704
Savitri river
Riverwise Trend (2007-16) - Savitri River
Max Average Min

237
0
10
20
30
40
50
60
70
80
90
1001
0-1
1
11-1
2
12-1
3
13-1
4
14-1
5
15-1
6
16-1
7
07-0
8
08-0
9
09-1
0
10-1
1
11-1
2
12-1
3
13-1
4
14-1
5
15-1
6
16-1
7
07-0
8
08-0
9
09-1
0
10-1
1
11-1
2
12-1
3
13-1
4
14-1
5
15-1
6
16-1
7
07-0
8
08-0
9
09-1
0
10-1
1
11-1
2
12-1
3
13-1
4
14-1
5
15-1
6
16-1
7
2709 1251 1313 1314
Tansa river Tapi river
Riverwise Trend (2007-16) - Tapi &Tansa River
Max Average Min

238
0
10
20
30
40
50
60
70
80
90
100
07-0
8
08-0
9
09-1
0
10-1
1
11-1
2
12-1
3
13-1
4
14-1
5
15-1
6
16-1
7
07-0
8
08-0
9
09-1
0
10-1
1
11-1
2
12-1
3
13-1
4
14-1
5
15-1
6
16-1
7
07-0
8
08-0
9
09-1
0
10-1
1
11-1
2
12-1
3
13-1
4
14-1
5
15-1
6
16-1
7
08-0
9
09-1
0
10-1
1
11-1
2
12-1
3
13-1
4
14-1
5
15-1
6
16-1
7
07-0
8
08-0
9
09-1
0
10-1
1
11-1
2
12-1
3
13-1
4
14-1
5
15-1
6
16-1
7
2710 1093 1094 2162 2711
Titur river Ulhas river Urmodi river
Riverwise Trend (2007-16) - Titur, Ulhas & Umrodi River
Max Average Min

239
0
10
20
30
40
50
60
70
80
90
100
07-0
8
08-0
9
10-1
1
11-1
2
12-1
3
13-1
4
14-1
5
15-1
6
16-1
7
07-0
8
08-0
9
09-1
0
10-1
1
11-1
2
12-1
3
13-1
4
14-1
5
15-1
6
16-1
7
08-0
9
09-1
0
10-1
1
11-1
2
12-1
3
13-1
4
14-1
5
15-1
6
16-1
7
08-0
9
09-1
0
10-1
1
11-1
2
12-1
3
13-1
4
14-1
5
15-1
6
16-1
7
2712 2164 2713 2714
Vaitarna river Vashishti river
Riverwise Trend (2007-16) - Vaitarna & Vashishti River
Max Average Min

240
0
10
20
30
40
50
60
70
80
90
1000
7-0
8
08-0
9
09-1
0
10-1
1
11-1
2
12-1
3
13-1
4
14-1
5
15-1
6
16-1
7
07-0
8
08-0
9
09-1
0
10-1
1
11-1
2
12-1
3
13-1
4
14-1
5
15-1
6
16-1
7
07-0
8
08-0
9
09-1
0
10-1
1
11-1
2
12-1
3
13-1
4
14-1
5
15-1
6
16-1
7
07-0
8
08-0
9
09-1
0
10-1
1
11-1
2
12-1
3
13-1
4
14-1
5
15-1
6
16-1
7
2715 2186 2716 2717
Vel river Venna river
Riverwise Trend (2007-16) - Vel & Venna River
Max Average Min

241
0
10
20
30
40
50
60
70
80
90
07-0
8
08-0
9
09-1
0
10-1
1
11-1
2
12-1
3
13-1
4
14-1
5
15-1
6
16-1
7
07-0
8
08-0
9
09-1
0
10-1
1
11-1
2
12-1
3
13-1
4
14-1
5
15-1
6
16-1
7
07-0
8
08-0
9
09-1
0
10-1
1
11-1
2
12-1
3
13-1
4
14-1
5
15-1
6
16-1
7
07-0
8
08-0
9
09-1
0
10-1
1
11-1
2
12-1
3
13-1
4
14-1
5
15-1
6
16-1
7
07-0
8
08-0
9
09-1
0
10-1
1
11-1
2
12-1
3
13-1
4
14-1
5
15-1
6
16-1
7
07-0
8
08-0
9
09-1
0
10-1
1
11-1
2
12-1
3
13-1
4
14-1
5
15-1
6
16-1
7
11 1910 2172 2173 2175 2176
Wainganga river
Riverwise Trend (2007-16) - Wainganga River
Max Average Min

242
0
10
20
30
40
50
60
70
80
900
7-0
8
08-0
9
09-1
0
10-1
1
11-1
2
12-1
3
13-1
4
14-1
5
15-1
6
16-1
7
07-0
8
08-0
9
09-1
0
10-1
1
11-1
2
12-1
3
13-1
4
14-1
5
15-1
6
16-1
7
07-0
8
08-0
9
09-1
0
10-1
1
11-1
2
12-1
3
13-1
4
14-1
5
15-1
6
16-1
7
07-0
8
08-0
9
09-1
0
10-1
1
11-1
2
12-1
3
13-1
4
14-1
5
15-1
6
16-1
7
1212 1315 2156 2174
Wardha river
Riverwise Trend (2007-16) - Wardha River (1 of 2)
Max Average Min

243
0
10
20
30
40
50
60
70
80
90
07-0808-0910-1111-1212-1313-1414-1515-1616-1707-0808-0909-1010-1111-1212-1313-1414-1515-1616-1707-0808-0910-1111-1212-1313-1414-1515-1616-17
2719 2720 2721
Wardha river
Riverwise Trend (2007-16) - Wardha River (2 of 2)
Max Average Min

244
0
10
20
30
40
50
60
70
80
90
100
07-0
8
08-0
9
09-1
0
10-1
1
11-1
2
12-1
3
13-1
4
14-1
5
15-1
6
16-1
7
07-0
8
08-0
9
09-1
0
10-1
1
11-1
2
12-1
3
13-1
4
14-1
5
15-1
6
16-1
7
07-0
8
08-0
9
09-1
0
10-1
1
11-1
2
12-1
3
13-1
4
14-1
5
16-1
7
2722 2723 2718
Wena river Waghur river
Riverwise Trend (2007-16) - Wena & Waghur River
Max Average Min

245
Station wise Trend in WQI (2007-17)
Surface water Trend of WQI -2016-17
For calculation of CAGR: Refer Pg no.23

246
For calculation of CAGR: Refer Pg no.23

247
For calculation of CAGR: Refer Pg no.23

248
For calculation of CAGR: Refer Pg no.23

249
For calculation of CAGR: Refer Pg no.23

250
For calculation of CAGR: Refer Pg no.23
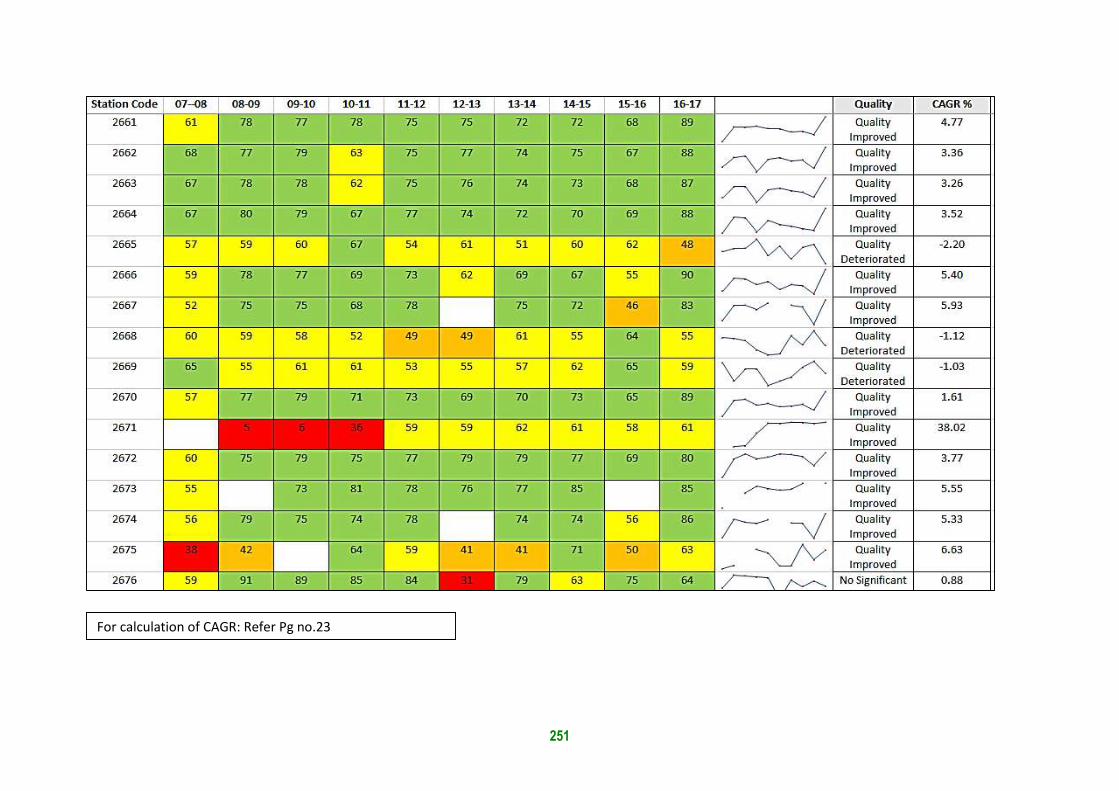
251
For calculation of CAGR: Refer Pg no.23

252
For calculation of CAGR: Refer Pg no.23

253
For calculation of CAGR: Refer Pg no.23

254
For calculation of CAGR: Refer Pg no.23

255
For calculation of CAGR: Refer Pg no.23

256
Saline water Trend of WQI -2016-17
Mumbai District
For calculation of CAGR: Refer Pg no.23

257
Ratnagiri & Raigad District
For calculation of CAGR: Refer Pg no.23

258
Thane District (1 of 2)
For calculation of CAGR: Refer Pg no.23

259
Thane District (2 of 2)
For calculation of CAGR: Refer Pg no.23

Maharashtra Pollution Control Board Kalpataru Point, 2nd, 3rd and 4th floor, Opp. Cine Planet, Sion Circle, Mumbai - 400 022
Telephone : +91 22 24020781 / 24014701 Fax : +91 22 24024068
Website : http://mpcb.gov.in/
The Energy and Resources Institute Western Regional Centre, 318, Raheja Arcade, Sector-11, Belapur CBD, Navi Mumbai – 400 614 Telephone : +91 22 27580021/ 40241615 Fax : +91 22 27580022 Website : www.teriin.org