water quality risk assessment
TRANSCRIPT
rpsgroup.com
WATER QUALITY RISK ASSESSMENT
DPC Maintenance Dredging 2020-2021
Water Quality Risk Assessment
27 March 2019

WATER QUALIY RISK ASSESSMENT
DPC Maintenance Dredging 2020-2021 | Water Quality Risk Assessment | | 27 March 2019
rpsgroup.com Page ii
Document status
Version Purpose of document Authored by Reviewed by Approved by Review date
D01 Water Quality Risk Assessment Various AGB AGB 15/03/2019
F01 Water Quality Risk Assessment Various AGB AGB 27/03/2019
Approval for issue
Alan Barr 27 March 2019
Prepared by: Prepared for:
RPS Dublin Port Company
Daniel Hogan
Senior Scientist - Water Environment and Flood
Risk Management
Eamon McElroy
Port Engineer
Elmwood House
74 Boucher Road, Belfast
Co. Antrim BT12 6RZ
Port Centre
Alexandra Road
Dublin 1, Ireland
T +44 2890 667 914
T +353 1 8876000

WATER QUALIY RISK ASSESSMENT
DPC Maintenance Dredging 2020-2021 | Water Quality Risk Assessment | | 27 March 2019
rpsgroup.com Page iii
Contents
1 INTRODUCTION ......................................................................................................................1
2 WATER QUALITY ...................................................................................................................2
2.1 Assessment Methodology ........................................................................................................2
2.2 Receiving Water Environment ..................................................................................................4
2.2.1 Surface Water Bodies ..............................................................................................................5
2.2.2 Water Framework Directive Water Body Status ........................................................................6
2.2.3 Protected Areas ..................................................................................................................... 10
2.2.4 Marine Strategy Framework Directive Environmental Status ................................................... 15
2.2.5 EPA Water Quality in 2016: An Indicators Report ................................................................... 16
2.2.6 Marine Institute Monitoring ..................................................................................................... 19
2.2.7 Dublin Port Company Monitoring Programme (ABR Project) ................................................... 20
2.2.8 Summary of Existing Water Quality ........................................................................................ 38
2.3 Likelihood of Impacts .............................................................................................................. 39
2.3.1 Potential Impacts.................................................................................................................... 40
2.4 Description of Likely Significant Impacts ................................................................................. 40
2.4.1 Maintenance Dredging & Disposal Operations ........................................................................ 40
2.5 Mitigation Measures ............................................................................................................... 41
2.5.1 Suspended Sediment and Sedimentation ............................................................................... 41
2.6 Residual Impacts.................................................................................................................... 42
2.7 Potential Cumulative Impacts ................................................................................................. 42
2.7.1 Dublin Port Company ABR Project ......................................................................................... 42
2.7.2 Irish Water – Ringsend Wastewater Treatment Plan (WwTP) Upgrade Project ....................... 43
2.7.3 Howth Yacht Club Project ....................................................................................................... 44
2.8 Conclusions ........................................................................................................................... 45
Tables
Table 2-1 Criteria for Rating Receptor Sensitivity (NRA, 2008) .................................................................2
Table 2-2 Criteria for Rating the Magnitude of Impact (NRA, 2008) ...........................................................3
Table 2-3 Criteria for Rating the Significance of Environmental Impacts (NRA 2008) ................................3
Table 2-4 Defining Impact Significance (NRA, 2008) ................................................................................4
Table 2-5 WFD Status (2007-2015) ..........................................................................................................8
Table 2-6 WFD Status Breakdown (2010-2015) .......................................................................................9
Table 2-7 Annual Assessment Criteria for Bathing Waters ...................................................................... 10
Table 2-8 Status of Individual Samples during the 2018 Monitoring Season............................................ 12
Table 2-9 Parameters and criteria used in the Trophic Status Assessment Scheme (TSAS) for Irish
Marine Water Bodies (EPC, 2010) ......................................................................................................... 17
Table 2-10 Summary Statistics for Dissolved Oxygen, Salinity, Temperature and Turbidity at Eastlink
Monitoring Station .................................................................................................................................. 23
Table 2-11 Summary Statistics for Dissolved Oxygen, Salinity, Temperature and Turbidity at Poolbeg
Monitoring Station .................................................................................................................................. 23
Table 2-12 Summary Statistics for Dissolved Oxygen, Salinity, Temperature and Turbidity at
Northbank Monitoring Station ................................................................................................................. 23

WATER QUALIY RISK ASSESSMENT
DPC Maintenance Dredging 2020-2021 | Water Quality Risk Assessment | | 27 March 2019
rpsgroup.com Page iv
Table 2-13 Summary Statistics for Dissolved Oxygen, Salinity, Temperature and Turbidity, at Tolka
Monitoring Station .................................................................................................................................. 24
Table 2-14 Summary Statistics for CoastBuoy 1 between Sept 2017 to Dec 2018 .................................. 37
Table 2-15 Summary Statistics for CoastBuoy 2 between Sept 2017 to Dec 2018 .................................. 37
Table 2-16 Summary Statistics for CoastBuoy 3 between Sept 2017 to Dec 2018 .................................. 37
Table 2-17 Summary Statistics for CoastBuoy 4 between Sept 2017 to Dec 2018 .................................. 37
Table 2-18: Final Effluent Discharge – Load Reduction Summary ........................................................... 44
Figures
Figure 2-1 Site Location in the Context of the Wider Surface Water Environment .....................................5
Figure 2-2 Elements of the Water Framework Directive Status .................................................................7
Figure 2-3 Water Framework Directive Water Body Status – Reported 2017 ............................................8
Figure 2-4 Bathing Water Quality in the Dublin Area 2017 (EPA, 2018) .................................................. 11
Figure 2-5 Nutrient Sensitive Areas ........................................................................................................ 13
Figure 2-6 Natura 2000 Designated Sites (Special Protection Areas) ...................................................... 14
Figure 2-7 Natura 2000 Designated Sites (Special Areas of Conservation) ............................................. 15
Figure 2-8 Marine Institute Monitoring Locations relative to the Loading Area and the Licenced
Disposal Site .......................................................................................................................................... 19
Figure 2-9 Marine Institute Summary Water Quality Data 2015 – 2018 ................................................... 20
Figure 2-10 Water Quality Monitoring Stations in the Dublin Port Area .................................................... 21
Figure 2-11 Relationship Established between Turbidity and Total Suspended Solids (Inner Liffey
Channel) ................................................................................................................................................ 22
Figure 2-12 Plots of 24-Hour Averages for Water Quality measurements made at Eastlink Monitoring
Station (2017-2018) -Dredging Periods shown by Pink Bars. .................................................................. 25
Figure 2-13 Plots of 24-Hour Averages for Water Quality measurements made at Poolbeg Monitoring
Station (2017-2018) -Dredging Periods shown by Pink Bars. .................................................................. 26
Figure 2-14 Plots of 24-Hour Averages for Water Quality measurements made at Northbank
Monitoring Station (2017-2018) -Dredging Periods shown by Pink Bars. ................................................. 27
Figure 2-15 Plots of 24-Hour Averages for Water Quality measurements made at Tolka Monitoring
Station (2017-2018) -Dredging Periods shown by Pink Bars. .................................................................. 28
Figure 2-16 Mean daily turbidity September to December 2017 (periods of dredging are indicated by
horizontal bars – green for maintenance dredge and red for dredge campaigns (onset of storm
Ophelia is shown by the red arrows)) ..................................................................................................... 29
Figure 2-17 Coasteye Monitoring Buoys On Board the ILV Granuaile for Deployment in Dublin Bay ....... 30
Figure 2-18 Locations of the Coasteye Monitoring Buoys at the Disposal Site ........................................ 31
Figure 2-19 TSS versus Turbidity for suspensions of river bed silt sediment (red) and approach
channel fine sand sediment (blue). Equations & r2 values in corresponding colours for each series ........ 32
Figure 2-20 Plots of 24-Hour Averages for Turbidity measurements made at Coasteye Buoy 1
Monitoring Station (2017-2018) -Dredging Periods shown by Pink Bars. ................................................. 33
Figure 2-21 Plots of 24-Hour Averages for Turbidity measurements made at Coasteye Buoy 2
Monitoring Station (2017-2018) -Dredging Periods shown by Pink Bars. ................................................. 34
Figure 2-22 Plots of 24-Hour Averages for Turbidity measurements made at Coasteye Buoy 3
Monitoring Station (2017-2018) -Dredging Periods shown by Pink Bars. ................................................. 35
Figure 2-23 Plots of 24-Hour Averages for Turbidity measurements made at Coasteye Buoy 4
Monitoring Station (2017-2018) -Dredging Periods shown by Pink Bars. ................................................. 36

WATER QUALIY RISK ASSESSMENT
DPC Maintenance Dredging 2020-2021 | Water Quality Risk Assessment | | 27 March 2019
rpsgroup.com Page v

WATER QUALITY RISK ASSESSMENT
DPC Maintenance Dredging 2020-2021 | Water Quality Risk Assessment | | 27 March 2019
rpsgroup.com
Page 1
Page 1
1 INTRODUCTION
Dublin Port Company (DPC) is submitting a Foreshore Licence application for the next phase of Maintenance
Dredging at Dublin Port. This dredging will be carried out over 2020 and 2021. The maintenance dredging
footprint will take place within the Inner Liffey Channel and the Approach Channel within Dublin Bay over seabed
that has already been impacted by dredging. The impacted areas will include zones that have been subject
capital dredging to –10m CD under the Alexandra Basin Redevelopment (ABR) Project, and also in zones where
capital dredging are planned but have not yet occurred. The maintenance dredging will only extend to the
existing dredged depths.
This report assesses the potential impact of the proposed 2020-2021 maintenance dredging campaigns on
water quality within the receiving environment. Existing water quality in the vicinity of the proposed maintenance
dredging campaigns is established based on available water quality information. The likely significant effects of
the dredging campaigns on water quality are determined and measures to reduce, avoid and prevent these
likely significant effects are proposed, where they are necessary.

WATER QUALITY RISK ASSESSMENT
DPC Maintenance Dredging 2020-2021 | Water Quality Risk Assessment | | 27 March 2019
rpsgroup.com
Page 2
Page 2
2 WATER QUALITY
2.1 Assessment Methodology
Baseline water quality within the receiving environment has been established through the review of national
monitoring data used to establish water quality status in the context of the EU Water Framework Directive (WFD)
and supporting environmental standards. Recent high frequency monitoring data, collected during DPC's ABR
Project, has also been considered.
An assessment has then been made of the 2020-2021 Maintenance Dredging operations and associated
disposal at sea activities to determine the likelihood for significant impacts on water quality using criteria for
rating significance and magnitude set out in the National Roads Authority (NRA) publication “Guidelines on
Procedures for Assessment and Treatment of Geology, Hydrology and Hydrogeology for National Road
Schemes” (NRA, 2008). The significance of impact on surface water quality likely to occur during the
maintenance dredging campaigns are determined using a predominantly qualitative methodology supported,
where appropriate, by quantitate assessment. The assessment is a consideration of a combination of receptor
sensitivity (Table 2-1) and the potential magnitude of the impact on the water environment (Table 2-2), in order
to determine significance (Table 2-3).
Table 2-1 Criteria for Rating Receptor Sensitivity (NRA, 2008)
Value
(Sensitivity) Typical Descriptors
Extremely High
Attribute has a high quality or value on an international scale. Examples: River, Wetland or surface water body
ecosystem protected by EU legislation. I.e. designated under the Habitats, Birds, Shellfish, Bathing Water or
Freshwater Fish, Drinking Water or Nitrate Directives.
Very High
Attribute has a high quality or value on a regional or national scale. Examples: River, Wetland or surface water
body ecosystem protected by national legislation (NHA status), Regional important potable water source supplying
>2500 homes, nationally important amenity site for wide range of leisure activities, Quality Class A (Biotic Index Q4,
Q5), Flood plain protecting more than 50 residential or commercial properties from flooding.
High
Attribute has a high quality or value on a local scale. Examples: Salmon fishery, locally important potable water
source supplying >1000 homes, Quality Class B (Biotic Index Q3-4), Flood plain protecting 5 to 50 residential or
commercial properties from flooding, Locally important amenity site for wide range of leisure activities.
Medium
Attribute has a medium quality or value on a local scale. Examples: Coarse fishery, Local potable water source
supplying >50 homes, Quality Class C (Biotic Index Q3, Q2-3), Flood plain protecting between 1 and 5 residential or
commercial properties from flooding.
Low
Attribute has a low quality or value on a local scale. Examples: Locally important amenity site for small range of
leisure activities, Local potable water source supplying <50 homes, Quality Class D (Biotic Index Q2, Q1), Flood plain
protecting 1 residential or commercial property from flooding. Amenity site used by small numbers of local people.

WATER QUALITY RISK ASSESSMENT
DPC Maintenance Dredging 2020-2021 | Water Quality Risk Assessment | | 27 March 2019
rpsgroup.com
Page 3
Page 3
Table 2-2 Criteria for Rating the Magnitude of Impact (NRA, 2008)
Magnitude of
Impact Criteria Typical Examples
Large Adverse Results in loss of attribute
and /or quality and integrity of
attribute
Loss or extensive change to a water body or water dependent habitat.
Increase in predicted peak flood level >100mm.
Extensive loss of fishery
Extensive reduction in amenity value
Potential high risk of pollution to water body from routine run-off
Moderate
Adverse
Results in impact on integrity
of attribute or loss of part of
attribute
Increase in predicted peak flood level >50mm
Partial loss of fishery
Potential medium risk of pollution to water body from routine run-off
Partial reduction in amenity value
Minor Adverse Results in minor impact on
integrity of attribute or loss of
small part of attribute
Increase in predicted peak flood level >10mm
Minor loss of fishery
Potential low risk of pollution to water body from routine run-off
Slight reduction in amenity value
Negligible
Results in an impact on
attribute but of insufficient
magnitude to affect either use
or integrity
Negligible change in predicted peak flood level
Negligible loss of amenity value
Negligible loss of fishery
The approach to assessing the significance of impacts comprises assigning each impact to one of the four
categories of magnitude as outlined in Table 2-1 and enables different characteristics to be assessed based
upon the same scale.
Table 2-3 Criteria for Rating the Significance of Environmental Impacts (NRA 2008)
Importance of
Attribute
Magnitude of Impact
Negligible Minor Moderate Large
Extremely High Imperceptible Significant Profound Profound
Very High Imperceptible Significant / Moderate Profound / Significant Profound
High Imperceptible Moderate / Slight Significant / Moderate Severe / Significant
Medium Imperceptible Slight Moderate Significant
Low Imperceptible Imperceptible Slight Slight / Moderate
The significance determination and assessment of the potential likely environmental effects of each component
of the proposed maintenance dredging campaigns has been made based on the matrix presented in Table 2-3
and defined in Table 2-4.

WATER QUALITY RISK ASSESSMENT
DPC Maintenance Dredging 2020-2021 | Water Quality Risk Assessment | | 27 March 2019
rpsgroup.com
Page 4
Page 4
Table 2-4 Defining Impact Significance (NRA, 2008)
Impact Level Attribute Importance
Extremely High Very High High Medium Low
Profound Any permanent impact on attribute
Permanent impact on significant proportion of attribute
Significant Temporary impact on significant proportion
of attribute
Permanent impact on small proportion of
attribute
Permanent impact on significant proportion
of attribute
Moderate Temporary impact on small proportion of
attribute
Temporary impact on significant proportion
of attribute
Permanent impact on small proportion of
attribute
Permanent impact on significant proportion
of attribute
Slight Temporary impact on small proportion of
attribute
Temporary impact on significant proportion
of attribute
Permanent impact on small proportion of
attribute
Permanent impact on significant proportion
of attribute
Imperceptible Temporary impact on small proportion of
attribute
Temporary impact on significant proportion
of attribute
Permanent impact on small proportion of
attribute
To conclude the assessment, mitigation measures are proposed to reduce, avoid and prevent these likely
significant effects, where appropriate. This enables a “with mitigation” assessment to be made of any residual
impact as a result of the proposed maintenance dredging and/or in combination with other projects in the vicinity
of Dublin Port.
2.2 Receiving Water Environment
A desk-based assessment of surface water quality in the vicinity of the proposed maintenance dredging
campaigns was conducted. The sources of the water quality information are summarised include:
Water Framework Directive water body status information arising from the Water Framework Directive
monitoring programme. Water Quality in Ireland Report 2010-2015 (2017) supported by water quality
information available on the EPAs online Water Framework Directive Application (www.catchments.ie);
Protected areas datasets including:
– bathing water quality information outlined in the EPA’s most recent bathing water quality report,
Bathing Water Quality in Ireland, A Report for the Year 2017 (EPA, 2018);
– information on Nutrient Sensitive Areas as outlined in the EPA’s most recent Urban Waste Water
Treatment Report (2017); and
– the existing Register of Protected Areas (under Article 6 of the Water Framework Directive) for water
dependent habitats and species in the SAC and SPA networks held by the EPA.
Department of Environment, Community and Local Government - Marine Strategy Framework Programme
of Measures Summary Report (2016);
Water Quality in Ireland – An Indicators Report (2018);
Marine Institute water quality monitoring data for Liffey Estuary Lower and Dublin Bay 2015 – 2018;
Site specific water quality monitoring data was made available by Dublin Port Company’s Monitoring
Programme (ongoing for the ABR Project), these data are reported in DPC’s annual environmental
returns/baseline state of the environment reporting.

WATER QUALITY RISK ASSESSMENT
DPC Maintenance Dredging 2020-2021 | Water Quality Risk Assessment | | 27 March 2019
rpsgroup.com
Page 5
Page 5
2.2.1 Surface Water Bodies
For the purposes of monitoring and assessing the quality of surface waters, all rivers, lakes, coastal interbasins,
estuaries, and coastal waters (within 1 nautical mile of the shoreline) have been divided into management units
called “water bodies”. The condition of each water body must be reported to the European Commission in the
form of ecological status and chemical status. Ground water bodies are similarly delineated with status
identified.
Surface water bodies are grouped into sub-catchments for the purposes of water management, of which there
are 583 nationally, which are further grouped into catchment management units of which there are 46 based on
the hydrometric areas used by public authorities. As illustrated in Figure 2-1, the 2020 maintenance dredge
loading activity will take place within the Liffey Estuary and Dublin Bay. The propoed maintenance dredging
campaigns are located within two surface water bodies: ‘Liffey Estuary Lower’ transitional water body
(EA_090_0300) and ‘Dublin Bay’ coastal water body (EA_090_0000). The ‘Liffey Estuary Upper’
(EA_090_0400) and the 'Tolka Estuary' (EA_090_0200) transitional water bodies are situated upstream of the
proposed maintenance dredging campaigns.
Figure 2-1 Site Location in the Context of the Wider Surface Water Environment
The proposed maintenance dredging campaigns lie within the ‘Dublin Urban’ groundwater body (EA-G-008).
This water body has achieved and maintained ‘good’ status since the 2007-2012 WFD Monitoring Cycle as

WATER QUALITY RISK ASSESSMENT
DPC Maintenance Dredging 2020-2021 | Water Quality Risk Assessment | | 27 March 2019
rpsgroup.com
Page 6
Page 6
reported in 2017. All these waterbodies are grouped into the ‘Liffey and Dublin Bay Catchment’ (HA09) of the
Irish River Basin District.
Due to the nature of the proposed maintenance dredging campaigns, there are no likely significant water quality
effects on groundwater expected and these have therefore not been assessed further in this report.
2.2.2 Water Framework Directive Water Body Status
Directive 2000/60/EC establishing a framework for community action in the field of water policy (the Water
Framework Directive), and transposing regulations, establishes a legal framework for the protection,
improvement and sustainable management of rivers, lakes, transitional waters (estuaries), coastal waters (to a
distance of one nautical mile) and groundwater.
The fundamental objectives of the WFD are to maintain “high status” of surface waters where it exists, prevent
deterioration in the existing status of waters, and achieve at least “good status” in relation to all waters by the
end of the current river basin management cycle (2021) unless subject to extended deadlines. A water body
must achieve both good ‘ecological status’ and good ‘chemical status’ before it can be considered to be at good
overall status. An assessment of the risks to the achievement of these objectives for water bodies has been
undertaken by the EPA through the extensive characterisation of water bodies and the key pressures acting
upon them. This will allow the development of a programme of measures to allow the achievement of the WFD
objectives.
The Programme of Measures (POMs) outlines the steps that will be taken to meet WFD objectives as applicable
to each water body. This Programme is contained within an overarching River Basin Management Plan (RBMP).
These measures will require implementation at strategic level but also at regional and local level through the
establishment of Regional Integrated Catchment Management Programme. Whilst none of the water bodies
within the project area have been included amongst those 190 prioritised areas for action in the current River
Basin Management Plan for Ireland 2018 - 2021 (DHPLG, 2018), it is noted that measures required to ensure
compliance with existing legislation will be implemented during this river basin management cycle.

WATER QUALITY RISK ASSESSMENT
DPC Maintenance Dredging 2020-2021 | Water Quality Risk Assessment | | 27 March 2019
rpsgroup.com
Page 7
Page 7
Figure 2-2 Elements of the Water Framework Directive Status
Environmental Quality Standards (EQSs) for classifying surface water status are established in the European
Communities Environmental Objectives (Surface Waters) Regulations, 2009 (SI No. 272 of 2009), as amended.
These regulations set standards for biological quality elements, physico-chemical conditions supporting
biological elements (including general conditions and specific pollutants), priority substances and priority
hazardous substances.
As shown in Figure 2-2 the ‘ecological status’ of a water body is established according to compliance with the
EQSs for biological quality elements, physico-chemical conditions supporting biological elements and relevant
pollutants and hydromorphological quality element. The ‘chemical status’ of a water body is established
according to compliance with the EQSs for priority substances and priority hazardous substances.
In addition to achieving good ecological and chemical status, a water body must achieve compliance with
standards and objectives specified for protected areas, which include areas designated by the Bathing Water
Directive; the Urban Waste Water Treatment Directive; the Shellfish Waters Directive; the Habitats Directive
and the Birds Directive. Waters bodies that are compliant with WFD standards, but that contain protected areas
that are non-compliant with protected area standards are downgraded to ‘less than good’ status.
Based on monitoring information and data from 2010 to 2015, the current WFD status classification of
transitional and coastal water bodies potentially affected by the proposed maintenance dredging campaigns is
illustrated in Figure 2-3.
WATER QUALITY RISK ASSESSMENT
DPC Maintenance Dredging 2020-2021 | Water Quality Risk Assessment | | 27 March 2019
rpsgroup.com
Page 8
Page 8
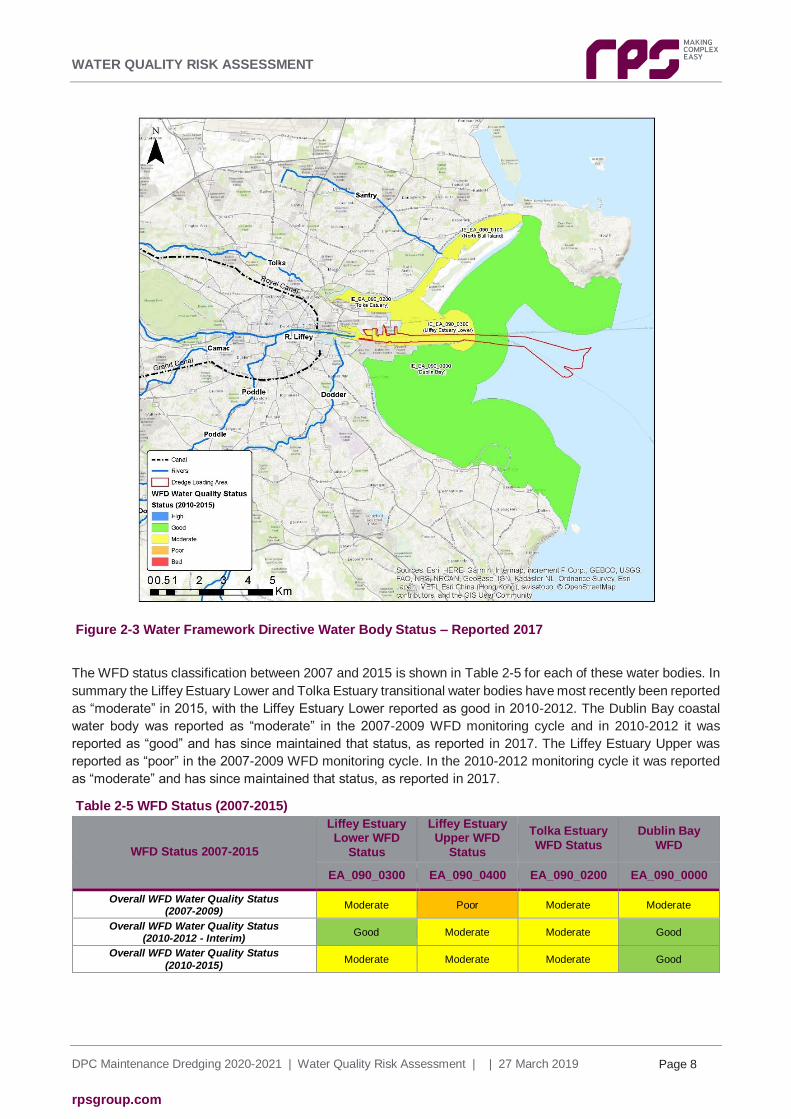
Figure 2-3 Water Framework Directive Water Body Status – Reported 2017
The WFD status classification between 2007 and 2015 is shown in Table 2-5 for each of these water bodies. In
summary the Liffey Estuary Lower and Tolka Estuary transitional water bodies have most recently been reported
as “moderate” in 2015, with the Liffey Estuary Lower reported as good in 2010-2012. The Dublin Bay coastal
water body was reported as “moderate” in the 2007-2009 WFD monitoring cycle and in 2010-2012 it was
reported as “good” and has since maintained that status, as reported in 2017. The Liffey Estuary Upper was
reported as “poor” in the 2007-2009 WFD monitoring cycle. In the 2010-2012 monitoring cycle it was reported
as “moderate” and has since maintained that status, as reported in 2017.
Table 2-5 WFD Status (2007-2015)
WFD Status 2007-2015
Liffey Estuary Lower WFD
Status
Liffey Estuary Upper WFD
Status
Tolka Estuary
WFD Status
Dublin Bay
WFD
EA_090_0300 EA_090_0400 EA_090_0200 EA_090_0000
Overall WFD Water Quality Status (2007-2009)
Moderate Poor Moderate Moderate
Overall WFD Water Quality Status (2010-2012 - Interim)
Good Moderate Moderate Good
Overall WFD Water Quality Status
(2010-2015) Moderate Moderate Moderate Good

WATER QUALITY RISK ASSESSMENT
DPC Maintenance Dredging 2020-2021 | Water Quality Risk Assessment | | 27 March 2019
rpsgroup.com
Page 9
Page 9
A further breakdown of the ecological and chemical elements for the 2010-2015 WFD cycles is shown in Table
2-6. The Liffey Estuary Lower water body is currently at "moderate" Ecological Status but was at "good" status
in the previous monitoring cycle. This resulted from a reduction in Biological Status from "good" to "moderate"
due to a reduction in Fish Status from "good" to "moderate". Oxygenation conditions have also reduced from
"high" in the 2007-2009 monitoring interval to "good" in the current 2010-2015 interval.
The Dublin Bay coastal water body has improved from "moderate" in the 2007-2009 monitoring cycle to "good"
Ecological Status in the latest monitoring intervals. This resulted from an increase in Biological Status from
"moderate" to "good" due to improving Invertebrate Status, notwithstanding the deterioration in Supporting
Chemistry Conditions, including Oxygenation Conditions, from "high" to "good" status.
The Tolka Estuary has retained 'moderate' Ecological Status throughout all monitoring intervals although Fish
Status has improved to "good" status in the last two monitoring intervals and Oxygenation Conditions have
reduced to "moderate" status' from previous "good" status.
The Liffey Estuary Upper has improved Ecological Status from "poor" in the 2007-2009 monitoring cycle to
"moderate" in the most recent monitoring period. The improvement reflects a change in Fish Status from "poor"
to "moderate".
This assessment of likely significant effects on water quality has been undertaken having regard to the necessity
to comply with the WFD and in doing so ensuring that the proposed maintenance dredging campaigns do not
prevent the achievement of the WFD objectives for these water bodies in subsequent RBMP cycles.
Table 2-6 WFD Status Breakdown (2010-2015)
WFD Status 2010-2015
Liffey Estuary Lower
Liffey Estuary Upper
Tolka Estuary Dublin Bay
EA_090_0300 EA_090_0400 EA_090_0200 EA_090_0000
Ecolo
gic
al S
tatu
s
Biological Status
Phytoplankton Status
Good Good High High
Other Aquatic Floras Status
Not Available Not Available Moderate Good
Invertebrate Status High Not Available Moderate Good
Fish Status Moderate Moderate Good Not Available
Supporting Chemistry Conditions
Oxygenation Conditions
Good Moderate Moderate Good
Nutrients Condition Good Moderate Moderate High
Relevant Pollutants Pass Not Available Not Available Pass
Hydromorphological Quality
Element
Hydrology, Morphology,
Continuity
Poor Bad Poor Good
Ecological Status (2010 – 2015) Moderate Moderate Moderate Good
Chem
ical
Sta
tus Priority substances and other EU-level dangerous
substances
Good Not Available Not Available Good
Chemical Status (2010 – 2015) Good Not Available Not Available Good
Overall WFD Quality Status 2010 - 2015 Moderate Moderate Moderate Good

WATER QUALITY RISK ASSESSMENT
DPC Maintenance Dredging 2020-2021 | Water Quality Risk Assessment | | 27 March 2019
rpsgroup.com
Page 10
Page 10
2.2.3 Protected Areas
A significant proportion of the area of Dublin Bay and adjacent coastline is protected under existing EU
legislation requiring special protection due to the sensitivity to pollution or particular environmental importance.
All of the areas requiring special protection in the Irish River Basin District have been identified by the EPA,
mapped and listed in a national register of protected areas (required under Article 6 of the WFD Directive). The
register of protected areas includes:
areas designated for the abstraction of water for human consumption (Drinking Water Protected Areas);
areas designated for the protection of economically significant aquatic species, i.e. Freshwater Fish and
Shellfish;
bodies of water designated as recreational waters, including areas designated as bathing waters;
nutrient-sensitive areas, including areas identified as Nitrate Vulnerable Zones under the Nitrates Directive
or areas designated as sensitive under Urban Waste Water Treatment Directive; as well as
areas designated for the protection of habitats or species where the maintenance or improvement of the
status of water is an important factor in their protection including relevant Natura 2000 sites (Special
Protection Areas (SPAs); and candidate Special Areas of Conservation (cSACs)).
These protected areas have their own monitoring and assessment requirements to determine their condition.
They are often assessed for additional pollutants or requirements relevant to their designation. Protected areas
within the Dublin Port and Dublin Bay area include areas of Bathing Water, Nutrient Sensitive Waters and Natura
2000 sites.
2.2.3.1 Bathing Waters
The Bathing Water Directive (2006/7/EC) came into force in March 2006, and was transposed into Irish law by
the Bathing Water Quality Regulations, 2008, as amended. The previous 1976 Directive was repealed with
effect from 31 December 2014. Since 2014, the annual water quality classification (rating) of a beach or lake
has been based on water quality results covering a four-year period rather than a single previous season’s data.
Water quality at beaches and lakes is classified as Excellent; Good, Sufficient or Poor (Table 2-7). This
approach is common across all EU Member States and there is a requirement to ensure that bathing waters
are of ‘Sufficient’ standard or better. Any ‘Poor’ bathing water requires a programme of adequate management
measures to be implemented. A minimum of 16 samples are required for formal annual assessment.
Table 2-7 Annual Assessment Criteria for Bathing Waters
Parameter Excellent Good Sufficient
E. coli (Freshwater) 500* 1000* 900**
E. coli (Coastal) 250* 500* 500**
Intestinal enterococci (freshwater) 200* 400* 330**
Intestinal enterococci (Coastal) 100* 200* 185**
*based on 95-percentile value **based on 90-percentile value

WATER QUALITY RISK ASSESSMENT
DPC Maintenance Dredging 2020-2021 | Water Quality Risk Assessment | | 27 March 2019
rpsgroup.com
Page 11
Page 11
The bathing areas in the immediate vicinity of the loading area are Dollymount Strand, Sandymount Strand,
Merrion Strand and Seapoint. Most recently, Dollymount Strand has been classified as Good; Sandymount and
Merrion Strands have been classified as Poor; and Seapoint has been classified as Excellent (Figure 2-4).
Sandymount Strand has deteriorated from Sufficient in the 2016 to Poor in the most recent 2017 monitoring
period. The remaining sites showed no change over this interval.
Figure 2-4 Bathing Water Quality in the Dublin Area 2017 (EPA, 2018)
Both Merrion and Sandymount Strands are considered vulnerable to pollution. The likely pollution sources are
identified as arising from surface water inflows, drainage misconnections from domestic properties and fouling
by large numbers of birds that roost on the extensive areas of exposed sand at these sites. Seabird droppings
have as much as 10 million E.coli bacteria per gram so it is possible that they may be contributing to a decline
in quality, particularly as microbiological standards have become stricter and bird numbers appear to be
increasing.
In addition to the waters which Ireland has formally identified to the EU as bathing waters there are many
locations around the country which are monitored by local authorities because swimming or recreational
activities are known to take place there. Water quality results for other monitored waters for the period 2014-
2017 shows the quality likely to be achieved at these waters.
Of the other monitored waters in the Dublin Bay area, the North Bull Wall Causeway on the River Liffey, is
indicated as likely to be of Poor quality. The Half Moon bathing area is indicated as Good; Shelley Banks as
Sufficient; White Rock and Sandycove as Excellent (Figure 2-4).
WATER QUALITY RISK ASSESSMENT
DPC Maintenance Dredging 2020-2021 | Water Quality Risk Assessment | | 27 March 2019
rpsgroup.com
Page 12
Page 12
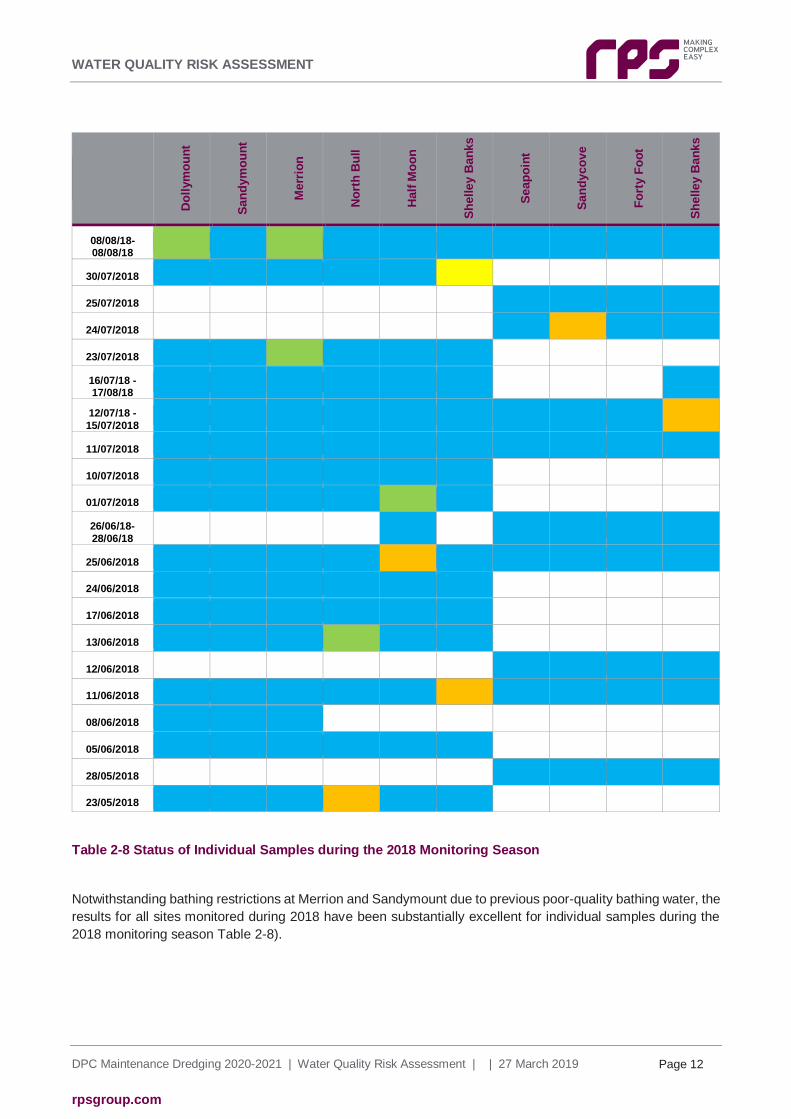
Table 2-8 Status of Individual Samples during the 2018 Monitoring Season
Notwithstanding bathing restrictions at Merrion and Sandymount due to previous poor-quality bathing water, the
results for all sites monitored during 2018 have been substantially excellent for individual samples during the
2018 monitoring season Table 2-8).
D
oll
ym
ou
nt
San
dym
ou
nt
Merr
ion
No
rth
Bu
ll
Half
Mo
on
Sh
elley B
an
ks
Seap
oin
t
San
dyco
ve
Fo
rty F
oo
t
Sh
elley B
an
ks
08/08/18- 08/08/18
30/07/2018
25/07/2018
24/07/2018
23/07/2018
16/07/18 - 17/08/18
12/07/18 -
15/07/2018
11/07/2018
10/07/2018
01/07/2018
26/06/18-
28/06/18
25/06/2018
24/06/2018
17/06/2018
13/06/2018
12/06/2018
11/06/2018
08/06/2018
05/06/2018
28/05/2018
23/05/2018

WATER QUALITY RISK ASSESSMENT
DPC Maintenance Dredging 2020-2021 | Water Quality Risk Assessment | | 27 March 2019
rpsgroup.com
Page 13
Page 13
2.2.3.2 Nutrient Sensitive Waters
The Urban Waste Water Treatment Regulations 2001, as amended (which transpose the Urban Wastewater
Treatment Directive (91/271/EEC) into Irish law and update the Environmental Protection Agency Act, 1992
(Urban Waste Water Treatment) Regulations 1994, as amended) list nutrient sensitive waters in the Third
Schedule.
The Liffey Estuary from Islandbridge weir to Poolbeg Lighthouse, including the River Tolka basin and South Bull
Lagoon has been designated as a nutrient sensitive area (Figure 2-5). Ringsend WWTP currently discharges
in the Lower Liffey Estuary.
Figure 2-5 Nutrient Sensitive Areas

WATER QUALITY RISK ASSESSMENT
DPC Maintenance Dredging 2020-2021 | Water Quality Risk Assessment | | 27 March 2019
rpsgroup.com
Page 14
Page 14
2.2.3.3 Natura 2000 Protected Areas
Natura 2000 is a European network of important ecological sites. The EU Habitats Directive (92/43/EEC) places
an obligation on Member States of the EU to establish the Natura 2000 network. The network is made up of
Special Protection Areas (SPAs), established under the EU Birds Directive (79/409/EEC), and cSACs,
established under the Habitats Directive itself.
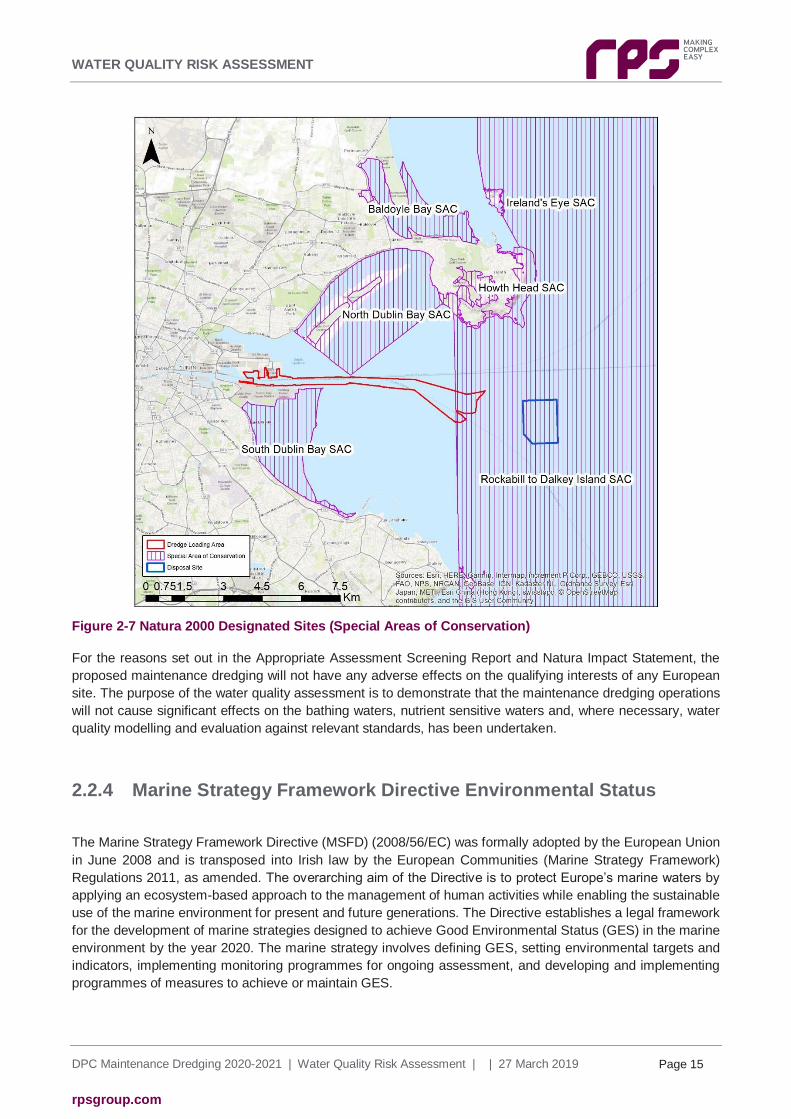
As illustrated in Figure 2-6 the proposed maintenance dredging loading activities within Dublin Harbour do not
lie within any Natura 2000 site (i.e. SPA or cSAC). The outermost section of the navigation channel within Dublin
Bay does however lie within the Rockabill to Dalkey SAC (Figure 2-7). The licensed dumping area also lies
within the Rockabill to Dalkey SAC which is designated for the marine Annex I qualifying interest reefs and the
Annex II species Phocoena phocoena (harbour porpoise). The potential of likely significant effects from the
proposed maintenance dredging campaigns has been assessed in the Natura Impact Statement accompanying
this Foreshore Licence Application.
Figure 2-6 Natura 2000 Designated Sites (Special Protection Areas)
WATER QUALITY RISK ASSESSMENT
DPC Maintenance Dredging 2020-2021 | Water Quality Risk Assessment | | 27 March 2019
rpsgroup.com
Page 15
Page 15
Figure 2-7 Natura 2000 Designated Sites (Special Areas of Conservation)
For the reasons set out in the Appropriate Assessment Screening Report and Natura Impact Statement, the
proposed maintenance dredging will not have any adverse effects on the qualifying interests of any European
site. The purpose of the water quality assessment is to demonstrate that the maintenance dredging operations
will not cause significant effects on the bathing waters, nutrient sensitive waters and, where necessary, water
quality modelling and evaluation against relevant standards, has been undertaken.
2.2.4 Marine Strategy Framework Directive Environmental Status
The Marine Strategy Framework Directive (MSFD) (2008/56/EC) was formally adopted by the European Union
in June 2008 and is transposed into Irish law by the European Communities (Marine Strategy Framework)
Regulations 2011, as amended. The overarching aim of the Directive is to protect Europe’s marine waters by
applying an ecosystem-based approach to the management of human activities while enabling the sustainable
use of the marine environment for present and future generations. The Directive establishes a legal framework
for the development of marine strategies designed to achieve Good Environmental Status (GES) in the marine
environment by the year 2020. The marine strategy involves defining GES, setting environmental targets and
indicators, implementing monitoring programmes for ongoing assessment, and developing and implementing
programmes of measures to achieve or maintain GES.

WATER QUALITY RISK ASSESSMENT
DPC Maintenance Dredging 2020-2021 | Water Quality Risk Assessment | | 27 March 2019
rpsgroup.com
Page 16
Page 16
GES is defined as ‘the environmental status of marine waters where these provide ecologically diverse and
dynamic oceans and seas which are clean, healthy and productive within their intrinsic conditions, and the use
of the marine environment is at a level that is sustainable, thus safeguarding the potential for uses and activities
by current and future generations’.
The assessment of GES is undertaken by reference to qualitative descriptors which define overarching
objectives in respect of key socio-economic or ecological aspects of the marine environment. These specifically
require the consideration of the following:
biodiversity;
non-indigenous species;
exploited fish and shellfish;
food webs;
human-induced eutrophication;
sea-floor integrity;
alteration of hydrographical conditions;
contaminants in water and seafood;
marine litter; and
the introduction of energy including underwater noise.
To date, an Initial Assessment (constituting a comprehensive review of the physical, chemical and biological
characteristics of the marine area, as well as the human pressures acting upon it) has been undertaken (DEHLG
2013)). A comprehensive set of environmental targets and associated indicators is under development. These
will be used to demonstrate that GES has been achieved or is being maintained in accordance with the
objectives of the MSFD. A monitoring programme will be established by the Department of Housing, Planning
and Local Government and the Marine Institute to identify measures which will need to be taken in order to
achieve or maintain GES in marine waters. To date, the extent of achievement of GES has not been established
for individual water bodies, therefore this water quality assessment relies on the WFD water quality assessment
to ensure that the proposed development will not cause conflict with the MSFD.
2.2.5 EPA Water Quality in 2016: An Indicators Report
In 2018 the EPA published the Water Quality in Ireland, An indicators Report. The intention of the report is to
keep decision makers and the public informed by providing timely, scientifically sound information on water
quality using a series of water quality indicators. Of the sixteen indicators three relate to Transitional and Coastal
Waters;
Indicator 9 – Trophic Status of Transitional and Coastal Waters,
Indicator 10 – Nitrogen in Transitional and Coastal Waters,
Indicator 11 – Phosphorus in Transitional and Coastal Waters.

WATER QUALITY RISK ASSESSMENT
DPC Maintenance Dredging 2020-2021 | Water Quality Risk Assessment | | 27 March 2019
rpsgroup.com
Page 17
Page 17
2.2.5.1 Indicator 9 – Trophic Status of Transitional and Coastal Waters
The assessment of trophic status is used to identify waters that may be sensitive to nutrient enrichment and the
occurrence of eutrophication. Trophic status is a measure of the amount of biomass in a water body at a certain
time. Too much nutrient leads to too much biomass, which can severely impact the normal functioning of saline
ecosystems and can cause changes to the biological communities and undesirable disturbance to the overall
ecology. Eutrophication in estuaries and coastal waters can be caused by nitrogen and/or phosphorus.
Phosphorus is generally considered the primary limiting nutrient in river-dominated estuaries while nitrogen is
considered the primary limiting nutrient in coastal ecosystems.
The trophic status of transitional and coastal water bodies is assessed using the EPA’s Trophic Status
Assessment Scheme (TSAS) and is required for the EU Urban Waste Water Treatment Directive (91/271/EEC)
and the EU Nitrates Directive (91/676/EEC). The scheme compares the compliance of individual parameters
against a set of criteria indicative of trophic state (Table 2-9) and classifies water bodies as follows:
Eutrophic water bodies are those in which criteria in each of the categories are breached, i.e. where
elevated nutrient concentrations, accelerated growth of plants and undesirable water quality disturbance
occur simultaneously;
Potentially Eutrophic water bodies are those in which criteria in two of the categories are breached and
the third falls within 15 per cent of the relevant threshold value;
Intermediate status water bodies are those which breach one or two of the criteria;
Unpolluted water bodies are those which do not breach any of the criteria in any category.
The Water Quality in 2016 Indicator Report has indicated that the Liffey Estuary lower and the Liffey Estuary
Upper water bodies have been designated as being Intermediate, the Tolka Estuary has been designated as
Eutrophic and Dublin Bay is Unpolluted.
Table 2-9 Parameters and criteria used in the Trophic Status Assessment Scheme (TSAS) for Irish
Marine Water Bodies (EPC, 2010)

WATER QUALITY RISK ASSESSMENT
DPC Maintenance Dredging 2020-2021 | Water Quality Risk Assessment | | 27 March 2019
rpsgroup.com
Page 18
Page 18
2.2.5.2 Indicator 10 – Nitrogen in Transitional and Coastal Waters
Nitrogen is generally considered the primary limiting nutrient in coastal ecosystems, meaning that the
concentration of this nutrient can limit the growth of algae and aquatic plants. Increases in nitrogen can lead to
elevated growth of phytoplankton and/or macroalgae. Levels of Dissolved Inorganic Nitrogen (DIN) are
monitored in winter, when levels are expected to be at their seasonal maximum due to the absence of any
significant plant or algal growth.
The EPA have defined salinity-dependent thresholds for DIN in transitional and coastal waters, and there is an
environmental quality standard for coastal waters. These assessment thresholds range from ≤2.6 mg N/l at a
salinity of 0 to ≤0.25 mg N/l at a salinity of 34.5, and are used to assess water quality of transitional and coastal
waters around Ireland. Dissolved inorganic nitrogen concentrations above the assessment threshold indicate
the presence of elevated nitrogen levels from anthropogenic sources. The indicator uses the median winter DIN
concentration for the period 2014–2016 to assess number of exceedances against the assessment threshold.
The EPA 2016 Indicators Report has reviewed trends in some coastal and transitional water bodies. Liffey
Estuary Lower, Tolka Estuary and Dublin Bay have been included in this analysis, but Liffey Estuary Upper has
not. Indicator 10 reports that the Medium DIN Concentration trend between 2007 and 2016 has remained stable
for all three water bodies. It also reports at that the Liffey Estuary Lower and Tolka Estuary have experienced
between 1% to 50% exceedances of Winter DIN and Dublin Bay has not experienced exceedance of Winter
DIN.
2.2.5.3 Indicator 11 – Phosphorus in Transitional and Coastal Waters
Phosphorus is important in transitional systems because it is limiting in lower salinity waters. Salinity-dependent
thresholds have been defined for phosphorus in transitional and coastal waters and there is an environmental
quality standard for transitional waters (S.I. 272, 2009). The assessment threshold is 0.060 mg P/l for fresh to
intermediate salinity waters and ranges from 0.059–0.040 mg P/l for intermediate to full salinity waters.
Phosphorus concentrations above these thresholds can indicate excess phosphorus being transported to
surface waters due to anthropogenic activity. Levels of Molybdate Reactive Phosphorus (MRP) are monitored
in winter, when levels are expected to be at their seasonal maximum due to the absence of any significant plant
or algal growth. Winter (January–March) phosphorus exceedances give an indication of available nutrients
without the influence of biological activity, which mainly occurs during the summer growth period.
Indicator 11 reported that the Median MRP concentration trend between 2007 and 2016 has remained stable
for Liffey Lower Estuary and the Tolka Estuary while the concentration of Dublin Bay has decreased significantly.
It also reports that the Liffey Estuary Lower and Tolka Estuary have not experienced exceedances of Winter
MRP and Dublin Bay has also not experienced exceedance of Winter MRP.
In this water quality assessment consideration has been given to potential effects of the proposed maintenance
dredging campaigns on these nutrient related environmental indicators.

WATER QUALITY RISK ASSESSMENT
DPC Maintenance Dredging 2020-2021 | Water Quality Risk Assessment | | 27 March 2019
rpsgroup.com
Page 19
Page 19
2.2.6 Marine Institute Monitoring
The Marine Institute (MI) monitors water quality at two locations in Dublin Bay and one location in the Liffey
Estuary Lower (Figure 2-8). Available physico-chemical monitoring data from January 2015 to March 2018 have
been collated and are summarised in Figure 2-9.
The mean turbidity measured by MI at Dublin Bay stations 1 and 2 is 8 NTU. This is in agreement with
measurements made at the coastal monitoring buoys in the ABR Project where mean turbidity at four sites and
at three depths was measured at 8 to 14 NTU. The mean turbidity measured in the Liffey Estuary Lower (based
on data from September and November 2018 only) is 21 NTU. This compares with mean turbidity of 2.4 to 7.4
measured at four sites in the Liffey Estuary during the ABR Project. The slightly higher turbidity measured by
MI may relate to the time of year when measurements were made at this site (September and November). It
also reflects the greater variance in turbidity in the dynamic Port area.
Figure 2-8 Marine Institute Monitoring Locations relative to the Loading Area and the Licenced
Disposal Site
Dissolved oxygen levels are 8.9 mg/l at both Dublin Bay sites and slightly lower in the Liffey Estuary at 8.3 mg/l.
This compares with average dissolved oxygen levels of 8.5 to 9.0 mg/l measured in the Liffey Estuary by the
ABR Project and confirms that DO is typically around saturation levels.

WATER QUALITY RISK ASSESSMENT
DPC Maintenance Dredging 2020-2021 | Water Quality Risk Assessment | | 27 March 2019
rpsgroup.com
Page 20
Page 20
Figure 2-9 Marine Institute Summary Water Quality Data 2015 – 2018
This Marine Institute monitoring data provides a baseline of existing turbidity levels and variations giving context
for the assessment of the proposed maintenance dredging campaigns.
2.2.7 Dublin Port Company Monitoring Programme (ABR Project)
2.2.7.1 Within Dublin Port
Dublin Port Company is carrying out extensive monitoring of water quality in Dublin Port and Dublin Bay as part
of its Alexandra Basin Redevelopment (ABR) Project.
Monitoring stations have been established in the Port to provide detailed information on relevant water quality
parameters. The locations of these stations have been agreed with the Planning Authority. They measure real
time water quality and continuously relay the data to a shore-based location. Trigger levels that initiate
investigations have been set for key water quality indicators to allow a quick response and remedial actions,
including the temporary cessation of the works where appropriate.
Monitoring stations have also been established in Dublin Bay at the licensed dredge dumping site as required
by Dumping at Sea Permit S00024-01 to provide for the protection of the marine environment by way of
monitoring of the impacts associated with the loading and dumping at sea activity during dredging operations.
Continuous real-time turbidity monitoring is carried out at four stations and at three depths along with tidal
current and wave climate at one station.
Monitoring Stations
Four water quality monitoring stations have been established at locations within the Liffey Estuary (Figure 2-10).
The sites chosen represent ambient surface water quality in the Liffey Estuary Lower and in the Tolka Estuary
water bodies. Monitoring at the Tolka Estuary station commenced on the 23rd June 2017 while the other three
sites were in operation throughout 2017. The monitoring station at the Tolka Estuary is mounted on an OSIL

WATER QUALITY RISK ASSESSMENT
DPC Maintenance Dredging 2020-2021 | Water Quality Risk Assessment | | 27 March 2019
rpsgroup.com
Page 21
Page 21
Micro Field buoy. At the East Link, Poolbeg Sludge Jetty and North Bank Light stations the monitoring apparatus
has been secured to permanent in-river structures.
Four parameters are measured at each of the water quality stations. Measurements are made every 15 minutes
using a Hydrolab Multiparameter HL4 Sonde with integrated sensors. A secure stilling tube maintains the sonde
at a fixed point below the surface and a watertight compartment on the structure houses a data-logger and
communications hardware. The parameters measured are turbidity, temperature, dissolved oxygen and salinity.
In addition, water level is measured at the Poolbeg Sludge Jetty station. Data are relayed from the monitoring
stations via a 3G connection and web-based telemetry software (ADCON addVANTAGE pRO 6.6) is used to
visualize and distribute the information.
The information from the network of monitoring stations is supplemented by data collected by boat surveys in
the estuary and Dublin Bay. Water samples are taken at fixed locations and along set paths that are strategically
located to measure any impacts on water quality in the area, including behaviour and dispersal of turbidity
plumes.
Figure 2-10 Water Quality Monitoring Stations in the Dublin Port Area
Turbidity and Total Suspended Solids
Turbidity is monitored as a proxy for total suspended solids (TSS) in water due to the ease and frequency with
which it can be measured. Turbidity is a measure of the cloudiness or haziness of water caused by material
suspended in the water such as soil particles, sediment, or small floating algae. Particles are often small and
can remain in suspension in the water for lengthy periods. Turbidity can be caused by natural events such as
flooding, algal growth, water currents, wind and wave action as well as human activities.
Turbidity is measured in NTU (Nephelometric Turbidity Units), which is basically a measure of the amount of
light scattered by particles in suspension. It is readily measured on site and can be used to give a rapid estimate

WATER QUALITY RISK ASSESSMENT
DPC Maintenance Dredging 2020-2021 | Water Quality Risk Assessment | | 27 March 2019
rpsgroup.com
Page 22
Page 22
of the total amount of suspended solids in the water. Measuring the total suspended solids concentration
requires taking water samples for filtration, weighing and drying in the laboratory.
The relationship between turbidity and suspended solids in water is site-specific. It is influenced by the type of
sediment in suspension, its colour, shape and reflectivity. Therefore, a sediment sample from the Liffey at East
Link Bridge was taken and used to establish a relationship between turbidity and suspended solids for the Port
area. The sediment consisted of sandy silt and suspensions were prepared from this sample to provide turbidity
in the range 0 to 150 NTU. Turbidity (NTU) and TSS (mg/l) were measured for 75 suspensions to allow
development of a calibration curve (Figure 2-11).
This relationship can be used to estimate total suspended solids from turbidity readings at the monitoring
stations in the Port area. Based on this relationship a factor of 2.5 is used to convert NTU to TSS mg/l.
Figure 2-11 Relationship Established between Turbidity and Total Suspended Solids (Inner Liffey
Channel)
Dissolved Oxygen (DO), Temperature and Salinity
The amount of oxygen dissolved in the water is reported as milligrams per litre (mg/l). Aquatic animals breathe
using the oxygen dissolved in the water. The level is therefore critically important, particularly for fish. Salmon
and trout begin to be affected by low oxygen levels at about 6 mg/l (around 50% saturation), and at dissolved
oxygen levels below 1.7 mg/l death of some adult fish is likely.
Temperature is one of a number of factors that can affect oxygen levels in water. When freshwater is saturated
with oxygen it can hold about 12.7 mg/l of oxygen at a temperature of 5°C; this reduces to 9.1 mg/l at 20°C.
High temperatures also promote more rapid microbiological breakdown of organic wastes and this can also use
up oxygen in the water.
Other factors, including salinity and atmospheric pressure, can also affect dissolved oxygen levels. For example,
seawater holds about 20% less oxygen than freshwater when saturated, and algae produce oxygen during the
daylight hours when they are photosynthesising but use it up during darkness when respiring. These factors
produce daily and tidal rhythms of higher and lower dissolved oxygen levels.
Salinity is measured in PSU (practical salinity units). Full seawater has a salinity of about 35 PSU, while
freshwater has a value close to zero. As well as influencing the type of animals and plants that occur in the
water, salinity affects many aspects of the water's chemistry and physical properties (including the amount of
oxygen dissolved in the water as demonstrated above).

WATER QUALITY RISK ASSESSMENT
DPC Maintenance Dredging 2020-2021 | Water Quality Risk Assessment | | 27 March 2019
rpsgroup.com
Page 23
Page 23
Summary statistics for each full data set are set out in Table 2-10 to Table 2-13. Although maximum and
minimum values are given for each parameter these obviously reflect extreme outlier values that are highly
unlikely to be representative of general ambient water quality. The percentile values listed give a more robust
indication of the true dispersal of the measurements, and clearly most of the measurements (90% of them) lie
between the 5 percentile and 95 percentile values listed.
The graphs in Figure 2-12 to Figure 2-15 show the 24-hour average values for turbidity, salinity, dissolved
oxygen and temperature at each of the monitoring stations. Various dredging campaigns between 2017 and
2018 are also shown. Some data gaps occur due to several causes e.g. fouling of instruments, apparatus failure
or damage.
Table 2-10 Summary Statistics for Dissolved Oxygen, Salinity, Temperature and Turbidity at Eastlink
Monitoring Station
DO (mg/l) Salinity (PSU) Temperature (°C) Turbidity (NTU)
Mean 7.9 32.6 11.6 2.4
Max 11.0 34.8 18.6 9.0
Min 5.6 25.0 3.9 0.0
5%-ile 6.1 29.3 6.4 0.0
95 %-ile 9.7 33.8 17.0 7.1
n 17533 17533 17533 17533
Table 2-11 Summary Statistics for Dissolved Oxygen, Salinity, Temperature and Turbidity at Poolbeg
Monitoring Station
DO (mg/l) Salinity (PSU) Temperature (°C) Turbidity (NTU)
Mean 8.4 32.0 11.9 7.4
Max 12.5 35.3 19.0 190.3
Min 5.9 22.7 6.3 0.0
5%-ile 6.8 26.7 6.9 0.0
95 %ile 9.6 34.4 17.2 34.3
n 17533 17533 17533 17533
Table 2-12 Summary Statistics for Dissolved Oxygen, Salinity, Temperature and Turbidity at
Northbank Monitoring Station
DO (mg/l) Salinity (PSU) Temperature (°C) Turbidity (NTU)
Mean 8.3 33.2 11.6 2.6
Max 10.7 34.8 18.6 39.5
Min 5.4 27.7 4.1 0.0
5%-ile 6.0 31.6 6.5 0.0
95 %ile 9.9 34.3 16.9 8.6
n 17533 17533 17533 17533

WATER QUALITY RISK ASSESSMENT
DPC Maintenance Dredging 2020-2021 | Water Quality Risk Assessment | | 27 March 2019
rpsgroup.com
Page 24
Page 24
Table 2-13 Summary Statistics for Dissolved Oxygen, Salinity, Temperature and Turbidity, at Tolka
Monitoring Station
DO (mg/l) Salinity (PSU) Temperature (°C) Turbidity (NTU)
Mean 8.9 31.8 12.1 3.3
Max 12.8 35.3 19.0 52.5
Min 5.5 23.3 4.1 0.0
5%-ile 7.9 27.0 6.3 0.0
95 %ile 10.3 34.2 17.3 12.6
n 13357 13357 13357 13357

WATER QUALITY RISK ASSESSMENT
DPC Maintenance Dredging 2020-2021 | Water Quality Risk Assessment | | 27 March 2019
rpsgroup.com
Page 25
Page 25
Figure 2-12 Plots of 24-Hour Averages for Water Quality measurements made at Eastlink Monitoring Station (2017-2018) -Dredging Periods shown
by Pink Bars.

WATER QUALITY RISK ASSESSMENT
DPC Maintenance Dredging 2020-2021 | Water Quality Risk Assessment | | 27 March 2019
rpsgroup.com
Page 26
Page 26
Figure 2-13 Plots of 24-Hour Averages for Water Quality measurements made at Poolbeg Monitoring Station (2017-2018) -Dredging Periods
shown by Pink Bars.

WATER QUALITY RISK ASSESSMENT
DPC Maintenance Dredging 2020-2021 | Water Quality Risk Assessment | | 27 March 2019
rpsgroup.com
Page 27
Page 27
Figure 2-14 Plots of 24-Hour Averages for Water Quality measurements made at Northbank Monitoring Station (2017-2018) -Dredging Periods
shown by Pink Bars.

WATER QUALITY RISK ASSESSMENT
DPC Maintenance Dredging 2020-2021 | Water Quality Risk Assessment | | 27 March 2019
rpsgroup.com
Page 28
Page 28
Figure 2-15 Plots of 24-Hour Averages for Water Quality measurements made at Tolka Monitoring Station (2017-2018) -Dredging Periods shown
by Pink Bars.

WATER QUALITY RISK ASSESSMENT
DPC Maintenance Dredging 2020-2021 | Water Quality Risk Assessment | | 27 March 2019
rpsgroup.com
Page 29
Page 29
In general, salinity remains relatively high at all sites, between 22 and 35 PSU. However, on some occasions
significant freshwater influences are obvious, such as at East Link during major storm events when riverine
freshwater inputs increase.
Temperature shows the expected seasonal trend. Temperature peaks at about 19°C during July and August
(2018) at East Link, North Bank Light and Tolka Estuary. The temperature at the Poolbeg site is slightly higher
compared to the other three sites, the higher temperatures here probably reflecting the influence of the nearby
cooling water stream.
The two water quality parameters of greatest significance are turbidity and dissolved oxygen. Figure 2-11–
Figure 2-15 shows that at its extremes, turbidity is very variable, particularly at Poolbeg where very high spikes
of turbidity are sometimes measured. However, 95% of turbidity measurements are less than 35 NTU at
Poolbeg, and less than 15 NTU at East Link, North Bank and Tolka Estuary. Many of the higher turbidity readings
recorded are transient and local and do not represent events of any environmental significance or diagnostic
value in assessing potential impacts.
Some periods of higher turbidity are discernible particularly at Poolbeg (Figure 2-13). Turbidity is volatile at
Poolbeg Jetty. This appears to be mainly due to site characteristics and tidal effects particularly during low
spring tides. Turbidity at all sites may be elevated during storm conditions. The October 2017 event results from
the impact of storm Ophelia followed quickly by storm Brian. Maximum wave heights of 4.8m and 3.8m
respectively were recorded in Dublin Bay during these storms. The impact of storm Ophelia on turbidity is
illustrated in Figure 2-16 The February/March 2018 event was caused by storm Emma when a maximum wave
height of 7.8m was recorded in Dublin Bay.
Investigations during elevated turbidity events have confirmed that ABR Project activities are not the cause of
these events. Comparisons of mean turbidity during periods of 'dredging' and 'no dredging' activity showed that
here is little difference between absolute values and no apparent pattern i.e. no consistent increase in mean
turbidity during dredging episodes as reflected in the plots presented in Figures 2-11 to 2-14 above. In fact,
mean turbidity is higher just as frequently during periods when no dredging was occurring. Measured turbidity
results demonstrate that dredging campaigns in 2017/2018 did not cause any discernible increase in turbidity
within the inner Liffey channel.
Finally, dissolved oxygen levels generally range between 5 and 12.8 mg/l. The mean dissolved oxygen values
clearly indicate that oxygen levels are consistently close to saturation levels and no extended periods of oxygen
sag or impacts of any dredging activities are obvious
Figure 2-16 Mean daily turbidity September to December 2017 (periods of dredging are indicated by
horizontal bars – green for maintenance dredge and red for dredge campaigns (onset of storm
Ophelia is shown by the red arrows))

WATER QUALITY RISK ASSESSMENT
DPC Maintenance Dredging 2020-2021 | Water Quality Risk Assessment | | 27 March 2019
rpsgroup.com
Page 30
Page 30
2.2.7.2 Within Dublin Bay
Turbidity is measured in the outer bay area using four Coast Eye Monitoring Buoys as part of the ABR Project
monitoring programme. The buoys are shown in Figure 2-17 on the deck of the Commissioners of Irish Light
vessel the ILV Granuaile at the time they were launched. Three of the buoys are positioned at the licensed
dumping site near the Burford Bank (to the north, in the middle, and to the south). A fourth buoy is located about
2.5km to the northeast of Dalkey. This fourth buoy gives an indication of the background conditions in Dublin
Bay away from any spoil dumping and dredging activities. All the buoys are moored in about 20m water depth.
Their locations are shown in Figure 2-18.
Figure 2-17 Coasteye Monitoring Buoys On Board the ILV Granuaile for Deployment in Dublin Bay

WATER QUALITY RISK ASSESSMENT
DPC Maintenance Dredging 2020-2021 | Water Quality Risk Assessment | | 27 March 2019
rpsgroup.com
Page 31
Page 31
Figure 2-18 Locations of the Coasteye Monitoring Buoys at the Disposal Site
Turbidity and Total Suspended Solids in the Bay
As described earlier the relationship between turbidity and suspended solids in water is site specific. Therefore,
sediment from outside the breakwaters was sampled and used to establish a relationship between turbidity and
suspended solids for the outer Bay area. The sediment consisted of fine sand and suspensions were prepared
from this sample to provide turbidity in the range 0 to 150 NTU. Turbidity (NTU) and TSS (mg/l) were measured
for 75 suspensions to allow development of the blue calibration curve in Figure 2-19. The previous calibration
curve for fine river sediments is also shown for comparison (red curve).

WATER QUALITY RISK ASSESSMENT
DPC Maintenance Dredging 2020-2021 | Water Quality Risk Assessment | | 27 March 2019
rpsgroup.com
Page 32
Page 32
Figure 2-19 TSS versus Turbidity for suspensions of river bed silt sediment (red) and approach
channel fine sand sediment (blue). Equations & r2 values in corresponding colours for each series
Total suspended solids (TSS) (mg/l) is estimated at 1.61 times the turbidity (NTU) for the approach channel
sediments (fine sand). The correlation coefficients squared show very good relationships in both calibration
series (r2 > 0.90). These relationships are site/sediment-specific but allow an estimate of TSS based on recorded
turbidity. They indicate that turbidity increases more rapidly with increasing amounts finer sediments (silt) in
suspension than with coarser sediments (fine sand).
Each of the monitoring buoys is equipped with three turbidity sensors: one near the water surface; one in mid
water; and one nearer the bottom. Measurements at the buoys are made every fifteen minutes and are relayed
to a shore-based computer for analysis and reporting. This gives a 3-dimensional record of water clarity and
allows detection of any plume of sediment spreading from the dump site when dredge spoil is released. Data
recording at each buoy began in September 2017.
Figure 2-20 to Figure 2-23 shows turbidity from September 2017 until December 2018 for all three depths at
each of the four monitoring buoys. The pink vertical bars indicate periods when dredging took place and the
grey lines highlights some of the storms that passed through Ireland during 2017 and 2018.

WATER QUALITY RISK ASSESSMENT
DPC Maintenance Dredging 2020-2021 | Water Quality Risk Assessment | | 27 March 2019
rpsgroup.com
Page 33
Page 33
Figure 2-20 Plots of 24-Hour Averages for Turbidity measurements made at Coasteye Buoy 1 Monitoring Station (2017-2018) -Dredging Periods
shown by Pink Bars.

WATER QUALITY RISK ASSESSMENT
DPC Maintenance Dredging 2020-2021 | Water Quality Risk Assessment | | 27 March 2019
rpsgroup.com
Page 34
Page 34
Figure 2-21 Plots of 24-Hour Averages for Turbidity measurements made at Coasteye Buoy 2 Monitoring Station (2017-2018) -Dredging Periods
shown by Pink Bars.

WATER QUALITY RISK ASSESSMENT
DPC Maintenance Dredging 2020-2021 | Water Quality Risk Assessment | | 27 March 2019
rpsgroup.com
Page 35
Page 35
Figure 2-22 Plots of 24-Hour Averages for Turbidity measurements made at Coasteye Buoy 3 Monitoring Station (2017-2018) -Dredging Periods
shown by Pink Bars.

WATER QUALITY RISK ASSESSMENT
DPC Maintenance Dredging 2020-2021 | Water Quality Risk Assessment | | 27 March 2019
rpsgroup.com
Page 36
Page 36
Figure 2-23 Plots of 24-Hour Averages for Turbidity measurements made at Coasteye Buoy 4 Monitoring Station (2017-2018) -Dredging Periods
shown by Pink Bars.
WATER QUALITY RISK ASSESSMENT
DPC Maintenance Dredging 2020-2021 | Water Quality Risk Assessment | | 27 March 2019
rpsgroup.com
Page 37
Page 37
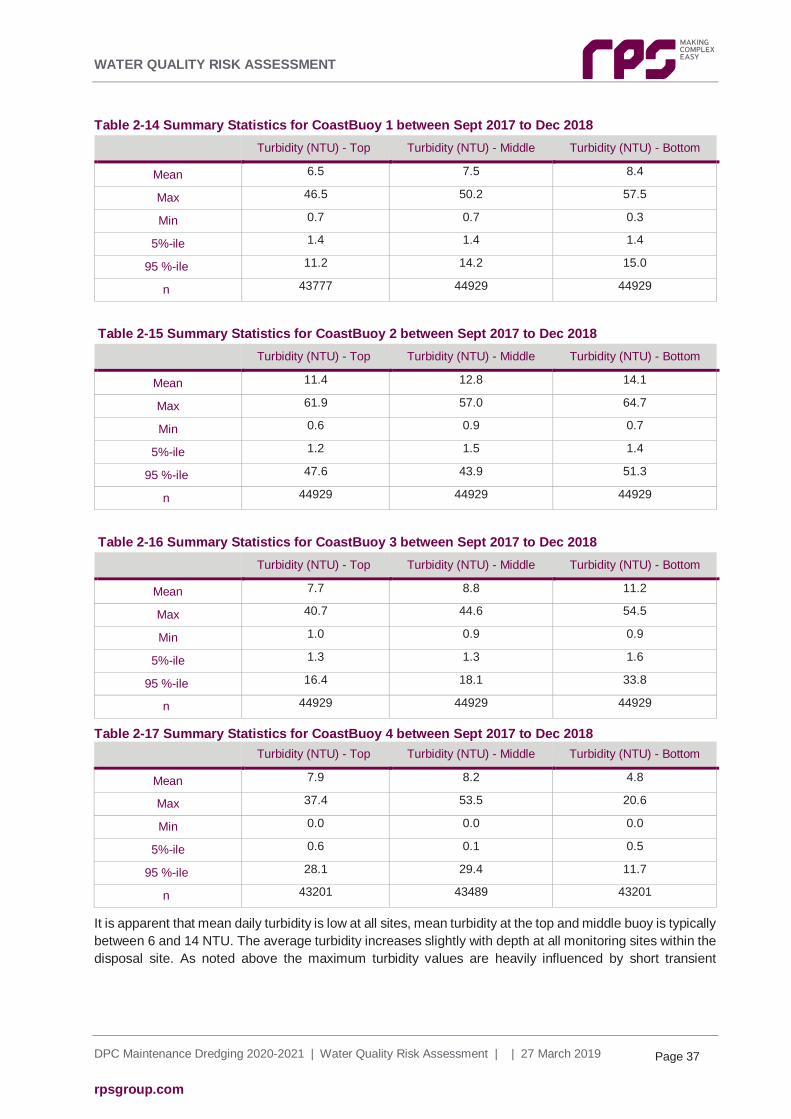
Table 2-14 Summary Statistics for CoastBuoy 1 between Sept 2017 to Dec 2018
Turbidity (NTU) - Top Turbidity (NTU) - Middle Turbidity (NTU) - Bottom
Mean 6.5 7.5 8.4
Max 46.5 50.2 57.5
Min 0.7 0.7 0.3
5%-ile 1.4 1.4 1.4
95 %-ile 11.2 14.2 15.0
n 43777 44929 44929
Table 2-15 Summary Statistics for CoastBuoy 2 between Sept 2017 to Dec 2018
Turbidity (NTU) - Top Turbidity (NTU) - Middle Turbidity (NTU) - Bottom
Mean 11.4 12.8 14.1
Max 61.9 57.0 64.7
Min 0.6 0.9 0.7
5%-ile 1.2 1.5 1.4
95 %-ile 47.6 43.9 51.3
n 44929 44929 44929
Table 2-16 Summary Statistics for CoastBuoy 3 between Sept 2017 to Dec 2018
Turbidity (NTU) - Top Turbidity (NTU) - Middle Turbidity (NTU) - Bottom
Mean 7.7 8.8 11.2
Max 40.7 44.6 54.5
Min 1.0 0.9 0.9
5%-ile 1.3 1.3 1.6
95 %-ile 16.4 18.1 33.8
n 44929 44929 44929
Table 2-17 Summary Statistics for CoastBuoy 4 between Sept 2017 to Dec 2018
Turbidity (NTU) - Top Turbidity (NTU) - Middle Turbidity (NTU) - Bottom
Mean 7.9 8.2 4.8
Max 37.4 53.5 20.6
Min 0.0 0.0 0.0
5%-ile 0.6 0.1 0.5
95 %-ile 28.1 29.4 11.7
n 43201 43489 43201
It is apparent that mean daily turbidity is low at all sites, mean turbidity at the top and middle buoy is typically
between 6 and 14 NTU. The average turbidity increases slightly with depth at all monitoring sites within the
disposal site. As noted above the maximum turbidity values are heavily influenced by short transient

WATER QUALITY RISK ASSESSMENT
DPC Maintenance Dredging 2020-2021 | Water Quality Risk Assessment | | 27 March 2019
rpsgroup.com
Page 38
Page 38
episodes often during stormy weather that are of no environmental significance and are of limited diagnostic
value in assessing water quality. By comparison the 95 percentile values show that turbidity is rarely above
50 NTU at any of the sites. Using the relationship established above between turbidity and total suspended
solids from the Bay area, this is equivalent to a TSS of less than 100mg/l.
There is no obvious relationship between turbidity in Dublin Bay and dredging periods. A statistical analysis
of the turbidity monitoring results is presented in the Dumping at Sea Permit S0024-01 Annual
Environmental Report 2017. The results show no marked difference between turbidity at the dump site
(Buoys 1, 2 and 3) and the control site (Buoy 4). The highest turbidity reading was in fact recorded at the
control site. The results show that the dominant influence on turbidity levels is in fact the natural spring–
neap–spring tidal cycles with the highest turbidity levels recorded close to the seabed.
In conclusion, the measured turbidity results demonstrate that both the dredging campaigns during 2017
and 2018 did not cause any discernible increase in turbidity above background levels. These site-specific
detailed monitoring data have provided further understanding of existing turbidity levels and variations to
provide added context for the assessment of potential significant effects of the proposed maintenance
dredging campaigns.
2.2.8 Summary of Existing Water Quality
A review of available national monitoring information for the water bodies in the immediate vicinity of the
proposed development site, in combination with real time monitoring data from the Port and Dublin Bay
area and supported by computational water quality assessment has concluded:
Overall WFD Water Quality between 2010-2015 for the Liffey Estuary Lower, Liffey Estuary Upper,
Tolka Estuary and Dublin Bay is Moderate, Moderate, Moderate and Good respectively and the ‘Dublin
Urban’ groundwater body (EA-G-008) has achieved and maintained ‘good’ status since the 2007-2012
WFD Monitoring Cycle as reported in 2017.
Within the immediate vicinity of the loading activity , there are a number of protected areas under
Article 6 of the WFD Directive including areas of Bathing and Recreational Water, Nutrient Sensitive
Areas and Water Dependant Natura 2000 sites;
– The bathing areas in the immediate vicinity of the loading area have been classified as Dollymount
Strand - Good; Sandymount and Merrion Strands - Poor; Seapoint – Excellent in the 2017
Monitoring period. Sandymount and Merrion bathing waters are considered vulnerable to pollution
due largely to surface water inflows, and faecal pollution by birds. Bathing water monitoring in the
2018 season has indicated excellent quality in most sampling instances to date.
– The Liffey Estuary from Islandbridge weir to Poolbeg Lighthouse, including the River Tolka basin
and South Bull Lagoon has been designated as a nutrient sensitive area.
– The licensed dumping area is within the Rockabill to Dalkey SAC which is designated for Annex
I qualifying interest Reef and Annex II species Phocoea phocoena (harbour porpoise.
To date, the extent of achievement of GES under the MSFD has not been established for individual
water bodies, consequently no further conclusions can be drawn currently in relation to the MSFD and
the WFD water quality assessment is relied on until specific standards are identified.
The EPA Water Quality in 2016: An indicators Report has stated that the Trophic status for the Liffey
Estuary Lower, Tolka Estuary and Dublin Bay is Intermediate, Eutrophic and Unpolluted respectively;

WATER QUALITY RISK ASSESSMENT
DPC Maintenance Dredging 2020-2021 | Water Quality Risk Assessment | | 27 March 2019
rpsgroup.com
Page 39
Page 39
It was also stated that levels of Winter Dissolved Inorganic Nitrogen (DIN) concentration trends have
remained stable between 2007 and 2016. In addition, Winter Molybdate Reactive Phosphorus (MRP)
concentration trends have remained stable for the Liffey Estuary Lower between 2007 and 2016 and
the Tolka Estuary while the concentration of Dublin Bay has shown a significant decrease over this
period.
Marine Institute monitoring provides turbidity, temperature and dissolved oxygen datasets for the
estuary and Dublin Bay which are comparable with the ABR Project monitoring datasets.
DPC is carrying out extensive monitoring of water quality in Dublin Port and Dublin Bay as part of its
ABR Project. Monitoring stations have been established in the Dublin Port and Bay areas to provide
detailed information on relevant water quality parameters. Monitoring carried out by the Marine Institute
has confirmed the turbidity and dissolved oxygen levels recorded during the ABR Project monitoring
programme.
– High frequency water quality monitoring as part of the ABR Project at various locations in the port
has shown that average daily turbidity remains generally low and less than 10 NTU (equivalent to
about 25mg/l Total Suspended Solids) but may be elevated during storms. The mean dissolved
oxygen monitoring data also shows that oxygen levels are consistently close to saturation levels.
– High frequency measurements of turbidity in Dublin Bay gives a 3-dimensional record of water
clarity and shows that mean daily turbidity is low at all sites, typically around 10 NTU (equivalent
to about 16mg/l Total Suspended Solids), and increases slightly with depth. There is no obvious
relationship between turbidity and dredging periods.
– Water quality has been satisfactory during the monitoring programme 2017 to date and has not
been impacted by loading or dumping during dredging operations. Measured turbidity results
demonstrate that the dredging campaigns during 2017 and 2018 did not cause any discernible
increase in turbidity above background levels.
As discussed in detail in Section 3, water quality model simulations, undertaken to assess the likely
water quality impact of dredging and disposal operations on general water quality and for protected
areas, have concluded that there will be no significant elevation in suspended solids outside the
immediate zone of the operations. To further support these predictions, it is noted that ongoing
Water Quality monitoring undertaken during the ABR Project Capital dredging works and routine
maintenance dredging works have demonstrated that these disposal operations did not cause any
discernible increase in turbidity above background levels. In addition, the potential impact on the
dispersion of the plume (or associated nutrient concentrations or other water quality indicators) in the
vicinity of the Ringsend WWTW Outfall was also examined with no change predicted in the water
quality of these receiving waters.
2.3 Likelihood of Impacts
The likelihood of environmental impacts arising due to the maintenance dredging loading and disposal at
sea activities is assessed in relation to the dredging and disposal operations. The potential impacts on
water quality have been identified for assessment.
The significance of any environmental effect is rated based on the magnitude of the impact and the
importance of the attribute as detailed in Section 2.1. Based on the criteria detailed in NRA Guidelines the
Dublin Bay coastal water body, the Liffey Estuary Lower and Tolka Estuary water bodies are considered to
be of "extremely high" importance due to its designation under the Urban Waste Water Treatment Directive

WATER QUALITY RISK ASSESSMENT
DPC Maintenance Dredging 2020-2021 | Water Quality Risk Assessment | | 27 March 2019
rpsgroup.com
Page 40
Page 40
(91/271/EEC) and proximity to the South Dublin Bay and Tolka Estuary SPA designated under EU Birds
Directive (79/409/EEC). The Liffey Estuary Upper is considered to be of "very high" importance due to its
quality and value on a regional scale.
The proposed maintenance dredging campaigns at Dublin Port has the potential to directly impact upon
the ‘Liffey Estuary Lower’ transitional water body (EA_090_0300) and ‘Dublin Bay’ coastal water body
(EA_090_0000) given the location of the proposed maintenance dredging campaigns. The potential to
indirectly impact upon the adjacent 'Tolka Estuary' (EA_090_0200) ‘and Liffey Estuary Upper’ river water
body (EA_090_0400), transitional water bodies has also been considered.
2.3.1 Potential Impacts
For the purposes of this assessment the main impacts to water quality is mobilised suspended sediment
caused by; maintenance dredging operations within the loading area and the disposal of spoil at the
offshore disposal site. Increases in suspended sediments and turbidity levels from dredging and disposal
operations may under certain conditions have adverse effects on water quality, water dependant habitats
and aquatic ecology through; physical disturbance and also through reduced light penetration into the water
column leading to the potential reduction in photosynthesis activity and a decrease in dissolved oxygen
(DO) levels. Such impacts can be can prevent the achievement of WFD objectives and could result in the
deterioration of status in extreme circumstances
For maintenance dredging and disposal operations, the extent of these environmental affects is near-field
and temporary generally only lasting as long as dredging operations are taking place.
2.4 Description of Likely Significant Impacts
2.4.1 Maintenance Dredging & Disposal Operations
Dredging operations will cause temporary suspension and release of sediments at the loading sites. Spoil
disposal operations will also give rise to temporary sediment plumes at the licensed dumping site at the
approaches to Dublin Bay. Dredging loading operations have been designed to minimise the disturbance
and escape of material at the seabed and during removal through the water column. Proposed individual
loading operations are of relatively short duration and intermittent in nature. It is envisaged that disposal
operations occur at the licensed dumping site which is naturally dispersive for fine sediments. Nevertheless,
significant amounts of dredge material will be removed and deposited at the dumping site over a relatively
extended period.
The magnitude of the potential impact from suspended sediment due to dredging and disposal is considered
to have a minor adverse risk to water quality. The localised significance of the environmental effect is
therefore significant adverse in the absence of mitigation based on the extremely high sensitivity of the
receiving environment.
WATER QUALITY RISK ASSESSMENT
DPC Maintenance Dredging 2020-2021 | Water Quality Risk Assessment | | 27 March 2019
rpsgroup.com
Page 41
Page 41
2.5 Mitigation Measures
In absence of mitigation, the maintenance dredging and disposal works have the potential to have
Significant Adverse impacts on the aquatic environment.
With these considerations in mind, detailed mitigation has been incorporated into the design of the proposed
maintenance dredging campaigns to minimise its potential impact on the water environment. This section
details the mitigation measure that will be employed on site during the maintenance dredging campaign.
2.5.1 Suspended Sediment and Sedimentation
Suspended sediment, including cobbles, gravels, sands, silts and mud is the single main pollutant to the
aquatic environment generated by the proposed maintenance dredging campaigns. In this instance, the
primary source of suspended sediments will arises during the loading and dumping operations. The
adoption of appropriate sediment controls during maintenance dredging is essential to prevent increased
suspended sediment concentrations.
Dredging and Disposal
DPC completed its first winter capital dredging season (October 2017 – March 2018) as part of the ABR
Project. This dredging campaign was fully compliant with the requirements of all the development consents,
as confirmed by high resolution environmental monitoring results reported in the Annual Environmental
Report submitted to the Office of Environmental Enforcement (OEE) in March 2018. The monitoring
included year-round real-time measurement of water quality parameters in the Liffey Channel and in Dublin
Bay at eight monitoring stations and at various water depths. This was supplemented by sediment plume
and hydrographic monitoring that validated Plume Dispersal Modelling.
A Dredging Management Plan was developed for the ABR Project and is set out in Alexandra Basin
Redevelopment Project Construction Environmental Management Plan (CEMP) Rev. F August 2018. The
mitigation proposed for dredging operations in the 2020-2021 Maintenance Dredging Campaign has been
informed by the ABR Project monitoring and experience working in the same locations. The following key
relevant mitigation measures will apply to each dredging campaign:
The maintenance dredging activity will be carried out during the months (April – September) to avoid
overlap with the ABR Project capital dredging works.
No over-spilling from the dredger will be permitted while the dredging activity is being carried out within
the inner Liffey Channel.
The dredger's hopper will be filled to a maximum of 4,100 cubic metres (including entrained water) to
control the volume of sediment released at the dumping site.
Full time monitoring of Marine Mammals within 500m of loading and dumping operations will be
undertaken in accordance with the measures contained in the Guidance to Manage the Risk to Marine
Mammals from Man-Made Sound Sources in Irish Waters (NPWS 2014).
A documented Accident Prevention Procedure will be put in place prior to commencement
A documented Emergency Response Procedure will be put in place prior to commencement

WATER QUALITY RISK ASSESSMENT
DPC Maintenance Dredging 2020-2021 | Water Quality Risk Assessment | | 27 March 2019
rpsgroup.com
Page 42
Page 42
A full record of loading and dumping tracks and record of the material being dumped will be maintained
for each trip.
Dumping will be carried out through the vessel's hull.
The dredger will work on one half of the channel at a time within the inner Liffey channel to prevent
the formation of a silt curtain across the River Liffey.
In circumstances where the above mitigation measures are employed during the proposed maintenance
dredging and disposal operations, the potential impact to receiving water environment will be negligible
thus reducing the significance of environmental effect to Imperceptible.
2.6 Residual Impacts
Thus, in circumstances where the appropriate mitigation measures are fully implemented during the
proposed maintenance dredging campaigns as outlined above, the impact of on the water quality in the
area will be imperceptible.
Accordingly, the 2020-2021 maintenance dredging campaign will not have a significant effect on the water
quality of the receiving waters. It can therefore be concluded that the proposed maintenance dredging
campaigns are compliant with the requirements and environmental objectives of the EU Water Framework
Directive and the other relevant water quality objectives for these water bodies.
2.7 Potential Cumulative Impacts
Potential cumulative impacts may arise from the 2020-2021 maintenance dredging when combined with
other existing and/or approved projects. In accordance with the European Commission (2017) and EPA
Draft Guidelines (2017), existing and/or approved projects with the potential for cumulative impacts have
been identified. Cumulative impact assessments have been undertaken in this section for relevant
pressures that could potentially give rise to cumulative impact. Each development with the potential to
impact on the water environment has been considered through a review of the environmental supporting
information (where available) for the existing or approved developments.
2.7.1 Dublin Port Company ABR Project
The Alexandra Basin Redevelopment (ABR) Project is the first major infrastructure project to be brought
forward for planning and other consents from Dublin Port Company's (DPC) Masterplan 2012 to 2040. The
Masterplan recognised the need to provide capacity in the Port to cater for 60m (million) gross tonnes of
cargo by 2040 and was approved by the Board of DPC in February 2012. An Bord Pleanála granted
permission for the ABR Project on 8th July 2015 (29N.PA0034).
The ABR Project comprises a number of engineering works set out in DPC's Masterplan document, mainly:
Works at Alexandra Basin West including construction of new quays and jetties, remediation of
contamination on the bed of the basin, capital dredging to deepen the basin and to achieve the
specified depths of -10m Chart Datum (CD) at the new berths.

WATER QUALITY RISK ASSESSMENT
DPC Maintenance Dredging 2020-2021 | Water Quality Risk Assessment | | 27 March 2019
rpsgroup.com
Page 43
Page 43
Infilling of the Basin at Berths 52 & 53 and construction of a new river berth with a double tiered Ro-
Ro ramp.
Deepening of the fairway and approach to Dublin Port to increase the ruling depth from -7.8m CD to -
10.0m CD.
In terms of impact assessment, both the ABR Project are part of Dublin Port Company's Masterplan and
have been planned and designed as part of a structured and integrated development programme that
considers environmental impact and cumulative effects. The most relevant element of the ABR Project in
considering potential cumulative impacts on water quality is the capital dredging elements. Dredging
undertaken as part of the ABR Project will occur in the same water body (Liffey Estuary Lower) and spoil
dumping will use the same licensed dumping site at the approaches to Dublin Bay. DPC will implement
mitigation through avoidance of overlap of dredging activity with the ABR project. This temporal separation
will mitigate cumulative effects on water quality. The extensive mitigation measures described above will
be implemented during the dredging maintenance dredging campaigns.
On the basis of scheduling the maintenance dredging campaigns to avoid overlap and comprehensive
mitigation measures applied it can be concluded that there will be no cumulative effects on water quality.
2.7.2 Irish Water – Ringsend Wastewater Treatment Plan (WwTP) Upgrade Project
Irish Water has submitted a planning application for strategic infrastructure development to An Bord
Pleanála (Ref. PL29S.301798) seeking permission to further progress the upgrade of the Ringsend
Wastewater Treatment Plant (WwTP). The need for additional wastewater treatment capacity has
previously been identified to meet increased commercial, domestic and industrial demand together with a
requirement to meet higher environmental standards in the Lower Liffey Estuary which is designated as a
“sensitive” water body requiring higher treatment standards. As a result, Irish Water propose to expand the
existing wastewater treatment plant to 2.4 million PE capacity and to upgrade the Ringsend WwTP using
enhanced Nereda© treatment technology to allow for improved environmental outcomes.
Estimates of the potential reduction of pollutants due to the upgrade are provided in the Ringsend
Wastewater Treatment Plant Upgrade Project EIAR (June 2018). These are reproduced here in Table 2-18.
It has been estimated in process proving trials that the proposed upgrade and enhanced treatment process
will result in a substantial reduction in BOD, sediment and nutrient loads with significant positive
environmental benefits.
The Ringsend Wastewater Treatment Plant Upgrade EIAR (June 2018) finds that there is potential for a
temporary negative but not significant effect in the Tolka Estuary during the upgrade due to a number of
secondary treatment tanks being temporarily out of operation. However, it concludes that the benefit of the
permanent positive impact after the completion of construction outweighs the insignificant, temporary
negative impact observed during the construction phase. Therefore, given the positive impact of the WwTP
upgrade on receiving water quality it is unlikely that there will be any cumulative adverse effects when
considered in combination with the 2020-2021 maintenance dredging campaigns.

WATER QUALITY RISK ASSESSMENT
DPC Maintenance Dredging 2020-2021 | Water Quality Risk Assessment | | 27 March 2019
rpsgroup.com
Page 44
Page 44
Table 2-18: Final Effluent Discharge – Load Reduction Summary
Parameter Current Average Future Average % Reduction
BOD (Biochemical Oxygen Demand) 8,739 kg/day 7,206 kg/day 17.5%
Suspended Solids 16,205 kg/day 10,508 kg/day 35.2%
Ammonia 4,370 kg/day 600 kg/day 86.3%
DIN (Dissolved Inorganic Nitrogen) 5,939 kg/day 4,804 kg/day 19.1%
MRP (Molybdate Reactive Phosphate) 1,056 kg/day 420 kg/day 60.2%
Measures intended to avoid or reduce these potentially significant effects on the European sites were
proposed as part of the Stage Two Appropriate Assessment, and there will be no adverse effect on the
integrity of any European site as a result.
The Ringsend WwTP project is sufficient spatially separated from proposed maintenance dredging project
to prevent any significant in-combination visual or noise disturbance on SPA feature species at construction
stage. With the measures proposed to avoid or reduce the likely significant pollution effects predicted for
the WwTP Project, there will be no adverse effects upon the integrity of any European site. When both
projects are considered together, there will be no additional in combination effects.
2.7.3 Howth Yacht Club Project
Howth Yacht Club are holders of a Dumping at Sea Permit (Ref. No. S0010-01) granted in August 2011 for
capital works at the inner marina basin at Howth Harbour to extend the existing marina to provide additional
berths. Loading and dumping activities must be completed within one year of the date of commencement
of activities. Dumping of the uncontaminated dredged material is to be at the licensed dumping site at
Burford Bank in Dublin Bay.
The Burford Bank dumping site is an established spoil ground which has been used previously by Howth
Yacht Club for the disposal of dredged material and is also currently permitted for use by Dublin Port
Company (Dumping at Sea Permit S0024-01). Under permit S0010-01, Howth Yacht Club are permitted to
load and dump a maximum of 120,000 tonnes of dredged material over a one year period. In its application
for a Dumping at Sea Permit Howth Yacht Club estimated a maximum daily quantity for dumping of 1,200
tonnes and 800 tonnes in each load. It also suggested a spring or winter commencement and campaign
duration of six months.
The annual load is equivalent to approximately 6% of the annual permitted quantity of material that may be
dumped at this site by Dublin Port Company under Dumping at Sea Permit S0024-01. While dumping by
Dublin Port Company is restricted to the winter months (October to March), no such restriction applies to
Howth Yacht Club activities. Given the possibility of a spring commencement to dredging in Howth it is
possible, therefore, that there could be temporal separation of some if not all dredging activities under these
two permits.
Only Howth Yacht Club and Dublin Port Company currently hold Dumping at Sea Permits for use of the
Dublin Bay dumping site and the Howth permit has been in place since 2011 without commencement. The
dumping site has been used by a number of users over many years without significant environmental effect.
A Marine Benthic Survey of the Dredge Spoil Disposal Area at the Burford Bank (June 2016), ABR Dublin

WATER QUALITY RISK ASSESSMENT
DPC Maintenance Dredging 2020-2021 | Water Quality Risk Assessment | | 27 March 2019
rpsgroup.com
Page 45
Page 45
Port Company concluded that the biological communities identified from the dumpsite and the adjacent
areas were similar to those recorded by Walker and Rees (1980), who had identified communities present
in Dublin Bay dominated by similar fauna over 20 years earlier. This indicates the stable nature of the
benthos (which water quality elements support) within Dublin Bay and around the area of the dumpsite.
Results from the above survey generally concur with the findings of previous surveys of the area and
indicate stable benthic communities at high biological status in the area of the dumpsite.
Therefore, it is unlikely that any significant cumulative effects will occur due to the Howth Yacht Club
proposed project.
2.8 Conclusions
Baseline water quality within the receiving environment was established through review of national
monitoring data used to establish water quality status in the context of the EU Water Framework Directive
(WFD) and supporting environmental standards. Recent high-frequency monitoring data collected during
Dublin Port Company's ABR Project was also reviewed.
Using baseline water quality data and site specific water quality model simulation outputs, an assessment
of the 2020-2021 Maintenance Dredging loading and dumping activities was conducted to determine the
likelihood of significant impacts on water quality using the criteria for rating significance and magnitude as
set out in the National Roads Authority (NRA) publication “Guidelines on Procedures for Assessment and
Treatment of Geology, Hydrology and Hydrogeology for National Road Schemes” (NRA, 2008) and
appropriate mitigation measures to reduce impacts were proposed, where necessary.
In circumstances where the appropriate mitigations measures are fully implemented during the proposed
maintenance dredging campaigns, the impact to the water quality in the area will be imperceptible. The
loading and dumping activities is therefore not expected to have a significant effect on the water quality of
the receiving waters.
It can therefore be concluded that the proposed maintenance dredging campaigns are compliant with the
requirements and environmental objectives of the EU Water Framework Directive and the other relevant
water quality objectives for these water bodies.