water quality of the potomac river … sources-river flows that vary seasonally ... 4 water quality...
TRANSCRIPT

WATER QUALITY OF THE POTOMAC RIVER ESTUARY AT WASHINGTON, D.C.
I


Water Quality of the Potomac River Estuary at Washington, D.C.
By W. H. Durum and W. B. Langbein
POTOMAC RIVER STUDIES
G E 0 L 0 G I C A L S U R V E Y C I R C U L A R 529-A

United States Department of the Interior STEWART l. UDALL, Secretary
Geological Survey William T. Pecora, Director
Free on application to the U.S. Geological Survey, Washington, D.C. 20242

CONTENTS
Page The setting__________________________ 1 Riverflow and quality characteristics _ _ 1
Effects of wastes ------------------ 4 Dissolved oxygen------------------ 4
SummarY---------------------------References-------------------------
ILLUSTRATIONS
Figure 1. Graph showing seasonal distribution of flow of the Potomac River, at Point
Page 8 9
Page
of Rocks, Md __________________ ---- ____________ -------- ____ ---- _ -------- 2 2. Graph showing suspended sediment-load at Point of Rocks, Md_________________ 3 3. Ratio of river to tidal flows------------------------------------------------ 3 4. Map showing estimated daily biochemical oxygen demand reaching the estuary _ _ 5 5. Diagram showing pollution index of Potomac River estuarY-------------------- 6 6. Graph showing relation of dissolved oxygen content to distance for various
rates of discharge, 1963-65- ________ -- ___ --- ____ --- _____ - ___ --- __ -- __ ---- 8
TABLES
Page Table 1. Characteristics of water in Potomac River estuary___________________________ 7
2. Most prevalent quality class, October 1963 to September 1964----------------- 7
III

Potomac River Studies
Warer Q.uality of the Potomac River Estuary at Washington, D.C.
By W. H. Durum and W. B. Langbein
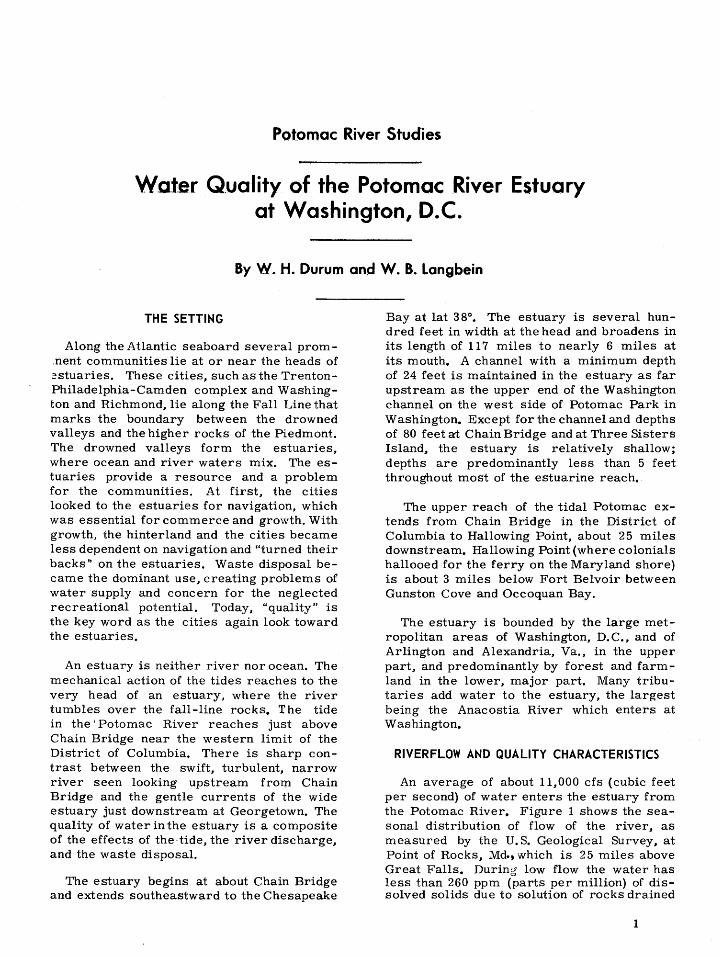
THE SETTING
Along the Atlantic seaboard several prom_nent communities lie at or near the heads of ~stuaries. These cities~ such as the TrentonPhiladelphia-Camden complex and Washington and Richmond~ lie along the Fall Line that marks the boundary between the drowned valleys and the higher rocks of the Piedmont. The drowned valleys form the estuaries~
where ocean and river waters mix. The estuaries provide a resource and a problem for the communities. At first, the cities looked to the estuaries for navigation, which was essential for commerce and growth. With growth, the hinterland and the cities became less dependent on navigation and "turned their backs" on the estuaries. Waste disposal became the dominant use~ creating problems of water supply and concern for the neglected recreational potential. Today~ "quality" is the key word as the cities again look toward the estuaries.
An estuary is neither river nor ocean. The mechanical action of the tides reaches to the very head of an estuary, where the river tumbles over the fall-line rocks. The tide in the' Potomac River reaches just above Chain Bridge near the western limit of the District of Columbia. There is sharp contrast between the swift~ turbulent~ narrow river seen looking upstream from Chain Bridge and the gentle currents of the wide estuary just downstream at Georgetown. The quality of water in the estuary is a composite of the effects of the tide~ the river discharge~ and the waste disposal.
The estuary begins at about Chain Bridge and extends southeastward to the Chesapeake
Bay at lat 38°. The estuary is several hundred feet in width at the head and broadens in its length of 117 miles to nearly 6 miles at its mouth. A channel with a minimum depth of 24 feet is maintained in the estuary as far upstream as the upper end of the Washington channel on the west side of Potomac Park in Washington. Except for the channel and depths of 80 feet crt Chain Bridge and at Three Sisters Island, the estuary is relatively shallow; depths are predominantly less than 5 feet throughout most of the estuarine reach.
The upper reach of the tidal Potomac extends from Chain Bridge in the District of Columbia to Hallowing Point~ about 25 miles downstream. Hallowing Point (where colonials hallooed for the ferry on the Maryland shore) is about 3 miles below Fort Belvoir between Gunston Cove and Occoquan Bay.
The estuary is bounded by the large metropolitan areas of Washington, D.C.~ and of Arlington and Alexandria, Va .• in the upper part~ and predominantly by forest and farmland in the lower, major part. Many tributaries add water to the estuary, the largest being the Anacostia River which enters at Washington.
RIVERFLOW AND QUALITY CHARACTERISTICS
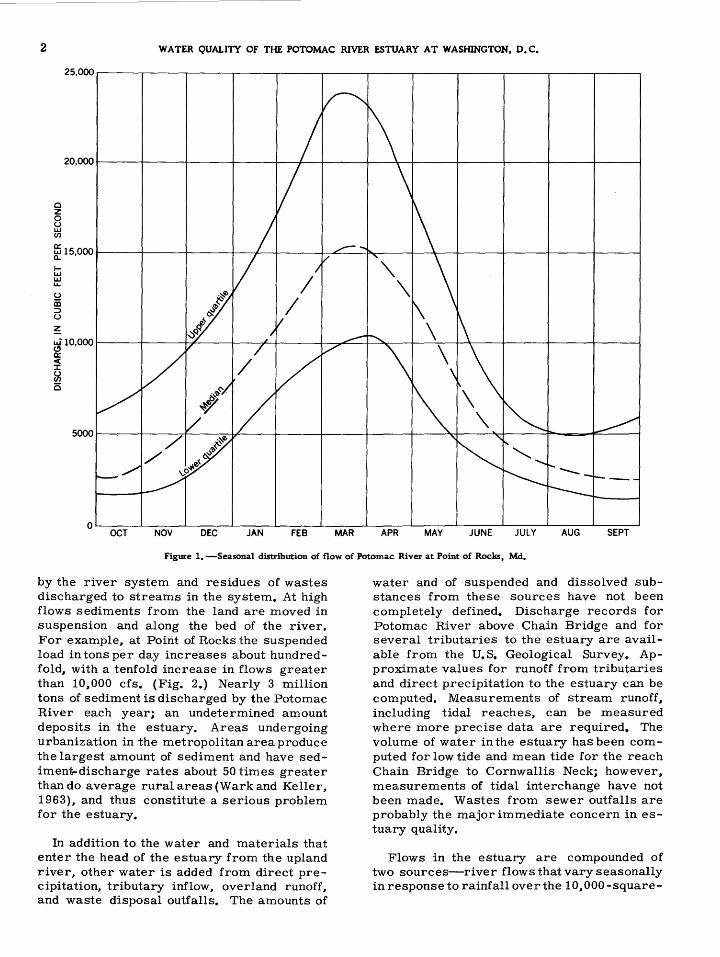
An average of about 11,000 cfs (cubic feet per second) of water enters the estuary from the Potomac River. Figure 1 shows the seasonal distribution of flow of the river, as measured by the U.S. Geological Survey, at Point of Rocks, Md., which is 25 miles above Great Falls. During low flow the water has less than 260 ppm (parts per million) of dissolved solids due to solution of rocks drained
1
2 WATER QUALITY OF THE POTOMAC RIVER ESTUARY AT WASHINGTON, D.C.
0 z 0 (.) LAJ en
25,000
20,000
a:: ~ 15,000
...... LAJ LAJ IL.
5000
0
v _/
OCT
I I
I " ~
0: ~
..::> ,I / / v /
-~~/ # / v /v ~'li
/ ~e<. \.,0
__/
NOV DEC JAN
~
1\ I v \ ~ ,...-- .....
/ ' '\
~\ I
I \ I
I \ ..---...... \ v \ \ \\ v \
\ ~ \ ~
'~ '"'-... ........ r----.._ ~ -r----r-----
FEB MAR APR MAY JUNE JULY AUG SEPT
Figure 1. -Seasonal distribution of flow of Potomac River at Point of Rocks, Md.
by the river system and residues of wastes discharged to streams in the system. At high flows sediments from the land are moved in suspension and along the bed of the river. For example, at Point of Rocks the suspended load in tons per day increases about hundredfold, with a tenfold increase in flows greater than 10,000 cfs. (Fig. 2.) Nearly 3 million tons of sediment is discharged by the Potomac River each year; an undetermined amount deposits in the estuary. Areas undergoing urbanization in the metropolitan area produce the largest amount of sediment and have sedimen~discharge rates about 50 times greater than do average rural areas (Wark and Keller, 1963), and thus constitute a serious problem for the estuary.
In addition to the water and materials that enter the head of the estuary from the upland river, other water is added from direct precipitation, tributary inflow, overland runoff, and waste disposal outfalls. The amounts of
water and of suspended and dissolved substances from these sources have not been completely defined. Discharge records for Potomac River above Chain Bridge and for several tributaries to the estuary are available from the u.s. Geological Survey. Approximate values for runoff from tributaries and direct precipitation to the estuary can be computed. Measurements of stream runoff, including tidal reaches, can be measured where more precise data are required. The volume of water in the estuary has been computed for low tide and mean tide for the reach Chain Bridge to Cornwallis Neck; however, measurements of tidal interchange have not been made. Wastes from sewer outfalls are probably the major immediate concern in estuary quality.
Flows in the estuary are compounded of two sources-river flows that vary seasonally in response to rainfall over the 10,000-square-

> <( 0
0::: LL.I .0...
en z ~ ~ LLi C!J 0::: <( I <..> en c 1-z LL.I ~ c LL.I en 6 LL.I 0 z LL.I .0... en ::) en
RIVERFLOW AHD QUALITY CHARACTERISTICS 3
10,000 100,000
WATER DISCHARGE, IN CUBIC FEET PER SECOND
mile watershed and the twice-daily tidal current inducted by the oceans.
The relative influence of the river and tide in the estuary may be approximated by the ratio. Q / ( Q+V /I)# where. Q is the river discharge, V is the intertidal prism (Durfor, 1961, fig. 14), and T is the time of a tidal cycle (13.5 hr). Figure 3 shows this ratio in terms of mileage along the estuary. Proceeding downstream, one finds that river discharge becomes a smaller part of the total water movement. At low flows ( Q=1,000 cfs) the flow in the estuary below Roosevelt !~land is dominantly tidal. Even at mean discharge (Q =11,000 cfs), t:j.dal movement exceeds river discharge at a distance of 12 miles below Chain Bridge. The distance at which river discharge exceeds tidal flow (that is Q ~ V /l') increases only as the square root of the discharge.
Ftawe 2. --5Uipended-sec:Ument load at Point of Rocks, Md.
Although the ocean tides reach to Chain Bridge, the ocea~ salt water does not extend beyond Indian Head. The inland extent of salt water in the estuary varies in relation to river discharge and tidal action. During a lowflow period in 1930. a chloride concentration
~ 0.6 0 ...J u.. 0::: LL.I > ii: u.. 0 0 i=
0.4 < 0:::
5 10 15 20 25 30 35
DISTANCE, IN MILES DOWNSTREAM FROM CHAIN BRIDGE

4 WATER QUALITY OF THE POTOMAC RIVER ESTUARY AT WASHINGTON, D.C.
of 3, 700 ppm (equivalent to about 20 percent sea water) was observed at Indian Head. A chloride concentration of 68 ppm-several i:imes the probable normal value-was observed at Fort Washington during low flow in September 196 3. Although this concentration is relatively low in comparison with that in sea water, it does indicate a probable maximum point of inland movement of wateJ;' from Chesapeake Bay. During high flows the inland extent of salt water is considerably less.
The water in the estuary at Washington is always fresh, and the main concerns of water quality are sediment content, biologic character, and dissolved oxygen.
EFFECTS OF WASTES
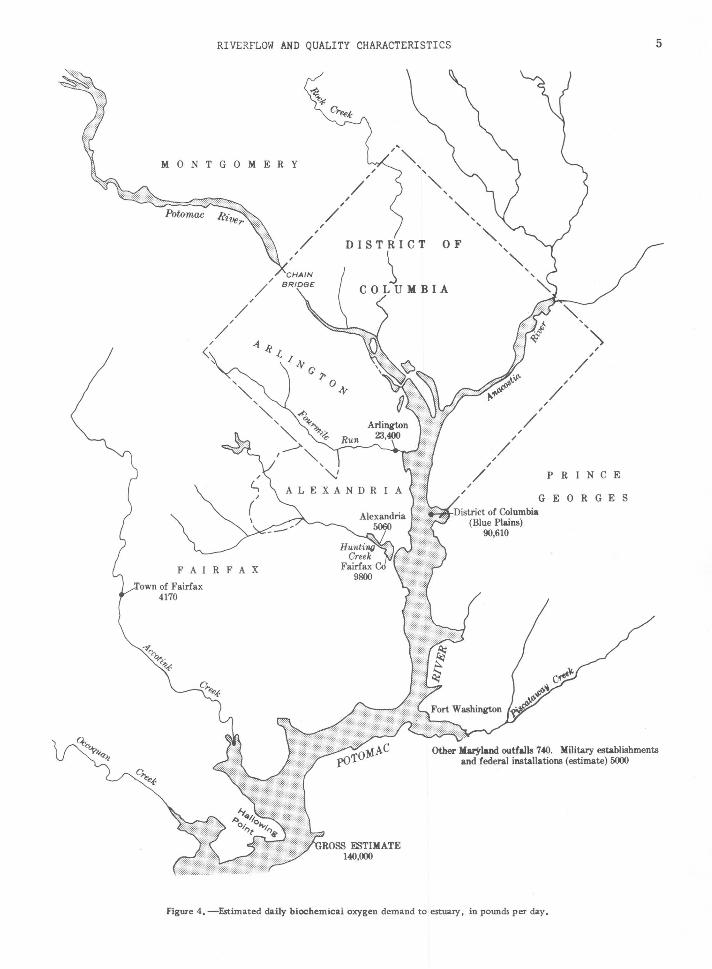
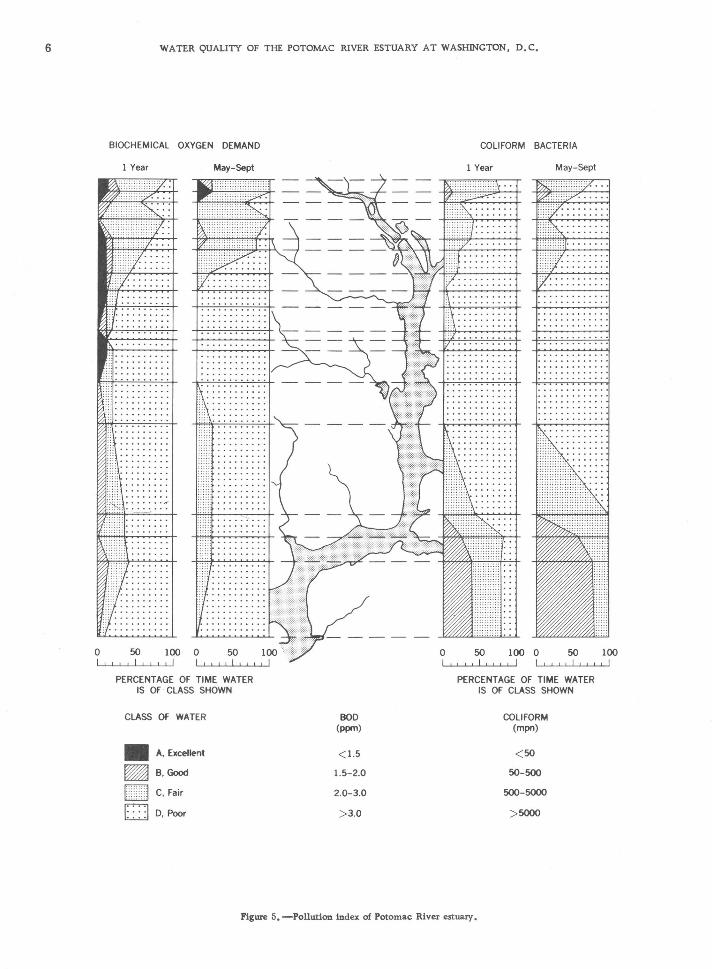
More than 200 million gallons per day of waste effluent is added to the estuary. Locations of waste outfalls are shown on figure 4. Although about 70 percent of settleable solids is removed from the wastes before they are discharged to the estuary, unknown amounts of sludge deposits have accumulated at the mouth of the Anacostia River and at waste outfalls. Dissolved materials in the wastes include minerals normally in the water and chemicals used in treatment of the wastes. The daily wastes from the metropolitan area alone are estimated to contain more than 22,000 pounds of phosphorus and more than 68,000 pounds of nitrogen. The euthrophication by these chemicalsabetted by favorable hydrologic and climatic conditions-caused algal populations in 1963 to be more than 10 times as large as populations generally found in tidal waters (Brehemer, 1964). Figure 5 illustrates the general conditions of the estuary based on biochemical oxygen demand and coliform bacteria.
Because variable amounts and types of suspended and dissolved materials are added to ·the estuary, the quality of water below Chain Bridge is highly variable with respect to location and time, a factor that limits water use. In the upper part of the estuary, near Chain Bridge, the contents of the water are such that the water can be used most of the time for most purposes after standard treatment. Concentrations of dissolved solids and specific ions such as chloride and sulfate are well within the; maximum limits allowed for drinking supplies. Also, specific ions such as silica are not present in sufficient quantities at this site to impair the utility of the water for industrial processes. Coliform bacteria occasionally exceed suggested tolerable limits of 5,000 mpn (most probable number per 100 milliliters). Much higher quantities, up to 390,000 mpn, have been detected below Blue Plains (table 1).
Downstream, from Chain Bridge to the vicinity of Washington and Mount Vernon, the dissolved oxygen decreases and bacterial content of the water increases at low flow. Phosphorous and nitrogen compounds are conspicuous during the dry season.
DISSOLVED OXYGEN
Organic matter in water is decomposed through oxidation. If oxygen is not available to decompose organic matter, septic conditions and foul odors are created. Oxygen content then is a direct indicator of the state of organic health of a body of water.
The oxygen content varies with the oxygen demand of the organic load (reported as BOD, biochemical oxygen demand), with the ternperature (cold water can contain more oxygen than warm water), and with the river discharge. The effect of river discharge on oxygen content is complex.
RIVERFLOW AijD QUALITY CHARACTERISTICS 5
M 0 N T G 0 M E R Y
Powmac
/
/ /
/ /
<
FAIRFAX
of Fairfax 4170
/ , / DISTRICT OF
~ COLUMBIA
/ /
/ /
/
/ /
/
/ /
/
/ /
/
' '
/
'\ /
/
PRINCE
GEORGES
Other !II.,Yland ootfalls 740. Military establishments and federal installations (estimate) 5000
Figure 4, -Estimated daily bioc:hemicai oxygen demand to estuary, in pounds per day.
6 WATER QUALITY OF THE POTOMAC RIVER ESTUARY AT WASHINGTON, D.C.
BIOCHEMICAL OXYGEN DEMAND
1 Year May-Sept
0 50 100 I II II I • I I I I
PERCENTAGE OF TIME WATER IS OF CLASS SHOWN
CLASS OF WATER
• A, Excellent
~ B,Good
CJTI] C,Fair
0 D, Poor
BOD (ppm)
< 1.5
1.5-2.0
2.0-3.0
> 3.0
COLIFORM BACTERIA
1 Year May-Sept
PERCENTAGE OF TIME WATER IS OF CLASS SHOWN
COLIFORM (mpn}
< 50
50-500
500-5000
Figure 5. -Pollution index of Potomac River estuary.
RIVERFLOW AND QUALITY CHARACTERISTICS 7
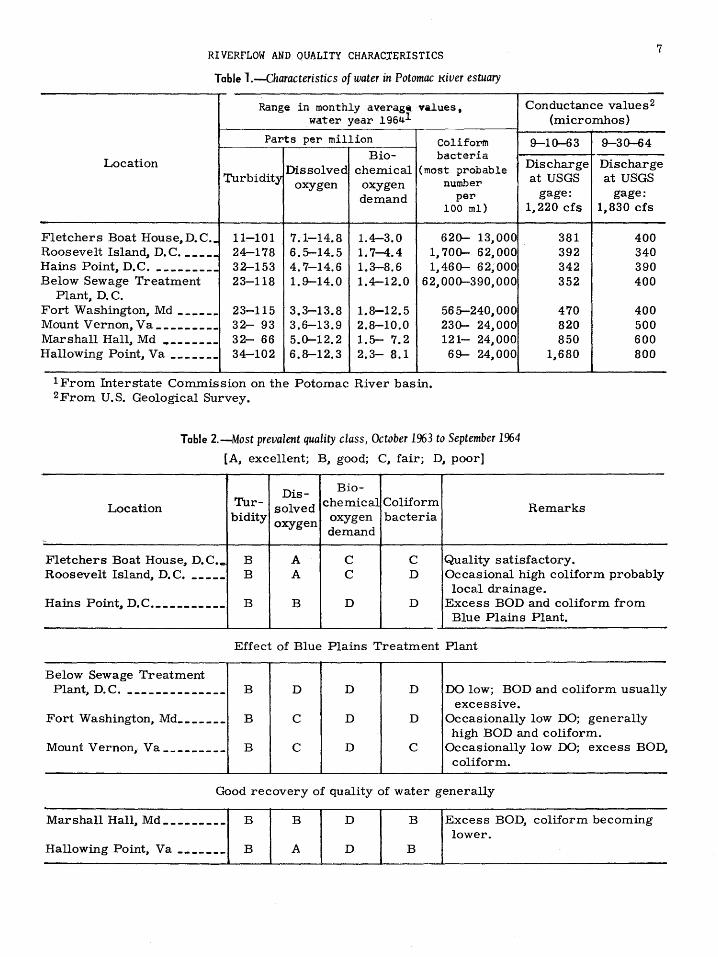
Table 1.-Characteristics of water in Potomac I<.iver estuary
Range in monthly av.erag~ values, Conductance values2 water year 19641 (micromhos)
Parts per million Coliform 9-10-63 9-30-64 bacteria Bio-
Location Dissolved chemical (most probable Discharge Discharge
Turbidity oxygen oxygen number demand per
100 ml)
Fletchers Boat House,D.C .• 11-101 7.1-14.8 1.4-3.0 620- 13,000 Roosevelt Island, D.C.----- 24-178 6.~14.5 1. 7-4.4 1 .. 700- 62 .. 000 Hains Point, D.C. --------- 32-153 4. 7-14.6 1.3-8.6 1,460- 62;000 Below Sewage Treatment 23-118 1.9-14.0 1.4-12.0 62.,000-390,000
Plant .. D.C. Fort Washington, Md ------ 23-115 3.3-13.8 1.8-12.5 56~240.,000
Mount Vernon, Va --------- 32- 93 3,6-13.9 2.8-10.0 230- 24,000 Marshall Hall, Md -------- 32- 66 5.0-12.2 1.5- 7.2 121- 24,000 Hallowing Point., Va ------- 34-102 6.8-12.3 2.3- 8.1 69- 24,000
1 From Interstate Commission on the Potomac River basin. 2From U.S. Geological Survey.
Location
-
Table 2.-Most prevalent quality class, October 1963 to September 1964
[A., excellent; B, good; C., fair; D., poor]
Dis- Bio-Tur- solved chemical Coliform bidity oxygen oxygen bacteria
demand
at USGS gage:
1 .. 220 cfs
381 392 342 352
470 820 850
1.,680
Remarks
Fletchers Boat House, D. C._ B A c c Quality satisfactory.
at USGS gage:
1, 830 cfs
400 340 390 400
400 500 600 800
Roosevelt Island, D.C. ----- B A c D Occasional high coliform probably local drainage.
Hains Point, D.C. __________ B B D D Excess BOD and coliform from Blue Plains Plant.
Effect of Blue Plains Treatment Plant
Below Sewage Treatment Plant, D. C. ___ ----------- B D D D DO low; BOD and coliform usually
excessive. Fort Washington, Md _______ B c D D Occasionally low DO; generally
high BOD and coliform. Mount Vernon .. Va --------- B c D c Occasionally low DO; excess BOD,
coliform.
Good recovery of quality of water generally
Marshall Hall, Md _________ B B D B Excess BOD, coliform becoming lower.
Hallowing Point, Va ------- B A D B
8 WATER QUALITY OF THE POTOMAC RIVER ESTUARY AT WASHINGTON, D.C.
z 0 t= < Ct: ::l 1-
~
80
1- 60 z UJ (.) Ct:
~ z z UJ (!)
~ 40 0 0 UJ
~
~ Ci
20 "' c ·o; il: ., :::J
iii
I
./. <:?q;,0 River discharge into estuary,
cubic feet per second
c 0 E ., > -c :::J 0 ::!'
I
c: ·a (l_
"" c "i .2 ro I
I
0o~----------~5------------~~~o------------~15~----------~2~o------------2~5~----------~3o
DISTANCE, IN MILES DOWNSTREAM FROM CHAIN BRIDGE
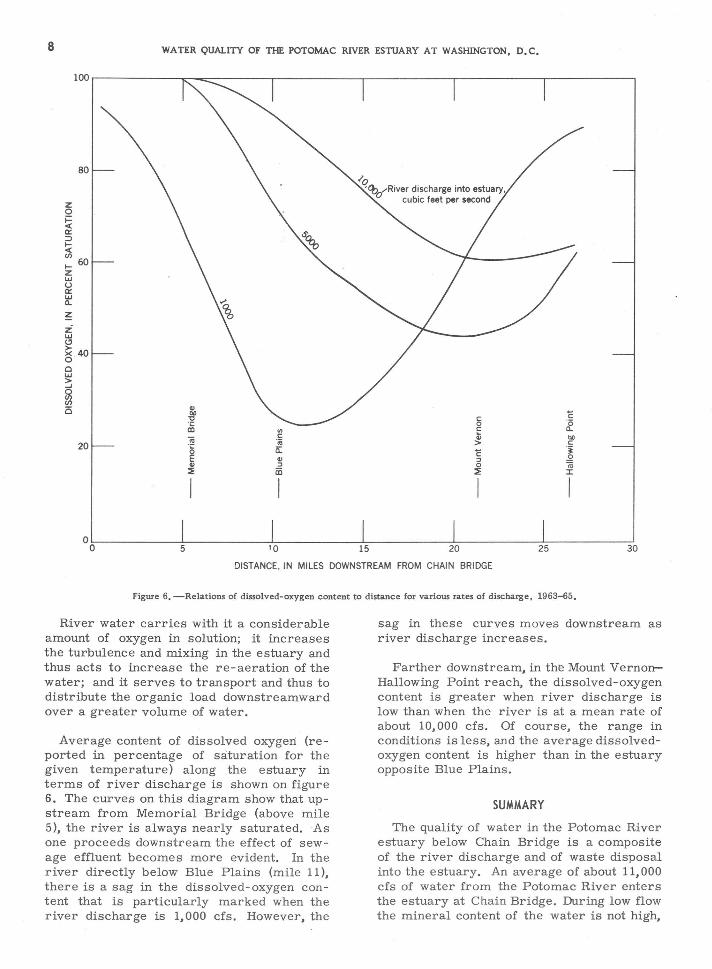
Figure 6. -Relations of dissolved-oxygen content to distance for various rates of discharge, 1963-65.
River water carries with it a considerable amount of oxygen in solution; it increases the turbulence and mixing in the estuary and thus acts to increase the re-aeration of the water; and it serves to transport and thus to distribute the organic load downstreamward over a greater volume of water.
Average content of dissolved oxygen (reported in percentage of saturation for the given temperature) along the estuary in terms of river discharge is shown on figure 6. The curves on this diagram show that upstream from Memorial Bridge (above mile 5), the river is always nearly saturated. ·As one proceeds downstream the effect of sewage effluent becomes more evident. In the river directly below Blue Plains (mile 11), there is a sag in the dissolved-oxygen content that is particularly marked when the river discharge is 1,000 cfs. However, the
sag in these curves moves downstream as river discharge increases.
Farther downstream, in the Mount VernonHallowing Point reach, the dissolved-oxygen content is greater when river discharge is low than when the river is at a mean rate of about 10,000 cfs. Of course, the range in conditions is less, and the average dissolvedoxygen content is higher than in the estuary opposite Blue Plains.
SUMMARY
The quality of water in the Potomac River estuary below Chain Bridge is a composite of the river discharge and of waste disposal into the estuary. An average of about 11,000 cfs of water from the Potomac River enters the estuary at Chain Bridge. During low flow the mineral content of the water is not high,

REFERENCES 9
less than 260 ppm of dissolved solids derived from rocks drained by the river system and residues of wastes discharged to the system.
Nearly 3 million tons of sediment is discharged annually by the Potomac River. Areas in the Washington metropolitan area undergoing urbanization have rates of sediment yield that are 50 times greater than rates in rural areas.
The relative influence of the river and tide in the estuary can be expressed by the ratio Q/(Q+ V /T), where Q is river discharge, V is the volume of intertidal prism, and T is the time of a tidal cycle. At mean discharge, tidal movement exceeds river discharge at a distance of 12 miles below Chain Bridge. Although the ocean tides reach to Chain Bridge, the maximum point of inland movement of salt water is near Fort Washington.
The water in the estuary at Washington is always fresh. The main concerns of water quality are sediment content, biologic character, and dissolved oxygen.
More than 200 million gallons of waste effluent enter the estuary daily. Daily wastes from metropolitan area alone contain an estimated 22,000 pounds of phosphorus and 68,000 pounds of nitrogen. In the upper reaches of the estuary, the water quality is satisfactory for most uses after standard treatment to sterilize, being about the same
as the quality at the metropolitan intake at Little Falls. Downstream, from Chain Bridge to the vicinity of Fort Washington and Mount Vernon, the dissolved oxygen decreases and the bacterial content of the water increases. There is a sag in the dissolved-oxygen content directly below Blue Plains that moves downstream as river discharge increases above 1, 000 cfs.
REFERENCES
Brehemer, Morris, 1964, Nutrients, in Problems of the Potomac Estuary: Interstate Comm. Potomac River Basin Winter Mtg., Arlington, Va., January 1964, Proc., p. 47-50.
Durfor, C. N., 1961, Water quality and hydrology in the Fort Belvoir area, Virginia, 1954-55: U.S. Geol. Survey Water-Supply Paper 1586-A, 57 p.
Interstate Commission on the Potomac River basin, 1964, Potomac River water quality network: 3 5 p.
U.S. Army Corps of Engineers, 1962, Potomac River basin report: U.S. Army Enginear Dist., Baltimore, v. 4, Engineering studies; v. 5, Water supply and water quality control-uses, requirements, and benefits.
Wark, J. W., and Keller, F. J., 1963, Preliminary study of sediment sources and transport in the Potomac River basin: Interstate Comm. Potomac River Basin Tech. Bull. 1963-2, 28 p.