water quality in the halawa, haiku, and kaneohe drainage ... · water quality in the halawa, haiku,...
TRANSCRIPT

Water Quality in the Halawa, Haiku, and Kaneohe Drainage Basins Before, During, and After H-3 Highway Construction, Oahu, Hawaii, 1983–99
Water Quality in the Halawa, Haiku, and Kaneohe Drainage Basins Before, During, and After H-3 Highway Construction, Oahu, Hawaii, 1983–99
Prepared in cooperation with the State of Hawaii Department of Transportation Prepared in cooperation with the State of Hawaii Department of Transportation
U.S. Department of the InteriorU.S. Geological SurveyScientific Investigations Report 2004-5002
U.S. Department of the InteriorU.S. Geological SurveyScientific Investigations Report 2004-5002

About the cover: This vertical aerial color photograph was taken on June 2, 1989, by Air Survey Hawaii. The photograph shows the North Halawa Valley during the early phases of the construction of the H-3 freeway. At the time of this photograph, only the 2-lane paved access road had been con-structed in the valley. The Hawaiian Cement quarry and plant, the H-1 freeway, and the urbanized areas near the mouth of the valley are visible in the lower left.

Water Quality in the Halawa, Haiku, and Kaneohe Drainage Basins Before, During, and After H-3 Highway Construction, Oahu, Hawaii, 1983–99
By Michael F. Wong
Prepared in cooperation with theSTATE OF HAWAII DEPARTMENT OF TRANSPORTATION
Scientific Investigations Report 2004–5002
U.S. Department of the Interior U.S. Geological Survey

U.S. Department of the InteriorGale A. Norton, Secretary
U.S. Geological SurveyCharles G. Groat, Director
U.S. Geological Survey, Reston, Virginia: 2005For sale by U.S. Geological Survey, Information Services Box 25286, Denver Federal Center Denver, CO 80225-0286
For more information about the USGS and its products: Telephone: 1-888-ASK-USGS
World Wide Web: http://www.usgs.gov/
Any use of trade, product, or firm names in this publication is for descriptive purposes only and does not imply endorsement by the U.S. Government.
Although this report is in the public domain, permission must be secured from the individual copyright owners to reproduce any copyrighted materials contained within this report.
Suggested citation Wong, M.F., 2005, Water quality in the Halawa, Haiku, and Kaneohe drainage basins before, during, and after H-3 High-way construction, Oahu, Hawaii, 1983–99: U.S. Geological Survey Scientific Investigations Report 2004–5002, 45 p.

iii
Contents
Abstract . . . . . . . . . . . . . . . . . . . . . . . . . . . . . . . . . . . . . . . . . . . . . . . . . . . . . . . . . . . . . . . . . . . . . . . . . . . 1Introduction . . . . . . . . . . . . . . . . . . . . . . . . . . . . . . . . . . . . . . . . . . . . . . . . . . . . . . . . . . . . . . . . . . . . . . . . 1
Purpose and Scope . . . . . . . . . . . . . . . . . . . . . . . . . . . . . . . . . . . . . . . . . . . . . . . . . . . . . . . . . . . . 1H-3 Highway Construction . . . . . . . . . . . . . . . . . . . . . . . . . . . . . . . . . . . . . . . . . . . . . . . . . . . . . . 4Study Area . . . . . . . . . . . . . . . . . . . . . . . . . . . . . . . . . . . . . . . . . . . . . . . . . . . . . . . . . . . . . . . . . . . . 4Previous Studies . . . . . . . . . . . . . . . . . . . . . . . . . . . . . . . . . . . . . . . . . . . . . . . . . . . . . . . . . . . . . . . 8Acknowledgements . . . . . . . . . . . . . . . . . . . . . . . . . . . . . . . . . . . . . . . . . . . . . . . . . . . . . . . . . . . . 9
Data Collection and Statistical Analysis . . . . . . . . . . . . . . . . . . . . . . . . . . . . . . . . . . . . . . . . . . . . . . . . 9Water-Quality Data Collection . . . . . . . . . . . . . . . . . . . . . . . . . . . . . . . . . . . . . . . . . . . . . . . . . . . 10Statistical Analysis . . . . . . . . . . . . . . . . . . . . . . . . . . . . . . . . . . . . . . . . . . . . . . . . . . . . . . . . . . . . . 12
Water Quality Before, During, and After Highway Construction . . . . . . . . . . . . . . . . . . . . . . . . . . . 13Summary and Conclusions . . . . . . . . . . . . . . . . . . . . . . . . . . . . . . . . . . . . . . . . . . . . . . . . . . . . . . . . . . . 41References Cited . . . . . . . . . . . . . . . . . . . . . . . . . . . . . . . . . . . . . . . . . . . . . . . . . . . . . . . . . . . . . . . . . . . 42
Figures
1. Selected water-quality stations and drainage basins in the H-3 Highway study area, Oahu, Hawaii . . . . . . . . . . . . . . . . . . . . . . . . . . . . . . . . . . . . . . . . . . . . . . . . . . . . . . . . . . . 2
2. Water-quality stations in the Haiku and Kaneohe drainage basins, Oahu, Hawaii . . . . . . . . . . . . . . . . . . . . . . . . . . . . . . . . . . . . . . . . . . . . . . . . . . . . . . . . . . . . 3
3. Flow-duration curves of daily flows for stations 16226200 North Halawa Stream and 16275000 Haiku Stream, 1983–99, Oahu, Hawaii . . . . . . . . . . . . . . . . . . . . . . . . . . . . . . 6
4. Total nitrogen concentrations at station 16267500, February 1983 to January 1998, Oahu, Hawaii . . . . . . . . . . . . . . . . . . . . . . . . . . . . . . . . . . . . . . . . . . . . . . . . . . . . . . . . . . . 16
5. Total nitrogen concentrations and instantaneous discharges at (A) station 16265700, February 1983 to January 1998; and (B) station 16270900, February 1983 to January 1998; and (C) station 16275000, April 1983 to February 1998, Oahu, Hawaii . . . . . . . . . . . . . . . . . . . . . . . . . . . . . . . . . . . . . . . . . . . . . . . . . . . . . . . . . . . 18
6. Nitrite and nitrate nitrogen concentrations and instantaneous discharges at (A) station 16266500, February 1983 to December 1996; and (B) station 16274100, December 1988 to February 1998, Oahu, Hawaii . . . . . . . . . . . . . . . . . . . . . . . . . . . . . 21
7. Turbidity concentrations and instantaneous discharges at station 16265600, February 1983 to April 1998, Oahu, Hawaii . . . . . . . . . . . . . . . . . . . . . . . . . . . . . . . . . . 29
8. Specific conductance at (A) station 16226200, May 1983 to March 1999; (B) station 16269500, February 1983 to January 1998; and (C) station 16227100, November 1988 to November 1998, Oahu, Hawaii . . . . . . . . . . . . . . . . . . . . . . . . . . . . . . . . . . . . . . . . . . . . . 35
iv
Tables
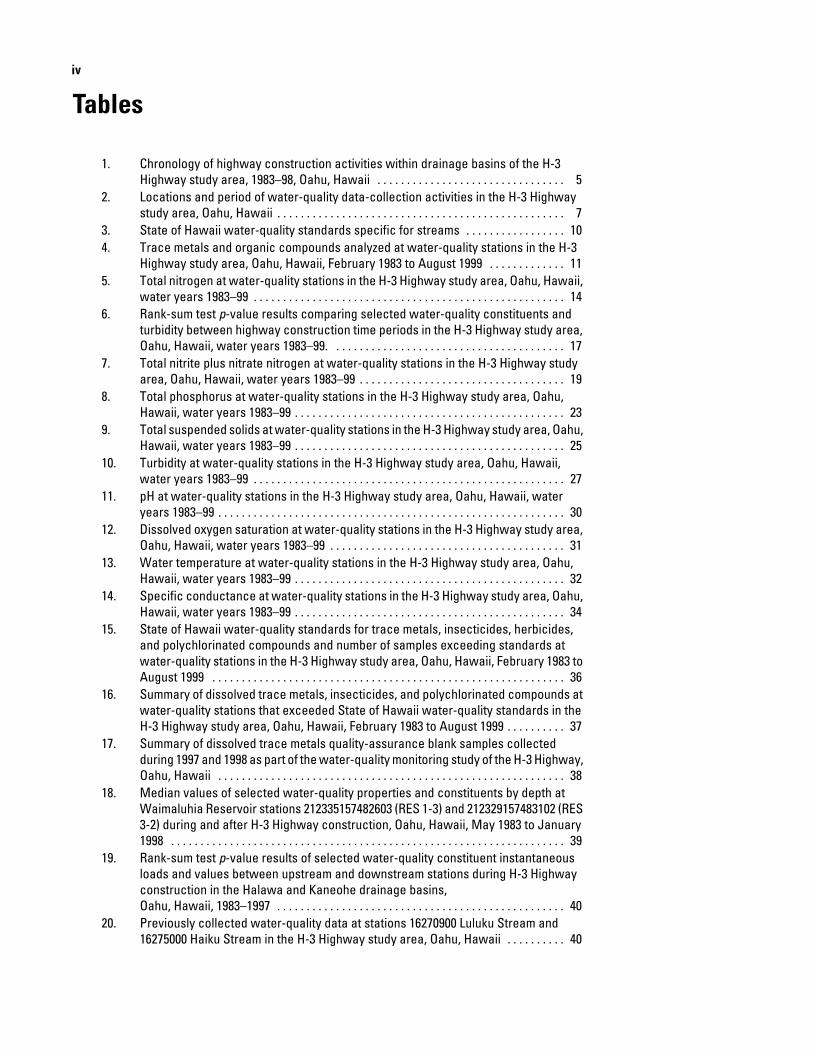
1. Chronology of highway construction activities within drainage basins of the H-3 Highway study area, 1983–98, Oahu, Hawaii . . . . . . . . . . . . . . . . . . . . . . . . . . . . . . . . 5
2. Locations and period of water-quality data-collection activities in the H-3 Highway study area, Oahu, Hawaii . . . . . . . . . . . . . . . . . . . . . . . . . . . . . . . . . . . . . . . . . . . . . . . . . 7
3. State of Hawaii water-quality standards specific for streams . . . . . . . . . . . . . . . . . 104. Trace metals and organic compounds analyzed at water-quality stations in the H-3
Highway study area, Oahu, Hawaii, February 1983 to August 1999 . . . . . . . . . . . . . 115. Total nitrogen at water-quality stations in the H-3 Highway study area, Oahu, Hawaii,
water years 1983–99 . . . . . . . . . . . . . . . . . . . . . . . . . . . . . . . . . . . . . . . . . . . . . . . . . . . . . 146. Rank-sum test p-value results comparing selected water-quality constituents and
turbidity between highway construction time periods in the H-3 Highway study area, Oahu, Hawaii, water years 1983–99. . . . . . . . . . . . . . . . . . . . . . . . . . . . . . . . . . . . . . . . 17
7. Total nitrite plus nitrate nitrogen at water-quality stations in the H-3 Highway study area, Oahu, Hawaii, water years 1983–99 . . . . . . . . . . . . . . . . . . . . . . . . . . . . . . . . . . . 19
8. Total phosphorus at water-quality stations in the H-3 Highway study area, Oahu, Hawaii, water years 1983–99 . . . . . . . . . . . . . . . . . . . . . . . . . . . . . . . . . . . . . . . . . . . . . . 23
9. Total suspended solids at water-quality stations in the H-3 Highway study area, Oahu, Hawaii, water years 1983–99 . . . . . . . . . . . . . . . . . . . . . . . . . . . . . . . . . . . . . . . . . . . . . . 25
10. Turbidity at water-quality stations in the H-3 Highway study area, Oahu, Hawaii, water years 1983–99 . . . . . . . . . . . . . . . . . . . . . . . . . . . . . . . . . . . . . . . . . . . . . . . . . . . . . 27
11. pH at water-quality stations in the H-3 Highway study area, Oahu, Hawaii, water years 1983–99 . . . . . . . . . . . . . . . . . . . . . . . . . . . . . . . . . . . . . . . . . . . . . . . . . . . . . . . . . . . 30
12. Dissolved oxygen saturation at water-quality stations in the H-3 Highway study area, Oahu, Hawaii, water years 1983–99 . . . . . . . . . . . . . . . . . . . . . . . . . . . . . . . . . . . . . . . . 31
13. Water temperature at water-quality stations in the H-3 Highway study area, Oahu, Hawaii, water years 1983–99 . . . . . . . . . . . . . . . . . . . . . . . . . . . . . . . . . . . . . . . . . . . . . . 32
14. Specific conductance at water-quality stations in the H-3 Highway study area, Oahu, Hawaii, water years 1983–99 . . . . . . . . . . . . . . . . . . . . . . . . . . . . . . . . . . . . . . . . . . . . . . 34
15. State of Hawaii water-quality standards for trace metals, insecticides, herbicides, and polychlorinated compounds and number of samples exceeding standards at water-quality stations in the H-3 Highway study area, Oahu, Hawaii, February 1983 to August 1999 . . . . . . . . . . . . . . . . . . . . . . . . . . . . . . . . . . . . . . . . . . . . . . . . . . . . . . . . . . . . 36
16. Summary of dissolved trace metals, insecticides, and polychlorinated compounds at water-quality stations that exceeded State of Hawaii water-quality standards in the H-3 Highway study area, Oahu, Hawaii, February 1983 to August 1999 . . . . . . . . . . 37
17. Summary of dissolved trace metals quality-assurance blank samples collected during 1997 and 1998 as part of the water-quality monitoring study of the H-3 Highway, Oahu, Hawaii . . . . . . . . . . . . . . . . . . . . . . . . . . . . . . . . . . . . . . . . . . . . . . . . . . . . . . . . . . . 38
18. Median values of selected water-quality properties and constituents by depth at Waimaluhia Reservoir stations 212335157482603 (RES 1-3) and 212329157483102 (RES 3-2) during and after H-3 Highway construction, Oahu, Hawaii, May 1983 to January 1998 . . . . . . . . . . . . . . . . . . . . . . . . . . . . . . . . . . . . . . . . . . . . . . . . . . . . . . . . . . . . . . . . . . . 39
19. Rank-sum test p-value results of selected water-quality constituent instantaneous loads and values between upstream and downstream stations during H-3 Highway construction in the Halawa and Kaneohe drainage basins, Oahu, Hawaii, 1983–1997 . . . . . . . . . . . . . . . . . . . . . . . . . . . . . . . . . . . . . . . . . . . . . . . . . 40
20. Previously collected water-quality data at stations 16270900 Luluku Stream and 16275000 Haiku Stream in the H-3 Highway study area, Oahu, Hawaii . . . . . . . . . . 40
v
Conversion Factors and Datums
Multiply By To obtain
Length
inch (in.) 25.4 millimeter (mm)
foot (ft) 0.3048 meter (m)
mile (mi) 1.609 kilometer (km)
Area
acre 4,047 square meter (m2)
square mile (mi2) 2.590 square kilometer (km2)
Volume
acre-foot (acre-ft) 1,233 cubic meter (m3)
Flow rate
cubic foot per second (ft3/s) 0.02832 cubic meter per second (m3/s)
Temperature in degrees Fahrenheit (°F) may be converted to degrees Celsius (°C) as follows:
°C = (°F – 32) / 1.8
Specific conductance is given in microsiemens per centimeter at 25 degrees Celsius (µS/cm at 25°C).
Concentrations of chemical constituents in water are given either in milligrams per liter (mg/L) or micrograms per liter (µg/L).
DatumsAltitude, as used in this report, refers to distance above the vertical datum.Horizontal coordinate information is referenced to the Old Hawaiian Datum unless otherwise specified.

Water Quality in the Halawa, Haiku, and Kaneohe Drainage Basins Before, During, and After H-3 Highway Construction, Oahu, Hawaii, 1983–1999
By Michael F. Wong
Abstract
Selected water-quality data collected before, during, and after construction of the H-3 Highway at 13 water-quality stations were compared to the State of Hawaii Department of Health water-quality standards to determine the effects of highway construction on the water quality of the affected streams. Highway construction had no effect on the high concentrations of total nitrogen and nitrite plus nitrate nitrogen observed except for increased nitrite plus nitrate nitrogen concentrations at one station on Hooleinaiwa Stream. Exceedences of the 10- and 2-percent-of-the-time concentration standards for total phosphorus, total suspended solids, and turbidity, all constituents associated with sediment, occurred more commonly and at more stations during construction than either before or after. These exceedences may be, in part, due to land disturbance caused by highway construction. Highway construction had no effect on the physical water-quality properties of pH, dissolved oxygen, temperature, and specific conductance except at North Halawa and Kuou Streams, where specific-conductance values increased throughout the study period, most likely due to highway construction. No effects on selected trace metals and organic chemical compounds were observed due to highway construction. No effects due to highway construction were observed in the water quality of Waimaluhia Reservoir. Runoff from areas of urban land use in the Kaneohe drainage basin contributed more to the higher loads of selected water-quality constituents than did runoff from areas affected by highway construction.
Introduction
The H-3 Highway is a major highway across the Koolau Range on the eastern part of the island of Oahu, Hawaii (fig. 1). Potential effects of construction, such as soil erosion from land disturbance, runoff from construction staging areas, and stream sedimentation that might degrade the water quality of streams along the route, were an issue of public concern, and
construction began only after a lengthy environmental evaluation (U.S. Department of Transportation and others, 1987). In 1983, the U.S. Geological Survey (USGS), in cooperation with the State of Hawaii Department of Transportation and in collaboration with the Federal Highway Administration, began a study to assess the effects of highway construction on the water quality in the affected streams; specifically to determine whether highway construction resulted in any exceedence of the State of Hawaii water-quality standards. The results of the study also will add information to what is generally known about the effects of highway construction in tropical environments.
Purpose and Scope
The purpose of this report is to describe whether water-quality standards were exceeded before, during, or after construction, and if so, whether the exceedence could be attributed to highway construction. To meet this objective, data collection was carried out before, during, and after construction during 1983–99 at a network of 13 water-quality stations. Twelve of the stations were on streams and one station was in the Waimaluhia Reservoir.
This report describes the Halawa, Haiku, and Kaneohe drainage basins, the methods used for water-quality data collection, and a statistical analysis of water-quality data collected during the 17-year (1983–99) study period. Data were analyzed at 2 stations in the Halawa, 1 in the Haiku, and 10 in the Kaneohe drainage basins (figs. 1 and 2). Additional data from the Waimaluhia Reservoir also were analyzed. Only those constituents that can be compared to the State of Hawaii water-quality standards (State of Hawaii Department of Health, 2000) are described in this report. These and other constituents were previously summarized in two published statistical summaries of data; one covering data collected during water years 1983–89 (Wong and Hill, 1992), and the other during water years 1983–99 (Wong and Young, 2001). A water year is a 12-month period that extends from October 1 to September 30 and is designated by the calendar year in which it ends.

uction
2 Water Quality in the Halawa, Haiku, and Kaneohe Drainage Basins Before, During, and After H-3 Highway ConstrSout
h H
alaw
a St
ream
Halaw
a St
ream
Nor
th H
alaw
a St
ream
Kan
eohe
Str
eam
Eas
t Loc
h
PEAR
L H
ARBOR
KA
NE
OH
E
BA
Y
21˚2
2'
21˚2
6'
157˚
52'
157˚
56'
157˚
48'
0 0
3 M
ILES
2
23
KILO
MET
ERS
1
1
Kan
eohe
Mar
ine
Cor
psB
ase
Haw
aii
H-3
High
way
H-3 Highway
DE
VE
LO
PED
AR
EA
WIT
HIN
STU
DY
BA
SIN
DR
AIN
AG
E D
IVID
E
WA
TE
R-Q
UA
LIT
Y S
TAT
ION
A
ND
NU
MB
ER
TRAN
S-KO
OLAU
TUN
NEL
KOOLA
U
RANGE
EX
PL
AN
AT
ION
Kamehameha Highway H-
1 Hi
ghw
ay
Moa
nalu
a
Free
way
Likel
ike H
ighw
ay
Pali
Hi
ghw
ay
Ford
Isla
nd
1622
6200
1622
6200
1622
7100
HALA
WA
DRAI
NAG
E BA
SIN
Kam
ooal
iiSt
ream
Syst
em
Base
mod
ified
from
U.S
. Geo
logi
cal S
urve
y di
gita
l dat
a,
1:24
,000
, 198
3, A
lber
s eq
ual a
rea
proj
ectio
n,
stan
dard
par
alle
ls 2
1˚19
'40"
and
21˚
38'2
0",
cent
ral m
erid
ian
157˚
58'
Hai
ku
Stre
am
Heeia Stream
22˚
20˚
158˚
156˚
160˚
Kaua
i
Niih
auOa
huM
aui
Mol
okai
Lana
iKa
hool
awe Ha
wai
i
HAW
AII
Hala
wa
Stud
yAr
ea
OA
HU
,H
AW
AII
Paci
ficO
cean
PAC
IFIC
OC
EA
N
Figu
re 1
. Se
lect
ed w
ater
-qua
lity
stat
ions
and
dra
inag
e ba
sins
in th
e H-
3 Hi
ghw
ay s
tudy
are
a, O
ahu,
Haw
aii.

Introduction 3
Base modified from U.S. Geological Survey digital data, 1:24,000, 1983, Albers equal area projection, standard parallels 21˚19'40" and 21˚38'20", central meridian 157˚58'
Kameham
eha Highway
Kaneohe Bay Drive
Trans-KoolauTunnel
Hospital RockTunnel
WindwardViaduct
Ho'omaluhiaBotanical Garden
KoolauGolfCourse
NUUANUVALLEY
KANEOHE
BAY
Kahekili Highway
H-3 Highway
PaliGolf
Course
Hawaii LoaCampus
KaneoheInterchange
HalekouInterchange
KalanianaoleHighway
Right B
ranch
Kam
ooalii Stream
Kam
ooal
ii
Pali Highway
RANGE
KOOLAU
157˚49' 157˚46'30"
21˚25'
21˚22'30"
H-3 Highway
Likelike Highway
Windward Highway
EXPLANATION
DEVELOPED AREA WITHIN STUDY BASIN
DRAINAGE DIVIDE
WATER-QUALITY STATION AND NUMBER
0
0 1 KILOMETER
1 MILE1/2
OAHU,HAWAII
KaneoheStudy Area
PacificOcean
Iolekaa Stream
Heeia
Stream
Stream
Stream
Haiku
Kapunahala
Sout
h Fo
rkK
apun
ahal
a
Stream
Kuou
Pih
o St
ream
Hooleinaiw
a Stream
Kam
ooal
ii S
trea
m
Kaneohe Stream
Luluku Stream
Stream
WaimaluhiaReservoir
16272200
1627410016275000
16275000
16273950
16265600
1626650016265700
16267500
16269500RES 3-2
RES 1-316270900
Figure 2. Water-quality stations in the Haiku and Kaneohe drainage basins, Oahu, Hawaii.

4 Water Quality in the Halawa, Haiku, and Kaneohe Drainage Basins Before, During, and After H-3 Highway Construction
Instantaneous water-quality data used in the analyses in this report have been published in the U.S. Geological Survey’s annual water-resources data reports for Hawaii, water years 1983 through 2000. See, for example, Hill and others (2000) for the water year 1999 report. These data also are available on the World Wide Web at NWISWeb (http://waterdata.usgs.gov/nwis).
H-3 Highway Construction
The H-3 Highway route traverses the drainage basins of Halawa and Haiku Streams and the tributaries of Kaneohe Stream (fig. 1). The H-3 segment that is the subject of this report extends from the H-1 Highway near the East Loch of Pearl Harbor on the leeward (southwestern) side of the Koolau Range to the Halekou Interchange on the windward (northeastern) side, where the H-3 connects to a previously constructed section of H-3 leading from Kamehameha Highway to Kaneohe Marine Corps Base–Hawaii. The completed H-3 Highway consists of part cut-and-fill and part viaduct sections in the lower North Halawa Valley, a viaduct through the upper North Halawa Valley, twin tunnels below the crest of the Koolau Range, a viaduct through the Haiku drainage basin, and a cut-and-fill section through the Kapunahala and Kamooalii drainage subbasins of the Kaneohe drainage basin (U.S. Department of Transportation and others, 1987). Highway construction affected from 3 to 15 percent of the drainage basin areas upstream from the water-quality stations discussed in this report.
Construction of the H-3 Highway proceeded in increments (table 1). Construction was, at times, halted by court actions, and the planned route was modified to avoid sites of cultural importance. The court actions also halted water-quality data collection before construction started. Access roads were built in the North Halawa and Haiku Valleys before construction of the highway. An exploratory tunnel was excavated below the crest of the Koolau Range before the larger traffic tunnels were excavated.
Study Area
The Koolau Range is the eroded remnant of the larger and younger of the two major shield volcanoes that formed the island of Oahu (Hunt, 1996). Much of the windward side of the original Koolau Volcano has been eroded, leaving a steep windward slope indented with short, broad, amphitheater-shaped valleys (Hinds, 1925). In contrast, the gentle leeward slope is deeply dissected by long, roughly linear valleys. Ridges on the leeward side approximate the original morphology of the Koolau volcanic dome (Wentworth, 1943).
Geology of the study area consists primarily of Koolau Basalt that was extruded in numerous gently dipping thin (less than 10 ft) flows of lava that are intruded by near-vertical, dense basaltic dikes near the crest of the present Koolau Range (Hunt, 1996). More recent volcanic rocks are exposed in small
areas on the windward side of the study area (Takasaki and others, 1969). The gently sloping lower parts of the windward drainage basins and the valley floor of the North Halawa drainage basin are overlain by alluvium derived from erosion of the Koolau Range (Takasaki and others, 1969; Izuka, 1992).
The climate of Oahu is warm and humid. Average annual temperature near the study area is about 74°F and monthly averages range from 65°F to 84°F (Owenby and Ezell, 1992). Temperatures above 95°F and below 50°F are rare on Oahu (Blumenstock and Price, 1961). The distribution of rainfall is affected by the prevailing northeasterly trade winds and the topography of the island. Because of the Koolau Range, which has an altitude of 2,000 to 3,000 ft above mean sea level at the crest, there is orographic lifting and cooling of marine air masses moving with the trade winds. This lifting results in heavier and more frequent rainfall on the windward side and near the crest of the Koolau Range. The heaviest rain falls about 0.5 to 1 mi leeward of the crest (Wentworth, 1942; Mink, 1960). Rainfall varies seasonally, with most rain falling from November to April. Median annual rainfall ranges from 60 to 120 in. on the windward side of the study area and from 40 to more than 120 in. on the leeward side (Division of Water and Land Development, 1982). Average annual pan evaporation is between 50 to 70 in. on the windward side and between 30 to 80 in. on the leeward side of the study drainage basins (Ekern and Chang, 1985).
The temporal and spatial distribution of streamflow is determined almost exclusively by geology and climate. Streams on the windward side respond rapidly to direct runoff that takes place during periods of rainfall. Large quantities of rainfall and the presence of numerous low-permeability dikes result in storage of high-elevation ground water that maintains the base flow of streams on the windward side (Takasaki and others, 1969). As a result of the highly permeable bedrock and the orientation of dikes, ground water is known to flow between windward drainage basins. Rainfall infiltrating in one valley may emerge as streamflow in another (Hirashima, 1963, 1971; Takasaki and others, 1969). Streamflow in the Halawa Stream drainage basin is intermittent and is dependent primarily on direct runoff that occurs during rainfall. Most infiltrating rainfall in the North Halawa Valley percolates to the freshwater-lens aquifer and does not maintain base flows in the streams (Izuka, 1992). Streamflow is supplemented by the discharge of small quantities of ground water from alluvial aquifers that extend recession flows only to a minor extent (Izuka, 1992). The contrast between streamflow characteristics in the leeward and windward drainage basins of the study area is shown by using flow-duration curves (fig. 3). A flow-duration curve indicates the percentage of time that values of daily mean streamflow were equaled or exceeded (Searcy, 1959). The steep slope of the North Halawa Stream curve indicates the highly variable nature of streamflow in Halawa Valley, while the flat slope of the Haiku Stream curve indicates the large storage of ground water on the windward side (fig. 3).
Soils in the Halawa drainage basin are classified as low-permeability, very stony clays of the Kaena series with
Introduction 5
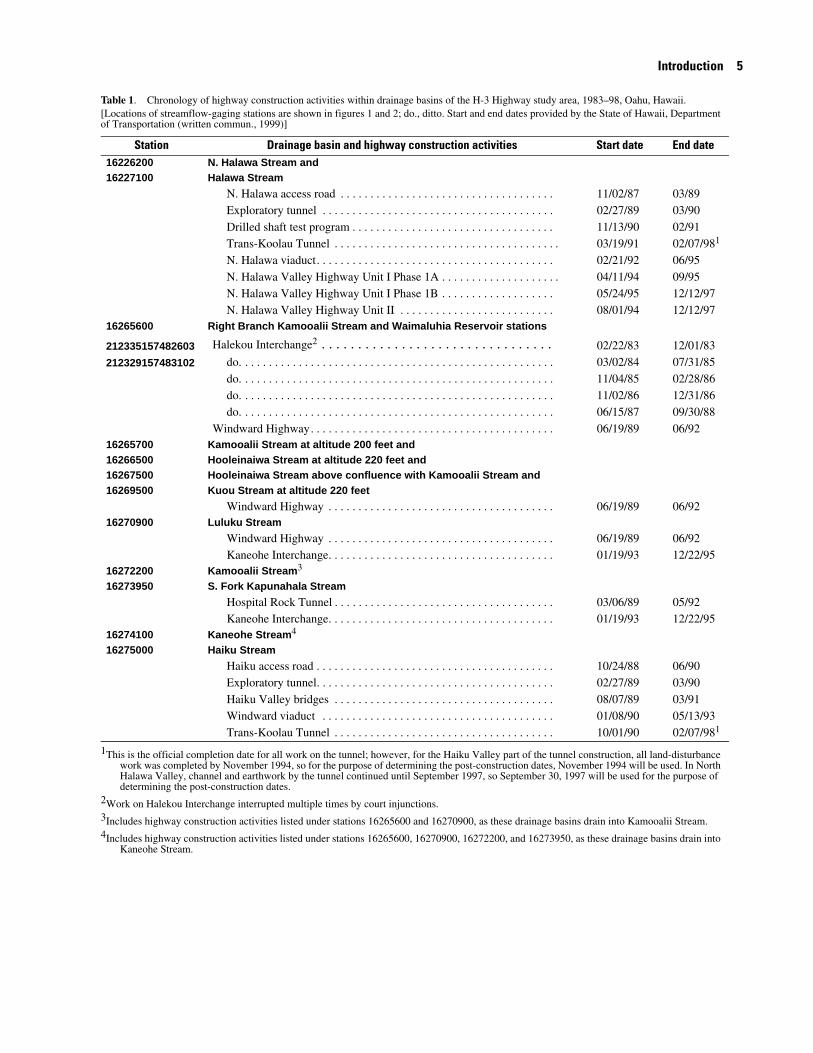
Table 1. Chronology of highway construction activities within drainage basins of the H-3 Highway study area, 1983–98, Oahu, Hawaii.[Locations of streamflow-gaging stations are shown in figures 1 and 2; do., ditto. Start and end dates provided by the State of Hawaii, Department of Transportation (written commun., 1999)]
Station Drainage basin and highway construction activities Start date End date16226200 N. Halawa Stream and 16227100 Halawa Stream
N. Halawa access road . . . . . . . . . . . . . . . . . . . . . . . . . . . . . . . . . . . . 11/02/87 03/89Exploratory tunnel . . . . . . . . . . . . . . . . . . . . . . . . . . . . . . . . . . . . . . . 02/27/89 03/90Drilled shaft test program . . . . . . . . . . . . . . . . . . . . . . . . . . . . . . . . . . 11/13/90 02/91Trans-Koolau Tunnel . . . . . . . . . . . . . . . . . . . . . . . . . . . . . . . . . . . . . . 03/19/91 02/07/981
N. Halawa viaduct. . . . . . . . . . . . . . . . . . . . . . . . . . . . . . . . . . . . . . . . 02/21/92 06/95N. Halawa Valley Highway Unit I Phase 1A . . . . . . . . . . . . . . . . . . . . 04/11/94 09/95N. Halawa Valley Highway Unit I Phase 1B . . . . . . . . . . . . . . . . . . . 05/24/95 12/12/97N. Halawa Valley Highway Unit II . . . . . . . . . . . . . . . . . . . . . . . . . . 08/01/94 12/12/97
16265600 Right Branch Kamooalii Stream and Waimaluhia Reservoir stations
212335157482603 Halekou Interchange2 02/22/83 12/01/83
212329157483102 do. . . . . . . . . . . . . . . . . . . . . . . . . . . . . . . . . . . . . . . . . . . . . . . . . . . . . 03/02/84 07/31/85do. . . . . . . . . . . . . . . . . . . . . . . . . . . . . . . . . . . . . . . . . . . . . . . . . . . . . 11/04/85 02/28/86do. . . . . . . . . . . . . . . . . . . . . . . . . . . . . . . . . . . . . . . . . . . . . . . . . . . . . 11/02/86 12/31/86do. . . . . . . . . . . . . . . . . . . . . . . . . . . . . . . . . . . . . . . . . . . . . . . . . . . . . 06/15/87 09/30/88
Windward Highway. . . . . . . . . . . . . . . . . . . . . . . . . . . . . . . . . . . . . . . . . 06/19/89 06/9216265700 Kamooalii Stream at altitude 200 feet and 16266500 Hooleinaiwa Stream at altitude 220 feet and 16267500 Hooleinaiwa Stream above confluence with Kamooalii Stream and 16269500 Kuou Stream at altitude 220 feet
Windward Highway . . . . . . . . . . . . . . . . . . . . . . . . . . . . . . . . . . . . . . 06/19/89 06/9216270900 Luluku Stream
Windward Highway . . . . . . . . . . . . . . . . . . . . . . . . . . . . . . . . . . . . . . 06/19/89 06/92Kaneohe Interchange. . . . . . . . . . . . . . . . . . . . . . . . . . . . . . . . . . . . . . 01/19/93 12/22/95
16272200 Kamooalii Stream3
16273950 S. Fork Kapunahala StreamHospital Rock Tunnel . . . . . . . . . . . . . . . . . . . . . . . . . . . . . . . . . . . . . 03/06/89 05/92Kaneohe Interchange. . . . . . . . . . . . . . . . . . . . . . . . . . . . . . . . . . . . . . 01/19/93 12/22/95
16274100 Kaneohe Stream4
16275000 Haiku StreamHaiku access road . . . . . . . . . . . . . . . . . . . . . . . . . . . . . . . . . . . . . . . . 10/24/88 06/90Exploratory tunnel. . . . . . . . . . . . . . . . . . . . . . . . . . . . . . . . . . . . . . . . 02/27/89 03/90Haiku Valley bridges . . . . . . . . . . . . . . . . . . . . . . . . . . . . . . . . . . . . . 08/07/89 03/91Windward viaduct . . . . . . . . . . . . . . . . . . . . . . . . . . . . . . . . . . . . . . . 01/08/90 05/13/93Trans-Koolau Tunnel . . . . . . . . . . . . . . . . . . . . . . . . . . . . . . . . . . . . . 10/01/90 02/07/981
1This is the official completion date for all work on the tunnel; however, for the Haiku Valley part of the tunnel construction, all land-disturbance work was completed by November 1994, so for the purpose of determining the post-construction dates, November 1994 will be used. In North Halawa Valley, channel and earthwork by the tunnel continued until September 1997, so September 30, 1997 will be used for the purpose of determining the post-construction dates.
2Work on Halekou Interchange interrupted multiple times by court injunctions.3Includes highway construction activities listed under stations 16265600 and 16270900, as these drainage basins drain into Kamooalii Stream.4Includes highway construction activities listed under stations 16265600, 16270900, 16272200, and 16273950, as these drainage basins drain into
Kaneohe Stream.
. . . . . . . . . . . . . . . . . . . . . . . . . . . . . . . .

6 Water Quality in the H H-3 Highway Construction
0.01
0.1
1
10
100
1000
0 10 20 30 40 50 60 70 80 90 100
PERCENTAGE OF TIME INDICATED DISCHARGE WAS EQUALLED OR EXCEEDED
DISC
HARG
E, IN
CUB
IC F
EET
PER
SECO
ND
Haiku Stream
North Halawa Stream
alawa, Haiku, and Kaneohe Drainage Basins Before, During, and After
Figure 3. Flow-duration curves of daily flows for stations 16226200 North Halawa Stream and 16275000 Haiku Stream, 1983–99, Oahu, Hawaii.
Kawaihapai clay loam soils by the mouth of Halawa Stream (Foote and others, 1972). Soils in the Haiku and Kaneohe drainage basins are classified as Lokelaa with some Kaneohe and Hanalei series silty clays. These types of silty clays have moderate permeability and are highly erodible on steep slopes (Foote and others, 1972). Most of the mountainous areas within all the study drainage basins are classified as "rough mountainous land," "rock land," or "rock outcrop" (Foote and others, 1972), and little information is available on the soils of these areas.
Except where disturbed by development (figs. 1 and 2), all study basins are completely covered with some type of vegetation. Most of the native vegetation on the windward side of the study area has been replaced by cultivated crops such as bananas, other nonnative plants, and residential and commercial developments. Much of the Luluku subdrainage basin (fig. 2, station 16270900) has been converted to banana plantations. Vegetation in the North Halawa Valley is representative of undisturbed forest in the leeward Koolau Range and includes native and introduced species.
Eight-digit station numbers are used throughout the report to refer to locations of data collection and their corresponding drainage basins. Stations with 15 digit station numbers are referred to by their names. Table 2 lists station numbers and their corresponding station names, drainage areas, locations, and periods of water-quality data collection. Water-quality
data collection continues (2004) at station 16226200, and data through July 2000 was used in this report.
Halawa Drainage Basin.—The Halawa drainage basin is on the leeward side of the crest of the Koolau Range and has a drainage area of 8.90 mi2 upstream from station 16227100. Halawa Stream flows into the East Loch of Pearl Harbor and originates at the confluence of North and South Halawa Streams, downstream from Moanalua Freeway (fig. 1). Data collection in the Halawa drainage basin was concentrated in the North Halawa Stream valley. For this study, the water-quality data collected at station 16227100 on Halawa Stream (fig. 1) were the only data collected in the Halawa drainage basin outside of North Halawa Valley. Between stations 16227100 and 16226200, the land is developed and consists of a light industrial park near the mouths of both North and South Halawa Streams and residential areas near the Moanalua Freeway and H-1 Highway. The H-3 Highway composes about 3 percent of the drainage area upstream from station 16227100 and about 4 percent of the North Halawa 4.01-mi2 drainage area upstream from station 16226200.
Before highway construction in the North Halawa Stream valley began in November 1987, this drainage basin was undeveloped, but the lower valley was used for agriculture from 1850 to 1947 (Spear, 1990). The stream is more than 100 ft above the freshwater-lens water table throughout the valley and flow in the main channel is intermittent in most

Introduction 7
Table 2. Locations and period of water-quality data-collection activities in the H-3 Highway study area, Oahu, Hawaii.[mi2, square miles; ft, feet; Str, stream; P, data collection continues at present, 2004]
USGS stationnumber
Drainage area(mi2)
Altitude of station
(ft)
LocationPeriod of
water-quality data
Station name Latitude Longitude Start End
Halawa drainage basin16227100 Halawa Str below H-1 8.90 20 21°22′17″ 157°55′57″ Nov 1988 Nov 1998
N. Halawa subdrainage basin16226200 North Halawa Str near Honolulu 4.01 160 21°23′04″ 157°54′22″ May 1983 P
Haiku drainage basin16275000 Haiku Str 0.97 272 21°24′46″ 157°49′33″ Mar 1983 Apr 1998
Kaneohe drainage basin16274100 Kaneohe Str 5.22 40 21°24′54″ 157°48′03″ Nov 1988 Aug 1999
South Fork Kapunahala subdrainage basin16273950 South Fork Kapunahala Str 0.40 111 21°24′21″ 157°48′31″ Aug 1983 Apr 1998
Kamooalii subdrainage basin16265600 Right Branch Kamooalii Str 1.11 195 21°23′22″ 157°47′44″ Feb 1983 Jan 1998
16265700 Kamooalii Str at altitude 200 ft 0.46 200 21°23′11″ 157°47′56″ Feb 1983 Jan 1998
16266500 Hooleinaiwa Str at altitude 220 ft 0.41 220 21°23′06″ 157°48′16″ Feb 1983 Feb 1997
16267500 Hooleinaiwa Str above conflu-ence with Kamooalii Str
0.57 180 21°23′15″ 157°48′19″ Feb 1983 Jan 1998
16269500 Kuou Str at altitude 220 ft 0.34 220 21°23′30″ 157°48′45″ Feb 1983 Jan 1998
212335157482603 RES 1-3 (Waimaluhia Reservoir) 3.20 160 21°23′35″ 157°48′26″ May 1983 Jan 1998
212329157483102 RES 3-2 (Waimaluhia Reservoir) 3.20 160 21°23′29″ 157°48′31″ May 1983 Jan 1998
16270900 Luluku Str 0.44 220 21°23′42″ 157°48′44″ Feb 1983 Apr 1998
16272200 Kamooalii Str 3.81 116 21°23′47″ 157°48′23″ Oct 1980 Apr 1998
years (Izuka, 1992). About 20 percent of the stream channel was channelized during the highway construction.
Haiku Drainage Basin.—The Haiku drainage basin (fig. 2) is on the windward side of the Koolau Range and adjoins the Halawa drainage basin along the crest of the Koolau Range (fig. 2). At station 16275000, Haiku Stream flows perennially. Almost all of the 0.97-mi2 drainage basin upstream from station 16275000 was undeveloped except for a road and large building that was part of a U.S. Coast Guard low-frequency radio navigational facility. This station was operated from 1944 to September 30, 1997. The main land-use impact of the station was an array of radio antenna wires suspended over the valley, anchored from the ridge crests. A municipal water-supply tunnel and well also are located in the valley. Highway construction in the Haiku drainage basin began in October 1988 (table 1). The part of the H-3 Highway located within the Haiku drainage basin was constructed entirely as a viaduct and covers about 3 percent of the drainage area upstream from station 16275000.
Kaneohe Drainage Basin.—The Kaneohe drainage basin (fig. 2) is on the windward side of the Koolau Range, south of the Haiku drainage basin, and has an area of 5.22 mi2 upstream from station 16274100. Kaneohe Stream flows into Kaneohe Bay downstream from the confluence of Kapunahala and Kamooalii Streams, which join to form Kaneohe Stream near
Kamehameha Highway (fig. 2). Data collection in the study basin was concentrated in the Kapunahala and Kamooalii subdrainage basins. The water-quality data collected at station 16274100 on Kaneohe Stream (fig. 2) were the only data collected in the Kaneohe drainage basin outside of these two subbasins. Land use upstream from station 16274100 and downstream from stations 16272200 and 16273950 consists entirely of residential and urban areas of Kaneohe town. H-3 Highway construction affected about 3 percent of the drainage area upstream from station 16274100.
In the Kapunahala subdrainage basin, only the South Fork of Kapunahala Stream was monitored during the study. The South Fork Kapunahala subdrainage basin lies to the southeast of the Haiku drainage basin and has a drainage area of 0.40 mi2
upstream from station 16273950, located at an altitude of 111 ft (fig. 2). The subdrainage basin consists of residential and some agricultural lands in the lower parts of the basin. H-3 Highway construction in the basin began in March 1989 (table 1), with most construction activities occurring near the 400-ft altitude. The H-3 Highway covers about 15 percent of the drainage area upstream from station 16273950. Drainage patterns to station 16273950 from the existing Likelike Highway were altered during the H-3 Highway construction.
The Kamooalii sub-drainage basin upstream from station 16272200, at an altitude of 116 ft, has a drainage area of

8 Water Quality in the Halawa, Haiku, and Kaneohe Drainage Basins Before, During, and After H-3 Highway Construction
3.81 mi2 (fig. 2). Highway construction within the Kamooalii subdrainage basin began in 1983 (table 1) with the construction of the Halekou Interchange upstream from station 16265600 on the right branch of Kamooalii Stream (fig. 2). Numerous court injunctions delayed the construction at various times (table 1). Construction of the Windward Highway segment of the H-3 Highway (the section between the Halekou and Kaneohe Interchanges), which affects most of the basin, began in the summer of 1989 and ended in the summer of 1992 (table 1). Most of the highway segments in the Kamooalii subdrainage basin were constructed using cut-and-fill techniques. The H-3 Highway composes about 4 percent of the drainage area upstream from station 16272200.
In addition to station 16272200, water-quality data were collected in the Kamooalii subdrainage basin at stations 16265600 Right Branch Kamooalii Stream, 16265700 Kamooalii Stream at altitude 200 ft, 16266500 Hooleinaiwa Stream at altitude 220 ft, 16267500 Hooleinaiwa Stream above confluence with Kamooalii Stream, 16269500 Kuou Stream at altitude 220 ft, and at station 16270900 Luluku Stream (fig. 2). Streamflow at all stations except 16269500 is perennial. Kuou Stream at station 16296500 was observed to be dry numerous times during the study period. Streamflow at station 16272200 includes water that has flowed through Waimaluhia Reservoir, a flood-control reservoir completed in 1981 upstream from the confluence of Luluku and Kamooalii Streams. Water from Luluku Stream does not flow through the Waimaluhia Reservoir. The reservoir consists of a 26-acre permanent pool with a capacity of 209 acre-ft in 1998 (Wong, 2001). Mean depth is about 8 ft with depths up to 16 ft. The area affected by the H-3 Highway construction includes about 4 percent of the drainage area at station 16266500, about 5 percent of the drainage areas at stations 16265600, 16265700, 16269500, and 16270900; and about 6 percent of the drainage area at station 16265700.
Land use upstream from station 16272200 includes the Hoomaluhia Botanical Garden, a public park operated by the City and County of Honolulu (fig. 2), which includes the Waimaluhia Reservoir. Stations 16265700, 16266500, 16267500, 16269500, and 16270900 all are within the park boundaries. Downstream from the botanical garden, most of the drainage basin has been developed for residential use. Upstream from the botanical garden to the east and southeast is the Pali Golf Course, built in 1957; the Koolau Golf Course built between 1989 and 1991; and the Hawaii Loa campus of Hawaii Pacific University (fig. 2). Both the Pali Golf course and the Hawaii Loa campus are upstream from station 16265600. The Koolau Golf Course is upstream from stations 16265600, 16265700, 16266500, and 16267500. The remaining land area in the Kamooalii drainage basin is banana plantations, which covers about 40 percent of the area upstream from station 16270900, or undeveloped land. Parts of both Likelike and Pali Highways cross the drainage basin near the Koolau Range (fig. 2). More information on the land use and land cover in the Kamooalii drainage area can be found in Wong (2001).
Previous Studies
Except for studies of suspended sediment (Hill, 1996; Wong and Yeatts, 2002), no previous studies of water-quality effects of highway construction are known for Oahu or other similar central Pacific Islands. Investigations from the continental United States on the effects of highway construction on water quality (Parizek, 1971; Barrett and others, 1993) have detected increases in suspended solids and turbidity due to increased soil erosion caused by highway-construction activities. Once highway construction was completed, suspended-solids and turbidity values returned to ambient levels (Barrett and others, 1993). Other water-quality constituents such as nutrients, bacteria, oxygen demand, trace metals, and oil and grease monitored in these studies did not significantly change during highway construction (Barrett and others, 1993, 1995).
Previous studies on stream water quality in the H-3 Highway study area were done in the Kaneohe and Haiku Stream drainage area. The Kaneohe drainage area studies were done to determine the water-quality effects of urban Kaneohe town on Kaneohe Bay or the effects of constructing the Waimaluhia Reservoir, and included sampling at some stream sites that also were sampled as part of this study. Quan and others (1970) sampled for bacteria and nutrients in Kaneohe Stream, downstream from station 16274100, from February to April 1968. Cox and others (1973) collected samples for pH, nutrients, dissolved oxygen, and oxygen demand from September 1968 to April 1969 from Kamooalii Stream near currently discontinued station 16273900 (which was located on Kamooalii Stream about 50 ft upstream from the confluence with Kapunahala Stream) and from Haiku Stream at station 16275000. Cox and others (1973) concluded that total nitrogen concentrations in streams were greater than the State of Hawaii water-quality standards for coastal waters, and that sewage sources had the greatest effect on nutrient loading to Kaneohe Bay. As part of studies supporting the environmental impact statement for the Waimaluhia Reservoir, the U.S. Army Corps of Engineers (1975) collected biweekly samples for pH, dissolved oxygen, turbidity, nutrients, and fecal coliform at sites on Kamooalii Stream near station 16272200 and discontinued station 16273900 and on Kaneohe Stream downstream from station 16274100 from February 1972 to February 1973. Dugan (1977) collected monthly samples for nutrients from February 1974 to February 1975 at stations 16270900 and 16274100. Dugan (1977) also sampled for nutrients and turbidity of storm runoff at discontinued station 16273900 from November 1974 to March 1975. Dugan (1977) concluded that constituent concentrations were related to flow and not the time phase of the storm runoff, with increasing concentrations with increasing flow. Finally, AECOS, Inc. (1981), sampled for turbidity and nutrients upstream and downstream (near station 16272200) from the Waimaluhia Reservoir construction site during 1977–81.
Because of changes in land use in the upper Kaneohe drainage basin, especially the construction of the Hoomaluhia

Data Collection and Statistical Analysis 9
botanical garden and Waimaluhia Reservoir during 1976–81, direct comparison of water-quality data from this study with data collected prior to 1981 for Kamooalii and Kaneohe Streams to detect changes associated with construction of the H-3 Highway cannot be made. Comparisons with previous data from stations 16270900 and 16275000, however, can be made because the only land-use change of significance in these basins during the time interval between studies is the construction of the H-3 Highway. More recent water-quality data were collected at station 16274100 by Brasher and Anthony (2000), who sampled for organochlorine pesticides in fish tissue and bed sediments in 1998. In the Haiku drainage area, Izuka and others (1993) sampled for polychlorinated biphenyls (PCBs) in Haiku Stream as part of a study on PCB transport.
The USGS collected water-quality data at some study stations in the past. These data include measurements of physical properties such as pH, temperature, and specific conductance and samples for major ions, except at station 16275000, where additional samples for nitrite plus nitrate nitrogen (NO2+NO3) were collected (Matsuoka, 1983). Data from sites along Kamooalii Stream were collected during 1967–75 and 1967–77 at discontinued stations 16270500 (which was located downstream from Waimaluhia Reservoir but upstream from Luluku Stream) and 16273900, and during 1977–79 at station 16272200. Data also were collected at stations 16270900 and 16275000 during 1970–76 and 1970–77. Because of the occurrence of multiple land-use changes in most basins, only data from stations 16270900 and 16275000 can be used for comparison with current data to detect changes associated with construction of the H-3 Highway.
A statistical summary of hydrologic and water-quality data collected by the USGS in the H-3 Highway study area during water years 1983–89 was presented in Wong and Hill (1992). Wong and Young (2001) presented an updated statistical summary of hydrologic and water-quality data through water year 1999. These summary reports presented annual rainfall, streamflow, suspended-sediment loads, particle size, and concentrations, and water-quality data from streamflow and suspended-sediment gaging stations in the H-3 Highway study area.
Acknowledgements
The author gratefully acknowledges Harold Sexton, George Dayag, and Frank Romualdo, retired U.S. Geological Survey employees, for their assistance with data collection. The staff at the Hoomaluhia Botanical Garden, Department of Parks and Recreation, City and County of Honolulu, provided access to Waimaluhia Reservoir and boats used for field data collection. Start and end dates for construction activities were provided by Dennis Higa, Earl Kobataki, and Emilio Barroga, Jr. of the State of Hawaii Department of Transportation.
Data Collection and Statistical Analysis
To determine whether the State of Hawaii water-quality standards were exceeded before, during, or after construction of H-3 Highway, sample data from each time period were compared to the standards. In cases where the standards were exceeded during construction, sample data were compared between time periods by simple statistical tests. The results of these comparisons were used to determine if any exceedence of the standards could be attributed to highway construction. Additional comparisons were made between upstream and downstream locations and with previous water-quality data collected at selected stations.
The State of Hawaii water-quality standards specific to streams are presented in table 3 (State of Hawaii Department of Health, 2000). The standards use the geometric mean for selected constituents (table 3). The geometric mean is computed by taking the logarithms of the data set, determining the mean of the logarithms, and then back transforming the mean of the logarithms to the original units. Geometric means are used to reduce the effects of outliers on the mean value of a data set. The geometric mean is an estimate of the median when the logarithms of the data are symmetric. Additional properties of the geometric mean as used for water-quality standards can be found in Landwehr (1978). Natural (base e) logarithms were used throughout this report. Data from Waimaluhia Reservoir station RES 1-3, were compared to these stream standards (table 3), although they are not applicable to lakes and reservoirs. The State of Hawaii does not have similar standards for lakes and reservoirs.
The State of Hawaii water-quality standards also include concentration values that should not be exceeded more than 10- and 2-percent-of-the-time (table 3). Values to compare to these exceedence criteria were computed as the 90th and 98th percentiles, which are equivalent to the 10- and 2-percent exceedence. Percentiles were computed by assuming no statistical distribution and by using only the instantaneous water-quality data collected. Each sample was assumed to represent an equal period of time. Percentiles were computed by ranking the data from lowest to highest in value and then dividing the rank by the total number of samples (Iman and Conover, 1983). Values for the 90th and 98th percentiles were interpolated when necessary because of sample size between the given percentages assigned to each data point. Percentiles were only computed when sample size was greater than five values.
The State of Hawaii water-quality standards for physical properties—pH, temperature, dissolved oxygen, and specific conductance—are given as numeric values or ranges not to be exceeded (table 3). The standard for specific conductance is listed in units of micromhos per centimeter. During this study, specific conductance was measured in units of microsiemens

10 Water Quality in the Halawa, Haiku, and Kaneohe Drainage Basins Before, During, and After H-3 Highway Construction
Table 3. State of Hawaii water-quality standards specific for streams.[mg/L, milligrams per liter; NTU, Nephelometric Turbidity Unit; standards listed in Hawaii Administrative Rules, Title 11, Chapter 54, Section 5.2, dated April 4, 2000; wet season is from November 1 to April 30 and dry season is from May 1 to October 31; ambient conditions are conditions that would occur in the receiving waters if these waters were not influenced by the proposed new human activity]
Property or constituent Season
Geometric mean not to exceed the given
value
Not to exceed the given value more than 10 percent of the
time
Not to exceed the given value more than 2
percent of the timeTotal nitrogen (mg/L as N) wet 0.25 0.52 0.80
dry 0.18 0.38 0.60Nitrite plus nitrate nitrogen wet 0.07 0.18 0.30(mg/L as N) dry 0.03 0.09 0.17Total phosphorus (mg/L as P) wet 0.05 0.10 0.15
dry 0.03 0.06 0.08Total suspended solids (mg/L) wet 20 50 80
dry 10 30 55Turbidity (NTU) wet 5.0 15.0 25.0
dry 2.0 5.5 10.0pH units Shall not deviate more than 0.5 units from ambient conditions and shall not be lower than
5.5 nor higher than 8.0Dissolved oxygen Not less than 80 percent saturation, determined as a function of ambient water temperature
and barometric pressureTemperature Shall not vary more than 1 degree Celsius from ambient conditionsSpecific conductance Not more than 300 micromhos per centimeter
per centimeter. Both of these units are numerically equivalent (Hem, 1985).
The final aspect of the State of Hawaii water-quality standards, called basic standards, are standards for trace metals and organic chemical compounds that are applicable to all surface waters, fresh and salt, in the State. These standards list numeric values for acute and chronic conditions that are not to be exceeded (State of Hawaii Department of Health, 2000). Table 4 lists the trace metals and organic compounds that were analyzed during this study. Only those constituents with State water-quality standards were further analyzed for this report.
Water-Quality Data Collection
Water-quality measurements and samples were collected at the following 12 stream- water-quality stations: 16226200, 16227100, 16265600, 16265700, 16266500, 16267500, 16269500, 16270900, 16272200, 16273950, 16274100, and 16275000 (table 2), and at various depths at 2 sites in Waimaluhia Reservoir (figs. 1 and 2). Measurements of physical properties such as streamflow, water temperature, specific conductance, pH, and dissolved oxygen were made in the field. In addition, samples were collected and subsequently analyzed for inorganic constituents such as turbidity, total suspended solids, major ions, nutrients, and trace metals; biological constituents such as fecal coliform bacteria; and organic constituents such as total organic carbon, oil and grease, pesticides, and polychlorinated compounds. All field measurements and samples for chemical constituent analyses were collected, processed, and treated according to guidelines
in Ward and Harr (1990), Sylvester and others (1990), and Shelton (1994). Direct measurements of streamflow were made using standard practices for current-meter measurements (Rantz and others, 1982).
Stream-sample collection was done using an equal-width increment method when flow conditions (stream widths greater than 3 ft and depths greater than 0.5 ft) permitted. Otherwise, dip samples were collected at the centroid of streamflow. Inorganic samples were collected using a DH–81 sampler with 1-L polyethylene bottles when depths were greater than 0.5 ft. An open-mouth polyethylene bottle was used to collect samples from shallower depths. A churn splitter (Ward and Harr, 1990) was used to composite and split all inorganic samples. Samples for fecal coliform bacteria and organic constituents were collected directly into sterile (bacteria) or baked (organic) glass containers by dip sampling at the centroid of streamflow.
Samples from Waimaluhia Reservoir were collected using a modified vertical configuration Van Dorn sampler until 1995; after which, a standard horizontal configuration Van Dorn sampler was used (Ward and Harr, 1990). Reservoir measurements for physical properties and sampling for turbidity, total suspended solids, nutrients, and fecal coliform bacteria were done by depth at RES 1-3 and 3-2 (fig. 2). In addition, at RES 1-3, the primary reservoir sampling site, samples were collected at various depths and then composited for analysis of major ions, trace metal, and organic constituents. All other samples, except those for major ions and trace metals, were collected directly into sample bottles using the Van Dorn sampler. Major-ion and trace-metal

Data Collection and Statistical Analysis 11
Table 4. Trace metals and organic compounds analyzed at water-quality stations in the H-3 Highway study area, Oahu, Hawaii, February 1983 to August 1999.[µg/L, microgram per liter; *, State of Hawaii water-quality standard exists for this constituent; diss., dissolved]
Trace metal constituent
Original minimum reporting level
(µg/L)
Revised minimum reporting level, December 1997
(µg/L) Organic constituent
Minimumreporting level
(µg/L)
Aluminum, total and diss.* 28 total, 10 diss. 28 total, 10 diss. Aldrin * 0.01Arsenic, total and diss.* 1 1 Chlordane * 0.1Barium, total and diss. 100 total, 2 diss. 1 total, 2 diss. Chlorpyrifos * 0.01Beryllium, total and diss.* 10 total, 0.5 diss. 5 total, 1 diss. DDD 0.01Cadmium, total and diss.* 1 1 total, 8 diss. DDE * 0.01Chromium, total and diss.* 1 1 total, 14 diss. DDT * 0.01Cobalt, total and diss. 1 total, 3 diss. 1 total, 12 diss. DEF 0.01Copper, total and diss.* 1 1 total, 10 diss. Diazinon 0.01Iron, total and diss. 10 total, 3 diss. 14 total, 10 diss. Dieldrin * 0.01Lead, total and diss.* 1 1 total, 100 diss. Disulfoton 0.01Lithium, total and diss. 10 total, 4 diss. 10 total, 4 diss. Endosulfan-alpha * 0.01Manganese, total and diss. 1 3 total, 4 diss. Endrin * 0.01Mercury, total and diss.* 0.1 0.1 Ethion 0.01Molybdenum, total and diss. 1 total, 10 diss. 1 total, 60 diss. Fonofos 0.01Nickel, total and diss.* 1 1 total, 40 diss. Heptachlor * 0.01Selenium, total and diss.* 1 1 Heptachlor epoxide 0.01Silver, total and diss.* 1 1 total, 4 diss. Lindane * 0.01Strontium, diss. 0.5 1 Malathion * 0.01Vanadium, diss. 6 10 Methyl-Parathion 0.01Zinc, total and diss.* 10 total, 3 diss. 40 total, 20 diss. Methoxychlor * 0.01
Mirex * 0.01Parathion * 0.01Perthane 0.1Phorate 0.01PCB * 0.1PCN 0.1Toxaphene * 1Trithion
(carbophenothion)0.01
2,4-D * 0.012,4-DP (dichlorprop) 0.012,4,5-T 0.01Silvex (2,4,5-TP) 0.01
samples were composited in a churn splitter. The composite for organic constituents at RES 1-3 was done by filling part of each organic sample bottle from samples collected at the various depths in equal proportions based on the number of different depths sampled. Measurements for only physical properties (pH, dissolved oxygen, temperature, specific conductance) were done by depth at 10 other reservoir sites, although these data are not summarized in this report.
Water-quality samples at stream sites were collected, on average, 10 times per year. Sampling dates were equally divided between wet (October to April) and dry (May to September) seasons. Measurements of streamflow, water temperature, specific conductance, pH, and dissolved oxygen and samples for turbidity and total suspended solids were
collected for all 10 of the sampling dates during a water year. Samples for nutrients and fecal coliform bacteria were collected during 4 of the 10 sampling dates, approximately quarterly, twice during the wet season and twice during the dry season. Samples for major ions, trace metals, and organic constituents were collected during 2 of the 10 sampling dates, approximately semiannually, once during the wet season and once during the dry season. At Waimaluhia Reservoir, measurements of water temperature, specific conductance, pH, and dissolved oxygen and samples for turbidity, nutrients, and fecal coliform bacteria were collected four times per year, approximately quarterly; and samples for major ions, trace metals, and organic constituents were collected during two of
12 Water Quality in the Halawa, Haiku, and Kaneohe Drainage Basins Before, During, and After H-3 Highway Construction
the four sampling dates, approximately semiannually. Sample dates were not always equally spaced in time.
Samples for major ions, nutrients, and trace metals that were required to be filtered prior to laboratory analysis were filtered at the field site using a 0.45-µm pore-size plate filter prior to water year 1995. Starting in water year 1995, a 0.45-µm pore-size capsule filter was used and sample filtering was done in the office following the filtering protocol in Horowitz and others (1994). Sample filtering for nutrient samples on sampling dates when only the nutrient samples required filtering continued to be filtered at the field site.
Starting in water year 1995, samples for inorganic constituents such as major ions, nutrients, and trace metals were collected and processed using the part per billion protocol in Horowitz and others (1994). This protocol uses cleaner techniques than previous methods and provides for accurate, quality-assured, inorganic data at lower concentration levels. Beginning in water year 1997, because of the use of the part per billion protocol, quality-assurance field-blank samples for trace metals were processed twice a year. Prior to water year 1997, no field quality-assurance samples were collected. All personnel responsible for field data collection participated annually in the USGS National Field Quality Assurance (NFQA) Program during the study period (Stanley and others, 1998). The NFQA Program checks the proficiency of personnel making pH and specific-conductance measurements.
Samples for trace-metal analysis were preserved with nonultrapure nitric acid until water year 1995, when the use of ultrapure nitric acid was started. Prior to October 1994, samples for nutrient analyses were preserved with mercuric chloride and then chilled to 4oC. After October 1994, nutrient samples were preserved only by chilling (U.S. Geological Survey, 1994). Starting in January 1999, nutrient samples for total ammonia and organic nitrogen and total phosphorus were preserved with sulfuric acid and then chilled (U.S. Geological Survey, 1998b). Only data collection at stations 16226200 and 16274100 were affected by this change because data collection ended at all the other stations prior to January 1999 (table 2).
The methods used for the analysis of all the water-quality properties and constituents followed those in Wershaw and others (1987), Britton and Greeson (1989), Fishman and Friedman (1989), Patton and Truitt (1992), and Fishman (1993). All laboratory analyses were conducted by the U.S. Geological Survey’s National Water Quality Laboratory (NWQL) in Colorado. Quality-assurance practices at NWQL are documented in Friedman and Erdmann (1982) and Pritt and Rease (1992). In January 1993, laboratory analysis for unfiltered NO2+NO3 nitrogen was discontinued, and only filtered NO2+NO3 was analyzed after that date, because values for unfiltered and filtered NO2+NO3 nitrogen were statistically indistinguishable (U.S. Geological Survey, 1992).
Statistical Analysis
Water-quality constituents that are not detected in a sample are commonly reported to be below the minimum reporting level. The minimum reporting level is the smallest measured concentration of a constituent that can be reliably reported by using a given analytical method (Childress and others, 1999). This means that the actual concentration can be anywhere from zero to the minimum reporting level. A concentration less than the minimum reporting level does not mean that the constituents are not present in the sample. Minimum reporting levels can change over time because of improved laboratory techniques or as a result of refinements in the analytical methods used.
During this study, minimum reporting levels for several constituents changed. The minimum reporting level for (NO2+NO3) nitrogen changed from 0.10 to 0.05 mg/L in April 1991 due to changes in laboratory method. The minimum reporting level for ammonia and organic nitrogen decreased from 0.20 to 0.10 mg/L in November 1997, and values from 0.05 to 0.10 mg/L were reported as estimates starting in October 1998 because of changes in laboratory method and new reporting procedures (U.S. Geological Survey, 1997a, 1998a). Total nitrogen values used in this report were computed by adding the concentrations of NO2+NO3 nitrogen, ammonia, and organic nitrogen. The minimum reporting level for total phosphorus changed from 0.01 to 0.05 mg/L in October 1998, although values between 0.03 and 0.05 mg/L may be reported as estimates (U.S. Geological Survey, 1998a). The minimum reporting level for total suspended solids was raised from 1 to 10 mg/L in April 2000 (U.S. Geological Survey, 2000). This change only affected total suspended-solids data collected at station 16226200 because data collection ended earlier at all the other stations (table 1). The changes to the minimum reporting levels for total phosphorus and total suspended solids were due to new reporting procedures based on statistical and quality-assurance analyses (Childress and others, 1999). Constituents with variable minimum reporting levels were analyzed in this report using the minimum reporting level applicable at the time the samples were originally collected. Constituents reported as estimates were used at the reported value. The changes in minimum reporting levels mostly occurred during the after-construction data-collection period at all stations (table 1).
Methods for computing summary statistics such as the geometric mean when data are reported as less than the minimum reporting level, commonly called censored data, are summarized in Helsel (1990). The method recommended by Helsel (1990) for computing means is log-probability regression. This method requires at least three detected observations not having the same value and can be used on data sets with up to 80 percent censored data, but error and bias increase when more than 60 percent of the data set is censored

Water Quality Before, During, and After Highway Construction 13
data (Gilliom and Helsel, 1986). The log-probability method is robust, easy to compute with standard statistics software, can be used with multiple minimum reporting levels (Helsel and Cohn, 1988), and is ideal for computing geometric means (Travis and Land, 1990). In this study, log-probability regression was used when censored data did not constitute more than 60 percent of the data set for data sets greater than 10 values and more than 50 percent for data sets with 5 to 10 values. Where log-probability regression could not be used because of the above limitations, a simple substitution method of using one-half the minimum reporting level was used. Compared to other simple substitution methods (Helsel and Gilliom, 1986; Helsel, 1990), this substitution method provided the lowest error and bias in computing sample means and also provided a lower error than log-probability regression when samples sizes were small (less than 10 samples)(Clarke, 1998).
Although useful, the comparison of geometric means with water-quality standards cannot be used to infer the effects of highway construction at the study stations. It was assumed, however, that at stations where the geometric mean did not exceed the water-quality standards, the effects of highway construction were negligible. At stations where the geometric mean did exceed the water-quality standards, a rank-sum test was conducted to determine if there were any significant differences between the before-, during-, and after-construction data sets.
The rank-sum test, also known as the Wilcoxon-Mann-Whitney rank-sum test, is a nonparametric hypothesis test used to compare two independent sample sets for differences (Iman and Conover, 1983; Helsel and Hirsh, 1992). The rank-sum test was used to compare seasonal data sets between the time periods before and during, during and after, and before and after. The null hypothesis was no difference between time periods and was tested with a significance level of α=0.10. Because all rank-sum tests in this study were computed as two-sided, the actual test statistic was α/2=0.05, so a p-value less than 0.05 is needed to reject the null hypothesis. The rank-sum test is valid for all sample sizes and distributions but does assume that both sample sets are random samples of their respective populations (Iman and Conover, 1983).
To compare data sets at one station over two different time periods requires the assumption that variations in rainfall and streamflow are similar for both time periods. The small data sets in this study prevented the use of more rigorous statistical methods such as analysis of covariance to account for this variation. Therefore, an assumption was made that if the stream discharges associated with the water-quality samples were similar, then any variation in rainfall between the two time periods tested would have a minimal effect on the rank-sum test results. Thus, stream discharge between time periods, but not by season, also were tested using the rank-sum test with a null hypothesis of no difference in stream discharge. Where discharges were found to be significantly different, no rank-sum test on the water-quality constituent was done.
Another problem that would affect the interpretation of the rank-sum test between time periods is the change in minimum reporting levels for certain constituents. Most of these changes occurred to the sample data in the after-construction time period. Differences were checked visually using time-series plots of the data and if there appeared to be a noticeable difference in the data due to the change in the minimum reporting level, then no rank-sum test was done. Such differences were more easily seen in data sets with large numbers of values below the minimum reporting levels.
In addition to comparing the data between time periods, total nitrogen, NO2+NO3 nitrogen, phosphorus, total suspended solids (TSS), and turbidity data between two pairs of stations also were compared using the rank-sum test. Stations 16227100 Halawa Stream and 16274100 Kaneohe Stream were established in 1988 at sites near the mouth of each stream downstream from the urban areas (figs. 1 and 2). The upstream sites, stations 16226200 on North Halawa Stream and 16272200 on Kamooalii Stream, are upstream from the urban areas and downstream from the area affected by highway construction. The purpose of comparisons at station 16226200 with 16227100 and station 16272200 with 16274100, using the during-construction data sets, was to determine if the water-quality effects from the H-3 Highway construction were any different from the existing urban effects.
Because of differences in streamflow between the two sampling locations, this comparison was done using instantaneous constituent loads and not concentration data, because concentration data may be affected by inflows and outflows between locations. Constituent loads were computed by multiplying the concentration data in milligrams per liter with its corresponding instantaneous discharge in cubic feet per second and by a conversion factor of 5.394 to convert all units into pounds per day. The rank-sum test was computed comparing the load data except for turbidity, because turbidity data are not reported in a concentration unit. The basic hypothesis was no difference between loads or turbidity at sampling locations and this was tested with a significance level of α/2=0.05.
Data sets were tested first using all the data collected during the construction time period, and then by using wet- and dry-season data sets. Because this was a test between data at different locations during a similar time period, the rainfall variations and changes in minimum reporting levels were assumed to be the same at both locations and would have no effect on the interpretation of these rank-sum test results.
Water Quality Before, During, and After Highway Construction
Nitrogen.—Geometric mean values for total nitrogen ranged from 0.14 mg/L at station 16267500 after construction, wet season, to 0.89 mg/L at station 16265600 during

14 Water Quality in the Halawa, Haiku, and Kaneohe Drainage Basins Before, During, and After H-3 Highway Construction
construction, dry season. This dry-season maximum value is almost five times higher than the State of Hawaii standard of 0.18 mg/L (table 3). The State of Hawaii standards for total nitrogen geometric means were exceeded at almost all stations both before and during construction (table 5). The only exception was at station 16267500 where the wet-season, during-construction geometric mean value was below standards. After construction, the total nitrogen geometric
means exceeded the standards at most stations except the wet-season geometric means at stations 16226200, 16267500, 16273950, and 16275000. Dry-season after-construction geometric means also were below standards at stations 16266500 and 16267500. At the majority of sites where the geometric mean standards were exceeded, the 10- and 2-percent-of-the-time exceedence values also were exceeded (table 5).
Table 5. Total nitrogen at water-quality stations in the H-3 Highway study area, Oahu, Hawaii, water years 1983–99.[--, no data; mg/L, milligrams per liter; e, value estimated by log-probability regression; h, value estimated by one-half minimum reporting limit substitution; minimum reporting limits for total nitrogen were determined by the addition of minimum reporting limits for nitrite plus nitrate nitrogen, ammonia, and organic nitrogen and changed from 0.30 to 0.25 mg/L in 1992 and to 0.15 mg/L in 1997; shaded values exceeded the State of Hawaii water-quality standards in table 3]
StationConstruction
period SeasonNumber of samples
Number of samples
greater than minimum reporting
levelGeometric mean
(mg/L)
Concentration (mg/L) exceeded
10 percent of the time
2 percent of the time
16226200 before wet 1 0 -- -- --
dry 6 0 h0.46 h0.85 h0.85
during wet 18 2 h0.26 h0.87 h2.6
dry 15 2 h0.27 h1.0 h1.7
after wet 8 4 e0.21 0.94 0.99
dry 1 0 -- -- --
16227100 during wet 17 6 h0.32 0.63 0.69
dry 13 5 h0.51 1.0 3.4
16265600 during wet 18 10 e0.80 1.2 1.8
dry 20 16 e0.89 1.3 3.6
after wet 12 1 h0.59 h0.69 h0.90
dry 7 0 h0.49 h0.59 h0.60
16265700 before wet 5 5 0.80 1.2 1.3
dry 6 5 e0.56 0.70 0.70
during wet 7 2 h0.43 0.94 1.2
dry 7 4 e0.52 0.83 0.89
after wet 10 0 h0.40 h0.48 h0.62
dry 5 0 h0.48 h0.68 h0.69
16266500 before wet 5 1 h0.26 h0.52 h0.66
dry 5 0 h0.20 h0.30 h0.34
during wet 7 1 h0.28 h0.49 h0.66
dry 7 3 h0.29 0.66 0.77
after wet 7 1 h0.26 h0.39 h0.58
dry 6 0 h0.17 h0.21 h0.22
16267500 before wet 5 0 h0.33 h0.55 h0.55
dry 6 1 h0.26 h0.57 h0.71
during wet 7 2 h0.24 0.53 0.59
dry 7 0 h0.22 h0.44 h0.61
after wet 10 0 h0.14 h0.19 h0.20
dry 6 0 h0.17 h0.24 h0.33

Water Quality Before, During, and After Highway Construction 15
Table 5. Total nitrogen at water-quality stations in the H-3 Highway study area, Oahu, Hawaii, water years 1983–99.—Continued[--, no data; mg/L, milligrams per liter; e, value estimated by log-probability regression; h, value estimated by one-half minimum reporting limit substitution; minimum reporting limits for total nitrogen were determined by the addition of minimum reporting limits for nitrite and nitrate nitrogen and ammonia and organic nitrogen and changed from 0.30 to 0.25 mg/L in 1992 and to 0.15 mg/L in 1997; shaded values exceeded the State of Hawaii water-quality standards listed in table 3]
StationConstruction
period SeasonNumber of samples
Number of samples
greater than minimum reporting
levelGeometric mean
(mg/L)
Concentration (mg/L) exceeded
10 percent of the time
2 percent of the time
16269500 before wet 5 4 e0.68 1.2 1.5
dry 5 1 h0.52 h2.6 h4.5
during wet 7 2 h0.50 0.70 0.70
dry 7 3 h0.47 0.83 1.3
after wet 10 2 h0.41 h0.53 h0.59
dry 5 0 h0.37 h0.45 h0.51
16270900 before wet 10 6 e0.71 1.1 1.9
dry 9 1 h0.35 h0.58 h1.64
during wet 12 3 h0.36 0.50 0.58
dry 12 4 h0.28 0.40 0.55
after wet 7 0 h0.26 0.31 0.33
dry 2 0 -- -- --
16272200 during wet 20 11 e0.56 0.80 1.1
dry 25 16 e0.53 0.80 1.3
after wet 7 3 h0.47 0.53 0.55
dry 2 1 -- -- --
16273950 before wet 1 1 -- -- --
dry 8 0 h0.35 h0.68 h0.82
during wet 12 2 h0.37 h0.78 3.65
dry 12 2 h0.24 h0.62 0.78
after wet 7 0 h0.17 h0.20 h0.22
dry 2 0 -- -- --
16274100 during wet 13 5 h0.62 0.87 0.98
dry 12 9 e0.54 0.77 0.88
after wet 7 4 e0.48 0.54 0.60
dry 3 3 0.54 -- --
16275000 before wet 3 0 h0.33 -- --
dry 8 0 h0.27 h0.57 h0.63
during wet 11 3 h0.27 0.40 0.48
dry 10 0 h0.22 h0.27 h0.57
after wet 8 0 h0.18 h0.22 h0.23
dry 4 0 h0.19 -- --
RES 1-3 during wet 30 23 e0.74 1.1 1.3
dry 45 44 e0.71 1.2 1.4
after wet 13 0 h0.51 h0.57 h0.59
dry 6 2 h0.56 0.84 0.85

16 Water Quality in the Halawa, Haiku, and Kaneohe Drainage Basins Before, During, and After H-3 Highway Construction
Rank-sum test p-value results comparing geometric means between construction time periods for total nitrogen are shown in table 6. Rank-sum tests could not be computed because of small sample size, n<5, in one of the construction or seasonal time periods at stations 16226200, 16270900, 16272200, 16273950, 16274100, and 16275000. The changes in the minimum reporting level for total nitrogen were most obvious at station 16267500 as shown in figure 4, so no rank-sum test was done comparing the after-construction data with the other two time periods at this station. Rank-sum tests could not be computed because streamflow values associated with the total nitrogen samples were significantly different between some of the construction time periods at stations 16269500, 16270900, and 16275000. At station 16275000, for example, the difference in the before- and during-construction discharges was significant with a p-value of 0.01. Before-construction discharges were lower (fig. 5C). Results were similar at stations 16269500 and 16270900 except that at station 16269500, the after-construction discharges were significantly lower than the before-construction discharges. Also, because no before-construction data were collected at stations 16227100, 16265600, 16272200, and 16274100, comparisons with before-construction data could obviously not be made. Where the rank-sum test was computed, only stations 16265600, 16265700, 16270900, 16273950, and 16275000 had statistically significant differences between comparisons with the after-construction time period (table 6).
At all five stations where statistically significant differences in total nitrogen were found, the geometric means were lower after construction than either before or during construction (tables 5 and 6). This may be, in part, due to the
lower minimum reporting levels for total nitrogen (0.25 mg/L starting in April 1991 and 0.15 mg/L in November 1997) that affected the after-construction data at most sites (table 1). However, time-series plots of the total nitrogen data show that the effect of lower minimum reporting levels is minimal (fig. 5). In figure 5, total nitrogen concentrations are mostly above the minimum reporting level at stations 16265700 and 16270900, while at station 16275000, concentrations are mostly below the minimum reporting level; yet in both cases, the after-construction concentrations are significantly lower than the before- or during-construction concentrations. The lower after-construction concentrations may be due to a decrease in land disturbance after highway construction or land-use change because land-use prior to construction upstream from these stations was not pristine.
Of the two major components of total nitrogen, standards exist only for NO2+NO3 nitrogen (table 3). The lowest NO2+NO3 nitrogen geometric mean was at station 16267500 after construction, dry season, with a value of 0.04 mg/L; the highest geometric mean was at station 16265600 during construction, dry season, with a value of 0.50 mg/L (table 7). The geometric mean standards at all sites and during all time periods were exceeded except for before construction, wet season, at stations 16266500, 16267500, and 16275000 and after construction, wet season, at stations 16226200 and 16267500 (table 7). The 10- and 2-percent-of-the-time exceedence values were not exceeded as often for total nitrogen (table 5). Stations 16267500 and 16275000 had no exceedence of the 2-percent-of-the-time exceedence value. Stations 16226200, 16266500, 16267500, and 16275000 had the least amount of developed land prior to highway construction.
Station 16267500
0.00
0.10
0.20
0.30
0.40
0.50
0.60
0.70
0.80
DATE
TOTA
L N
ITRO
GEN
, IN
MIL
LIGR
AMS
PER
LITE
R
1983 1984 1985
Begi
n co
nstru
ctio
n, J
une
1989
End
cons
truct
ion,
Jun
e 19
92
1986 1987 1988 1989 1990 1991 1992 1993 1994 1995 1996 1997 1998
Note: values less than minimum reporting level plotted using one-half substitution method
0.30 mg/L
0.25 mg/L0.15 mg/L
Minimum reporting level
BEFORE DURING AFTER
Figure 4. Total nitrogen concentrations at station 16267500, February 1983 to January 1998, Oahu, Hawaii.

Water Quality Before, During, and After Highway Construction 17
Table 6. Rank-sum test p-value results comparing selected water-quality constituents and turbidity between highway construction time periods in the H-3 Highway study area, Oahu, Hawaii, water years 1983–99.[Shaded values represent significant results with p-values less than 0.05; wet season is from November 1 to April 30 and dry season is from May 1 to October 31; --, no test done]
Station Construction periods Season Total nitrogenNitrite plus
nitrate nitrogenTotal
phosphorus Turbidity
16226200 before and during dry 0.19 1 -- --
during and after wet 0.89 0.23 -- 0.25
16265600 during and after wet 0.06 0.93 -- --
dry 0.00 0.03 -- --
16265700 before and during wet 0.12 0.86 -- 0.02
dry 0.56 0.55 0.94 0.05
during and after wet 0.59 0.24 -- --
dry 1 0.62 0.59 --
before and after wet 0.02 0.11 -- --
dry 0.52 0.29 0.38 --
16266500 before and during wet 0.68 0.05 -- --
dry 0.31 0.03 -- --
during and after wet 0.80 0.52 -- --
dry 0.17 0.17 -- --
before and after wet 0.68 0.01 -- --
dry 0.64 0.39 -- --
16267500 before and during wet 0.48 0.13 -- 0.01
dry 0.66 0.49 -- 0.02
16269500 before and during wet 0.25 0.57 -- --
dry 1 0.80 -- --
during and after wet 0.20 0.10 -- --
dry 0.41 0.68 -- --
16270900 during and after wet 0.04 0.13 -- --
before and after wet 0.00 0.03 -- --
16272200 during and after wet 0.40 0.05 -- --
16273950 before and during dry 0.45 0.14 -- 0.97
during and after wet 0.02 0.15 -- --
dry -- -- -- 0.75
before and after dry -- -- -- 0.88
16274100 during and after wet 0.07 0.02 -- --
16275000 during and after wet 0.01 0.06 -- --

18 Water Quality in the Halawa, Haiku, and Kaneohe Drainage Basins Before, During, and After H-3 Highway Construction
Statio
n 16
2657
00
0.01
0.10
1.00
10.0
0
100.
00
TOTAL NITROGEN, IN MILLIGRAMS PER LITER, AND INSTANTANEOUS DISCHARGE, IN CUBIC FEET PER SECOND
TOTAL NITROGEN, IN MILLIGRAMS PER LITER, AND INSTANTANEOUS DISCHARGE, IN CUBIC FEET PER SECOND
TOTA
L N
ITRO
GEN
, IN
MIL
LIGR
AMS
PE
R LI
TER
INST
ANTA
NEO
US D
ISCH
ARGE
, IN
CUB
IC F
EET
PE
R SE
CON
D
Stat
ion
1627
0900
0.10
1.00
10.0
0
100.
00
Stat
ion
1627
5000
0.101.0
10.0
100.
0
A B
C
Begin construction, June 1989
End construction, June 1992
Begin construction, October 1988
End construction, November 1994
0.3
0 m
g/L
0.25
mg/
L
0.15
mg/
L
min
imum
repo
rting
leve
l
Med
ian
disc
harg
e =
1.4
ft3 /sM
edia
n di
scha
rge
= 0.
83 ft
3 /s
Med
ian
disc
harg
e =
1.4
ft3 /s 0
.30
mg/
L0.
25 m
g/L
0.15
mg/
L
Min
imum
repo
rting
leve
l
Med
ian
disc
harg
e =
1.5
ft3 /sM
edia
n di
scha
rge
= 1.
9 ft3 /s
Med
ian
disc
harg
e =
1.9
ft3 /s
Med
ian
disc
harg
e =
0.74
ft3 /s
Med
ian
disc
harg
e=
1.2
ft3 /sM
edia
n di
scha
rge
= 1.
2 ft3 /s
DATE
1983
1984
1985
1986
1987
1988
1989
1990
1991
1992
1993
1994
1995
1996
1997
1998
DATE
1983
1984
1985
1986
1987
1988
1989
1990
1991
1992
1993
1994
1995
1996
1997
1998
Not
e: v
alue
s le
ss th
an m
inim
um re
porti
ng le
vel p
lotte
d us
ing
one-
half
subs
titut
ion
met
hod
DATE
1983
1984
1985
1986
1987
1988
1989
1990
1991
1992
1993
1994
1995
1996
1997
1998
Begin construction, June 1989
End construction, December 1995
0.3
0 m
g/L
0.25
mg/
L0.
15 m
g/L
Min
imum
repo
rting
leve
l
BEFO
REDU
RIN
GAF
TER
BEFO
REDU
RIN
GAF
TER
BEFO
REDU
RIN
GAF
TER
EXPL
AN
ATIO
N
Figu
re 5
. To
tal n
itrog
en c
once
ntra
tions
and
inst
anta
neou
s di
scha
rges
at (
A) s
tatio
n 16
2657
00, F
ebru
ary
1983
to J
anua
ry 1
998;
and
(B) s
tatio
n 16
2709
00, F
ebru
ary
1983
to
Janu
ary
1998
; and
(C) s
tatio
n 16
2750
00, A
pril
1983
to F
ebru
ary
1998
, Oah
u, H
awai
i.

Water Quality Before, During, and After Highway Construction 19
Table 7. Total nitrite plus nitrate nitrogen at water-quality stations in the H-3 Highway study area, Oahu, Hawaii, water years 1983–99.[--, no data; mg/L, milligrams per liter; e, value estimated by log-probability regression; h, value estimated by one-half minimum reporting limit substitution; minimum reporting levels for nitrite plus nitrate nitrogen were changed from 0.10 to 0.05 mg/L in 1992; <, actual value is less than value shown; shaded values represent total nitrite plus nitrate nitrogen values that have exceeded the State of Hawaii water-quality standards listed in table 3]
StationConstruction
period SeasonNumber of samples
Number of samples greater than
minimum reporting
levelGeometric
mean (mg/L)
Concentration (mg/L) exceeded
10 percent of the time
2 percent of the time
16226200 before wet 1 0 -- -- --
dry 6 0 h0.05 <0.10 <0.10
during wet 18 11 e0.08 0.18 0.19
dry 15 5 h0.06 0.10 0.74
after wet 8 4 e0.05 0.12 0.13
dry 1 0 -- -- --
16227100 during wet 17 7 e0.13 0.29 0.30
dry 13 5 h0.08 0.39 2.2
16265600 during wet 18 18 0.44 0.60 0.67
dry 20 20 e0.50 0.60 1.8
after wet 12 12 0.48 0.54 0.59
dry 7 7 0.39 0.49 0.50
16265700 before wet 5 5 0.24 0.30 0.30
dry 6 6 0.24 0.30 0.30
during wet 7 7 0.26 0.44 0.73
dry 7 7 0.28 0.53 0.59
after wet 9 9 0.30 0.38 0.52
dry 5 5 0.37 0.58 0.59
16266500 before wet 5 2 h0.06 0.10 0.10
dry 5 0 h0.05 <0.10 <0.10
during wet 7 6 e0.16 0.30 0.30
dry 7 5 e0.12 0.26 0.37
after wet 8 8 0.13 0.18 0.20
dry 6 4 e0.08 0.11 0.12
16267500 before wet 5 0 h0.05 <0.10 <0.10
dry 6 2 h0.06 0.10 0.10
during wet 7 3 h0.10 0.23 0.29
dry 7 1 h0.06 h0.06 h0.09
after wet 10 7 e0.06 0.09 0.10
dry 6 3 h0.04 0.06 0.07
16269500 before wet 5 4 e0.21 0.80 1.0
dry 5 3 h0.24 2.2 3.7
during wet 7 7 0.34 0.50 0.50
dry 7 7 0.24 0.41 0.64
after wet 10 10 0.26 0.36 0.47
dry 5 5 0.27 0.35 0.41
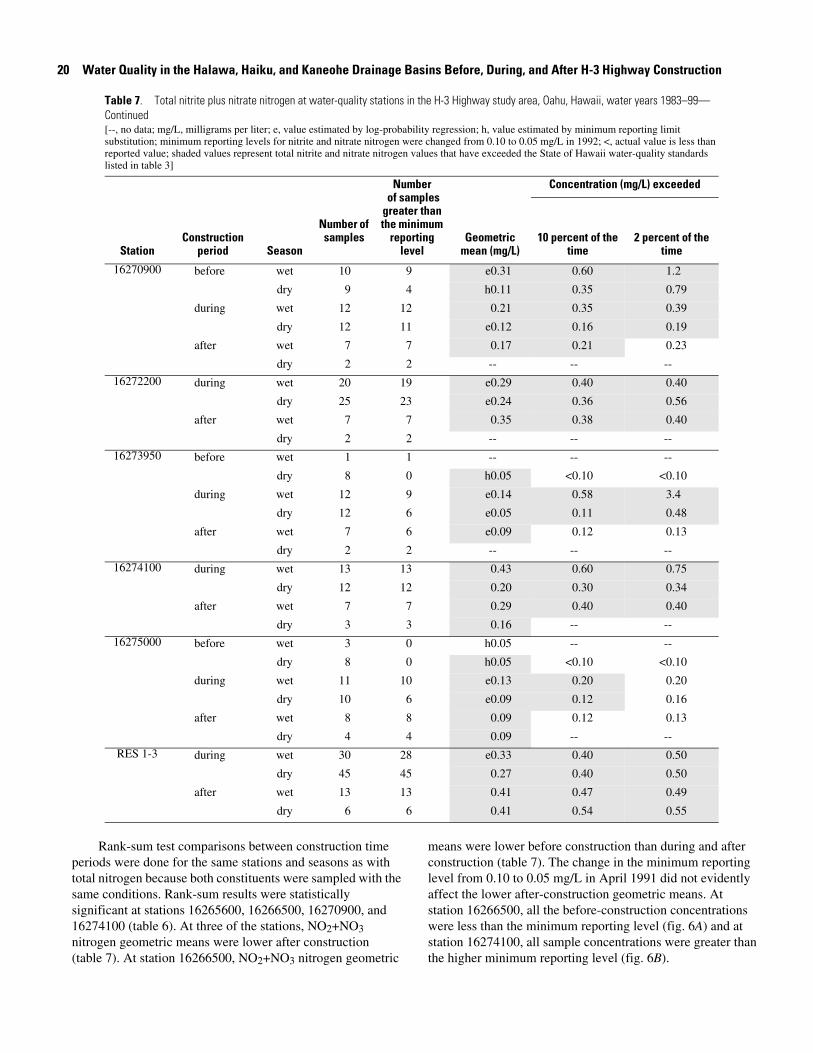
20 Water Quality in the Halawa, Haiku, and Kaneohe Drainage Basins Before, During, and After H-3 Highway Construction
Table 7. Total nitrite plus nitrate nitrogen at water-quality stations in the H-3 Highway study area, Oahu, Hawaii, water years 1983–99—Continued[--, no data; mg/L, milligrams per liter; e, value estimated by log-probability regression; h, value estimated by minimum reporting limit substitution; minimum reporting levels for nitrite and nitrate nitrogen were changed from 0.10 to 0.05 mg/L in 1992; <, actual value is less than reported value; shaded values represent total nitrite and nitrate nitrogen values that have exceeded the State of Hawaii water-quality standards listed in table 3]
StationConstruction
period Season
Number of samples
Number of samples greater than the minimum
reporting level
Geometric mean (mg/L)
Concentration (mg/L) exceeded
10 percent of the time
2 percent of the time
16270900 before wet 10 9 e0.31 0.60 1.2
dry 9 4 h0.11 0.35 0.79
during wet 12 12 0.21 0.35 0.39
dry 12 11 e0.12 0.16 0.19
after wet 7 7 0.17 0.21 0.23
dry 2 2 -- -- --
16272200 during wet 20 19 e0.29 0.40 0.40
dry 25 23 e0.24 0.36 0.56
after wet 7 7 0.35 0.38 0.40
dry 2 2 -- -- --
16273950 before wet 1 1 -- -- --
dry 8 0 h0.05 <0.10 <0.10
during wet 12 9 e0.14 0.58 3.4
dry 12 6 e0.05 0.11 0.48
after wet 7 6 e0.09 0.12 0.13
dry 2 2 -- -- --
16274100 during wet 13 13 0.43 0.60 0.75
dry 12 12 0.20 0.30 0.34
after wet 7 7 0.29 0.40 0.40
dry 3 3 0.16 -- --
16275000 before wet 3 0 h0.05 -- --
dry 8 0 h0.05 <0.10 <0.10
during wet 11 10 e0.13 0.20 0.20
dry 10 6 e0.09 0.12 0.16
after wet 8 8 0.09 0.12 0.13
dry 4 4 0.09 -- --
RES 1-3 during wet 30 28 e0.33 0.40 0.50
dry 45 45 0.27 0.40 0.50
after wet 13 13 0.41 0.47 0.49
dry 6 6 0.41 0.54 0.55
Rank-sum test comparisons between construction time periods were done for the same stations and seasons as with total nitrogen because both constituents were sampled with the same conditions. Rank-sum results were statistically significant at stations 16265600, 16266500, 16270900, and 16274100 (table 6). At three of the stations, NO2+NO3 nitrogen geometric means were lower after construction (table 7). At station 16266500, NO2+NO3 nitrogen geometric
means were lower before construction than during and after construction (table 7). The change in the minimum reporting level from 0.10 to 0.05 mg/L in April 1991 did not evidently affect the lower after-construction geometric means. At station 16266500, all the before-construction concentrations were less than the minimum reporting level (fig. 6A) and at station 16274100, all sample concentrations were greater than the higher minimum reporting level (fig. 6B).
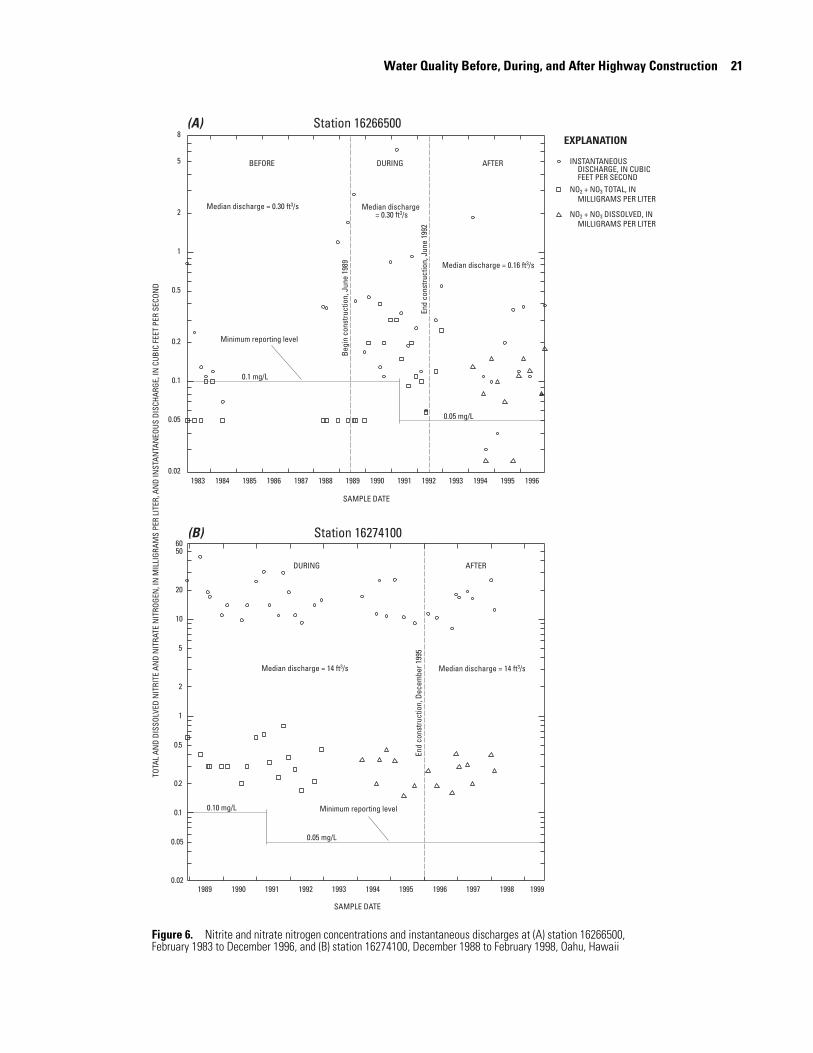
Water Quality Before, During, and After Highway Construction 21
(A)
1984 1986 1988 1990 1992 1994 19961983 1985 1987 1989 1991 1993 1995
SAMPLE DATE
0.02
0.05
0.1
0.2
0.5
1
2
5
8
INSTANTANEOUS DISCHARGE, IN CUBIC FEET PER SECONDNO2 + NO3 TOTAL, IN MILLIGRAMS PER LITER
NO2 + NO3 DISSOLVED, IN MILLIGRAMS PER LITER
TOTA
L AN
D DI
SSOL
VED
NIT
RITE
AN
D N
ITRA
TE N
ITRO
GEN
, IN
MIL
LIGR
AMS
PER
LITE
R, A
ND
INST
ANTA
NEO
US D
ISCH
ARGE
, IN
CUB
IC F
EET
PER
SECO
ND
Begi
n co
nstru
ctio
n, J
une
1989
End
cons
truct
ion,
Jun
e 19
92En
d co
nstru
ctio
n, D
ecem
ber 1
995
0.1 mg/L
0.05 mg/L
Minimum reporting level
Median discharge = 0.30 ft3/s
Median discharge = 0.16 ft3/s
Median discharge = 0.30 ft3/s
0.10 mg/L
0.05 mg/L
Minimum reporting level
Median discharge = 14 ft3/sMedian discharge = 14 ft3/s
(B)
Station 16266500
Station 16274100
1990 1992 1994 1996 1998 19991989 1991 1993 1995 1997
SAMPLE DATE
0.02
0.05
0.1
0.2
0.5
1
2
5
10
20
5060
EXPLANATION
DURING AFTER
BEFORE DURING AFTER
Figure 6. Nitrite and nitrate nitrogen concentrations and instantaneous discharges at (A) station 16266500, February 1983 to December 1996, and (B) station 16274100, December 1988 to February 1998, Oahu, Hawaii
22 Water Quality in the Halawa, Haiku, and Kaneohe Drainage Basins Before, During, and After H-3 Highway Construction
Because the minimum reporting limits for total and NO2+NO3 nitrogen were greater than the State of Hawaii geometric mean standards for most of the study period, it is difficult to determine the effects of highway construction on these two constituents. However, because before-construction data for both total and NO2+NO3 nitrogen were not statistically different from during-construction data at all stations where the tests could be conducted (table 6), no highway construction effects on total or NO2+NO3 nitrogen can be attributed to any station except at station 16266500.
Nitrogen component data collected during 1991–92 at all stations showed that, on average, total nitrogen was made up of 45 percent nitrate (NO3), 45 percent organic N, 5 percent nitrite (NO2), and 5 percent ammonia (NH4) (unpublished data on file at Hawaii District, U.S. Geological Survey). Looking at the geometric mean values of NO2+NO3 nitrogen in relation to total nitrogen, a distribution change can be seen at stations 16265700, 16275000, and RES 1-3 (tables 5 and 7). At these sites, after-construction geometric means for total nitrogen show a greater NO2+NO3 nitrogen component than either before or during construction. Increasing NO2+NO3 nitrogen can be attributed to increased anthropogenic effects from the increase in urban land use (Mueller and others, 1995; Thom and others, 2001).
Phosphorus.—Geometric mean values for total phosphorus ranged from 0.01 mg/L at many stations to 0.05 mg/L at station 16275000 before construction, wet season (table 8). Geometric mean values for total phosphorus exceeded the standards only during construction, dry season, at stations 16265600 and 16265700 (table 8). Rank-sum tests could be done only at station 16265700 because of significantly different phosphorus sample discharges, p-value of 0.02, between during- and after-construction time periods at station 16265600. Rank-sum results (table 6) indicate no significant differences between the before-, during-, and after-construction geometric means for phosphorus at station 16265700. Total phosphorus concentrations exceeded water-quality standards more commonly for the 10- and 2-percent standards than for the geometric mean, in contrast to the opposite pattern for nitrogen (tables 5 and 7). The 10- and(or) 2-percent-of-the-time exceedence values for total phosphorus were exceeded before construction at stations 16269500 and 16270900; during construction at stations 16226200, 16227100, 16265600, 16265700, 16270900, 16272200, and 16273950; and after construction only at stations 16226200 and 16265600 (table 8). Except for station 16226200, all the other stations with high phosphorus values have upstream land-use activities, such as golf courses or banana plantations, where fertilizers would be used. Because phosphorus tends to adsorb to sediment particles, increased land disturbance due to highway construction also may have caused the higher observed phosphorus values.
Total suspended solids and turbidity.—Total suspended solids (TSS) geometric means ranged from 1 to 17 mg/L and only exceeded the standard at stations 16227100 and 16274100, both during construction, dry season (table 9). The
high TSS geometric means at stations 16227100 and 16274100 may be a result of other urban land-use activities upstream from these stations. No rank-sum test could be computed for either station, because no or insufficient before- or after-construction data were collected. The 10- and (or) 2-percent-of-the-time exceedence standards (table 3) were exceeded, for the most part, only during construction at most stations and after construction only at stations 16226200 and 16267500 (table 9). The high TSS values are probably the result of land disturbance caused by highway construction and also by golf-course construction upstream from stations 16265600 and 16265700. A larger number of samples for the concentration of suspended sediment were collected during this study, especially during periods of storm runoff. Suspended-sediment data were summarized in Wong and Young (2001) and suspended-sediment loads were analyzed by Wong and Yeatts (2002). Results in Wong and Yeatts (2002) show that suspended-sediment loads increased at most stations during construction, even though that increase is not reflected in the TSS data.
Turbidity geometric mean values ranged from 0.3 to 14 NTU and exceeded the standard before construction at stations 16226200, 16267500, 16269500, and 16273950; during the construction period at stations 16226200, 16227100, 16265600, 16265700, 16267500, 16273950, and 16274100; and after construction at stations 16267500, 16273950, and 16274100 (table 10). During highway construction the 10-percent-of-the-time exceedence standards were exceeded at all stations except 16273950, 16275000, and RES 1-3; after construction, only at stations 16226200 and 16267500. The 2-percent-of-the-time exceedence standards were exceeded at all stations during highway construction and after construction at stations 16226200, 16265600, 16267500, 16270900, and 16275000.
Rank-sum tests could not be computed because of small sample size (less than five samples) in one of the construction or seasonal time periods at stations 16226200, 16273950, and 16274100 (table 10). Rank-sum tests also could not be computed because of discharges associated with the turbidity samples being significantly different between some of the construction time periods at stations 16226200, 16265600, 16265700, and 16267500. Figure 7 shows this difference at station 16265600, where the after-construction discharges were significantly lower (p-value of 0.001) than the during-construction discharges. Stations 16265700 and 16267500 had significant differences between the during- and after-construction discharges (p-values of 0.02 and 0.01, respectively), while station 16226200 had significant difference (p-value of 0.03) between the before- and after-construction discharges. Rank-sum test results (table 6) indicate that the differences in the before and during turbidity geometric means at stations 16265700 and 16267500 are statistically significant, with the during-construction geometric means being higher (table 10).
Because turbidity values represent not only suspended particulate matter that can be caused by land disturbance, but

Water Quality Before, During, and After Highway Construction 23
Table 8. Total phosphorus at water-quality stations in the H-3 Highway study area, Oahu, Hawaii, water years 1983–99.[--, no data; mg/L, milligrams per liter; e, value estimated by log-probability regression; h, value estimated by one-half minimum reporting level substitution; minimum reporting level changed from 0.01 to 0.05 mg/L in 1998; <, actual value is less than value shown; shaded values represent total phosphorus values that have exceeded the State of Hawaii water-quality standards listed in table 3]
StationConstruction
period Season
Concentration (mg/L) exceeded
Number of samples
Number of samples greater than the minimum
reporting level
Geometric mean (mg/L)
10 percent of the time
2 percent of the time
16226200 before wet 2 2 -- -- --
dry 6 4 e0.02 0.05 0.06
during wet 20 13 e0.02 0.13 0.22
dry 17 9 e0.02 0.05 0.10
after wet 8 3 h0.03 0.12 0.14
dry 1 0 -- -- --
16227100 during wet 19 13 e0.02 0.07 0.14
dry 15 13 e0.03 0.08 0.10
16265600 during wet 18 18 0.03 0.10 0.35
dry 20 16 e0.04 0.10 0.39
after wet 14 8 e0.01 0.02 0.16
dry 9 7 e0.02 0.07 0.24
16265700 before wet 5 5 0.02 0.04 0.04
dry 6 6 0.03 0.05 0.07
during wet 7 5 e0.04 0.28 0.33
dry 7 5 e0.04 0.25 0.34
after wet 11 9 e0.02 0.04 0.06
dry 8 7 e0.02 0.04 0.06
16266500 before wet 5 3 h0.01 0.04 0.06
dry 4 2 h0.01 -- --
during wet 7 2 h0.01 0.03 0.06
dry 7 4 e0.02 0.04 0.06
after wet 10 1 h0.01 h0.01 h0.10
dry 8 2 h0.01 0.02 0.02
16267500 before wet 5 4 h0.02 0.03 0.03
dry 6 4 h0.01 0.03 0.03
during wet 7 4 e0.02 0.07 0.11
dry 7 4 e0.01 0.03 0.04
after wet 12 5 h0.01 0.02 0.02
dry 8 5 h0.01 0.03 0.08
16269500 before wet 5 3 h0.01 0.02 0.02
dry 5 4 e0.02 0.12 0.18
during wet 7 5 e0.02 0.03 0.04
dry 7 4 h0.01 0.02 0.02
after wet 12 5 e0.01 0.06 0.08
dry 6 4 h0.01 0.02 0.03

24 Water Quality in the Halawa, Haiku, and Kaneohe Drainage Basins Before, During, and After H-3 Highway Construction
Table 8. Total phosphorus at water-quality stations in the H-3 Highway study area, Oahu, Hawaii, water years 1983–99—Continued[--, no data; mg/L, milligrams per liter; e, value estimated by log-probability regression; minimum reporting limit changed from 0.01 to 0.05 mg/L in 1998; <, actual value is less than value shown; shaded values represent total phosphorus values that have exceeded the State of Hawaii water-quality standards listed in table 3]
StationConstruction
period Season
Concentration (mg/L) exceeded
Number of samples
Number of samples greater than
minimum reporting
levelGeometric
mean (mg/L)10 percent of the
time2 percent of the
time
16270900 before wet 10 9 e0.03 0.14 0.26
dry 9 9 0.02 0.04 0.13
during wet 14 13 e0.04 0.19 0.77
dry 14 12 h0.02 0.03 0.03
after wet 7 5 e0.01 0.02 0.03
dry 2 2 -- -- --
16272200 during wet 23 20 e0.03 0.18 0.26
dry 27 24 e0.02 0.02 0.16
after wet 7 6 e0.01 0.02 0.02
dry 2 2 -- -- --
16273950 before wet 1 1 -- -- --
dry 8 8 0.02 0.03 0.04
during wet 15 14 e0.04 0.06 0.22
dry 14 12 e0.02 0.04 0.04
after wet 7 7 0.02 0.03 0.03
dry 2 2 -- -- --
16274100 during wet 15 15 0.04 0.08 0.09
dry 14 12 e0.03 0.04 0.05
after wet 7 4 e0.02 0.04 0.04
dry 3 3 0.03 -- --
16275000 before wet 3 3 0.05 -- --
dry 8 7 e0.02 0.06 0.07
during wet 13 10 e0.02 0.04 0.13
dry 12 11 e0.02 0.03 0.08
after wet 8 5 e0.01 0.02 0.02
dry 4 4 0.02 -- --
RES 1-3 during wet 30 26 e0.02 0.03 0.05
dry 45 40 e0.02 0.04 0.08
after wet 16 7 e0.01 0.01 0.03
dry 9 7 e0.02 0.03 0.03
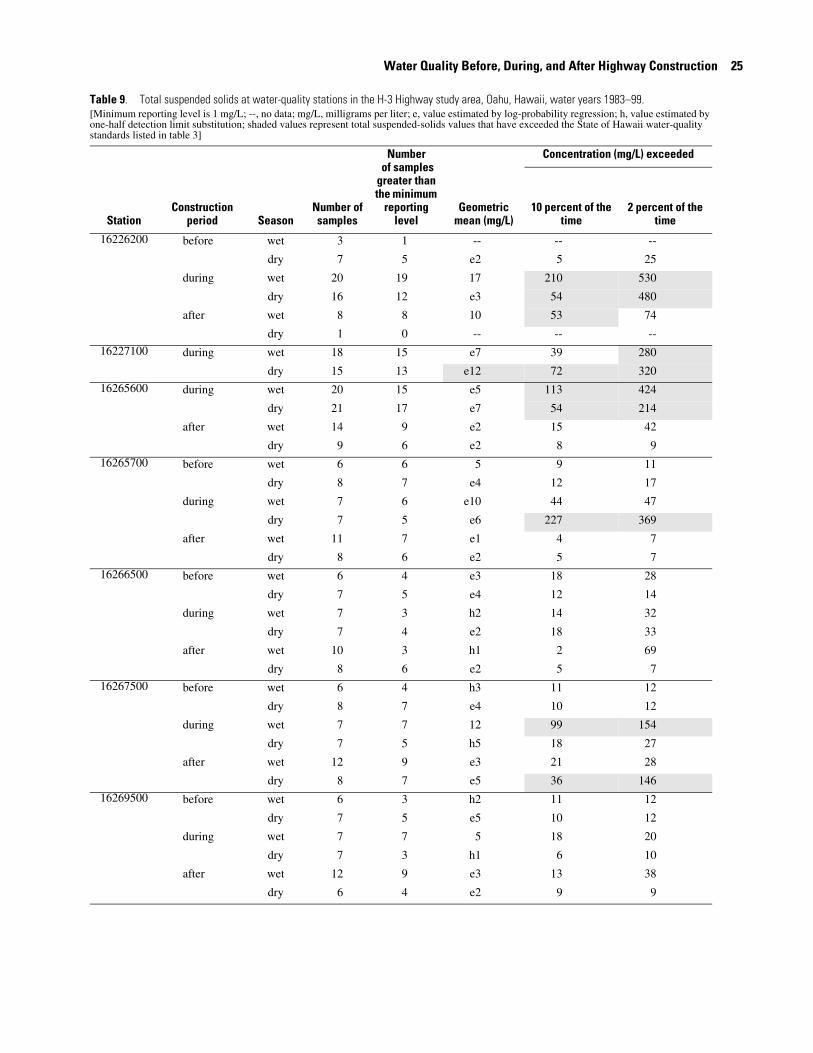
Water Quality Before, During, and After Highway Construction 25
Table 9. Total suspended solids at water-quality stations in the H-3 Highway study area, Oahu, Hawaii, water years 1983–99.[Minimum reporting level is 1 mg/L; --, no data; mg/L, milligrams per liter; e, value estimated by log-probability regression; h, value estimated by one-half detection limit substitution; shaded values represent total suspended-solids values that have exceeded the State of Hawaii water-quality standards listed in table 3]
StationConstruction
period SeasonNumber of samples
Number of samples greater than the minimum
reporting level
Geometric mean (mg/L)
Concentration (mg/L) exceeded
10 percent of the time
2 percent of the time
16226200 before wet 3 1 -- -- --
dry 7 5 e2 5 25
during wet 20 19 17 210 530
dry 16 12 e3 54 480
after wet 8 8 10 53 74
dry 1 0 -- -- --
16227100 during wet 18 15 e7 39 280
dry 15 13 e12 72 320
16265600 during wet 20 15 e5 113 424
dry 21 17 e7 54 214
after wet 14 9 e2 15 42
dry 9 6 e2 8 9
16265700 before wet 6 6 5 9 11
dry 8 7 e4 12 17
during wet 7 6 e10 44 47
dry 7 5 e6 227 369
after wet 11 7 e1 4 7
dry 8 6 e2 5 7
16266500 before wet 6 4 e3 18 28
dry 7 5 e4 12 14
during wet 7 3 h2 14 32
dry 7 4 e2 18 33
after wet 10 3 h1 2 69
dry 8 6 e2 5 7
16267500 before wet 6 4 h3 11 12
dry 8 7 e4 10 12
during wet 7 7 12 99 154
dry 7 5 h5 18 27
after wet 12 9 e3 21 28
dry 8 7 e5 36 146
16269500 before wet 6 3 h2 11 12
dry 7 5 e5 10 12
during wet 7 7 5 18 20
dry 7 3 h1 6 10
after wet 12 9 e3 13 38
dry 6 4 e2 9 9

26 Water Quality in the Halawa, Haiku, and Kaneohe Drainage Basins Before, During, and After H-3 Highway Construction
Table 9. Total suspended solids at water-quality stations in the H-3 Highway study area, Oahu, Hawaii, water years 1983–99—Continued[Minimum reporting level is 1 mg/L; --, no data; mg/L, milligrams per liter; e, value estimated by log-probability regression; h, value estimated by one-half detection limit substitution; shaded values represent total suspended-solids values that have exceeded the State of Hawaii water-quality standards listed in table 3]
StationConstruction
period SeasonNumber of samples
Number of samples greater than
minimum reporting
levelGeometric
mean (mg/L)
Concentration (mg/L) exceeded
10 percent of the time
2 percent of the time
16270900 before wet 13 9 e5 23 28
dry 9 6 e5 24 64
during wet 14 10 e2 109 770
dry 14 7 e2 7 12
after wet 7 5 h1 3 3
dry 2 2 -- -- --
16272200 during wet 26 24 e8 106 149
dry 27 24 e4 11 68
after wet 7 3 h1 5 7
dry 2 2 -- -- --
16273950 before wet 2 2 -- -- --
dry 7 6 e6 9 11
during wet 15 13 e8 19 109
dry 14 13 e6 14 14
after wet 7 6 e4 6 9
dry 2 2 -- -- --
16274100 during wet 15 15 8 22 26
dry 14 13 e11 25 32
after wet 7 6 e5 10 18
dry 2 2 -- -- --
16275000 before wet 5 3 e3 8 9
dry 8 5 e5 10 11
during wet 13 11 e5 34 162
dry 12 7 e2 10 27
after wet 8 4 e1 2 4
dry 4 2 h1 -- --
RES 1-3 during wet 33 30 e4 13 18
dry 45 30 e2 12 17
after wet 22 17 e3 8 11
dry 10 10 4 8 10

Water Quality Before, During, and After Highway Construction 27
Table 10. Turbidity at water-quality stations in the H-3 Highway study area, Oahu, Hawaii, water years 1983–99.[Minimum reporting level is 0.1 NTU; --, no data; NTU, Nephelometric Turbidity Unit; shaded values represent turbidity values that have exceeded the State of Hawaii water-quality standards for turbidity listed in table 3]
StationConstruction
period SeasonNumber of samples
Number of samples greater than the minimum
reporting levelGeometric
mean (NTU)
Concentration (NTU) exceeded
10 percent of the time
2 percent of the time
16226200 before wet 3 3 5.6 -- --
dry 8 8 1.5 5.4 6.7
during wet 52 52 9.0 190 520
dry 37 37 2.2 85 400
after wet 8 8 3.8 20 31
dry 3 3 0.4 -- --16227100 during wet 52 52 3.2 38 390
dry 35 35 2.5 34 27016265600 during wet 30 30 5.4 60 300
dry 34 34 4.0 31 79
after wet 35 35 1.8 9.0 29
dry 21 21 1.1 2.0 8.616265700 before wet 9 9 1.4 5.3 5.8
dry 9 9 0.9 1.8 7.6
during wet 19 19 11 116 2,660
dry 17 17 7.4 199 8,800
after wet 30 30 0.7 1.7 2.3
dry 17 17 0.4 1.0 1.216266500 before wet 8 8 0.8 1.5 2.2
dry 7 7 0.5 0.9 1.2
during wet 17 17 1.8 23 3,140
dry 17 17 0.8 1.6 22
after wet 29 29 0.5 1.4 13
dry 17 17 0.5 1.1 2.816267500 before wet 8 8 3.5 6.2 11
dry 9 9 3.0 3.5 7.5
during wet 16 16 14 120 447
dry 17 17 4.0 8.9 22
after wet 31 31 3.1 8.2 17
dry 17 17 4.1 16 5116269500 before wet 8 8 3.8 12 37
dry 7 7 3.2 4.8 6.3
during wet 16 16 2.2 5.2 13
dry 17 17 2.0 6.0 13
after wet 31 31 0.8 2.8 25
dry 14 14 1.0 3.5 3.9

28 Water Quality in the Halawa, Haiku, and Kaneohe Drainage Basins Before, During, and After H-3 Highway Construction
Table 10. Turbidity at water-quality stations in the H-3 Highway study area, Oahu, Hawaii, water years 1983–99—Continued[Minimum reporting level is 0.1 NTU; --, no data; NTU, Nephelometric Turbidity Unit; shaded values represent turbidity values that have exceeded the State of Hawaii water-quality standards for turbidity listed in table 3]
StationConstruction
period SeasonNumber of samples
Number of samples greater than
minimum reporting level
Geometric mean (NTU)
Concentration (NTU) exceeded
10 percent of the time
2 percent of the time
16270900 before wet 15 15 3.1 44 115
dry 10 10 1.1 1.2 27
during wet 37 37 2.2 24 300
dry 32 32 0.9 3.5 7.9
after wet 15 15 1.0 9.6 29
dry 5 5 0.3 0.3 0.416272200 during wet 52 52 3.7 31 120
dry 46 46 1.7 2.8 5.0
after wet 15 15 1.6 2.6 5.1
dry 5 5 0.7 1.2 1.416273950 before wet 3 3 13 -- --
dry 8 8 2.8 3.5 3.7
during wet 39 39 3.8 6.5 37
dry 34 34 3.0 4.4 17
after wet 15 15 2.7 4.0 4.7
dry 5 5 3.1 4.1 4.716274100 during wet 40 40 4.4 18 25
dry 34 34 3.5 6.3 11
after wet 15 15 2.7 5.2 6.7
dry 4 4 4.5 -- --16275000 before wet 5 5 0.7 1.0 1.0
dry 10 10 0.7 0.8 1.4
during wet 32 32 1.0 2.6 190
dry 30 30 0.8 5.1 19
after wet 22 22 0.4 0.8 41
dry 9 9 0.4 0.6 0.8RES 1-3 during wet 40 40 2.3 5.0 9.2
dry 73 73 1.6 3.4 13
after wet 35 35 2.6 8.8 16
dry 24 24 1.4 2.5 7.9

way Construction 29
INST
ANTA
NEO
US D
ISCH
ARGE
, IN
CUB
IC F
EET
PER
SECO
ND,
AN
D TU
RBID
ITY,
IN N
EPHE
LOM
ETRI
C TU
RBID
ITY
UNIT
S
1984 1986 1988 1990 1992 1994 1996 19971983 1985 1987 1989 1991 1993 1995
SAMPLE DATE
0.02
0.05
0.1
0.2
0.5
1
2
5
10
20
50
100
200
500600
INSTANTANEOUS DISCHARGETURBIDITY
End
cons
truct
ion,
Jun
e 19
92
Median discharge = 0.80 ft3/s Median discharge = 0.43 ft3/s
DURING AFTER
Station 16265600
Water Quality Before, During, and After High
Figure 7. Turbidity concentrations and instantaneous discharges at station 16265600, February 1983 to April 1998, Oahu, Hawaii.
also organic matter, high values at these sites may be, in part, due to algae growth observed during low-flow conditions at all stations that exceeded the geometric mean standards and to the waterfowl habitat observed upstream from stations 16267500 and 16273950. The high turbidity values computed for station 16265700 during construction also may be due to the upstream golf-course construction, which occurred during the same time as the highway construction (table 10). Because of these circumstances, none of the geometric mean exceedences during the construction time period can be attributed solely to highway construction. However, the 10- and(or) 2-percent-of-the-time exceedences during construction at all stations may be, in part, due to land disturbance caused by highway construction.
pH.—Median pH values at all stations ranged from 6.6 to 9.0 pH units (table 11). Lowest and highest pH values measured were 4.5 at station 16265700 and 10.1 pH at station 16227100. Normal pH values range from 6.5 to 8.5 for uncontaminated natural waters (Hem, 1985, p. 64). Except for a few high values of pH at most stations, pH values exceeded the standard, both during and after construction, only at the two urban stations, 16227100 and 16274100 (table 11). The interquartile ranges, the difference between values of the 75- and 25-percentile concentrations, were all less than or equal to 0.5 pH units except before construction at station 16275000; during construction at stations 16226200, 16227100, and 16272200; and after construction at station 16274100 (table
11). The median and 75-percentile pH values increased by more than 0.5 pH units from before to during construction at stations 16226200 and 16272200 (table 11). These increases may be construed as a violation of the pH standard (table 3).
Dissolved oxygen.—Median dissolved-oxygen values ranged from 61 to 132 percent saturation (table 12). Dissolved-oxygen values tended to be low in 25 percent of the measurements during all time periods only in the Kamooalii drainage basin at stations 16265600, 16265700, 16266500, 16267500, and 16269500, and in the reservoir itself (table 12). Station 16265600 was the only site with constantly low dissolved-oxygen values after construction. Low median dissolved-oxygen values in the reservoir were due to the low dissolved oxygen at deeper depths.
Temperature.—Whether any water-temperature values exceeded the standard is difficult to determine, because no day and night measurements were made to determine the ambient water temperatures. However, the majority of daytime water-temperature measurements tended not to vary more than 1°C from the median (table 13). Highest median water temperatures were measured at the urban sites, stations 16227100 and 16274100.
Specific conductance.—Specific-conductance values exceeded the standards most often at the intermittent stream sites, stations 16226200, 16227100, and 16269500 (table 14). At stations 16226200 and 16269500, the highest values occurred after highway construction. Specific-conductance

30 Water Quality in the Halawa, Haiku, and Kaneohe Drainage Basins Before, During, and After H-3 Highway Construction
Table 11. pH at water-quality stations in the H-3 Highway study area, Oahu, Hawaii, water years 1983–99.[Resolution is 0.1 pH unit; --, no data; shaded values represent pH values that have exceeded the State of Hawaii water-quality standards for pH listed in table 3]
Station Construction periodNumber of
measurements Minimum
Concentration percentile
25(median)
50 75 Maximum16226200 before 23 6.5 6.9 6.9 7.3 7.5
during 91 6.2 7.4 7.7 8.0 8.3after 11 6.7 7.3 7.6 7.7 7.9
16227100 during 89 6.7 8.6 9.0 9.3 10.1after 4 8.7 -- 9.0 -- 9.1
16265600 before 1 -- -- -- -- 5.9during 74 5.7 6.5 6.6 6.8 7.9after 57 6.0 6.6 6.6 6.8 7.9
16265700 before 19 6.0 6.5 6.8 7.0 8.6during 35 6.4 6.9 7.0 7.4 8.1after 48 4.5 6.6 6.8 7.1 7.6
16266500 before 16 6.1 6.4 6.7 6.8 7.0during 33 6.2 6.8 7.0 7.2 7.5after 46 6.0 6.6 6.8 6.9 7.4
16267500 before 17 6.3 6.8 6.9 7.1 7.4during 33 6.8 7.0 7.3 7.4 7.8after 48 6.3 7.0 7.2 7.4 7.6
16269500 before 17 6.0 6.8 6.9 7.0 7.4during 32 6.6 7.0 7.0 7.4 8.7after 45 6.5 6.8 7.1 7.3 7.5
16270900 before 43 6.3 6.9 7.1 7.4 8.3during 70 6.0 7.2 7.5 7.7 8.1after 21 7.0 7.4 7.6 7.7 7.9
16272200 before 11 6.8 7.1 7.2 7.4 7.7during 113 6.4 7.3 7.8 8.0 8.5after 20 6.5 7.6 7.8 8.0 8.1
16273950 before 11 7.1 7.4 7.6 7.8 7.9during 73 6.8 7.6 7.8 7.9 8.1after 20 6.8 7.7 7.8 8.0 8.1
16274100 during 73 6.7 8.3 8.6 8.8 9.3after 20 7.9 8.4 8.6 9.0 9.3
16275000 before 28 6.3 7.0 7.3 7.7 7.9during 62 6.5 7.6 7.8 7.9 8.2after 31 7.3 7.6 7.7 7.8 8.0
RES 1-3 during 271 6.4 7.2 7.4 7.6 8.7after 109 6.9 7.2 7.4 7.6 7.8

Water Quality Before, During, and After Highway Construction 31
Table 12. Dissolved oxygen saturation at water-quality stations in the H-3 Highway study area, Oahu, Hawaii, water years 1983–99.[Resolution is 1-percent saturation; --, no data; shaded values represent dissolved-oxygen percentages that have exceeded the State of Hawaii water-quality standards for dissolved oxygen listed in table 3]
Construction period
Concentration percentile
StationNumber of
measurements Minimum 25(median)
50 75 Maximum16226200 before 11 82 87 88 91 97
during 89 65 88 95 98 108after 10 73 81 88 97 101
16227100 during 87 65 119 131 149 186after 4 114 -- 132 -- 137
16265600 before 1 -- -- -- -- 79during 64 48 64 76 86 103after 57 37 56 61 68 102
16265700 before 18 74 83 90 95 106during 32 68 85 89 93 100after 47 50 74 85 92 101
16266500 before 15 78 82 85 97 107during 33 63 82 89 96 103after 45 47 74 79 84 99
16267500 before 17 74 78 81 92 97during 33 73 87 91 95 100after 47 63 81 84 90 107
16269500 before 15 60 64 82 92 105during 32 67 77 84 93 98after 45 30 81 86 91 133
16270900 before 25 79 86 94 102 113during 68 77 92 95 98 105after 20 78 95 98 100 101
16272200 before 1 -- -- -- -- 96during 98 68 97 102 107 134after 19 90 102 104 109 113
16273950 before 9 89 92 93 94 97during 73 89 95 96 98 103after 19 93 95 98 99 101
16274100 during 74 67 106 112 116 122after 21 103 108 114 120 136
16275000 before 15 62 91 94 97 98during 61 93 96 97 98 101after 31 93 97 98 100 103
RES 1-3 during 265 31 72 84 92 111after 102 26 71 79 86 101
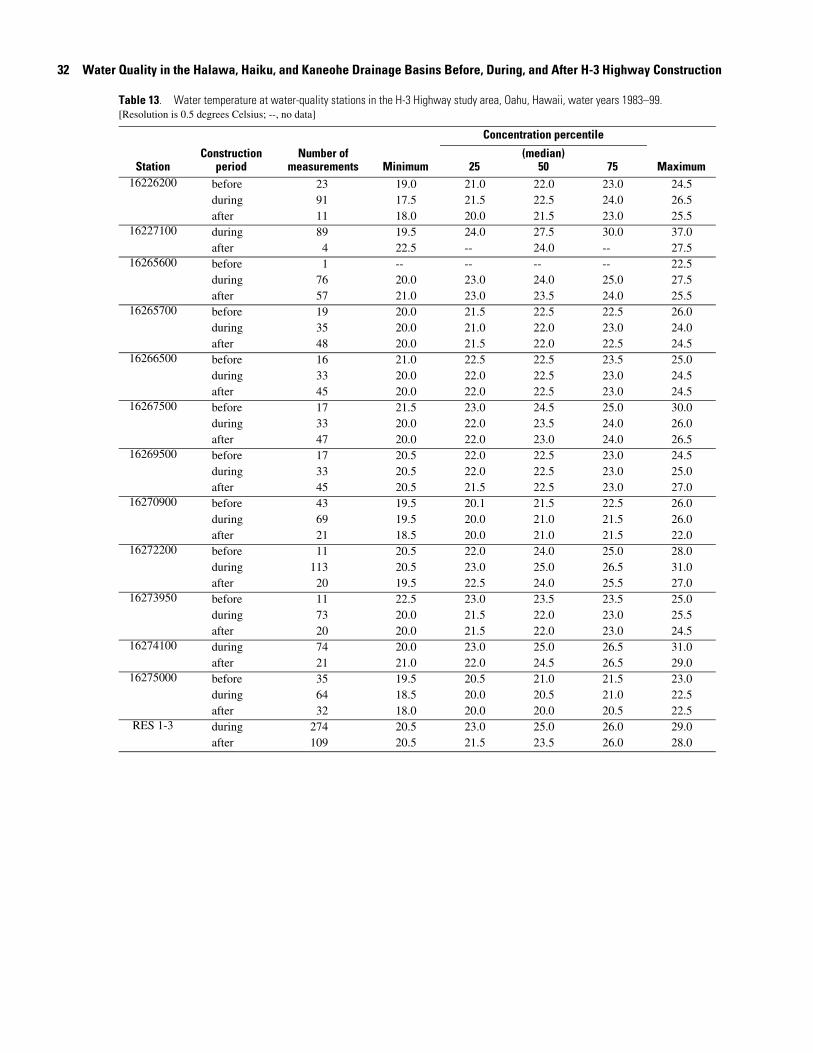
32 Water Quality in the Halawa, Haiku, and Kaneohe Drainage Basins Before, During, and After H-3 Highway Construction
Table 13. Water temperature at water-quality stations in the H-3 Highway study area, Oahu, Hawaii, water years 1983–99.[Resolution is 0.5 degrees Celsius; --, no data]
StationConstruction
period
Concentration percentile
Number of measurements Minimum 25
(median)50 75 Maximum
16226200 before 23 19.0 21.0 22.0 23.0 24.5during 91 17.5 21.5 22.5 24.0 26.5after 11 18.0 20.0 21.5 23.0 25.5
16227100 during 89 19.5 24.0 27.5 30.0 37.0after 4 22.5 -- 24.0 -- 27.5
16265600 before 1 -- -- -- -- 22.5during 76 20.0 23.0 24.0 25.0 27.5after 57 21.0 23.0 23.5 24.0 25.5
16265700 before 19 20.0 21.5 22.5 22.5 26.0during 35 20.0 21.0 22.0 23.0 24.0after 48 20.0 21.5 22.0 22.5 24.5
16266500 before 16 21.0 22.5 22.5 23.5 25.0during 33 20.0 22.0 22.5 23.0 24.5after 45 20.0 22.0 22.5 23.0 24.5
16267500 before 17 21.5 23.0 24.5 25.0 30.0during 33 20.0 22.0 23.5 24.0 26.0after 47 20.0 22.0 23.0 24.0 26.5
16269500 before 17 20.5 22.0 22.5 23.0 24.5during 33 20.5 22.0 22.5 23.0 25.0after 45 20.5 21.5 22.5 23.0 27.0
16270900 before 43 19.5 20.1 21.5 22.5 26.0during 69 19.5 20.0 21.0 21.5 26.0after 21 18.5 20.0 21.0 21.5 22.0
16272200 before 11 20.5 22.0 24.0 25.0 28.0during 113 20.5 23.0 25.0 26.5 31.0after 20 19.5 22.5 24.0 25.5 27.0
16273950 before 11 22.5 23.0 23.5 23.5 25.0during 73 20.0 21.5 22.0 23.0 25.5after 20 20.0 21.5 22.0 23.0 24.5
16274100 during 74 20.0 23.0 25.0 26.5 31.0after 21 21.0 22.0 24.5 26.5 29.0
16275000 before 35 19.5 20.5 21.0 21.5 23.0during 64 18.5 20.0 20.5 21.0 22.5after 32 18.0 20.0 20.0 20.5 22.5
RES 1-3 during 274 20.5 23.0 25.0 26.0 29.0after 109 20.5 21.5 23.5 26.0 28.0

Water Quality Before, During, and After Highway Construction 33
values at stations 16226200 and 16269500 increased throughout the construction period (fig. 8) most likely due to construction. Increased municipal ground-water withdrawals began during the construction period in 1990 upstream from station 16269500. Because station 16269500 was not a continuous streamflow site, the effect of the increased pumpage on streamflow and specific conductance cannot be determined. No trend at station 16227100 due to construction is apparent (fig. 8). Values were high during and after construction (table 14). High values at station 16227100 are most likely due to the urban effects associated with the light industrial park and concrete-lined channel. The pattern of increasing conductance during and after construction also is present at stations 16266500 and 16267500 as well, although the values did not exceed the standard (table 14).
Trace elements and organic compounds.—Ten constituents were detected at concentration levels in excess of the State of Hawaii water-quality standards for trace metals and organic compounds in freshwater (table 15). The detections in excess of standards were predominantly during construction and at a total of nine stations (table 16). In most cases, a constituent in excess of standards was detected only once at any station. Chlordane, copper, dieldrin, and zinc were the only constituents to be detected in excess of standards more than once at any station. At the urban station 16227100, four constituents were detected in excess of standards, and three constituents in excess of standards were detected at three stations: 16272200, 16273950, and 16274100.
Chlordane concentrations in excess of the chronic water-quality standard were detected in 3 out of 18 samples at station 16274100. Dieldrin concentrations in excess of the chronic water-quality standard were detected in nearly all samples from station 16274100 and in more than 15 percent of samples from the two stations immediately upstream, 16272200 and 16273950 (table 16). Stations 16272200, 16273950, and 16274100 all receive some runoff from urban areas (fig. 2). Chlordane and dieldrin, both insecticides used to control termites, were not detected in any samples from stations affected by highway construction without other urban influence. Bed-sediment data from station 16274100 also were high in dieldrin in a study by Brasher and Anthony (2000).
Acute water-quality standards were exceeded a few times by concentrations of the common metals aluminum, copper, and zinc and once by silver (table 16). Aluminum, copper, and zinc were detected in a majority of the samples collected during the study (table 15). Late in the study period, the NWQL raised the minimum reporting levels for a number of metals determined by inductively coupled plasma-atomic emission spectrometry method (ICP-AES) because of an excessive rate of false positive results (U.S. Geological Survey, 1997b, 1998a). These values are presented as the revised minimum reporting levels in table 4. Concentrations between the original and revised minimum reporting levels have a 1- to 50-percent chance, depending on the constituent, of being a false positive (U.S. Geological Survey, 1998a). The ICP-AES method was used to determine dissolved metal
concentrations during the entire study period. During 1997 and 1998, the project also submitted 10 samples of blank water for analysis by inductively coupled plasma-mass spectrometry method (ICP-MS), which has lower minimum reporting levels than ICP-AES. These blank samples were processed through all the same steps as routine environmental samples and were intended to detect potential sources of the metals throughout the term of the study. When the study was initially planned 15 years earlier, such targeted quality-assurance samples had not been commonly recognized as necessary.
The distribution of copper and zinc contamination caused by sample handling and processing can be estimated from the analysis of blank water. The highest measured concentration among 10 blanks would be expected to be exceeded randomly in about 7 percent of all environmental samples (Jim Eychaner, U.S. Geological Survey, written commun., December 30, 2003). Thus, if the blank samples represent the full study period, more than 3-µg/L copper and 5-µg/L zinc could be found in 7 percent of the samples, even if none were present in the environment (table 17). In fact, 13 percent of the environmental samples exceeded 3-µg/L copper and 35 percent exceeded 5-µg/L zinc, which indicates that environmental sources of copper and zinc were measured in some cases. Copper usually has concentrations of less than 10 µg/L and zinc has a median value of 20 µg/L in streams (Hem, 1985). The high values of copper (detected at station 16226200) and zinc (detected at stations 16265600 and 16273950)(table 16) may indicate sources other than natural inputs, even though Hawaiian soils also are high in copper and zinc because of the volcanic parent material (De Carlo and Anthony, 2002; Halbig and others, 1985). Median copper and zinc concentrations from unfiltered samples, (total recoverable samples) were, on average, only twice as great as dissolved copper and zinc median values (Wong and Young, 2000). Both stations 16265600 and 16273950 are near heavily used highways, Kamehameha and Likelike, respectively (fig. 2), as well as residential areas, so potential anthropogenic sources exist. The high copper concentrations at station 16226200 may be due to highway construction because no other anthropogenic sources exist prior to highway construction upstream from this site.
High aluminum values are not surprising because Hawaiian soils are naturally high in aluminum (Moir and others, 1936), but aluminum usually does not exist in the dissolved fraction (Hem, 1985). Median aluminum concentrations from total recoverable samples are about 10 times higher than the median values for dissolved aluminum based on samples collected in the study area (Wong and Young, 2000). Aluminum contamination from sample handling and processing of the samples was very minimal (table 17).
Because silver is rare in Hawaiian soils and no readily apparent anthropogenic source exists anywhere in the study area, it was a surprise that silver was detected at station 16272200 (table 16). The detection of silver, however, may be false. The revised minimum reporting levels (table 4)
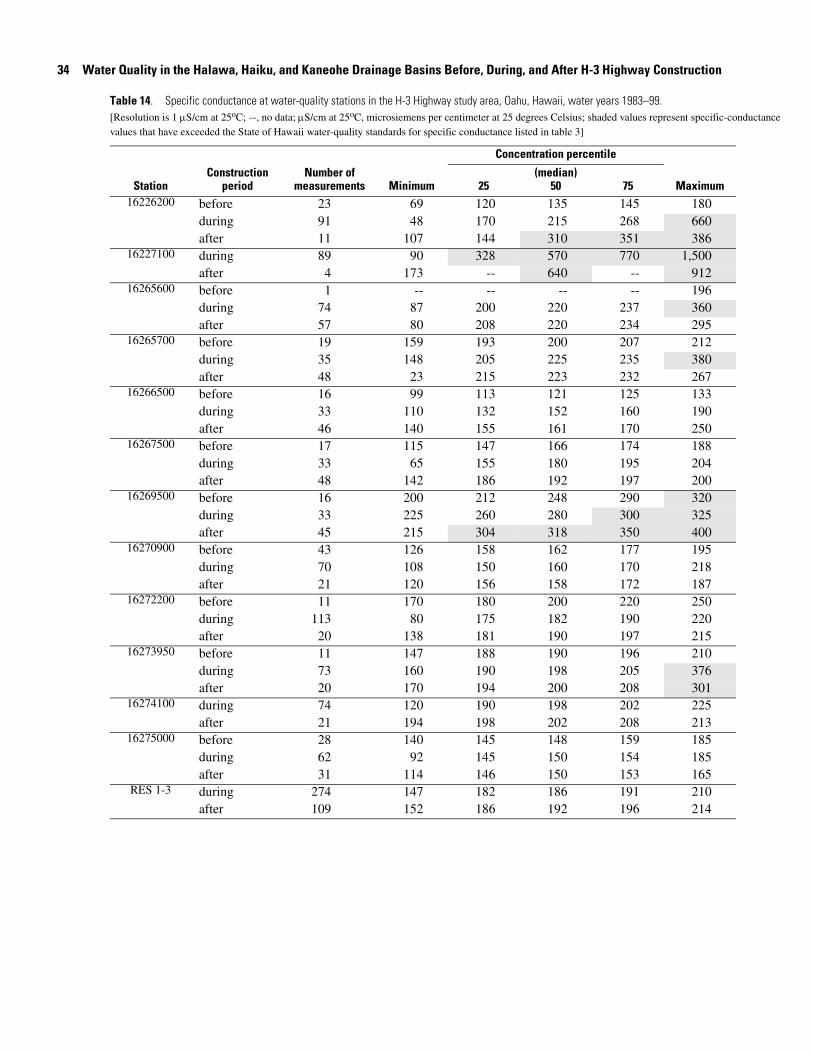
34 Water Quality in the Halawa, Haiku, and Kaneohe Drainage Basins Before, During, and After H-3 Highway Construction
Table 14. Specific conductance at water-quality stations in the H-3 Highway study area, Oahu, Hawaii, water years 1983–99.[Resolution is 1 µS/cm at 25oC; --, no data; µS/cm at 25oC, microsiemens per centimeter at 25 degrees Celsius; shaded values represent specific-conductance values that have exceeded the State of Hawaii water-quality standards for specific conductance listed in table 3]
StationConstruction
period
Concentration percentile
Number of measurements Minimum 25
(median)50 75 Maximum
16226200 before 23 69 120 135 145 180during 91 48 170 215 268 660after 11 107 144 310 351 386
16227100 during 89 90 328 570 770 1,500after 4 173 -- 640 -- 912
16265600 before 1 -- -- -- -- 196during 74 87 200 220 237 360after 57 80 208 220 234 295
16265700 before 19 159 193 200 207 212during 35 148 205 225 235 380after 48 23 215 223 232 267
16266500 before 16 99 113 121 125 133during 33 110 132 152 160 190after 46 140 155 161 170 250
16267500 before 17 115 147 166 174 188during 33 65 155 180 195 204after 48 142 186 192 197 200
16269500 before 16 200 212 248 290 320during 33 225 260 280 300 325after 45 215 304 318 350 400
16270900 before 43 126 158 162 177 195during 70 108 150 160 170 218after 21 120 156 158 172 187
16272200 before 11 170 180 200 220 250during 113 80 175 182 190 220after 20 138 181 190 197 215
16273950 before 11 147 188 190 196 210during 73 160 190 198 205 376after 20 170 194 200 208 301
16274100 during 74 120 190 198 202 225after 21 194 198 202 208 213
16275000 before 28 140 145 148 159 185during 62 92 145 150 154 185after 31 114 146 150 153 165
RES 1-3 during 274 147 182 186 191 210after 109 152 186 192 196 214

Water Quality Before, During, and After Highway Construction 35
1984 1986 1988 1990 1992 1994 1996
SAMPLE DATE
0
25
50
75
100
125
150
175
200
225
250
275
300
325
350
375
400
425
SPEC
IFIC
CON
DUCT
ANCE
, IN
MIC
ROSI
EMEN
S PE
R CE
NTI
MET
ER A
T 25
º CEL
SIUS
SPEC
IFIC
CON
DUCT
ANCE
, IN
MIC
ROSI
EMEN
S PE
R CE
NTI
MET
ER A
T 25
º CEL
SIUS
B
A C
1984 1986 1988 1990 1992 1994 1996 1998SAMPLE DATE
0
100
200
300
400
500
600
700
1990 1992 1994 1996 1998SAMPLE DATE
0
200
400
600
800
1000
1200
1400
1600Station 16226200 Station 16227100
Station 16269500
Figure 8. Specific conductance at (A) station 16226200, May 1983 to March 1999, (B) station 16269500, February 1983 to January 1998, and (C) station 16227100, November 1988 to November 1998, Oahu, Hawaii

36 Water Quality in the Halawa, Haiku, and Kaneohe Drainage Basins Before, During, and After H-3 Highway Construction
Table 15. State of Hawaii water-quality standards for trace metals, insecticides, herbicides, and polychlorinated compounds, and the number of samples exceeding standards at water-quality stations in the H-3 Highway study area, Oahu, Hawaii, February 1983 to August 1999.
[µg/L, micrograms per liter; ns, no standard; +, value is minimum standard, higher standard may apply depending on the receiving water hardness value]
Constituent
State of Hawaii freshwater water-quality standard
Total number of samples at all
study sites
Total number of samples exceeding original minimum
reporting limit(table 4)
Total number of samples exceeding
State of Hawaii standard
acute/chronicacute(µg/L)
chronic(µg/L)
Aldrin 3.0 ns 240 2 0
Aluminum, dissolved 750 260 235 144 1/2
Arsenic, dissolved 360 190 124 32 0
Beryllium, dissolved 43 ns 124 9 0
Cadmium, dissolved 3+ 3+ 124 6 0
Chlordane 2.4 0.0043 240 5 0/5
Chlorpyrifos 0.083 0.041 134 14 1/1
Chromium, dissolved 16 11 127 21 0
Copper, dissolved 6+ 6+ 127 102 2/2
DDE 0.03 ns 240 0 0
DDT 1.1 0.001 240 2 0/2
2,4-D 670 ns 222 18 0
Dieldrin 2.5 0.0019 240 28 0/28
Endosulfan-alpha 0.22 0.056 240 0 0
Endrin 0.18 0.0023 240 0 0
Heptachlor 0.52 0.0038 240 0 0
Lead, dissolved 29+ 29+ 127 32 0
Lindane 2.0 0.08 240 1 0
Malathion ns 0.1 226 8 0/1
Mercury, dissolved 2.4 0.55 123 23 0
Methoxychlor ns 0.03 240 0 0
Mirex ns 0.001 240 0 0
Nickel, dissolved 5+ 5+ 238 83 0
Parathion 0.065 0.013 226 0 0
PCB 2.0 0.014 240 1 0/1
Selenium, dissolved 20 5 235 2 0
Silver, dissolved 1+ 1+ 235 4 1/1
Toxaphene 0.73 0.0002 240 0 0
Zinc, dissolved 22+ 22+ 127 85 3/3

Water Quality Before, During, and After Highway Construction 37
Table 16. Summary of dissolved trace metals, insecticides, and polychlorinated compounds at water-quality stations that exceeded State of Hawaii water-quality standards in the H-3 Highway study area, Oahu, Hawaii, February 1983 to August 1999.[µg/L, micrograms per liter; b, before-construction period; d, during-construction period; a, after-construction period; State of Hawaii standards listed in table 15]
Constituent Stationnumber Station name
Total number of samples
Total number of samples
exceeding State of Hawaii standard
Highest concentration
measured(µg/L)
Time period when highest
concentration occurred
Aluminum, dissolved 16226200 North Halawa Stream near Honolulu 25 1 340 d16227100 Halawa Stream below H-1 17 1 300 d16272200 Kamooalii Stream below Luluku Stream 31 1 1,200 d
Chlordane 16227100 Halawa Stream below H-1 16 1 0.1 d
16273950 South Fork Kapunahala Stream 24 1 0.1 d16274100 Kaneohe Stream 18 3 0.1 d
Chlorpyrifos 16265600 Right Branch Kamooalii Stream 15 1 0.9 d
Copper, dissolved 16226200 North Halawa Stream near Honolulu 15 2 14 d
DDT 16227100 Halawa Stream below H-1 16 1 0.01 d16275000 Haiku Stream 32 1 0.08 d
Dieldrin 16227100 Halawa Stream below H-1 16 1 0.01 d16272200 Kamooalii Stream below Luluku Stream 33 5 0.01 d, a
16273950 South Fork Kapunahala Stream 24 4 0.02 d16274100 Kaneohe Stream 18 17 0.05 d, a
212335157482603 RES 1-3 22 1 0.01 d
Malathion 16265700 Kamooalii Stream at altitude 220 ft 3 1 0.28 b
PCB 16274100 Kaneohe Stream 18 1 0.2 d
Silver, dissolved 16272200 Kamooalii Stream below Luluku Stream 31 1 2.0 d
Zinc, dissolved 16265600 Right Branch Kamooalii Stream 15 2 160 d16273950 South Fork Kapunahala Stream 11 1 100 d

38 Water Quality in the Halawa, Haiku, and Kaneohe Drainage Basins Before, During, and After H-3 Highway Construction
Table 17. Summary of dissolved trace metals quality-assurance blank samples collected during 1997 and 1998 as part of the water-quality monitoring study of the H-3 Highway, Oahu, Hawaii.[µg/L, micrograms per liter; --, not applicable]
Trace metal constituent,
dissolved fraction Minimum reporting
limit (µg/L)Method detection
limit (µg/L)
Total number of samples
Total number of detections exceeding
method detection limit
Highest concentration
detected(µg/L)
Mean value of detected
concentrations (µg/L)
Aluminum 10 0.3 10 1 1.1 --Barium 2 0.2 10 0 -- --Beryllium 0.5 0.2 10 0 -- --Cadmium 1 0.3 10 0 -- --Chromium 1 0.2 10 0 -- --Cobalt 3 0.2 10 0 -- --Copper 1 0.2 10 5 2.9 1.2Iron 3 3 10 0 -- --Lead 1 0.3 10 0 -- --Manganese 1 0.1 10 1 1.7 --Molybdenum 10 0.2 10 0 -- --Nickel 1 0.5 10 0 -- --Silver 1 0.2 10 0 -- --Strontium 0.5 0.1 10 2 0.3 0.2Zinc 3 0.5 10 6 4.9 1.9
calls into question the presence of silver at station 16272200, because the highest concentration of 2 µg/L is below the newer 4 µg/L minimum reporting level.
Waimaluhia Reservoir.—The water-quality data collected from Waimaluhia Reservoir at the primary reservoir site (RES 1-3) were compared to the State of Hawaii water-quality standards specific to streams, although these standards do not apply to reservoirs. This was done for comparative purposes with the tributaries and downstream stream sites of the reservoir. Geometric mean values in the reservoir exceeded the State standards for total and NO2+NO3 nitrogen (tables 5 and 7). Total nitrogen geometric means were higher during construction than after, and NO2+NO3 nitrogen geometric means increased after construction. This change was similar to the effect observed at stations on two tributaries to the reservoir (stations 16265700 and 16269500) (tables 5 and 7). Geometric mean values of total and NO2+NO3 nitrogen were lower downstream from the reservoir at station 16272200 than in the reservoir (tables 5 and 7). The remaining constituents had geometric mean values that were similar in and downstream from the reservoir. Geometric mean values of all constituents at station 16270900, which contributes flow to 16272200 downstream from the reservoir outlet, were all lower than at 16272200. There may be some dilution effect, but only very small, because the contribution of streamflow from station 16270900 to 16272200 is only about 12 percent, on average, computed from daily mean streamflow data collected in water years 1985–97 (Wong, 2001). Upstream from the reservoir, geometric mean values for total and NO2+NO3 nitrogen at all tributaries (stations 16265600, 16265700,
16266500, 16267500, and 16269500) were high, about equal to those at RES 1-3, and exceeded the standards during all time periods (before, during, and after construction) at all stations except 16266500 and 16267500 (tables 5 and 7). Therefore, much of the nutrient input to the reservoir exists as natural or anthropogenic sources not related to highway construction, and the reservoir may serve as a nutrient sink because nitrogen values are lower downstream. Nutrient values and other limnological data collected in Waimaluhia Reservoir (Matsuoka and others, 1991) indicate that the reservoir is eutrophic.
Temperature, pH, and specific-conductance data from all depths at RES 1-3 fell below or within the ranges listed in the water-quality standards (tables 3, 11, 13, and 14). Only dissolved oxygen fell below the standard level of 80 percent saturation (tables 3 and 12). This was due to the low dissolved oxygen at the deeper reservoir depths (table 18). Nutrient, pH, and specific-conductance data collected by reservoir depth (table 18) showed no differences with depth or by time period. The only changes by depth both during and after construction were with temperature and dissolved oxygen, which was expected because deeper waters tend to be cooler and have less oxygen (table 18). Turbidity and TSS were, on average, 1 NTU or 1 mg/L higher at the deepest depths compared to the shallower depths (table 18). This may be, in part, due to interference by the Van Dorn sampler close to the reservoir bottom or by possible turbidity currents.
Additional comparisons.—Results of the upstream/downstream comparisons between stations 16226200 and 16227100 and between stations

Water Quality Before, During, and After Highway Construction 39
Table 18. Median values of selected water-quality properties and constituents by depth at Waimaluhia Reservoir, stations 212335157482603 (RES 1-3) and 212329157483102 (RES 3-2) during and after H-3 Highway construction, Oahu, Hawaii, May 1983 to January 1998.[--, no data; mg/L, milligrams per liter; oC, degrees Celsius; µS/cm at 25oC, microsiemens per centimeter at 25 degrees Celsius; NTU, Nephelometric Turbidity Unit; e, median estimated by log-probability regression due to values below the detection limit; <, less than]
Depth(feet)
pH(pH units)
Dissolved- oxygen
saturation(percent)
Dissolved- oxygen
concentration(mg/L)
Water temperature
(oC)
Specific conductance
(µS/cm at 25oC)
Total nitrate plus nitrite
nitrogen(mg/L)
Ammonia and organic nitrogen
(mg/L)Phosphorus
(mg/L)
Total suspended
solids(mg/L)
Turbidity(NTU)
Station 212335157482603 (RES 1-3), during highway construction, May 1983 to June 1992Number of measurements or samples varied by depth, property, and constituent, and ranged from 9 to 38
1 7.6 94 7.6 25.5 184 0.30 e0.40 e0.02 e2 1.23 7.6 94 7.5 25.5 184 -- -- -- -- --5 7.6 88 7.2 25.5 185 -- -- -- -- --7 7.4 84 7.0 25.0 186 0.30 e0.40 e0.02 e3 1.39 7.3 76 6.1 25.0 188 -- -- -- -- --11 7.2 68 5.6 24.0 189 0.40 0.30 e0.02 e6 2.212 7.2 63 5.2 24.0 188 e0.30 e0.40 0.02 e6 2.3
Station 212335157482603 (RES 1-3), after highway construction, August 1992 to January 1998Number of measurements or samples varied by depth, property, and constituent, and ranged from 5 to 17
1 7.4 84 7.0 23.0 188 0.41 <0.20 <0.01 e2 1.43 7.4 84 6.8 24.0 188 -- -- -- -- --5 7.4 82 6.8 24.0 188 -- -- -- -- --7 7.4 80 6.6 23.5 190 0.40 <0.20 <0.01 e4 1.39 7.3 70 6.2 23.5 192 -- -- -- -- --11 7.3 66 5.6 23.0 196 0.44 <0.20 e0.02 e6 2.5
Station 212329157483102 (RES 3-2), during highway construction, May 1983 to June 1992Number of measurements or samples varied by depth, property, and constituent, and ranged from 6 to 23
1 7.6 96 7.6 26.5 184 e0.30 e0.30 e0.01 e3 1.02 7.6 97 7.9 25.5 180 -- -- -- -- --3 7.6 95 7.6 26.5 185 -- -- -- -- --5 7.6 90 7.2 26.0 184 -- -- -- -- 1.66 7.5 92 7.6 26.0 184 e0.30 e0.40 e0.01 e2 1.27 7.5 87 7.2 25.5 185 -- -- -- -- --9 7.4 84 6.9 25.0 186 -- -- -- -- --10 7.4 78 6.6 25.0 186 e0.30 0.30 e0.01 e4 2.411 7.3 68 5.6 24.0 182 -- -- -- -- --
Station 212329157483102 (RES 3-2), after highway construction, August 1992 to April 1998Number of measurements or samples varied by depth, property, and constituent, and ranged from 4 to 15
1 7.6 87 7.3 23.0 186 0.37 <0.20 <0.01 e2 1.33 7.6 87 7.0 22.5 188 -- -- -- -- --5 7.6 86 7.3 22.5 188 0.39 <0.20 <0.01 e2 1.37 7.6 85 7.0 22.5 188 -- -- -- -- --9 7.6 83 7.0 22.5 186 -- -- -- -- --10 7.6 81 6.8 23.0 188 0.38 <0.20 0.02 e4 2.8
16272200 and 16274100 are shown in table 19. Significant differences (p-values less than 0.05) between stations 16226200 and 16227100 were detected only among wet-season turbidity data (table 19). Wet-season turbidity values were significantly higher upstream at station 16226200, which could be a construction-related effect. The differences due to urban Kaneohe were more pronounced as shown by the data from stations 16272200 and 16274100. Combined (wet- and dry-season) data and dry-season data for all constituents tested were significantly higher downstream at station 16274100
because of urban effects (table 19). The only significant wet-season difference was with total and NO2+NO3 nitrogen loads, both being higher at station 16274100.
Because land-use changes upstream from stations 16270900 and 16275000 were minimal prior to highway construction, a comparison was made between data collected prior to 1983 (table 20) and data that was collected during this study. Cox and others (1973) determined a total nitrogen average of 0.26 mg/L at station 16275000. Compared to the geometric means, which would be lower than average

40 Water Quality in the Halawa, Haiku, and Kaneohe Drainage Basins Before, During, and After H-3 Highway Construction
Table 19. Rank-sum test p-value results of selected water-quality constituent instantaneous loads and values between upstream and downstream stations during H-3 Highway construction in the Halawa and Kaneohe drainage basins, Oahu, Hawaii, 1983–1997[Shaded values represent significant results with p-values less than 0.05; wet season is from November 1 to April 30 and dry season is from May 1 to October 31; lbs/day, pounds per day; NTU, Nephelometric Turbidity Unit]
Constituent All data Wet-season data Dry-season data RemarksStations 16226200 (upstream) and 16227100 (downstream), Halawa drainage area, during
highway construction, water years 1988-97Total nitrogen (lbs/day) 0.48 0.87 0.18Nitrite plus nitrate nitrogen(lbs/day) 0.93 0.59 0.46Total phosphorus (lbs/day) 0.36 0.82 0.13Total suspended solids (lbs/day) 0.83 0.38 0.15Turbidity (NTU) 0.35 0.02 0.16 Values at 16226200 higher.
Stations 16272200 (upstream) and 16274100 (downstream), Kaneohe drainage area, during highway construction, water years 1983-96
Total nitrogen (lbs/day) 0.00 0.04 0.02 Loads at 16274100 higher.Nitrite plus nitrate nitrogen (lbs/day) 0.00 0.00 0.02 Loads at 16274100 higher.Total phosphorus (lbs/day) 0.00 0.05 0.00 Loads at 16274100 higher.Total suspended solids (lbs/day) 0.00 0.10 0.00 Loads at 16274100 higher.Turbidity (NTU) 0.00 0.08 0.00 Values at 16274100 higher.
Table 20. Previously collected water-quality data at stations 16270900 Luluku Stream and 16275000 Haiku Stream in the H-3 Highway study area, Oahu, Hawaii[--, no data; mg/L, milligrams per liter; oC, degrees Celsius; µs/cm, microsiemens per centimeter; >, greater than; JTU, Jackson turbidity units]
Constituent or property
Station 16270900 Station 16275000
Data source
Number of observations or samples Minimum Median Maximum
Number of observations or samples Minimum Median Maximum
pH (units) 6 6.0 7.2 7.5 28 6.0 7.1 8.5 Matsuoka, 1983
Temperature (oC) 5 18.0 20.0 21.0 26 19.0 20.5 22.0 Matsuoka, 1983
Specific conduc-tance (µs/cm)
6 130 142 150 28 134 160 206 Matsuoka, 1983
Nitrite plus nitrate nitrogen (mg/L)
138 0.005 0.16 >1.4 8 0.01 0.04 0.21 Dugan, 1977, Matsuoka, 1983
Turbidity (JTU) 5 0 1 4 12 0 1 2 Matsuoka, 1983
(table 5), the earlier data were similar and slightly lower than the before- and during-construction data at station 16275000. The median NO2+NO3 nitrogen at station 16270900 computed by Dugan (1977) was similar to the study data geometric means (table 7). At station 16275000, median NO2+NO3 nitrogen also was lower than, but similar to, the before-construction study data and lower than the during-construction data (tables 7 and 20). The older Jackson Turbidity Unit (JTU) was similar to the NTU but not exactly equivalent (Fishman and Friedman, 1989), and geometric mean values (table 10) were similar to the older data median values at both stations. The pH and water temperature data collected by Cox and others (1973) were
similar to that in Matsuoka (1983), so are not presented in table 20. For pH, temperature, and specific conductance, the older data were similar to the current data (tables 11, 13, and 14). The past pH data at station 16275000 have a lower median pH (table 20), and median temperature and specific conductance at station 16270900 also are lower in the previous data but, in all cases, not greatly so. Therefore, for these two stations, any effect the highway construction had on the above-discussed properties and constituents was temporary, and no long-term change in water-quality trends is apparent based on this simple comparison.

Summary and Conclusions 41
Summary and Conclusions
Selected water-quality data collected before, during, and after construction of the H-3 Highway at 13 water-quality stations were compared to the State of Hawaii Department of Health water-quality standards to determine the effects of highway construction on the water quality of the affected streams. The geometric mean and concentrations not to be exceeded 10- and 2-percent-of-the-time were used as numeric standards for five water-quality constituents: total nitrogen, nitrite plus nitrate (NO2+NO3) nitrogen, total phosphorus, total suspended solids, and turbidity. The remaining standards consist of a single numeric criteria not to be exceeded, except for water temperature and pH, which depend on deviations from ambient conditions. Numeric standards for total nitrogen, NO2+NO3 nitrogen, total suspended solids, and turbidity are dependent on wet or dry seasons, with wet-season standards being higher. For constituents with data determined to be below the minimum reporting levels, log-probability regression or one-half minimum reporting level substitution methods were used to determine the numeric values for comparison to the water-quality standards.
Highway construction had no significant effect on the geometric means of total nitrogen concentrations. The geometric means of total nitrogen exceeded the standards at all 12 streams and the primary reservoir site both before and during construction. At almost all stations where the total nitrogen geometric means exceeded the standards, the standards for the 10- and 2-percent-of-the-time concentrations also were exceeded.
The NO2+NO3 nitrogen geometric mean standards were exceeded before, during, and after construction at all sites except during the wet season before construction at stations 16266500, 16267500, and 16275000 and after construction at stations 16226200 and 16267500. At these sites, land-use effects prior to highway construction were minimal. Also, at almost all stations where the NO2+NO3 nitrogen geometric means exceeded the standards, the standards for the 10- and 2-percent-of-the-time concentrations also were exceeded. Highway construction had a significant effect on increasing NO2+NO3 nitrogen concentrations only at station 16266500.
Highway construction did not have an effect on total phosphorus values except at station 16226200. Geometric means for total phosphorus at all stations did not exceed the standards except at stations 16265600 and 16265700 during construction, dry season. Golf courses exist or were built upstream from both these stations, and fertilizer use may be the cause of high phosphorus values. No before-construction data were collected at station 16265600, but at station 16265700, there were no significant differences in phosphorus concentrations before, during, or after highway construction. Phosphorus standards for the 10- and 2-percent-of-the-time concentrations were exceeded at 7 of the 13 sites. Exceedences of these standards, except at station 16226200, may be, in part,
due to existing upstream agricultural and urban land use. The land disturbances caused by highway construction most likely contributed to the high values at station 16226200.
Highway construction did have an effect on total suspended-solids concentrations. Geometric means for total suspended solids exceeded the standards only at stations 16227100 and 16274100, both urban sites, during construction during the dry season. The 10- and 2-percent-of-the-time concentrations were exceeded at most stations only during construction. High values for the 10- and 2-percent-of-the-time concentrations most likely are due to land disturbances caused by highway construction. After construction, total suspended-solids values were still high enough to exceed the 10- and 2-percent-of-the-time concentrations at stations 16226200 and 16267500.
High turbidity values during highway construction were, in part, due to land disturbance caused by the highway construction. Turbidity geometric means were high enough to exceed the standards during construction at stations 16226200, 16227100, 16265600, 16265700, 16267500, 16273950, and 16274100. These exceedences, however, cannot be directly attributed to highway construction because of before-construction exceedences and existing land-use activities upstream from these sites. The 2-percent-of-the-time standard was exceeded at all stations during construction while the 10-percent-of-the-time standard was exceeded at all stations except 16273950, 16275000, and RES 1-3.
The effects of highway construction on total suspended solids and turbidity can be considered temporary due to land disturbances, because after-construction values do not exceed the standards except at a few stations of which only total suspended solids at stations 16226200 and 16267500 and turbidity at station 16226200 can be directly attributed to after-construction effects. This effect is similar to those observed in other studies.
Highway construction had no effect on the physical water-quality properties of pH, dissolved oxygen, and temperature. No effects were observed on specific conductance except at stations 16226200 and 16269500. At these two sites, specific-conductance values increased throughout the study period, most likely due to changing land use caused by highway construction. Median values of specific conductance also increased during the study period at stations 16266500 and 16267500, although not in excess of standards. No effects were observed on selected trace metals and organic chemical compounds because of highway construction. High dieldrin concentrations detected at station 16274100 were likely caused by the urban use of this chemical. No effects due to highway construction were observed in the water quality of Waimaluhia Reservoir. The reservoir is naturally eutrophic and acts as a nutrient sink.
In comparing selected water-quality data collected downstream from highway construction but upstream from urban areas with that collected downstream from urban areas during highway construction, no significant differences were

42 Water Quality in the Halawa, Haiku, and Kaneohe Drainage Basins Before, During, and After H-3 Highway Construction
observed in Halawa Stream. Turbidity values were higher upstream at station 16226200 during the wet season than downstream because of the highway construction. Urban land use contributed to higher loads or values of total nitrogen, NO2+NO3 nitrogen, phosphorus, total suspended solids, and turbidity at station 16274100, than at station 16272200, which was affected only by highway construction or agriculture. Data at stations 16270900 and 16275000 collected prior to 1983 were similar to data collected during this study. Land-use changes prior to highway construction were minimal in these basins and for the properties and constituents compared; therefore, little long-term change due to highway construction was observed.
References Cited
AECOS, Inc., 1981, Final report on monitoring activities Kaneohe-Kailua flood control project: AECOS, Inc., Kaneohe, Hawaii, 44 p.
Barrett, M.E., Zuber, R.D., Collins, E.R., III, Malina, J.F., Jr., Charbeneau, R.J., and Ward, G.H., 1993, A review and evaluation of literature pertaining to the quantity and control of pollution from highway runoff and construction: Center for Research in Water Resources Technical Report 239, Bureau of Engineering Research, University of Texas at Austin, 140 p.
Barrett, M.E., Malina, J.F., Jr., Charbeneau, R.J., and Ward, G.H., 1995, Water quality and quantity impacts of highway construction and operation:—Summary and conclusions: Center for Research in Water Resources Technical Report 266, Bureau of Engineering Research, University of Texas at Austin, 35 p.
Blumenstock, D.I., and Price, Saul, 1961, Climates of the states—Hawaii: U.S. Department of Commerce, Environmental Science Services Administration, Climatography of the United States, no. 60–51, 27 p.
Brasher, A.M., and Anthony, S.S., 2000, Occurrence of organochlorine pesticides in streambed sediment and fish from selected streams on the island of Oahu, Hawaii, 1998: U.S. Geological Survey FS–140–00, 6 p.
Britton, L.J., and Greeson, P.E., eds., 1989, Methods for collection and analysis of aquatic biological and microbiological samples: U.S. Geological Survey Techniques of Water-Resources Investigations, book 5, chap. A4, 363 p.
Childress, C.J.O., Foreman, W.T., Connor, B.F., and Maloney, T.J., 1999, New reporting procedures based on long-term method detection levels and some considerations for interpretations of water-quality data provided by the U.S. Geological Survey National Water Quality Laboratory: U.S. Geological Survey Open-File Report 99–193, accessed June 6, 2003, at http://water.usgs.gov/owq/OFR_99-193/index.html
Clarke, J.U., 1998, Evaluation of censored data methods to allow statistical comparisons among very small samples with below minimum reporting limit observations: Environmental Science and Technology, v. 32, no. 1, p. 177–183.
Cox, D.C., Fan, P.F., Chave, K.E., Clutter, R.I., Gundersen, K.R., Burbank, N.C., Jr., Lau, L.S., Davidson, J.R., and others, 1973, Estuarine pollution in the State of Hawaii— v.2, Kaneohe Bay Study: Honolulu, University of Hawaii Water Resources Research Center, Technical Report 31, 444 p.
De Carlo, E.H., and Anthony, S.S., 2002, Spatial and temporal variability of trace element concentrations in an urban subtropical watershed, Honolulu, Hawaii: Applied Geochemistry, v. 17, p. 475–492.
Division of Water and Land Development, 1982, Median rainfall, State of Hawaii: State of Hawaii, Department of Land and Natural Resources, Circular C88, 44 p.
Dugan, G.L., 1977, Water quality of normal and storm-induced surface water runoff:—Kaneohe Bay watershed, Oahu, Hawaii, February 1974 to March 1975: Honolulu, University of Hawaii Water Resources Research Center, Technical Report 106, 74 p.
Ekern, P.C., and Chang, Jen-Hu, 1985, Pan evaporation:—State of Hawaii, 1894–1983: State of Hawaii, Department of Land and Natural Resources, Report R74, 172 p.
Fishman, M.J., and Friedman, L.C. eds., 1989, Methods for determination of inorganic substances in water and fluvial sediments (3d ed.): U.S. Geological Survey Techniques of Water-Resources Investigations, book 5, chap. A1, 545 p.
Fishman, M.J., ed., 1993, Methods of analysis by the U.S. Geological Survey National Water Quality Laboratory—Determination of inorganic and organic constituents in water and fluvial sediments: U.S. Geological Survey Open-File Report 93–125, 217 p.
Foote, D.E., Hill, E.L., Nakamura, Sakuichi, and Stephens, Floyd, 1972, Soil survey of the islands of Kauai, Oahu, Maui, Molokai, and Lanai, State of Hawaii: U.S. Department of Agriculture, Soil Conservation Service, 232 p.
Friedman, L.C., and Erdmann, D.E., 1982, Quality assurance practices for the chemical and biological analyses of water and fluvial sediments: U.S. Geological Survey Techniques of Water-Resources Investigations, book 5, chap. A6, 181 p.
Gilliom, R.J., and Helsel, D.R, 1986, Estimation of distributional parameters for censored trace-level water quality data—I., Estimation techniques: Water Resources Research, v. 22, no. 2, p. 135–146.
Halbig, J.B., Barnard, W.M., Johnston, S.E., Butts, R.A., and Bartlett, S.A., 1985, A baseline study of soil geochemistry in selected areas on the island of Hawaii: State of Hawaii, Department of Planning and Economic Development, various pagination.
Helsel, D.R., 1990, Less than obvious:—Statistical treatment of data below the detection limit: Environmental Science and Technology, v. 24, no. 12, p. 1766–1774.

References Cited 43
Helsel, D.R., and Cohn, T.A., 1988, Estimation of descriptive statistics for multiply censored water quality data: Water Resources Research, v. 24, no. 12, p. 1997–2004.
Helsel, D.R., and Gilliom, R.J., 1986, Estimation of distributional parameters for censored trace-level water quality data—II., Verification and applications: Water Resources Research, v. 22, no. 2, p. 147–155.
Helsel, D.R., and Hirsch, R.M., 1992, Statistical methods in water resources: Studies in Environmental Science 49: Amsterdam, Elsevier, 522 p.
Hem, J.D., 1985, Study and interpretation of the chemical characteristics of natural water, (3d ed.): U.S. Geological Survey Water-Supply Paper 2254, 264 p.
Hill, B.R., 1996, Streamflow and suspended-sediment loads before and during highway construction, North Halawa, Haiku, and Kamooalii drainage basins, Oahu, Hawaii, 1983–91: U.S. Geological Survey Water-Resources Investigations Report 96–4259, 34 p.
Hill, B.R., Fontaine, R.A., Taogoshi, R.I., and Teeters, P.C., 2000, Water resources data, Hawaii and other Pacific areas, water year 1999—v. 1, Hawaii: U.S. Geological Survey Water-Data Report HI–99–1, 339 p.
Hinds, N.E.A., 1925, Amphitheater valley heads: Journal of Geology, v. 33, p. 816–818.
Hirashima, G.T., 1963, Influence of water-development tunnels on streamflow-groundwater relations in Haiku-Kahaluu area, Oahu, Hawaii: Honolulu, State of Hawaii Department of Land and Natural Resources, Division of Water and Land Development, Circular C21, 10 p.
Hirashima, G.T., 1971, Tunnels and dikes of the Koolau Range, Oahu, Hawaii, and their effects on storage depletion and movement of ground water: U.S. Geological Survey Water-Supply Paper 1999–M, 21 p.
Horowitz, A.J., Demas, C.R., Fitzgerald, K.K., Miller, T.L., and Rickert, D.R., 1994, U.S. Geological Survey protocol of the collection and processing of surface-water samples for the subsequent determination of inorganic constituents in filtered water: U.S. Geological Survey Open-File Report 94–539, 57 p.
Hunt, C.D., Jr., 1996, Geohydrology of the island of Oahu, Hawaii: U.S. Geological Survey Professional Paper 1412–B, 54 p.
Iman, R.L., and Conover, W.J., 1983, A modern approach to statistics: New York, John Wiley and Sons, 497 p.
Izuka, S.K., 1992, Geology and stream infiltration of North Halawa Valley, Oahu, Hawaii: U.S. Geological Survey Water-Resources Investigations Report 91-4197, 21 p.
Izuka, S.K., Hill, B.R., Shade, P.J., and Tribble, G.W., 1993, Geohydrology and possible transport routes of polychlorinated biphenyls in Haiku Valley, Oahu, Hawaii: U.S. Geological Survey Water-Resources Investigations Report 92–4168, 48 p.
Landwehr, J.M., 1978, Some properties of the geometric mean and its use in water quality standards: Water Resources Research, v. 14, no. 3, p. 467–473.
Matsuoka, Iwao, 1983, Summary of available data on surface water, State of Hawaii—v. 4, Data and statistical tables for Oahu: U.S. Geological Survey Open-File Report 81–1056, 570 p.
Matsuoka, Iwao, Tateishi, G.A., Lum, M.G., and Kunishige, V.E., 1991, Water resources data, Hawaii and other Pacific areas, water year 1990—v. 1, Hawaii: U.S. Geological Survey Water-Data Report HI–90–1, 290 p.
Mink, J.F., 1960, Distribution pattern of rainfall in the leeward Koolau Mountains, Oahu, Hawaii: Journal of Geophysical Research, v. 65, no. 9, p. 2869–2876.
Moir, W.W.G., Allen, O.N., Borden, R.J., Hance, F.E., Magisat, O.C., Palmer, H.S., and Wadsworth, H.A., 1936, Handbook on Hawaiian soils: Honolulu, Association of Hawaiian Sugar Technologists, Agricultural Section, 266 p.
Mueller, D.K., Hamilton, P.A., Helsel, D.R., Hitt, K.J., and Ruddy, B.C., 1995, Nutrients in ground water and surface water of the United States—An analysis of data through 1992: U.S. Geological Survey Water-Resources Investigations Report 95–4031, 74 p.
Owenby, J.R., and Ezell, D.S., 1992, Monthly station normals of temperature, precipitation, and heating and cooling degree days 1961–90: Asheville, North Carolina, U.S. Department of Commerce, National Oceanic and Atmospheric Administration, National Climatic Data Center, Climatography of the United States 81, 26 p.
Parizek, R.R., 1971, Impact of highways on the hydrogeologic environment, in Environmental geomorphology, Coates, D.R., ed.: Binghamton, State University of New York, 262 p.
Patton, C.J., and Truitt, E.P., 1992, Methods of analysis by the U.S. Geological Survey National Water Quality Laboratory—Determination of total phosphorus by a Kjeldahl digestion method and an automated colorimetric finish that includes dialysis: U.S. Geological Survey Open-File Report 92–146, 39 p.
Pritt, J.W., and Rease, J.W., eds., 1992, Quality assurance/quality control manual, National Water Quality Laboratory: U.S. Geological Survey Open-File Report 94–708, 26 p.
Quan, E.L., Young, R.H.F., Burbank, N.C., Jr., and Lau, L.S., 1970, Effects of surface runoff and waste discharge into the southern sector of Kaneohe Bay:—January–April 1968: Honolulu, University of Hawaii Water Resources Research Center, Technical Report 35, 39 p.
Rantz, S.E., and others, 1982, Measurement and computation of streamflow:—v. 1, Measurement of stage and discharge;—v. 2, Computation of discharge: U.S. Geological Survey Water-Supply Paper 2175; v. 1, 284 p.; v.2, 346 p.
Searcy, J.K., 1959, Flow-duration curves: Manual of Hydrology—pt. 2, Low-Flow Techniques: U.S. Geological Survey Water-Supply Paper 1542-A, 33 p.

44 Water Quality in the Halawa, Haiku, and Kaneohe Drainage Basins Before, During, and After H-3 Highway Construction
Shelton, L.R., 1994, Field Guide for collecting and processing stream-water samples of the National Water Quality Assessment Program: U.S. Geological Survey Open-File Report 94–455, 42 p.
Spear, R.L., 1990, North Halawa Valley—A progress report on the archaeological fieldwork conducted within the H-3 Highway corridor, Oahu Island, Hawaii: Honolulu, Hawaii, Applied Research Group, Bishop Museum, 18 p.
Stanley, D.L, Boozer, T.M., and Schroder, L.J., 1998, Summary of the U.S. Geological Survey National Field Quality Assurance program from 1979 through 1997: U.S. Geological Survey Open-File Report 98–392, 11 p.
State of Hawaii Department of Health, 2000, Hawaii Administrative Rules, Title 11, chap. 54, Water Quality Standards, p.54–1 to 54–61, approved April 7, 2000.
Sylvester, M.A., Kister, L.R., and Garrett, W.B., 1990, Guidelines for the collection, treatment, and analysis of water samples—U.S. Geological Survey Western Region Field Manual: U.S. Geological Survey, Water Resources Division, Western Region Internal Report, 144 p.
Takasaki, K.J., Hirashima, G.T., and Lubke, E.R., 1969, Water resources of windward Oahu, Hawaii: U.S. Geological Survey Water-Supply Paper 1894, 119 p.
Thom, R.M., Borde, A.B., Richter, K.O., and Hibler, L.F., 2001, Influence of urbanization on ecological processes in wetlands, in Wigmosta, M.S., and Burges, S.J., eds., Land use and watersheds—Human influence on hydrology and geomorphology in urban and forest areas: Washington D.C., American Geophysical Union, 227 p.
Travis, C.C., and Land, M.L., 1990, Estimating the mean of data sets with nondetectable values: Environmental Science and Technology, v. 24, no. 7, p. 961–962.
U.S. Army Corps of Engineers, 1975, Coordinated supplemental environmental statement—Phase II, project design, flood control and allied purposes, Kaneohe-Kailua area, Oahu, Hawaii: March 1975, various pagination.
U.S. Department of Transportation, Federal Highway Administration, and State of Hawaii Department of Transportation, 1987, Final third supplement to the Interstate Route H-3 Environmental Impact Statement, Interstate Route H-3 Halawa to Halekou Interchange, Report Number FHWA–HI–EIS–87–01–F(S), various pagination.
U.S. Geological Survey, 1992, Analytical methods—Discontinuation of the National Water Quality Laboratory determinations for "total" nitrite, "total" nitrite plus nitrate, "total" ammonia, and "total" orthophosphate (using the four-channel analyzer): Office of Water Quality Technical Memorandum 93.04, accessed June 30, 2003, at http://water.usgs.gov/admin/memo/QW/qw93.04.html
U.S. Geological Survey, 1994, New preservation techniques for nutrient samples: Office of Water Quality Technical Memorandum 94.16, accessed June 30, 2003, at http://water.usgs.gov/admin/memo/QW/qw94.16.html
U.S. Geological Survey, 1997a, Change in ammonia plus organic nitrogen minimum reporting level: National Water Quality Laboratory Technical Memorandum 98.01, accessed June 30, 2003, at http://nwql.usgs.gov/ Public/tech_memos/nwql.98-01.html
U.S. Geological Survey, 1997b, Changes in minimum reporting levels for Inductively Coupled Plasma—Atomic Emission Spectrometry: National Water Quality Laboratory Technical Memorandum 98.05, accessed June 30, 2003, at http://nwql.usgs.gov/Public/tech_memos/nwql.98-05.html
U.S. Geological Survey, 1998, Reporting level changes for volatile organic compounds (Schedules 2020/2021), Inductively Coupled Plasma—Atomic Emission Spectrometry (ICP-AES), ammonia plus organic nitrogen and phosphorus (micro-Kjeldahl) in water methods at the National Water Quality Laboratory: National Water Quality Laboratory Technical Memorandum 98.07, accessed June 30, 2003, at http://nwql.usgs.gov/ Public/tech_memos/nwql.98-07.html
U.S. Geological Survey, 1998, Changes in field treatment protocols and bottle types for whole-water samples collected for total ammonium plus organic nitrogen and total phosphorus determinations: Office of Water Quality Technical Memorandum 99.04, accessed June 30, 2003, at http://water.usgs.gov/admin/memo/QW/qw99.04.html
U.S. Geological Survey, 2000, Changes in minimum reporting levels for suspended solids analyses at the NWQL: National Water Quality Laboratory Technical Memorandum 00.03, accessed June 30, 2003, at http://nwql.usgs.gov/ Public/tech_memos/nwql.00-03.html
Ward, J.R., and Harr, C.A., eds., 1990, Methods for collection and processing of surface-water and bed material samples for physical and chemical analyses: U.S. Geological Survey Open-File Report 90–140, 71 p.
Wentworth, C.K., 1942, Geology and ground-water resources of the Moanalua-Halawa District, Honolulu Board of Water Supply, 156 p.
Wentworth, C.K., 1943, Soil avalanches on Oahu, Hawaii: Bulletin of the Geological Society of America, v. 54, p. 53–64.
Wershaw, R.L., Fishman, M.J., Grabbe, R.R., Lowe, L.E., 1987, Methods for the determination of organic substances in water and fluvial sediments: U.S. Geological Survey Techniques of Water Resources Investigations, book 5, chap. A3, 80 p.
Wong, M.F., 2001, Sedimentation history of Waimaluhia Reservoir during highway construction, Oahu, Hawaii, 1983–98: U.S. Geological Survey Water-Resources Investigations Report 01–4001, 20 p.
Wong, M.F., and Hill, B.R., 1992, Statistical summary of hydrologic and water-quality data from the North Halawa, Haiku, and Kamooalii drainage basins, Oahu, Hawaii, water years 1983–89: U.S. Geological Survey Water-Resources Investigations Report 92–4049, 52 p.

References Cited 45
Wong, M.F., and Yeatts, D.S., 2002, Streamflow and suspended-sediment loads before, during, and after H-3 Highway construction, North Halawa, Haiku, South Fork Kapunahala, and Kamooalii drainage basins, Oahu, Hawaii, 1983–99: U.S. Geological Survey Water-Resources Investigations Report 02–4005, 49 p.
Wong, M.F., and Young, S.T.M., 2001, Statistical summary of hydrologic and water-quality data from the Halawa, Haiku, and Kaneohe drainage basins before, during, and after H-3 Highway construction, Oahu, Hawaii, 1983–99: U.S. Geological Survey Open-File Report 01–64, 69 p.