water quality failures in distribution networks ...€¦ · fire 1 in 82,977 (0.0000012)...
TRANSCRIPT

Water quality failures in distribution networks - understanding risk
Water quality failures in distribution Water quality failures in distribution networks networks -- understanding riskunderstanding risk
Rehan SadiqRehan Sadiq
Institute for Research in ConstructionInstitute for Research in Construction
National Research Council CanadaNational Research Council CanadaOttawa, OntarioOttawa, Ontario
Gander, Newfoundland September 2004

Outline
•• Water quality in distribution networksWater quality in distribution networksDeterioration mechanismsDeterioration mechanisms
Water quality monitoringWater quality monitoring
Water quality managementWater quality management
•• Risk analysisRisk analysisUnderstanding riskUnderstanding risk
Risk assessment & managementRisk assessment & management
•• An exampleAn example

What is Water Quality?
“collection of upper and lower limits on “collection of upper and lower limits on selected water quality indicators” selected water quality indicators”
PhysicalPhysical: : Temperature, turbidityTemperature, turbidity
ChemicalChemical: : Nutrients, metal, pH, organicsNutrients, metal, pH, organics
AestheticAesthetic: : Color, taste, odorColor, taste, odor
MicrobiologicalMicrobiological: : Bacteria, viruses, protozoa Bacteria, viruses, protozoa

Drinking Water Laws, Regulations and Guidelines
Protects public health
“... concentrations do not result in any significant risk to human health, over a lifetime consumption”
… required to perform regular monitoring to meet regulatory limits

Commonly monitored indicators of water quality
Common parameter Purpose
Alkalinity Corrosion controlDissolved oxygen Corrosion control; Detection of dead-end mainsFluoride Water quality monitoringNitrate Water quality monitoringpH Water quality monitoringPhosphate Corrosion control; Water quality monitoringResidual disinfectant Water quality monitoringSpecific organic Water quality monitoringTemperature Water quality monitoring; Flow managementTurbidity Water quality monitoring

Water Quality Failure
“an “an exceedenceexceedence of one or more water of one or more water quality indicators from quality indicators from specific specific regulationsregulations, or in the absence of , or in the absence of regulations, exceedence of regulations, exceedence of guidelinesguidelinesor or selfself--imposed limitsimposed limits driven by driven by customers’ needs”customers’ needs”

Sources of Water Quality Failure
Permeation
Permeation
IntrusionIntrusion
Leaching (and corrosion)Leaching (and corrosion)
Biofilm, Biofilm, regrowthregrowth
Water treatment Water treatment deficiencydeficiency
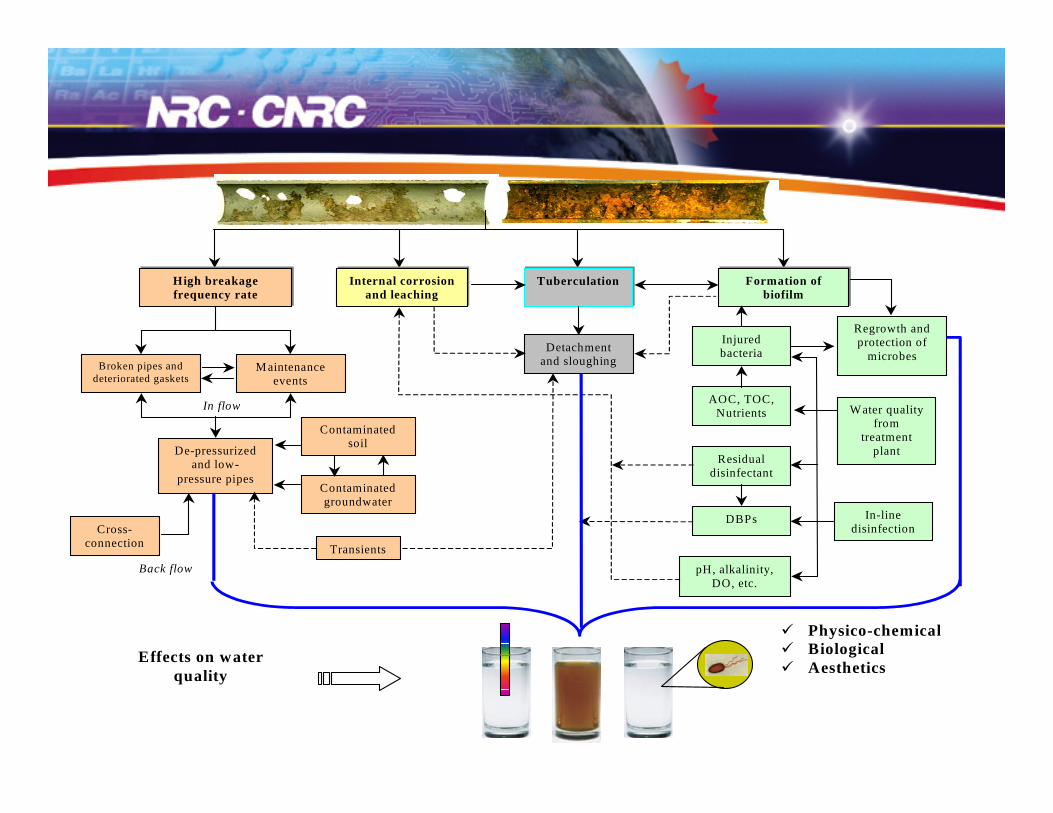
Physico-chemical Biological Aesthetics
Effects on waterquality
Back flow
Cross-connection
In flow
High breakagefrequency rate
Internal corrosionand leaching
Broken pipes anddeteriorated gaskets
Maintenanceevents
De-pressurizedand low-
pressure pipes
Contaminatedsoil
Contaminatedgroundwater
Tuberculation Formation ofbiofilm
Water qualityfrom
treatmentplant
Injuredbacteria
AOC, TOC,Nutrients
Residualdisinfectant
DBPs In-linedisinfection
pH, alkalinity,DO, etc.
Detachmentand sloughing
Regrowth andprotection of
microbes
Transients

Water quality failures in NL*
Indicator Observed StandardColor (TCU) 2 – 165 (36) 15
Turbidity (NTU) 0.06 – 4.52 1
Lead (mg/L) 0.001 – 0.101 0.100
THM (µg/L) > 20% water supplies(≈80K population)
100
Giardia 8 cases
5% boiled water advisories due to microbiological water qualityfailures (*Source to tap – water supplies in Newfoundland & Labrador, 2001)

Public UtilitiesSafety SafetyFree of excess chlorine residual
Maintaining chlorine residual
Taste and odour Taste and odourGood appearance Corrosion controlUniform water quality DBP formation
Rank of Major Water Quality Issues
Perceived riskPerceived risk Actual riskActual risk

Water Quality Monitoring - benefits
•• ReducesReduces public health public health risk by early detectionrisk by early detection
•• MeetsMeets legislated legislated requirementsrequirements
•• HelpsHelps to take decisions to take decisions for O & M activitiesfor O & M activities

Water Quality Monitoring - benefits
•• IncreasesIncreases consumer confidence consumer confidence (reduces perceived risk) (reduces perceived risk)
•• DevelopsDevelops water quality baseline datawater quality baseline data•• ProvidesProvides a proa pro--active approach to deal active approach to deal
with emerging water quality issueswith emerging water quality issues

Bacteriological Monitoring in NL
No distribution system or very smallsystem serving less than 100 people
1 sample/month
Distribution systems servingpopulation < 5,000
4 samples/month
Distribution systems servingpopulation 5,000 to 90,000
1 sample/1,000/month
Distribution systems servingpopulation > 90,000
For 90,000 plus
one sample/additional10,000/month

Disinfectant Monitoring in NL
... after a minimum 20 minute contact time, shall contain a residual disinfectantconcentration of free chlorine of at least 0.3 mg/L, or equivalent CT value.
Detectable free chlorine residual must be maintained in all areas in the distribution system.

Water Quality Monitoring - implementation
•• Decision on water quality indicators, Decision on water quality indicators, monitoring locations, frequency and monitoring locations, frequency and sampling techniquessampling techniques
•• Management and Management and reporting of collected reporting of collected datadata

Water Quality Monitoring - implementation
•• Incorporation of eventIncorporation of event--driven monitoring driven monitoring in the programin the program
•• Establishment of partnerships with the Establishment of partnerships with the community to monitor water qualitycommunity to monitor water quality
•• Development of response protocols for Development of response protocols for monitored data and maintenance, and monitored data and maintenance, and procedures to update programprocedures to update program

Water Quality - management
•• Multiple barrier approach Multiple barrier approach -- defensivedefensive
•• Total water quality management Total water quality management -- TWQMTWQM
Source water protection
Traditional water treatment
Disinfection O & M of water distribution
Monitoring Public awareness
Physical barriers Virtual barrier

Water Quality - management
•• HACCP HACCP -- (Hazard Analysis Critical Control Points)(Hazard Analysis Critical Control Points)Hazard analysisHazard analysis
Critical control pointsCritical control points
Critical limitsCritical limits
Monitoring Monitoring
RiskRisk--based corrective actionsbased corrective actions
Verification & validationVerification & validation
Record keeping & documentationRecord keeping & documentation

Water Quality Management Framework
Waterquality
indicator
Water qualitydeteriorationmechanisms
MitigativeactionsPipe
deteriorationmechanisms
Site specific factors
Water quality management
Operationand design
Pipecharacteristics

Risk
refers torefers to“joint probabilities of an “joint probabilities of an occurrenceoccurrence of an event of an event
and its and its consequencesconsequences” ” ((Lowrance, 1976)
“a triplet of “a triplet of causal scenariocausal scenario, , likelihoodlikelihood, and , and consequenceconsequence”” (Kaplan, 1997)

Risk AnalysisRisk AssessmentRisk Assessment
WhatWhat can go wrong?can go wrong?What What is the is the likelihoodlikelihood that it will go wrong?that it will go wrong?WhatWhat are the are the consequencesconsequences??Risk ManagementRisk ManagementWhatWhat can be done?can be done?WhatWhat options are available and options are available and whatwhat are the are the
associated tradeoffs in terms of cost, risks, and associated tradeoffs in terms of cost, risks, and benefits?benefits?
WhatWhat are the impacts of current management are the impacts of current management decisions on future options?decisions on future options?

Source §Annual risk of mortality
Heart disease 1 in 397 (0.0025)**Cancer 1 in 511 (0.002)Accidents 1 in 3,014 (0.0003)Alcohol 1 in 6,210 (0.00016)Suicide 1 in 12,091 (0.000083)Homicide 1 in 15,440 (0.000065)Fire 1 in 82,977 (0.0000012)Bioterrorism 1 in 56,424,800 (0.00000002)Food poisoning 1 in 56,424 (0.00002)
Understanding Risk
Cause of death is cancer for every 511th death in any year

Human Health Risk Assessment
•• Hazard identificationHazard identification•• Exposure assessmentExposure assessment•• Toxicity assessment (doseToxicity assessment (dose--response)response)•• Risk characterizationRisk characterization•• Risk communicationRisk communication

Hazard Identification
•• Examines data on contaminants Examines data on contaminants detected during monitoring and detected during monitoring and emphasizes those of concernemphasizes those of concern
•• Requires knowledge of source of Requires knowledge of source of contamination, concentration of contamination, concentration of contaminants and transport contaminants and transport mechanisms, i.e., how they reach mechanisms, i.e., how they reach the receptorthe receptor

Exposure Assessment
•• Source and release mechanismsSource and release mechanisms•• Transport, transfer and Transport, transfer and
transformation mechanismstransformation mechanisms•• Exposure point Exposure point •• ReceptorReceptor•• Exposure routeExposure route•• Estimation of chronic daily Estimation of chronic daily
intake (CDI)intake (CDI)

Toxicity Assessment
Cancer riskCancer risk: : Determine slope factor, SF Determine slope factor, SF (mg/kg(mg/kg--day)day)--11 , , from dosefrom dose--response curve response curve
NonNon--cancer riskcancer risk: : Determine reference dose,Determine reference dose, RfD RfD ((mg/kgmg/kg--dayday)) from dosefrom dose--response curveresponse curve
0 40 80 Dose
100%
50%
0
Res
pons
e
Acceptable level
Reference dose

Risk Characterization
ToxicityAssessment
Risk Characterization
Exposure Assessment
Hazard Identification

Risk Characterization
•• Unit Unit cancer cancer riskrisk == CDICDI ×× SFSF•• Number of a cancer cases (over life span)Number of a cancer cases (over life span)
== Unit Unit cancer cancer risk risk ×× populationpopulation•• Hazard index,Hazard index, HIHI == CDICDI // RfDRfD•• NonNon--cancer riskcancer risk == pp((HIHI > > 1)1)

Uncertainty
Risk estimates are highly uncertain due to:Risk estimates are highly uncertain due to:Extrapolation of doseExtrapolation of dose--response curve response curve NonNon--availability of data on exposure availability of data on exposure assessmentassessment

Uncertainty
Type IType IVariability,Variability, stochasticitystochasticity
related to natural related to natural heterogeneityheterogeneity
Type of uncertainties
Type IIType IIEpistemic, systematic, Epistemic, systematic,
uncertainty related to partial uncertainty related to partial ignorance, subjectivity and ignorance, subjectivity and
vaguenessvagueness

Uncertainty - based Methods
•• Probabilistic risk analysisProbabilistic risk analysisMonte Carlo simulations (higher order MCS)Monte Carlo simulations (higher order MCS)First order reliability methodsFirst order reliability methods
•• FuzzyFuzzy--based methodbased methodFuzzy arithmetic and possibility theoryFuzzy arithmetic and possibility theory
•• Interval analysisInterval analysis

CommunicatedCommunicated
Risk communication
Actual Actual (estimated)(estimated)
PerceivedPerceived
Risk gapRisk gap PerceivedPerceivedRisk gapRisk gap
Actual Actual (estimated)(estimated)
Non communicatedNon communicated
Ris
k Sc
ale
Ris
k Sc
ale

Example - DBPsChlorine residual + Chlorine residual +
NOM (NOM (natural organic matter) natural organic matter)
THMs (THMs (Chloroform Chloroform (CHCl(CHCl33), ), ……))
CCClCl
ClClClCl
HH
“Disinfection ranks with the discoveryof antibiotics as one of the majorpublic health accomplishments
of the 20th century”

Risk-risk tradeoffR
isk
Disinfection level
DBPsMicrobial
Regulatory regime
“In terms of risk, chlorination has allowed people to live long enough to worry about cancer”

Example - DBPsTHM = f (NOM, pH, Br, Dose, Temperature, time)
Dose ↑ THM ↑ (Treatment related)NOM ↑ THM ↑ (Source WQ & treatment related)Temp. ↑ THM ↑ (Environmental)Time ↑ THM ↑ (Design, O&M related)pH ↑ THM ↑ (source WQ & treatment related)
Health risks of DBPs are uncertain, they should be reduced whenever economically feasible

Strategies to reduce DBPs
• Control/surveillance to reduce both DBP precursors and microbial contaminants in source water;
• optimize all treatment processes, to ensure that concentrations of disinfectant are adequate;
• use of alternative disinfectants; and• reduce water age in distribution system.

Health Issues related to THMs
•• Linked to small increase in risk ofLinked to small increase in risk of bladder bladder cancer cancer andand colorectal cancercolorectal cancer
•• Some investigations link to heart, lung, Some investigations link to heart, lung, kidney, liver, andkidney, liver, and central nervous system central nervous system damagedamage
•• Other studies link THM toOther studies link THM to reproductive reproductive problems, problems, including miscarriagesincluding miscarriages

Categorization of contaminants for human health risk assessment
A: Human carcinogen; B: Probable human carcinogen (B1 and B2 represents two levels of B); C: Possible human carcinogen; D: Not Classified; E: Evidence that its is non-carcinogenic
Human evidence
Sufficient Limited InadequateNo
data
Evidence of no effect
Sufficient A A A A ALimited
B1 B1 B1 B1 B1Inadequate B2 C D D DNo data B2 C D D EEvidence of no effect B2 C D D E
Animal evidence

Comparison of Total THM (ppb)
Parameter Nitrate (mg/L)
THM (ppb)
§ WHO (1993) 45
US EPA (2001) 45 80Health Canada (2001) 45 100Australia - New Zealand (2000)
50 25098/83/EC 100UK (2000) 50 100§ ratio of individual THMs to guideline values should be less than 1
14
1≤∑
=i i
i
WHOTHM

Health Issues of THMs
Class of DBPs Compound Rating Detrimental effects
Trihalomethanes (THM) Chloroform B2 Cancer, liver, kidney, and reproductive effects
Dibromochloromethane C Nervous system, liver, kidney, and reproductive effects
Bromodichloromethane B2 Cancer, liver, kidney, and reproductive effects
Bromoform B2 Cancer, nervous system, liver and kidney effects

Defining input parameters for cancer risk model
DeterministicDeterministic Monte CarloMonte Carlo
FuzzyFuzzy--basedbased IntervalInterval

CDI = (IR × C × ED × EF) / (BW × AT)Unit cancer risk = CDI × SF
IR = intake rate (L/Day)C = chloroform concentration (mg/L)BW = body weight (kg)AT = averaging time (days)EF = exposure frequency (day/yr.)ED = exposure duration (yr.)SF = slope factor (mg/kg-day)-1
CDI = chronic daily intake (mg/kg-day)
Input parameters for cancer risk modelInput parameters for cancer risk model
How is risk determined?

Cancer risk cases in a million (over life span)
Statistical parameters
Maximum likely Minimum Maximum
Deterministic 10 - -MCS 7.4 0.34 69Fuzzy (2 - 45) 0.00087 660Interval - 0.00087 660

0
50
100
150
200
0
0.2
0.4
0.6
0.8
1
10-7 10-6 10-5 10-4
Freq
uenc
yC
umulative probability
Risk
Probability distribution (PDF)
Cumulative distribution (CDF)
0.34 × 10⁻⁶ 7.4 × 10⁻⁶ 69 × 10-6
Monte Carlo Simulations

0
0.2
0.4
0.6
0.8
1
1.2
10-10 10-9 10-8 10-7 10-6 10-5 10-4 10-3 10-2
Poss
ibili
ty
Risk
DeterministicInterval analysis
Monte Carlo
Fuzzy-based
Comparison of different methods

Summary
•• Water quality can be deteriorated through Water quality can be deteriorated through various sources in distribution networksvarious sources in distribution networks
•• The risk analysis for water quality failures in The risk analysis for water quality failures in distribution networks is a complex process anddistribution networks is a complex process and
•• Risk estimates are highly uncertainRisk estimates are highly uncertain

Publications1. Sadiq, R., Rajani, B., Kleiner, Y. (2004). Risk analysis for water quality deterioration in
distribution networks, Evaluation and Control of Water Loss in Urban Water Networks, Valencia, Spain, http://irc.nrc-cnrc.gc.ca/fulltext/nrcc47067/nrcc47067.pdf
2. Sadiq, R., Kleiner, Y., Rajani, B. (2004). Aggregative risk analysis for water quality failure in distribution networks, Journal of Water Supply Research and Technology : Aqua, 53(4): 241-261. http://irc.nrc-cnrc.gc.ca/fulltext/nrcc46269/nrcc46269.pdf
3. Sadiq, R., Rodriguez, M.J. (2004). Disinfection by-products (DBPs) in drinking water and the predictive models for their occurrence: a review, Science of the Total Environment, 321(1-3): 21-46. http://irc.nrc-cnrc.gc.ca/fulltext/nrcc44499/nrcc44499.pdf
4. Sadiq, R., Kleiner, Y., Rajani, B. (2003). Forensics of water quality failure in distribution systems - a conceptual framework, Journal of Indian Water Works Association, 35(4): 1-23.http://irc.nrc-cnrc.gc.ca/fulltext/nrcc46742/nrcc46742.pdf
5. Sadiq, R., Rodriguez, M.J. (2004). Fuzzy synthetic evaluation of disinfection by-products - a risk-based indexing system, Journal of Environmental Management, 73(1):1-13. http://irc.nrc-cnrc.gc.ca/fulltext/nrcc46632/nrcc46632.pdf
6. Sadiq, R., Rajani, B., Kleiner, Y. (2004). Probabilistic risk analysis of corrosion associated failures in cast iron water mains, Reliability Engineering and System Safety, 86(1): 1-10.
http://irc.nrc-cnrc.gc.ca/fulltext/nrcc45730/nrcc45730.pdf

http://www.nrc.ca/irc/uir/bu/index.html
URBAN INFRASTRUCTURE PROGRAMBuried Utilities Research
Visit us at ...