water quality assessment and ... study report on...1 acknowledgement the report presents “water...
TRANSCRIPT

1
ENVIRONMENTAL MONITORING & MODELING DIVISION
WATER QUALITY ASSESSMENT AND CHARACTERIZATION OF
TOXICITY OF KEENJIHAR LAKE
JUNE 2012
1
ACKNOWLEDGEMENT
The report presents “Water Quality Assessment and Characterization of Toxicity of Keenjhar Lake”. This work would not have
been possible without the kind support and help of many individuals and organizations. The authors extend their sincere thanks to
all of them.
Thanks are due to Mr. Ajmal, Assistant Director, Sindh EPA, Mr. Abbasi, Executive Engineer, Sindh Irrigation Department, Mr.
Jhangir, National Conservative Manager, WWF-Pakistan for their kind guidance and facilitation regarding acquisition of site
information and collection of representative samples.
The authors also express their gratitude towards staff and officers of SUPARCO for their kind co-operation and sincere efforts, in
making this project a success.
The authors are highly indebted to the Chairman, SUPARCO for his continued support and encouragement that stimulated the
study team in achieving the objectives.
Authors

2
Study Team Members
SUPARCO
1. Dr. M. Mansha, Manager, SUPARCO
2. Mr. Maqbool Ahmad, Assistant Manager, SUPARCO
3. Mr. Akhtar Ali, Assistant Manager, SUPARCO
4. Syed Asif Ali, Assistant Research Officer, SUPARCO
5. Mr. Arif Aman, Senior Scientific Assistant, SUPARCO
6. Mr. Mumtaz Hussain, Sub-Engg-II, SUPARCO
OTHER NATIONAL AGENCIES
1. Mr. Mohammad Mithal Abbasi, Executive Engineer, Sindh Irrigation Department
2. Mr. M. Ajmal, Assistant Director, Sindh EPA
3. Mr. Jahangir Durrani, National Conservative Manager, WWF-P
4. Mr. Salim Siddiqui, Senior Executive Engineer, KSWB
3
TABLE OF CONTENT
EXECUTIVE SUMMARY 12
1. CHAPTER-1 INTRODUCTION 18
1.1 Background 19
1.2 Media Reports and Experts Opinions 20
1.3 Objectives of the Study 25
2.0 CHAPTER-2 FIELD SAMPLING AND LAB TESTING METHODOLOGY 26
2.1 Sample Collection 27
2.2 Pre-Treatment of Samples 31
2.3 Analysis of Prepared Samples 32
2.4 Precautions 34
2.5 References 34
3.0 CHAPTER-3 WATER QUALITY AND TOXICITY ASSESSMENT OF 37 KB FEEDER CANAL
3.1 Introduction 38
3.2 Results and Discussion 39
3.2.1 Sampling Site-1, RD-16 (Near Hyderabad Tool Plaza) 39

4
3.2.2 Sampling Site-2, RD-36
(near Kotri Industrial Area Effluent Discharge Point) 41
3.2.3 Sampling Site-3, RD-50 (5-6 km from site RD-36) 43
3.2.4 Sampling Site-4, at Head Regulator of KB canal 44
3.3 Spatial Variation of Water Quality Parameters (Physical & Biological) 45
4.0 CHAPTER-4 WATER QUALITY AND TOXICITY ASSESSMENT OF 55 HAROOLO DRAIN
4.1 Introduction 56
4.2 Results and Discussion 57
4.2.1 Sampling Site-1, near Haroolo Bridge 57
4.2.2 Sampling Site-2, Lower Haroolo-1 58
4.2.3 Sampling Site-3, Lower Haroolo-2, near Lake 61
4.3 Spatial Variation of Water Quality Parameters (Physical and Biological) 63
5.0 CHAPTER-5 WATER QUALITY AND TOXICITY ASSESSMENT OF 75 KEENJIHAR LAKE
5.1 Introduction 76
5.1.1 Ecological Features and Status 78
5.2 Results and Discussion 79
5.2.1 Sampling Site-1 (KG Canal) 79
5.2.2 Sampling Site-2 (Near Lake Bank at RD-50) 80
5
5.2.3 Sampling Site-3 (Sindh Irrigation Deptt Rest House) 81
5.2.4 Sampling Site-4 (Noori Jam Tamaji Mazar) 82
5.2.5 Sampling Site-5 (Mid of Lake between Noori Jam Tamachi Mazar
and Picnic Point) 83
5.2.6 Sampling Site-6 (Picnic Point) 84
5.3 Spatial Distribution Water Quality Parameters in Lake Water 85
Samples (Physical and Biological)
6.0 CHAPTER-6 GIS-BASED WATER QUALITY AND TOXICITY ASSESSMENT 97
OF KEENJIHAR LAKE
6.1 Introduction 98
6.2 GIS Tools for Mapping of Lake Water Quality 98
6.3 Results and Discussion 99
6.4 References 99
7.0 CHAPTER-7 CONCLUSION AND RECOMMENDATIONS 123
7.1 Conclusion 124
7.2 Recommendations 125
Annexure-I (News Paper Articles) 127
6
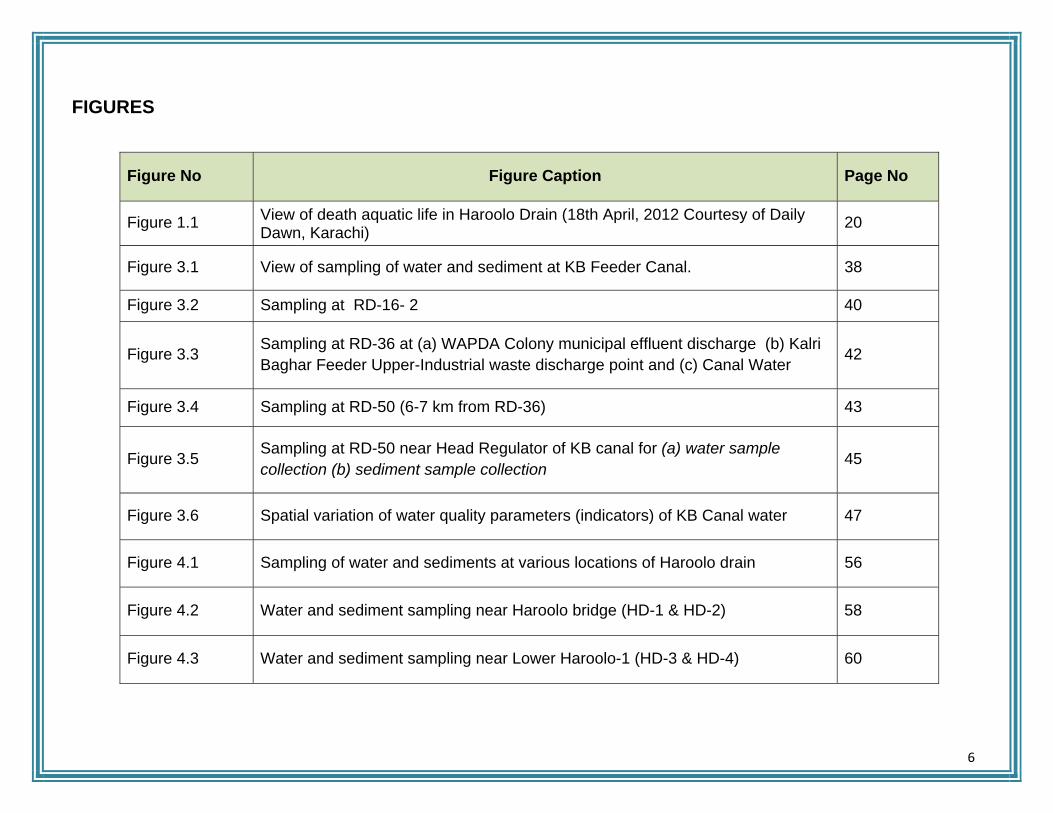
FIGURES
Figure No Figure Caption Page No
Figure 1.1 View of death aquatic life in Haroolo Drain (18th April, 2012 Courtesy of Daily Dawn, Karachi) 20
Figure 3.1 View of sampling of water and sediment at KB Feeder Canal. 38
Figure 3.2 Sampling at RD-16- 2 40
Figure 3.3 Sampling at RD-36 at (a) WAPDA Colony municipal effluent discharge (b) Kalri Baghar Feeder Upper-Industrial waste discharge point and (c) Canal Water 42
Figure 3.4 Sampling at RD-50 (6-7 km from RD-36) 43
Figure 3.5 Sampling at RD-50 near Head Regulator of KB canal for (a) water sample collection (b) sediment sample collection
45
Figure 3.6 Spatial variation of water quality parameters (indicators) of KB Canal water 47
Figure 4.1 Sampling of water and sediments at various locations of Haroolo drain 56
Figure 4.2 Water and sediment sampling near Haroolo bridge (HD-1 & HD-2) 58
Figure 4.3 Water and sediment sampling near Lower Haroolo-1 (HD-3 & HD-4) 60

7
Figure 4.4 Water and sediment sampling near Lower Haroolo-2 (HD-5 & HD-6) 62
Figure 4.5 Spatial variation of water quality parameters (indicators) of KB Canal water 64
Figure 4.6 Spatial distribution of toxic elements in sediments of Haroolo drain 65
Figure 5.1 Satellite view of study area (Keenjhar Lake) 77
Figure 5.2 Sampling team at KL-1 (KG Canal) the regulator of KG Canal 80
Figure 5.3 Sampling at KL-2 near lake bank at RD-50 81
Figure 5.4 Sampling team at KL-3 (Sindh Irrigation Deptt Rest House) 82
Figure 5.5 Sampling near Noori Jam Tamaji Mazar located in the mid of lake 84
Figure 5.6 Sampling at KL-6 (Picnic Point) 85
Figure 5.7 Spatial variation of water quality parameters (indicators) of Karli lake water 87
Figure 6.1 Figures showing spatial distribution of lake water quality parameters (Physical & Toxic Elements) 100

8
LIST OF TABLES
Table No Title Pg No.
Table 1 Spatial range of water quality parameters (Physical) in KB canal water samples 13 Table 2 Spatial variation in water quality parameters (Physical) in Haroolo Drain water samples 14
Table 3 Spatial Variation In Water Quality Parameters (Physical) in Keenjihar lake water samples 15
Table 1A Sample preservation details 28
Table 2.1 Sample collection matrix 30
Table 2.2 Microwave assisted acid digestion program for sample preparation 32
Table 2.3 List of methods for physical parameters & inorganic ions analysis 33
Table 2.4 Sample analysis matrix of water quality parameters 35
Table 3.1 Parametric analysis of water samples from KB Canal water and Kotri Industrial area effluent 48
Table 3.2 Water soluble anions and urea analysis of KB Canal water and effluent from Kotri industrial area 49
Table 3.3 Bacterial analysis of KB feeder canal and municipal wastewater (from WAPDA Colony) 50
Table 3.4-A Trace & Toxic element analysis for of KB canal water and Kotri industrial effluent 51
Table 3.4-B Trace & Toxic element analysis for of KB canal water and Kotri industrial effluent 52
Table 3.5-A Trace & Toxic element analysis for sediments collected from KB canal and Kotri industrial effluent ponds 53
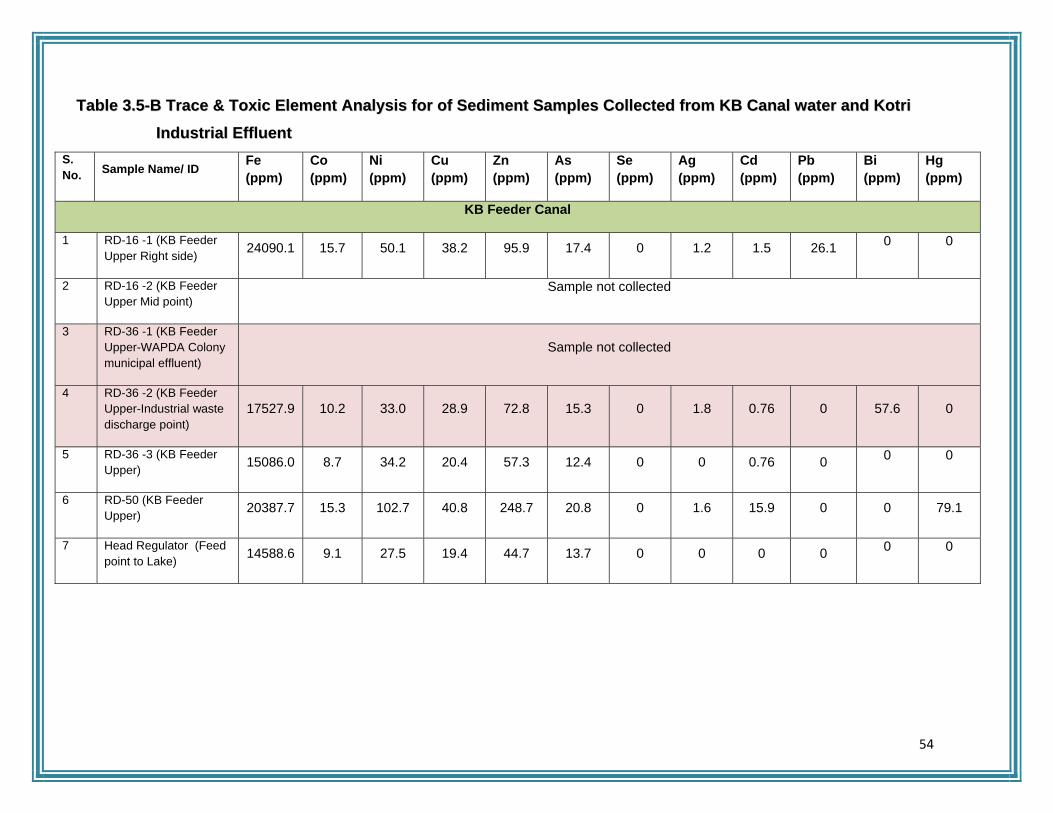
Table 3.5-B Trace & Toxic element analysis for of sediment samples collected from KB canal water and Kotri industrial effluent 54

9
Table 4.1 Physical parametric analysis of water samples from Haroolo Drain 66
Table 4.2 Bacterial analysis of water samples from Haroolo Drain 67
Table 4.3 Water soluble anions and urea analysis of water samples from Haroolo Drain 68
Table 4.4-A Trace & Toxic element analysis of Haroolo drain water samples 69
Table 4.4-B Trace & Toxic element analysis of Haroolo drain water samples 70
Table 4.5-A Trace & Toxic element analysis of sediment samples collected from Haroolo drain 71
Table 4.5-A Trace & Toxic element analysis of sediment samples collected from Haroolo drain 72
Table 4.6 Elemental analysis of Fish (dead & alive) from collected affected section of Haroolo drain, HD-3 –SUPARCO (Lower Haroolo-1) 73
Table 5.1(a) Important features of Keenjhar lake 77
Table 5.1(b) Some common birds in ecosystem of Keenjhar Lake 78
Table 5.2 Physical parametric analysis of water samples from Keenjhar Lake 90
Table 5.3 Bacterial analysis of Keenjhar lake water 91
Table 5.4 Water soluble anions and urea analysis of Keenjhar lake water 92
Table 5.5-A Trace & Toxic element analysis of Keenjhar lake water samples 93
Table 5.5-B Trace & Toxic element analysis of Keenjhar lake water samples 94
Table 5.6-A Trace & Toxic element analysis of Keenjhar lake sediment samples 95
Table 5.6-B Trace & Toxic element analysis of Keenjhar lake sediment samples 96

10
Acronyms
KB Karli Baghar
HD Haroolo Drain
KL Karli Lake
KG Canal Karachi feeding canal from lake
GIS Geographic Information System
GPS Geographic Positioning System
ICPMS Inductively Coupled Plasma Mass Spectrometer
TDS Total Dissolved Solids
TSS Total Suspended Solids
DO Dissolved Oxygen
ND Not Detected
NEQS National Environmental Quality Standards
SEPA Sindh Environmental
Protection Agency
WWF-P World Wildlife Fund-Pakistan
SUPARCO Pakistan Space and Upper Atmospheric Research Commission
PCSIR Pakistan Council of Scientific and Industrial Research
WHO World Health Organization
IDWT Industrial Development Water Technology
HCl Hydro Chloric Acid
HNO3 Nitric Acid
HF Hydro Fluoric Acid
Cl-, Chloride
F-, Floride
NO3-, Nitrate
NO2-, Nitrite
As, Arsenic
SO4-2 Sulphate
CN- Cyanide
Ca Calcium
Ba, Barium
Be Beryllium
Cd Cadmium
Co Cobalt
Cr Chromium
Cu Copper
Fe Iron
K Potassium
Li Lithium
Mg Magnesium
Mn Manganese
Na Sodium
Ni Nickel
Se Selenium
V Vanadium
Hg Mercury y
Zn Zinc

11
Units
ppb Part per billions
ppm Part per millions
µg/ L Microgram per Liter
mg/ L Milligram per Liter
NTU Nephlometric Turbidity Unit
uS/cm Microsiemens per Centimeter

12
Executive Summary
Keenjhar Lake also known as Kalri Lake is one of the
largest freshwater lakes in Pakistan. It has length of about 24
km, width 6 km and capacity of 0.53 million acre feet. Indus
River provides fresh water to Keenjhar Lake through KB
feeder originating from Kotri Barrage. The lake is an
important source of drinking water to Thatta District and
Karachi city. It is also favorable area for habitat of birds
migrating during winter from the northern hemisphere.
Keenjhar Lake is also a popular tourist resort. A large number
of people visit there daily from Karachi, Hyderabad and
Thatta to enjoy picnic, swimming, fishing and boating. The
rain water entering to lake through Haroolo drain is causing
contamination of the lake water and making it unfit for
drinking when mixed with lake water. Other multiple activities
at lake might severely degrade the lake ecology which cannot
be ignored without highlighting the dire consequences.
Daily DAWN reported on 14 & 15th of April, 2012 that
thousands of dead fish, snails, bivalves were found floating
on the surface of water near the conflux of Keenjhar lake and
Haroolo drain. The local community also reported killing of
four Cows, Jackals and a number of turtles due to the
contaminated water of the Haroolo Drain.
A team comprising of SUPARCO’s senior officers and
field staff as well as officers from other relevant agencies
such as Sindh Environmental Protection Agency (SEPA),
Sindh Irrigation Department and WWF-P visited the affected
areas for studying the water quality of the lake. SUPARCO
led this team at the lake site and its field staff collected
samples of water and sediments from the point of inlet
feeding sources i.e. (I) KB Canal and (II) Rain Fed Haroolo
Drain as well as other parts of the Lake areas. The samples
of wastewater entering into the lake in the form of combined
effluent of Kotri Industrial Area (a potential contaminating
source polluting water of KB canal) were also collected. The
samples of aqueous species (especially fish) at the entry
points of the contaminating source i.e. the Haroolo Drain
were also collected. These samples were preserved in
accordance with international protocols and then analyzed
using advanced analytical techniques in SUPARCO’s
Environmental Laboratory equipped with latest state-of-art
analytical instruments.
13
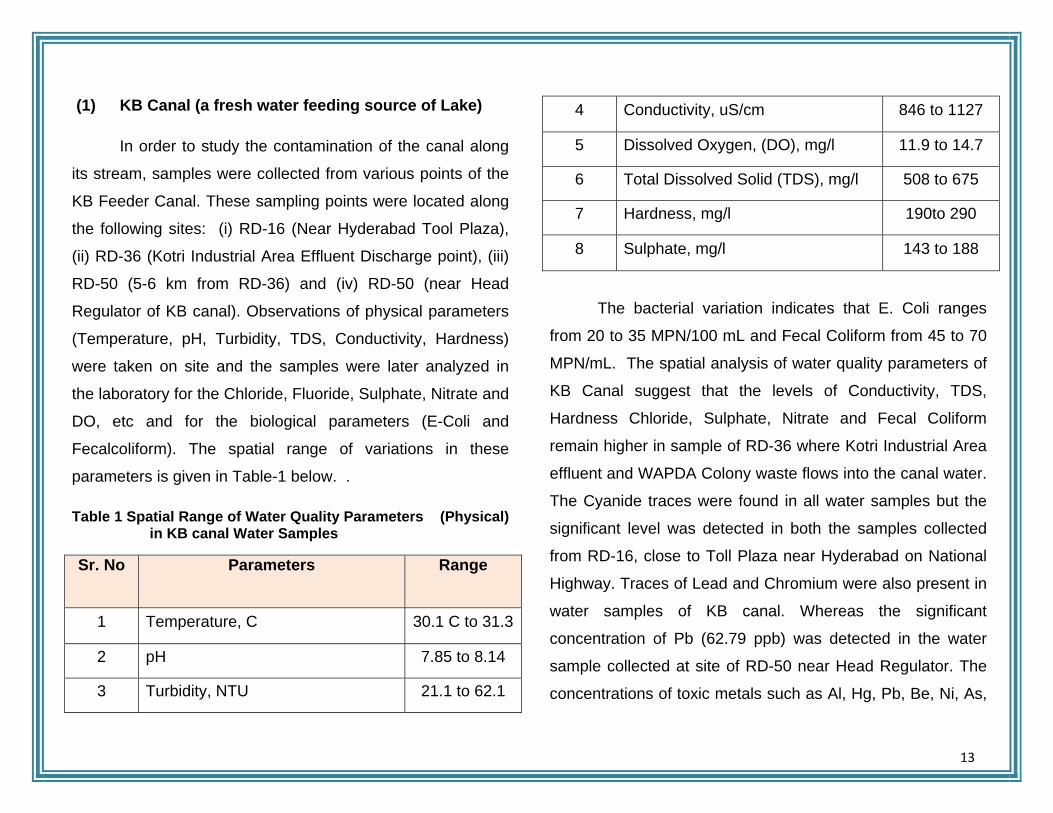
(1) KB Canal (a fresh water feeding source of Lake)
In order to study the contamination of the canal along
its stream, samples were collected from various points of the
KB Feeder Canal. These sampling points were located along
the following sites: (i) RD-16 (Near Hyderabad Tool Plaza),
(ii) RD-36 (Kotri Industrial Area Effluent Discharge point), (iii)
RD-50 (5-6 km from RD-36) and (iv) RD-50 (near Head
Regulator of KB canal). Observations of physical parameters
(Temperature, pH, Turbidity, TDS, Conductivity, Hardness)
were taken on site and the samples were later analyzed in
the laboratory for the Chloride, Fluoride, Sulphate, Nitrate and
DO, etc and for the biological parameters (E-Coli and
Fecalcoliform). The spatial range of variations in these
parameters is given in Table-1 below. .
Table 1 Spatial Range of Water Quality Parameters (Physical) in KB canal Water Samples
Sr. No Parameters Range
1 Temperature, C 30.1 C to 31.3
2 pH 7.85 to 8.14
3 Turbidity, NTU 21.1 to 62.1
4 Conductivity, uS/cm 846 to 1127
5 Dissolved Oxygen, (DO), mg/l 11.9 to 14.7
6 Total Dissolved Solid (TDS), mg/l 508 to 675
7 Hardness, mg/l 190to 290
8 Sulphate, mg/l 143 to 188
The bacterial variation indicates that E. Coli ranges
from 20 to 35 MPN/100 mL and Fecal Coliform from 45 to 70
MPN/mL. The spatial analysis of water quality parameters of
KB Canal suggest that the levels of Conductivity, TDS,
Hardness Chloride, Sulphate, Nitrate and Fecal Coliform
remain higher in sample of RD-36 where Kotri Industrial Area
effluent and WAPDA Colony waste flows into the canal water.
The Cyanide traces were found in all water samples but the
significant level was detected in both the samples collected
from RD-16, close to Toll Plaza near Hyderabad on National
Highway. Traces of Lead and Chromium were also present in
water samples of KB canal. Whereas the significant
concentration of Pb (62.79 ppb) was detected in the water
sample collected at site of RD-50 near Head Regulator. The
concentrations of toxic metals such as Al, Hg, Pb, Be, Ni, As,
14
Ag and Se were found significant in samples of sediments
collected from KB canal sites. It was concluded that major
source of water pollution comprised of industrial effluents
being discharged and mixed into the canal water.
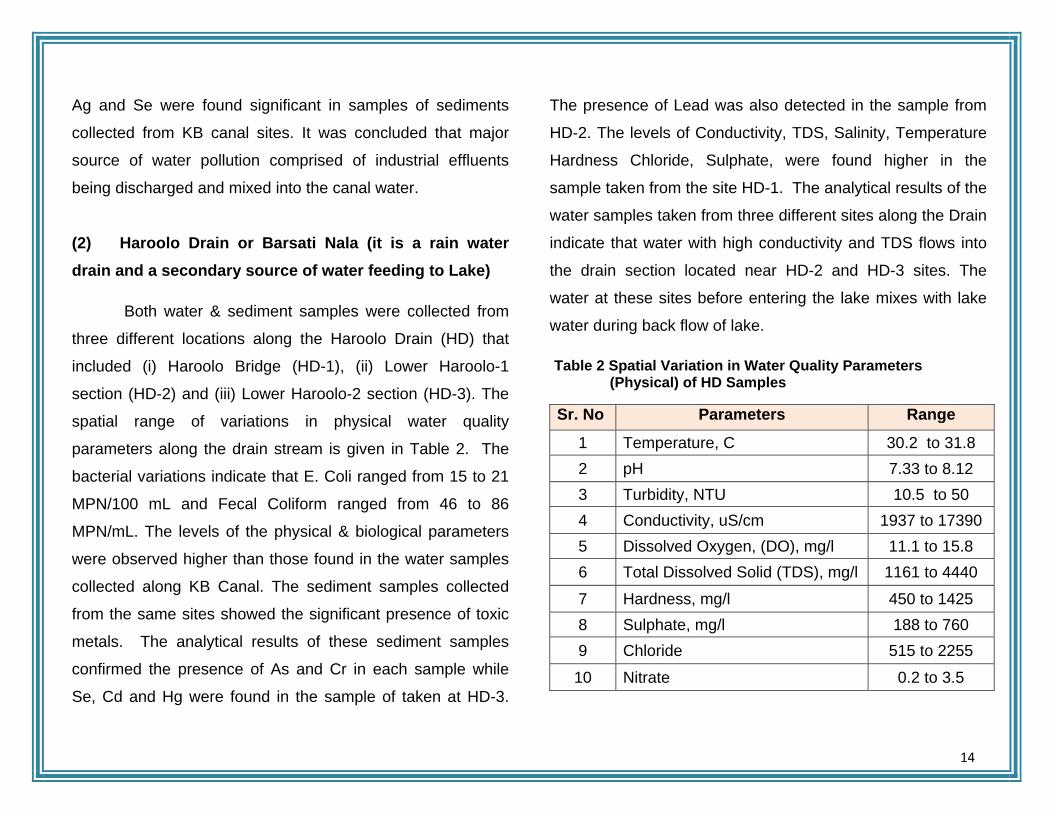
(2) Haroolo Drain or Barsati Nala (it is a rain water drain and a secondary source of water feeding to Lake)
Both water & sediment samples were collected from
three different locations along the Haroolo Drain (HD) that
included (i) Haroolo Bridge (HD-1), (ii) Lower Haroolo-1
section (HD-2) and (iii) Lower Haroolo-2 section (HD-3). The
spatial range of variations in physical water quality
parameters along the drain stream is given in Table 2. The
bacterial variations indicate that E. Coli ranged from 15 to 21
MPN/100 mL and Fecal Coliform ranged from 46 to 86
MPN/mL. The levels of the physical & biological parameters
were observed higher than those found in the water samples
collected along KB Canal. The sediment samples collected
from the same sites showed the significant presence of toxic
metals. The analytical results of these sediment samples
confirmed the presence of As and Cr in each sample while
Se, Cd and Hg were found in the sample of taken at HD-3.
The presence of Lead was also detected in the sample from
HD-2. The levels of Conductivity, TDS, Salinity, Temperature
Hardness Chloride, Sulphate, were found higher in the
sample taken from the site HD-1. The analytical results of the
water samples taken from three different sites along the Drain
indicate that water with high conductivity and TDS flows into
the drain section located near HD-2 and HD-3 sites. The
water at these sites before entering the lake mixes with lake
water during back flow of lake.
Table 2 Spatial Variation in Water Quality Parameters (Physical) of HD Samples
Sr. No Parameters Range
1 Temperature, C 30.2 to 31.8 2 pH 7.33 to 8.12 3 Turbidity, NTU 10.5 to 50 4 Conductivity, uS/cm 1937 to 17390 5 Dissolved Oxygen, (DO), mg/l 11.1 to 15.8 6 Total Dissolved Solid (TDS), mg/l 1161 to 4440
7 Hardness, mg/l 450 to 1425 8 Sulphate, mg/l 188 to 760 9 Chloride 515 to 2255
10 Nitrate 0.2 to 3.5

15
The mixing of these waters resulted in higher levels of
DO, E.Coli and Fecal Coliform in the samples collected from
the sites HD-2 and HD-3. The samples collected by the
WWF-P team during their independent survey of the same
sites on 17-04-2012 were also analyzed at SUPARCO’s labs.
The analytical results of these samples revealed the
presence of significant amount of Urea (70 mg/l) at these
sites. This indicates that Urea contaminated water flows into
the same section of lake imposing threat to the aquatic life in
the vicinity. The samples collected by SUPARCO team at the
site of HD-3 also showed the presence of urea in addition to
traces of toxic metals including Al, As, Cr, Ni and Se in each
of the water sample.
“The commulative effect of instant increased demand of DO (usualy during mid night living fish competes for oxygen due to reversal of plant photosynthesis process), toxic metals (Pb, Se, Ni and As) and Urea following in with rain water from upper side of the Drain, put threat to the aquatic life. Occurrence of similar condition in the lake caused the recent killing of fish and othe aquatic organisms”
(3) Keenjihar Lake (Major Source of Fresh Water Supply to Karachi).
Samples were collected from six (06) different
locations of lake and analyzed for physical, chemical and
bacterial parameters. The ranges of these analytical results
have been produced in the Table 3 below.
Table 3 Spatial Variation in Water Quality Parameters (Physical) in Keenjihar Lake Water Samples
Sr. No Parameters Range
1 Temperature, C 29.9 C to 30.5
2 pH 7.74 to 8.8.47
3 Turbidity, NTU 1.33 to 8.75
4 Conductivity, uS/cm 542 to 628
5 Dissolved Oxygen, (DO), mg/l 9.3 to 14.3
6 Total Dissolved Solid (TDS), mg/l 326 to 378
7 Hardness, mg/l 160 to 240
8 Sulphate, mg/l 90 to 146
9 Chloride 62 to 89
10 Nitrate 0.2 to 2.0

16
The results show that E-Coli ranged between 5-30
MPN/100mL and that of Fecal Coliform between 12-70
MPN/100mL. The levels of the physical & biological
parameters were found lower than those observed at both
feeding sources i.e KB Feeder Canal and Haroolo Drain. The
presence of Toxic metals including As and Cr was detected
while Pb and Hg were untraceable in any of the lake water
sample. The physical parameter of these water samples were
found within the safe limits of Pak NEQS for drinking water.
The higher level of DO was recorded at site of Lake exit near
KG Canal regulator. This indicates the presence of organic
species in the location and in case the DO is increased to
much higher level, incidence of mass aquatic life killings
specifically the fish species may happen around the site of
the lake. Moreover, E.Coli and Fecal coliform bacteria were
also detected in each of water samples which suggest the
lake water unsafe for dinking purposes unless passed
through treatment process. The presence of toxic elements
like As, Ni, Cr and Al in the samples of lake sediments and
traces of cyanide in the lake water samples were also found.
Frequent intake of contaminated drinking water containing
traces of cyanide makes it fatal for living organisms and its
accumulative effect may result in eradication of aquatic,
human and animal’s lives.
Recommendations:
• A strict and prompt action by the concerned authorities
(including Sindh Irrigation Deptt , KSWB and SEPA)
should be taken to block the discharge of toxic effluent
of Kotri industrial area into KB canal.
• Develop an action plan to prevent dumping of solid
wastes into the main channel of Haroolo Drain or
prevent mixing of rain water flowing through Haroolo
drain to Lower Haroolo drain section where lake’s back
flow especially during heavy rains may avoid future
incident of massive killing of aquatic life in Lower
Haroolo section.
• Regulate the flow of KB canal to lake in light of
pollution load in lake water.
• Frequent analysis of surface and In-depth (vertical)
water of lake Region using GIS based techniques.

17
• Device a GIS based monitoring mechanism of the lake
and its feeding sources (a) KB Feeder Canal and (b)
Haroolo drain that may be carried out jointly by
stakeholders (SEPA, Irrigation Department, KWSB)
and external expert agency on monthly basis.
• Make urgent arrangements for early completion of the
combined effluent treatment plant at Kotri

18
CHAPTER-1 INTRODUCTION

19
1.1 Background
Lakes are open reservoirs and integrated components
of the watershed. Watershed influence the lake environment,
as such, lakes’ ecology cannot be addressed in isolation.
The lake ecologies are governed by the quality of water and
sediments entering, leaving or settling in the lake. Lakes are
characterized by average current velocity of 0.001 to 0.01
meters per second at its surface. Water storage period of
lakes varies from months to several years. Flow of water
currents within the lakes is multidirectional and many lakes
have alternating periods of stratification and vertical mixing.
Besides withstanding of aquatic life, more than 20 million
people (directly & indirectly) depend upon the lake water. In
case the lake water is contaminated / polluted the dependent
living masses would be under threat.
Water to Keenjihar Lake is fed by KB Canal
originating from Kotri Barrage. KB canal is the main source
of fresh water supply while the Haroolo drain feeds the rain
water at times of heavy raining in the adjoining areas. The
hazardous and anthropogenic pollution sources
contaminating the lake water may be summarized as
follows:
1. KB Feeder Canal
2. Haroolo Drain
3. Direct dumping of hazardous & toxic waste
material in the lake or feeding channels either
intentionally or unintentionally
DAWN reported (18th April, 2012) an incidence of the
aquatic and land animal mass killing that happened on 15th
April, 2012, at the conflux point in Haroolo drain close to the
lake. It emphasized the probable causes of producing high
level of contamination in drain water resulting in mass killing
of aquatic and animal life could be the following:
a. Flow of toxic runoff of rain water from the various small streams falling in the main channel of the drain.
b. The other possible causes of toxicity of the affected part of the drain water could be the factors;
I. Wash out of atmospheric dust by the rain hit in the area for very short duration (10-15 min as reported by WWF-P and local villagers) just a day ago on 14th April, 2012.
20
II. Dumping of toxic or hazardous waste material in the main / branch channels of drain which was carried along into the affected part of the drain.
III. Direct dumping of toxic or hazardous waste material into the affected part of the drain either.
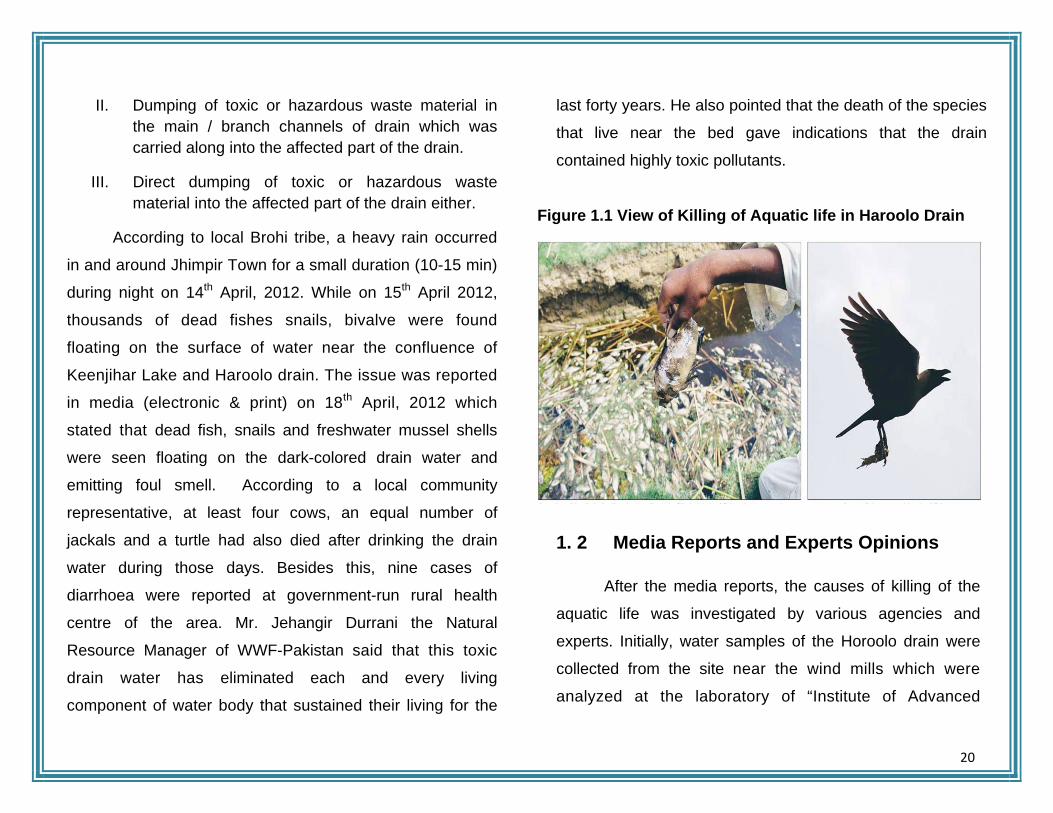
According to local Brohi tribe, a heavy rain occurred
in and around Jhimpir Town for a small duration (10-15 min)
during night on 14th April, 2012. While on 15th April 2012,
thousands of dead fishes snails, bivalve were found
floating on the surface of water near the confluence of
Keenjihar Lake and Haroolo drain. The issue was reported
in media (electronic & print) on 18th April, 2012 which
stated that dead fish, snails and freshwater mussel shells
were seen floating on the dark-colored drain water and
emitting foul smell. According to a local community
representative, at least four cows, an equal number of
jackals and a turtle had also died after drinking the drain
water during those days. Besides this, nine cases of
diarrhoea were reported at government-run rural health
centre of the area. Mr. Jehangir Durrani the Natural
Resource Manager of WWF-Pakistan said that this toxic
drain water has eliminated each and every living
component of water body that sustained their living for the
last forty years. He also pointed that the death of the species
that live near the bed gave indications that the drain
contained highly toxic pollutants.
Figure 1.1 View of Killing of Aquatic life in Haroolo Drain
1. 2 Media Reports and Experts Opinions
After the media reports, the causes of killing of the
aquatic life was investigated by various agencies and
experts. Initially, water samples of the Horoolo drain were
collected from the site near the wind mills which were
analyzed at the laboratory of “Institute of Advanced

21
Research Studies in Chemical Sciences University of
Sind, Jamshoro”. These samples were analyzed for
physical parameters like color, taste, odour, TDS,
conductivity and pH. The results of these analysis indicated
that the lake water at the site was turned brownish and
smelled pungent. However, this analytical report was
unable to expose the real cause of death of fish and other
animals but assumed the water contaminants as the
only cause of these deaths.
The report did not provide any solid evidence related to
the reasons of this high level water contamination and
recommended further investigation on the following ground:
• Analysis of soil / moist mud
• Analysis of fish meat ,tissues for the detecting
the impacts of Lead, Cu, etc
• Analysis of dead bivalve
• Investigate the reason of change in water color
that caused depletion of oxygen.
The most likely causative agents that could kill the mass
aquatic life are elaborated in the following paragraphs:
According to Mr. Abdul Hameed Palari, Vice Chairman
of the Keenjhar Conservation Network that the specific
drain (HD) might have carried wastes from the site of
Wind Mill Unit. As, the erection of wind turbines at the
mill site was started a few months ago and the
chemicals used in this work were mixed with the drain
water that accumulated on the site and resultantly
caused the sudden killing of the fishes and other species
(18th April, 2012, Daily DAWAN, Karachi)
Dr Shafi Mohammad Wassan, District Surveillance
Officer of the WHO pointed out that results of preliminary
tests of water samples showed drain water unfit for
human intake and suggested detailed chemical analysis
to find out the exact nature of contamination. (18th April,
2012, Daily DAWAN, Karachi)
The issue came to limelight when activists of Pakistan
Fisherfolk Forum, and political parties showed sever
reaction against massive loss of lake aquatic life, fauna
and flora and livestock due to the lake water. These
activists lead a huge procession and observed a
complete shutdown strike in Jhampir on 19th April, 2012

22
to draw the attention of relevant bodies and take
remedial measure of this menace. The protest nudged
the officials of SEPA, water expert Dr Ahsan Siddiqui,
Director of Fisheries Inland, Ghulam Mujtaba Wadhar
and Dr Shafi Mohammad Wassan of WHO, who made a
prompt visit of the lake site including the Jhampir town
and the industrial area near the lake. During their site
visits, they collected samples of dead fished and water
at the discharge point of effluent sources in the areas on
20th April, 2012. (18th April, 2012, Daily DAWAN,
Karachi).
The opinion of the representatives of fisher communities
comprising of Mr. Hashim Solangi, Mr. Ali Ahmed and
Mr. Hanif Palari was that the effluents discharging from
Industrial areas of Nooriabad, Hyderabad and Phulelli
had made its way into the lake through upper KB Feeder
canal which caused the rising of pollution level in the
lake. Domestic wastewater released from nearby
villages also contributed in contaminating the lake water
(18th April, 2012, Daily DAWAN, Karachi).
Experts said that turbidity, BOD and COD were found
higher along with toxic metals such as lead and
cadmium in the lake water samples collected near the
KB Feeder. Sufficient organic load was also observed
which caused depletion of DO. (18th April, 2012, Daily
DAWAN, Karachi).
According to the Rapid Assessment Report (RAR)
conducted by fisheries department, the quantum of
bacterial and toxic pollutants in the lake was 2.3 against
the WHO standards of 0.75, a level 210 per cent higher
than normal. The acidic carbonates were reported 800
mg against the standard of 500 mg. Chief Executive
IDWT and a member of EPA team, Dr Ahsan Siddiqui
said the main reason behind rapid contamination of the
lake water seems to be the use of explosive materials,
dynamite and urea by multinational windmill companies
engaged in the erection process of the mill. (18th April,
2012, Daily DAWAN, Karachi).
Dr Siddiqui claimed the possibility of toxin (an organic
compound in pungent water that turns to blackish colour)
and urea (used for producing explosion possibly for the

23
construction of a tank to store water) in the lake water
that was used by the cows who lost their skin within a
day of dying under a completely unnatural
decomposition process (19th April, 2012, Daily DAWAN,
Karachi).
Dawn reported that the Chief Engineer of Kotri Barrage
Mr. Mohammad Mithal Abbasi, denied all statements
related to the feeding of highly contaminated water to
lake through Haroolo drain. He claimed that drain water
was not toxic, though it could be slightly tainted due to
recent rains. He was of the opinion that the lake’s
contamination from the drain was not possible, because
the drain was located in depression while the lake’s
ground level was comparatively higher (20th April, 2012,
Daily DAWAN, Karachi).
Dr Siddiqui stated that the Cr, Pb and Hg levels at the
windmill project site were found to be 43.52, 13.89 and
5.32 ppb respectively. While, the levels of Cr and Pb at
the mouth of the drain were found to be 1.88 and 9.46
ppb respectively. The level of Pb in the area of lake
located about one and a half kilometer away from the
drain mouth was found to be at 333.33 ppb. No traces of
Hg were detected at both of these sites, but the traces of
Hg were not present in the samples taken from the later
site. The WHO’s recommended levels in drinking water
for Pb, Cr and Hg are 10, 50 and 1 ppb respectively.
One can see the abnormal levels of these compounds
found in the water samples of the sites in comparison
with the WHO’s standards. He further recommended a
technically sound investigation of the situation could only
be made with the help of complete analytical results.
(21st April, 2012, Daily DAWAN, Karachi).
Dr Ahsan Siddiqui, said that urea causes the death of
cattles and other aquatic species. He also observed that
the range of TDS (145-938 ppm), Salinity (0.2-1.1pc),
Conductivity (3722380) of the samples showed that the
water was purely rainwater, unaltered with contamination
of industrial wastes which contains high levels of TDS
among other things, he pointed out. (28th April, 2012,
Daily DAWAN, Karachi).
The analysis of about four water samples taken from the
Keenjhar Lake after toxic contamination of one of its

24
drains, PCSIR established absence of poisonous
compounds and occurrence of high concentration of
fecal matter in the lake water. PCSIR officials observed
the presence of high concentration of fecal coliform in
the samples that could cause illness. The PCSIR team
collected these water samples one each from the KB
Feeder and the lake spot from where water is supplied
to Karachi. The rest of the two water samples were
provided by the KWSB taken from the lake ignoring
information of sampling sites (2nd May, 2012, Daily
DAWAN, Karachi).
An official of the Fauji Fertiliser Company Energy, who is
working on a wind power project in Jhampir, has
dispelled a perception of lake contamination by the
pollution generated by the erection work on the project.
(7th May, 2012, Daily DAWAN, Karachi).
A committee was set up by the Environment Secretary
Sindh, to investigate the cause of lake contamination.
The investigation team was comprised of Dr. Ahsan
Siddiqui, Farhad Shahid, Mujeeb Sheikh, Abdullah
Magsi and S.M. Yahya of SEPA. The terms of reference
of the investigating team included fixing of responsibility
on the perpetrator of the lake contamination. The team
collected water samples from affected drain and were
tested both at SEPA’s laboratory and separately by Dr
Siddiqui himself. Both tests had similar findings. Dr
Siddiqui highlighted in his report the presence of high
concentration of urea in the water samples. The report
submitted to SEPA established two sources of
contamination of the Haroolo Drain — wastewater from
the Nooriabad Industrial Area; and the waste from the
nearby windmill project. The author ruled out the
possibility of contamination from industrial waste on the
basis of the lab test findings. This report also
established that Haroolo drain contained only rainwater,
rationale being the absence of high levels of TDS in the
water samples which is considered as the major sign of
with industrial effluent. Dr. Ahsan confidently reported
the deaths of aquatic and animals that happened due to
the high concentration of urea in the drain water. He
further said the rise of urea concentration could be
happened by washing out of empty urea bags by
rainwater otherwise freshly sprinkled urea in farm fields
25
that dissolved in the rain water was gushed into the
drain. But, the possibility of some blasting activity in the
hilly area that resulted into lake contamination cannot be
ignored. Dr Ahsan, rejected the contamination due to
windmill project. His analyses of water samples also
confirm the traces of chromium in the lake water (12th
May, 2012, Daily DAWAN, Karachi).
1.3 Objectives of the Study
The primary objectives of the current study were to
investigate the:
• Water Quality status and contamination levels of
Keenjhar Lake water.
• Water quality and contamination levels of the lake
feeding sources including KB Canal and rain fed
Haroolo Drain.
• Contamination level of the industrial effluent from
the Kotri Industrial Area entering into the KB
canal (potential source toxic chemicals).
• Fixing of responsibility and cause of the killing of
the aquatic life in the section of Haroolo Drain
close to the lake.
• Mapping of the water quality parameters in the
Keenjhar Lake using GIS techniques.
• Recommendations for mitigation Measures

26
CHAPTER-2 FIELD SAMPLING AND LAB TESTING
METHODOLOGY

27
2.1 Sample Collection
Water sampling criteria adopted for the study was to
collect sample of grab water from the central layers one foot
each below the upper surface and above the lower surface
(bottom) of lake for chemical analysis of water contaminants.
The said sampling depth was maintained for sampling of
chlorophyll, and herbicides. The sample collection matrix for
the study is given in Table 2.1.
2.1.1 Sampling Requirements
Following were the requirements of material and
equipment for sampling of lake water, soil/ sediment and fish:
• Sampling bottles made of glass or plastic having
capacity of 1-1.5 Liters
• Stainless Steel Scoops / Ponar or ekman bottom
grab sampler for sediment sampling
• Polyethylene bags for collection of sediments, fish
and lake plant samples
• Ice box with ice to store/preserve collected
samples
2.1.2 Sampling Techniques
a) Water Sampling for all Parameters except Bacteria
Lake water samples for analysis of trace &
toxic metals and inorganic contaminants were
collected in clean plastic bottles at about one foot
below the surface level of lake water. Sampling
bottles were rinsed repeatedly two to three times with
sample water before filling up the sample. Separate
samples were collected for trace & toxic metals and
inorganic contaminants in properly labeled bottles.
Nitric Acid (HNO3) was added in samples labeled
“trace & toxic metals” to keep metals concentration
below pH2. The sample bottles were capped tightly
and placed in ice box to maintain temperature below
4 oC for transportation to analytical laboratory.
b) Water Sampling for Bacteria
Lake water samples for bacterial analysis
were collected in pre cleaned & sterilized plastic
labeled bottles from about one feet below the surface
28
water level. To prevent leakage, the sampling
bottles after filling with water samples were tightly
capped and placed in ice box to maintain
temperature below 4oC during transportation to
laboratory for conducting analyses on the same day.
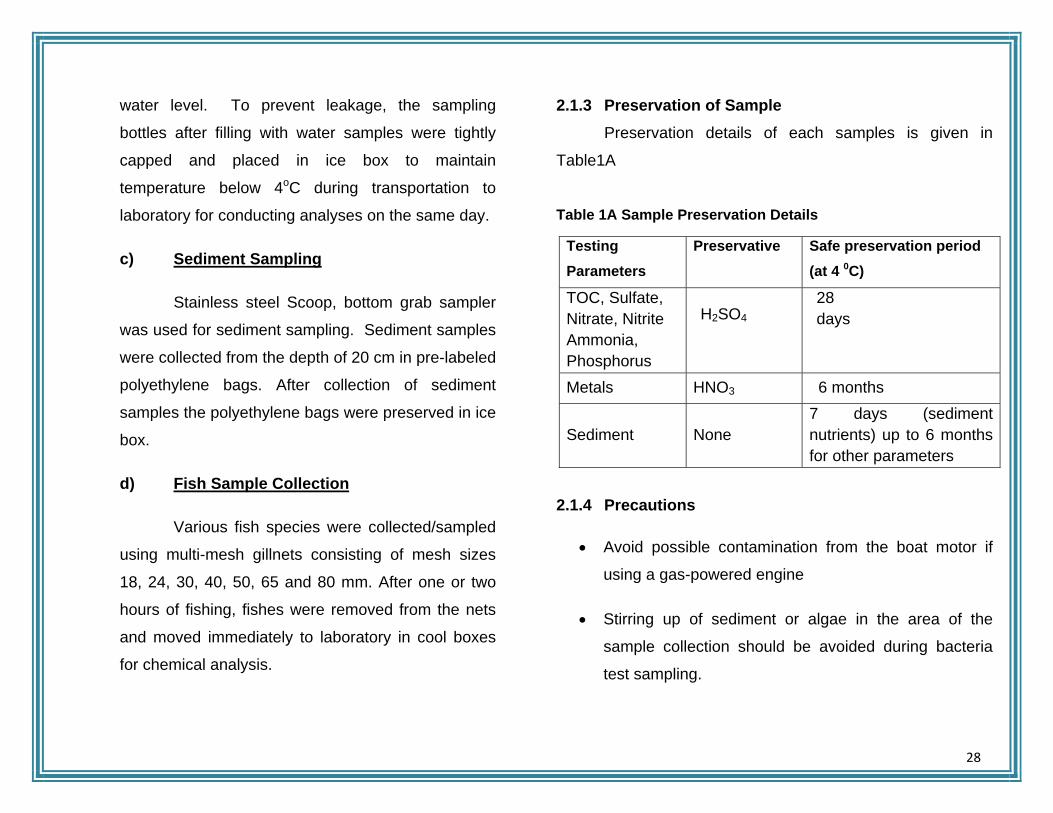
c) Sediment Sampling
Stainless steel Scoop, bottom grab sampler
was used for sediment sampling. Sediment samples
were collected from the depth of 20 cm in pre-labeled
polyethylene bags. After collection of sediment
samples the polyethylene bags were preserved in ice
box.
d) Fish Sample Collection
Various fish species were collected/sampled
using multi-mesh gillnets consisting of mesh sizes
18, 24, 30, 40, 50, 65 and 80 mm. After one or two
hours of fishing, fishes were removed from the nets
and moved immediately to laboratory in cool boxes
for chemical analysis.
2.1.3 Preservation of Sample Preservation details of each samples is given in
Table1A
Table 1A Sample Preservation Details
2.1.4 Precautions
• Avoid possible contamination from the boat motor if
using a gas-powered engine
• Stirring up of sediment or algae in the area of the
sample collection should be avoided during bacteria
test sampling.
Testing Parameters
Preservative Safe preservation period (at 4 0C)
TOC, Sulfate, Nitrate, Nitrite Ammonia, Phosphorus
H2SO4 28 days
Metals HNO3 6 months
Sediment None 7 days (sediment nutrients) up to 6 months for other parameters

29
• Water samples for bacteria testing be collected
approximately 50 feet from the shoreline of the dock
eliminating boat ramp
• Keep bottles filled with samples in cold storage / Ice
box avoiding sample containers from any type of
agitation/ disturbance during transportation to
laboratory
2.1.5 References: i. Henry, M. Spliethoff and Harold F. Hemond.
“History of toxic metal discharge to surface
waters of the aberjona watershed, environ.
Sci. Technol. 1996, 30, 121-128
ii. Anna Farkas, Janos Salanki, Andras
Specziar and Istvan Varanka, metal pollution
as health indicator of lake ecosystems*,
international journal of occupational
medicine and environmental health, vol. 14,
no. 2, 163—170, 2001
iii. Vardanyan Lg, Ingole BS Lilit G. Vardanyan
and Baban S. Ingole studies on heavy metal
accumulation in aquatic macrophytes from
sevan (armenia) and carambolim (india) lake
system, environ int. 2006, 32(2):208-18

30
Table 2.1 Sample Collection Matrix
S. No. Sample Name/ ID Surface Water Soil/ Sediment Fish
1 RD-16 -1 (Kalri Baghar Feeder Upper Right side) X X
2 RD-16 -2 (Kalri Baghar Feeder Upper Mid point) X
3 RD-36 -1 (Kalri Baghar Feeder Upper-WAPDA Colony municipal effluent) X X
4 RD-36 -2 (Kalri Baghar Feeder Upper-Industrial waste discharge point) X X
5 RD-36 -3 (Kalri Baghar Feeder Upper) X
6 RD-50 (Kalri Baghar Feeder Upper) X X
7 KL-1 (near KG Canal Karachi Feed X X
8 KL-2 Near Lake Bank at RD-50) X X
9 KL-3 (Sindh Irrigation Deptt. Rest House) X X
10 KL-4 (near Noori Jam Tamachi Mazar) X 11 KL-5 (Mid of Lake between Noori Jam Tamachi Mazar and Picnic Point) X
12 KL-6 (near picnic point) X
13 HD-1 -SUPARCO (near Haroolo Bridge) X
14 HD-3 –SUPARCO (Lower Haroolo-1) X
15 HD-5 –SUPARCO (Lower Haroolo-1) X X
16 HD-2-WWF (near Bridge Haroolo) X X X
17 HD-4 -WWF (Lower Haroolo-1) X X X
18 HD-6-WWF (Lower Haroolo- 2) X X
Total number of Samples 22 12 2

31
2.2 Pre-Treatment of Samples This section describes the techniques/protocol
adopted for sample preparation and analysis of the lake
surface water, bottom sediments/soils and fish samples for
toxicity (toxic & heavy metals) contents. A complete list of
parameters and methods used or their analysis is given in
Table 2.3.
2.2.1 Sample pre-treatment techniques
Different pre-treatment techniques were adopted for
water sample based on the state/nature of the samples.
2.2.2 Sample preparation for Lake/ Canal water sample
The homogenized lake water samples in
cleaned Teflon 100mL beakers were acidified with
concentrated Nitric Acid (HNO3) for making
concentration of HNO3 to 5% for matching of matrix
with the standard solution. These acidified samples
were filtered in cleaned, dried and labeled 100 mL
volumetric flask (class A category) through filter
paper (MilliporeTM) of 0.45 µm pore size to remove
suspended particles.
2.2.3 Sample preparation for Soil / Sediment sample
The solids samples of soil /sediments were
acid digested before analyzing for the contents of
trace & toxic metals using Inductively Coupled
Plasma Mass Spectrometer (ICPMS). Multiwave™
3000 Microwave Oven (PerkinElmer/Anton-Paar)
was used for the microwave-assisted digestion of
soil / sediment samples (Table 2.2).
The oven dried (at 95-100 0C) samples were
freed from the large debris and shells prior to
grinding in the porcelain mortal with pestle. A
quantity of 0.25 gram of these homogenized soil/
sediment samples were accurately weighed directly
into the digestion vessel (PTFE-TFM liner). The
liners after adding 2 mL of HNO3, 1 mL of HF and 5
mL of HCl to each digestion vessel were properly
sealed and placed the rotor in microwave for
digestion. After completion of the digestion process,
the liquefied samples were filtered through 0.45 um
filter paper in a100 mL volumetric flask and makeup
volume using de-ionized water.

32
2.2.4 Sample preparation for fish species
For determining the level of trace & toxic
metals in different fish species collected from the
affected Haroolo drain, the gills and meat samples
were separately prepared and analyzed using
ICPMS.
First of all the fishes were cut into pieces and
their gills and meats were separated and dried in an
oven at 70 0C for 48 hours. These dried samples
were grinded using porcelain mortal and pestles.
The accurately weighed 0.25 gram of homogenized
fish samples were directly put into the digestion
vessel (PTFE-TFM liner). The liners of the digestion
vessels were properly sealed after adding 5 mL of
HNO3 and 1 mL of HCl and then placed on rotor in
microwave for digestion. After the digestion process,
the liquefied samples were filtered in 100 mL
volumetric flask using 0.45 um filter paper and
makeup volume using de-ionized water.
Table 2.2 Microwave assisted acid digestion program for sample preparation
Power (watt)
Ramp (min)
Hold time (min) Fan
800 10:00 20:00 1
0 - 15:00 3
2.3 Analysis of prepared samples
2.3.1 Analysis for Physical Parameters, Inorganic ions and Bacteria
Measurement of physical parameters and
analytical test for Inorganic ions and bacteria were
performed for the unpreserved / original water
samples. Physical parameters such as Temperature,
Conductivity, TDS, pH, Turbidity, Salinity and DO
were monitored on sampling site using portable
meters according to standard methods (Table 2.3).
Inorganic ions consisting Cl-, F-, NO3-, NO2
-,
SO4-2 and CN- along with Hardness were analyzed
on Spectrophotometer using standard methods
(Table 2.3). Bacterial tests specifically for Coliform
(E. Coli & Fecal) were performed for all water
samples collected from different point of the lake,

33
KB Canal and KG Canal using membrane filtration
method.
Table 2.3 List of Methods for Physical Parameters & Inorganic Ions Analysis
S. No. Parameters Methods
1 Temperature ASTM D 6764-02 (2007)
2 pH Value (acidity/basicity) ASTM D 6764-02 (2007)
3 Total Suspended Solids
(TSS) HACH Method#8006
4 Total Dissolved Solids (TDS) -
5 Chloride (as Cl-) AWWA* Method # 4110 B
6 Fluoride ( as F-) AWWA* Method # 4110 B
7 Nitrate (NO-3) AWWA* Method # 4110 B
Sulphate (SO4-2) AWWA* Method # 4110 B
8 Cyanide (as CN-) AWWA* Method # 4500
2.3.2 Analysis for trace & toxic metals
The samples prepared from lake water, soil /
sediment, macrofieds and fish species were
analyzed using ICPMS (PerkinElmer’s Elan DRC
model) for determining the levels of As, Ba Be, Ca,
Cd, Co, Cr, Cu, Fe, K, Li, Mg, Mn, Na, Ni, Se, V, Hg
and Zn.
The ICP-MS was tuned (using PerkinElmer
Smart Tune solution containing 10 ppb of Ba, Be,
Ce, Co, In, Mg, Pb, Rh and U, optimized (using
PerkinElmer, setup / stab / masscal solution
containing 10 ppb of Mg, cu, Rh, Cd, In, Ba, Ce, Pb,
U and detection limit solution containing 10 µg/L of
Be, Co, In, U and calibrated for the range of 1 to 100
ppb using five multi-element calibration standards
prepared from diluting stock standard solution
(PerkinElmer, Multi-element calibration standard 3).
Each sample was tested on ICP-MS and replicated
the test three times.
34
2.4 Precautions • Wearing of gloves, lab coat and safety mask at
the time of sample preparation and testing be
ensured.
• Clean and dry apparatus should be used
• Avoid returning of excess reagents to stock
bottles. The excess amount should be discarded
• Always pour acids into water. If you pour water
into acid, the heat of reaction will cause the
water to explode into steam, sometimes
violently, and the acid will splatter
• Eliminate from the laboratory as many ignition
sources as possible, such as open flames,
devices that can spark, and source of static
electricity
2.5 References 1 Christophe Kaki *, Guedenon Patient, Kelome
Nelly, Edorh Patrick A, and Adechina Rodrigue
“Evaluation of heavy metals pollution of
Nokoue Lake ”African Journal of Environmental
Science and Technology Vol. 5(3), pp. 255-
261, March, 2011
2 A.O. Ubalua, U. C. Chijioke and O.U. Ezeronye
“Determination and Assessment of Heavy Metal
Content in Fish and Shell-fish in Aba River, Abia
State, Nigeria” KMITL Sci. Tech. J. Vol. 7 No. 1
Jan. - Jun. 2007
3 E. O. Farombi, O. A. Adelowo, and y. R. Ajimoko
“Determination and Assessment of Heavy Metal
Content in Fish and Shellfish in Aba River, Abia
State, Nigeria” KMITL Sci. Tech. J. Vol. 7 No. 1
Jan. - Jun. 2007
4 Anna Farkas, János Salánki, András Specziár and
István Varanka “Metal Pollution as Health Indicator
of Lake Ecosystems” International Journal of
Occupational Medicine and Environmental Health,
Vol. 14, No. 2, 163—170, 2001
35
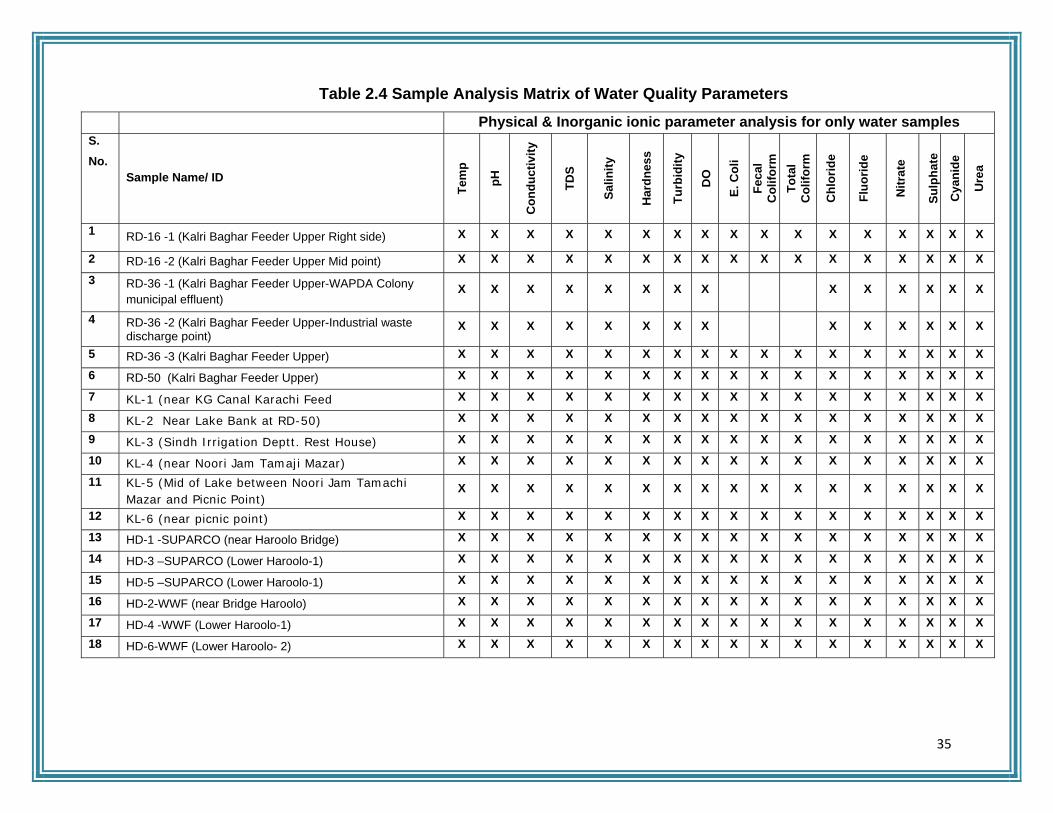
Table 2.4 Sample Analysis Matrix of Water Quality Parameters Physical & Inorganic ionic parameter analysis for only water samples S. No.
Sample Name/ ID
Tem
p
pH
Con
duct
ivity
TDS
Salin
ity
Har
dnes
s
Turb
idity
DO
E. C
oli
Feca
l C
olifo
rm
Tota
l C
olifo
rm
Chl
orid
e
Fluo
ride
Nitr
ate
Sulp
hate
Cya
nide
Ure
a
1 RD-16 -1 (Kalri Baghar Feeder Upper Right side) X X X X X X X X X X X X X X X X X
2 RD-16 -2 (Kalri Baghar Feeder Upper Mid point) X X X X X X X X X X X X X X X X X
3 RD-36 -1 (Kalri Baghar Feeder Upper-WAPDA Colony municipal effluent)
X X X X X X X X X X X X X X
4 RD-36 -2 (Kalri Baghar Feeder Upper-Industrial waste discharge point)
X X X X X X X X X X X X X X
5 RD-36 -3 (Kalri Baghar Feeder Upper) X X X X X X X X X X X X X X X X X
6 RD-50 (Kalri Baghar Feeder Upper) X X X X X X X X X X X X X X X X X
7 KL-1 (near KG Canal Karachi Feed X X X X X X X X X X X X X X X X X
8 KL-2 Near Lake Bank at RD-50) X X X X X X X X X X X X X X X X X
9 KL-3 (Sindh Irrigation Deptt. Rest House) X X X X X X X X X X X X X X X X X
10 KL-4 (near Noori Jam Tamaji Mazar) X X X X X X X X X X X X X X X X X
11 KL-5 (Mid of Lake between Noori Jam Tamachi Mazar and Picnic Point)
X X X X X X X X X X X X X X X X X
12 KL-6 (near picnic point) X X X X X X X X X X X X X X X X X
13 HD-1 -SUPARCO (near Haroolo Bridge) X X X X X X X X X X X X X X X X X
14 HD-3 –SUPARCO (Lower Haroolo-1) X X X X X X X X X X X X X X X X X
15 HD-5 –SUPARCO (Lower Haroolo-1) X X X X X X X X X X X X X X X X X
16 HD-2-WWF (near Bridge Haroolo) X X X X X X X X X X X X X X X X X
17 HD-4 -WWF (Lower Haroolo-1) X X X X X X X X X X X X X X X X X
18 HD-6-WWF (Lower Haroolo- 2) X X X X X X X X X X X X X X X X X

36
Table 2.4 Sample Analysis Matrix Table (continue) Trace & Toxic metals analysis for all types of samples S. No.
Sample Name/ ID
Lith
ium
(Li)
Ber
ylliu
m (B
e )
Sodi
um (N
a)
Mag
nesi
um(M
g)
Alu
min
um (A
l)
Pota
ssiu
m (K
)
Cal
cium
(Ca)
Vana
dium
(V)
Chr
omiu
m (C
r)
Man
gane
se (M
n)
Iron
(Fe)
Cob
alt (
Co)
Nic
kel (
Ni)
Cop
per (
Cu)
Zinc
(Zn)
Ars
enic
(As)
Sele
nium
(Se)
Silv
er (A
g)
Cad
miu
m (C
d)
Lead
(Pb)
Mer
cury
(Hg)
Bis
mut
h (B
i)
Bar
ium
(Ba)
1 RD-16 -1 (Kalri Baghar Feeder Upper Right side)
X X X X X X X X X X X X X X X X X X X X X X X
2 RD-16 -2 (Kalri Baghar Feeder Upper Mid point)
X X X X X X X X X X X X X X X X X X X X X X X
3 RD-36 -1 (Kalri Baghar Feeder Upper-WAPDA Colony municipal effluent)
X X X X X X X X X X X X X X X X X X X X X X X
4 RD-36 -2 (Kalri Baghar Feeder Upper-Industrial waste discharge point)
X X X X X X X X X X X X X X X X X X X X X X X
5 RD-36 -3 (Kalri Baghar Feeder Upper) X X X X X X X X X X X X X X X X X X X X X X X
6 RD-50 (Kalri Baghar Feeder Upper) X X X X X X X X X X X X X X X X X X X X X X X
7 KL-1 (near KG Canal Karachi Feed X X X X X X X X X X X X X X X X X X X X X X X
8 KL-2 Near Lake Bank at RD-50) X X X X X X X X X X X X X X X X X X X X X X X
9 KL-3 (Sindh Irrigation Deptt. Rest House)
X X X X X X X X X X X X X X X X X X X X X X X
10 KL-4 (near Noori Jam Tamaji Mazar)
X X X X X X X X X X X X X X X X X X X X X X X
11 KL-5 (Mid of Lake between Noori Jam Tamachi Mazar and Picnic Point)
X X X X X X X X X X X X X X X X X X X X X X X
12 KL-6 (near picnic point) X X X X X X X X X X X X X X X X X X X X X X X
13 HD-1 -SUPARCO (near Haroolo Bridge) X X X X X X X X X X X X X X X X X X X X X X X
14 HD-3 –SUPARCO (Lower Haroolo-1) X X X X X X X X X X X X X X X X X X X X X X X
15 HD-5 –SUPARCO (Lower Haroolo-1) X X X X X X X X X X X X X X X X X X X X X X X
16 HD-2-WWF (near Bridge Haroolo) X X X X X X X X X X X X X X X X X X X X X X X
17 HD-4 -WWF (Lower Haroolo-1) X X X X X X X X X X X X X X X X X X X X X X X
18 HD-6-WWF (Lower Haroolo- 2) X X X X X X X X X X X X X X X X X X X X X X X

37
CHAPTER-3 WATER QUALITY AND TOXICITY ASSESSMENT
OF KB FEEDER CANAL

38
3.1 Introduction
KB Canal is feeding source of fresh water to lake and
it is originating from the River Indus. The maintenance of the
water quality of canal falls under the jurisdiction of Sindh
Irrigation Department, a major stake holder. The effluent
waste of industries operating in Kotri Industrial Area is
discharged into the canal and this is one of the major
sources of anthropogenic contamination. The other potential
pollution sources are Municipal Waste of WAPDA Colony
and domestic waste of villages settled along the canal. We
have focused the section of canal staring from RD-16 near
Hyderabad Toll Plaza on Karachi-Hyderabad National
Highway section to Head Regulator at RD-50 near Keenjihar
Lake. The drinking water flowing into canal from the Indus
River is contaminated from these three major sources of
pollution which blend the water of canal along its way.
In present study, following criteria was followed in
selecting the sampling site for sample collection (water &
sediment);
1. Before contamination from Kotri Industrial
effluents i.e site before Kotri Industrial Area
2. The waste effluent of Kotri Industrial Area i.e.
the entrance point of industrial effluent
3. After mixing of the waste effluent i.e. after the
Kotri Industrial Area
Figure 3.1 View of Sampling of water and sediment at KB Feeder Canal.

39
3.2 Results and Discussion
3.2.1 Sampling Site-1, RD-16 (Near Hyderabad Tool Plaza)
This site is located (lat 25.41319 & long 68.2893)
near Tool Plaza on Karachi-Hyderabad Highway. At this site
two water and one sediment samples were collected.
Sample collected from right bank of canal designated as
RD-16-1 (KB Feeder Canal Upper Right side) and other
from mid of canal designated as RD-16-2 (KB Feeder Canal
Upper Mid point). The sampling is shown in Figure 3.2.
The water quality analysis of both water samples for
physical parameters including Temperature, pH, and
Conductivity, TDS, Salinity, Hardness and DO was carried
out. The analysis indicates that all of the parameters are
within the permissible limits of Pak NEQS for drinking water
except Temperature and Turbidity as given in Table 3.1.
Turbidity in both of the water samples at this sampling
location was more than the four times of the Pak NEQS
limits. DO was varied form 13.6 to 15.3 mg/l. The water
soluble anion analysis was carried out for Cl-1, NO3-1, SO4
-2
and CN-1. The detail results are given in Table 3.1.
Water soluble anion analysis of the canal water
samples indicate that Cl-1, F-1, SO4-2
and NO3-1 ion were
present in the samples but the concentration of F was 1.2
mg/l (at RD-16-1) which was close to the safe limits of Pak
NEQS (1.5 mg/l) but this is alarming level as this is a cancer
causing element if accumulated in the body for long time.
The other ions were in trace concentrations as shown in
Table 3.2. Urea was also detected in sample of RD16-1 (10
mg/l) which could cause killing of water species in the canal.
The results dictate that cyanide was detected in both of the
water samples although it is in the safe limits of the Pak.
NEQS and levels of other parameters were all within the
permissible limits at this site as shown in Table 3.2.
Bacterial analysis of the water samples was
conducted for two parameters including E.Coli and Fecal
Coliform. The result depicted that both water samples
contain bacteria as E. Coli was 35 MPN/100 ml and 30
MPN/100 ml at RD16-1 and RD-16-2 respectively. Similarly,
Fecal Coliform was 60 MPN/100 ml and 65 MPN/100 ml at
RD16-1 and RD-16-2 respectively. The source of the
bacterial contamination could be from cattle farm and waste
discharged from the local settlements along the bank of the

40
canal far behind or around the sampling location of RD-16
near Tool Plaza at Karachi-Hyderabad National Highway
near Hyderabad. The details results are given in Table 3.3.
Trace and Toxic element analysis of the canal water
samples was carried to asses the toxicity in the canal water
on upside of the Kotri Industrial Area. In water samples from
RD-16, the Be, Hg and Ag were not detected in both
samples, however, higher Al concentrations (361.7 ppb)
was detected in water sample collected from mid of the
canal at location of RD-16. Trace concentrations of Al (82.7
ppb at RD-16-1 and 361.7 ppb at RD-16-2), Cr (4.21 ppb at
RD-16-1 and 2.37 ppb at RD-16-2), Ni (3.01 ppb at RD-16-1
and 4.12 ppb at RD-16-2), As (0.42 ppb at RD-16-1 and
1.36 ppb at RD-16-2), Se (4.97 ppb at RD-16-1 and 3.32
ppb at RD-16-2) and Cd (1.32 ppb at RD-16-1 and 2.65 ppb
at RD-16-2) but these levels were within permissible safe
limits of Pak NEQS as shown in Table 4-A and Table 4-B.
In comparison with toxic elements in water samples,
the sediment sample (collected from bank of KB canal at
RD-16) contains high concentration of toxic metals such as
Al (26036.9 ppm very high), Be (1.9 ppb), Cr (115.9 ppm),
Figure 3.2 Sampling at RD-16- 2
Ni (50.1 ppm), As (17.4 ppm), Se (00), Pb (26.1 ppm), and
Cd (1.5 ppm). Se and Hg were not detected in the sediment
sample at this site as shown in Table 5-A and Table 5-B.
The high concentration of toxic element in the sediment
sample was due to the deposition of these elements since
long time back.
41
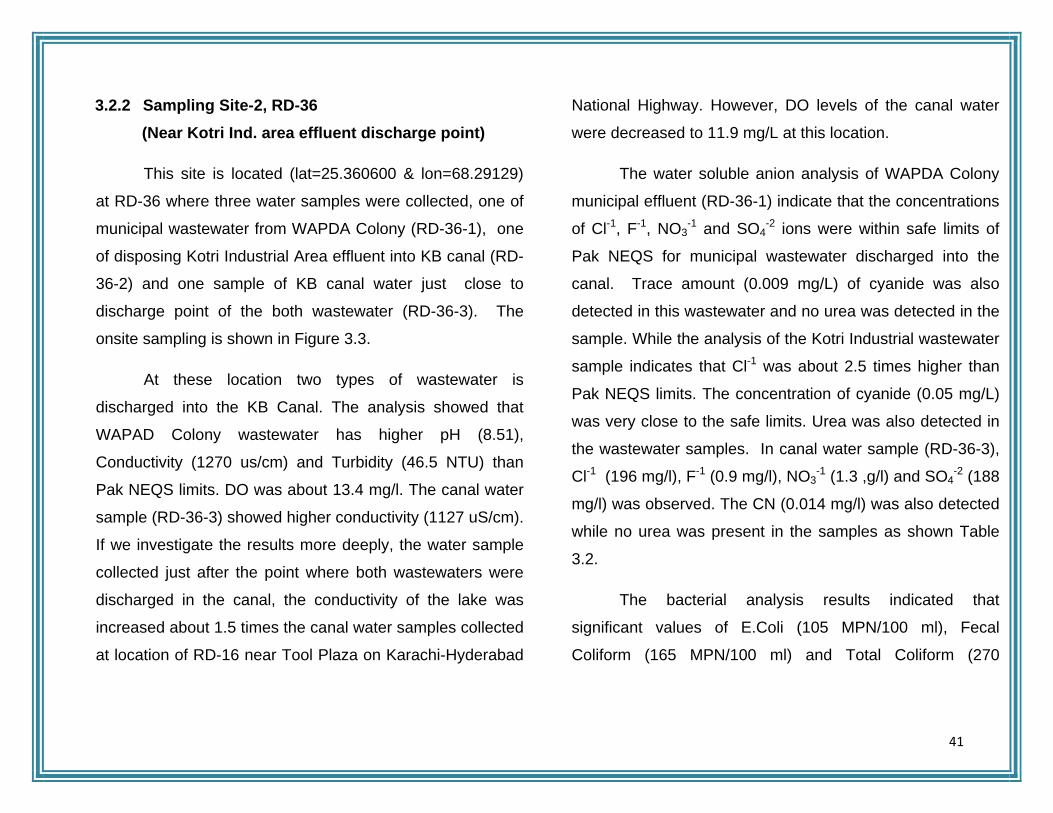
3.2.2 Sampling Site-2, RD-36 (Near Kotri Ind. area effluent discharge point)
This site is located (lat=25.360600 & lon=68.29129)
at RD-36 where three water samples were collected, one of
municipal wastewater from WAPDA Colony (RD-36-1), one
of disposing Kotri Industrial Area effluent into KB canal (RD-
36-2) and one sample of KB canal water just close to
discharge point of the both wastewater (RD-36-3). The
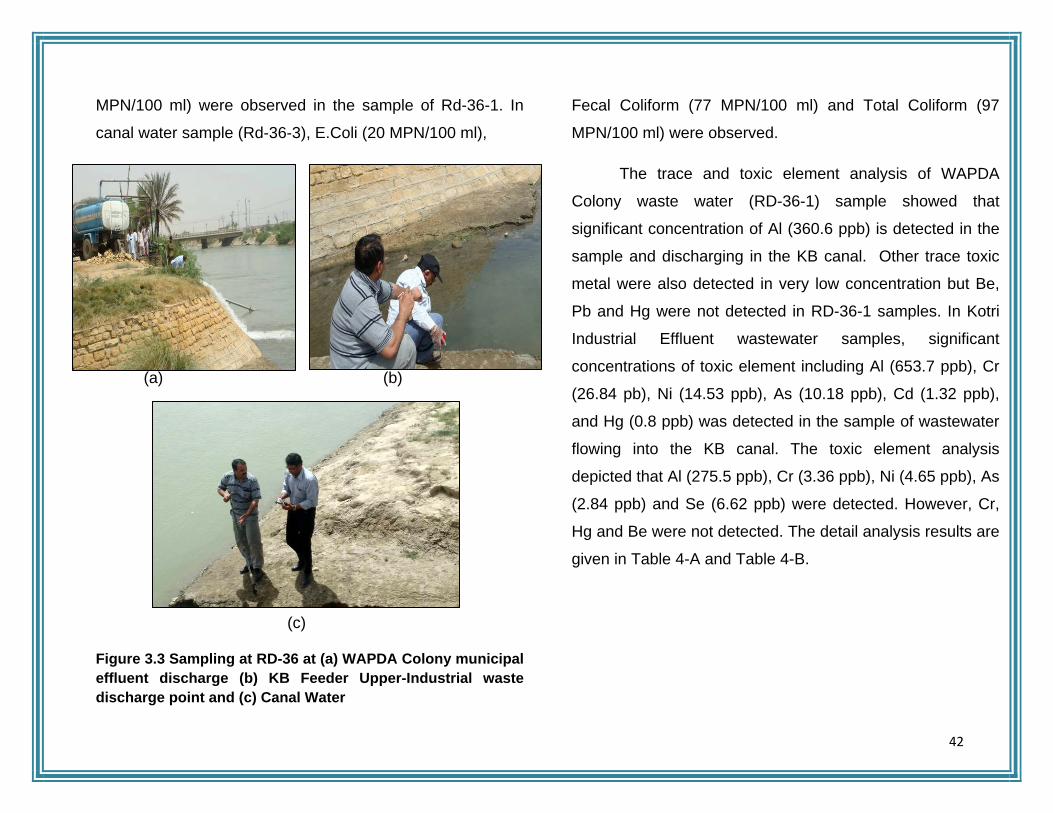
onsite sampling is shown in Figure 3.3.
At these location two types of wastewater is
discharged into the KB Canal. The analysis showed that
WAPAD Colony wastewater has higher pH (8.51),
Conductivity (1270 us/cm) and Turbidity (46.5 NTU) than
Pak NEQS limits. DO was about 13.4 mg/l. The canal water
sample (RD-36-3) showed higher conductivity (1127 uS/cm).
If we investigate the results more deeply, the water sample
collected just after the point where both wastewaters were
discharged in the canal, the conductivity of the lake was
increased about 1.5 times the canal water samples collected
at location of RD-16 near Tool Plaza on Karachi-Hyderabad
National Highway. However, DO levels of the canal water
were decreased to 11.9 mg/L at this location.
The water soluble anion analysis of WAPDA Colony
municipal effluent (RD-36-1) indicate that the concentrations
of Cl-1, F-1, NO3-1 and SO4
-2 ions were within safe limits of
Pak NEQS for municipal wastewater discharged into the
canal. Trace amount (0.009 mg/L) of cyanide was also
detected in this wastewater and no urea was detected in the
sample. While the analysis of the Kotri Industrial wastewater
sample indicates that Cl-1 was about 2.5 times higher than
Pak NEQS limits. The concentration of cyanide (0.05 mg/L)
was very close to the safe limits. Urea was also detected in
the wastewater samples. In canal water sample (RD-36-3),
Cl-1 (196 mg/l), F-1 (0.9 mg/l), NO3-1 (1.3 ,g/l) and SO4
-2 (188
mg/l) was observed. The CN (0.014 mg/l) was also detected
while no urea was present in the samples as shown Table
3.2.
The bacterial analysis results indicated that
significant values of E.Coli (105 MPN/100 ml), Fecal
Coliform (165 MPN/100 ml) and Total Coliform (270
42
MPN/100 ml) were observed in the sample of Rd-36-1. In
canal water sample (Rd-36-3), E.Coli (20 MPN/100 ml),
(a) (b)
(c) Figure 3.3 Sampling at RD-36 at (a) WAPDA Colony municipal effluent discharge (b) KB Feeder Upper-Industrial waste discharge point and (c) Canal Water
Fecal Coliform (77 MPN/100 ml) and Total Coliform (97
MPN/100 ml) were observed.
The trace and toxic element analysis of WAPDA
Colony waste water (RD-36-1) sample showed that
significant concentration of Al (360.6 ppb) is detected in the
sample and discharging in the KB canal. Other trace toxic
metal were also detected in very low concentration but Be,
Pb and Hg were not detected in RD-36-1 samples. In Kotri
Industrial Effluent wastewater samples, significant
concentrations of toxic element including Al (653.7 ppb), Cr
(26.84 pb), Ni (14.53 ppb), As (10.18 ppb), Cd (1.32 ppb),
and Hg (0.8 ppb) was detected in the sample of wastewater
flowing into the KB canal. The toxic element analysis
depicted that Al (275.5 ppb), Cr (3.36 ppb), Ni (4.65 ppb), As
(2.84 ppb) and Se (6.62 ppb) were detected. However, Cr,
Hg and Be were not detected. The detail analysis results are
given in Table 4-A and Table 4-B.
43
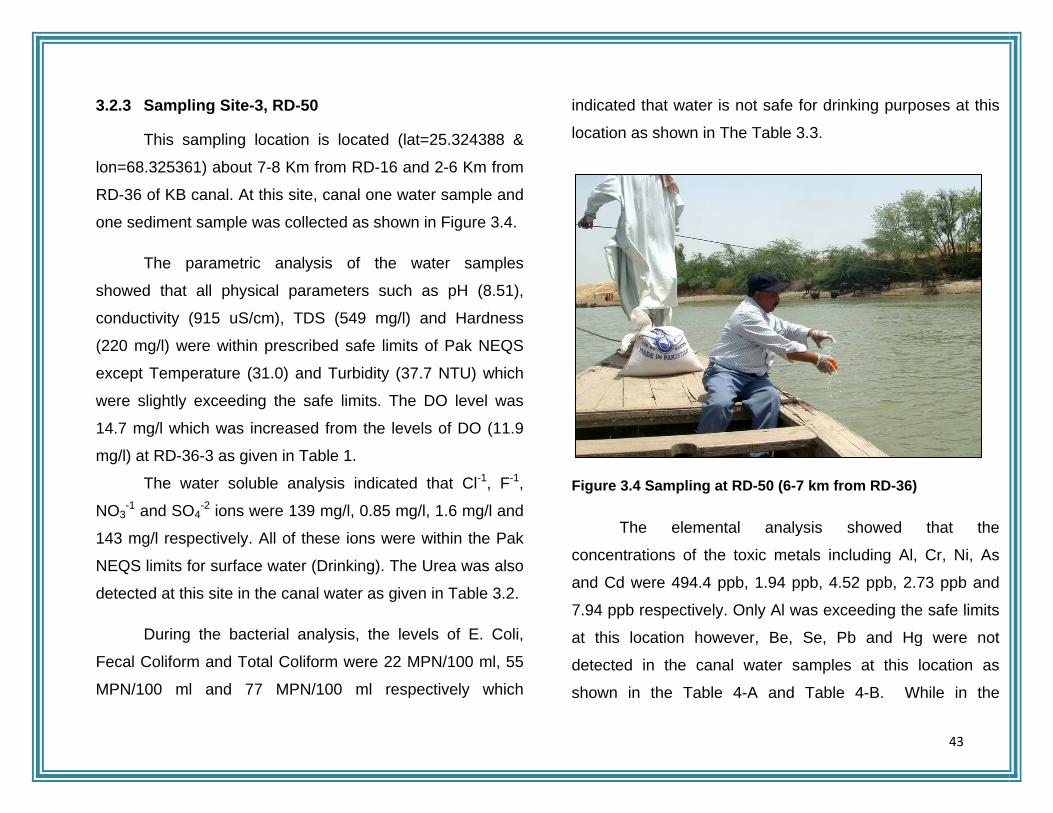
3.2.3 Sampling Site-3, RD-50
This sampling location is located (lat=25.324388 &
lon=68.325361) about 7-8 Km from RD-16 and 2-6 Km from
RD-36 of KB canal. At this site, canal one water sample and
one sediment sample was collected as shown in Figure 3.4.
The parametric analysis of the water samples
showed that all physical parameters such as pH (8.51),
conductivity (915 uS/cm), TDS (549 mg/l) and Hardness
(220 mg/l) were within prescribed safe limits of Pak NEQS
except Temperature (31.0) and Turbidity (37.7 NTU) which
were slightly exceeding the safe limits. The DO level was
14.7 mg/l which was increased from the levels of DO (11.9
mg/l) at RD-36-3 as given in Table 1.
The water soluble analysis indicated that Cl-1, F-1,
NO3-1 and SO4
-2 ions were 139 mg/l, 0.85 mg/l, 1.6 mg/l and
143 mg/l respectively. All of these ions were within the Pak
NEQS limits for surface water (Drinking). The Urea was also
detected at this site in the canal water as given in Table 3.2.
During the bacterial analysis, the levels of E. Coli,
Fecal Coliform and Total Coliform were 22 MPN/100 ml, 55
MPN/100 ml and 77 MPN/100 ml respectively which
indicated that water is not safe for drinking purposes at this
location as shown in The Table 3.3.
Figure 3.4 Sampling at RD-50 (6-7 km from RD-36)
The elemental analysis showed that the
concentrations of the toxic metals including Al, Cr, Ni, As
and Cd were 494.4 ppb, 1.94 ppb, 4.52 ppb, 2.73 ppb and
7.94 ppb respectively. Only Al was exceeding the safe limits
at this location however, Be, Se, Pb and Hg were not
detected in the canal water samples at this location as
shown in the Table 4-A and Table 4-B. While in the

44
sediment sample, the very high concentrations of toxic
metals was observed such as Al (17682.6 ppm), Cr (75.3
ppm), Ni (102.7 ppm), As (20.8 ppm), Cd (15.9 ppm) and Hg
(79.1 ppm) but Se and Pb were not detected in the sediment
samples at this site as given in the Table 5-A and Table 5-B.
These high concentrations indicate the alarming conditions.
3.2.4 Sampling Site-4, at Head Regulator of KB canal
This site is located (lat=25.03900 & lon=68.13636)
near the Lake where the KB canal water is fed to the Lake
and water flow to lake is regulated at this point. At this
location, water sample, sediment samples were collected
and sampling is shown in Figure 3.5.
Parametric analysis of the water samples depicted that
physical parameters such as pH (8.12), conductivity (871
uS/cm), TDS (524 mg/l) and Hardness (190 mg/l) were
within prescribed safe limits of Pak NEQS except
Temperature (31.3) and Turbidity (62.1 NTU) which were
slightly exceeding the safe limits however, DO levels was
12.4 mg/l which was slightly decreased from the levels of
DO (14.7 mg/l) at RD-4 as given in Table 3.1.
At this site, water soluble ions such as Chloride,
Nitrate and Sulphate ions were 85 mg/l, 0.8 mg/l and 163
mg/l respectively but Flouride ions were not detected in the
canal water samples at this location. All of these ions were
within the Pak. NEQS limits for surface water (Drinking). The
Urea was also detected at this site with the concentration of
20 mg/l as given in Table 3.2.
The bacterial analysis showed that harmful bacteria
such as E.Coli, Fecal Coliform and Total Coliform were
detected in the water sample as 22 MPN/100 ml, 45
MPN/100 ml and 67 MPN/100 ml respectively which
indicated that water is also not safe for drinking purposes at
this location as shown in the Table 3.3.
The results of elemental analysis of water samples
showed that the concentrations of the toxic metals including
Al, Cr, Ni, As, Pb and Se were 287.8 ppb, 1.80 ppb, 5.36
ppb, 3.32 ppb, 62.7 ppb and 2.67 ppb respectively. At this
location both Al and Pb were exceeding the safe limits at
this location however, Be, Ag, Cd and Hg were not detected
in the sample at this location as shown in the Table 4-A and
Table 4-B. The analysis of sediment sample showed that

45
(a)
(b)
Figure 3.5 Sampling at RD-50 near Head Regulator of KB canal for (a) water sample collection (b) sediment sample collection
the very high concentrations of toxic metals was observed
such as Al (8101.3 ppm), Cr (56.1 ppm), Ni (27.5 ppm), As
(13.7 ppm) but Se, Ag, Cd and Hg were not found in the
sample of this site as shown in the Table 5-A and Table 5-B.
These high concentrations indicate the alarming conditions
of toxicity at this site.
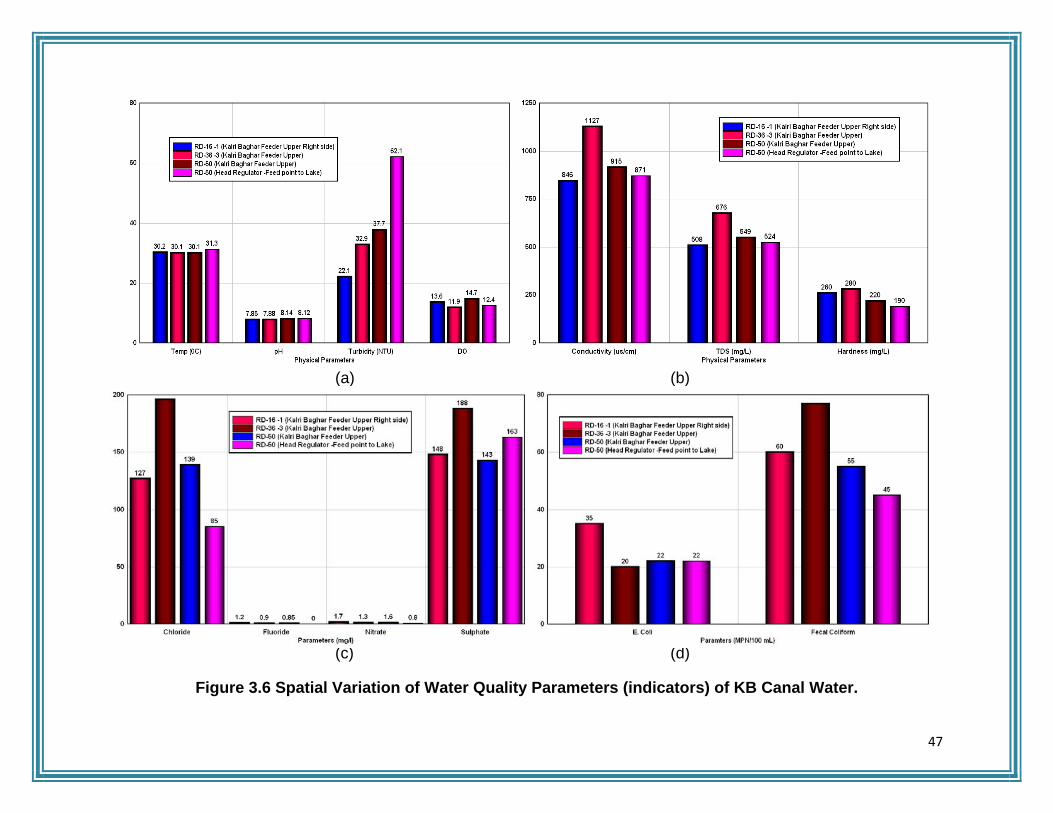
3.3 Spatial Variation of Water Quality Parameters (Physical and Biological)
The water samples were collected from various
points of the KB Feeder Canal located at (i) RD-16 (Near
Hyderabad Tool Plaza), (ii) RD-36 (Kotri Industrial Area Effluent Discharge point), (iii) RD-50 (5-6 km from RD-36)
and (iv) Head Regulator (near lake). The water samples
were analyzed for water quality parameters including
physical (Temperature, pH, Turbidity, TDS, Conductivity,
Hardness, DO, Cl-1, F-1, SO4-2 and NO3
-1 etc) and biological
parameters (E-Coli and Fecal Coliform). The spatial
variation of these parameters is shown in Figure 3.6. This
figure showed that physical parameters varied as
Temperature (30.1 C to 31.3 C), pH (7.85 to 8.14), Turbidity
(21.1 NTU to 62.1 NTU), DO (11.9 to 14.7), Conductivity
(846 to 1127 uS/cm), TDS (508 to 675 mg/l), Hardness

46
(190to 290 mg/l), SO4-1 (143 to 188 mg/l) in the canal water
samples. The bacterial variation indicated that E. Coli varied
from 20 to 35 MPN/100 mL and Fecal Coliform varied from
45 to 70 MPN/mL. Figure 3.6 showed that levels of
Conductivity, TDS, Hardness Cl-1, SO4-2, NO3
-1 and Fecal
Coliform were found higher in sample of RD-36-3 where
Kotrial Industrial Area effluent and WAPDA Colony waste
flows into the canal water.
47
) (b)
(a) (b)
(c) (d)
Figure 3.6 Spatial Variation of Water Quality Parameters (indicators) of KB Canal Water.

48
TTaabbllee 33..11 PPaarraammeettrriicc AAnnaallyyssiiss ooff WWaatteerr SSaammpplleess ffrroomm KKBB CCaannaall wwaatteerr aanndd KKoottrrii IInndduussttrriiaall AArreeaa EEfffflluueenntt
S. No.
Sample Name/ ID Temp (0C) pH Conductivity
(us/cm) TDS
(mg/L) Salinity (mg/L)
Hardness
(mg/L)
Turbidity
(NTU)
DO (mg/L)
WHO/ NEQS limit 25 6.5-8.5 1000 1000 -- 500 5 --
KB Feeder Canal
1 RD-16 -1 (KB Feeder Upper Right side) 30.2 7.85 846 508 0.6 260 22.1 13.6
2 RD-16 -2 (KB Feeder Upper Mid point) 30.4 7.89 865 520 0.6 250 31.0 15.3
3 RD-36 -1 (KB Feeder Upper-WAPDA Colony municipal effluent) 31.0 8.51 1270 758 0.7 210 46.5 13.4
4 RD-36 -2 (KB Feeder Upper-Industrial waste discharge point) 31.5 7.36 - - - - - 16.2
5 RD-36 -3 (KB Feeder Upper) 30.1 7.88 1127 676 0.7 280 32.9 11.9
6 RD-50 (KB Feeder Upper) 30.1 8.14 915 549 0.6 220 37.7 14.7
7 Head Regulator (Feed point to Lake) 31.3 8.12 871 524 0.6 190 62.1 12.4

49
TTaabbllee 33..22 WWaatteerr SSoolluubbllee AAnniioonnss aanndd UUrreeaa AAnnaallyyssiiss ooff KKBB CCaannaall wwaatteerr aanndd EEfffflluueenntt ffrroomm KKoottrrii IInndduussttrriiaall AArreeaa
S. No. Sample Name/ ID
Chloride
(mg/L)
Fluoride
(mg/L)
Nitrate
(mg/L)
Sulphate
(mg/L)
Cyanide
(mg/L)
Urea (mg/L)
WHO/ NEQS limit 250 1.5 50 250 0.05 <0.1 (WHO
guidelines)
KB Feeder Canal
1 RD-16 -1 (KB Feeder Upper Right side) 127 1.2 1.7 148 0.012 10
2 RD-16 -2 (KB Feeder Upper Mid point) 129 0.08 1.5 145 0.018 00
3 RD-36 -1 (KB Feeder Upper-WAPDA Colony municipal effluent)
135 1.1 5.6 150 0.009 00
4 RD-36 -2 (KB Feeder Upper-Industrial waste discharge point)
765 - 0.1 135 0.05 20
5 RD-36 -3 (KB Feeder Upper) 196 0.9 1.3 188 0.014 00
6 RD-50 (KB Feeder Upper) 139 0.85 1.6 143 0.007 10
2 Head Regulator (Feed point to Lake) 85 ND 0.8 163 0.008 20
50
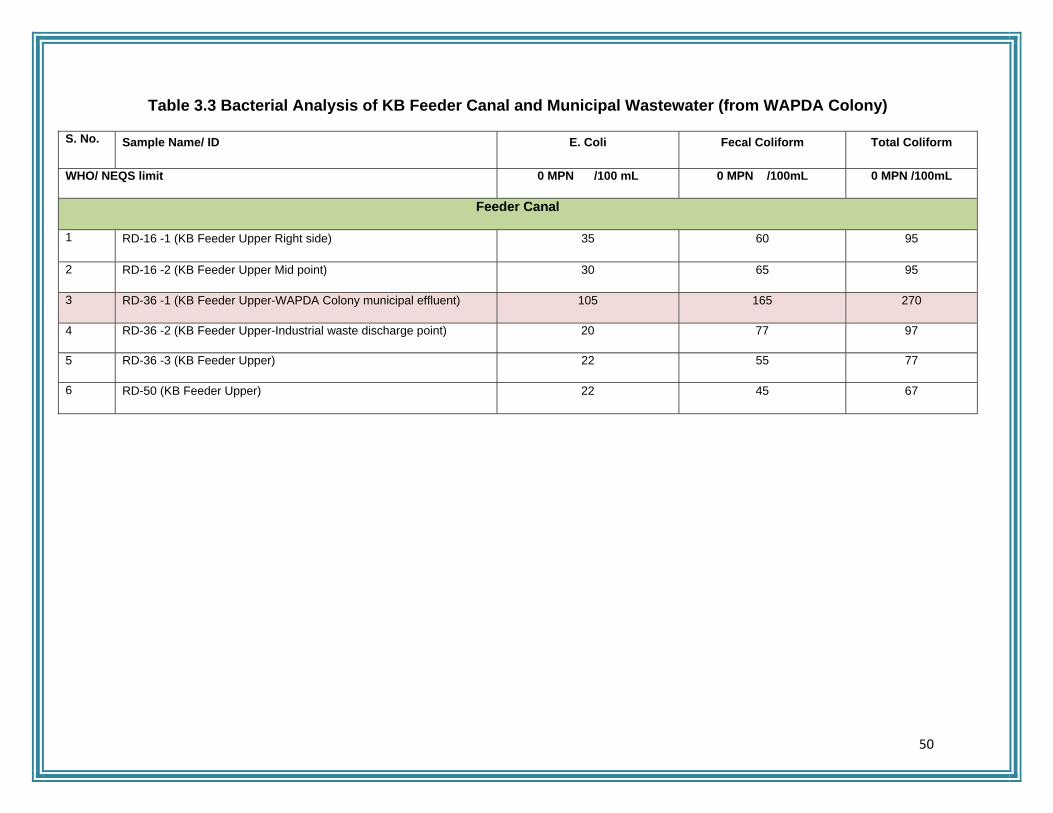
Table 3.3 Bacterial Analysis of KB Feeder Canal and Municipal Wastewater (from WAPDA Colony)
S. No. Sample Name/ ID E. Coli Fecal Coliform Total Coliform
WHO/ NEQS limit 0 MPN /100 mL 0 MPN /100mL 0 MPN /100mL
Feeder Canal
1 RD-16 -1 (KB Feeder Upper Right side) 35 60 95
2 RD-16 -2 (KB Feeder Upper Mid point) 30 65 95
3 RD-36 -1 (KB Feeder Upper-WAPDA Colony municipal effluent) 105 165 270
4 RD-36 -2 (KB Feeder Upper-Industrial waste discharge point) 20 77 97
5 RD-36 -3 (KB Feeder Upper) 22 55 77
6 RD-50 (KB Feeder Upper) 22 45 67

51
Table 3.4-A Trace & Toxic Element Analysis for of KB Canal water and Kotri Industrial Effluent
S. No Sample Name/ ID
Li
(ppb)
Be
(ppb)
Na
(ppm)
Mg
(ppm)
Al (ppb)
K
(ppm)
Ca
(ppm)
V (ppb)
Cr (ppb)
Mn (ppb)
Fe (ppb)
Co (ppb)
WHO/ NEQS limit - - 200 - 200 - - - 50 500 300 -
KB Feeder Canal
1 RD-16 -1 (KB Feeder Upper Right side) 5.34 ND 25.71 5.4 82.7 1.46 5.31 0.87 4.21 2.91 111.1 0.184
2 RD-16 -2 (KB Feeder Upper Mid point) 13.73 ND 67.75 14.16 361.7 3.55 14.65 3.19 2.37 10.72 421.3 0.386
3 RD-36 -1 (KB Feeder Upper-WAPDA Colony municipal effluent)
10.06 ND 73.17 15.19 360.6 4.23 15.42 3.71 2.17 5.38 416.5 0.241
4 RD-36 -2 (KB Feeder Upper-Industrial waste discharge point)
27.92 0.02 984.63 28.92 653.0 27.08 56.08 8.23 26.84 218.66 1136.9 1.538
5 RD-36 -3 (KB Feeder Upper) 15.74 ND 91.9 18.25 257.5 5.91 18.73 3.24 3.36 11.2 302.1 0.310
6 RD-50 (KB Feeder Upper) 13.21 0.02 69.71 14.58 494.4 3.79 14.3 3.43 1.94 14.23 494.2 0.405
7 Head Regulator (Feed point to Lake) 16.27 ND 82.73 17.33 287.8 4.74 17.48 3.93 1.80 9.51 444.4 0.431

52
TTaabbllee 33..44--BB TTrraaccee && TTooxxiicc EElleemmeenntt AAnnaallyyssiiss ffoorr ooff KKBB CCaannaall wwaatteerr aanndd KKoottrrii IInndduussttrriiaall EEfffflluueenntt
S. No Sample Name/ ID
Ni
(ppb)
Cu (ppb)
Zn (ppb)
As (ppb)
Se (ppb)
Ag (ppb)
Cd (ppb)
Pb (ppb)
Hg (ppb)
Bi (ppb)
Ba (ppb)
WHO/ NEQS limit 20 2000 5000 50 10 - 10 50 1 - 700
KB Feeder Canal
1 RD-16 -1 (KB Feeder Upper Right side)
3.01 3.19 34.34 0.42 4.97 ND 1.32 0 22 0
2 RD-16 -2 (KB Feeder Upper Mid point) 4.12 7.10 87.18 1.36 3.32 ND 2.65 0 0 22 130.5
3 RD-36 -1 (KB Feeder Upper-WAPDA Colony municipal effluent) 3.91 8.51 78.34 1.68 8.27 0.76 1.32 0 0 73 94.8
4 RD-36 -2 (KB Feeder Upper-Industrial waste discharge point) 14.53 17.43 40.57 10.18 ND 0.19 1.32 0 0.8 22 161.8
5 RD-36 -3 (KB Feeder Upper) 4.65 8.30 67.99 2.84 6.62 ND ND 0 0 22 103.7
6 RD-50 (KB Feeder Upper) 4.52 9.31 30.24 2.73 ND 0.76 7.94 0 0 0 1336.1
7 Head Regulator (Feed point to Lake) 5.36 5.44 51.02 3.32 2.67 ND ND 62.76 0 0 68.56

53
TTaabbllee 33..55--AA TTrraaccee && TTooxxiicc EElleemmeenntt AAnnaallyyssiiss ffoorr SSeeddiimmeennttss CCoolllleecctteedd ffrroomm KKBB CCaannaall aanndd KKoottrrii IInndduussttrriiaall EEfffflluueenntt PPoonnddss
S. No. Sample Name/ ID
Li
(ppb)
Be
(ppb)
Na
(ppm)
Mg
(ppm)
Al (ppm)
K
(ppm)
Ca
(ppm)
V (ppm)
Cr (ppm)
Mn (ppm)
KB Feeder Canal
1 RD-16 -1 (KB Feeder Upper Right side) 50.3 1.9 6149.7 6614.9 26036.9 7884.9 6681.7 127.6 115.9 432.7
2 RD-16 -2 (KB Feeder Upper Mid point)
Sample not collected
3 RD-36 -1 (KB Feeder Upper-WAPDA Colony municipal effluent)
Sample not collected
4 RD-36 -2 (KB Feeder Upper-Industrial waste discharge point) 34.7 1.6 9241.8 5066.5 16583.0 7056.8 11555.9 85.5 61.8 433.9
5 RD-36 -3 (KB Feeder Upper) 23.3 0.9 5213.8 7427.5 19071.8 6743.6 26137.7 70.4 120.2 350.2
6 RD-50 (KB Feeder Upper) 39.7 2.0 11425.5 8310.7 17682.6 6821.5 18621.3 87.4 75.3 593.9
7 Head Regulator (Feed point to Lake) 31.5 1.5 10539.5 2052.8 8101.3 5139.9 9034.1 69.5 56.1 399.3
54
TTaabbllee 33..55--BB TTrraaccee && TTooxxiicc EElleemmeenntt AAnnaallyyssiiss ffoorr ooff SSeeddiimmeenntt SSaammpplleess CCoolllleecctteedd ffrroomm KKBB CCaannaall wwaatteerr aanndd KKoottrrii
IInndduussttrriiaall EEfffflluueenntt
S. No. Sample Name/ ID
Fe (ppm)
Co (ppm)
Ni (ppm)
Cu (ppm)
Zn (ppm)
As (ppm)
Se (ppm)
Ag (ppm)
Cd (ppm)
Pb (ppm)
Bi (ppm)
Hg (ppm)
KB Feeder Canal
1 RD-16 -1 (KB Feeder Upper Right side) 24090.1 15.7 50.1 38.2 95.9 17.4 0 1.2 1.5 26.1 0 0
2 RD-16 -2 (KB Feeder Upper Mid point)
Sample not collected
3 RD-36 -1 (KB Feeder Upper-WAPDA Colony municipal effluent)
Sample not collected
4 RD-36 -2 (KB Feeder Upper-Industrial waste discharge point)
17527.9 10.2 33.0 28.9 72.8 15.3 0 1.8 0.76 0 57.6 0
5 RD-36 -3 (KB Feeder Upper) 15086.0 8.7 34.2 20.4 57.3 12.4 0 0 0.76 0 0 0
6 RD-50 (KB Feeder Upper) 20387.7 15.3 102.7 40.8 248.7 20.8 0 1.6 15.9 0 0 79.1
7 Head Regulator (Feed point to Lake) 14588.6 9.1 27.5 19.4 44.7 13.7 0 0 0 0 0 0

55
CHAPTER-4 WWAATTEERR QQUUAALLIITTYY AANNDD TTOOXXIICCIITTYY AASSSSEESSSSMMEENNTT
OOFF HHAARROOOOLLOO DDRRAAIINN

56
4.1 Introduction
It is rainy water drain which carries rain water to
Keenjihar Lake when heavy rains fall in the localities. The
length of Horoolo drain is about 4 Km from Horoolo bridge to
connecting point with lake. It is water bed of this drain is
about 3-4 feet lower than the lake and lake water flow back
in the drain channel commonly. The water in this section of
drain is consumed by the near settled population, cattle and
aquatic life (fish, turtles, etc). Incase of the of heavy rain,
water level become high in the drain than lake water level
and this drain water flow into the lake. The low channel and
sampling sites are shown in Figure 4.1.
The recent incident of killing of the aquatic life has
happened in the connecting section of Haroolo drain to the
lake where the lake water flows back in this section. The
media reports indicate that the recent killing of aquatic life
was confined in this section of drain and no killing of the
aquatic life is reported in lake water body near the
connecting with this section. This undoubtedly indicate that
cause of killing comes from the;
Figure 4.1 Sampling of Water and Sediments at Various Locations of Haroolo Drain
a. Toxic drain water mixed with water in the affected
section of Haroolo drain.
b. Local dumping of waste (toxic or industrial waste)
that poisoned the water or consumed the oxygen
(in dissolved form) resulting in the suffocation for
aquatic life.

57
To investigate the above possibilities, water samples,
sediment samples and affected species (fish) samples were
collected and analyzed for;
1. Water quality parameters (Physical & Biological)
2. Toxic elements
3. Urea
The sampling detail and investigating parameters are given
in Table 2.1 and Table 2.3 of Chapter 2 of this report.
4.2 Results and Discussion
4.2.1 Sampling Site-1, near Haroolo Bridge
This sampling location is located (lat=25.037633 &
lon=68.04486) about 4 km from Lake. At this location, drain
was dried and contains small amount of water. The
sampling location is shown in Figure 4.2. At this location,
two water and one sediment samples were collected. One
water sample was collected on 14-04-212 by WWF-P
officials when the recent incident was happened and one
water sample was collected on 02-05-2012 by SUPARCO
survey team.
The water quality analysis (Physical & Biological) of
both samples as carried out. The analysis report of WWF-
P’s sample indicated that Temperature (30.6 0C),
Conductivity (2710 uS/cm), TDS (1625 mg/l), Hardness (750
mg/l) were exceeding the prescribed safe limits of Pak
NEQS for surface water where as pH (7.82) and Turbidity
(3.04 NTU) was within the safe limits. The DO was about
18.6 mg/l in the sample. Similarly, SUPARCO’s water
sample results showed the similar trend where Temperature
(31.8 C), Conductivity (7390 uS/cm) TDS (4440 mg/l),
Hardness (1425 mg/l), Turbidity (10.5 NTU) which were
higher than the WWF-P sample but also exceeding the
prescribed safe limits of Pak NEQS while pH (8.11) was
within the safe limits as shown in Table 4.1.
The bacterial analysis was carried out only for the
SUPARCO sample. This analysis indicates presence of the
harmful bacteria in the drain water near the bridge. The
results showed that E. Coli, Fecal Coliform and Total
Coliform were 15 MPN/100 ml, 46 MPN/100 ml and 61
MPN/100 ml as shown in The Table 4.2.
The water soluble ion analysis indicated that Cl-1, F-1,
NO3-1 and SO4
-2 ions were 200 mg/l, 0.46 mg/l, 0.9 mg/l and
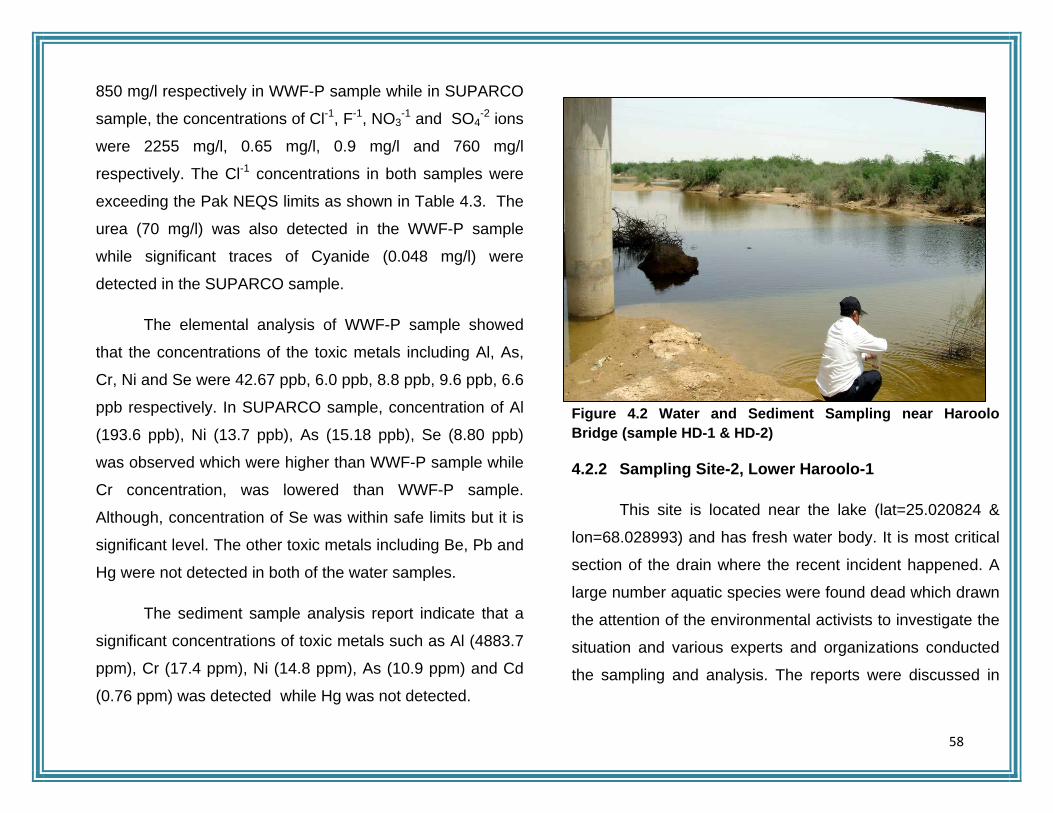
58
850 mg/l respectively in WWF-P sample while in SUPARCO
sample, the concentrations of Cl-1, F-1, NO3-1 and SO4
-2 ions
were 2255 mg/l, 0.65 mg/l, 0.9 mg/l and 760 mg/l
respectively. The Cl-1 concentrations in both samples were
exceeding the Pak NEQS limits as shown in Table 4.3. The
urea (70 mg/l) was also detected in the WWF-P sample
while significant traces of Cyanide (0.048 mg/l) were
detected in the SUPARCO sample.
The elemental analysis of WWF-P sample showed
that the concentrations of the toxic metals including Al, As,
Cr, Ni and Se were 42.67 ppb, 6.0 ppb, 8.8 ppb, 9.6 ppb, 6.6
ppb respectively. In SUPARCO sample, concentration of Al
(193.6 ppb), Ni (13.7 ppb), As (15.18 ppb), Se (8.80 ppb)
was observed which were higher than WWF-P sample while
Cr concentration, was lowered than WWF-P sample.
Although, concentration of Se was within safe limits but it is
significant level. The other toxic metals including Be, Pb and
Hg were not detected in both of the water samples.
The sediment sample analysis report indicate that a
significant concentrations of toxic metals such as Al (4883.7
ppm), Cr (17.4 ppm), Ni (14.8 ppm), As (10.9 ppm) and Cd
(0.76 ppm) was detected while Hg was not detected.
Figure 4.2 Water and Sediment Sampling near Haroolo Bridge (sample HD-1 & HD-2)
4.2.2 Sampling Site-2, Lower Haroolo-1
This site is located near the lake (lat=25.020824 &
lon=68.028993) and has fresh water body. It is most critical
section of the drain where the recent incident happened. A
large number aquatic species were found dead which drawn
the attention of the environmental activists to investigate the
situation and various experts and organizations conducted
the sampling and analysis. The reports were discussed in

59
Chapter 1 drawn no solid conclusion of the cause. The
sampling location is shown in Figure 4.3.
At this site, water (two) and sediment (one) samples
were collected. One water sample was collected on 17-04-
2012 by WWF-P staff while other sample was collected on
02-05-2012 by SUPARCO officials along with the sediment
sample. The physical parameters analysis report showed
that WWF-P water sample has Temperature (31.3 C), pH
(7.7), Conductivity (801 uS/cm) TDS (483 mg/l), Hardness
(250 mg/l) and Turbidity (3.07 NTU) and all of these
parameters were within the safe limits for drinking water of
Pak NEQS. The DO was about 9.8 mg/l in the sample as
given in Table 4.1. In SUPARCO’s water sample,
Temperature, pH, Conductivity, TDS, Hardness and
Turbidity was 30.2 0C, 7.52, 2670 uS/cm, 1608 mg/l, 700
mg/l and 68.2 NTU respectively. The results indicate that
TDS level was very high (about four times) as compared to
those of WWF-P sample.
The bacterial analysis was carried out only for the
SUPARCO sample. The results showed that E. Coli, Fecal
Coliform and Total Coliform were 15 MPN/100 ml, 65
MPN/100 ml and 80 MPN/100 ml as shown in The Table
4.2.This analysis indicates presence of the harmful bacteria
in the drain water at this site.
The water soluble ion analysis of WWF-P water
sample depict that the Cl-1, F-1, NO3-1 and SO4
-2 ions were
792 mg/l, 0.59 mg/l, 1.1 mg/l and 74 mg/l respectively which
showed that Chloride was higher than safe limits. All of
other ions were within the Pak NEQS limits. No Urea was
detected at this site. Analysis report of sample collected by
SUPARCO’s team showed the similar results i.e the
concentrations of Cl-1, F-1, NO3-1 and SO4
-2 ions were 985
mg/l, 0.88 mg/l, 2.8 mg/l and 248 mg/l respectively. The
cyanide was also detected in both of the samples. The detail
water soluble ions analysis report is given in Table 4.3.
At this site, elemental analysis of WWF-P sample
showed that the concentrations of the toxic metals including
Al, Cr, Ni and As were as 146.9 ppb, 1.49 ppb, 4.35 ppb,
1.73 ppb respectively. Other toxic metals including Be, Se,
Ag, Cd, Pb and Hg were not detected in the sample. In case
of sample collected by SUPARCO’s team at this site, the
concentration of Al, Cr, Ni, As and Se were 633.7 ppb, 6.29
ppb, 10.02 ppb, 4.46 ppb and 2.94 ppb respectively while
Ag, Cd, Pb and Hg were not detected.

60
The sediment sample (collected by SUPARCO staff)
analysis for toxic element indicates that significant
concentrations of Al (846.2 ppm), Cr (33.1 ppm), Ni (32.5
ppm), As (5.7 ppm), Cd (2.3 ppm) and Pb (52.3 ppm) were
present but Hg was not found in the sediment sample.
When SUPARCO survey team visited the site, most
of dead species were removed and no sufficient samples of
the effected species were available for in-depth analysis.
The team succeeded in collecting two fish (one alive and
one dead) samples. The toxic elemental analysis of Gills
and Meat of both alive and dead fish was carried out. In both
fish samples, toxic metal including Al, Cr, Ni, As and Se
were detected however, high concentrations of Cr (3.1
ppm), Ni (10.9 ppm) and Se (2.2 ppm) were detected in the
gills of dead fish sample compared to the concentrations of
Cr (2.8 ppm), Ni (6.8 ppm) and Se (0.55 ppm) of the gills of
alive fish sample. Comparatively, high concentrations of Al
(48.5 ppm), Ni (5.4 ppm) and As (0.45 ppm) were detected
in the meat sample of dead fish than the alive fish as given
in Table 4.6.
Figure 4.3 Water and Sediment Sampling near Lower Haroolo-1 (HD-3 & HD-4)

61
4.2.3 Sampling Site-3, Lower Haroolo-2 (close to lake)
This site is located (lat=25.01990 & lon=68.025215)
very close to the lake where either fresh lake water flow into
the drain or drain water flow into the lake. A large number of
plant species were also present in water body at this site.
At this site, water (two) and sediment (one) samples
were collected. One sample was collected on 17-04-2012 by
WWF-P staff while other sample was collected on 02-05-
2012 by SUPARCO officials along with sediment sample.
The physical parameters analysis report showed that water
sample collected by WWF-P has Temperature (31.2 C), pH
(7.74), Conductivity (825 uS/cm) TDS (494 mg/l), Hardness
(300 mg/l) and Turbidity (3.44 NTU) and all of these
parameters were within the safe limits for drinking water of
Pak NEQS. The DO was about 10.0 mg/l in the sample as
given in Table 4.1. In sample collected by SUPARCO’s
officials Temperature, pH, Conductivity, TDS, Hardness and
Turbidity was 30.2 0C, 8.12, 1937 uS/cm, 1161.0 mg/l, 450
mg/l and 49.2 NTU respectively. The results indicate that
TDS and Conductivity level were high (about 2.5 times) as
compared to those of WWF-P sample. DO was also higher
in the SUPARCO sample (15.8 mg/l). If we compare the
water sample analysis results of two sites, Lower Haroolo-1
and Lower Haroolo-2, the values of Temperature, pH,
Conductivity, TDS, Hardness, Turbidity and DO were higher
at site of Lower Haroolo-2.
The bacterial analysis of SUPARCO sample showed
that E. Coli, Fecal Coliform and Total Coliform were 19
MPN/100 ml, 85 MPN/100 ml and 104 MPN/100 ml as
shown in The Table 2.This analysis indicates presence of
the harmful bacteria in the drain water at this site.
The water soluble ion analysis of WWF-P water
sample depict that the Cl-1, F-1, NO3-1 and SO4
-2 ions were
180 mg/l, 0.65 mg/l, 1.9 mg/l and 71 mg/l respectively. All of
other ions were within the Pak NEQS limits. Urea (18.0 mg/l)
was detected in the water sample. Cyanide (0.025 mg/l) was
also detected in the sample. The analysis of SUPARCO’s
sample showed the concentrations of Cl-1, F-1, NO3-1 and
SO4-2 ions were 515 mg/l, 0.69 mg/l, 0.2 mg/l and 188 mg/l
respectively. The detail water soluble ions analysis report is
given in Table 4.3. If we compare the levels of ionic species
for sites Lower Haroolo-1 and Lower Haroolo-2, the higher
concentrations were detected in the site of Lower Haroolo-1
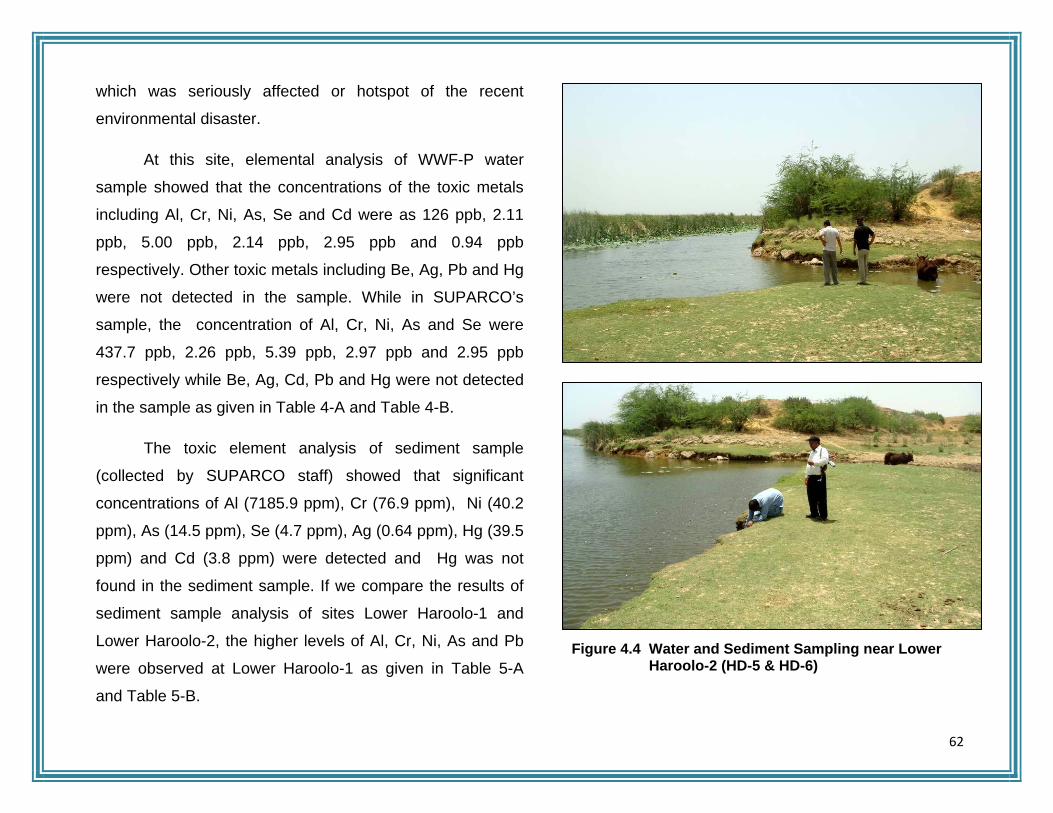
62
which was seriously affected or hotspot of the recent
environmental disaster.
At this site, elemental analysis of WWF-P water
sample showed that the concentrations of the toxic metals
including Al, Cr, Ni, As, Se and Cd were as 126 ppb, 2.11
ppb, 5.00 ppb, 2.14 ppb, 2.95 ppb and 0.94 ppb
respectively. Other toxic metals including Be, Ag, Pb and Hg
were not detected in the sample. While in SUPARCO’s
sample, the concentration of Al, Cr, Ni, As and Se were
437.7 ppb, 2.26 ppb, 5.39 ppb, 2.97 ppb and 2.95 ppb
respectively while Be, Ag, Cd, Pb and Hg were not detected
in the sample as given in Table 4-A and Table 4-B.
The toxic element analysis of sediment sample
(collected by SUPARCO staff) showed that significant
concentrations of Al (7185.9 ppm), Cr (76.9 ppm), Ni (40.2
ppm), As (14.5 ppm), Se (4.7 ppm), Ag (0.64 ppm), Hg (39.5
ppm) and Cd (3.8 ppm) were detected and Hg was not
found in the sediment sample. If we compare the results of
sediment sample analysis of sites Lower Haroolo-1 and
Lower Haroolo-2, the higher levels of Al, Cr, Ni, As and Pb
were observed at Lower Haroolo-1 as given in Table 5-A
and Table 5-B.
Figure 4.4 Water and Sediment Sampling near Lower Haroolo-2 (HD-5 & HD-6)
63
4.3.3 Spatial Variation of Water Quality Parameters (Physical and Biological)
Three water samples were collected from various
three different locations of the Haroolo Drain (i) near Bridge,
(ii) Lower Haroolo-1 and (iii) Lower Haroolo-2. The spatial
variation of physical water quality parameters (Temperature,
pH, Turbidity, TDS, Conductivity, Hardness, DO, Cl-1, F-1,
NO3-1 and SO4
-2 etc) and biological parameters (E-Coli and
Fecal Coliform) is shown in Figure 5. According to Figure
4.5, the physical parameters varied as Temperature (30.2 C
to 31.8 C), pH (7.33 to 8.12), Turbidity (10.5 NTU to 50
NTU), DO (11.1 to 15.8 mg/l), Conductivity (1937 to 17390
uS/cm), TDS (1161 to 4440 mg/l), Hardness (450 to 1425
mg/l), SO4-2 (188 to 760 mg/l) Cl-1 (515 to 2255 mg/l), NO3
-1
(0.2 to 3.5 mg/l) in the water samples. The bacterial
variation indicated that E. Coli varied from 15 to 21
MPN/100 mL and Fecal Coliform varied from 46 to 86
MPN/mL. The levels of the physical & biological parameters
were higher than the KB Canal results. Figure 6 showed the
significant presence of toxic metals. Sediment samples of
each site depicted that As and Cr were present in each
sample while Se, Cd and Hg were detected in sample of
Lower Haroolo-2. Pb was also detected in the sediment
sample of Haroolo-1.

64
(a) (b)
(c) (d)
Figure 4.5 Spatial Variation of Water Quality Parameters (indicators) of Haroolo Drain Water

65
Figure 4.6 Spatial Distribution of Toxic elements in Sediments of Haroolo Drain

66
TTaabbllee 44..11 PPhhyyssiiccaall PPaarraammeettrriicc AAnnaallyyssiiss ooff WWaatteerr SSaammpplleess ffrroomm HHaarroooolloo DDrraaiinn
S. No. Sample Name/ ID Temp
(0C) pH Conductivity (us/cm)
TDS (mg/L)
Salinity (mg/L)
Hardness
(mg/L)
Turbidity
(NTU)
DO (mg/L)
WHO/ NEQS limit 25 6.5-8.5 1000 1000 -- 500 5 --
Horoolo Drain
1 HD-1 -SUPARCO (near Haroolo Bridge) 31.8 8.11 7390 4440 3.2 1425 10.5 11.1
2 HD-2-WWF (near Bridge Haroolo) 30.6 7.82 2710 1625 1.3 750 3.04 18.6
3 HD-3 –SUPARCO (Lower Haroolo-1) 30.2 7.52 2670 1608 1.3 700 68.2 12.0
4 HD-4 -WWF (Lower Haroolo-1) 31.3 7.7 801 483 0.6 250 3.07 9.8
5 HD-5-(SUPARCO (Lower Haroolo -2) 30.2 8.12 1937 1161 1.0 450 49.2 15.8
6 HD-6-WWF (Lower Haroolo- 2) 31.2 7.74 825 494 0.6 300 3.44 10.0
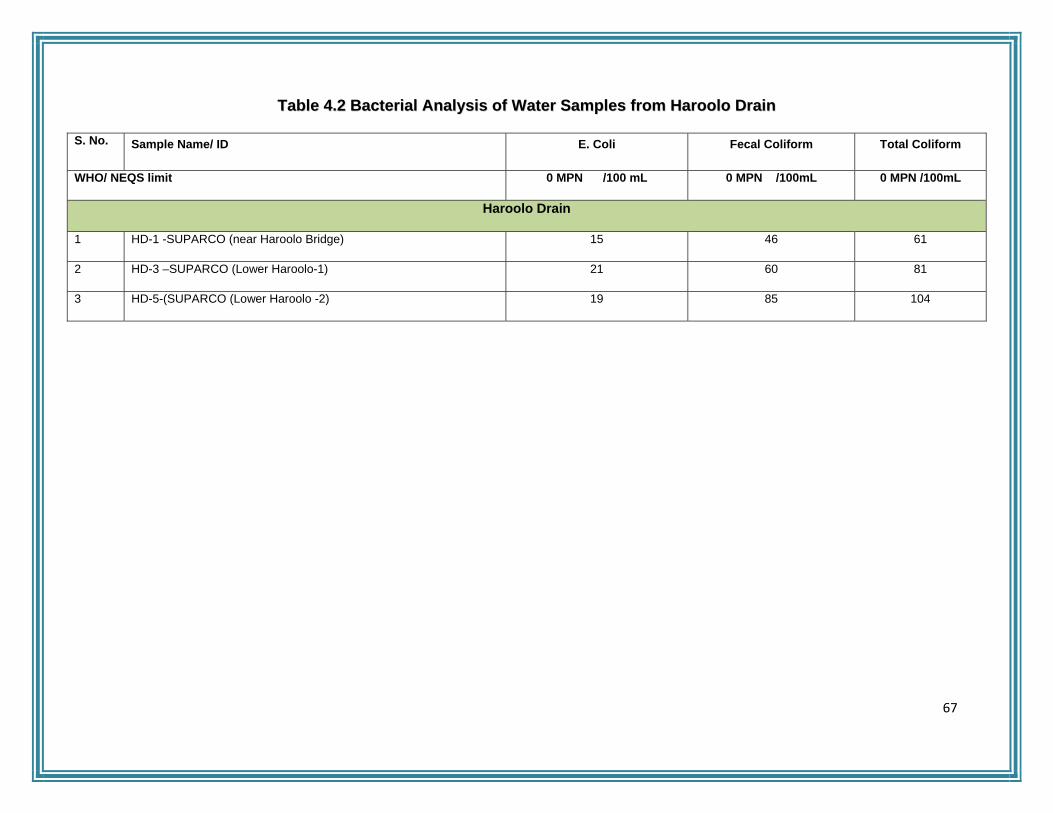
67
TTaabbllee 44..22 BBaacctteerriiaall AAnnaallyyssiiss ooff WWaatteerr SSaammpplleess ffrroomm HHaarroooolloo DDrraaiinn
S. No. Sample Name/ ID E. Coli Fecal Coliform Total Coliform
WHO/ NEQS limit 0 MPN /100 mL 0 MPN /100mL 0 MPN /100mL
Haroolo Drain
1 HD-1 -SUPARCO (near Haroolo Bridge) 15 46 61
2 HD-3 –SUPARCO (Lower Haroolo-1) 21 60 81
3 HD-5-(SUPARCO (Lower Haroolo -2) 19 85 104
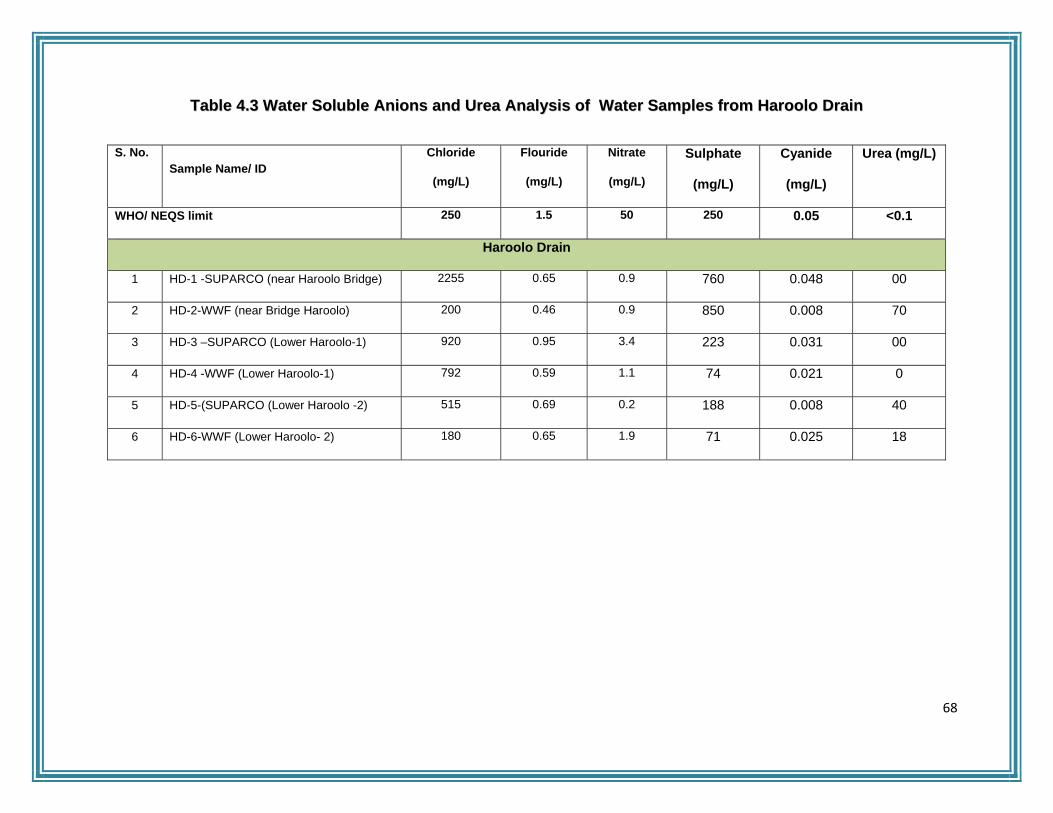
68
TTaabbllee 44..33 WWaatteerr SSoolluubbllee AAnniioonnss aanndd UUrreeaa AAnnaallyyssiiss ooff WWaatteerr SSaammpplleess ffrroomm HHaarroooolloo DDrraaiinn
S. No. Sample Name/ ID
Chloride
(mg/L)
Flouride
(mg/L)
Nitrate
(mg/L)
Sulphate
(mg/L)
Cyanide
(mg/L)
Urea (mg/L)
WHO/ NEQS limit 250 1.5 50 250 0.05 <0.1
Haroolo Drain
1 HD-1 -SUPARCO (near Haroolo Bridge) 2255 0.65 0.9 760 0.048 00
2 HD-2-WWF (near Bridge Haroolo) 200 0.46 0.9 850 0.008 70
3 HD-3 –SUPARCO (Lower Haroolo-1) 920 0.95 3.4 223 0.031 00
4 HD-4 -WWF (Lower Haroolo-1) 792 0.59 1.1 74 0.021 0
5 HD-5-(SUPARCO (Lower Haroolo -2) 515 0.69 0.2 188 0.008 40
6 HD-6-WWF (Lower Haroolo- 2) 180 0.65 1.9 71 0.025 18

69
TTaabbllee 44..44--AA TTrraaccee && TTooxxiicc EElleemmeenntt AAnnaallyyssiiss ooff HHaarroooolloo DDrraaiinn WWaatteerr SSaammpplleess
S. No Sample Name/ ID
Li
(ppb)
Be
(ppb)
Na
(ppm)
Mg
(ppm)
Al (ppb)
K
(ppm)
Ca
(ppm)
V (ppb)
Cr (ppb)
Mn (ppb)
Fe (ppb)
Co (ppb)
WHO/ NEQS limit
- - 200 - 200 - - - 50 300 -
Haroolo Drain
1 HD-1 -SUPARCO (near Haroolo Bridge)
62.60 ND - - 193.6 8.53 91.01 16.83 2.24 375.21 811.7 2.052
2 HD-2-WWF (near Bridge Haroolo) 21.6 0 71.9 34.8 42.67 4.1 39.9 7.24 8.8 96.2 393 0.75
3 HD-3 –SUPARCO (Lower Haroolo-1) 22.18 ND 882.8 43.27 185.7 4.53 33.88 5.82 1.78 76.73 433.6 0.60
4 HD-4 -WWF (Lower Haroolo-1) 12.89 ND 54.35 12.3 146.9 2.97 9.90 2.04 1.49 9.36 213.8 0.132
5 HD-5-(SUPARCO (Lower Haroolo -2) 19.85 ND 174.6 36.6 473.7 4.28 25.49 4.07 2.26 64.68 670.2 0.537
6 HD-6-WWF (Lower Haroolo- 2) 13.36 ND 60.14 13.53 126.9 3.26 10.98 2.08 2.11 6.23 183.3 0.173

70
TTaabbllee 44..44--BB TTrraaccee && TTooxxiicc EElleemmeenntt AAnnaallyyssiiss ooff HHaarroooolloo DDrraaiinn WWaatteerr SSaammpplleess
S. No Sample Name/ ID
Ni
(ppb)
Cu (ppb)
Zn (ppb)
As (ppb)
Se (ppb)
Ag (ppb)
Cd (ppb)
Pb (ppb)
Hg (ppb)
Bi (ppb)
Ba (ppb)
WHO/ NEQS limit 20 2000 5000 50 10 - 10 50 1 - 700
Haroolo Drain
S. No Sample Name/ ID
Ni
(ppb)
Cu (ppb)
Zn (ppb)
As (ppb)
Se (ppb)
Ag (ppb)
Cd (ppb)
Pb (ppb)
Hg (ppb)
Bi (ppb)
Ba (ppb)
WHO/ NEQS limit 20 2000 5000 50 10 - 10 50 1 - 700
1 HD-1 -SUPARCO (near Haroolo Bridge) 13.57 24.13 23.35 15.18 8.80 ND 0.94 0 0 0 29.14
2 HD-2-WWF (near Bridge Haroolo) 9.6 9.8 146.4 6.0 5.6 0 0 0 0 0 0
3 HD-3 –SUPARCO (Lower Haroolo-1) 8.33 12.87 27.31 3.14 7.38 ND ND 65.38 0 0 264.5
4 HD-4 -WWF (Lower Haroolo-1) 4.35 8.96 33.81 1.73 ND ND ND 0 0 0 67.24
5 HD-5-(SUPARCO (Lower Haroolo -2) 5.39 8.69 31.00 2.97 2.95 ND ND 0 0 0 152.4
6 HD-6-WWF (Lower Haroolo- 2) 5.00 6.07 182.2 2.14 2.95 ND 0.94 0 0 24.99 80.69
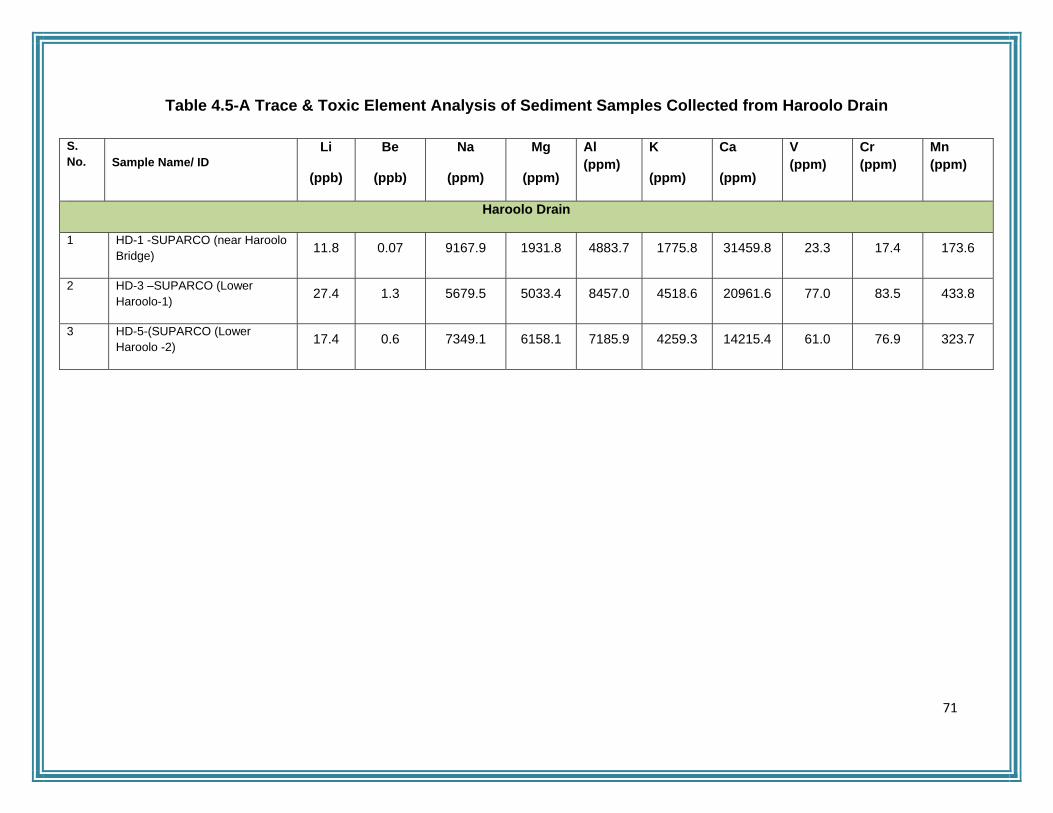
71
Table 4.5-A Trace & Toxic Element Analysis of Sediment Samples Collected from Haroolo Drain
S. No. Sample Name/ ID
Li
(ppb)
Be
(ppb)
Na
(ppm)
Mg
(ppm)
Al (ppm)
K
(ppm)
Ca
(ppm)
V (ppm)
Cr (ppm)
Mn (ppm)
Haroolo Drain
1 HD-1 -SUPARCO (near Haroolo Bridge) 11.8 0.07 9167.9 1931.8 4883.7 1775.8 31459.8 23.3 17.4 173.6
2 HD-3 –SUPARCO (Lower Haroolo-1) 27.4 1.3 5679.5 5033.4 8457.0 4518.6 20961.6 77.0 83.5 433.8
3 HD-5-(SUPARCO (Lower Haroolo -2) 17.4 0.6 7349.1 6158.1 7185.9 4259.3 14215.4 61.0 76.9 323.7
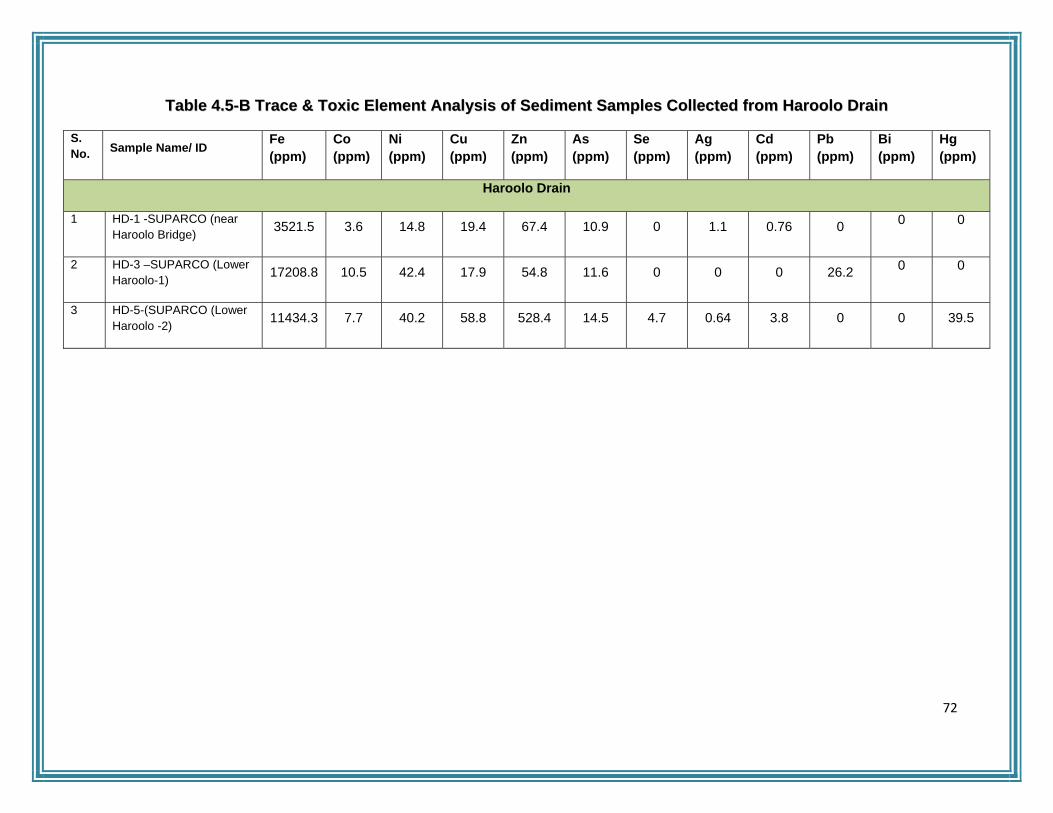
72
TTaabbllee 44..55--BB TTrraaccee && TTooxxiicc EElleemmeenntt AAnnaallyyssiiss ooff SSeeddiimmeenntt SSaammpplleess CCoolllleecctteedd ffrroomm HHaarroooolloo DDrraaiinn
S. No. Sample Name/ ID
Fe (ppm)
Co (ppm)
Ni (ppm)
Cu (ppm)
Zn (ppm)
As (ppm)
Se (ppm)
Ag (ppm)
Cd (ppm)
Pb (ppm)
Bi (ppm)
Hg (ppm)
Haroolo Drain
1 HD-1 -SUPARCO (near Haroolo Bridge) 3521.5 3.6 14.8 19.4 67.4 10.9 0 1.1 0.76 0 0 0
2 HD-3 –SUPARCO (Lower Haroolo-1) 17208.8 10.5 42.4 17.9 54.8 11.6 0 0 0 26.2 0 0
3 HD-5-(SUPARCO (Lower Haroolo -2) 11434.3 7.7 40.2 58.8 528.4 14.5 4.7 0.64 3.8 0 0 39.5

73
TTaabbllee 44..66 EElleemmeennttaall AAnnaallyyssiiss ooff FFiisshh ((DDeeaadd && AAlliivvee)) ffrroomm CCoolllleecctteedd AAffffeecctteedd SSeeccttiioonn ooff HHaarroooolloo DDrraaiinn,, HHDD--33 ––
SSUUPPAARRCCOO ((LLoowweerr HHaarroooolloo--11))
Parameters Gills of dead fish (ppm) Gills of alive fish
(ppm) Meat of dead fish
(ppm) Meat of alive fish (ppm)
WHO/ NEQS limit
1 Li 0.3 0.75 1.7 0.35
2 Be 0.01 0.01 0.01 0.089
3 Na 507.3 604.9 3251.6 411.5
4 Mg 945.0 1031.1 2276.1 979.1
5 Al 35.4 242.0 48.5 17.2
6 K 1285.5 553.0 1600.6 314.1
7 Ca 19985.5 32325.0 20577.7 17149.1
8 V 0.48 1.5 0.72 0.31
9 Cr 3.1 2.8 2.6 3.2
10 Mn 34.6 42.3 26.9 21.7
11 Fe 234.6 334.8 220.7 246.6
12 Co 0.39 0.44 0.19 0.23
13 Ni 10.9 6.8 5.4 3.9

74
Parameters Gills of dead fish (ppm) Gills of alive fish (ppm)
Meat of dead fish (ppm) Meat of alive fish (ppm)
14 Cu 1.8 3.2 2.3 2.5
15 Zn 96.9 117.2 77.6 140.9
16 As 0.26 0.75 0.45 0.23
17 Se 2.2 0.55 0 0.56
18 Ag 0.1 0 0 0.16
19 Cd 0 1.2 0 0.39
20 Pd 0 0 0 0
21 Bi 0 0 0 0
22 Hg 0 0 0 0
75
CHAPTER-5 WWAATTEERR QQUUAALLIITTYY AANNDD TTOOXXIICCIITTYY AASSSSEESSSSMMEENNTT
OOFF KKEEEENNJJIIHHAARR LLAAKKEE

76
5.1 Introduction
The operation of the lake is governed by what
materials enter the lake, leaves the lake and remains in
circulation. Lakes are characterized by a low, average current
velocity of 0.001 to 0.01 meters per second at its surface.
Water residence times in lake range from one month to
several years. Currents within lakes are multidirectional and,
many lakes have alternating periods of stratification and
vertical mixing. Similarly, quality of lake water is related to
inputs, like discharge of municipal and industrial wastewater,
diffused pollution from agricultural sources, discharge of toxic
substances from industries and thermal discharges, a specific
water quality problem may have its origin elsewhere. The
following principle will illustrate the point. Lakes have large
buffering capacities and can withstand certain levels of
pollutants. The buffering capacity is in the shape of the ability
of sediments to accumulate pollutants. Once the capacity has
exhausted, further input of pollutants will be reflected in the
water. This may give an impression that the problem has
occurred recently (e.g., lead in Keenjhar Lake), but, in
practice, the problem may have occurred many months ago.
The lake is a major source of drinking water for Karachi and
part of Thatta district, a picnic point and source of livelihood
for thousands of locals. It was created in 1930s from the union
of two smaller lakes Keenjhar and Kalri by the construction of
a dam at Chilya and a 12 km embankment on the eastern
side. Indus is only source of water which provides the
required water to Keenjhar through KB Feeder which starts
from Kotri Barrage. Keenjhar also known as Kalri Lake is the
only remaining fresh water body existing in Thatta
which is a hope for survival of two crore people living
in Karachi and in Thatta, In this dependency, the
degradation of the lake by many causative agents cannot be
ignored (WWF-P Report).
This lake is situated at least 60km away from the
industrial zone of Kotri and Jamshoro but it is receiving their
out flow regularly since long time. Nori industrial zone was
established towards the western and north western side of
the lake area at least 30 to 40 km away but the eutrphication
level of lake is indicating that huge quantity of polluted
water regularly contaminating it at its north western side
and making it more vulnerable, no action was taken yet. Due
to that contamination in water fish production has seriously
affected, nursery grounds offish had deteriorated. The name
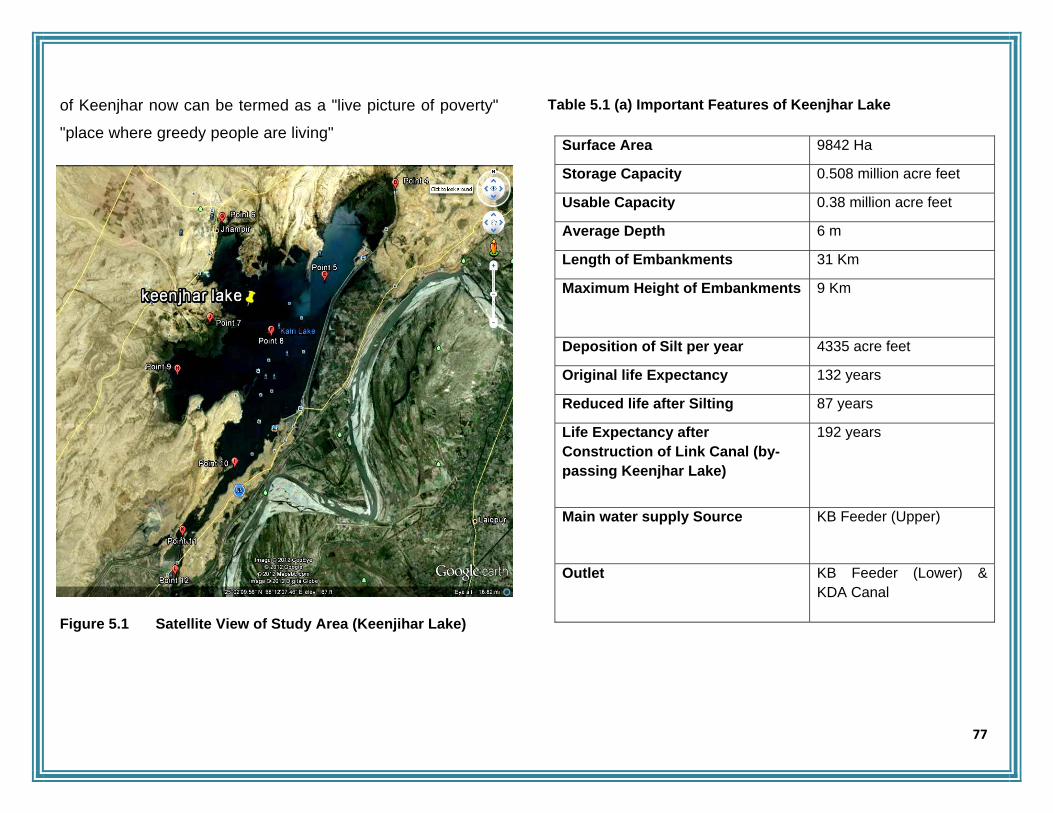
77
of Keenjhar now can be termed as a "live picture of poverty"
"place where greedy people are living"
Figure 5.1 Satellite View of Study Area (Keenjihar Lake)
Table 5.1 (a) Important Features of Keenjhar Lake
Surface Area 9842 Ha
Storage Capacity 0.508 million acre feet
Usable Capacity 0.38 million acre feet
Average Depth 6 m
Length of Embankments 31 Km
Maximum Height of Embankments 9 Km
Deposition of Silt per year 4335 acre feet
Original life Expectancy 132 years
Reduced life after Silting 87 years
Life Expectancy after Construction of Link Canal (by-passing Keenjhar Lake)
192 years
Main water supply Source KB Feeder (Upper)
Outlet KB Feeder (Lower) & KDA Canal

78
5.1.1 Ecological Features and Status
Keenjhar Lake was declared as a Game Sanctuary in
1971 and designated as a Wildlife Sanctuary in 1977 under
the Sind Wild life ordinance 1973. Population of migrants
(100000-200000 birds) during the winter was appreciated
worldwide and was selected as a Ramsar site. The lake is
internationally important for a wide variety of breeding,
staging, passage and wintering waterbirds. The wintering
birds include ducks and geese, shorebirds, flamingos,
cormorants, herons and egrets, ibises, coots, gulls, terns etc.
The breeding birds reported from this wetland are Cotton
Teal, Night Heron, Pheasant tailed Jacana and Purple
Moorehen. About 100,000 birds have been recorded from this
wetland in winter. This lake has rich submerged and floating
aquatic vegetation. The natural vegetation of the surrounding
area is tropical thorn forest. The Lake is rich in fish fauna and
supports the livelihood of about 50,000 local people. Main
activities at the site are commercial fishing, nature
conservation and public recreation. The number of birds in
and around Keenjhar Lake has dropped to a mere 1,750 from
50,000-150,000 in 1970, according to a recent survey.
According to surveys conducted by the WWF-Pakistan, there
were 13,000 birds residing in the area during the winter of
2007. In January 2008, the figure dropped to 7,000, in
November and December the figure declined further to 4,000
and 2,200 birds, respectively and the latest figure of January
2009 was 1,750, said the survey.
Table 5.1(b) Some Common Birds in Ecosystem of Keenjihar Lake
Common Birds Common Name Technical Name Status Common Teal Anas Crecca Migrant Common Pochard Aythya Ferina Migrant Common Coot Fulica Atra Migrant Great Cormorant Phalacrocorax Carbo Migrant Indian Shag Phalecrocorax
Fuscicollis Migrant
Little Grebe Tachybaptus Ruficollis Resident Little Cormorant Phalacrocorax Miger Resident Mallard Anas Platyrhynchos Migrant Pintail Anas Acuta Migrant Shoveller Anas Clypeata Migrant White Breasted Water Hen
Amauromis Phoenicurus
Resident

79
The survey stated that unabated hunting, particularly
through hanging nets and shooting, loss of habitat, loss of
feeding grounds, an increase in the water level, unrestricted
boat traffic and unsustainable fishing practices were behind
the problem. Some common species of birds are given in
Table 5.1 b.
5.2 Results and Discussion
For the, following sites were selected to collect the
samples near;
4. KL-1 (KG Canal)
5. KL-2 (Near Bank at RD-50)
6. KL-3 (Sindh Irrigation Deptt Rest House)
7. KL-4 (Noori Jam Tamaji Mazar)
8. KL-5 (Mid of Lake between Noori Jam Tamachi Mazar and Picnic Point)
9. KL-6 (Picnic Point)
5.2.1 KL-1 (KG Canal)
This site is located (lat=24.841654 & lon=67.98988)
near the regulator of KG Canal at the Keenjihar Lake where
lake water flows into the KG canal. At this point, one water
sample was collected and shown in Figure 5.2.
. The analysis for physical parameters such as pH,
conductivity, TDS, Salinity, Hardness and DO indicate that all
of the parameters are within the permissible limits of Pak
NEQS for drinking water expect DO was 14.3 mg/l. The detail
results are given in Table 5.2.
The water soluble anion analysis results showed that
Cl-1, F-1, NO3-1 and SO4
-2 were 62 mg/l, 0.75 mg/l, 2.0 mg/l
and 93 mg/l respectively. Cyanide was also detected in tracer
amount (0.013 mg/l) and no Urea was found in the sample.
The detail results are given in Table 5.3.
The Bacterial analysis of the water sample showed that
E.Coli and Fecal Coliform were present and the levels were
30 MPN/100 ml and 70 MPN/100 ml respectively. The details
results are given in Table 5.4.
Toxic element analysis of the water sample showed
that concentrations of Al Cr Ni As and Cd were 51.6 ppb 6.05
ppb 3.12 ppb and 2.3 ppb respectively while Be, Hg, Pb and
Se were not detected in the sample. These levels were within

80
permissible safe limits of Pak NEQS as shown in Table 5-A
and Table 5-B.
Figure 5.2 Sampling Team at KL-1 (KG Canal) the regulator of KG Canal 5.2.2 KL-2 (Near Lake Bank at RD-50)
This site is located the middle of the lake having
geological coordinates as (lat=24.904027 & lon=68.053722)
and sampling is shown in Figure 5.3.
The analysis report of the physical indicators
(parameters) of water quality depicted that physical
parameters such as pH (8.35), conductivity (547 uS/cm), TDS
(328 mg/l), Turbidity (1.77 NTU) and Hardness (225 mg/l)
were within prescribed safe limits of Pak NEQS except
Temperature (30.3) which was slightly exceeding the safe
limits however, DO levels was 13.0 mg/l which was slightly
increase from the levels of DO (9.3 mg/l and 10.2 mg/l) at the
sites near Rest House and Mid of Lake as given in Table 5.2.
The bacterial analysis showed that harmful bacteria
such as E.Coli, Fecal Coliform and Total Coliform were
detected in the water sample as 15 MPN/100 ml, 39 MPN/100
ml and 54 MPN/100 ml respectively which indicated that water
is also not safe for drinking purposes at this location as given
in Table 5.3. At this site, water soluble ions such as Cl-1, NO3-
1, SO4-1, F-1 and CN-1 ions were 65 mg/l, 0.9 mg/l, 90 mg/l,
0.02 mg/L and 0.006 respectively. All of these ions were
within the Pak NEQS limits for surface water (Drinking). The
Urea was not detected at this site as given in Table 5.4. The
results of elemental analysis of water samples showed that
the concentrations of the toxic metals including Al, Cr, Ni, As,
and Se were 87.4 ppb, 1.52 ppb, 2.61 ppb, 3.09 ppb, and
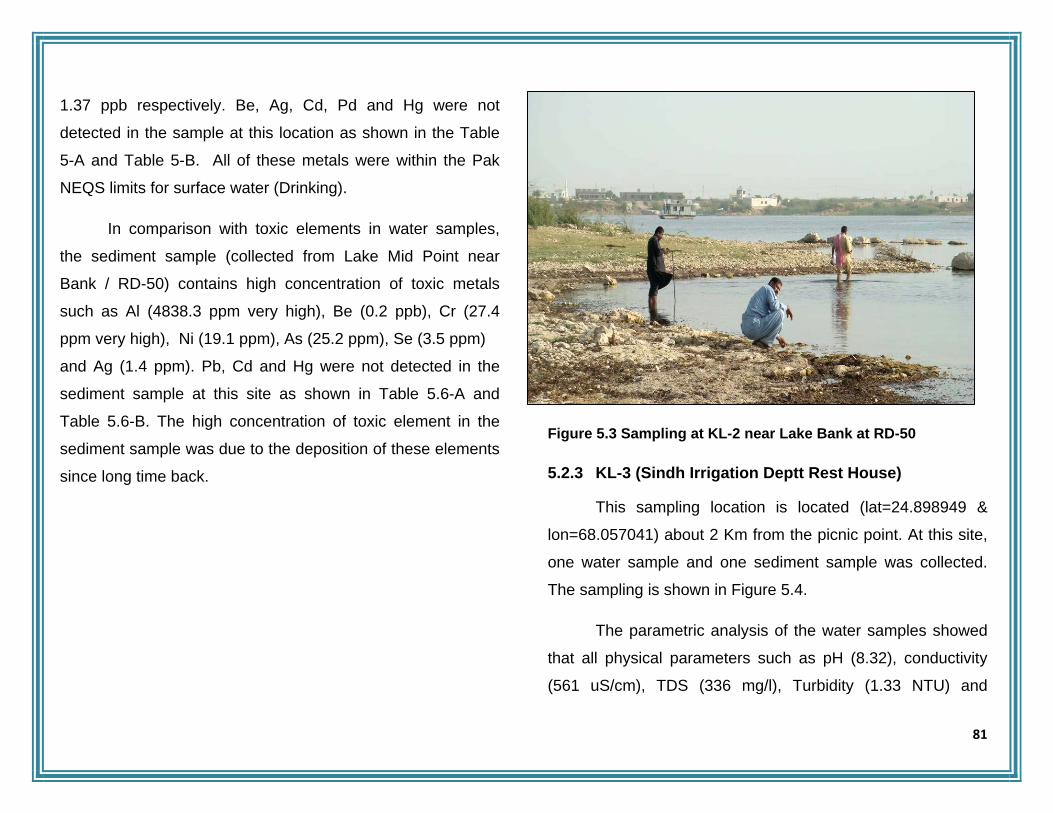
81
1.37 ppb respectively. Be, Ag, Cd, Pd and Hg were not
detected in the sample at this location as shown in the Table
5-A and Table 5-B. All of these metals were within the Pak
NEQS limits for surface water (Drinking).
In comparison with toxic elements in water samples,
the sediment sample (collected from Lake Mid Point near
Bank / RD-50) contains high concentration of toxic metals
such as Al (4838.3 ppm very high), Be (0.2 ppb), Cr (27.4
ppm very high), Ni (19.1 ppm), As (25.2 ppm), Se (3.5 ppm)
and Ag (1.4 ppm). Pb, Cd and Hg were not detected in the
sediment sample at this site as shown in Table 5.6-A and
Table 5.6-B. The high concentration of toxic element in the
sediment sample was due to the deposition of these elements
since long time back.
Figure 5.3 Sampling at KL-2 near Lake Bank at RD-50
5.2.3 KL-3 (Sindh Irrigation Deptt Rest House)
This sampling location is located (lat=24.898949 &
lon=68.057041) about 2 Km from the picnic point. At this site,
one water sample and one sediment sample was collected.
The sampling is shown in Figure 5.4.
The parametric analysis of the water samples showed
that all physical parameters such as pH (8.32), conductivity
(561 uS/cm), TDS (336 mg/l), Turbidity (1.33 NTU) and

82
Hardness (215 mg/l) were within prescribed safe limits of Pak
NEQS except Temperature (30.5) which was slightly
exceeding the safe limits. The DO level was 9.3 mg/l which
was decrease from the levels of DO at KG Canal water as
given in Table 5.2.
During the bacterial analysis, the levels of E. Coli,
Fecal Coliform and Total Coliform were 10 MPN/100 ml, 22
MPN/100 ml and 32 MPN/100 ml respectively which indicated
that water is not safe for drinking purposes at this location as
shown in The Table 5.3.
The water soluble analysis indicated that Cl-1, F-1,
NO3-1 and SO4
-2 ions were 73 mg/l, 0.05 mg/l, 1.2 mg/l and
107 mg/l respectively. All of these ions were within the Pak
NEQS limits for surface water (Drinking). The Urea was not
detected at this site as given in Table 5.4.
The elemental analysis showed that the concentrations
of the toxic metals including Al, Cr, Ni, and As were 128.1
ppb, 1.34 ppb, 3.65 ppb, and 2.27 ppb respectively. Be, Se,
Pb and Hg were not detected in the water samples at this
location as shown in the Table 5-A and Table 5-B. All of these
metals were within the Pak NEQS limits for surface water
(Drinking).
Figure 5.4 Sampling Team at KL-3 (Sindh Irrigation Deptt Rest House)
5.2.4 KL-4 (Noori Jam Tamaji Mazar)
This site is located (lat=24.936241 & lon=68.044814)
near mazar of Noori Jam Tamachi in main body of Lake water
and one water sample is collected as shown in Figure 5.5.
The parametric analysis of the water samples showed that all
83
physical parameters such as pH (8.42), conductivity (628
uS/cm), TDS (378 mg/l), Turbidity (1.73 NTU) and Hardness
(210 mg/l) were within prescribed safe limits of Pak. NEQS
except Temperature (29.9) which was slightly exceeding the
safe limits. The DO level was 10.0 mg/ as given in Table 5.2.
The water soluble analysis indicated that Cl-1, F-1,
NO3-1 and SO4
-2 ions were 89 mg/l, 0.15 mg/l, 0.6 mg/l and
105 mg/l respectively. All of these ions were within the Pak
NEQS limits for surface water (Drinking). The Urea was not
detected at this site as given in Table 5.3.
During the bacterial analysis, the levels of E. Coli,
Fecal Coliform and Total Coliform were 05 MPN/100 ml, 15
MPN/100 ml and 20 MPN/100 ml respectively which indicated
that water is not safe for drinking purposes at this location as
shown in The Table 5.4.
The elemental analysis showed that the concentrations
of the toxic metals including Al, Cr, Ni, As, Cd and Se were
93.6 ppb, 7.46 ppb, 4.97 ppb, 1.88 ppb, 1.13 ppb and 1.77
ppb respectively. Be, Pb and Hg were not detected in the
water samples at this location as shown in the Table 5.5-A
and Table 5.5-B. All of these metals were within the Pak.
NEQS limits for surface water (Drinking).
5.2.5 KL-5 (Mid of Lake between Noori Jam Tamachi Mazar and Picnic Point)
This site is located (lat=24.9450 & lon=68.053335)
near the Mid of Lake near Noori Jam Tamachi Mazar.
Parametric analysis of the water samples depicted that
physical parameters such as pH (8.35), conductivity (569
uS/cm), TDS (335 mg/l), Turbidity (1.72 NTU) and Hardness
(240 mg/l) were within prescribed safe limits of Pak NEQS
except Temperature (30.1) which was slightly exceeding the
safe limits however, DO levels was 10.2 mg/l which was
slightly increase from the levels of DO (9.3 mg/l) at the site
near Rest House.
At this site, water soluble ions such as Cl-1, F-1, NO3-1
and SO4-2, and Cyanide ions were 75 mg/l, 1.15 mg/l, 0.4
mg/l, 90 mg/L and 0.018 respectively. All of these ions were
within the Pak NEQS limits for surface water (Drinking). The
Urea was not detected at this site.

84
Figure 5.5 Sampling near Noori Jam Tamaji Mazar located in
the mid of lake The bacterial analysis showed that harmful bacteria
such as E.Coli, Fecal Coliform and Total Coliform were
detected in the water sample as 09 MPN/100 ml, 12 MPN/100
ml and 21 MPN/100 ml respectively which indicated that water
is also not safe for drinking purposes at this location as shown
in The Table 5.4.
The results of elemental analysis of water samples
showed that the concentrations of the toxic metals including
Al, Cr, Ni, As and Cd were 84.7 ppb, 5.18 ppb, 6.72 ppb, 3.27
and 1.13 respectively. Be, Ag, Pd, Se and Hg were not
detected in the sample at this location as shown in the Table
5.5-A and Table 5.5-B. All of these metals were within the
Pak NEQS limits for surface water (Drinking).
5.2.6 KL-6 (Picnic Point)
This site is located (lat=24.916227 & lon=68.073027)
near the picnic point. At this location, water sample, sediment
samples were collected as shown in Figure 5.6.
Parametric analysis of the water samples depicted that
physical parameters such as pH (8.47), conductivity (561
uS/cm), TDS (337 mg/l), Turbidity (2.68 NTU) and Hardness
(218 mg/l) were within prescribed safe limits of Pak NEQS
except Temperature (30.3 0C) which was slightly exceeding
the safe limits however, DO levels was 10.0 mg/l which was
slightly decreased from the levels of DO (10.2 mg/l) at Mid of
Lake as given in Table 5.2.
At this site, water soluble ions such as Cl-1, NO3-1,
SO4-2, F-1 and Cyanide ions were 80 mg/l, 1.1 mg/l, 146 mg/l,
0.13 mg/L and 0.009 respectively. All of these ions were
within the Pak NEQS limits for surface water (Drinking). The
Urea was not detected at this site as given in Table 5.3.

85
The bacterial analysis showed that harmful bacteria
such as E.Coli, Fecal Coliform and Total Coliform were
detected in the water sample as 22 MPN/100 ml, 60 MPN/100
ml and 82 MPN/100 ml respectively which indicated that water
is also not safe for drinking purposes at this location as shown
in The Table 5.4.
The results of elemental analysis of water samples
showed that the concentrations of the toxic metals including
Al, Cr, Ni, As, and Se were 44.1 ppb, 3.75 ppb, 6.86 ppb, and
1.32 ppb, respectively. Only concentration of Al is higher than
the limit of Pak NEQS. Be, Se, Ag, Cd, Pd and Hg were not
detected in the sample at this location as shown in the Table
5.5-A and Table 5.5-B. All of these metals were within the
Pak. NEQS limits for surface water (Drinking).
In comparison with toxic elements in water samples,
the sediment sample (collected Near Picnic Point) contains
high concentration of toxic metals such as Al (6305.9 ppm
very high), Be (0.8 ppb), Cr (49.8 ppm), Ni (19.6 ppm), As
(15.9 ppm) and Ag (2.0 ppm). Pb, Se, Cd and Hg were not
detected in the sediment sample at this site as shown in Table
5.6-A and Table 5.6-B.
Figure 5.6 Sampling at KL-6 (Picnic Point)
5.3 Spatial Distribution Water Quality Parameters in Lake Water samples (Physical and Biological)
For spatial distribution of lake water quality parameters,
water samples were collected from six (06) different locations
of lake. The spatial variation of physical water quality
parameters (Temperature, pH, Turbidity, TDS, Conductivity,
Hardness, DO, Cl-1, F-1, NO3-1 and SO4
-2 etc) and biological
parameters (E-Coli and Fecal Coliform) is shown in Figure

86
5.7. According to Figure 5.7, the physical parameters varied
as Temperature (29.9 C to 30.5 C), pH (7.74 to 8.8.47),
Turbidity (1.33 NTU to 8.75 NTU), DO (9.3 to 14.3 mg/l),
Conductivity (542 to 628 uS/cm), TDS (326 to 378 mg/l),
Hardness (160 to 240 mg/l), SO4-2 (90 to 146 mg/l) Cl-1 (62 to
89 mg/l), NO3-1 (0.2 to 2.0 mg/l) in the water samples. The
bacterial variation indicated that E. Coli varied from 5 to 30
MPN/100 mL and Fecal Coliform varied from 12 to 70
MPN/mL. The levels of the physical & biological parameters
were lower from both the feeding sources i.e KB Feeder
Canal and Haroolo Drain. Figure 5.7 also showed that Arsenic
(As) and Chromium (Cr) were detected while Lead (Pb) and
Mercury (Hg) were not found in any of the lake water sample.

87
(a)
(b)
Figure 5.7 Spatial Variation of Water Quality Parameters (indicators) of Karli Lake Water
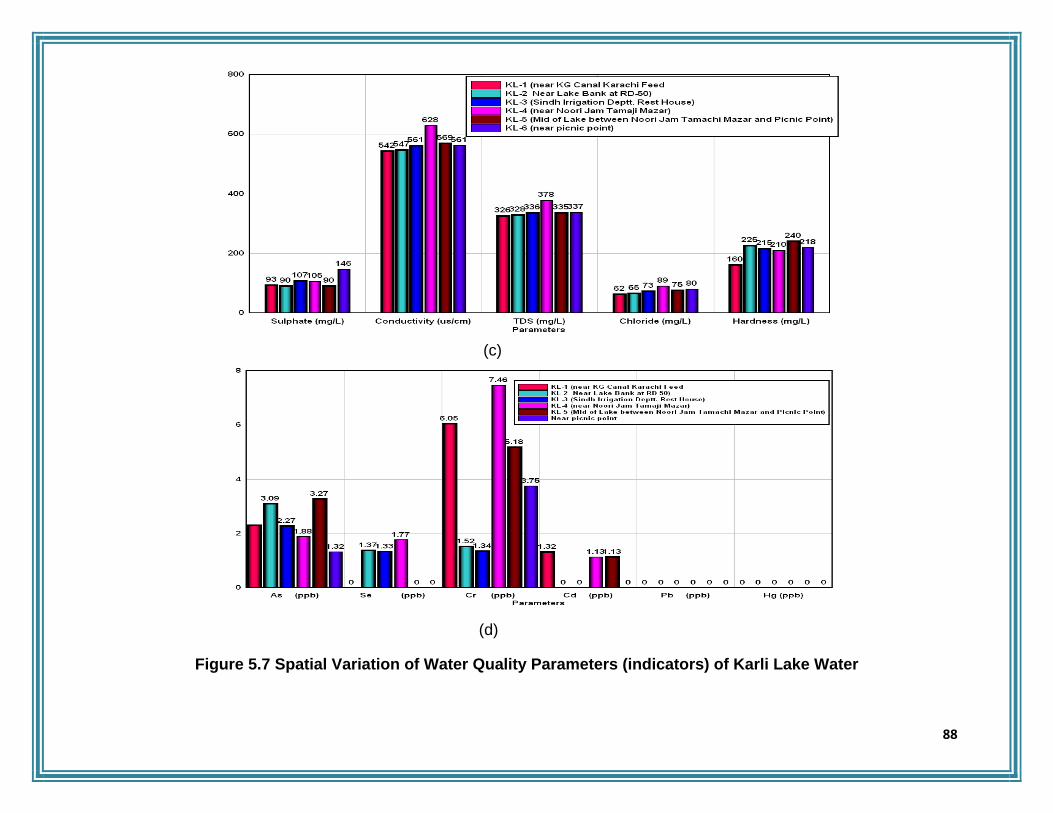
88
(c)
(d)
Figure 5.7 Spatial Variation of Water Quality Parameters (indicators) of Karli Lake Water

89
(e)
Figure 5.7 Spatial Variation of Water Quality Parameters (indicators) of Karli Lake Water
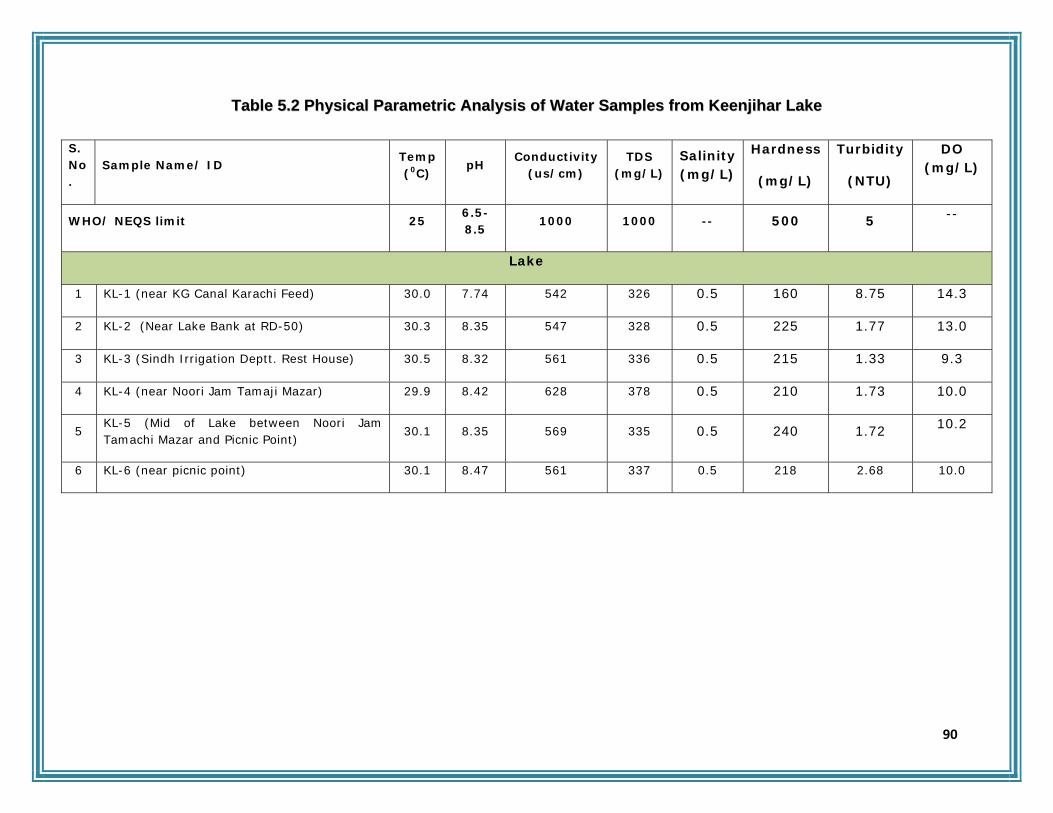
90
TTaabbllee 55..22 PPhhyyssiiccaall PPaarraammeettrriicc AAnnaallyyssiiss ooff WWaatteerr SSaammpplleess ffrroomm KKeeeennjjiihhaarr LLaakkee
S. No.
Sample Name/ ID Temp (0C)
pH Conductivity
(us/cm) TDS
(mg/L) Salinity (mg/L)
Hardness
(mg/L)
Turbidity
(NTU)
DO (mg/L)
WHO/ NEQS limit 25 6.5-8.5
1000 1000 -- 500 5 --
Lake
1 KL-1 (near KG Canal Karachi Feed) 30.0 7.74 542 326 0.5 160 8.75 14.3
2 KL-2 (Near Lake Bank at RD-50) 30.3 8.35 547 328 0.5 225 1.77 13.0
3 KL-3 (Sindh Irrigation Deptt. Rest House) 30.5 8.32 561 336 0.5 215 1.33 9.3
4 KL-4 (near Noori Jam Tamaji Mazar) 29.9 8.42 628 378 0.5 210 1.73 10.0
5 KL-5 (Mid of Lake between Noori Jam Tamachi Mazar and Picnic Point) 30.1 8.35 569 335 0.5 240 1.72 10.2
6 KL-6 (near picnic point) 30.1 8.47 561 337 0.5 218 2.68 10.0
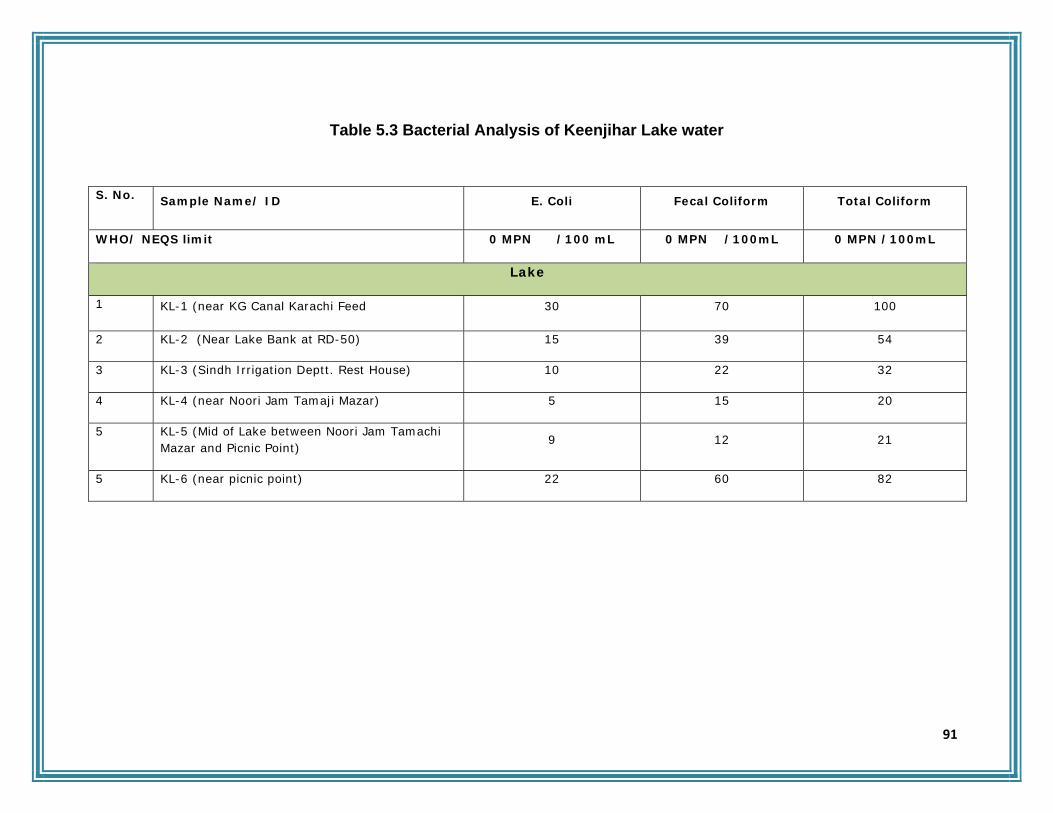
91
Table 5.3 Bacterial Analysis of Keenjihar Lake water
S. No. Sample Name/ ID E. Coli Fecal Coliform Total Coliform
WHO/ NEQS limit 0 MPN /100 mL 0 MPN /100mL 0 MPN /100mL
Lake
1 KL-1 (near KG Canal Karachi Feed 30 70 100
2 KL-2 (Near Lake Bank at RD-50) 15 39 54
3 KL-3 (Sindh Irrigation Deptt. Rest House) 10 22 32
4 KL-4 (near Noori Jam Tamaji Mazar) 5 15 20
5 KL-5 (Mid of Lake between Noori Jam Tamachi Mazar and Picnic Point)
9 12 21
5 KL-6 (near picnic point) 22 60 82
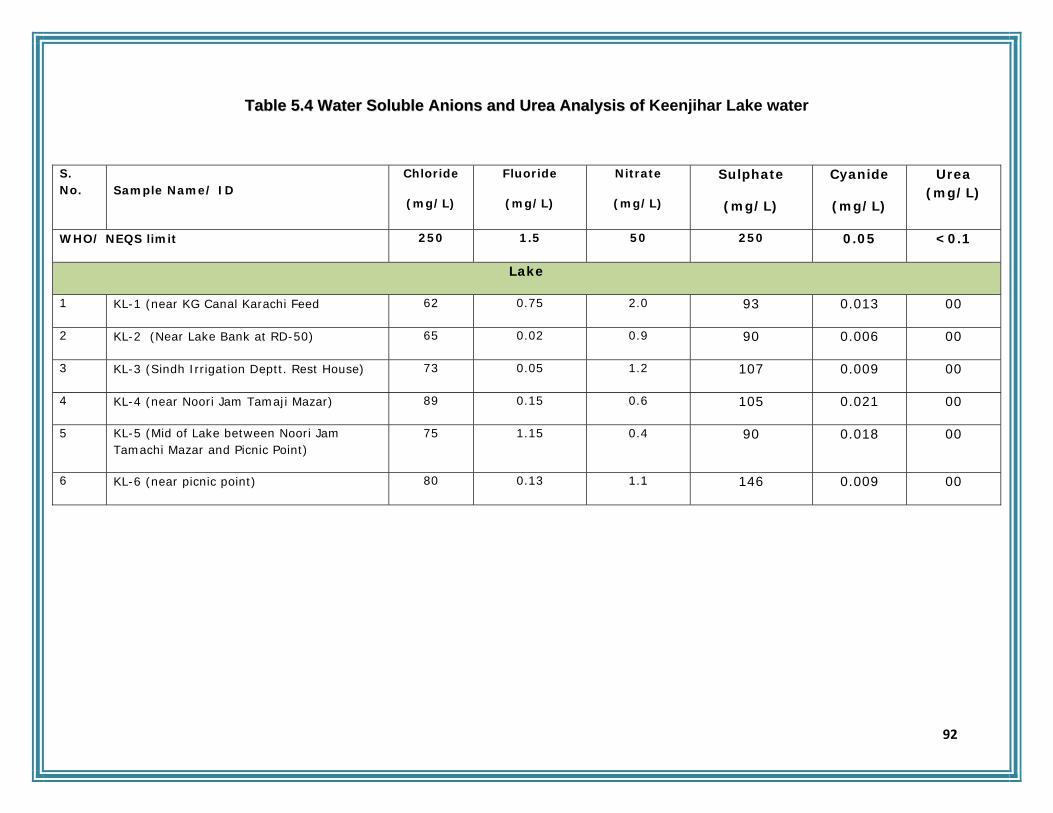
92
TTaabbllee 55..44 WWaatteerr SSoolluubbllee AAnniioonnss aanndd UUrreeaa AAnnaallyyssiiss ooff Keenjihar Lake water
S. No. Sample Name/ ID
Chloride
(mg/L)
Fluoride
(mg/L)
Nitrate
(mg/L)
Sulphate
(mg/L)
Cyanide
(mg/L)
Urea (mg/L)
WHO/ NEQS limit 250 1.5 50 250 0.05 <0.1
Lake
1 KL-1 (near KG Canal Karachi Feed 62 0.75 2.0 93 0.013 00
2 KL-2 (Near Lake Bank at RD-50) 65 0.02 0.9 90 0.006 00
3 KL-3 (Sindh Irrigation Deptt. Rest House) 73 0.05 1.2 107 0.009 00
4 KL-4 (near Noori Jam Tamaji Mazar) 89 0.15 0.6 105 0.021 00
5 KL-5 (Mid of Lake between Noori Jam Tamachi Mazar and Picnic Point)
75 1.15 0.4 90 0.018 00
6 KL-6 (near picnic point) 80 0.13 1.1 146 0.009 00

93
Table 5.5-A Trace & Toxic Element Analysis of Keenjihar Lake Water Samples
S. No Sample Name/ ID
Li
(ppb)
Be
(ppb)
Na
(ppm)
Mg
(ppm)
Al (ppb)
K
(ppm)
Ca
(ppm)
V (ppb)
Cr (ppb)
Mn (ppb)
Fe (ppb)
Co (ppb)
WHO/ NEQS limit - - 200 - 200 - - - 50 500 300 -
Lake
1 KL-1 (near KG Canal Karachi Feed
11.64 ND 44.12 10.13 151.6 3.25 8.62 2.45 6.05 6.42 159.6 0.207
2 KL-2 (Near Lake Bank at RD-50) 12.77 ND 49.27 11.34 87.4 3.56 9.11 2.28 1.52 4.11 210.3 0.252
3 KL-3 (Sindh Irrigation Deptt. Rest House)
11.51 ND 43.93 10.05 128.1 3.01 7.23 2.15 1.34 3.55 161.1 0.202
4 KL-4 (near Noori Jam Tamaji Mazar)
12.13 ND 37.97 8.8 93.6 2.40 8.07 1.43 7.46 3.70 155.7 0.136
5 KL-5 (Mid of Lake between Noori Jam Tamachi Mazar and Picnic Point)
13.14 ND 40.39 9.8 84.7 2.81 7.85 1.97 5.18 4.29 103.2 0.072
6 KL-6 (near picnic point) 12.26 ND 38.94 9.46 444.1 2.88 8.01 2.97 3.75 10.50 343.2 0.251

94
Table 5.5-B Trace & Toxic Element Analysis of Keenjihar Lake Water Samples
S. No Sample Name/ ID
Ni
(ppb)
Cu (ppb)
Zn (ppb)
As (ppb)
Se (ppb)
Ag (ppb)
Cd (ppb)
Pb (ppb)
Hg (ppb)
Bi (ppb)
Ba (ppb)
WHO/ NEQS limit 20 2000 5000 50 10 - 10 50 1 - 700
Lake
1 KL-1 (near KG Canal Karachi Feed 3.12 7.79 18.58 2.3 ND 0.19 1.32 0 0 0 67.24
2 KL-2 (Near Lake Bank at RD-50) 2.61 3.39 33.27 3.09 1.37 ND ND 0 0 0 22.41
3 KL-3 (Sindh Irrigation Deptt. Rest House)
3.65 7.99 36.62 2.27 1.33 0.23 ND 0 0 0 0
4 KL-4 (near Noori Jam Tamaji Mazar) 4.97 6.65 31.7 1.88 1.77 ND 1.13 0 0 0 35.8
5 KL-5 (Mid of Lake between Noori Jam Tamachi Mazar and Picnic Point)
6.72 7.23 43.49 3.27 ND ND 1.13 0 0 0 31.38
6 KL-6 (near picnic point) 6.86 3.94 51.97 1.32 ND ND ND 0 0 25.1 53.7
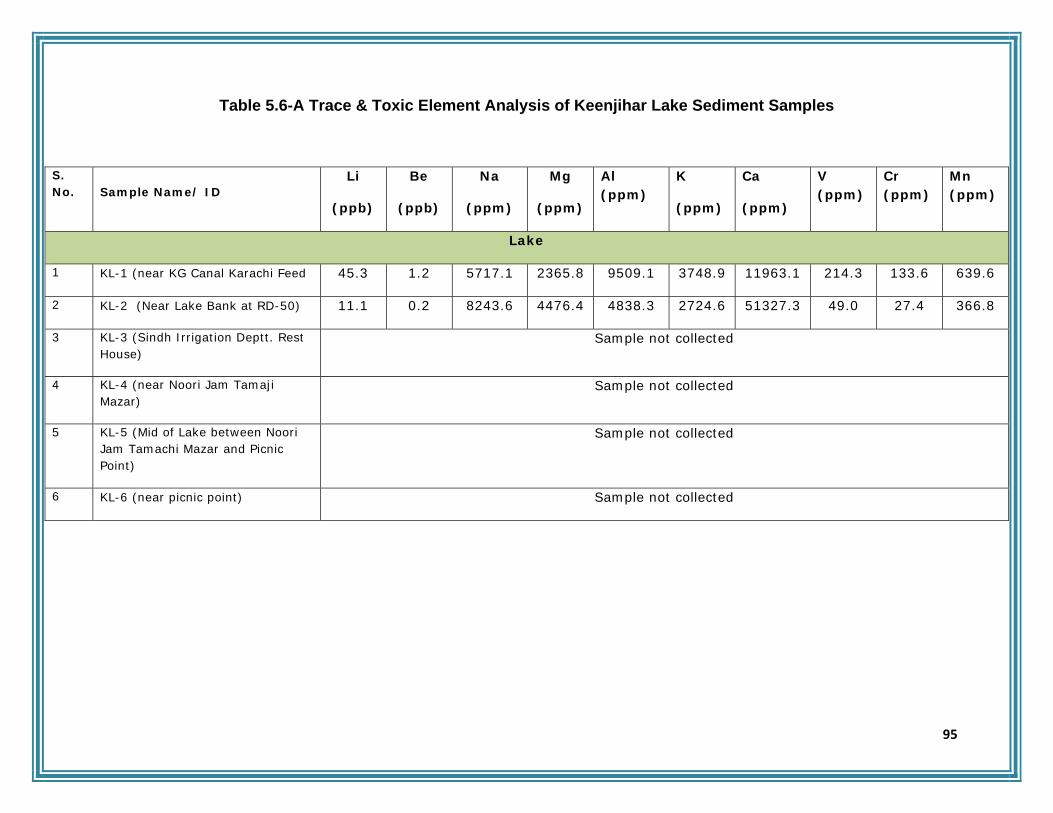
95
Table 5.6-A Trace & Toxic Element Analysis of Keenjihar Lake Sediment Samples
S. No. Sample Name/ ID
Li
(ppb)
Be
(ppb)
Na
(ppm)
Mg
(ppm)
Al (ppm)
K
(ppm)
Ca
(ppm)
V (ppm)
Cr (ppm)
Mn (ppm)
Lake
1 KL-1 (near KG Canal Karachi Feed 45.3 1.2 5717.1 2365.8 9509.1 3748.9 11963.1 214.3 133.6 639.6
2 KL-2 (Near Lake Bank at RD-50) 11.1 0.2 8243.6 4476.4 4838.3 2724.6 51327.3 49.0 27.4 366.8
3 KL-3 (Sindh Irrigation Deptt. Rest House)
Sample not collected
4 KL-4 (near Noori Jam Tamaji Mazar)
Sample not collected
5 KL-5 (Mid of Lake between Noori Jam Tamachi Mazar and Picnic Point)
Sample not collected
6 KL-6 (near picnic point) Sample not collected

96
Table 5.6-B Trace & Toxic Element Analysis of Keenjihar Lake Sediment Samples
S. No. Sample Name/ ID
Fe (ppm)
Co (ppm)
Ni (ppm)
Cu (ppm)
Zn (ppm)
As (ppm)
Se (ppm)
Ag (ppm)
Cd (ppm)
Pb (ppm)
Bi (ppm)
Hg (ppm)
Lake
1 KL-1 (near KG Canal Karachi Feed
47646.5
33.0 66.6 66.9 87.9 21.7 0 0.11 0 0 0 0
2 KL-2 (Near Lake Bank at RD-50)
5762.9
4.8 19.1 22.9 90.3 25.2 3.5 1.4 0 0 0 0
3 KL-3 (Sindh Irrigation Deptt. Rest House)
Sample not collected
4 KL-4 (near Noori Jam Tamaji Mazar)
Sample not collected
5 KL-5 (Mid of Lake between Noori Jam Tamachi Mazar and Picnic Point)
Sample not collected
6 KL-6 (near picnic point) Sample not collected

97
CHAPTER-6 GGIISS--BBAASSEEDD MMAAPPPPIINNGG ooff WWAATTEERR QQUUAALLIITTYY AANNDD
TTOOXXIICCIITTYY OOFF KKEEEENNJJIIHHAARR LLAAKKEE
98
6.1 Introduction
Traditional catchment-scale water quality
assessments are based on monitoring chemical and
biological indicators at selected sites to observe long-
term trends. Due to the spatial distribution of water
quality parameters, Grayson et al. (1997) and Eyre &
Pepperell (1999) advocated the use of short-duration,
spatially extensive water quality sampling during steady-
state conditions. This sampling methodology provides an
instantaneous view of the spatial variation of water
quality under stable, low flow conditions.
Remote sensing and GIS are effective tools for
water quality mapping and land cover mapping essential
for monitoring, modeling, and environmental change
detection. The GIS is potential tool for facilitating the
generation and use of thematic information, has been
applied for identification of groundwater quality
measurement for domestic and irrigation uses. GIS is
one of the best and effective systems for mass
assessment. In real scenario, water quality problems of a
lake cannot be assessed by taking a few water samples
as lakes are open systems and are integrated
components of the watershed. But through application of
the advance techniques like GIS, we can resolve this
problem and obtain a real picture of Lake water quality
assessment. (Aguilar-Manjarrez et al, 1995; Ganapathy
et al, 2004)
In this study, GIS based spatial analysis was
carried out for water quality parameters of Keenjihar Lake
water.
6.2 GIS Tools for Mapping of Lake Water Quality
In the present study, following GIS and image
processing tools were used for mapping spatial
distribution of water quality parameters and toxic
elements;
1. ArcGIS Map 9.0 (Spatial Analysis Tool)
2. Envi 4.0 (an Image Processing Software)
3. GPS Recever (A Tool for Coordinates
Measurement)

99
6.3 Results and Discussion
The spatial analysis was carried out by Krigging
Method implemented in ArcGIS. The subsequent figures
(Figure 6.1) showed the spatial distribution of water
quality parameters including pH, Turbidity, TDS, DO,
Salinity, Conductivity, Hardness, Cl-1, SO4-2 and NO3
-1.
These figure showed that pH varied from 7.61 to 8.47,
Turbidity from 0.114 to 61.96 NTU, TDS from 327.7 to
523.61 mg/l), DO from 10.245 to 12.518 mg/l, Salinity
from 0.497 to 0.599 mg/l, Conductivity from 546.28 to
870.348 uS/cm, Hardness from 150 to 239.788 mg/l,
NO3-1 from 0.405 to 2.4 mg/l, SO4
-2 from 94 to 157.195
mg/l and Cl-1 from 65.07 to 88.8748 mg/l in the water
samples. Li, 11.66 ppb, Fe from 150.423.497 ppb, Co
from 0.11 to 0.421 ppb, Cr from 1.527 to 7.429 ppb, Na
from 37.9 to 82.62 ppb, K from 2.403 to 4.735 ppb, Mg
8.81 to 17.31 ppm, Ca from 7.85 to 17.457 ppm and Ba
from 22.50 to 80 ppb.
6.4 References
1. Eyre, B. D. & Pepperell, P. 1999 A spatially intensive approach to water quality monitoring in the Rous River catchment, NSW, Australia. J. Environ. Mngmnt. 56, 91–118.
2. Grayson, R. B., Gippel, C. J., Finlayson, B. L. &
Hart, B. T. 1997 Catchment-wide impacts on water
quality: the use of ‘snapshot’ sampling during
stable flows. J. Hydrol. 199, 121–134.
3. Aguilar-Manjarrez J, Ross LG (1995).
geographical information system (GIS)
Environmental models for aquaculture
development in Sinaloa State, Mexico.
Aquacult. Int., 3: 103-115.
4. Ganapathy C, Ernest A (2004). Water Quality
Assessment Using Web Based GIS and
Distributed Database Management Systems.
Environ. Inform. Arch., 2: 938–945

100
6.1 Figures showing
Spatial Distribution of Lake Water Quality Parameters
(Physical & Toxic Elements)

101

102

103
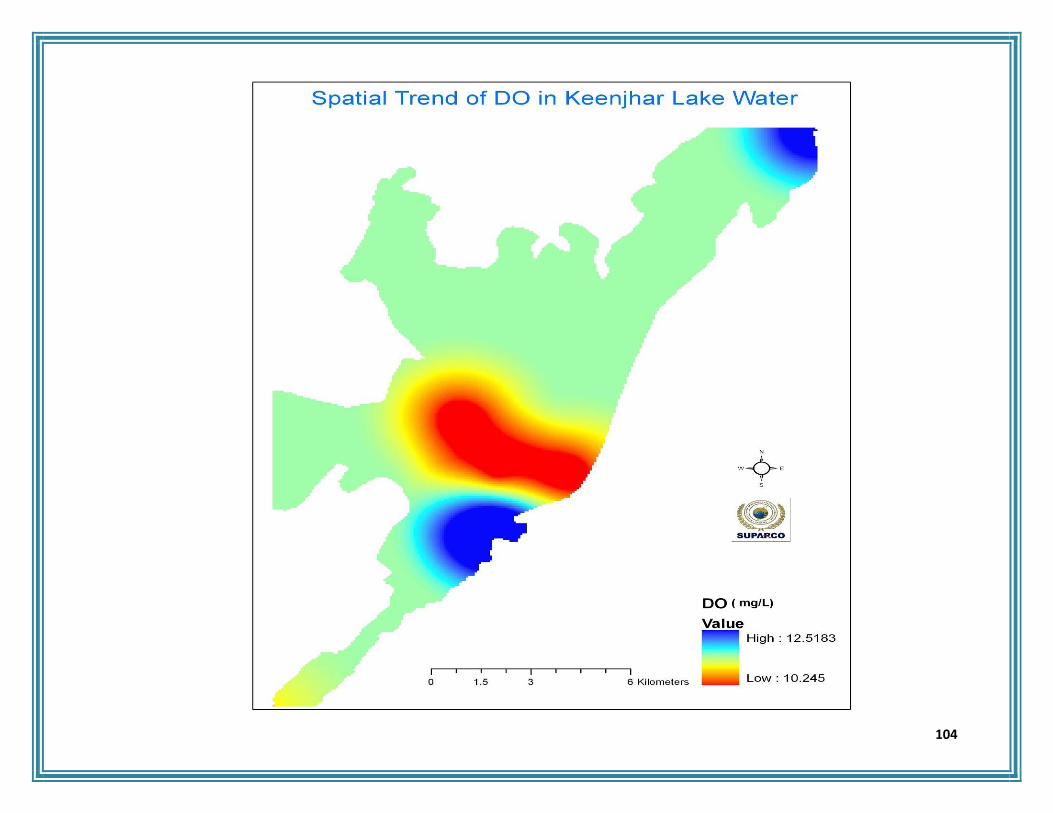
104

105

106
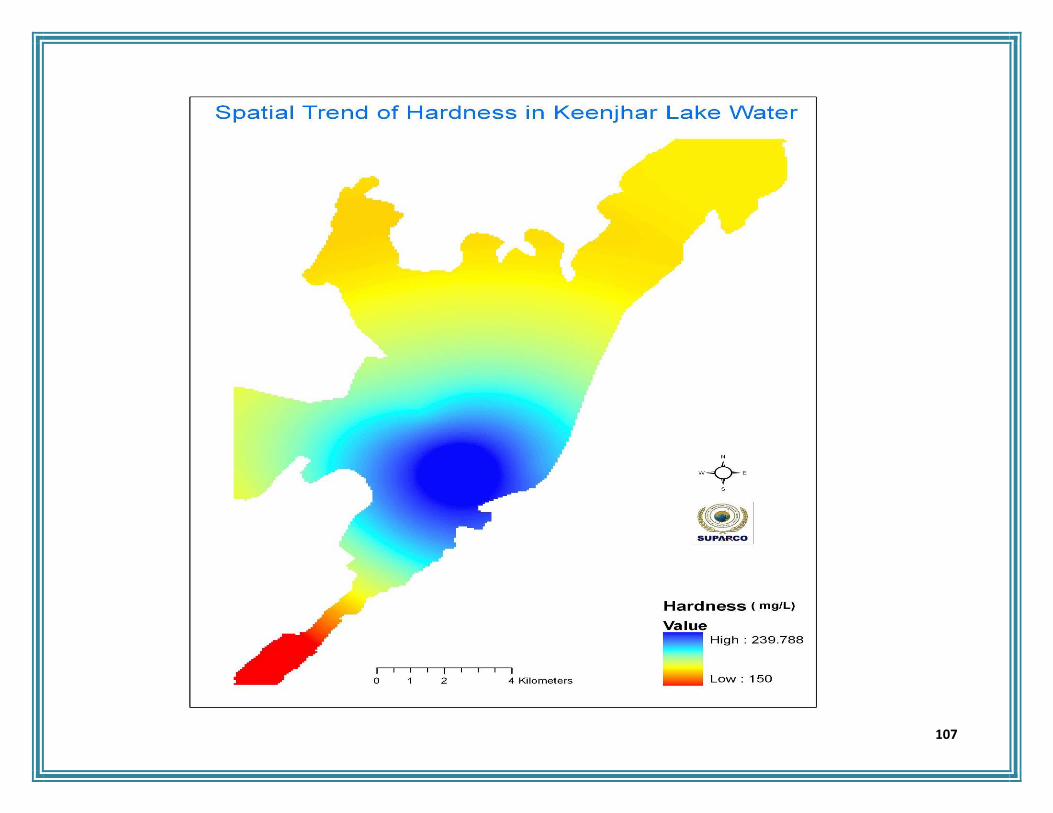
107

108
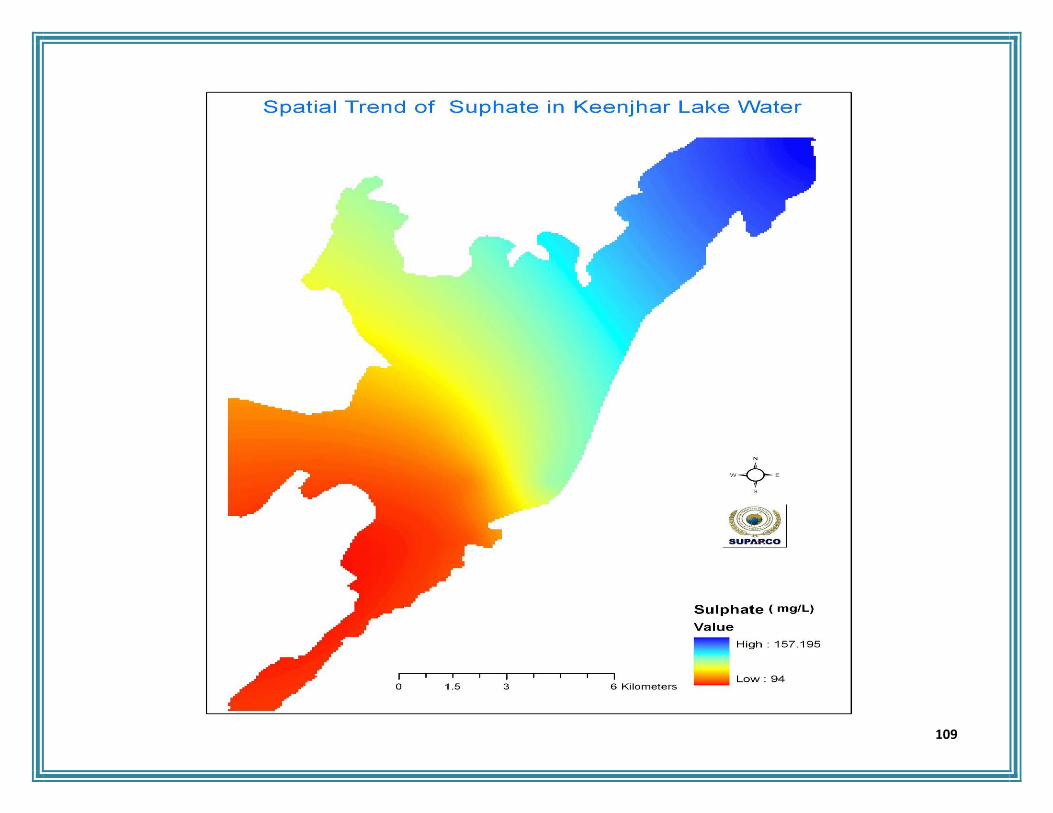
109

110
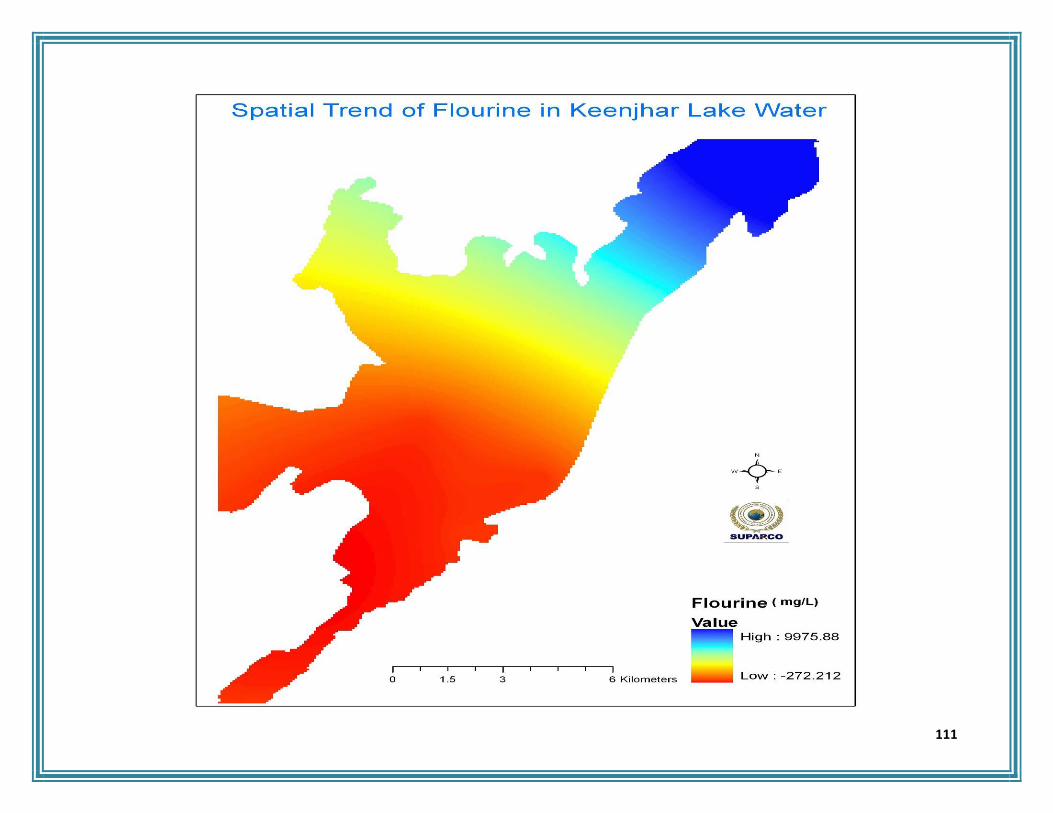
111

112
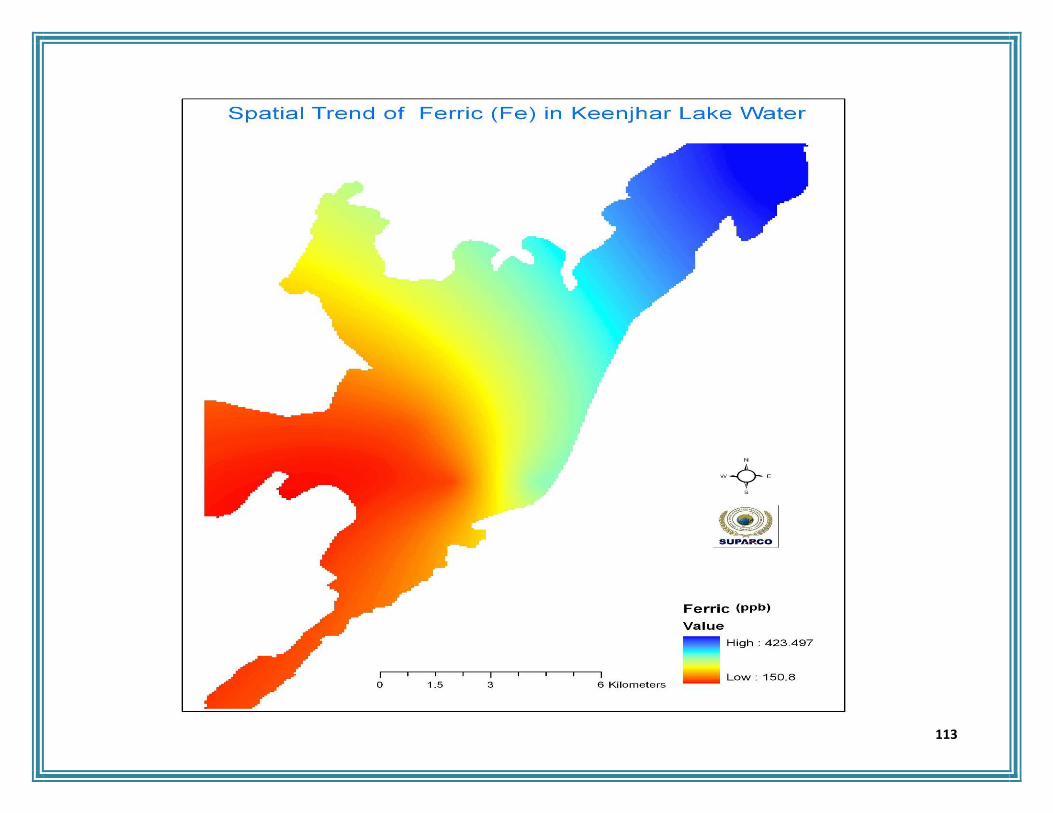
113

114

115
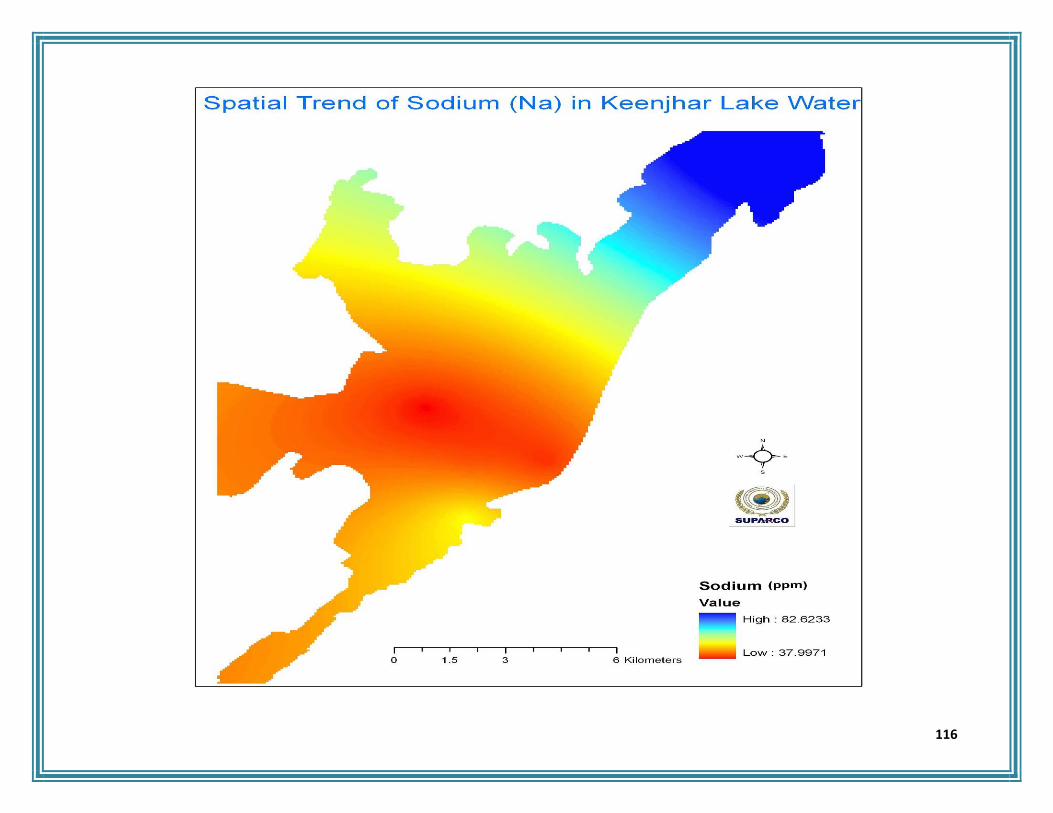
116
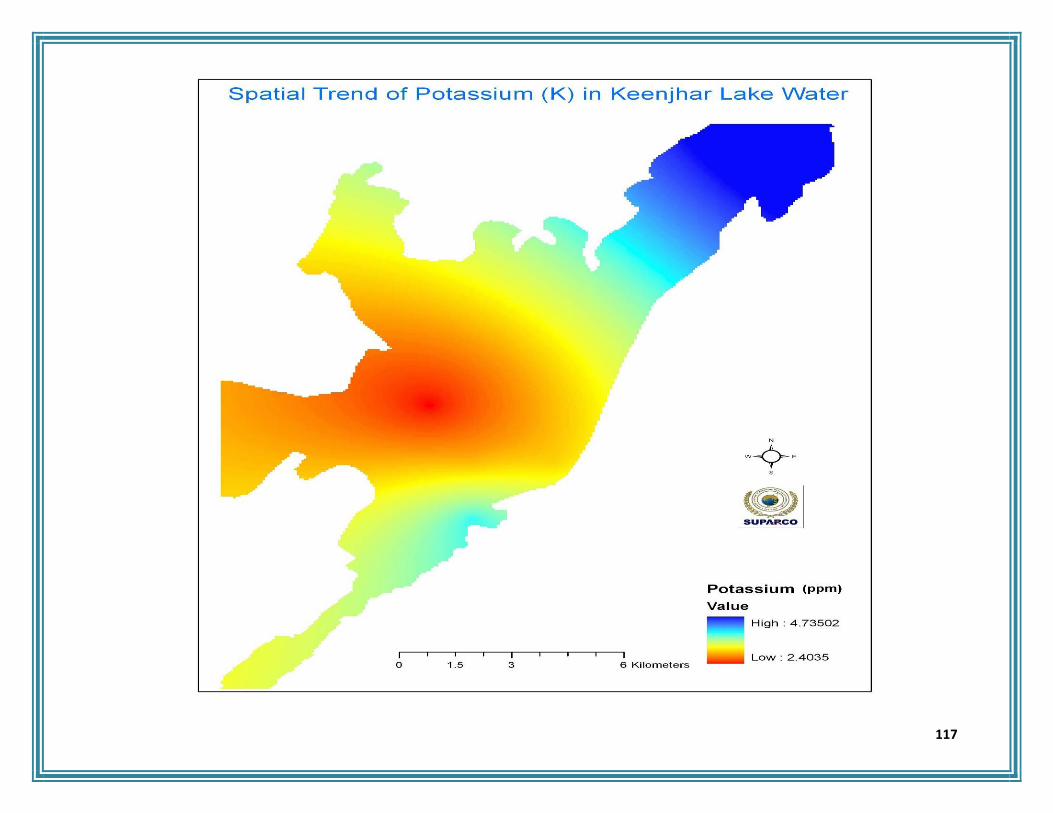
117

118

119
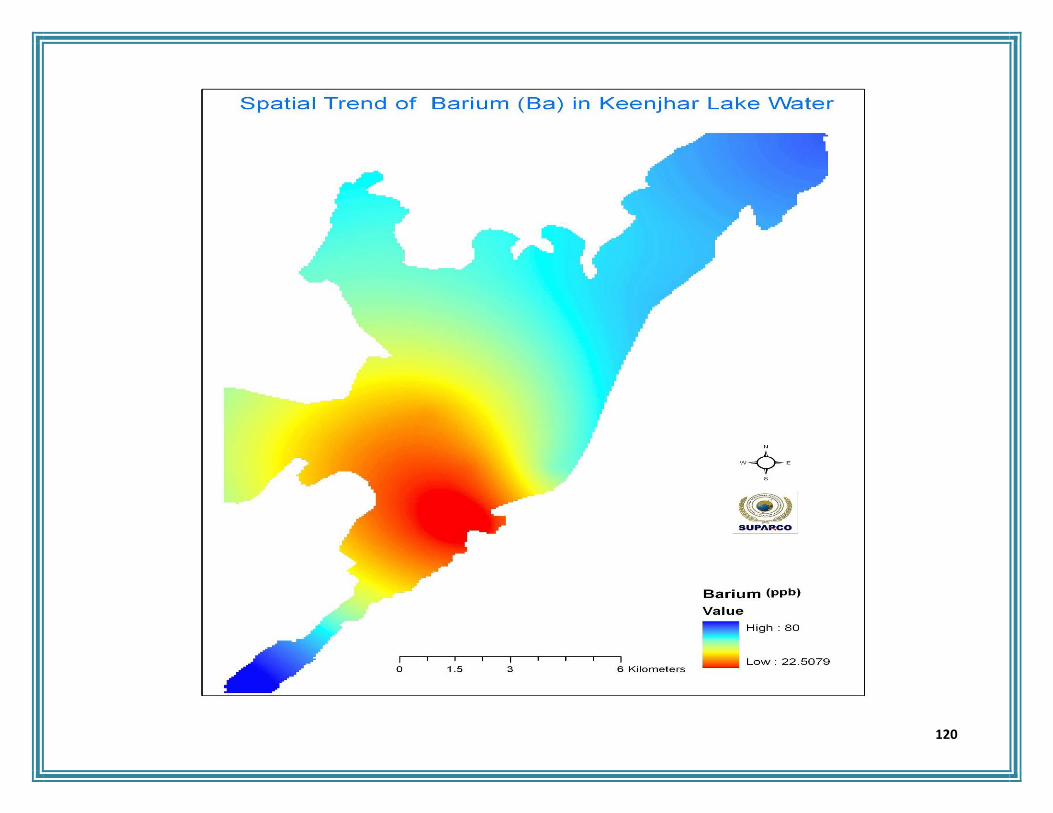
120
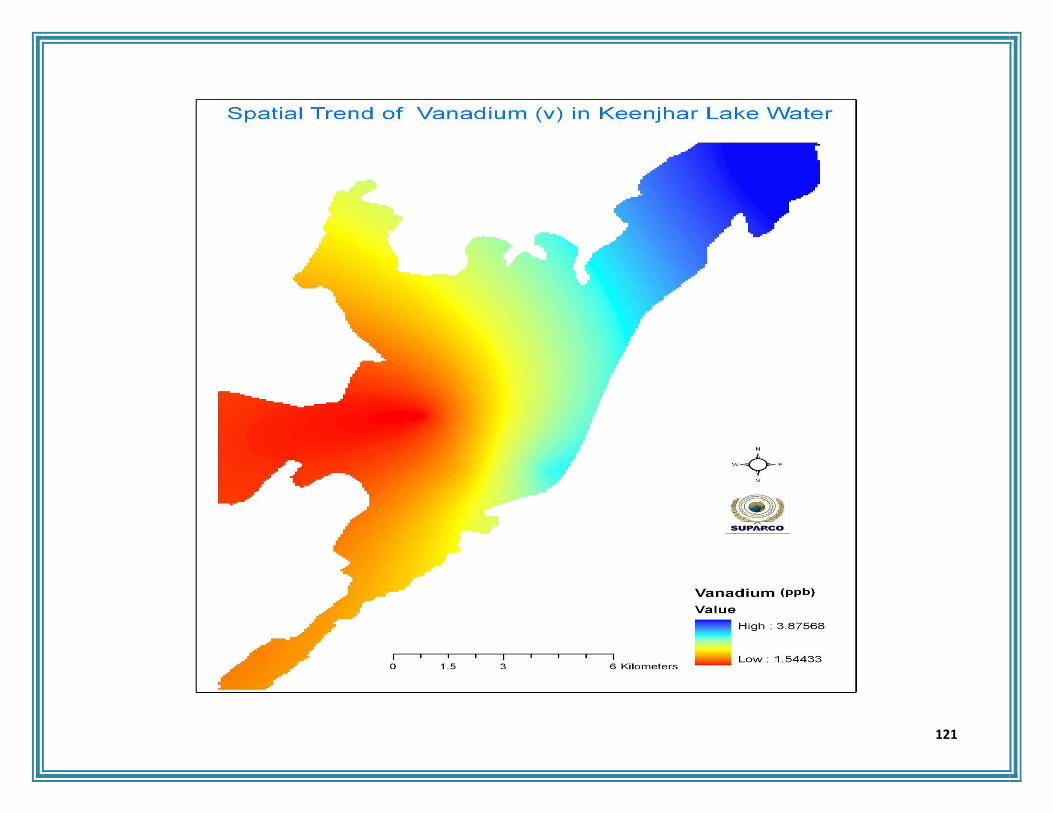
121

122
123
CHAPTER-7 CONCLUSION AND RECOMMENDATIONS
124
7.1 Conclusion
The analysis results of lake feeding sources (a) KB
Canal and (b) Haroolo Drain indicate that these are the two
major sources of pollution accumulating in the lake and are
becoming threat to both lake aquatic life and human
population relying on the lake water for drinking purposes.
The analysis reports indicate that cyanide traces were
detected in the all water samples but the significant levels
were found in samples collected at RD-16-1 and RD16-2 near
Toll Plaza near Hyderabad on National Highway. Pb and Cr
were detected in each of the water samples of canal water.
Significant concentration of Pb (62.79 ppb) was found in the
water sample collected at site of Rd-50 near Head Regulator.
Significant concentrations of toxic metals such as Al, Hg, Pb,
Be, Ni, As, Ag and Se were detected in sediment samples.
The levels of Conductivity, TDS, Hardness Cl-1, SO4-2, NO3
-1
and Fecal Coliform were found higher in sample of RD-36-3
where Kotri industrial area effluent and WAPDA Colony waste
flows into the canal water. Therefore, it is concluded that
major source of water pollution is effluent discharged into the
canal.
The levels of Conductivity, TDS, Salinity, Temperature
Hardness Cl-1, SO4-2, were found higher in sample of site
HD-1 near Haroolo Bridge. This indicates that water with high
conductivity and TDS flows into the section of Lower Haroolo-
1 and Lower Haroolo-2 and mixed with lake water (due to
back flow into affected section of Haroolo drain). Higher
levels of DO, E.Coli and Fecal Coliform were observed in the
samples of Lower Haroolo-1 and (iii) Lower Haroolo-2 sites.
Similarly, significant amount of Urea (70 mg/l) was also
detected in the WWF-P sample collected on 17-04-2012
which indicates that this Urea contains water flows into the
affected section and imposed threat to the aquatic life in this
portion. The samples of site Lower Haroolo-2 showed the
presence of urea in the water. The trace level of the toxic
metals including Al, As, Cr, Ni and Se were detected in each
of the water sample.
“The commulative effect of instant increased
demand of DO (usualy in middle of the night when
plant photosynthesis reverses and competes with
the fish for oxygen), toxic metals (Pb, Se, Ni and
As) and Urea due to flow of rain from upper side
of the drain into affteced section close to the Lake
125
put the threat to the aquatic life and caused the
recent killing”
The results indicated that water quality parameters
(Physical) in each of the water samples were within safe
limits of Pak NEQS for drinking water. The higher DO was
measured at site of Lake exit near KG Canal Regulator. This
indicate the presence of organic species and if this increased
to much higher level then similar incident may happen in this
location of the lake. Moreover, E. Coli and Fecal coliform
bacteria were also detected in each of water sample which
make lake unfit to use for dinking purposes without treating.
The toxic element such as As, Ni, Cr, Al were also detected in
the sediment samples of Lake and traces amount of cyanide
was also detected in the lake water samples. Although,
cyanide is in trace concentrations but it make fatal effects if
water is frequently used by the livings and accumulative
effect may results in killings of aquatic life as well as the
human and animals using this water for drinking purposes.
Although, cyanide is in trace concentrations but it
make fatal effects if water is frequently used by the livings
and accumulative effect may results in killings of aquatic life
as well as the human and animals using this water for
drinking purposes.
7.2 Recommendations
In light of the results discussed above, it is recommended to;
• A strict and prompt action by the concerned authorities
(including Irrigation Department , KSWB and Sindh
EPA) to block the discharge of effluent of Kotri
Industrial Area which is major source toxic elements
into KB canal.
• Develop an action plan to prevent dumping of waste
into the main channel of Haroolo Drain or at least put
check to avid the mixing of rain water flowing through
Haroolo drain water to Lower Haroolo drain section
where lake water flow back into drain section
especially during heavy rains in the localities to avoid
future incident of massive killing of aquatic life in the
Lower Haroolo section.
• The flow of KB canal to lake is to be regulated in light
of pollution load in lake water.

126
• Detailed analysis of Surface and In-depth (vertical)
water of lake water using GIS based techniques.
• Device a GIS based monitoring mechanism of lake
feeding sources (a) KB Feeder Canal and (b) Haroolo
drain and Lake itself is to be carried out by jointly all
stakeholders (Sindh EPA, Irrigation Department,
Karachi Water & Sewerage Board) and external expert
agency on monthly basis.
• Early completion of the combined effluent treatment
plant at Kotri

127
Annexure-I (News Paper Articles)

128
Toxic drain kills fish, pollutes Keenjhar Lake By Faiza Ilyas | April 19, 2012 Daily DAWN Karachi
KARACHI, April 18: The Keenjhar Lake the main source of water supply to Karachi and parts of Thatta district has been receiving highly contaminated water through a storm drain for the past three days, it emerged on Wednesday. During a visit to Jhimpir, a town in Thatta district located about 70 kilometers from Karachi, it was found that the government had not yet taken any measure to address the problem that is contaminating the country`s largest freshwater lake, which has been declared a Ramsar site and a wildlife sanctuary. Dead fish, snails and freshwater mussel shells were seen floating on the dark-colored water flowing in the drain emitting foul smell. According to a community representative, at least four cows, an equal number of jackals and a turtle have died after drinking the water in recent days. Besides, nine cases of diarrhoea have been reported at government-run health facilities in the area. Villagers said that only a few days back, the locality had received rain and the lake water got contaminated apparently when the drain carrying effluent overflowed. `The drain water had always been crystal clear. We used to bring children here for camping so that they could actually see the habitat of fish and other living organisms in the
water,` said Jehangir Durrani, natural resource manager of the World Wide Fund for Nature (WWF) at the lake, while speaking to Dawn. A significant number of fishes, some weighing as much as seven kilos, died from contamination, said Mr Durrani, adding that poor fishermen took them away and sold them in market. `Initially they didn`t know what was happening. But as soon as villagers realized the gravity of the situation, the community was warned through announcements on loudspeakers in area mosques against drinking water from the lake, he explained. The manager said the lake was a rich habitat for 33 fish species. Of them, he added, tilapia, snake head, rohu, catfish and grass carp fish were spotted dead in the two-kilometre-long drain that falls in the lake. Expressing concern over the large-scale pollution, he said the death of the species that live near the bed gave indications that the drain contained highly toxic pollutants. `It will not be an easy task to get rid of the contaminants that might have settled in the earth. While contamination of lake water with industrial effluent was a longstanding problem, it was the first time that this specific drain in Jhimpir had become contaminated, the villagers told Dawn. `All the storm water drains in the area fall into the lake. Effluent from the Kotri and Nooriabad industrial areas also enter the lake through drains in the monsoon when they overflow,` said Abdul Hameed Palari, vice chairman of the Keenjhar Conservation Network.

129
`The specific drain carries wastes from the unit that started working on the wind turbines project a few months ago and it uses some chemicals,` said Mr Palari, `but there is a need for a thorough investigation. Water samples Speaking to Dawn, Dr Shafi Mohammad Wassan, district surveillance officer of the World Health Organization, said preliminary tests of water samples showed that the water was not fit for human consumption, but a detailed chemical analysis was required to find the exact nature of contamination. However, managing director of the Karachi Water and Sewerage Board Misbahuddin Farid said that samples taken from the Gujjo head work and Dhabeji pumping station had shown no sign of contamination. The results of other samples taken from the affected drain have not been received yet,` he said. He added: `The Keenjhar Lake is under the irrigation department control and not KWSB`s. Yet we are consulting with the relevant departments on the matter. `Better inflow to reduce toxicity` WWF representatives at the site recommended immediate release of adequate quantities of water into the lake to reduce the level of toxicity amid fears that the toxic elements could affect the entire lake if the area received downpour in the next few days as being forecast. A villager said: `It`s high time that the government look into the issue of lake contamination and address it on a priority basis. Almost everyone depending on the lake for drinking water is suffering from water-borne diseases and the area lacks quality healthcare services for the poor.
Sindh Chief Minister Qaim Ali Shah, meanwhile, took notice of the reports about the release of `poisonous` water into the Keenjhar Lake. According to a press note, he directed the officials concerned to look into the issue.

130
Sanctuary of life turns into mire of death April 19, 2012 by Iqbal Khwaja Daily DAWN Karachi
THATTA, April 18: Municipal and industrial wastewater, agricultural runoff and windmill installation are fast adding to pollution level in Keenjhar Lake and if authorities concerned fail to take timely steps, the lake water will harm ecology and cause an outbreak of diseases among people.
The lake is a major source of drinking water for Karachi and part of Thatta district, a picnic point and source of livelihood for thousands of locals. The issue came to limelight when activists of Pakistan Fisherfolk Forum, Jeay Sindh Qaumi Mahaz and a number of other political parties reacted against massive loss of aquatic creatures of the lake, fauna and flora and livestock after consuming the lake’s polluted water.
They took out a procession and observed a strike in Jhampir on Tuesday against the lake pollution.
The protest prompted the officials of Environmental Protection Agency, water expert Dr Ahsan Siddiqui, director of Fisheries Inland Ghulam Mujtaba Wadhar and Dr Shafi Mohammad Wassan, surveillance officer disease early warning system to visit the lake, the town and the industries near the lake, which were a major source of its pollution, collected samples of water and fish meat on Wednesday.
Representatives of fisher communities Hashim Solangi, Ali Ahmed and Hanif Palari believe that effluents from Nooriabad Industrial Zone, Hyderabad and Phulelli Industrial Area that make their way into the lake through KB Feeder upper are mainly responsible for rising level of pollution in the lake. Domestic wastewater from nearly villages is also released into the lake, they said.
The water contamination was causing health hazards among over 70,000 people living along the lake’s banks who consumed its water and used it for growing vegetables. A majority of this population suffered from various waterborne diseases, they said.
Municipal and industrial wastewater and agricultural runoff relased into the lake through drains were the main contributors to increasing pollution of wetlands, including the legendary lake, the biggest manmade freshwater lake in Asia (length 32 km and width 11km), a Ramsar site and a wildlife sanctuary, said Nasir Panhwar, Programme Coordinator of WWF Pakistan.
He told Dawn the Sindh government had declared Keenjhar among other sites as a protected wetland under the Ramsar Convention.
Sites were selected under the convention on the basis of ecosystem, health and a variety of other indicators including its environmental services, he said.
However, he said, the sites notified as Ramsar did not hold this designation in perpetuity. Rather the classification of a site was retained only on the basis of its sustainability and ecological health. If a wetland was deemed environmentally unhealthy then it would be stripped of its Ramsar designation and would require de-notification, said Mr Panhwar.
The loss of Ramsar designation should be seen as a sign of mismanagement of a particular wetland and should also be viewed as a question mark on the capacity of the state to maintain and protect valuable wetlands, he said.
He held a number of industries, mainly a windmill installation company in Jhampir, responsible for polluting the lake water.
He and other experts and stakeholders advise the district health department to adopt adequate precautionary measures against a

131
possible outbreak of gastroenteritis, skin and eye diseases among the population of some 62 small and large villages, including Sonehri, Chillya, Gandri, Chakro, Moldi, Doulatpur, Kambo, Hillaya that fall under four union councils of Thatta district.
Experts said that turbidity, biological oxygen demand and chemical oxygen demand were high along with toxic pollutants such as lead and cadmium in the lake water collected near the KB Feeder. Sufficient organic load was observed which caused depletion of dissolved oxygen.
According to Rapid Assessment Report conducted by fisheries department, the quantum of bacterial and toxic pollution in the lake was 2.3 against the WHO standards of 0.75, 210 per cent higher than normal, they said.
The acidic carbonates were 800 mg as against 500 mg, they said.
Chief Executive Industrial Development Water Technology and a member of EPA Dr Ahsan Siddiqui said the main reason behind rapid pollution of the lake was use of explosives by some multinational windmill companies and use of dynamite and urea in the process.
Dr Ahsan said that the lake was a protective sanctuary and as per rules any excavation and deep digging within its radius of three km was strictly prohibited.
Area people said the degree of damage caused by increasing pollution had never been documented. Its intensity was felt during monsoon when industrial waste killed tons of fish, destroyed birds’ habitats and led to infections among local population, they said.
They complained that there was no adequate mechanism for looking after quality of water and called for the establishment of an authority comprising concerned departments to address the issue.
‘Keenjhar Lake inflow not increased yet’ by Faiza Ilyas | April 20, 2012 Daily DAWN Karachi
KARACHI, April 19: While the findings of an examination of water samples taken on a request of the Sindh Environment Protection Agency from a ‘polluting drain’ feeding the Keenjhar Lake are expected to be out by Friday evening, a senior official of the irrigation department said that an increase in the lake inflow that some experts recommended to reduce toxicity could not be done due to serious water shortage.
Two government departments had also collected water samples for examination to check the reported contamination, but their results were pending. The findings may help in determining the source of contamination and in evolving a strategy to prevent further deaths of animals and an outbreak of waterborne diseases.
The Keenjhar Lake has been receiving highly polluted water from a storm drain in Jhimpir, a town located about 70 kilometers from Karachi and parts of Thatta district, for the past few days. This is the first time the drain in Jhimpir has turned contaminated, causing the death of fish and around a dozen animals that drank its water.
It is worth noting here that the lake — the main source of water supply to Karachi and parts of Thatta — is a protected site under an international convention and provincial government rules.
Speaking to Dawn, Kotri Barrage chief engineer Mohammad Mithal Abbasi, however, denied the drain feeding the lake had received highly contaminated water and was polluting the lake.

132
“I have visited the spot today. The drain water is not toxic, though it can be called slightly tainted on account of the recent rains,” he said.
He was of the opinion that the lake’s contamination from the drain was not possible, because the former was located in depression while the lake is situated at a higher ground.
However, he couldn’t justify why the livestock, fish and other animals died if the drain’s water was not toxic.
Asked whether his department tested the drain’s water, he replied in the negative. But he insisted that the samples taken from the Keenjhar Lake had been found fit for human consumption.
Regarding the release of increased water into the lake to reduce the level of contamination, he said currently there was serious water shortage.
“As soon as the situation will improve over the next four to five days, more water will be supplied to the lake,” he said.
SEPA
On the request of the Sindh Environment Protection Agency (Sepa), an expert of analytical chemistry has been conducting analysis of the samples collected from the drain.
“The test samples include that of fish, water and soil,” said the expert, Dr Ahsan Siddiqui.
“I was shocked to see the dead turtle oozing out blood as soon it was taken out of the water. The skin of other dead animals, too, was badly damaged,” he said, “but one must wait for the results, which will be available by Friday evening.”
“Such a strong impact on animal bodies might be the result of high contents of urea or mercury in the drain water while high concentration of inorganic compounds such as lead and arsenic may also be present,” said the expert, who is also a visiting professor at local and foreign varsities.
Though the exact source of contamination could only be known once test results were available, Dr Siddiqui said it was possible that the wind energy companies used some chemicals for blasting that got mixed with some metals and entered the drain during the recent rains.
“Pollution can be effectively managed by the release of adequate quantity of water,” he said, adding that downpour in the area for the next few days would benefit.
In reply to Dawn queries, Sindh Environment Protection Agency Director General Rafiuddin said that the federally-run alternative energy development board was solely responsible for allowing companies to install wind turbines in Jhimpir. “Sepa has nothing to do with the project. However, we have sent teams to the spot and are coordinating with relevant departments. The results of the samples will help us in chalking out a line of action,” he said.
Windmills project
When contacted, the manager of a wind energy project (under Fauji Fertiliser) located near the affected drain, retired brigadier Tariq Aizaz, rejected the perception that chemicals were used in the so-called blasting technique to install windmills.“There is no need to carry out a blast to install windmills. The digging process is carried out with the help of machinery. It’s unfortunate that people point fingers at an environment-friendly project without acquiring its knowledge,” he said.

133
He hinted at the contamination of dolomite, a carbonate material that was extensively taken out from the area, in the drain’s water, but said it would be inappropriate to blame anyone without having carried out proper tests of the water.
Governor seeks report
Meanwhile, Sindh Governor Dr Ishratul Ibad directed the environment protection agency, irrigation department and the Karachi Water and Sewerage Board to take urgent measures to keep the lake safe from hazardous effluents, adds APP.
He also sought an urgent report in this connection from the KWSB managing director Misbahuddin Farid.
In his report, the KWSB chief stated that the hazardous effluent was coming through two natural storm drains from the industrial area of Nooriabad.
However, he said, the Keenjhar Lake was under the administrative control of the irrigation department.
The governor directed the irrigation department to undertake every step to keep the lake water safe for marine life.
Another source of Keenjhar Lake toxicity exposed By Faiza Ilyas | 4/22/2012 Daily DAWN Karachi KARACHI, April 21: High concentration of lead has been found in one of the water samples taken for analysis from the Keenjhar Lake and its surrounding areas after a drain feeding the lake turned toxic following a rain spell, preliminary results of the test show.
According to sources, the high level of lead in a section of the lake is due to oil contaminants being released by an oil depot and has nothing to do with the recent incident of toxicity in the drain. Speaking to Dawn, Dr Mohammad Ahsan Siddiqui, a senior expert on water analysis carrying out the tests on the request of the Sindh Environment Protection Agency (Sepa), said that water samples were taken from a windmill project site, the mouth of the drain and a portion of the lake from where water was supplied to the Jhimpir town. `Initially, we have determined the levels of arsenic, chromium, lead and mercury compounds at these three points as they existed on April 18 when the incident was reported,` he said, adding that a detailed analysis was under way and complete findings would be available by next week. According to Dr Siddiqui, chromium, lead and mercury levels at the windmill project site was found to be at 43.52ppb (parts per billion), 13.89ppb and 5.32ppb respectively. Levels of chromium and lead were found to be at 1.88ppb and 9.46ppb respectively at the mouth of the drain. The level of lead in a section of the lake located about one and a half kilometre away from the drain was found to be at 333.33ppb. No traces of mercury were detected at both these sites whereas samples taken from the letter site didn`t show any trace of mercury. The World Health Organisation`s recom-mended value for these compounds for drinking water is: lead (10ppb), chromium (50ppb) and mercury (1ppb). `As one can see, the values are abnormal if compared with the WHO`s standards. However, a technically sound analysis of the situation could only be made with the help of complete results,` Dr Siddiqui said.
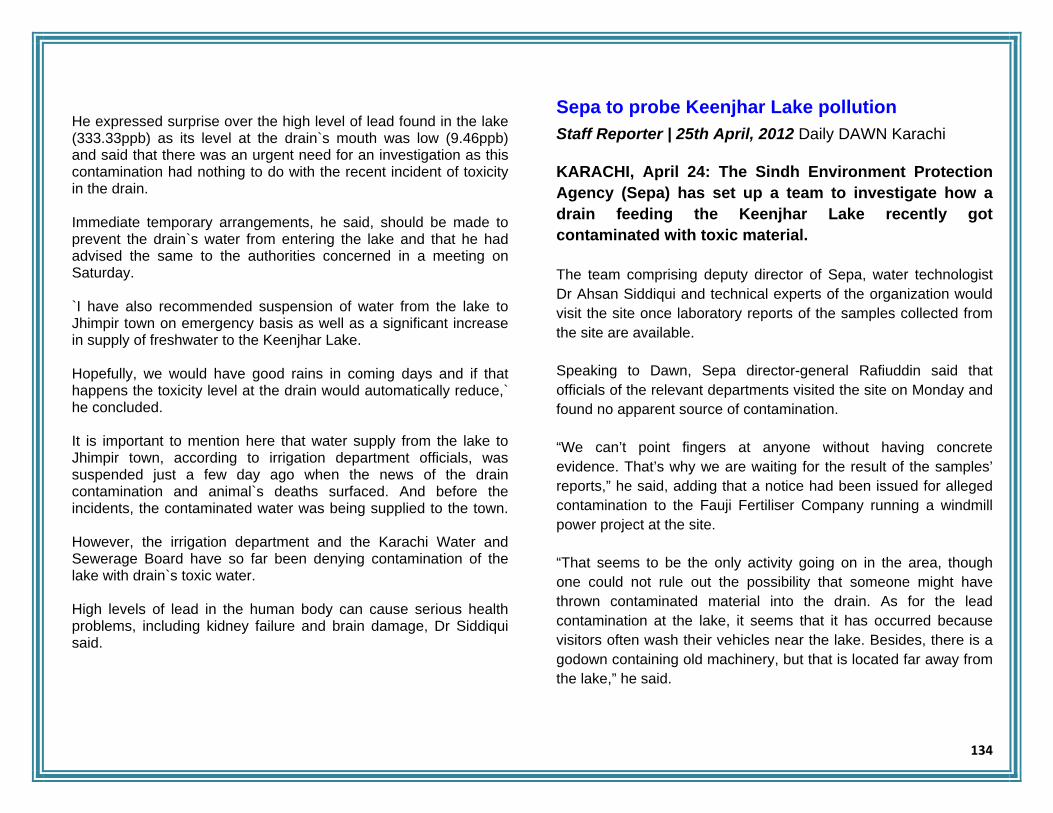
134
He expressed surprise over the high level of lead found in the lake (333.33ppb) as its level at the drain`s mouth was low (9.46ppb) and said that there was an urgent need for an investigation as this contamination had nothing to do with the recent incident of toxicity in the drain. Immediate temporary arrangements, he said, should be made to prevent the drain`s water from entering the lake and that he had advised the same to the authorities concerned in a meeting on Saturday. `I have also recommended suspension of water from the lake to Jhimpir town on emergency basis as well as a significant increase in supply of freshwater to the Keenjhar Lake. Hopefully, we would have good rains in coming days and if that happens the toxicity level at the drain would automatically reduce,` he concluded. It is important to mention here that water supply from the lake to Jhimpir town, according to irrigation department officials, was suspended just a few day ago when the news of the drain contamination and animal`s deaths surfaced. And before the incidents, the contaminated water was being supplied to the town. However, the irrigation department and the Karachi Water and Sewerage Board have so far been denying contamination of the lake with drain`s toxic water. High levels of lead in the human body can cause serious health problems, including kidney failure and brain damage, Dr Siddiqui said.
Sepa to probe Keenjhar Lake pollution Staff Reporter | 25th April, 2012 Daily DAWN Karachi KARACHI, April 24: The Sindh Environment Protection Agency (Sepa) has set up a team to investigate how a drain feeding the Keenjhar Lake recently got contaminated with toxic material. The team comprising deputy director of Sepa, water technologist Dr Ahsan Siddiqui and technical experts of the organization would visit the site once laboratory reports of the samples collected from the site are available.
Speaking to Dawn, Sepa director-general Rafiuddin said that officials of the relevant departments visited the site on Monday and found no apparent source of contamination.
“We can’t point fingers at anyone without having concrete evidence. That’s why we are waiting for the result of the samples’ reports,” he said, adding that a notice had been issued for alleged contamination to the Fauji Fertiliser Company running a windmill power project at the site.
“That seems to be the only activity going on in the area, though one could not rule out the possibility that someone might have thrown contaminated material into the drain. As for the lead contamination at the lake, it seems that it has occurred because visitors often wash their vehicles near the lake. Besides, there is a godown containing old machinery, but that is located far away from the lake,” he said.
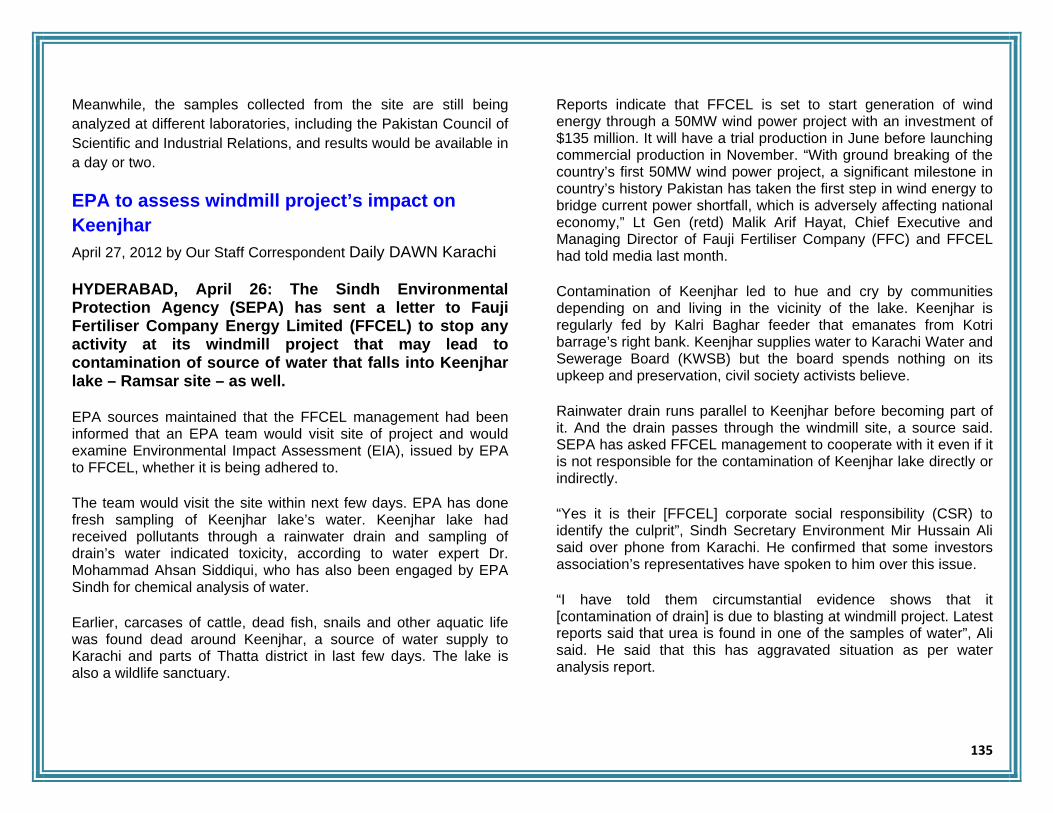
135
Meanwhile, the samples collected from the site are still being analyzed at different laboratories, including the Pakistan Council of Scientific and Industrial Relations, and results would be available in a day or two.
EPA to assess windmill project’s impact on Keenjhar April 27, 2012 by Our Staff Correspondent Daily DAWN Karachi
HYDERABAD, April 26: The Sindh Environmental Protection Agency (SEPA) has sent a letter to Fauji Fertiliser Company Energy Limited (FFCEL) to stop any activity at its windmill project that may lead to contamination of source of water that falls into Keenjhar lake – Ramsar site – as well.
EPA sources maintained that the FFCEL management had been informed that an EPA team would visit site of project and would examine Environmental Impact Assessment (EIA), issued by EPA to FFCEL, whether it is being adhered to.
The team would visit the site within next few days. EPA has done fresh sampling of Keenjhar lake’s water. Keenjhar lake had received pollutants through a rainwater drain and sampling of drain’s water indicated toxicity, according to water expert Dr. Mohammad Ahsan Siddiqui, who has also been engaged by EPA Sindh for chemical analysis of water.
Earlier, carcases of cattle, dead fish, snails and other aquatic life was found dead around Keenjhar, a source of water supply to Karachi and parts of Thatta district in last few days. The lake is also a wildlife sanctuary.
Reports indicate that FFCEL is set to start generation of wind energy through a 50MW wind power project with an investment of $135 million. It will have a trial production in June before launching commercial production in November. “With ground breaking of the country’s first 50MW wind power project, a significant milestone in country’s history Pakistan has taken the first step in wind energy to bridge current power shortfall, which is adversely affecting national economy,” Lt Gen (retd) Malik Arif Hayat, Chief Executive and Managing Director of Fauji Fertiliser Company (FFC) and FFCEL had told media last month.
Contamination of Keenjhar led to hue and cry by communities depending on and living in the vicinity of the lake. Keenjhar is regularly fed by Kalri Baghar feeder that emanates from Kotri barrage’s right bank. Keenjhar supplies water to Karachi Water and Sewerage Board (KWSB) but the board spends nothing on its upkeep and preservation, civil society activists believe.
Rainwater drain runs parallel to Keenjhar before becoming part of it. And the drain passes through the windmill site, a source said. SEPA has asked FFCEL management to cooperate with it even if it is not responsible for the contamination of Keenjhar lake directly or indirectly.
“Yes it is their [FFCEL] corporate social responsibility (CSR) to identify the culprit”, Sindh Secretary Environment Mir Hussain Ali said over phone from Karachi. He confirmed that some investors association’s representatives have spoken to him over this issue.
“I have told them circumstantial evidence shows that it [contamination of drain] is due to blasting at windmill project. Latest reports said that urea is found in one of the samples of water”, Ali said. He said that this has aggravated situation as per water analysis report.

136
“Blasting has taken place right at the spot wherefrom rainwater drain starts, said Dr. Siddiqui, who is been visiting the Site regularly for water quality analysis. “I also believe that it is blasting which whose traces in shape of urea have found their way into the rainwater and then this water goes into Keenjhar lake”, he said.
Dr. Siddiqui had called for stopping water supply to Jhimpir because of presence of pollutants contaminants in the sample. Then flow of water of Keenjhar was increased by irrigation authorities.
Mir Hussain Ali said that FFCEL has got its EIA done from EPA Sindh. “But they still need to clarify and explain their position because it is the question of life and death of people”, he said. A deep excavation was needed for creating base/plinth for wind turbine and such a solid base couldn’t be created in absence of blasting, he said.
He agreed that there was no industrial effluent coming out of FFCEL project site yet it was imperative that analysis of ground situation was done to exclude all factors to ensure preservation of lake, a source of livelihood of people. “I have told the investors’ representatives who spoke to me to please do identity the element responsible for the present situation”, said Ali.
Keenjhar animal deaths blamed on urea inflow April 28, 2012 by Our Staff Reporter Daily DAWN Karachi
KARACHI, April 27: High concentration of urea in the Keenjhar Lake drain is believed to have caused death of aquatic species and animals recently in Jhimpir, a town in Thatta district, laboratory tests of the contaminated water samples have shown.
It may be recalled that a large number of fish, a turtle, four cows and the same number of jackals were found dead more than a week ago after consuming water of a rainwater drain feeding Keenjhar Lake.
The lake is the main source of freshwater supply to Karachi and parts of Thatta district.
The Sindh Environment Protection Agency (Sepa) has already served Fauji Fertiliser Company (FFC) with a notice after the incident and a team of the agency is expected to visit the site on Saturday where the FFC is carrying out a windmill project located closely to the drain, according to director general of Sepa Rafiuddin.
The team would investigate how contamination took place and fix responsibility.
Water flow into the lake is said to have been increased by the irrigation department in order to dilute the impact of toxicity.
Speaking to Dawn, Dr Ahsan Siddiqui, a water technologist assigned by Sepa to carry out tests of samples at his laboratory, said that water samples were taken from three sites — the spot where the drain (Horoolo drain) crosses the FFC, 100 yards away from the FFC and the drain where it comes close to the Keenjhar Lake.
“The samples results show a uniform (50mg/ litre) concentration of urea. If cattle accumulate 30mg/litre concentration of urea along with a low Ph level in their bodies, they can die. Aquatic species are, however, more sensitive and could die with a lesser concentration of urea,” he said.
Urea is an organic chemical compound and its high concentration can cause immediate death if Ph level of water is between 7.1 and

137
7.9. In this case, the Ph level was between 7.8 and 8.4 at three different sites, he added.
“The Ph level of drinking water is between 6.8 and 8.0. But the same water becomes toxic, if it contains high concentration of urea,” he said, adding that the concentration of urea was found to be 10mg/liter at the spot from where water was supplied to Jhimpir and that had earlier shown high concentration of lead.“That means the impact of urea was diluted with the flow of water,” Dr Siddqui observed.
The range of total dissolved solids (145-938ppm), salinity (0.2-1.1pc), conductivity (372-2380) of the samples showed that the water was purely rainwater and not contaminated with industrial waste as it had high levels of TDS among other things, he pointed out.
Keenjhar Lake samples test: PCSIR finds high concentration of faecal matter May 2, 2012 by Faiza Ilyas Daily DAWN Karachi
KARACHI, May 1: The findings of the analysis by the Pakistan Council of Scientific and Industrial Research (PCSIR) of the water samples taken from the Keenjhar Lake following toxic contamination of one of its drains show no presence of poisonous compounds but high concentration of faecal matter, it emerged on Tuesday.
The contamination could cause illness in both humans and animals, experts at the PCSIR believed, adding that this should be a cause for concern for the communities living around the lake and those being supplied water from the lake.
The results were out after the Sindh Environment Protection Agency (Sepa) recently initiated an inquiry into the pollution case after serving a notice to Fauji Fertiliser Company running a windmill project in the area. The step was taken when laboratory tests found high concentration of urea in the samples collected from the Horoolo drain feeding Keenjhar Lake. The contamination caused death of fish in large numbers, besides other animals.
Speaking to Dawn, PCSIR microbiology laboratory head, Principal Scientific Officer Dr Seema Ismat, said that faecal coliform was found in high concentration in the samples that could cause illness.
“Two samples [collected by the PCSIR] were taken from the Kalri Baghar Feeder and the lake spot which supplied water to Karachi. The other two submitted by the Karachi Water and Sewerage Board were also taken from the lake, but we have not been informed about the exact sites from where they had been collected,” she said.
She mentioned that the time and site of sample collection was very important, as they determined results. “With the flow of water, the level of toxicity dilutes.”
When her attention was drawn to the lab findings of Sepa, she said there could be a possibility that the samples were not taken from the affected spot or at the right time (following the contamination in the drain).
Water contaminated with faecal matter, she said, should be of concern for communities living around the lake and consuming its water without treating it.
“Karachi is located far from the lake and the impact of such pollutants dilutes to a great extent when it reaches the city. Besides, chlorination also takes care of fecal contaminants,” she added.

138
About the supply of contaminated water in Thatta, Abdul Hameed Palari, vice chairman of the Keenjhar Conservation Network, said that about 70,000 people lived around the lake and were directly dependent on the lake for livelihood and drinking water.
“All human and animal waste from Jhimpir goes into the Keenjhar Lake. The same is true for the people living around the lake as they don’t have toilets in their homes and their animals graze along the lake in seasons when the water level goes down,” he said.
Contaminated water of the lake, according to Mr Palari, had gravely affected public health. Hepatitis, tuberculosis and skin infections were too common among people residing around the lake and Jhimpir that he said received untreated water from the lake.
When the divisional officer (engineering) of public health department, Thatta, Rasheed Soomro, was asked about these concerns, he said that his department was only responsible for the supply of water to Jhimpir. He said that Jhimpir received water only after treatment.
“The quality is checked on alternate days. We have found no traces of contamination in the samples taken from the lake and tested at a government lab recently.”
He said people living around the lake had been drinking that water for a long time. Also, water from the lake was supplied to various other places through tankers, he said. According to environmentalists, a number of government departments are working at the lake though none of them is practically responsible to check pollution that has exposed the communities to various health hazards.
Restoring Keenjhar Lake By Nasir Ali Panhwar | 7th May, 2012, Daily DAWN Karachi
KEENJHAR, the country’s largest freshwater lake, declared a Ramsar site and a wildlife sanctuary, received highly contaminated water recently through a storm drain.
According to a community representative, at least four cows, an equal number of jackals and a turtle had died after drinking water from the confluence of the drain and the lake in recent days.
In addition to that dead fish, snails and freshwater mussel shells were reported floating on the dark colored water flowing in the drain. The lake is a major source of drinking water for Karachi and part of Thatta district, a tourist point and source of livelihood for thousands of locals.
While the actual source of pollutants is yet to be determined, it was obvious from the water condition that poisonous compounds were released in the lake through water channel. The effect of contamination was restricted to a specific area, because wind blowing towards the east was preventing dead organisms and pollutants from entering the lake.
Keenjhar Lake is the largest perennial freshwater lake with extensive reed-beds and blooming lotus, mainly in the shallow western and northern parts. The lake supports diverse flora and fauna, and is a breeding, staging and wintering area for a wide variety of waterfowls.
The lake’s freshwater ecosystem is under threat due to increased industrial and domestic effluent discharge through the Kalri-Baghar Feeder (KB Feeder) canal which carries contaminants from Kotri urban and Industrial area. There are a number of industries in
139
Kotri, which drain their effluents into the KB Feeder and these chemicals together with sewage discharge into the Keenjhar Lake. This water is then supplied to Karachi for drinking purposes.
The lake was formed by the union of two lakes Sonehri and Keenjhar, through the construction of a bund on their eastern side.
Originally, these lakes came into existence when the Indus changed its course. The purpose of the bund was to enhance the storage capacity of the lake. Rain torrents from surrounding hills were also the source of water to Keenjhar Lake.
The area had been an estuary of the Sakro branch of Indus River for a long time. This is evident from the fossilised life scattered over the area.
The lake is endowed with a rich wealth of natural resources comprising mainly 55 species of fish, 263 species of aquatic and terrestrial plants, 51 species of birds and almost 98 species of large and small mammals. Surrounding areas of the lake provide ideal habitat for almost 23 species of reptiles and amphibians.
Fisheries resources have been the main source of livelihood for the dependant communities. Fish populations have declined in the lake in recent years, mainly due to non-observance of conservation measures — diversion of freshwater through the bypass canal during monsoon season when fish juveniles are abundant in river water, unsustainable exploitation, juvenile fishing, pollution and introduction of alien invasive species of fish and plants.
The socio-economic assessment 2007, conducted by the Indus for All Programme WWF-Pakistan, indicated that the main source of livelihood of the people of Keenjhar is fishing, agriculture and livestock, but due to depletion of these resources, many people have switched over to stone mining and stone crushing. There are
39 villages around the lake out of which 26 are small, nine medium and four are large villages having population of 50,000.
According to a survey conducted by the Environment Department, Government of Sindh, only 29 industries located in Kotri SITE area are agents of pollution, while the rest are within parameters. The Environment Department had filed a case in the Sindh High Court to address these issues.
The stakeholders have been called and reprimanded, however there have been no on-ground changes. Seasonal streams (hill torrents) also carry untreated effluents from the Nooriabad Industrial Area and wash over pesticides from surrounding agricultural fields to the lake.
The departments of irrigation, fisheries, wildlife, environment and tourism besides the Karachi Water and Sewerage Board responsible for looking after the lake, work in isolation due to the absence of a proper mechanism for coordination.
The inactivity of concerned departments is a threat to the wetland’s survival, as they do not follow government rules and regulations. Those responsible for dumping untreated effluents in Keenjhar Lake must be identified.
The principle “the polluter should pay” should be applied and it should be ensured that this should not happen again. One major lesson drawn from recent incident is that there are no standard operating procedures (SOPs) to tackle such kind of incidents.
Hence, a dedicated authority with the clear hierarchy is needed to address the issues of wetland management in Sindh. The proposed authority should be answerable to the appropriate department. This would require both supportive legislation as well as political will.

140
Other measures specific to Keenjhar include the development of management plan, setting up of an endowment fund for the rehabilitation and upkeep of Keenjhar Lake, contribution of at least one per cent income of the KWSB from water collection fee for the improvement, installation of treatment plants for industrial effluent by Kotri SITE and installation of nets at the inlet and outlet of the lake to stop the release of fish seed.
‘Wind power project not polluting lake’ May 7, 2012 by Our Correspondent, Daily DAWN Karachi
THATTA, May 6: An official of the Fauji Fertiliser Company Energy, which is working on a wind power project in Jhampir, has dispelled a perception that the project has been causing pollution in Keenjhar Lake, a major source of water for Karachi and parts of Thatta.
In an apparent reference to recent media reports that a drain carrying wastes from a unit of the project which uses some chemicals, has led to massive pollution in the lake, the project director Tariq Aizaz said the project did not pose any environmental threat to the lake.
The company had invited the Sindh irrigation department and the Sindh Environmental Protection Agency for a visit to the project site and adjoining area to determine whether any activity was leading to pollution in the lake, he said at a press conference at the project site near Jhampir.
He said wind power projects had no environmental impact and were inherently safe as far as environment was concerned as they did not discharge any solid, liquid or gaseous effluent.
Wind turbines were basically giant generators which rotated due to wind flow and produced clean and green electricity, Mr Tariq said.
They did not require water or fuel of any sort for their operation, he added.
Referring to Haroolo Nullah about which was reported to contain toxic effluent released into it from the wind turbine project, he said the storm drain was not fed only at the project site but from a large area around the site.
He said the inflow of chemical waste from Nooriabad industries into a canal feeding the lake was mainly responsible for polluting the lake.
He said a number of lime kilns and agricultural land were closer to the lake than the project site. Effect of these sources of pollution like excessive use of fertilizer or pesticide in agricultural activities and discharge of lime water into storm drains should be checked, he added.
He said that the countries in Europe and North America with stringent environmental laws and controls were installing wind power projects which required no waste water or solid waste management.
He said the company was aware of the importance of the lake and believed that it should not be polluted also because it was the source of livelihood for the people living along it.
141
Stakeholders urged to protect Keenjhar Lake May 9, 2012 by Our Correspondent Daily DAWN Karachi THATTA, May 8: A symbolic four-member people’s tribunal on Keenjhar Lake has urged the departments of fisheries, irrigation, wildlife and tourism to play their due role to protect the lake.
Led by environmentalist Samiul Zaman, the tribunal held its proceedings organised by the Pakistan Fisherfolk Forum (PFF) at the lake on Tuesday.
Other members of the tribunal were Nuzhat Ara Alvi, a teacher in Sindh Judicial Academy, district and session judge Dr Najam Khurshid and Maryam Majeedi, a poetess. Government officials and representatives of community and civil society also attended the proceedings.
The tribunal said Keenjhar Lake was a national asset and it was the responsibility of all the stakeholders and the community to protect it.
Nuzhat Ara Alvi read out recommendations, advising fishermen to give one-month notice to the Environmental Protection Agency for taking action. In case of failure people should file a case before the Environment Tribunal for action.
The recommendations said it was responsibility of the commissioner of Hyderabad division to ensure protection to those who were struggling to protect lake and facing political pressure in their areas.
“It is a declared protected zone. Species in and around the lake, including fish, birds, turtles and otters, be protected at all costs,” the tribunal ruled.
It asked the Karachi Water and Sewerage Board (KWSB) to pay royalty for development activities around the lake. KWSB gets 1,000 cusecs of water daily.
Sindh Wildlife Department was advised to design management plan involving all stakeholders, including community, to prevent the lake from pollution. The tourism department should take steps to promote ecotourism and improve facilities, the tribunal said.
Sami ul Zaman urged people not to be dependant on others and to protect their resources themselves. He asked people living near the lake to collect information through monitoring to see situation and inform the government departments concerned.
If the community did not trust other organizations, they themselves should bring samples to him for laboratory tests free of cost, he said adding: “We will check water quality. If you want to file case with the Environmental Tribunal, I will be happy to support you.”
He said there was a procedure for filing case with the Environment Tribunal against any industry. Before coming to the tribunal, fishermen should write a letter to the EPA, asking them to take action.
PFF chairman Mohammed Ali Shah, pleading as a community representative before the tribunal, said Nooriabad and Kotri industrial areas released waste into Keenjhar Lake through natural drains and main Kalri Baghar Feeder, posing a threat to wildlife and environment and livelihood of fishermen who already face joblessness.
He said 15 years ago there were 55 species of fish in the lake and now there were eight.

142
Keenjhar might lose its attraction because of looming threats of pollution like Manchhar which received poisonous water through Main Nara Valley (MNV) drain, he said.
Hundreds of fishermen had migrated from native villages around Keenjhar to other lakes for livelihood, he said.
After community assessment, it was observed that windmill operators dumped chemicals into natural waterways. When it rained, drains brought the chemicals to lake which killed fish, turtles, birds and livestock.
People from Jhampir and 12 other villages get lake water through Keenjhar. Fishermen are reluctant to use water from it.
Barrister Abdul Rehman said government departments, including KWSB, was the main stakeholder responsible to save fresh water body.
Sindh wildlife department declared lake as wildlife sanctuary in 1972 but it could not check pollution in it.
Keenjhar Lake pollution: Sepa fails to fix responsibility May 12, 2012 by Faiza Ilyas Daily DAWN Karachi
KARACHI: While strongly suggesting that the recent contamination in the Keenjhar Lake drain was caused by the release of toxics from a windmill project, an investigative report received by the Sindh Environment Protection Agency (Sepa) on Friday remains short of fixing responsibility on anyone for the incident.
Dr Mohammad Ahsan Siddiqui, the report’s author, was part of the committee set up by the environment secretary to investigate the contamination, which not only killed a number of fishes but also claimed the life of many animals last month.
The team’s terms of reference included fixing of responsibility for the lake contamination. Farhad Shahid, Mujeeb Sheikh, Abdullah Magsi and S.M. Yahya of Sepa were part of the team.
Water samples from the affected drain were not only tested at Sepa’s own laboratory, but also separately examined by Dr Siddiqui, an independent scientist on water analysis. Both tests showed similar findings.
According to Dr Siddiqui’s report submitted to Sepa on Friday, the samples contained high concentration of urea.
The report submitted to Sepa on Friday stated that there could have been only two sources of contamination of the Horoolo drain — wastewater from the Nooriabad Industrial Area or waste from the nearby windmill project.
The author ruled out the first possibility on the basis of the lab findings that showed the water was not contaminated with industrial waste.
It was pure rainwater, he said, explaining that the water sample did not contain high levels of TDS (total dissolved solids), a major sign of contamination with industrial effluent.
“On the basis of my lab tests, I can say with confidence that the deaths were caused by high concentration of urea in the drain water.”
He said it could be the empty bags of urea that had washed away by rainwater or someone might have thrown urea into the drain
143
intentionally or unintentionally. But “one must not ignore the possibility that someone might have carried out blasting activity in the hilly area that led to the contamination.“Having said that, we couldn’t find anything objectionable during our visit to the windmill project being run by Fauji Fertilizer Company (FFC),” Dr Siddiqui said.
The samples, he said, also contained traces of chromium.
Prevention:
To prevent recurrence of such incident, the report recommended a number of measures, including the imposition of a ban on explosives use for construction in the area that enjoys the status of a wildlife sanctuary and regular monitoring of the lake and the drains feeding it by relevant departments and independent experts.
Besides, Dr Siddiqui expressed serious concern over the continuous release of industrial waste into the lake through the Kalri Baghar Feeder (K.B. Feeder), one of the major sources of regular water supply to the lake.
The Karachi Water Board and Sewerage Board should also allocate budget for the lake’s monitoring, he suggested in his report.
When contacted, Environment Secretary Mir Hussain Ali told Dawn that he wanted more input from the environment department. He said he needed a comprehensive report. “The terms of reference of the committee warrant a comprehensive investigative report that can help us fix responsibility and I will insist the Sepa director general on this,” said Mr Ali.
“A comprehensive investigative report, which contains specific observation of team members and details of their interaction with
locals, is necessary to prevent recurrence of such an incident in future.”
Monitoring mechanism:
In its first meeting held on Friday, a committee set up by the chief secretary to address the issue of Keenjhar Lake pollution decided that a monitoring mechanism of all the drains feeding the Keenjhar Lake, K.B. Feeder as well as the lake itself would be devised and proposed to the government for funding.
Some industrial areas representatives attending the meeting informed the committee about the construction of a combined effluent treatment plant at Kotri. They said it would be operational in June. For Nooriabad, they added, a scheme had been proposed in the annual development programme.
The meeting took notice of the KWSB managing director’s absence. The water board, the participants said, was the prime stakeholder in this issue and “must demonstrate responsibility”.
They said the water board had no lab at the lake from where water was drawn for Karachi. They also expressed concern over the lack of monitoring by the KWSB along the channel taking water to the city.
144
Keenjhar Lake water quality management May 27, 2012 by F H Mughal Daily DAWN Karachi
This is apropos the news ‘Another Source of Keenjhar Lake Exposed’ (April 22).
The 2008 and 2011 editions of WHO’s drinking water guidelines give a value for mercury as 0.006 mg per litre, or 6 mg per litre, or 6 parts per billion and not as 1 ppb, as reported.
In the report, WHO guidelines for drinking water have been compared with Keenjhar Lake water. How can one compare oranges with apples? All surface water bodies in Sindh are polluted. Drinking those raw waters would end up in massive health complications. Water-treatment plants are used for treating polluted raw water. Only the quality of treated water, meant for drinking, should be compared with WHO’s drinking-water guidelines.
Water quality problems of a lake are not assessed by taking a few water samples, as is being done by some persons. Lakes are open systems and are integrated components of the watershed. Watershed influence the lake, as such, lakes’ problems cannot be handled in isolation. They must be co-related to the watershed and its environment. The operation of the lake is governed by what materials enter the lake, leaves the lake and remains in circulation. Lakes are characterized by a low, average current velocity of 0.001 to 0.01 meters per second at its surface. Water residence times in lake range from one month to several years. Currents within lakes are multidirectional and, many lakes have alternating periods of stratification and vertical mixing.
While causes of the water quality problem in a lake may relate to inputs, like discharge of municipal and industrial wastewater, diffused pollution from agricultural sources, discharge of toxic
substances from industries and thermal discharges, a specific water quality problem may have its origin elsewhere. The following principle will illustrate the point:
Lakes have large buffering capacities and can withstand certain levels of pollutants. The buffering capacity is in the shape of the ability of sediments to accumulate pollutants.
Once the capacity has exhausted, further input of pollutants will be reflected in the water. This may give an impression that the problem has occurred recently (e.g., lead in Keenjhar Lake), but, in practice, the problem may have occurred many months ago.
Eutrophication causes oxygen depletion in the hypolimnion layer. Depletion of oxygen in the lake’s bottom results in the remobilisation of manganese, iron and phosphorus. Some trace elements are also released from bottom sediments.
Particulate matter plays a major role in water quality assessment as it regulates the uptake and release of pollutants. Thus, besides water sampling, the particulate matter and biological material are also analyzed by limnologists for a complete water-quality assessment study.
The major problem of surface water bodies in Sindh pertains to the governance issue. Nobody knows who controls the water bodies in Sindh. Technically, the Sindh irrigation department should control the hydraulic aspect (water quantity, water supply, water flows) and the Sindh EPA should control the water quality aspect.