water futures and solutionpure.iiasa.ac.at/id/eprint/13008/1/wp-16-006.pdf · tramberend, yoshihide...
TRANSCRIPT

1
International Institute for
Applied Systems Analysis
Schlossplatz 1
A-2361 Laxenburg, Austria
Tel: +43 2236 807 342
Fax: +43 2236 71313
E-mail: [email protected]
Web: www.iiasa.ac.at
Working Papers on work of the International Institute for Applied Systems Analysis receive only limited review. Views or opinions expressed herein do not necessarily represent those of the Institute, its National Member Organizations, or other organizations supporting the work.
Working Paper WP-16-006
Water Futures and Solution
Fast Track Initiative – Final ReportADA Project Number 2725-00/2014
Peter Burek ([email protected]) Yusuke Satoh ([email protected]) Günther Fischer ([email protected]) Mohammed Taher Kahil ([email protected]) Angelika Scherzer ([email protected]) Sylvia Tramberend ([email protected]) Luzma Fabiola Nava ([email protected]) Yoshihide Wada ([email protected]) Stephanie Eisner Martina Flörke Naota Hanasaki Piotr Magnuszewski ([email protected]) Bill Cosgrove ([email protected]) David Wiberg ([email protected])
ZVR 524808900
Approved by
Bill Cosgrove
Acting Program Director, Water Program
May 2016

Final REPORT Water Futures and Solution
Fast Track Initiative ADA Project Number 2725-00/2014
Peter BUREK, Yusuke SATOH, Günther FISCHER, Taher KAHIL, Luzma NAVA JIMENEZ, Angelika SCHERZER, Sylvia TRAMBEREND, Yoshihide WADA, Stefanie EISNER, Martina FLÖRKE, Naota HANASAKI, Piotr MAGNUSZIEWSKI,
William COSGROVE and David WIBERG
IIASA, Laxenburg, Austria, March 2016


I
Contents
Su ar V
I trodu tio ................................................................................................................................
. Pu pose of this epo t ...........................................................................................................................
. WFa“ s e a io app oa h .......................................................................................................................
. ‘egio al atego ies used i this a al sis ..............................................................................................
The I porta e of a Ne us Approa h ...........................................................................................
Future s e arios - WFaS Futures A al sis Approa h ......................................................................
. Buildi g ate s e a ios .......................................................................................................................
. Wate e te ded “ha ed “o io-E o o i Path a s ““Ps ...................................................................
. H d o-e o o i lassifi atio ..............................................................................................................
. “u a of s e a io assu ptio s fo WFa“ fast-t a k ..................................................................
. Multi- odel assess e t .....................................................................................................................
. Food a d ag i ultu e odelli g f a e o k........................................................................................
. . The odeli g f a e o k .........................................................................................................
. . ““P s e a io i ple e tatio ..................................................................................................
. U e tai t of ate suppl a d de a d ..........................................................................................
Glo al ‘esults ...........................................................................................................................
. “o io E o o i s ..........................................................................................................................
. . Populatio ................................................................................................................................
. . E o o i g o th a d i o e ..................................................................................................
. E e g s ste de elop e t a d s e a ios ........................................................................................
. . E e g de a d ha ge a d i pli atio s o ate use ..........................................................
. . Cli ate ha ge i pa ts o the e e g se to .........................................................................
. Food a d ag i ultu e de elop e t .....................................................................................................
. . Food de a d ...........................................................................................................................
. . People at isk of hu ge ...........................................................................................................
. . E olutio of ulti ated la d .....................................................................................................
. . Co ludi g e a ks o Food a d ag i ultu e de elop e t ....................................................
. Wate “uppl ..........................................................................................................................
. . A aila le su fa e ate ............................................................................................................
. . A aila le su fa e ate pe apita ...........................................................................................
. . G ou d ate ............................................................................................................................
. . T a s ou da depe de of ate esou es ......................................................................
. Wate de a d ..........................................................................................................................
. . Total ate de a d .................................................................................................................
. . Wate de a d ha ge se to .............................................................................................
. Wate se u it ..........................................................................................................................
. . Wate s a it - I ala e et ee suppl a d de a d .......................................................
. . Pote tial populatio e posed to futu e se e e ate s a it ................................................
. H d o-e o o i lassifi atio ............................................................................................................
Outlook - u o eri g ater solutio s .........................................................................................
. Poli espo ses fo opi g ith g o i g ate s a it ....................................................................
. Diffe e t path a s fo a agi g ate s a it ................................................................................
Co lusio ...............................................................................................................................
‘efere e ...............................................................................................................................

II
Appe di I Appe di A: ““P “to li es .......................................................................................................................... I Appe di B- : WFa“ ate sto li es a d i pli atio s fo i dust ial ate use ...................................... III Appe di B- : WFa“ ate sto li es a d i pli atio s fo do esti ate use........................................V
Appe di B- : WFa“ ate sto li es a d i pli atio s fo ag i ultu al ate use ...................................VI Appe di C: H d o E o o i lassifi atio su egio s a d ou t ies ...............................................VIII Appe di D: Additio al esults fo all s e a ios ....................................................................................... XII
Figure list
Figure 1-1: Regional categories .............................................................................................................................. 2
Figure 3-1: The shared socioeconomic pathways (SSPs) representing different combinations of
challenges to climate mitigation and adaptation. .................................................................................... 5
Figure 3-2: Conceptual framework for allocation of hydro-economic classification to four
quadrants of water security ..................................................................................................................... 9
Figure 3-3: Framework for ecological-economic world food system analysis ...................................................... 16
Figure 3-4: Long term trend under Middle of the Road scenario: a) precipitation b) runoff .............................. 20
Figure 3-5: Multi-GHMs comparison of each water demand example of India and China ................................ 20
Figure 4-1: Population development until 2100, by continent and scenario ....................................................... 22
Figure 4- : Populatio de elop e t i the Middle of the ‘oad scenario for the sub-regions of
Africa, Asia, and Europe ......................................................................................................................... 22
Figure 4-3: Population – Middle of the road scenario Top: population 2010. Middle: population
2050. Bottom: change rate of population [%] compared to 2010 ......................................................... 23
Figure 4-4: For three scenarios GDP development till 2100 for the 6 continents ................................................ 24
Figure 4-5: For the 3 scenarios population development till 2100 for subregions Africa, Asia and
Europe .................................................................................................................................................... 25
Figure 4-6: Gross domestic product – Middle of the Road scenario Top: GDP 2010. Middle: GDP
2050. Bottom: change rate of GDP [%] compared to 2010 .................................................................... 25
Figure 4-7: Per capita GDP in 2010 and 2050 for the three scenarios.................................................................. 26
Figure 4-8: Gross domestic product per capita – Middle of the Road scenario Top: GDP/cap 2010.
Middle: GDP/cap 2050. Bottom: change rate of GDP/cap [%] compared to 2010 ................................ 27
Figure 4-9: Changes in Gross domestic per capita and population for ADA priority countries
lue Sustainability , ello Middle of the ‘oad , ed ‘egional ‘i alr scenario)........................... 28
Figure 4-10: Population in detail at the example of Eastern Africa. Source: Jones 2014 ..................................... 30
Figure 4-11: Global primary energy demand (upper-left) and electricity generation (down-left)
under the different WEO-2015 scenarios and changes in technology mix of global primary
energy demand (upper-right) and electricity generation (down-right) between 2010 and
2040. ....................................................................................................................................................... 31
Figure 4-12: Global water withdrawals (rectangular bars) and consumption (black squares) for
energy production by scenario ............................................................................................................... 33
Figure 4-13: Impacts of climate and water resources change on annual mean usable capacity of
current hydropower and thermoelectric power plants. ........................................................................ 35
Figure 4-14: Selected indicators of global food system development under the different SSP
scenarios................................................................................................................................................. 36
Figure 4-15: Selected indicators of food system development in Asia under the different SSP
scenarios................................................................................................................................................. 38
Figure 4-16: Selected indicators of food system development in Africa under the different SSP
scenarios................................................................................................................................................. 39

III
Figure 4-17: Evolution of cultivated land, area equipped with irrigation and total irrigation water
requirement in Asia under the different SSPs ........................................................................................ 40
Figure 4-18: Indicators of global food system intensification under the different SSPs. ..................................... 43
Figure 4-19: Cumulative global forest loss under the different SSPs. .................................................................. 43
Figure 4-20: Evolution of cultivated land, area equipped with irrigation demand in Asia under the
different SSPs. ........................................................................................................................................ 44
Figure 4-21: Evolution of cultivated land, area equipped with irrigation and cumulative
deforestation in Africa under the different SSPs.................................................................................... 46
Figure 4-22: Evolution of irrigated land and irrigation water requirements in Africa under the
Middle of the Road scenario. ................................................................................................................. 46
Figure 4-23: Cumulative forest conversion due to cropland and urban land expansion in Africa
under the Regional Rivalry scenario. ...................................................................................................... 47
Figure 4-24: Cereal price index (2010=100) under the different SSP scenarios. .................................................. 48
Figure 4-25: Projections of surface water availability for the different continents under two
scenarios until 2100 ............................................................................................................................... 49
Figure 4-26: Available surface water – Middle of the Road scenario Top: Available surface water
2010. Middle: Available surface water 2050. Bottom: change rate of available surface
water [%] compared to 2010.................................................................................................................. 50
Figure 4-27: Available surface water – Middle of the Road scenario Top: Available surface water
per capita 2010. Available surface water per capita 2050. Bottom: Sub-country scale of
Available surface water per capita 2050 for three regions .................................................................... 52
Figure 4-28: Available surface water per capita for ADA priority countries – three scenario
comparison ............................................................................................................................................. 53
Figure 4-29: Groundwater abstraction in the 2010s - Middle of the Road scenario Top:
Groundwater abstraction in the 2010s. Bottom: Change (in Mio m3/year) till 2050 ............................. 55
Figure 4-30: Groundwater abstraction in India, China and Pakistan .................................................................... 55
Figure 4-31: Flow regime and water dependency in the 2010s (2005-2014) at the example of
Ethiopia, Syria and Egypt ........................................................................................................................ 56
Figure 4-32: Dependency ratio 2010 .................................................................................................................... 57
Figure 4-33: Dependency ratio of the ADA priority countries .............................................................................. 57
Figure 4-34: Surface water supply and demand for 2010 and 2050 – Middle of the Road scenario ................... 58
Figure 4-35: Total water demand by continent until 2050. .................................................................................. 59
Figure 4-36: Total water demand by sub-region in Africa, Asia and Europe until 2050 ....................................... 59
Figure 4-37: Water demand in 2010 and 2050 at country-level – Middle of the Road scenario ......................... 60
Figure 4-38: Share of agricultural water demand in 2010 and changes by 2050 ................................................. 62
Figure 4-39: Water scarcity - Middle of the Road Scenario for each grid cell ...................................................... 65
Figure 4-40: Potential Population under severe water scarcity for all three scenarios from 2010 to
2050. Left: On annual basis. Right: On basis of the most water scarce month ..................................... 66
Figure 4-41: Potential Population under severe water scarcity in 2050 – Middle of the Road
Scenario .................................................................................................................................................. 67
Figure 4-42: Most water scare month in the period 2005-2014 – Middle of the Road Scenario ......................... 67
Figure 4-43: Potential Population under severe water scarcity in 2050 – Middle of the Road
Scenario .................................................................................................................................................. 68
Figure 4-44: Hydro-Economic dimension ............................................................................................................. 69
Figure 4-45: Country-level Hydro-economic class in 2010 and 2050 - Middle of the Road scenario ................... 70
Figure 4-46: Change in Hydro-Economic classes for the priority countries of the Austrian
Development Cooperation – Middle of the Road scenario .................................................................... 73

IV
Table list
Table 3-1: Assu ptio s applied i the WFa“ fast-tra k s e a io u s, deplo ed at ou t le el .................... 12
Table 3-2: Scenario assumptions for technology and structural change in the industry and domestic
sector ...................................................................................................................................................... 13
Table 3-3: Global Hydrological Models (GHM) used in this study ........................................................................ 15
Table 3-4: General Circulation Models (GCM) used in this study ......................................................................... 15
Table 3-5: Drivers and parameter for estimation of industrial water demand .................................................... 15
Table 3-6: Drivers and parameter for estimation of domestic water demand .................................................... 15
Table 3-7: Overview on assumptions for food and agriculture scenario simulations .......................................... 19
Table 4-1: Population, GDP and GDP per capita comparison Middle of the Road scenario ............................... 26
Table 4-2: Population, GDP and GDP per capita comparison ADA priority countries – Middle of the
Road scenario ......................................................................................................................................... 29
Table 4-3: Climate and land use components of increased irrigation requirements ........................................... 41
Table 4-4: Regional climate and land use components of increased irrigation demand in 2050 ......................... 42
Table 4-5: Climate and land use components of increased irrigation requirements in Asia ................................ 45
Table 4-6: Available surface water per capita – ranking of the countries with lowest water per
capita worldwide .................................................................................................................................... 51
Table 4-7: Available surface water per capita – ADA priority countries ............................................................... 53
Table 4-8: Groundwater abstraction – ranking of the countries with the highest abstraction in the
world ...................................................................................................................................................... 54
Table 4-9: Groundwater abstraction – ADA priority countries ............................................................................. 56
Table 4-10: Water demand by continent and sector under the Middle of the road scenario. ............................. 62
Table 4-11: Water demand by sector in ADA priority countries under Middle of the road scenario .................. 63
Table 4-12: Potential Population under severe water scarcity in 2010 and 2050 - ADA countries–
Middle of the Road Scenario .................................................................................................................. 68
Table 4-13: The number of countries in each Hydro-Economic classes. Country results are
accumulated at subregional level........................................................................................................... 69
Table 4-14: Population for each Hydro-Economic classes .................................................................................... 71
Table 4-15: GDP for each Hydro-Economic classes. Country results are accumulated at subregional
level. ....................................................................................................................................................... 71
Table 4-16: Countries which is categorized into larger water challenge classes in the 2010s and in
the 2050s under three future scenarios ................................................................................................. 72
Table 4-17: Information about GDP per capita in HE4 ......................................................................................... 73
Table 5-1: Water supply-side interventions. ........................................................................................................ 77
Table 5-2: Water demand-side interventions ....................................................................................................... 78

V
“u ar
The Water Futures and Solutions Initiative (WFaS) is a cross-sector, collaborative global water project.
Its objective is to apply systems analysis, develop scientific evidence and identify water-related
policies and management practices, working together consistently across scales and sectors to
improve human well-being through water security. The approach is a stakeholder-informed, scenario-
based assessment of water resources and water demand that employs ensembles of state-of-the-art
socio-economic and hydrological models, examines possible futures and tests the feasibility,
sustainability and robustness of options that can be implemented today and can be sustainable and
robust across a range of possible futures and associated uncertainties. This report aims at assessing
the global current and future water situation.
Possible Water Futures
WFaS has developed a set of scenarios of global water futures, which have been quantified and
assessed with a multi-model approach. These water-relevant future scenarios are based on water use
narratives that extend the Shared Socio-economic Pathways (SSPs) and Representative Concentration
Pathways (RCPs); a set of pathways developed by a large global community over several years for the
assessments of the Intergovernmental Panel on Climate Change (IPCC). The advantage of using these
multi-disciplinary scenarios is to ensure the consistency among the different sectoral scenarios. The
scenarios assume different paths of socioeconomic change and varying degrees of climatic change.
These scenarios are: Sustainability scenario (resulting in low challenges with respect to sustainability,
mitigation and adaptation), Middle of the Road scenario (intermediate challenges) and Regional
Rivalry scenario (high challenges). The main findings of this analysis are summarized as follows:
Populatio a d GDP: Glo al total populatio is esti ated at . illio i . Futu e p oje tio s i di ate that Glo al populatio is e pe ted to u de go o side a le ha ges i the o i g de ades. It ill a ge et ee . a d . illio i the s a d it ill a ge et ee a d illio i the
s depe di g o the s e a io. “pe ifi all , total populatio ill o ti ue to i ease th ough u de the Middle of the ‘oad s e a io, hile it ill peak at a d i the Sustaina ilit a d the Middle of the ‘oad s e a ios, espe ti el . Glo al GDP le els at the e d of this e tu a e lo est i the ‘i al s e a io ith lo est le els of i te atio al o-ope atio a d t ade a ou ti g to a ou d t illio U“D. I the “ustai a ilit a d Middle of the ‘oad s e a io this i eases to a d t illio U“D. O i g to its la ge populatio Asia a d Af i a a e the ai d i e s fo diffe e es a oss s e a ios, espe iall i the se o d half of this e tu .
Food: Glo all , a e age food e e g i take i the Wo ld Food “ ste odel is esti ated at kCal/ ap/da i , ith egio s a gi g f o less tha kCal/ ap/da i Af i a to o e tha
kCal/ ap/da i No the A e i a, Eu ope a d O ea ia. The p oje ted pe apita food e e g i take i a ges le els et ee to kCal/ ap/da depe di g o the s e a io. The
u e of people at isk of hu ge esti ated fo a ou ts to Millio , so e . % of glo al populatio . This u e is apidl de easi g i t o de elop e t path a s a d the sha e of people at isk of hu ge is elo % of glo al populatio . O l i the ‘egional ‘i alr s e a io the esti ated u e of people at isk of hu ge stag ates at a out Millio o so e . % of the glo al populatio i .

VI
E erg : Glo al e e g de a d is e pe ted to fu the i ease i the e t de ades, f o illio to s of oil e ui ale t Mtoe i to - Mtoe i depe di g o the s e a io of the
Wo ld E e g Outlook. This i ease ill e d i e ai l de a d g o th i I dia, Chi a, Af i a, the Middle East, a d “outheast Asia. The g o i g de a d fo po e e ge de s glo al ele t i it ge e atio to i ease. Glo al ele t i it ge e atio is e pe ted to i ease sig ifi a tl f o TWh i to et ee a d TWh i . The o t i utio of fossil fuels to total ele t i it ge e atio ill de ease f o % i to et ee % a d % i . Ge e atio f o e e a les g o s the fastest, as thei osts fall a d go e e t suppo t o ti ues, a d it i eases t o to th ee a d a half ti es, to ea h et ee a d TWh . H d opo e e ai s the la gest sou e of e e a les ge e atio , hile i d po e a d sola PV e pa d apidl , ut f o a u h lo e ase. Output f o u lea po e pla ts i eases up to %.
A aila le surfa e ater resour es per apita: Cou t ies o the A a i pe i sula sho the lo est ate a aila ilit pe apita i the s follo ed No th Af i a ou t ies. Pakista , Chi a ut also Belgiu ha e lo ate a aila ilit pe apita. Due to de og aphi ha ges, diffe e es i ate a aila ilit pe apita a o g s e a ios e o e e ide t the s. Wate a aila ilit pe apita is e pe ted to de ease i a elt a ou d to o the latitude f o Mo o o to I dia du i g the ea l half of the st e tu u de all s e a ios o side ed. O l a fe ou t ies sho the opposite t e d like Pola d hi h goes f o ul e a le i the s to o st ess i the s a d Chi a hi h is u de
ate st ess o ut ill e i the atego a o e / ea / ap i t o out of th ee s e a ios i the s.
Grou d ater resour e: G ou d ate use glo all a ou ts to k / ea i the s. The la gest a st a tio s a e taki g pla e i I dia, U“A, Chi a, I a a d Pakista . A st a tio s these ou t ies a ou t fo % of total a st a tio s o ld ide. I a ou t ies, g ou d ate a st a tio has al ead e eeded e ha ge, leadi g to the o e e ploitatio a d deg adatio of i po ta t a uife s ste s. A o i g issue i the s ill e the e pe ted la ge su ge i g ou d ate a st a tio s, e ui ed to satisf the i ease of ate de a ds, a ou ti g to k / ea , a % i ease o pa ed to u e t le el.
Water de a d: It is esti ated that glo al total ate de a d i the s is a out k / ea a d p oje ted that it ill e et ee to k / ea u de the th ee s e a ios o side ed, ith i dust ial a d do esti de a d g o i g u h faste tha ag i ultu al de a d. U de Middle of the ‘oad s e a io, the sha e of ag i ultu al de a d ill de ease f o % i the s to % i the
s, hile the sha e of i dust ial a d do esti de a d ill i ease f o % i the s to % i the s. At o ti e tal s ale, Asia e ai s the la gest ate use i the o ld i all se to s espe iall fo ag i ultu al ate use. “ig ifi a t ises i total ate de a d a e e pe ted to o u i Weste , Easte a d “outhe Af i a, as ell as i “outhe a d Easte Asia. At ou t le el, I dia a d Chi a ha e the la gest de a d, follo ed U“A, Pakista a d ‘ussia. Do esti de a ds a e apidl i easi g i su “aha a Cou t ies, d i e thei i te se so io-e o o i g o th. These ha ges i ate use patte s o e togethe ith the pote tial i ease of fe tilize s utilizatio , due
to the eed to i p o e ag i ultu al p odu ti it . All of this ill likel i pai ate ualit a d da age alua le ate -depe de t e os ste s, if o ade uate a ate e t easu es a e desig ed a d
i ple e ted.
Water s ar it : Ma ou t ies i ludi g the ou t ies o the A a i pe i sula, No th Af i a, C p us, A e ia, Uz ekista , Afgha ista a d Pakista a e al ead u de goi g pe asi e ate s a it o ditio s. At p ese t al ost all ou t ies i elt a ou d to o the latitude f o Me i o to
Chi a a d Weste “outh A e i a, “outh Af i a, “outh Eu ope a e affe ted ate s a it . A i easi g u e of people ill e e posed to o ditio s of se e e ate s a it u til . I the
s o a ual asis . illio people % of the total glo al populatio li e i pote tial se e e ate s a e a eas a d i it ill e . to . illio depe di g o the s e a io. If o thl
a ia ilit is take i to a ou t al ead o . illio people o ld ide % a e li i g i pote tial se e e ate s a it a eas at least fo o e o th pe ea a d it ill e . to . illio i . % of the affe ted people li e i Asia % i .

VII
H dro-E o o i a al sis: ou t ies ith o i ed populatio of . illio people a e u e tl ate st essed i h a d poo e o o ies e ai i g ate st essed a d to ou t ies e pe ted to e i the s, depe di g o the s e a io o side ed. Co se ue tl , a populatio of . a d . illio to % of the Wo ld s total populatio ill e i the t o ate st ess atego ies i the s.
to % of the affe ted populatio ill li e i Asia ai l “outhe a d Easte Asia a d to % i Af i a ai l No the Af i a . Ou a al sis e eals that “o alia, E it ea, Nige , Bu ki a Faso, “e egal, Ye e , Afgha ista a d Pakista ill e the ost ul e a le ou t ies glo all , as the ill e highl st essed ith lo adapti e apa it u de ost of the s e a ios.
The results indicate that the World currently faces multiple and complex water challenges that are
expected to intensify in the future. This will likely hinder economic development, threaten food and
energy security, and damage valuable ecosystems. Improved water policies and governance
structures, and the adoption of a more innovative technological interventions will offer some
solutions. However, managing the water sector alone is no longer sufficient, since water integrates
across scales and sectors, which all use and influence increasingly scarce water resources. Consistent
solution portfolios need to be identified to work across economic sectors and scales of management.
Since we cannot manage what we cannot measure, information gathering, generation, and sharing
must also be improved. This report provides essential information to inform and guide policymakers
in the design and implementation of water solutions portfolios. The information provided includes
estimates of water supply by source, water variability, water demand, and hydro-economic
classification under various up-to-date socio-economic and climate scenarios. To improve water,
energy, and food security, sustain human wellbeing, and ensure sustainable development, the
identification of portfolios of options that work together synergistically in different regions will be the
focus of continuing work within the WFaS initiative and future reports.


1
I trodu tio
Changing and growing global water demand:
The world population is expected around the middle of 21st century to range from 8.4 to 9.8 billion
depending on the scenario. GDP is expected to grow globally three to six times till 2050 compared to
2010, although there are and will be large differences among countries. The drastic socio-economic
changes will increase pressure on food, energy, and water resources.
There is also increasing evidence that the global water cycle is changing due to global warming. The
hydrological cycle is intensifying with wetter regions generally becoming wetter and drier regions
becoming even drier. These supply side changes in the hydrological cycle can have large impacts on
future water availability and quality. Analysis of these aspects of global change helps understanding
the urgent need for swift planning and execution of strategic, reasonable and effective management
and countermeasures against deteriorating water security.
Global water assessment within the Water Future and Solutions Initiative (WFaS):
It is now universally accepted that sustainable management of food, energy, ecosystem and water are
central parts of the 21st century development challenge and that they are deeply connected with each
other. An assessment relevant to water should cover all of these components and consider their
linkages, utilizing consistent assumptions across sectors.
For the sake of providing scientific input to support stakeholder dialog and decision making, the Water
Future and Solutions Initiative (WFaS) develops consistent multi-model global water scenarios,
consistent with scenarios for other sectors, with the aim to analyze the water-food-energy-climate
nexus and identify future hotspots of water insecurity and related impacts on human wellbeing. This
current study investigates future climatic change developments in three main water use sectors, the
industrial, domestic and agricultural sectors, focusing on how the developments in those sectors affect
water supply and demand balances, and the related water security, into the future.
1.1 Purpose of this report
The purpose of this report is to assess and depict possible global water futures, applying the latest
climate and socio-economic change scenarios based on multiple-model analysis. Multi-model analysis
is used to better understand uncertainty, and provide an indication of the scientific confidence we can
provide with respect to some of the important conclusions. Better understanding of the current and
future availability of water resources is essential for sound development in a changing world. To cope
with expected global changes, we need to identify options and find appropriate pathways for
achieving the development goals, including Agenda 2030, in an effective, efficient and robust manner.
This report discusses where, when, how much and why water resource will be endangered in different
regions of the World under expected climate and socio-economic change.
1.2 WFa“ s e ario approa h
One of the primary tasks of WFaS has been to develop global scenarios of water potentials and
stressors, their interdependencies across the different sectors, the climate-water-food-energy-
ecosystem nexus, and the impacts on human wellbeing and earth ecosystems and the services they
provide. In the quantitative analysis WFaS develops consistent, multi-model global water scenarios

2
with the aim to analyze the water-food-energy-climate-environment nexus and identify future
hotspots of water insecurity and related impacts on human well-being, in particular food and energy
security. Water insecurity is an imbalance between water supply and demand, combined with risks of
extremes and the coping capacities of social systems, WFaS has projected these components and
assessed global water scarcity and security both at present and under possible futures. How will socio-
hydrological condition change in next 50 years? Where will be hot-spots of water insecurities? How
serious will it be?
1.3 Regio al ategories used i this a al sis
This report uses the composition of regions by the United Nations Statistics Division1, consisting of six
continental regions (Africa, North and Middle America, South America, Asia, Oceania, Europe) and 19
geographical sub-regions listed in Figure 1-1.
Continent Subregions Continent Subregions Africa Northern Africa America and
Central America
Northern America
Western Africa Central America
Middle Africa Caribbean
Eastern Africa South America South America
Southern Africa Europe Western Europe
Asia Western Asia Southern Europe
Southern Asia Northern Europe
Central Asia Eastern Europe
Eastern Asia Oceania Oceania
South-Eastern Asia
Figure 1-1: Regional categories
Assessments at five levels of spatial scale are provided in this report; global, continental, sub-regional,
country and sub-country scale (i.e. the grid scale of models). Some small islands are not reflected in
the result, because the minimum spatial resolution of the utilized models is 0.5ox 0.5o global
(approximately 50km x 50km at equator).
We put special emphasis on some of the countries which are the key and priority countries of the
Austrian Development Cooperation which are: Albania, Armenia, Bhutan, Burkina Faso, Ethiopia,
Moldavia, Mozambique, Uganda and for comparison Austria.
1 http://unstats.un.org/unsd/methods/m49/m49regin.htm

3
The I porta e of a Ne us Approa h
The water, food, and energy resource systems are inextricably linked. These resources are crucial input
into economic production and they provide valuable ecosystem services to humans. Secure, reliable,
and affordable access to all these resources is critical to basic survival, as well as ongoing economic
development, at all scales and in every region of the world. The energy sector needs significant
amounts of water withdrawals for power generation, primarily for cooling thermal power plants and
running hydropower turbines; for fuel extraction, processing, and transportation; and increasingly for
growing biofuels. Similarly, energy is essential for water extraction from both surface and subsurface
sources, conveyance and delivery to users, and treatment. Furthermore, energy is used in the agro-
forestry sector for fertilizer production, irrigation, cultivating and harvesting crops, and drying and
processing products. The agricultural sector is the largest user of water worldwide, mainly for
irrigation purposes. Finally, land resources are required for the agriculture, energy and water-related
activities, primarily for the cultivation of food, feed, fiber, and bioenergy, but also for setting up water
and energy facilities. Choices made in one sector can translate to increased risks and harmful effects
in another, but they can also generate co-benefits. This linked relationship is commonly known as the
water-food-energy nexus.
The next few decades will see an intensification of multiple challenges at the nexus of water, food,
and energy. These challenges include growing demands for water, food, and energy, driven by several
socio-economic changes. At the same time, water, food, and energy systems in many countries will be
put under growing pressure by increasingly complex interactions, the exhaustion of low cost supply
options, and the impacts of climate change. These challenges can jointly compromise the reliability of
existing operations and hinder future development. The challenges will be most acute in countries
undergoing accelerated transformation and rapid economic growth, or those in which a large
proportion of the population lacks access to modern services such as in many countries (WWAP 2014).
The projected future increase of energy demand, coupled with the relative change in the mix of energy
production technologies will likely substantially increase water demand and impair water quality.
Global water withdrawals for energy are projected to rise by one-fifth through 2035, with
consumption escalating dramatically by 85%, driven by the shift towards higher efficiency power
plants with more advanced cooling systems (that reduce water withdrawals but increase
consumption) and increased production of biofuels. These changes will be more pronounced in Asia,
with withdrawals and consumption increasing by about 50% and 100%, respectively (International
Energy Agency 2012). Moreover, future water demands of irrigation, municipal, industrial and
environmental uses are also expected to increase (Wada et al. 2016). This is likely to worsen water
scarcity condition already prevalent in many regions and to enhance competition for water across
sectors and regions.
At the same time, climate change impacts portend a more constrained future in many regions around
the world. Climate change will likely increase temperature and evapotranspiration, and modify
precipitation patterns. Many regions around the world will suffer a decrease of water resources
availability and an increase of the occurrence and intensity of extreme events such as droughts and
heatwaves. Hydropower and thermal power, the dominant electricity-generating technologies in the
world, are especially vulnerable to increased water temperature, diminished water availability and
extreme events (Van Vliet et al. 2012). These changes in energy supply can subsequently rise energy
prices and limit access to energy.

4
Energy demand for water supply and treatment is also expected to increase, as a consequence of the
growing demand for water, driven by population and wealth growth, and the shrinking water
availability because of climate change impacts. Some of the proposed solutions to address water
scarcity embrace water transfer and trading between distant regions, groundwater pumping from
deeper aquifers, the use of unconventional water resources such as treated wastewater and
desalination, and the shift towards more-efficient irrigation technologies such as sprinkle and drip
systems. All these solutions require considerable amounts of energy with consequences for
greenhouse gas (GHG) emissions and climate change (WWAP 2014). For example, desalination uses
10-12 times more energy than standard drinking-water treatment (King et al. 2008). Meanwhile,
hydropower projects can improve both energy and water security, but have implications for both
terrestrial and aquatic ecosystems through flow alteration and habitat loss (Vörösmarty et al. 2010).
Bioenergy production can help mitigate climate change and alleviate energy security concerns, but
can have negative impacts on food production and prices, water use, and biodiversity, if not restricted
to non-irrigated marginal or abandoned cropland (Chaturvedi et al. 2013). Food production can be
expanded through cropland expansion and intensification (Schmitz et al. 2014), but these strategies
will have impacts on natural ecosystems and result in greater water and energy use, and impaired
water quality.
Despite these interdependencies, water, food, and energy policies are rarely integrated, and have
been so far addressed in isolation within sectoral boundaries. Decision makers often remain ill-
informed about the importance of integration and nexus thinking. The lack of integration in resource
assessments and policy-making leads to inconsistent strategies and inefficient use of resources. Part
of the reason for this is the geographic scales of concern to water, food, and energy supply managers
are usually quite different. Energy providers are rarely focused on regions as small as a city, or town,
or basin that water utility managers and farmers are responsible for. Water utility managers of local
municipalities and farmers are not likely to feel they need to take into account the production of
electricity or gasoline hundreds of kilometers away that they may eventually use (Cosgrove and Loucks
2015).
Sustainable management of water, food and energy resource systems should be conducted using
integrated approaches that are based on a broader systems perspective (Liu et al. 2015). These
approaches strive to identify the linkages and interactions among sectors to better understand the
synergies and trade-offs involved in meeting future resource demands of both human and natural
systems in a sustainable way. The ultimate objective is to identify solutions that capitalize on potential
synergies and co-benefits, minimize counterproductive policies and investments, and ensure that
humanity remains within planetary boundaries. Although a fully integrated model and assessment of
nexus feedbacks is beyond the scope of this assessment the question of how water constraints will
affect food production, energy production, access to water, and ecosystem health is of particular
interest.

5
Future s e arios - WFa“ Futures A al sis Approa h
3.1 Buildi g ater s e arios
Alternative scenarios are an important method for exploring uncertainty in future dimensions of
environmental conditions which are intrinsically interlinked socio-economic developments. WFaS
employs globally consistent scenario analysis as a strategic planning method for exploring consistent
and coherent alternative hypothetical futures ultimately aimed at developing robust pathways
towards water security. Different perspectives of integrative future developments support decision-
making by providing rational information as a sound basis for action. Good scenarios are ones that
explore the possible, not just the probably – providing a relevant challenge to the conventional
wisdom of their users, and helping them prepare for the major changes ahead (Magnuszewski et al.
2015).
Water domain futures are determined by a wide range of specific dimensions of nature (climate
change, land use, water resources, ecosystems), society (demography, governance, value & lifestyles),
and economy (water use for agriculture, households, energy, and manufacturing, with extents driven
by a combination of economic development and technology).
A key element of this study is to develop consistent qualitative global scenarios across sectors,
embedded in global narratives. To the extent possible they quantify future water resource potentials
vis à vis water demand and use. To aid in developing indicators for water security we develop and
include in the scenario analysis a hydro-economic classification of water challenges (see section 2.3).
We oadl defi e ate se u it as the people s a ilit to ope ith ate elated isks that potentially threaten their well-being.
In a quantitative analysis, based on
the scenarios, WFaS employs an
ensemble of three state of the art
Global Water Models (Wada et al.
2016) for which information about
both climate and socioeconomic
change is required to project future
water supply and demand. For the
sake of a consistent set of new
global water scenarios the WFaS
initiative coordinates its work with
other on-going scenario efforts in
the context of the
Intergovernmental Panel on
Climate Change (IPCC) 5th
Assessment Report (Moss et al.
2010). This includes the emission
scenarios of the Representative
Concentration Pathways (RCPs)
(van Vuuren et al. 2011), completed
in 2012 to provide input that is essential for climate modelers. The spatial and seasonal patterns of
future climate change estimated by climate models must be complemented by socioeconomic and
ecological data that the other climate change research groups, namely the integrated assessment
Figure 3-1: The shared socioeconomic pathways (SSPs) representing different
combinations of challenges to climate mitigation and adaptation.
Source: (O'Neill, et al., 2015)

6
modelers (IAM), and the impacts, adaptation, and vulnerability community need. In response to this
the climate change research community converged on new projections, termed Shared
Socioeconomic Pathways (SSPs), illustrated in Figure 3-1 (O'Neill et al. 2014, O'Neill et al. 2015). The
SSP storylines, already the result of a multi-year community effort across sectors, have in WFaS been
extended with relevant critical dimensions affecting water availability and use. Despite the potential
offered by globally consistent, integrated scenario analysis, very few assessments have yet used the
SSPs to assess the impacts of global change on water resources, e.g. Hanasaki et al. 2013, Arnell and
Lloyd-Hughes 2014.
A fi st WFa“ fast-t a k assess e t uilds o e isti g ua tifi atio s of li ate s e a ios2 based on
the RCPs from the Inter-Sectoral Impact Model Intercomparison Project (ISI-MIP) (Warszawski et al.
2014, Frieler et al. 2012). The rate of climate change is characterized by four RCPs. They define
pathways of different amounts of radiative forcing until 2100 ranging from RCP 2.6 to RCP 8.5 (see
Box 1). General Global Circulation Models (GCM) experiments investigate the climate response to the
RCPs. ISI-MIP applied climate change from five3 GCMs (Table 2-4) for the calculation of diverse climate
change impacts including results such as daily runoff from Global Hydrological Models (GHM).
For the IPCC 5th assessment report the research community has agreed on a new parallel process
(Moss et al. 2010) building on the concept that the four RCPs can be achieved by a diverse range of
socio-economic and technological development scenarios outlined in the five SSPs. This results in a
new scenario matrix architecture (van Vuuren et al. 2014) combining RCPs and SSPs. The research
community4 is currently performing Integrated Assessment Models (IAM) to explore conditions for
potential combinations of RCPs and SSPs that could develop in the real world.
In consultation with researchers studying feasible RCP-SSP combinations during the WFaS project
group meeting in October 2013 (WFaS 2013) and thereafter WFaS employs the following combinations
fo its fast-t a k s e a io assess e t:
Sustaina ilit uildi g o ““P togethe ith ‘CP .
Middle of the ‘oad ““P -‘CP .
‘egional ‘i alr ““P -‘CP .
Another rational for selection of the specific SSP-RCP combinations was that those represent the
higher bound of climate change impacts assuming continuation of current mitigation policies. In
December 2015 the international community 5 decided that the global goal will be less than a
temperature increase of 2˚C, hi h o espo ds losel to a ‘CP of . . If this ta get is ea hed, so e of the climate change impacts could be less than described in this paper. Other scenario studies to
date have used the combinations SSP1-RCP 2.6, SSP3-RCP 6.0 and SSP5-RCP 8.56 (Veldkamp et al. 2016
following Winsemius et al. 2015).
2 Distributed by the Coupled Model Intercomparison Project (CMIP), see http://cmip-pcmdi.llnl.gov/cmip5/ 3 The GCMs were selected because their results are bias-corrected and reported globally for a 0.5 by 0.5 decimal
degree grid (about 50x50 km grids) 4 See https://tntcat.iiasa.ac.at/SspDb/dsd?Action=htmlpage&page=about 5 http://unfccc.int/files/meetings/paris_nov_2015/application/pdf/paris_agreement_english_.pdf 6 Current insight suggests that RCP 8.5, i.e. the most extensive radiative forcing, is only feasible in combination
with SSP5. The two studies explored this combination as their third scenario.

7
3.2 Water e te ded “hared “o io-E o o i Path a s ““Ps
SSPs include both a qualitative component in the form of a narrative on global development and a
quantitative component that includes numerical pathways for certain variables that are particularly
useful to have in quantitative form for use in other studies. Box 2 provides an excerpt of the summary
SSP storylines. They include demography, economic development, human development, technology,
lifestyles, environment and natural resources, and policy and institutions. For a subset of SSP
elements, tables of qualitative assumptions were developed to describe the relative direction and
magnitude of changes in these elements.
Quantifications of individual variables for each SSP are an ongoing effort of the research community
with results available at the IIASA SSP database portal7. At present final projections for population and
economic development including demography (population by age, sex, and education), urbanization
and economic development (GDP) are available for all scenarios.
SSPs were developed by the climate change community with a focus of the key elements of climate
policy. However, the five SSPs were developed to offer the possibility for experimentation by a wide
a ge of esea he s fo e te di g the o igi al ““P i a ious di e sio s (O'Neill et al. 2015). WFaS
has responded to this by extending the SSP storylines (Appendix A) with water narratives for water
use developed in collaboration with a group of water planners from around the world and the
scientific consortia of WFaS. The qualitative assessment of water narratives for each SSP (Appendix B)
provided the basis for the quantification of selected variables required for the global water models
(see section 3.5).
7 https://tntcat.iiasa.ac.at/SspDb/dsd?Action=htmlpage&page=about#intro
Box 1: Representative Concentration Pathways (RCPs)
The Representative Concentration Pathways (RCPs) are named according to the target level of radiative forcing1 for the year
2100 (2.6, 4.5, 6.0, and 8.5 W/m2, respectively).
The radiative forcing estimates are based on the forcing of greenhouse gases and other forcing agents, and the forcing levels
are relative to pre-industrial values [(Moss et al. 2010), (van Vuuren et al. 2011)].
The RCPs include:
A itigatio s e a io leadi g to a e lo fo i g le el ‘CP . , hi h ai s to li it the i ease of glo al ea te pe atu e to less tha °C .
A sta ilizatio s e a io ‘CP . i hi h total adiati e fo i g is sta ilized efo e e plo e t of te h ologies a d st ategies fo edu i g g ee house gas e issio s.
A othe sta ilizatio s e a io ‘CP . i hi h total adiati e fo i g is sta ilized afte . Both ‘CP . a d . ai to li it the i ease of glo al ea te pe atu e to less tha °C .
A e high e issio s e a io ‘CP . hi h is ha a te ized soa i g g ee house gas e issio s o e ti e, leadi g to high g ee house gas o e t atio le els. Glo al ea te pe atu e i eases ea l °C .
1Radiative forcing is a measure of the influence a factor has in altering the balance of incoming and outgoing energy in the
Earth-atmosphere system and is an index of the importance of the factor as a potential climate change mechanism. In this
report radiative forcing values are for changes relative to preindustrial conditions defined at 1750 and are expressed in
Watts per square meter (W/m2) (IPCC 2007)

8
3.3 H dro-e o o i lassifi atio
The WFaS initiative develops global scenarios of water potentials and stressors, their
interdependencies across different water sectors (climate-water-food-energy-ecosystem nexus) and
across spatial scales. A global assessment is imperative owing to the increasing importance of global
drivers such as climate change, population growth and rapid urbanization, economic globalization or
safeguarding biodiversity, all of which interrelated with the water domain. Maintaining a global
perspective while providing necessary regional detail, which recognizes the current spatial diversity of
water-related challenges and possible future developments, is key for water scenario development.
However, applying different scenario assumptions at every location would produce unjustifiable
complexity and make results hard to interpret in a meaningful way. The quantitative scenario
assessment here goes beyond globally uniform assumptions of important scenario drivers by
developing a classification system for countries and watersheds describing different conditions
pertaining to water security, or its reverse, water challenges (Fischer et al. 2015). Countries or
watersheds facing similar water security challenges and capacities can then be assumed to experience
similar rates of change in development, although each will still have its own unique path based on its
own current development trends.
Box 2: Shared Socioeconomic Pathways (SSP)
SSP1: Sustainability – Taking the green road
“The world shifts gradually, but pervasively, toward a more sustainable path, emphasizing more inclusive development
that respects perceived environmental boundaries. Increasing evidence of and accounting for the social, cultural, and
economic costs of environmental degradation and inequality drive this shift. Management of the global commons slowly
improves, facilitated by increasingly effective and persistent cooperation and collaboration of local, national, and
international organizations and institutions, the private sector, and civil so iet …
SSP2: Middle of the road
“The world follows a path in which social, economic, and technological trends do not shift markedly from historical
patterns. Development and income growth proceeds unevenly, with some countries making relatively good progress
while others fall short of expectations. Most economies are politically stable. Globally connected markets function
imperfectly. Global and national institutions work toward but make slow progress in achieving sustainable development
goals, including improved living conditions and access to education, safe water, and health care. Technological
development proceeds but without fundamental breakthroughs ...
SSP3: Regional rivalry – A rocky road
“A resurgent nationalism, concerns about competitiveness and security, and regional conflicts push countries to
increasingly focus on domestic or, at most, regional issues. This trend is reinforced by the limited number of
comparatively weak global institutions, with uneven coordination and cooperation for addressing environmental and
other global concerns. Policies shift over time to become increasingly oriented toward national and regional security
issues, including barriers to trade, particularly in the energy resource and agricultural markets. Countries focus on
achieving energy and food security goals within their own regions at the expense of broader-based development, and in
several regions move toward more authoritarian forms of government with highly regulated economies. Investments in
education and technological development decline ...
Source: O'Neill et al. 2015

9
This requires developing a system of classification
for countries and watersheds describing different
conditions pertaining to water security (or its
reverse water challenges). The concept of water
security is complex to define because it has
different dimensions or facets. First, security needs
to be understood as a relative concept, i.e., an
i ala e et ee suppl a d de a d that varies according to local conditions. Second, water
security and water scarcity are fundamentally
dynamic. For example, water scarcity intensifies
with increasing demand by users and with the
decreasing quantity and quality of the resource. It
can further decrease when the right response
options are put in place. In this spirit, we follow
recently adopted frameworks for a risk-science
perspective, which define water security in terms
of so ieties adaptatio o opi g apa it (Grey et
al. 2013) to water related challenges, for example
freshwater variability (Hall et al. 2014).
For this purpose we define a hydro-economic classification consisting of two broad dimensions
representing
1. e o o i a d i stitutio al apa it to add ess ate halle ges -di e sio i Figu e -
2. ag itude a d o ple it of halle ges elated to the a age e t of a aila le ate esou es; i.e. h drologi halle ge/ o ple it -di e sio i Figu e -
As watersheds and their inherent water challenges extend beyond national boundaries the hydro-
economic classification should also be applicable to both the country level and the geographic entity
of watersheds. To be useful in WFaS the classification approach must meet three basic principles:
1. P odu e a s all u e of disti t lasses that diffe e tiate ou t ies i te s of u e t a d futu e ate halle ges a d the ea s the ha e to a t a d the u ge a d p io ities the a e likel to assig to fi di g ate solutio s;
2. Use a ia les/i di ato s that a e ot o l a aila le fo past ea s ut a also e o puted fo futu e pe iods a d s e a ios;
3. Appl a app oa h that is fle i le, t a spa e t a d a efi ed/tailo ed to efle t stakeholde p io ities a d eeds.
For the classification, each major dimension is measured by a normalized composite index, computed
from a set of relevant sub-indicators (see Fischer et al. 2015). In this way countries/regions will be
located in a two-dimensional space representing different human-natural water development
challenges and levels of water security. The selection of indicators for each dimension has been
extensively discussed in the WFaS consortium including a stakeholder meeting in the context of the
WFaS Scenario Focus Group (Pound et al. 2013, Magnuszewski et al. 2015).
Figure 3-2: Conceptual framework for allocation of hydro-
economic classification to four quadrants of water
security

10
Hydrologic complexity
For the X-dimension, hydrologic complexity, four indicators of water challenge are used:
(i) Total rene a le ater resour es per apita i /pe so / ea as a easu e fo ate a aila ilit ,
(ii) ‘unoff aria ilit e p essed the oeffi ie t of a iatio of si ulated o thl u off fo a - ea pe iod sho i g oth i te - a d i t a-a ual a ia ilit of ate esou es,
(iii) The atio of a ual ate ithd a al to total e e a le ate esou es s ala f a tio as a p o fo elati e intensit of ater use,
(iv) The depe de atio, o the sha e of e te al f o outside atio al ou da ies to total e e a le ate esou es as a easu e of the dependen of e ternal ater resour es.
Data sou es used i the Fast-t a k a al sis i lude the AQUA“TAT data ase of the UN FAO a ia le i, iii and iv) and a model-ensemble of six hydrological models calculated from ISI-MIP (Warszawski et
al. 2014). All variables can be computed for future periods using hydrological models based on
selected climate change scenarios.
Economic / institutional coping capacity
For the y-di e sio , e e sele ted o e i di ato , a el GDP pe aput (in constant PPP dollars per
caput) as a measure of economic strength and financial resources available for investing in risk
management. Country level GDP per capita is readily available for future periods in the SSP database.
Several additional indicators have been discussed and were explored for potential inclusion in a
compound indicator to proxy economic-institutional coping capacity.
The World Bank publishes annual data in the context of The Worldwide Governance Indicators (WGI)
project 8 of the World Bank reports annually on six broad dimensions of governance including
composite indicators for:
Voi e a d a ou ta ilit
Politi al sta ilit a d a se e of iole e
Go e e t effe ti e ess
‘egulato ualit
‘ule of la
Co t ol of o uptio
The WGI relies exclusively on perception-based governance data sources drawing on data sources
from the private sector (e.g. Gallup World Poll, Global Competitiveness Report), non-governmental
organizations (e.g. Global Integrity, Reporters Without Borders), and selected public sector
organizations (e.g. CPIA9 of the World Bank, EBRD10 Transition Report).
Other potential indicators include:
i) the Hu a De elop e t I di ato HDI f o the U ited Natio s De elop e t P og a a d its e e t e te sio the I e ualit -adjusted HDI
ii) the Co uptio Pe eptio i de CPI f o T a spa e I te atio al , a o -p ofit, o -go e e tal o ga izatio
iii) the U i e sit of Not e Da e Glo al Adaptatio I de ND-GAIN11 su a izes a ou t s ul e a ilit to li ate ha ge a d othe glo al halle ges i o i atio ith its eadi ess
to i p o e esilie e. I pa ti ula the latte i ludes a fe i di ato s elated to e o o i -i stitutio al opi g apa it
iv) the F agile “tate I de F“I12 o p isi g of i di ato s o d i e s of state failu e pu lished si e the U ited “tates thi k ta k ,the Fu d fo Pea e a d the agazi e Foreign Poli .
8 See www.govindicators.org 9 Country Policy and Institutional Assessment 10 European Bank for Reconstruction and Development 11 See index.gain.org 12 See http://fsi.fundforpeace.org/

11
The level of education is a more general indicator that has been suggested to proxy socio-economic
coping capacity, for example in the context of climate change (Lutz et al. 2014) and natural disasters
(Butz et al. 2014).
The reservoir capacity per capita proxies mitigation potential to a key element of water challenges,
climatic variability causing both floods and droughts. The Global Reservoirs and Dams Database
(GRanD13) records data for 6862 reservoirs (Lehner et al. 2011).
In the context of scenario analysis it is important to note that only for GDP per capita and education
future projections have been calculated in the SSP database. For all other potential indicators expert
driven assumptions depending on scenario narrative would be required for future estimates.
The WFaS core group (including experienced experts on governance) initially selected CPI together
with GDP per capita for representation of economic-institutional coping capacity. However we were
aware that as the other indicators discussed above there is generally a strong correlation between
GDP per capita and the CPI. Thus CPI would hardly impact scenario outcomes.
A high-level stakeholder meeting in the WFaS Scenario Focus Group recommended to simplify the Y-
Axes to the indicator per capita GDP only. GDP was felt to be most recognizable and understandable,
representative of economic strength and the financial resources available for investing in risk
management. The CPI was perceived as not adding any additional value, its meaning may be
ambiguous across nations, and data sources are criticized as perception-based and subjective only.
The stakeholders further recommended, while selecting only GDP per capita for the Y-Axes, it was
encouraged to explore the potential of adding a third dimension to the 2-dimensional space of the
Hydro-Economic Classification scheme.
Agai st this a kg ou d WFa“ sele ted fo its fast-t a k ased o the follo i g o side atio s. GDP per capita has been projected into the future in the SSP scenarios. Globally for all countries there is a
strong positive correlation between GDP per capita and many of the other potential indicators
potentially contributing to institutional capacity (e.g. education, CPI, reservoir capacity per capita,
WGI). WFaS thus by using per capita GDP as proxy for a broader socio-economic perspective (i.e.
economic and institutional coping capacity) remains using an existing and well-known path. We argue
changing the indicator is not justified at this point in time because: First, the theoretical underpinning
and narrative to explain the other indicators in terms of positive or negative effects on institutional
effectiveness and potential to cope with risks is weak. Second, there are major differences of opinion
among experts on the definition of many of the above discussed indicators, e.g. corruption, fragile
state, regulatory quality. Finally, there is a lack of broad stakeholder agreement on the usefulness and
importance of other possible indicators, and on the relative weightings that they should be given if
combined in an index.
In conclusion, the WFaS consortium including the stakeholders perceived the selected variables for
the X-dimension as proxy for hydrologic complexity as generally comprehensive and useful. They also
recognized the importance of an appropriate indicator on the Y-di e sio to p o a ou t s / ate shed s e o o i a d i stitutio al opi g apa it to i ease esilie e agai st halle ges
arising from high levels of hydrological complexity. When hydrology is complex undoubtedly access to
investments is a prerequisite for building resilience. Depending on location-specific circumstances a
combination of infrastructure (e.g. reservoirs), insurance (e.g. against drought losses), technology (e.g.
desalination, improved irrigation schemes) and monitoring (e.g. for flood warning), all require initial
investments. Yet, institutions, management and governance are crucial for making resilience effective
13 See http://www.gwsp.org/products/grand-database.html

12
or prioritize often scarce financial resources. For example, even when reservoirs and monitoring are
in place, optimal governance of up-stream and down-stream management is essential in case of
flooding. Other inherently governance dependent resilience options include transparency and data
sharing (both ground- and surface water), monitoring of human water use across sectors (agriculture,
households and industry), legal aspects of access to water, and establishing supra-national watershed
commissions.
3.4 “u ar of s e ario assu ptio s for WFa“ fast-tra k
Following the procedures described above the water scenario assessment framework extends the SSP
storylines with water narratives developed in collaboration with a group of water planners from
around the world and the scientific consortia of WFaS. The framework makes use of available results
of climate projections14 based on the RCPs and socio-economic developments based on the SSPs to
develop a set of quantitative water projections. These climate and socio-economic pathways are being
analyzed in a coordinated multi-model assessment process involving sector and integrated
assessment models, water demand models and different global hydrological models.
While the socio-economic variables of the SSPs can be best quantified at spatial scale of countries,
climate change variables including runoff require calculations at the grid-cell level. We employ
estimates of monthly runoff using a model ensemble of six hydrological models developed in the ISI-
MIP project. Consistent with first estimates of Integrated Assessment Models (IAM) community the
WFa“ fast-t a k ate s e a ios u e tl uild o th ee ‘CP-SSP combinations (SSP1 and RCP4.5,
SSP2 and RCP6.0, SSP3 and RCP6.0) (see above 2.1). These scenarios cover the diagonal in SSP scenario
matrix in Figure 3-1, and are therefore a reasonably good representation of the scenario space.
Table 3-1 presents a comprehensive overview of the important quantitative scenario assumptions and
u de l i g data sou es applied i the fast-t a k ulti-model water assessment. Scenario
assumptions are generally deployed at the country level for each scenario. Assumptions for
technological and structural changes consider, in addition to the respective SSP scenario narrative,
14 Distributed by the Coupled Model Intercomparison Project (CMIP), see http://cmip-pcmdi.llnl.gov/cmip5/
Table 3-1: Assu ptio s applied i the WFa“ fast-t a k s e a io u s, deplo ed at ou t le el
WFaS fast tra k S e ario SSP1
Sustainability
SSP2
Middle of the Road
SSP3
Regional Rivalry
Population SSP1 (IIASA-VIC v9) SSP2 (IIASA-VIC v9) SSP3 (IIASA-VIC v9)
Urban population SSP1 (NCAR) SSP2 (NCAR) SSP3 (NCAR)
GDP SSP1 (OECD1 v9) SSP2 (OECD v9) SSP3 (OECD v9)
Value added in manufacturing2 scenario
related to GEO-4
SSP1 & UNEP-GEO4
“ustai a ilit Fi st SSP2 & UNEP-GEO4
Ma kets Fi st
SSP3 & UNEP-GEO4
“e u it Fi st
Energy consumption (KTOE)3 SSP1-RCP4.5
(Message)
SSP2-RCP6.0
(Message)
SSP1-RCP6.0
(Message)
Electricity production (GWh)3 SSP1-RCP4.5
(Message)
SSP2-RCP6.0
(Message)
SSP3-RCP6.0
(Message)
1 OECD Env-Growth Model. 2 This is only required for WaterGAP. The share of manufacturing gross value added in total GDP is taken from
the UNEP GEO4 Driver Scenarios distributed by International Futures (pardee.du.edu). 3 Preliminary results (October 2013) from IIASA –
MESSAGE-MACRO model consistent with population and GDP projections for each SSP. The MESSAGE model (Model for Energy Supply
Strategy Alternatives and their General Environmental Impact) generated results for 23 regions, which were disaggregated to country level
using the distribution of population and GDP from the SSP database hosted at IIASA

13
ou t s e posu e to hydrological challenges and economic-institutional coping capacity, i.e. its
position in the above described HE-classification (Table 3-2).
Thus scenario assumptions, such as rates of technological and structural change rates, have then been
made for countries, or basins, within the same H-E class. The Industrial sector comprises energy and
manufacturing. Positive technological change improves water use efficiency and thereby decreases
water use intensity in the industrial and domestic water use sectors. Annual water use efficiency
change rates are estimated for each combination of scenario and H-E class, using a range of historically
Table 3-2: Scenario assumptions for technology and structural change in the industry and domestic sector
1 The HE classification calculates for each country a compound indicator (values 0–1) for socioeconomic capacity to cope with water-
related risks (economic-institutional capacity) and their exposure to hydrologic challenges and complexity (hydrological complexity). In
this way each country was located in a two-dimensional space and grouped into four HE classes termed HE-1 to HE-4. 2 When economies
have sufficient investment potential (HE-2 and HE-3) or the societal paradigm strives for resource-efficient economies (SSP1) we assume
power plants to be replaced after a service life of 40 years by plants with modern water-saving tower-cooled technologies.3 Only in SSP1
(Sustainability Scenario), we assume by 2050 a 20% reduction in domestic water use intensity due to behavioral change

14
observed technological change rates (Flörke et al. 2013). Technological change rates are assumed to
be similar between the industrial and domestic sectors.
Structural changes in manufacturing lead to water use changes according to the structure of a
ou t s e o o . Although the WFa“ fast-t a k does ot e pli itl o side st u tu al ha ge i the manufacturing sector due to a lack of information on sector-specific GDP (i.e. share in agriculture,
manufacturing, service), it is at least partly reflected in the results because Gross Value Added (GVA)
in the manufacturing sector is an input variable for one of the employed water models, namely
WaterGAP (Table 3.5). Structural change in the electricity sector is represented by the replacement
rates of power plants with more efficient systems, since the vast majority of water use in this sector
is for cooling at thermal power plants. Change in the domestic water use sector is indicated by the
number of people and behavior changes. Structural change in the domestic sector is indicated by a
20% reduction in domestic water use intensity by 2050 for SSP1 due to behavioral changes.
Consistent spatial land use and agricultural scenarios, indicating areas of new or increased irrigation
and reflecting socio-economic change are now being developed using the FAO/ IIASA Global-Agro-
Ecological Zones (GAEZ) modeling system (Fischer et al. 2007, Fischer et al. 2012). They provide future
crop area distribution and improvement of irrigation efficiency. More details on the entire process of
scenario development is presented elsewhere (Tramberend et al. 2015).
3.5 Multi- odel assess e t
This initiative has developed a spatial-temporal quantitative assessment of future water resources
availability based on a multi-model assessment framework. The multi-model approach is becoming
widely used in future assessments because ensemble averages provide more robust projections than
individual models and avoid drawing conclusions from potential individual outliers (Dankers et al.
2014, Schewe et al. 2014). The approach is used to better understand the uncertainty and limitations
of the modeling, while providing a degree of confidence in the results, where many models are in
agreement. The set of models used provides estimates of water supply and demand with selected
combinations of future scenarios globally at 0.5°x 0.5° spatial resolution (approx. 50km x 50km at the
equator). The emission scenarios of the Representative Concentration Pathways (RCPs) (van Vuuren
et al. 2011) are applied as climate scenarios, and the socio-economic assumptions are designed to be
consistent with the Shared Socioeconomic Pathways (SSPs) (O'Neill et al. 2014). Associated
quantifications of developments in other sectors, such as energy and agriculture, are provided by
sector models and integrated assessment models working with the same SSPs.
Results presented in this report are based primarily on three leading global hydrological models
(GHMs) [H08 (Hanasaki et al. 2013), WaterGAP (Flörke et al. 2013, Schmied et al. 2014), and PCR-
GLOBWB (Van Beek et al. 2011, Wada et al. 2014)] which can estimate both water supply and demand
for the agricultural, industrial (including energy) and domestic sectors. Table 3.3 below details the
models used in this quantification of available water supply and demand. These GHMs were forced
with five general circulation models (GCMs) which provide meteorological conditions (Table 3.4). The
atmospheric forcing data set was compiled and made available by the Inter-Sectoral Impact Model
Intercomparison Project (Warszawski et al. 2014). In total, this study made use of 15 ensemble
members (five GCMs x three GHMs) of projections.
Although all GHMs use the same input data for the natural hydrological part (i.e. water supply
estimation), they require different input for their estimation of water demand because of the diversity
of methods applied to reflect such a diverse socio-economic development process. Table 3.5 and
Table 3.6 present drivers and parameters for estimation of industrial and domestic water demand,

15
respectively, in the models used. Each of the three applies different parameterizations and uses
different input data for the future period. One major difference among GHMs, for example, is the
representation of water use in the industrial sector. H08 and PCR-GLOBWB determine water use for
an aggregate industry sector, but WaterGAP separates water use for thermal electricity production
and the manufacturing industry. Furthermore, while H08 downscales national-level representative
values into grid-scale according to population distributions, PCR-GLOBWB and WaterGAP downscale
with urban area data. In this analysis, for the purpose of consistency, water demands estimated by
H08 were re-downscaled using the same urban area information as the other models.
Table 3-3: Global Hydrological Models (GHM) used in this study
GHM Resolution Institute Nation
WaterGAP 0.5°x0.5° University of Kassel Germany
H08 0.5°x0.5° NIES Japan
PCR-GLOBWB 0.5°x0.5° University of Utrecht The Netherlands
Table 3-4: General Circulation Models (GCM) used in this study
GCM Resolution Institute Nation
HadGem2-ES 192 x 145 Met Office Hadley Centre UK
IPSL-CM5A-LR 96 x 96° Institut Pierre-Simon Laplace France
GFDL-ESM2M 144 x 90 NOAA Geophysical Fluid Dynamics Laboratory United States
MIROC-ESM-CHEM Gaussian 128 x 64 JAMSTEC, AORI, University of Tokyo, NIES Japan
NorESM1-M 144 x 96 Norwegian Climate Centre Norway
Table 3-5: Drivers and parameter for estimation of industrial water demand
Manufacture water demand Thermal electricity production water demand
GHM Drivers Parameter Drivers Parameter
WaterGAP Manufacturing gross
value added (GVA)
Manufacturing
structural WU
intensity1
Thermal electricity production WW intensity1
Industrial water demand
H08 Electricity production Industrial water intensity2
PCR-GLOBWB GDP
Electricity production
Energy consumption
Household consumption
Industrial water consumption2 1 Data from national statistics 2 Data from AQUASTAT
Base year: 2005
Table 3-6: Drivers and parameter for estimation of domestic water demand
Domestic water demand
GHM Drivers Parameter
WaterGAP National population
GDP per capita
Population density
Domestic water intensity1 1 Data from national statistics 2 Data from AQUASTAT
Base year: 2005
H08 Population Municipal water intensity2
PCR-GLOBWB GDP
Electricity production
Energy consumption
Household consumption
Population density
Per capita domestic water use
WaterGAP:
Industrial WD = Manufacture WD +
Thermal electricity production WD

16
3.6 Food a d agri ulture odelli g fra e ork
In the long run, the increase of demand for agricultural products is largely driven by population and
economic growth, both foremost occurring in developing countries. It has become increasingly
complex and challenging to achieve food security under the impact of rapidly rising population
numbers, fast economic growth, changing consumption patterns, volatile international trade, growing
demand for non-food uses such as biofuels, and the impacts of climate variability and changes.
Resources needed to meet future food demand will also depend on future food preferences, in
particular the future levels of meat consumption. Increasing pressures on land in the last decades have
been the consequence and must be mitigated, where possible, through increased land use intensity
and more efficient land management.
Economic growth and food security have been mutually reinforcing factors throughout the history of
development. Rising per capita incomes and functioning markets foster improved household food
security, which can enhance economic growth through better social stability and a better health status
of the labor force. However, earlier experiences suggest that food insecurity cannot be fully eradicated
by economic growth alone. In the recent decades, strong growth played a crucial role in the decline of
poverty and undernourishment, but food insecurity still persists in many countries and regions around
the world. This means that for achieving food security raising food production is a necessary but not
sufficient condition. In addition to enhancing the resource base and increasing land productivity,
achieving food security also entails ensuring equitable distribution of food, particularly to food-deficit
countries and people, reducing distortions and barriers in global food markets, and avoiding
unnecessary wastage of food at all levels from field to fork.
Figure 3-3: Framework for ecological-economic world food system analysis
Developmentscenario
Climate impactresponse relations
Production Demand
Trade
GlobalFood-Feed-
Biofuel System
World Market
Climatemodel
11
22
33
44
55
66
Agro-ecological suitability and land productivity
Spatial distribution of land use
Developmentscenario
Climate impactresponse relations
Production Demand
Trade
GlobalFood-Feed-
Biofuel System
Production Demand
Trade
GlobalFood-Feed-
Biofuel System
World Market
Climatemodel
11
22
33
44
55
66
Agro-ecological suitability and land productivity
Spatial distribution of land use

17
3.6.1 The odeli g fra e ork
The analysis is based on a state-of-the-art ecological-economic modeling approach. The scenario-
based quantified findings of the study rely on a modeling framework which includes as components,
the FAO/IIASA Agro-ecological zone model (AEZ) and the IIASA world food system model (WFS). The
modeling framework encompasses climate scenarios, agro-ecological zoning information (Fischer et
al. 2012), demographic and socio-economic drivers, as well as production, consumption and world
food trade dynamics (Fischer 2011, Fischer et al. 2009, Fischer et al. 2007).
This modeling framework comprises six main elements, as sketched in Figure 3-3:
1. A sto li e a d ua tified a o-d i e s of de elop e t, he e hose f o a o g the “ha ed “o io-e o o i Path a s see elo , is sele ted to i fo the o ld food s ste odel of de og aphi ha ges i ea h egio a d of p oje ted e o o i g o th i the o -ag i ultu al se to s. It also p o ides sto li e assu ptio s ha a te izi g i oad te s the i te atio al setti g e.g. t ade li e alizatio ; i te atio al ig atio , ega di g te h ologi al p og ess, a d the p io ities of la d use egulatio . I additio , a set of ‘ep ese tati e Co e t atio Path a s
ua tifies sele ted e i o e tal a ia les, e.g. g ee house gas e issio s a d at osphe i o e t atio s of CO .
2. The e issio s path a asso iated ith the hose de elop e t s e a io is used to sele t a o g a aila le pu lished outputs of si ulatio e pe i e ts ith ge e al i ulatio odels GCMs to defi e futu e li ate s e a ios fo odeli g of ag i ultu e p odu tio s ste s a d ate esou es.
3. The ag o-e ologi al zo es ethod takes as i put a li ate s e a io a d esti ates o a spatial g id of ′ ′ latitude/lo gitude the likel ag o o i i pa ts of li ate ha ge i te s of soil
oistu e o ditio s, attai a le ai -fed a d i igated ops ields, a d i igatio ate e ui e e ts of ops.
4. Esti ated spatial li ate ha ge i pa ts o ields a e i o po ated i to the pa a ete izatio of the atio al op p odu tio odules of the o ld food s ste odel.
5. The glo al ge e al e uili iu o ld food s ste odel is used – i fo ed the de elop e t sto li e a d esti ated li ate ha ge ield i pa ts – to p odu e i te all o siste t o ld food s ste s e a ios po t a i g ea h espe ti e de elop e t path a . The si ulatio s e e a ied out o a ea l asis f o to .
6. I a fi al step, the esults of the o ld food s ste si ulatio s a e do s aled to the spatial grid of the resource database for spatial attribution of physical resource use, quantification of
land cover changes and spatial cropping patterns.
3.6.2 ““P s e ario i ple e tatio
In the analysis presented here, we make use of a new set of scenarios that was developed by the
research community to harmonize and provide a common context for climate change impact,
mitigation and adaptation assessments (Moss et al. 2010). A range of possible future socio-economic
conditions are described in the Shared-Socio-economic Pathways (SSP) (O'Neill et al. 2015). On the
most fundamental level, each SSP is described by a narrative. The SSP storylines describe socio-
economic developments without the assumption of climate policies and climate change. However, in
parallel possible future levels of climate change were explored through the development of different
representative concentration pathways (van Vuuren et al. 2011). For implementation in this study, the
de elop e t path a s ““P Middle of the road a d ““P Regional rivalry e e assu ed to e consistent with emission trajectories and climate outcomes of the RCP 6.0, and the SSP1 scenario
Sustainability applies the at osphe i o ditio s of ‘CP . .
18
Here we provide a brief summary of the salient features that characterize different SSPs and we
indicate some implications this may have for the food and agricultural sector, the land use and for
associated irrigation water withdrawal (Figure 3-3).
SSP1 –Sustainability scenario: The world shifts gradually toward a more sustainable path that respects
perceived environmental boundaries. This development pathway envisages: Relatively low population
growth and an emphasis on education; effective institutions; rapid technological change and improved
resource use efficiency; liberalization of markets; risk reduction and sharing mechanisms.
For scenario implementation, these general tendencies of development in the SSP1 storyline were
interpreted to have the following specific agriculture/irrigation related implications:
I p o ed ag i ultu al p odu ti it th ough o e apid edu tio o pa ed to efe e e te h ologi al assu ptio s o ields of p e aili g ield gaps to a d e i o e tall sustai a le a d ad a ed te h olog ield le els
P og essi e eli i atio of a ie s a d disto tio s i i te atio al t ade of ag i ultu al p odu ts
P og ess to a ds effe ti e la d use egulatio espe iall fo p e e ti g defo estatio aused e pa sio of opla d
E fo e e t of legall p ote ted o se atio a eas
La ge i p o e e ts of i igatio ate use effi ie he e possi le
‘elia le ate i f ast u tu e a d ate suppl
I p o i g ut itio ith e i o e tall e ig diets ith lo e pe apita o su ptio of li esto k p odu ts this last assu ptio as ot i luded i the ““P efe e e i ple e tatio ut
ill e assessed i a sepa ate s e a io a ia t .
SSP2 - Middle of the Road scenario: In the SSP2 world the development is progressing along past trends
and paradigms. Main characteristics of this pathway include: Population growth continues at slowing
rates and levels off in second half of century; markets are globally connected but they function
imperfectly; somewhat slow progress in achieving development goals of education, safe water, and
health care; environmental systems experience further degradation; barriers to enter markets are
reduced only slowly; significant heterogeneities exist within and across countries. The SSP2 World is
characterized by dynamics similar to historical developments. For scenario implementation this means
continuation of past agricultural growth paths and policies, continued protection of national
agricultural sectors, and further environmental damages caused by agriculture, and includes:
P og ess of ag i ultu al p odu ti it i de elopi g ou t ies as po t a ed i FAO pe spe ti e stud Wo ld Ag i ultu e: To a ds / FAO,
I easi g pe apita o su ptio of li esto k p odu ts ith g o i g pe apita i o es
Ba ie s a d disto tio s i i te atio al t ade of ag i ultu al p odu ts a e edu ed o l slo l
“o e i p o e e ts of ate use effi ie , ut o l li ited ad a es i lo -i o e ou t ies
“o e edu tio of food i se u it due to t i kle do of e o o i de elop e t Food a d ate i se u it e ai as p o le s i so e a eas of lo -i o e ou t ies
No effe ti e easu es a d p ote tio to p e e t defo estatio due to opla d e pa sio
SSP3 - Regional Rivalry scenario: The SSP3 storyline portrays a pathway where the world development
is stagnating. Some key characteristics of SSP3 include: Growing concerns about globalization and
focus on national/regional issues and interests; population growth is low in developed countries, but
continues at high rates in developing countries; overall a large increase of world population and slow
economic growth combine to result in poor progress in achieving development goals of education,
safe water, health care; global governance and institutions are weak; weak institutions contribute to

19
slow development; markets are protected and highly regulated; low priority is given for addressing
environmental problems and serious degradation of environmental systems occurs in some regions;
low investment in education and technology development; altogether this causes large disparities
within and across countries.
Development in the SSP3 World leads to manifold problems in food and agriculture, characterized by:
Poo p og ess ith ag i ultu al p odu ti it i p o e e ts i lo -i o e ou t ies due to la k of i est e t a d edu atio fo ield gap edu tio
G o i g p ote tio of atio al ag i ultu al se to s a d i easi g ag i ultu al t ade a ie s
Lo p io it to halt e i o e tal deg adatio aused ag i ultu e e osio , defo estatio , poo ut ie t a age e t, ate pollutio a d e ploitatio
Poo la d use egulatio a d o ti ued defo estatio of t opi al ai -fo ests
O l odest i p o e e ts of i igatio ate use effi ie
Pe siste t o e -e ploitatio of g ou d ate a uife s
U elia le ate a d e e g suppl fo ag i ultu al p odu e s
Food a d ate i se u it pe sist as ajo p o le s i lo -i o e ou t ies
High populatio g o th a d i suffi ie t de elop e t lea e ehi d highl ul e a le hu a a d e i o e tal s ste s
The characteristics of the three development pathways and the main assumptions used in the
implementation of the scenario simulations are summarized in Table 3-7. The sustainability scenario
SSP1 achieves land productivity improvements exceeding those in SSP2.
Table 3-7: Overview on assumptions for food and agriculture scenario simulations
SSP1
Sustainability
SSP2
Middle of the road
SSP3
Regional rivalry
Yield growth Faster than medium Medium Slower than medium
Irrigation share Above medium Medium Below medium
Trade liberalization Full Incomplete Constrained
Land use change Strong regulation Some regulation Deforestation allowed
Protected areas Fully enforced Fair enforcement Limited enforcement
Lowest technology advances and productivity gains materialize in SSP3. These assumptions were
implemented regarding crop yield increases, changes in cropping intensity (i.e. multi-cropping), and
concerning the share of irrigated land in total cropland.
As to institutional factors affecting the food and agriculture sector, it was assumed that agricultural
protection measures would be fully eliminated by 2040 in SSP1 and would be reduced, but incomplete
and at a slower pace, in SSP2. Protection measures persist in SSP3 with only small reductions.
Concerning land use change regulation it was assumed that legally protected conservation areas
would be fully enforced in SSP1 and some leakages of land conversion would be tolerated in SSP3.
Also, there is strong regulation and concern to prevent deforestation by agricultural land conversion;
yet, some deforestation still takes place due to urban development or lack of alternatives. In SSP3,
land regulation is assumed to be weak and deforestation for cropland expansion notably in Africa and
Latin America continues.

20
3.7 U ertai t of ater suppl a d de a d
Available surface water resource
This analysis applies a multi-model
approach with 5 GCMs and 3 GHMs, for a
total of 15 ensemble members. Model
biases are inevitable in meteorology and
hydrology. Thus we use a multi-model
approach for greater confidence in model
results and to estimate uncertainty due to
model bias. Figure 3-4 shows as example
time series of precipitation for each region
based on 5 GCMs (a.) and runoff simulated
by 15 ensemble members (5 GCMs x 3
GHMs) (b.). Light colors illustrate
uncertainty ranges, and solid lines are
ensemble means. Although showing the
uncertainty complicates the message, it is
informative to show that sometimes
significant uncertainty exists compared to
the trend from the whole ensemble.
Water demand
The results produced from our first global
water use model intercomparison showed
a remarkable difference among the three
global water models (H08, PCR-GLOBWB,
and WaterGAP) used i the WFa“ fast-
t a k a al sis. Figure 3-5 shows three
kinds of water demand (agricultural,
industrial and domestic) for China. Each
model presents three water scenarios,
respectively. Although assumptions on
socio-economic, technological and
structural change were harmonized,
ensemble projections of water use for the
first half of the 21st century showed large
variability among the models. The spread
was much larger in the industrial sector
compared to the domestic sector. Due to
lack of consistent databases of the
quantities, qualities, and locations of
water demands over time and of the
water-related technologies applied, the
models use simplified approaches for
estimating water demand of each sector.
The approaches used vary as each model
Figure 3-4: Long term trend under Middle of the Road scenario:
a) precipitation b) runoff
Figure 3-5: Multi-GHMs comparison of each water demand
example of India and China
(a) (b)
21
tries to balance the relative unavailability of data with the need for reasonable scenario projections.
Although there is a high degree of variability across models and scenarios, almost all projections
indicate consistently increasing trends in future industrial and domestic water uses. Despite potential
model and data limitations, the WFaS initiative advances an important step beyond earlier work by
attempting to account more realistically for the nature of human water use behavior in the 21st
century and identifying associated uncertainties. Results given in this report are ensemble means;
using ensemble means works well to detect long term and relatively large trends.

22
Glo al Results
4.1 “o io E o o i s
Population and economic development are key drivers for the estimation of water demand presented
in this study (section 4.5). Socio-economic development also bears an important effect on water
availability (section 4.4) as they determine GHG emission scenarios, a major driver for climate change
projections.
4.1.1 Populatio
Applying the methods of multi-dimensional mathematical demography (KC and Lutz 2014) projected
national populations based on alternative assumptions on future fertility, mortality, migrations and
educational transitions that correspond to the five SSPs. In terms of total world population size the
trajectories resulting from the five SSPs stay very close to each other until around 2030. By the middle
of the century already a visible differentiation appears resulting in a global population by 2100
between 6.9 illio i the lo est s e a io ““P Sustainability and 12.6 billion in the highest scenario
““P Regional ‘i alr . Note that populatio i the “ustai a ilit s e a ios is elo the current level of 7.3 billio people. I the Middle of the ‘oad scenario population peaks in the 2070s
and then declines to just below 9 billion by 2100. The difference between the scenarios is primarily
due to developments in Africa and Asia. In contrast population development in the Americas, Europe
and Oceania are comparatively similar across the scenarios (Figure 4-1).
Figure 4-1: Population development until 2100, by continent and scenario
Sub-regional development for Africa, Asia and Europe are presented in Figure 4- fo the Middle of
the ‘oad scenario. The maps in Figure 4-3 highlight the change in population between 2010 and 2050
on a country level.
Figure 4-2: Population development i the Middle of the ‘oad scenario for the sub-regions of Africa, Asia, and Europe
Africa: I the ‘i al s e a io Af i a s populatio dou les du i g less tha t o ge e atio s less tha 40 years) from 1.0 billion in 2010 reaching 2.0 billion in the beginning of the 2040s. By 2100 the current
populatio has al ost uad upled ea hi g . illio o % of glo al populatio . Af i a s high populatio g o th i ‘i al is losel li ked to the la k of i p o e e ts i edu atio o e ti e,
0
2000
4000
6000
8000
10000
12000
2010 2020 2030 2040 2050 2060 2070 2080 2090 2100
Africa Asia
North and Central America South America
Europe Oceania
0
2000
4000
6000
8000
10000
12000
2010 2020 2030 2040 2050 2060 2070 2080 2090 2100
Africa Asia
North and Central America South America
Europe Oceania
0
2000
4000
6000
8000
10000
12000
2010 2020 2030 2040 2050 2060 2070 2080 2090 2100
Africa Asia
North and Central America South America
Europe Oceania
Population - Sustainability Population - Middle of the Road Population - RivalryMio of
people
Mio of
people
Mio of
people
0
500
1000
1500
2000
2500
2010 2020 2030 2040 2050 2060 2070 2080 2090 2100
Northern Africa Western Africa Middle Africa
Eastern Africa Southern Africa
0
1000
2000
3000
4000
5000
2010 2020 2030 2040 2050 2060 2070 2080 2090 2100
Western Asia Southern Asia
Central Asia Eastern Asia
South-Eastern Asia
0
200
400
600
800
2010 2020 2030 2040 2050 2060 2070 2080 2090 2100
Western Europe Southern Europe
Northern Europe Eastern Europe
Europe - Population - Middle of the RoadAsia - Population - Middle of the RoadAfrica - Population- Middle of the RoadMio of
people
Mio of
peopleMio of
people

23
especially the low percentage of female, aged 20-39, with secondary and tertiary education15. Af i a s population growth is also sig ifi a t i the Middle of the ‘oad scenario with population doubling by
2050 and reaching 2.6 billion in 2100 (Figure 4-2, left and Table 4-1, upper). In this scenario countries
with a population over 100 million in 2050 include Nigeria (372 mio), followed by Ethiopia (159 mio),
DR Congo (146 mio), Egypt (125 mio) and UR Tanzania (102 io . E e i the “ustai a ilit s e a io Afri a s populatio i eases o e illio people + % u til he g o th ates e o e more moderate and peak at 1.9 billion in 2080.
Figure 4-3: Population – Middle of the road scenario
Top: population 2010. Middle: population 2050. Bottom: change rate of population [%] compared to 2010
Asia: Asia today is home to 4.1 billion people, 60% of global population. A continuous population
i ease is o l p oje ted i the ‘i al s e a io ea hi g as much as 6.6 billion in 2100. In the
“ustai a ilit a d Middle of the ‘oad s e a io Asia s populatio peaks i the s a d s ith about 4.7 and 5.1 billion people respectively. Two thirds of population increase in Asia is due to
developments i I dia. Fo e a ple the Middle of the ‘oad scenario projects between 2010 and 2050
15 For more information see KC and Lutz 2014

24
an additional 509 million people making India by far the largest nation of the world with a total
population of 1.7 billion. Other countries with a significant amount of increasing population (> 50 mio
until 2050) include Pakistan, Bangladesh, Indonesia and Philippines. Countries in the Middle East and
Western Asia also generally increase by between 44 million (Afghanistan) and 10 million (United Arab
Emirates). On the other hand for many countries in Asia population is expected to grow moderately
in the coming decades or even decline such as China and Japan.
Europe: Eu ope s u e t populatio of illio ea de li es i the Regional ‘i alr
scenario to 670 in a d i . I the Middle of the ‘oad a d Sustainability s e a io population increases moderately until the 2050s by about 26 and 33 million respectively. After 2050
population further declines.
4.1.2 E o o i gro th a d i o e
The SSP population and human capital projections provided key input for the long-term economic
growth projections. (Dellink et al. 2015) applied a methodology based on a convergence process with
emphasis on the key drivers of economic growth in the long-term: population, total factor productivity
(TFP), physical capital, employment and human capital, and energy and fossil fuel resources. TFP
related drivers include the rate of change of the technological frontier, the speed of convergence
between low and high income countries, and ope ess of the e o o . The autho s ote that the
projections are subject to large uncertainties, particularly for the later decades, and disregard a wide
range of country-specific drivers of economic growth that are outside the narrow economic framework,
such as external shocks, governance barriers and feedbacks from environmental damage. Hence, they
should be interpreted with sufficient care and not be treated as predictions. GDP a d i o e le els are presented in 2005 USD using constant purchasing power parity (PPP).
Glo al GDP le els at the e d of this e tu a e lo est i the Regional ‘i al s e a io ith lo est levels of international co-operation and trade) amounting to around 220 trillion USD. In the
“ustai a ilit a d Middle of the ‘oad scenario this increases to 650 and 570 trillion USD. This
pattern is similar for income (i.e. per capita GDP) levels. Owing to its large population Asia and Africa
are the main drivers for differences across scenarios, especially in the second half of this century
(Figure 4-4, Figure 4-5). This is also reflected in the relative increase in GDP, which is largest in these
continents (Figure 4-6 bottom).
The relative contribution of North and Central America, Europe and Oceania (i.e. including the majority
of industrialized countries) to global GDP declines significantly in all scenarios. Currently half (51%) of
GDP is generated in this region. By 2050 this declines to 33% i Regional ‘i alr , followed by 32% in
Middle of the ‘oad and a low of 29% i Sustainability . Notwithstanding per capita GDP in these
regions remains higher until 2050 (and thereafter) compared to the other major regions.
Figure 4-4: For three scenarios GDP development till 2100 for the 6 continents
0
100000
200000
300000
400000
500000
600000
2010 2020 2030 2040 2050 2060 2070 2080 2090 2100
Africa Asia
North and Central America South America
Europe Oceania
0
100000
200000
300000
400000
500000
600000
2010 2020 2030 2040 2050 2060 2070 2080 2090 2100
Africa
Asia
North and Central America
0
100000
200000
300000
400000
500000
600000
2010 2020 2030 2040 2050 2060 2070 2080 2090 2100
Africa Asia
North and Central America South America
Europe Oceania
GDP(PPP) - Sustainability GDP(PPP) - Middle of the Road GDP(PPP) - Regional RivalryBillion
US$/yr
Billion
US$/yrBillion
US$/yr

25
Figure 4-5: For the 3 scenarios population development till 2100 for subregions Africa, Asia and Europe
Figure 4-6: Gross domestic product – Middle of the Road scenario
Top: GDP 2010. Middle: GDP 2050. Bottom: change rate of GDP [%] compared to 2010
0
50000
100000
2010 2020 2030 2040 2050 2060 2070 2080 2090 2100
Northern Africa Western Africa Middle Africa
Eastern Africa Southern Africa
0
50000
100000
150000
200000
250000
2010 2020 2030 2040 2050 2060 2070 2080 2090 2100
Western Asia Southern Asia
Central Asia Eastern Asia
South-Eastern Asia
0
20000
40000
2010 2020 2030 2040 2050 2060 2070 2080 2090 2100
Western Europe Southern Europe
Northern Europe Eastern Europe
Europe - GDP(PPP) - Middle of the RoadAsia - GDP(PPP) - Middle of the RoadAfrica - GDP(PPP) - Middle of the RoadBillion
US$/yr
Billion
US$/yrBillion
US$/yr

26
Figure 4-7 and the maps in Figure 4-8
highlight per capita GDP on a regional
and country scale and the changes
between today and 2050. On a global
level income (per capita GDP) by 2050 is
highest i the “ustai a ilit s e a io, a 3.5 increase of current levels and
lo est i the ‘i al s e a io, o l just above twice current levels. The closure
in income gaps is highest in
“ustai a ilit a d lo est i ‘i al . Fo e a ple Asia s pe apita GDP today is only 20% of those of North and
Central America compared to 46%
(Middle of the Road) by 2050. Although
showing a high increase, Africa remains
well below global average per capita
GDP in all scenarios. Even in
“ustai a ilit , , Af i a s pe capita GDP is only about 43% of the
glo al a e age. I o t ast Asia s a d “outh A e i a s at h-up to global
average levels is more pronounced.
Table 4-1 presents a comprehensive
summary of the regional distribution of
population, GDP and per capita GDP in
2010 and 2050 for the Middle of the Road s e a io. As discussed above
results highlight the remaining high
levels of income (per capita GDP) in
North and Central America, Oceania,
and Europe in the coming decades.
Figure 4-7: Per capita GDP in 2010 and 2050 for the three scenarios
0
10000
20000
30000
40000
50000
60000
Africa Asia North &
Central
America
South
America
Europe Oceania WORLD
20
05
US$
pe
r ca
pit
a
2010
Sustainability 2050
Middle of the Road 2050
Regional Rivalry 2050
Table 4-1: Population, GDP and GDP per capita comparison
Middle of the Road scenario
% of Wo ld: % of the Wo ld s a e age GDP/ ap
Population Change rate
[ Mio of people ] 2010 Share 2050 Share (% of 2010)
Africa 1021 15% 2010 22% 197
Asia 4104 60% 5097 56% 124
North and Central A. 533 8% 692 8% 130
South America 392 6% 490 5% 125
Europe 739 11% 763 8% 103
Oceania 36 1% 57 1% 158
World 6825 9110 133
GDP Change rate
[ Mio US$2005/year ] 2010 Share 2050 Share (% of 2010)
Africa 2753 4% 19176 8% 697
Asia 25550 38% 123096 54% 482
North and Central A. 16197 24% 36076 16% 223
South America 3965 6% 12989 6% 328
Europe 17048 26% 34758 15% 204
Oceania 937 1% 2576 1% 275
World 66450 228671 344
GDP per capita Change rate
[ US$2005/year/cap ] 2010 % of 2050 % of (% of 2010)
Africa 2696 28% 9541 38% 354
Asia 6226 64% 24148 96% 388
North and Central A. 30411 312% 52126 208% 171
South America 10106 104% 26504 106% 262
Europe 23076 237% 45555 181% 197
Oceania 23076 237% 45290 180% 196
World 9736 25102 258
Mio US$2005/year

27
At the same time their share in global GDP declines from a current 51% to 29-33% (depending on the
scenario) while population remains fairly constant. Asia exhibits an increasing share in global economy
with a contribution of 38% in 2010 and of % . I o t ast Af i a s GDP g o th (from 4% in
2010 to 8-9% in 2050), although impressive in its growth rates, is apparently insufficient to
compensate for a strong population growth. The continent therefore lags behind in income even in
2050 when Af i a s GDP per capita will be only 33-43% of global average.
Figure 4-8: Gross domestic product per capita – Middle of the Road scenario
Top: GDP/cap 2010. Middle: GDP/cap 2050. Bottom: change rate of GDP/cap [%] compared to 2010

28
Austria and priority countries of the Austrian Development Agency
Figure 4-9 presents socio-economic development pathways along the storylines of the three scenarios
for Austria and the priority countries of the Austrian Development Agency. Table 4-2 summarizes the
socio-e o o i a ia les fo the Middle of the ‘oad scenario by country in 2010 and 2050.
Figure 4-9: Changes in Gross domestic per capita and population for ADA priority countries
lue Sustainability , ello Middle of the ‘oad , ed Regional ‘i alr scenario)
Austria: Like other high-i o e Eu opea ou t ies Aust ia s populatio de li es i the ‘i al scenario after an early peak in the 2020s. By 2050 population is 11% below and by 2100 as much as
47% lower compared to current 8.4 million people. An explanation for this decline are the assumptions
for fertility (low), mortality (High) and migration (none) for OECD countries of the SSP3 scenario
(Rivalry - Fragmented World – storyline see (O'Neill et al. 2015) and Appendix A). Further description
of the assu ptio s of the ““P s is gi e as a supple e t to the IIA“A ““P data ase16. The projection
for all the other ADA priority countries show the opposite trend, assuming an increasing population
fo the ‘i al s e a io e ause of a high fertility assumption for Non-OECD countries.
Nevertheless because of the rather extreme impact of the SSP3 scenario till 2100 we only consider the
period till 2050. Populatio de elop e t i the Middle of the ‘oad a d Sustainability s e a io is significantly different when population increases until about the middle of the century, followed by a
moderate decline until 2100. Economic development and income (GDP per capita) is fairly similar in
the “ustai a ilit a d Middle of the ‘oad s e a ios, ut sig ifi a tl lo e i the ‘i al s e a io.
Albania, Moldova, Armenia, Georgia: Population development trends across the three scenarios are
diffe e t i Eu ope s a d Ce t al Asia s lo i o e ou t ies o pa ed to high-income countries.
Population re ai s fai l sta le i ‘i al ut de li es igo ousl i 'Middle of the ‘oad and even
o e i Sustainability . I o e g o th is st o gest i Sustainability . Nevertheless GDP per capita in
2050 reaches just about the global average and is only about half the European average. Across the
four countries the strongest economic growth occurs in Moldova where GDP per capita increases
between 2010 and 2050 by a factor of between 5 Regional ‘i alr ) and 9 Sustaina ilit ).
16 https://tntcat.iiasa.ac.at/SspDb/static/download/ssp_suplementary%20text.pdf
0
20000
40000
60000
80000
100000
120000
140000
0.0
0.5
1.0
1.5
2.0
2.5
3.0
3.5
Armenia
0
20000
40000
60000
80000
100000
120000
140000
0.0
0.5
1.0
1.5
2.0
2.5
3.0
3.5
4.0
4.5
5.0
Georgia
0
20000
40000
60000
80000
100000
120000
140000
0.0
0.2
0.4
0.6
0.8
1.0
1.2
1.4
1.6
1.8
2.0
Bhutan
0
20000
40000
60000
80000
100000
120000
140000
0.0
0.5
1.0
1.5
2.0
2.5
3.0
3.5
4.0
Albania
0
20000
40000
60000
80000
100000
120000
140000
0.0
2.0
4.0
6.0
8.0
10.0
12.0
AustriaMio
People US$/yr/cap US$/yr/cap US$/yr/capMio
People
Mio
People US$/yr/cap US$/yr/capMio
People
Mio
People
0
20000
40000
60000
80000
100000
120000
140000
0
10
20
30
40
50
60
70
80
90
100
Burkina Faso US$/yr/cap
Mio
People
0
20000
40000
60000
80000
100000
120000
140000
0
50
100
150
200
250
300
350
Ethiopia
0
20000
40000
60000
80000
100000
120000
140000
0
50
100
150
200
250
300
UgandaMio
People US$/yr/cap
0
20000
40000
60000
80000
100000
120000
140000
0
10
20
30
40
50
60
70
80
MozambiqueUS$/yr/cap
Mio
People
Mio
People US$/yr/cap
0
20000
40000
60000
80000
100000
120000
140000
0.0
0.5
1.0
1.5
2.0
2.5
3.0
3.5
4.0
4.5
5.0
MoldovaMio
People US$/yr/cap

29
Bhutan: Bhutan stands out in its strong
economic development compared to the
other ADA target countries. Starting at
the same income level as Armenia and
Georgia, GDP per capita is projected to
increase by 2050 between 6-fold in
‘i al a d 11-fold i “ustai a ilit . Bhuta s i come level is thus by the
middle of the century well above global
average reaching almost the European
average.
Bhuta s populatio g o s i all th ee scenarios continuously until 2050 and
thereafter only declines in
“ustai a ilit . The elati el lo population of 0.7 million in 2010 has
increased to between 1.1 in
“ustai a ilit a d . i ‘i al 2050.
Burkina Faso, Ethiopia, Mozambique,
Uganda: In the African ADA target
countries population increase
significantly until the mid of the century
when growth flattens or decreases only
moderately. Growth is much stronger in
Regional ‘i alr compared to
Sustainability because of the high
fertility and no migration assumption in
the Regional Rivalry s e a io. Middle of
the ‘oad takes an intermediate position
with the following rates of increase
between 2010 and 2050 and population
numbers in 2050: Mozambique (1.8-fold
increase, 42 million in 2050), Ethiopia
(1.9-fold, 158 million), Burkina Faso (2.3-
fold, 37 million), Uganda (2.8-fold,
93 million). Across the four countries
population growth is projected to be strongest in Uganda, a trend continuing until 2100 (Figure 4-10).
Although economy grows strongly, for example by a factor of 10 to 20 between 2010 and 2050, income
levels remain throughout the century well below most other countries of the world17. However there
is some gap closure over time. By 2050 per capita GDP in all four countries has increased from a current
3-4% of global average to 9%. The four countries also remain on the lower end of income within Africa.
17 Chateau et al. 2012 explains the methodology for the long-term economic growth modeling
Table 4-2: Population, GDP and GDP per capita comparison
ADA priority countries – Middle of the Road scenario
% of Wo ld: % of the Wo ld s a e age GDP/ ap
Population Change rate
[ Mio of people ] 2010 2050 (% of 2010)
Austria 8.4 9.2 110
Albania 3.2 3.2 100
Armenia 3.1 2.6 84
Georgia 4.4 3.2 74
Moldova 3.6 2.2 61
Bhutan 0.7 1.2 171
Burkina Faso 16.5 38.6 234
Ethiopia 82.9 158.8 191
Uganda 33.4 93.3 279
Mozambique 23.4 42.3 181
GDP Change rate
[ Mio US$2005/year ] 2010 2050 (% of 2010)
Austria 297 561 189
Albania 25 58 237
Armenia 15 44 288
Georgia 20 76 374
Moldova 10 41 408
Bhutan 3 51 1471
Burkina Faso 19 221 1181
Ethiopia 77 896 1158
Uganda 38 555 1445
Mozambique 19 236 1226
GDP per capita Change rate
[ US$2005/year/cap ] 2010 % of 2050 % of (% of 2010)
Austria 35366 363% 60919 243% 172
Albania 7660 79% 18181 72% 237
Armenia 4901 50% 16821 67% 343
Georgia 4651 48% 23448 93% 504
Moldova 2785 29% 18622 74% 669
Bhutan 4780 49% 41202 164% 862
Burkina Faso 1136 12% 5725 23% 504
Ethiopia 932 10% 5639 22% 605
Uganda 1149 12% 5954 24% 518
Mozambique 823 8% 5579 22% 678

30
By 2050, the per capita GDP in these countries is between 5580 and 5950 (constant 2005 U$ PPP). This
compares to 9540 and 25100 fo Af i a s a d glo al a e age espe ti el .
Figure 4-10: Population in detail at the example of Eastern Africa. Source: Jones 2014
4.2 E erg s ste de elop e t a d s e arios
Water and energy resource systems are tightly linked. Secure and reliable access to both resources is
critical to basic survival, as well as ongoing economic development, at all scales and in every region of
the world. Water is needed for nearly all production and conversion processes throughout the energy
sector. It is used for fuel extraction and processing; for electricity generation; and increasingly for
growing biofuels. Similarly, energy is essential for water extraction from both surface and subsurface
sources, treatment, conveyance, and delivery to users. Choices made in one sector have direct and
indirect impacts on the other. Energy production technology choice determines the amount of water
required to produce energy. At the same time, the availability of freshwater resources, management
policies, and allocation rules determine how much water can be secured for energy production. This
linkage carries significant implications for managing water and energy security challenges.
4.2.1 E erg de a d ha ge a d i pli atio s o ater use
In this section, we present results from the 2015 World Energy Outlook (WEO-2015) and the related
reports (International Energy Agency (IEA) 2015). In these reports, three possible future scenarios for
energy system development are considered: Current Policies Scenario, New Policies Scenario, and 450
Scenario. The Current Policies Scenario takes into account only policies affecting energy markets that
had been enacted as of mid-2015. The New Policies Scenario, the central scenario in WEO-2015, takes
into account the policies adopted as of mid-2015, together with relevant declared policy intentions,
even though specific measures needed to put them into effect may not have been adopted. The 450
Scenario depicts a pathway to the 2°C climate goal that can be achieved by fostering technologies that
are close to becoming available at commercial scale.
Between 1990 and 2010, world primary energy demand increased by 55%, from about 8800 to 13600
million tonnes of oil equivalent (Mtoe). This demand is projected to further increase in the next few
Uganda
Population 2010:
33 Mio
Mozambique
Population 2010:
23 Mio
Uganda
Population 2050:
93 Mio
Mozambique
Population 2050:
42 Mio
Uganda
Population 2100:
156 Mio
Mozambique
Population 2100:
50 Mio

31
decades. However, future energy and climate policies play a powerful role in determining the pace at
which energy demand grows and the choice of energy technology mix. According to WEO-2015, world
primary energy demand will increase by 12 to 45% between 2010 and 2040, to reach between 15200
and 19700 Mtoe, depending on the scenario considered (Figure 4-11). This increase will be driven
mainly by demand growth in India, China, Africa, the Middle East, and Southeast Asia. Non-OECD
countries account together for all the increase in global energy demand, as demographic and
structural economic changes, together with greater efficiency, reduce collective demand in OECD
countries from the peak reached in 2007.
Declines are led by the European Union, Japan, and the United States (International Energy Agency
(IEA) 2015).
World primary energy demand for all fuels, except for fossil fuels under the 450 Scenario, grows
through to 2040. In all scenarios, fossil fuels remain the dominant source of energy supply to 2040,
but their share of the energy mix falls, just slightly in the Current Policies Scenario but much more
rapidly in the 450 Scenario. Renewables increase significantly, but their growth only just outpaces that
of total energy demand, meaning that their share of the energy mix changes little. Similarly, nuclear
sees little change. The outlook for all forms of low-carbon energy (renewables, nuclear power, and
others) is more positive in the 450 Scenario and they collectively meet 46% of primary energy demand
by 2040 (Figure 4-11).
Figure 4-11: Global primary energy demand (upper-left) and electricity generation (down-left) under the different WEO-
2015 scenarios and changes in technology mix of global primary energy demand (upper-right) and electricity
generation (down-right) between 2010 and 2040. Source: (International Energy Agency (IEA) 2015)
The power sector is the major energy end-use sector. At present, the power sector accounts for over
60% of coal demand, 40% of gas demand, 55% of the use of renewables, and 42% of global energy-
related CO2 emissions. The power sector must therefore be at the heart of any strategy that addresses
economic growth, energy and water security, and climate change. Electricity demand is strongly
correlated to economic growth, although the extent of the linkage depends on the level of economic
5000
7000
9000
11000
13000
15000
17000
19000
21000
1990 2000 2010 2020 2030 2040
Mtoe
New Policies Scenario
Current Policies Scenario
450 Scenario
0
5000
10000
15000
20000
25000
2010 NP_2040 CP_2040 450_2040
Mtoe
Coal Oil Gas Nuclear Hydro Bioenergy Other renewables
10000
15000
20000
25000
30000
35000
40000
45000
1990 2000 2010 2020 2030 2040
TWh
New Policies Scenario
Current Policies Scenario
450 Scenario
0
5000
10000
15000
20000
25000
30000
35000
40000
45000
50000
2010 NP_2040 CP_2040 450_2040
TWh
Coal Oil Gas Nuclear Hydropower Bioenergy Wind Solar PV Others

32
development of each country, the structure of the economy, and the extent of access to electricity. In
the New Policies Scenario, demand increases over 70% from about 20150 Terawatt hour (TWh) in 2010
to almost 34500 TWh in 2040, with an average annual growth rate of 2%. Demand is even more robust
in the Current Policies Scenario, to reach 37600 TWh in 2040, growing an average of 2.3% per year.
However in the 450 Scenario, demand growth moderates to 1.5% per year as efficiency measures take
hold, amounting to 30015 TWh in 2040. Non-OECD countries drive the growth in global demand, as
they are, in general, undergoing rapid economic and population growth, and associated rising incomes
and shifts from rural to urban areas. Major increases in electricity demand will take place in India,
Southeast Asia, and Africa, with an annual growth rate of about 4% between 2010 and 2040
(International Energy Agency (IEA) 2015).
The growing demand for power engenders global electricity generation to increase. Global electricity
generation is expected to increase significantly from 23318 TWh in 2010 to between 33900 and 43100
TWh in 2040, depending on the policy scenario. The energy mix changes markedly over time. The
contribution of fossil fuels to total electricity generation will decrease from 77% (15740 TWh) in 2010
to between 64% (27660 TWh) and 29% (9850 TWh) in 2040, depending on the policy scenario.
Generation from renewables grows the fastest, as their costs fall and government support continues,
and it increases two to three and a half times, to reach between 11500 and 17800 TWh by 2040.
Hydropower remains the largest source of renewables generation, while wind power and solar PV
expand rapidly, but from a much lower base. Output from nuclear power plants increases up to 150%,
to reach up to 6200 TWh by 2040 (Figure 4-11).
The Growing demand for energy and the shifts in technology will have important implications on water
demand and use. Global water withdrawals for energy production in 2010 is estimated at 583 km3,
representing a out % of the o ld s total ate ithd a als. Po e ge e atio is the ajo ate demand in the energy sector, requiring more than 90% of withdrawals. The largest users of water for
e e g p odu tio a e the o ld s la gest ele t i it ge e ato s: the United States, the European
Union, China and India. Global water consumption of the energy sector – the volume withdrawn but
not returned to its source – amounts to 66 km3. (International Energy Agency (IEA) 2012).
Projections of water demand to support future energy production vary by scenario. There is a general
trend toward a substantial increase of water consumption by the energy sector in all scenarios over
2010-2035, while the trend of withdrawals is more variable across the scenarios. The differences
across the scenarios are largely a consequence of divergent trends related to energy demand, the
changes in the generation technology mix and the cooling technologies used, and the growth rates of
biofuels production.
In the Current Policies Scenario (representing a pathway that assumes no change in existing energy-
related policies), global water withdrawals for energy production continue to rise throughout the
projection period, climbing to 790 km3 in 2035, about 35% higher than in 2010. In the New Policies
Scenario, global withdrawals reach 690 km3 in 2035, an increase of about 20% over 2010, with growth
slowing noticeably after 2020. Water consumption grows significantly by about 85% in the New
Policies Scenario and doubles in the Current Policies Scenario.
Slower energy demand growth in the New Policies Scenario (averaging 1.2% per year, compared to
1.5% in the Current Policies Scenario) plays a significant role in its comparatively lower water
requirements. The share of coal-fired power plants (that withdraw large quantities of water) in each
scenario also contributes to the difference in water requirements. In the New Policies Scenario, coal-
fired generation is reduced considerably, by 30% at the end of the Outlook period, and inefficient
plants are retired more quickly compared to the Current Policies Scenario. Moreover, the power sector
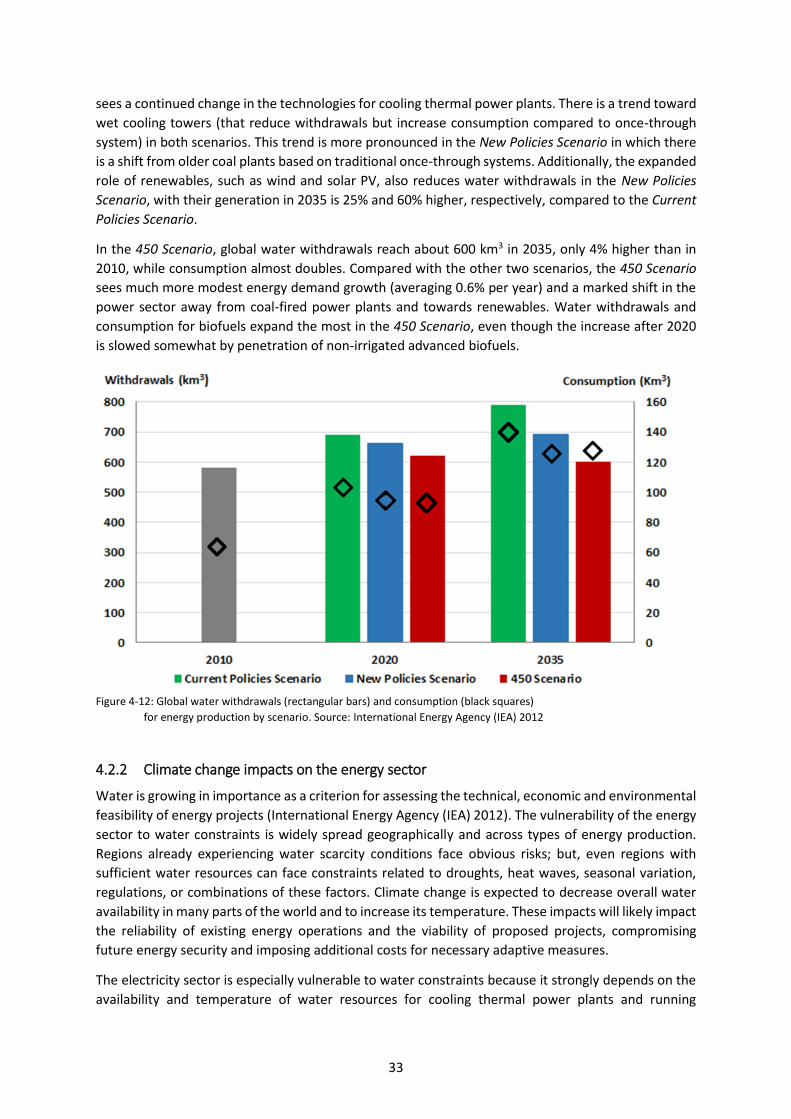
33
sees a continued change in the technologies for cooling thermal power plants. There is a trend toward
wet cooling towers (that reduce withdrawals but increase consumption compared to once-through
system) in both scenarios. This trend is more pronounced in the New Policies Scenario in which there
is a shift from older coal plants based on traditional once-through systems. Additionally, the expanded
role of renewables, such as wind and solar PV, also reduces water withdrawals in the New Policies
Scenario, with their generation in 2035 is 25% and 60% higher, respectively, compared to the Current
Policies Scenario.
In the 450 Scenario, global water withdrawals reach about 600 km3 in 2035, only 4% higher than in
2010, while consumption almost doubles. Compared with the other two scenarios, the 450 Scenario
sees much more modest energy demand growth (averaging 0.6% per year) and a marked shift in the
power sector away from coal-fired power plants and towards renewables. Water withdrawals and
consumption for biofuels expand the most in the 450 Scenario, even though the increase after 2020
is slowed somewhat by penetration of non-irrigated advanced biofuels.
Figure 4-12: Global water withdrawals (rectangular bars) and consumption (black squares)
for energy production by scenario. Source: International Energy Agency (IEA) 2012
4.2.2 Cli ate ha ge i pa ts o the e erg se tor
Water is growing in importance as a criterion for assessing the technical, economic and environmental
feasibility of energy projects (International Energy Agency (IEA) 2012). The vulnerability of the energy
sector to water constraints is widely spread geographically and across types of energy production.
Regions already experiencing water scarcity conditions face obvious risks; but, even regions with
sufficient water resources can face constraints related to droughts, heat waves, seasonal variation,
regulations, or combinations of these factors. Climate change is expected to decrease overall water
availability in many parts of the world and to increase its temperature. These impacts will likely impact
the reliability of existing energy operations and the viability of proposed projects, compromising
future energy security and imposing additional costs for necessary adaptive measures.
The electricity sector is especially vulnerable to water constraints because it strongly depends on the
availability and temperature of water resources for cooling thermal power plants and running

34
hydropower turbines, which together generate the major share of global electricity. Several studies in
the literature investigate the impacts of climate change on regional electricity generation. For
example, (Lehner et al. 2005) assess the impacts of global change on hydropower potential in Europe.
They find that this potential could be reduced by 6% for whole Europe and by 25% or more for
southern and southeastern European countries by the 2070s compared to baseline setting. (Van Vliet
et al. 2012) analyze the vulnerability of US and European electricity supply to climate change-induced
lower summer river flows and higher river water temperatures. Their results show a summer average
decrease in capacity of power plants of 6.3-19% in Europe and 4.4-16% in the United States depending
on cooling system type and climate scenario for 2031–2060, with increased probability of extreme
reductions in thermoelectric power production. This reduction of electricity generation potential
could significantly raise electricity prices, impacting negatively both consumer and producer benefits
(Van Vliet et al. 2013).
A recent study completed within the Water Futures and Solutions Initiative (WFaS) investigates the
global impacts of climate change on electricity generation (van Vliet et al. 2016). Results show that
over the coming decades, some regions will experience higher streamflow and only moderate water
temperature increases, while others, notably the USA, southern and central Europe, Southeast Asia
and southern parts of South America, northern and southern Africa, and southern Australia, will
experience decreases in streamflow over time. Furthermore, strong increases in water temperature
are expected in eastern North America, Europe, Asia and areas of southern Africa. These changes will
lead to average reductions in global annual hydropower capacities between 1 and 4% compared to
observed conditions, depending on the time horizon and climate scenario. The effects of climate
change on hydropower will likely be especially strong in South America and Australia. For
thermoelectric power, results show average reductions in global annual thermoelectric capacities
between 5 and 12% compared to observed conditions, depending on the time horizon and climate
scenario, due to the combined effects of streamflow reductions and temperature increases. Parts of
North America, Europe, Africa, and Australia will likely face the most severe impacts (Figure 4-13).
Several adaptation options are available to address climate change-related water impacts on the
energy sector. In the power sector, these include an increased diversification in the electricity sector,
with greater reliance on renewable energy technologies that are independent from water availability
and water temperature (e.g. solar PV, wind power); improving the efficiency of power plants; for
instance by replacing fuel sources in thermoelectric power plants; deployment of more advanced
cooling systems, including wet closed-loop system, and dry and hybrid systems; and switching to
seawater cooling for thermoelectric power plants along the coast. In biofuels production, some
solutions could be implemented to reduce water use of biofuel crops such as growing less-water
intensive crops, growing crops in rainfed conditions where possible, and growing crops in
multifunctional plantings. More generally, the energy sector can look to exploit unconventional water
resources such as saline water, treated wastewater, and storm water (International Energy Agency
2012).

35
Figure 4-13: Impacts of climate and water resources change on annual mean usable capacity of current hydropower and
thermoelectric power plants.
Relative changes in annual mean usable capacity of hydropower plants (a) and thermoelectric power plants (b) for
RCP2.6 and RCP8.5 for 2010–2039 (2020s) and 2040–2069 (2050s) relative to the control period 1971–2000.
Global trends of changes in annual mean hydropower and thermoelectric power usable capacity for 1971–2099
based on the GCM-ensemble mean results (thick lines) and for the five individual GCMs separately (thin dotted
lines) for both RCP2.6 (orange) and RCP8.5 (red) (c). Source: (van Vliet et al. 2016)

36
4.3 Food a d agri ulture de elop e t
As in the past decades, the growing wealth and population numbers will be driving a rising food
demand for better nutrition and more protein-rich diets. Based on the demographic and economic
macro-drivers outlined above, scenario simulations with IIA“A s Wo ld Food “ ste WF“ odel e.g. (Fischer 2011), (Fischer et al. 2009)) and the Global Agro-Ecological Zones (GAEZ) model ((Fischer et
al. 2012), (Fischer et al. 2007) were undertaken to explore possible future directions of the food and
agriculture systems and to quantify for each development pathway the attainable nutrition levels and
associated resource use.
4.3.1 Food de a d
Globally, average food energy intake in the WFS model is estimated at 2860 kCal/cap/day in 2010,
with regions ranging from less than 2300 kCal/cap/day in Africa, on average about 2780 kCal/cap/day
in Asia and Latin America, to more than 3500 kCal/cap/day in Northern America, Europe and Oceania.
The projected per capita food energy intake in 2050 reaches levels between 2950 kCal/cap/day
(Regional Rivalry scenario) and 3360 kCal/cap/day (Sustainability scenario), and in 2080 respectively
3000 to 3700 kCal/cap/day (Figure 4-14).
Figure 4-14: Selected indicators of global food system development under the different SSP scenarios
Global cereal food use in 2010 as simulated in the WFS model amounts to 1145 Million tons and global
cereal feed use is estimated in the model at 927 Million tons. In 2050 scenario results for cereal food
use fall in the range of 1540 Million tons (Sustainability scenario SSP1) to 1610 Million tons (Regional
1,100
1,200
1,300
1,400
1,500
1,600
1,700
1,800
1,900
2,000
2010 2020 2030 2040 2050 2060 2070 2080
Do
me
stic
Ce
rea
l U
tili
zati
on
(M
illi
on
to
ns)
Cereal Food Demand
Sustainability Middle of the Road Regional Rivalry
900
1,000
1,100
1,200
1,300
1,400
1,500
1,600
2010 2020 2030 2040 2050 2060 2070 2080
Do
me
stic
Ce
rea
l U
tili
zati
on
(M
illi
on
to
ns)
Cereal Feed Demand
Sustainability Middle of the Road Regional Rivalry
2700
2900
3100
3300
3500
3700
3900
2010 2020 2030 2040 2050 2060 2070 2080
Foo
d E
ne
rgy
Inta
ke (
kCa
l/ca
p/d
ay
)
Per Capita Food Energy
Sustainability Middle of the Road Regional Rivalry
0
2
4
6
8
10
12
14
2010 2020 2030 2040 2050 2060 2070 2080
Ris
k o
f H
un
ge
r (%
of
po
pu
lati
on
)
Risk of Hunger
Sustainability Middle of the Road Regional Rivalry

37
Rivalry scenario SSP3). In 2080, the range of scenario results for cereal food use widens, from a low of
1560 Million tons of cereals (Sustainability scenario) to a high estimate of 1890 Million tons in the
population-rich Regional rivalry scenario (Figure 4-14).
The total number of people, their wealth and dietary preferences are principle drivers of future global
food demand. Section 4.1 shows the range of projected global population development and economic
growth in the three development pathways over the period 2010 to 2080 analyzed in this study.
Starting from 6.9 billion people in 2010, the world population in SSP1 reaches 8.0 billion in 2030 and
its peak of about 8.5 billion around 2050. Beyond mid-century global population decreases in scenario
SSP1 and by 2080 amounts to 7.9 billion people. Global population also peaks in scenario SSP2, but
later (about 2070) and at a higher level of 9.4 billion. In scenario SSP3 population growth continues
until the end of this century, resulting in a global population of 8.5 billion people in 2030, nearly 10.0
billion in 2050 (45% more than in 2010) and a total of 11.6 billion in 2080, about 70% higher than in
2010.
From the diagram it can be seen that population in 2050 in the Regional Rivalry scenario is 18% higher
than in the Sustainability scenario, and 47% higher in 2080. Furthermore, global cereal food demand
in the Regional Rivalry scenario is 4% higher than in the Sustainability scenario in 2050, and 21% higher
in 2080. As a result, per caput cereal food consumption is highest in the Sustainability scenario and
least in the Regional Rivalry scenario. Just as one would intuitively expect in a scenario with less but
better endowed people, the per caput nutritional status and per caput cereal food demand is superior
in the Sustainability scenario compared to the other two scenarios analyzed here.
Yet, despite this clearly higher average per caput cereal food consumption in the Sustainability
scenario, the absolute amount of global total cereal food consumption is less than in the Regional
Rivalry scenario due to much higher population numbers under Regional Rivalry.
This compares to a cereal feed use in 2050 of between 1500 Million tons (scenario SSP1) and 1380
Million tons (scenario SSP3). Note that cereal feed use in scenario SSP3 is lower than in the other two
development scenarios. This can be explained by the fact that population numbers in developed
countries is lowest in the Regional rivalry scenario SSP3, e.g. 1.15 billion people in 2080 compared to
1.49 billion people in the Sustainability scenario SSP1. As a consequence, demand for livestock
products in developed countries in SSP3 is lower than in the other scenarios and with it livestock
production and feed use.
4.3.2 People at risk of hu ger
The number of people at risk of hunger estimated for 2010 amounts to 920 Million, some 13.5% of
global population. This number is rapidly decreasing in two development pathways and the share of
people at risk of hunger is below 2% of global population by 2080, i.e. 1.8% in scenario SSP2 and 0.6%
in scenario SSP1. Only in the Regional Rivalry scenario the demographic growth is too substantial and
economic development is insufficient to end hunger and the estimated number of people at risk of
hunger stagnates at about 800 Million or some 8.5% of the global population in 2080 (Figure 4-14).

38
Figure 4-15: Selected indicators of food system development in Asia under the different SSP scenarios
Selected food system indicators for the Asia region are presented in Figure 4-15. Cereal food demand
up to 2050 among the three scenarios falls within a relatively narrow range between 950 Million tons
(scenario SSP1) to 985 Million tons (scenario SSP3) compared to 765 Million tons in 2010. Driven by
the respective population development, cereal food demand in Asia beyond 2050 decreases in the
Sustainability scenario to 870 Million tons in 2080, remains at 960 Million tons in the Middle of the
Road scenario, and increases to 1100 Million tons by 2080 in response to population growth in the
Regional rivalry scenario.
The cereal self-sufficiency ratios for the Asia region is also shown in Figure 4-15 indicating that the
high level of regional self-reliance (about 90 percent as simulated in 2010) may initially fall slightly
until 2030. In the longer term the cereal self-reliance ratio of the Asia region is projected to recover
and increase in the Sustainability scenario SSP1 to 95%, well beyond the 2010 level, would remain
close to 90% in the Middle of the Road scenario SSP2, and would gradually decline to about 80% in the
Regional Rivalry scenario SSP3.
The estimated number of people at risk of hunger in the Asia region in 2010 amounts to 550 Million.
This number is rapidly declining in two development pathways and hunger is practically eliminated by
2080. Only under the Regional Rivalry scenario the economic development is insufficient and the
estimated number of people at risk of hunger stagnates at about 10.6% of the Asian population, i.e.
580 Million in 2080 (Figure 4-15).
700
750
800
850
900
950
1,000
1,050
1,100
1,150
2010 2020 2030 2040 2050 2060 2070 2080
Do
me
stic
Ce
rea
l U
tiliz
ati
on
(M
illi
on
to
ns)
Cereal Food Demand
Sustainability Middle of the Road Regional Rivalry
78
80
82
84
86
88
90
92
94
96
2010 2020 2030 2040 2050 2060 2070 2080
Ce
rea
l S
elf
-su
ffic
ien
cy (
pe
rce
nt)
Cereal Self-sufficiency
Sustainability Middle of the Road Regional Rivalry
0
100
200
300
400
500
600
700
2010 2020 2030 2040 2050 2060 2070 2080
Ris
k o
f H
un
ge
r (M
illio
n p
eo
ple
)
Risk of Hunger
Sustainability Middle of the Road Regional Rivalry
2500
2700
2900
3100
3300
3500
3700
3900
2010 2020 2030 2040 2050 2060 2070 2080
Foo
d E
ne
rgy
Inta
ke (
kCa
l/ca
p/d
ay
)
Per Capita Food Energy
Sustainability Middle of the Road Regional Rivalry

39
Figure 4-16: Selected indicators of food system development in Africa under the different SSP scenarios
Food system development indicators for the Africa region are summarized in Figure 4-16. Driven by
population growth and substantial income gains, cereal food demand in the Africa region is rapidly
increasing, from 128 Million tons in 2010 to between 290 Million tons (scenario SSP1) and 340 Million
tons (scenario SSP3) in 2050, and between 375 Million tons (scenario SSP1) and 510 Million tons
(scenario SSP3) in 2080. The assumed swift economic growth in Africa, especially as portrayed in the
storylines of scenario SSP1 and SSP2 (see Figure 4), results in greatly improved diets and food energy
intake, exceeding even in the worst case an average 2800 kCal/cap/day. By 2080, hunger is almost
completely eliminated in the SSP1 and SSP2 scenarios. In the Regional Rivalry scenario, though
gradually improving, the estimated number of people at risk of hunger amounts to 155 Million (or
9.5%) in 2050 and to 120 Million (or 5.6%) in 2080.
100
150
200
250
300
350
400
450
500
550
2010 2020 2030 2040 2050 2060 2070 2080
Do
me
stic
Ce
rea
l U
tili
zati
on
(M
illi
on
to
ns)
Cereal Food Demand
Sustainability Middle of the Road Regional Rivalry
2200
2400
2600
2800
3000
3200
3400
2010 2020 2030 2040 2050 2060 2070 2080
Foo
d E
ne
rgy
Inta
ke (
kCa
l/ca
p/d
ay
)
Per Capita Food Energy
Sustainability Middle of the Road Regional Rivalry
0
50
100
150
200
250
2010 2020 2030 2040 2050 2060 2070 2080
Ris
k o
f H
un
ge
r (M
illio
n p
eo
ple
)
Risk of Hunger
Sustainability Middle of the Road Regional Rivalry
60
65
70
75
80
85
90
95
2010 2020 2030 2040 2050 2060 2070 2080
Foo
d P
rote
in I
nta
ke (
gra
m/c
ap
/da
y)
Protein Intake
Sustainability Middle of the Road Regional Rivalry

40
Figure 4-17: Evolution of cultivated land, area equipped with irrigation and total irrigation water requirement in Asia under
the different SSPs
4.3.3 E olutio of ulti ated la d
The strong rise in global food and feed demand is putting additional pressures on land, water, energy
resources and the environment. Results of the WFS and GAEZ model simulations indicate a further
increase in the global use of cultivated land (i.e. arable land and land under permanent crops) from a
total of 1540 Million hectares in 2010 to reach under the different development scenarios between
1620 and 1775 Million hectares by 2050, and between 1555 and 1910 Million hectares in 2080 (Figure
4-17). In the Sustainability scenario the peak of global cultivated land use, about 1620 Million hectares,
is reached around 2050 and use of cultivated land subsequently decreases. Global cultivated land use
steadily increases in the Middle of the Road scenario, reaching about 1700 Million hectares in 2050
and some 1725 Million hectares in 2080, i.e. around 12% higher than in 2010. In the Regional Rivalry
scenario, due to continued population growth and slower economic development, the use of arable
land continues to increase until the end of the simulation period in 2080, approaching a level of about
1910 Million hectares (Figure 4-17), i.e. some 370 Million hectares (or nearly 25%) higher than in 2010.
For the land equipped with irrigation the projected extents increase from 321 Million hectares in 2010
to between 356 Million hectares (scenario SSP1) and 376 Million hectares (scenario SSP3) in 2050, and
between 350 Million hectares (scenario SSP1) and 400 Million hectares (scenario SSP3)in 2080 (Figure
4-17). This means that the aggregate global irrigation share, i.e. the share of cultivated land equipped
with irrigation in total cultivated land, remains almost constant at about 21% in the Regional Rivalry
scenario (SSP3) and increases somewhat in the Sustainability scenario (SSP1) (from 21% in 2010 to
1,500
1,550
1,600
1,650
1,700
1,750
1,800
1,850
1,900
1,950
2010 2020 2030 2040 2050 2060 2070 2080
Cu
ltiv
ate
d L
and
(M
illio
n h
ect
are
)Cultivated Land
Sustainability Middle of the Road Regional Rivalry
310
320
330
340
350
360
370
380
390
400
410
2010 2020 2030 2040 2050 2060 2070 2080
Irri
gate
d L
and
(M
illio
n h
ect
are
)
Irrigated Land
Sustainability Middle of the Road Regional Rivalry
2,250
2,500
2,750
3,000
3,250
3,500
3,750
4,000
2010 2020 2030 2040 2050 2060 2070 2080
Irri
ga
tio
n W
ate
r (k
m3
/ye
ar)
Irrigation Water Requirement
Sustainability Middle of the Road Regional Rivalry
0
50
100
150
200
250
300
350
400
2010 2020 2030 2040 2050 2060 2070 2080
Cu
ltiv
ate
d l
an
d (
Mil
lio
n h
ect
are
s)
Irrigated Land (Middle of the Road)
Africa Asia
Northern America Latin America & Caribbean
Europe Oceania

41
22% in 2050 and 22.5% in 2080) and the Middle of the Road scenario (SSP2) (21.5% in 2050 and 22%
in 2080). Note that about 70% of the land equipped with irrigation is located in the Asia region, with
an irrigation share of 42% in 2010 increasing to about 46% in 2050 and 48% in 2080.
Furthermore, we have estimated future global irrigation water requirements based on changes in
irrigated areas projected in the WFS scenario simulations and the multi-model ensemble mean of
irrigation requirements per unit area derived from the outputs of six major hydrological models
participating in the Inter-Sectoral Impact Model Intercomparison Project (ISI-MIP; (Warszawski et al.
2014). For the year 2010 we obtained an estimate of global irrigation water use amounting to 2340
km3/year. Keeping the irrigation system efficiency parameters at base year level, the irrigation water
requirements calculated for 2050 were in the range of 2875 km3/year (Sustainability scenario) to 3310
km3/year (Regional Rivalry scenario), and in 2080 ranging from 2975 km3/year to 3945 km3/year.
Hence, the estimated increases of global crop irrigation water requirements come in 2050 to 23% to
42% above the level in 2010 and reach 27% to 69% in 2080 (Figure 4-17).
Climate change and the increase of irrigated land combine in the scenario projections to increase crop
irrigation water requirements as detailed in Table 4-3. The results indicate an aggregate impact of
climate change on irrigation water requirements due to warming and changes in precipitation in 2030
of 2.2% (in the Sustainability scenario based on RCP4p5) to 2.8% (in RCP6p0). In 2050, using as weights
for aggregation the areas equipped with irrigation in the base year, the climate change induced
impacts on crop irrigation requirements fall into a range of 4.5% to 5.6%, and in 2080 the range
becomes 7.8% to 9.8%. Cultivated land equipped with irrigation in 2050 is 10.7% (scenario SSP1) to
16.9% (scenario SSP3) above the level in 2010, and by 9.0% to 24.1% in 2080. Also, the specific
geographic distribution of the expanding new irrigated areas results in some regions in an increase of
the average irrigation requirement per unit area in addition to climate induced changes, i.e. the newly
developed irrigated areas tend to require more water input than previously existing irrigated land.
Table 4-3: Climate and land use components of increased irrigation requirements
Climate change induced (% change relative to 2010)
Irrigated area increase (% change relative to 2010)
Irrigation requirements (% change relative to 2010)
Sustain-ability
Middle of the Road
Regional Rivalry
Sustain-ability
Middle of the Road
Regional Rivalry
Sustain-ability
Middle of the Road
Regional Rivalry
2030 2.2 2.8 2.8 7.0 8.5 10.1 13.4 18.5 23.3
2050 4.5 5.6 5.6 10.7 13.8 16.9 22.9 32.6 41.6
2080 7.8 9.8 9.8 9.0 17.2 24.1 27.2 47.7 68.7
Note: To account for climate change, RCP4p5 climate model results were used in the Sustainability scenario and RCP 6p0 results were used in the Middle of the Road and Regional Rivalry simulations.
When combining climate change and land use change impacts, the estimated increase of global
irrigation water demand becomes 22.9% to 41.6% in 2050, and 27.2% to 68.7% in 2080. As noted
before, these estimates are calculated assuming an overall irrigation system efficiency as in the base
year 2010. For instance, meeting a 33% increase of crop irrigation demand (as shown for 2050 in the
Middle of the Road scenario) with current water withdrawals would require the irrigation system
efficiency to improve on average by 0.7% per annum between 2010 and 2050.
Model estimates and data on crop water requirements and irrigation water withdrawal provided in
FAO (2012) indicate an overall global system efficiency expressed as a water requirement ratio (i.e.

42
the ratio of estimated crop irrigation water requirements over irrigation water withdrawal) of 56
percent, with large gains possible in many developing countries.
Due to the spatial pattern of global warming, climate change impacts on irrigation requirements are
more pronounced in higher latitude regions such as in East Asia, Europe and Northern America. In the
Africa and Latin America regions the projected changes of irrigated land dominate the increase of
irrigation water requirements. A summary of regional factors contributing to the increase of irrigation
water demand in the analyzed scenarios is presented in Table 4-4.
Table 4-4: Regional climate and land use components of increased irrigation demand in 2050
Climate change induced (% change relative to 2010)
Irrigated area increase (% change relative to 2010)
Irrigation requirements (% change relative to 2010)
Sustain-ability
Middle of the Road
Regional
Rivalry
Sustain-ability
Middle of the Road
Regional
Rivalry
Sustain-ability
Middle of the Road
Regional
Rivalry
Africa 4.6 4.5 4.5 24.9 36.7 46.8 157.4 241.1 320.6
Asia 4.1 5.4 5.4 9.6 12.2 14.7 13.8 18.3 20.2
Northern America 5.8 6.5 6.5 7.0 7.5 7.7 12.5 13.9 14.0
Latin America 4.6 5.1 5.1 17.6 24.9 34.7 61.5 102.5 171.0
Europe 9.2 10.1 10.1 9.9 11.6 14.4 23.3 26.5 31.6
Oceania 4.5 4.7 4.7 7.8 9.7 10.9 11.4 16.3 18.6
Note: To account for climate change, RCP4p5 climate model results were used in the Sustainability scenario and RCP 6p0 results were used in the Middle of the Road and Regional Rivalry simulations.
The relatively large expansion of food production required in the different development pathways is
achieved foremost by means of intensification, i.e. higher output per unit of cultivated land, through
yield improvements, increased input use, and somewhat increased multi-cropping intensity and
irrigation shares (Figure 4-18). In the Sustainability scenario about 90% of the crop output increases
in 2050 (relative to 2010 crop production) can be attributed to intensification and only 10% are due
to conversion of additional cropland. In 2080 an additional 60% of crop production is achieved from a
cultivated land extent almost the same as in 2010, i.e. by then all simulated production increases come
from higher yields. In the Middle of the Road scenario, the additional crop production in 2080
(compared to crop production in 2010) is achieved with about 12% more cropland, i.e. on average
85% of the production increases are derived from intensification. Only in the Regional Rivalry scenario,
where technological improvements are somewhat slower and a larger share of the production
increases occurs in developing regions, the arable land expansion, foremost in Africa and Latin
America, is responsible for about a third of crop production increases.

43
Figure 4-18: Indicators of global food system intensification under the different SSPs.
Even though the increases of global cultivated land are quite modest compared to simulated global
production changes, some forest conversion due to cropland and urban land expansion takes place,
albeit to a varying extent in the different scenarios. Cumulative deforestation caused by cropland
expansion and built-up conversion up to 2080 is shown in Figure 4-19.
Figure 4-19: Cumulative global forest loss under the different SSPs.
900
1,000
1,100
1,200
1,300
1,400
1,500
2010 2020 2030 2040 2050 2060 2070 2080
Lan
d Y
ield
(I$
20
05
/he
cta
re)
Output Intensity
Sustainability Middle of the Road Regional Rivalry
90
100
110
120
130
140
150
160
170
180
2010 2020 2030 2040 2050 2060 2070 2080
Nit
rog
en
fe
rtili
zers
(In
de
x 2
01
0=
10
0)
Use of Nitrogenous Fertilizers
Sustainability Middle of the Road Regional Rivalry
20.6
20.8
21.0
21.2
21.4
21.6
21.8
22.0
22.2
22.4
22.6
22.8
2010 2020 2030 2040 2050 2060 2070 2080
Shar
e o
f Ir
riga
ted
Cu
ltiv
ate
d L
and
(p
erc
en
t)
Irrigation Share
Sustainability Middle of the Road Regional Rivalry
83
84
85
86
87
88
89
2010 2020 2030 2040 2050 2060 2070 2080
Cro
pp
ing
Inte
nsi
ty (
pe
rce
nt)
Cropping Intensity
Sustainability Middle of the Road Regional Rivalry
-200
-175
-150
-125
-100
-75
-50
-25
0
2010 2020 2030 2040 2050 2060 2070 2080
Cu
mu
lati
ve F
ore
st L
oss
(M
illio
n h
ect
are
)
Cumulative Forest Conversion
Sustainability Middle of the Road Regional Rivalry
0
50
100
150
200
2010 2020 2030 2040 2050 2060 2070 2080
Cu
mu
lati
ve
de
fore
sta
tio
n (
Mil
lio
n h
ec
tare
)
Cumulative Forest Loss (Regional Rivalry)
Africa Asia
Northern America Latin America & Caribbean
Europe Oceania

44
The smallest amount of global deforestation occurs in the Sustainability scenario, around 47 Million
hectares by 2050, and 56 Million hectares by 2080. In the Middle of the Road scenario, accumulated
forest conversion due to cropland expansion and urbanization is 80 Million hectares by 2050 and
reaches 110 Million hectares by 2080. The largest forest conversion takes place in the Regional Rivalry
scenario, accumulating to 117 Million hectares in 2050 and as much as 192 Million hectares by 2080.
Figure 4-20: Evolution of cultivated land, area equipped with irrigation demand in Asia under the different SSPs.
Since availability of additional land suitable for crop production is rather limited, especially in South
and East Asia, the growth in food demand and production has strong implications for the intensity of
production, both regarding required yield increases and enhanced multi-cropping.
The increase of cultivated land in Asia is very small compared to simulated production changes.
Projected cereal production in the three analyzed scenarios is up by 26 to 30 percent in 2050
compared to 2010, and by 36 to 40 percent in 2080. Total crop production in the Asia region (at FAO
I$2005 constant international prices of 2004-2006) increases by 31 to 37 percent in 2050 (relative to
2010) and by about 50 percent in 2080 compared to 2010. For livestock production the projected
increases in the Asia region are even higher, namely 58 to 67 percent in 2050, and 85 to 115 percent
in 2080.
As most of the production expansion is achieved through yield increases, this implies a further
intensification of input use in terms of agro-chemicals, energy and water. Especially in the intensively
farmed areas of South and East Asia this may increase the risks of environmental over-exploitation
500
510
520
530
540
550
560
570
580
2010 2020 2030 2040 2050 2060 2070 2080
Cu
ltiv
ate
d L
an
d (
Mill
ion
he
cta
re)
Cultivated Land
Sustainability Middle of the Road Regional Rivalry
220
230
240
250
260
270
280
2010 2020 2030 2040 2050 2060 2070 2080Ir
riga
ted
La
nd
(M
illio
n h
ect
are
)
Irrigated Land
Sustainability Middle of the Road Regional Rivalry
1,800
1,900
2,000
2,100
2,200
2,300
2,400
2,500
2010 2020 2030 2040 2050 2060 2070 2080
Irri
ga
tio
n W
ate
r (k
m3
/ye
ar)
Irrigation Water Requirement
Sustainability Middle of the Road Regional Rivalry
0
500
1000
1500
2000
2500
2010 2020 2030 2040 2050 2060 2070 2080
Irri
ga
tio
n R
eq
uir
em
en
t (k
m3
/yr)
Irrigation Demand (Middle of the Road)
Western Asia Southern Asia Central Asia
Eastern Asia South-Eastern Asia

45
and degradation. For instance in the Middle of the Road scenario, projected use of nitrogenous
fertilizers in 2050 in the Asia region is 43 percent higher than in 2010 and 48 percent higher in 2080.
For the land equipped with irrigation the projected extents increase from 227 Million hectares in 2010
to between 249 to 261 Million hectares in 2050, and between 246 and 278 Million hectare in 2080
(Figure 4-20). The aggregate regional irrigation share, i.e. the share of cultivated land equipped with
irrigation in total cultivated land, increases from 42 percent in 2010 to about 46 percent in 2050, and
48 percent in 2080.
For the year 2010 we obtained an estimate of irrigation water demand in the Asia region amounting
to 1852 km3/year. Keeping the irrigation system efficiency parameters at base year level, the irrigation
water requirements calculated for 2050 were in the range of 2109 km3/year (Sustainability scenario)
to 2226 km3/year (Regional Rivalry scenario), and in 2080 ranging from 2157 km3/year to 2425
km3/year or 16% to 31% above the level in 2010 (Figure 4-20).
Table 4-5: Climate and land use components of increased irrigation requirements in Asia
Climate change induced (% change relative to 2010)
Irrigated area increase (% change relative to 2010)
Irrigation requirements (% change relative to 2010)
Sustain-ability
Middle of the Road
Regional Rivalry
Sustain-ability
Middle of the Road
Regional Rivalry
Sustain-ability
Middle of the Road
Regional Rivalry
2030 1.6 2.8 2.8 7.8 8.0 7.6 8.9 10.5 9.9
2050 3.2 5.5 5.5 11.6 12.1 12.5 14.5 17.6 17.7
2080 5.6 9.7 9.7 11.2 14.4 17.1 17.1 24.7 27.1
Note: To account for climate change, RCP4p5 climate model results were used in the Sustainability scenario and RCP 6p0 results were used in the Middle of the Road and Regional Rivalry simulations.
The results in Table 4-5 indicate an aggregate impact of climate change on irrigation water
requirements due to warming in 2030 of 2.1% (in Sustainability scenario based on RCP 4p5) to 2.7%
(in RCP6p0). In 2050, the climate change impacts on irrigation water demand range from 4.1% to 5.4%,
and in 2080 the range becomes 7.2% to 9.4%. In comparison, cultivated land equipped with irrigation
in 2050 is 9.6% to 14.7% above the level in 2010, and by 8.7% to 20.6% in 2080.
Among all the major world regions distinguished in this analysis, Africa is envisaged to have the most
dynamic development, with population numbers increasing up to 3.3 times and GDP growing up to
30-fold in the period from 2010 to 2080. It does not come as a surprise that this macro-driver
development is resulting in rather dynamic trajectories of agricultural production and resource use,
as shown in Figure 4-21.

46
Figure 4-21: Evolution of cultivated land, area equipped with irrigation and cumulative deforestation in Africa under the
different SSPs.
African cultivated land use in 2010 is estimated at 264 Million hectares, increasing to extents between
288 Million hectares (scenario SSP1) to 331 Million hectares in 2030, to a range of 302 to 387 Million
hectares in 2050, and between 303 and 481 Million hectares in 2080. Only under the conditions of the
Sustainability scenario (SSP1) cultivated land us is projected to stabilize at about 300 Million hectares,
whereas land conversion for agricultural expansion continues throughout the simulation period in the
other two development pathways.
Figure 4-22: Evolution of irrigated land and irrigation water requirements in Africa under the Middle of the Road scenario.
250
300
350
400
450
500
2010 2020 2030 2040 2050 2060 2070 2080
Cu
ltiv
ate
d L
an
d (
Mill
ion
he
cta
re)
Cultivated Land
Sustainability Middle of the Road Regional Rivalry
12.5
15.0
17.5
20.0
22.5
25.0
2010 2020 2030 2040 2050 2060 2070 2080
Irri
gate
d L
an
d (
Mill
ion
he
cta
re)
Irrigated Land
Sustainability Middle of the Road Regional Rivalry
0
50
100
150
200
250
300
350
400
450
500
2010 2020 2030 2040 2050 2060 2070 2080
Cu
ltiv
ate
d l
an
d (
Mil
lio
n h
ect
are
s)
Cultivated Land (Regional Rivalry scenario)
Northern Africa Western Africa Middle Africa
Eastern Africa Southern Africa
-100
-75
-50
-25
0
2010 2020 2030 2040 2050 2060 2070 2080
Cu
mu
lati
ve F
ore
st L
oss
(M
illio
n h
ect
are
)
Cumulative Forest Conversion
Sustainability Middle of the Road Regional Rivalry
0
5
10
15
20
25
2010 2020 2030 2040 2050 2060 2070 2080
Cu
ltiv
ate
d l
an
d (
Mil
lio
n h
ect
are
s)
Irrigated Land (Middle of the Road)
Northern Africa Western Africa Middle Africa
Eastern Africa Southern Africa
0
50
100
150
200
250
300
350
400
450
500
2010 2020 2030 2040 2050 2060 2070 2080
Irri
ga
tio
n R
eq
uir
em
en
t (k
m3
/y
r)
Irrigation Demand (Middle of the Road)
Northern Africa Western Africa Middle Africa
Eastern Africa Southern Africa

47
Irrigation, although expanding swiftly as well, plays an important role only in two sub-regions,
Northern Africa and Southern Africa. Cultivation in the other sub-regions remains foremost rain-fed
with irrigation shares below 5%, albeit of a rapidly growing cultivated land base. Regional trajectories
of irrigated land and associated irrigation water requirements are shown in Figure 4-22.
Figure 4-23: Cumulative forest conversion due to cropland and urban land expansion in Africa under the Regional Rivalry
scenario.
As indicated earlier in Figure 4-19, African cropland expansion comes with significant deforestation,
notably in the Regional Rivalry scenario, where the pressure to produce food results in cumulative
forest conversion amounting to 54 Million hectares in 2050 and to nearly 100 Million hectares by 2080.
Note that nearly half of total forest conversion occurs in Middle Africa and about one quarter each in
the Western Africa and Eastern Africa regions.
4.3.4 Co ludi g re arks o Food a d agri ulture de elop e t
The quantified scenarios presented in this report illustrate the magnitude of challenges facing the
regional and global food and agricultural systems in the next decades. The analysis suggests that due
to the dynamics of demographic and economic development the required production increases in the
next two to three decades will fall within a relatively narrow range of outcomes if hunger is to be
successfully eliminated by mid-century. Beyond 2050, the differences in population numbers and
economic growth among scenarios become large and the scenarios portray vastly different demands
for agricultural products and associated resource use and environmental risks.
Production increases in all scenarios mainly rely on intensification, i.e. substantial increases of output
per unit of cultivated land. While this is possible and achievable due to large prevailing yield gaps in
Africa and developing Asia, it cannot be taken as given and will require major efforts by the countries
and the international community. Even then, only in two of the three scenarios adequate nutrition
levels are achieved in all regions and the risk of hunger is much reduced by 2050 and practically
eliminated by 2080. In the Regional Rivalry scenario food production in Africa and parts of Asia cannot
meet the demand of rapidly growing populations and the reduction of hunger stagnates at a relatively
high absolute level, still decreasing somewhat in terms of the percentage of population at risk.
0
20
40
60
80
100
120
140
2010 2020 2030 2040 2050 2060 2070 2080
Cu
mu
lati
ve
Fo
rest
Co
nv
ers
ion
(M
ha
)
Cumulative Forest Loss (Regional Rivalry)
Northern Africa Western Africa Middle Africa
Eastern Africa Southern Africa
1.3%
27.1%
45.6%
25.7%
0.3%
Regional Shares in Cumulative Forest Lost
(Regional Rivalry scenario in 2080)
Northern Africa
Western Africa
Middle Africa
Eastern Africa
Southern Africa

48
Figure 4-24: Cereal price index (2010=100) under the different SSP scenarios.
In the world food system model the various national/regional components are linked together by
means of a world market, where international clearing prices are computed to equalize global demand
with supply. The index of cereal prices generated in each scenario are shown in Figure 4-24. The cereal
price index can be interpreted as a stress indicator of the world food system. Under the Sustainability
scenario, cereal prices remain initially quite stable. A clear downward trend occurs beyond mid-
century, coinciding with the decline of world population numbers in this scenario. Price development
in the Regional Rivalry scenario signals that meeting food demand is becoming increasingly difficult in
this scenario and adds to the risk of hunger in this SSP3 world.
Cropland expansion and intensification, if not regulated and managed well, increase the risk of
environmental damages. Intensification inevitably means intensified application of nutrients and
other agro-chemicals, may results pollution and over-exploitation of water resources to meet
irrigation requirements, and may cause excessive deforestation when yield improvements do not
materialize as needed. Such specific assumptions can be tested in the modelling framework but have
not been explored in the current analysis. Also, the scenario implementations of the analysis
presented here have used empirical relationships of enriching diets with livestock products as per
capita incomes rise, leading as well to increasing feed requirements. In follow-up work we will explore
the differential impacts of widely adopting more healthy and less environmentally burdening diets
involving less livestock products than currently.
0.6
0.8
1.0
1.2
1.4
1.6
1.8
2.0
2010 2020 2030 2040 2050 2060 2070 2080
Po
pu
lati
on
(M
illio
n p
eo
ple
)Price Index, Cereals
Sustainability Middle of the Road Regional Rivalry

49
4.4 Water “uppl
Future projections of water availability over long time period at regional and country level, are
presented in this section. Climate change results in alterations in hydrological cycle and affects spatial-
temporal distribution of water resources (Field et al. 2012).
The severity of climate change is characterized here by using two different RCPs. The Sustainability
scenario is combined with RCP 4.5 which assumes that the difference of energy from sunlight absorbed
by the Earth and energy radiated back to space (radiative forcing) is stabilized before 2100 (see Box 1
in section 3.1). Causes of change in radiative forcing include changes in the concentrations of
greenhouse gases and aerosols.
The Middle of the Road and Regional Rivalry scenarios are combined with RCP 6.0 which assumes that
the radiative forcing is stabilized after 2100. Furthermore, population change is an important factor
for water resources assessment that needs to be considered since the finite water resources need to
be shared. Here, we analyze separately the three scenarios as their population projections are
different. The population dataset used in this assessment is based on (Jones and O'Neill 2013) which
downscaled and gridded the projected population based on the SSPs.
The WFaS project provides estimations of both surface water and groundwater resources availability.
The present analysis defines that surface water is composed of runoff within a region or country and
inflow through river networks.
4.4.1 A aila le surfa e ater
An impact assessment of climate change at sub-regional and country levels is presented here. This
macroscopic perspective provides highly valuable insights that are worth taking under consideration,
although it may overlook some aspects related to the heterogeneity of water resources and local scale
water issues.
Figure 4-25: Projections of surface water availability for the different continents under two scenarios until 2100
Available surface water resources at continent-level presented in Figure 4-25 shows a relatively
constant development as opposed to the development of population, GDP, or water demand
(presented in section 4.5). At sub-regional level the change will be small ranging from -5 to +5 per cent
(Figure 4-26 bottom).The change of surface water availability will be more pronounced at country
level as shown in Figure 4-26 which displays the spatial distribution of surface water resources
averaged for a ten year time period of 2005-2014 (henceforth the 2010s) compared to the time period
2045-2054 (henceforth the 2050s) for Middle of the Road and Rivalry scenarios. For instance, several
countries undergoing already water scarcity conditions in the 2010s will have to cope with lower
surface water resources availability in the 2050s. Figure 4-26 middle shows a band of decreasing water
0
10000
20000
30000
40000
50000
2010 2020 2030 2040 2050 2060 2070 2080 2090 2100
Africa Asia
North and Central America South America
Europe Oceania
0
10000
20000
30000
40000
50000
2010 2020 2030 2040 2050 2060 2070 2080 2090 2100
Africa Asia
North and Central America South America
Europe Oceania
Water supply - Sustainability Water supply - Middle of the Road & RivalryKm3/yr Km3/yr

50
resources availability from Spain and Morocco to Pakistan. Below this band there is a strip with
increasing water resources availability from Mauritania to Sudan. These countries have to face a South
(more water) - North (less water) difference. On the other hand, almost all African countries have to
ope ith a la ge de adal a ia ilit hi h a e see fo the ase of Nige . Nige s ate esou es availability will increase but for the time period 2045-2054 all forcing climate models show in addition
a peak in precipitation compared to the period 2035-2045 or 2055-2064.
Figure 4-26: Available surface water – Middle of the Road scenario
Top: Available surface water 2010.
Middle: Available surface water 2050.
Bottom: change rate of available surface water [%] compared to 2010
4.4.2 A aila le surfa e ater per apita
Available surface water resources per capita (the so-called the Falkenmark Indicator) is one of the
most widely used measures of water stress, (Falkenmark 1989). Based on the per capita water
availability, the water conditions in an area can be categorized as:

51
o st ess > / ea / ap
st ess - / ea / ap
s a it - / ea / ap
a solute s a it < / ea / ap
In some reports the range between 1700 and 2500 m3/year/cap is described as vulnerability range
(WWAP 2015). In this study, the total renewable water resources are not restricted to the local (i.e.
per country) available freshwater, but it includes also the water resources originating from upstream
countries (more details can be found in section 4.4.4 on transboundary dependency). Therefore, some
countries such as Egypt and Sudan (fed by the upper Nile) or India (fed by Indus, and Ganges-
Brahmaputra) does not appear in the water scarcity categories in contrast to other publications such
as the 2015 World Water Development Report (WWAP 2015).
According to Falkenmark indicator, Morocco, Algeria, Tunisia, the Arabic peninsula, Pakistan and China
a e al ead atego ized i to st ess i the ea l half of st century under all three scenarios. Table
4-6 ranks the countries with the lowest water resources availability per capita across the world.
Table 4-6: Available surface water per capita – ranking of the countries with lowest water per capita worldwide
For countries from Morocco to Bangladesh water resources per capita will generally decrease
triggered mainly by population growth, but also by declining water resources (see Figure 4-3 and
Figure 4-27 For some African countries such as Burkina Faso, Uganda, Burundi, Rwanda, Kenya, and
Nigeria, the situation will worsen mainly because of the impact of population change. The opposite
trend is projected for the cases of Poland which goes from vulnerable in the 2010s to no stress in the
2050s, and China which is under water stress in the 2010s but will be in the category above
1700 m3/year/cap in two out of three scenarios in the 2050s.
Water per capita 2010
[ m3/year/cap ]
Qatar 130 60 - 110 46% - 85%
Yemen 430 140 - 290 33% - 67%
Bahrain 450 120 - 250 27% - 56%
Jordan 550 220 - 230 40% - 42%
Oman 720 570 - 720 79% - 100%
Israel 890 390 - 500 44% - 56%
Cape Verde 920 1230 - 2150 134% - 234%
Saudi Arabia 1020 400 - 690 39% - 68%
Djibouti 1070 280 - 470 26% - 44%
Algeria 1070 600 - 650 56% - 61%
Lebanon 1150 750 - 820 65% - 71%
Morocco 1220 640 - 840 52% - 69%
Pakistan 1250 600 - 860 48% - 69%
United Arab Emirates 1420 600 - 1220 42% - 86%
Tunisia 1570 980 - 1110 62% - 71%
Eritrea 1620 700 - 720 43% - 44%
Singapore 1680 1340 - 1400 80% - 83%
China 1690 1720 - 1920 102% - 114%
Belgium 1700 1420 - 1720 84% - 101%
2050
between 3 scenarios between 3 scenarios
2050 (% of 2010)

52
Figure 4-27: Available surface water – Middle of the Road scenario
Top: Available surface water per capita 2010. Available surface water per capita 2050.
Bottom: Sub-country scale of Available surface water per capita 2050 for three regions
Despite the fact that Figure 4-27 shows countries with or without water stress, a detailed analysis at
the sub-country scale is needed. USA and Mexico are categorized not water stressed countries but
there are hotspots of absolute scarcity such as California, Baja California, and Central Mexico. Egypt is
also not categorized as water stressed because the major part of population lives on the shore of the
Nile, although large parts of the country suffer from absolute water scarcity. Furthermore, countries
located in the tropics such as Indonesia with average water resources availability of around
17,000 m3/year/cap has water scarce areas in Java where almost half of the population of Indonesia
is living (140 million).

53
Austria and priority countries of the Austrian Development Agency
Table 4-7 and Figure 4-28 present total and per capita available surface water resources in the 2010s
and the 2050s for Austria and ADA priority countries. By the 2050s, the range of water availability per
capita between the three scenarios is shown. Some countries such as Armenia, Ethiopia and Uganda
are or will move into the category ul e a le . Although ate a aila ilit ill i ease i Bu ki a Faso by around 1.5 times, this will be overtopped by population increase of around 2.3 times, pushing
Burkina Faso into the water stress and water scarcity categories, depending on the scenario.
Table 4-7: Available surface water per capita – ADA priority countries
Available surface
water Avail. sur. water per cap
[km3/year] [km3/year/cap]
2010 2050 2010 2050
Austria 98 93 - 100 11600 9700 - 13000
Albania 50 41 - 43 15400 11900 - 13500
Moldova 22 20 - 22 6200 8200 - 10200
Armenia 7 5 - 6 2200 2000 - 2300
Georgia 69 60 - 64 15800 16500 - 19700
Bhutan 51 45 - 50 69500 35000 - 44000
Burkina Faso 28 39 - 43 1700 820 – 1300
Ethiopia 413 413 - 453 5000 2200 - 3200
Uganda 161 190 - 195 4800 1700 – 2500
Mozambique 601 559 - 595 25600 12600 - 14800
Figure 4-28: Available surface water per capita for ADA priority countries – three scenario comparison
Sustainability Middle of the Road Regional Rivalry
0
500
1000
1500
2000
2500
3000
3500
4000
Armenia
0
5000
10000
15000
20000
25000
30000
35000
Georgia
0
10000
20000
30000
40000
50000
60000
70000
80000
Bhutan
0
200
400
600
800
1000
1200
1400
1600
1800
2000
Burkina Faso
0
2000
4000
6000
8000
10000
12000
14000
16000
18000
20000
Albania
0
2000
4000
6000
8000
10000
12000
14000
16000
18000
Austriam3/year/cap
0
1000
2000
3000
4000
5000
6000
Ethiopia
0
1000
2000
3000
4000
5000
6000
Uganda
0
5000
10000
15000
20000
25000
30000
Mozambique
m3/year/cap m3/year/cap m3/year/cap m3/year/cap
m3/year/cap m3/year/cap m3/year/cap m3/year/cap
0
5000
10000
15000
20000
25000
Moldovam3/year/cap
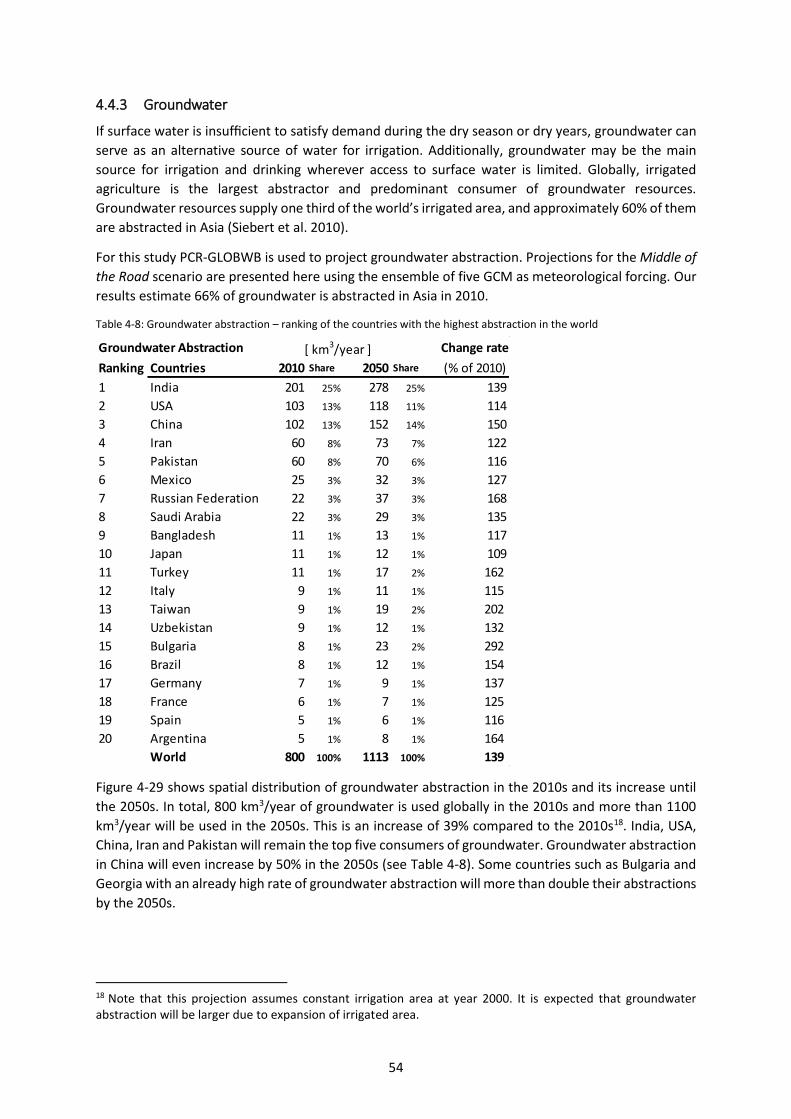
54
4.4.3 Grou d ater
If su fa e ate is i suffi ie t to satisf de a d du ing the dry season or dry years, groundwater can
serve as an alternative source of water for irrigation. Additionally, groundwater may be the main
source for irrigation and drinking wherever access to surface water is limited. Globally, irrigated
agriculture is the largest abstractor and predominant consumer of groundwater resources.
Groundwater resources supply o e thi d of the o ld s i igated a ea, a d app o i atel % of the are abstracted in Asia (Siebert et al. 2010).
For this study PCR-GLOBWB is used to project groundwater abstraction. Projections for the Middle of
the Road scenario are presented here using the ensemble of five GCM as meteorological forcing. Our
results estimate 66% of groundwater is abstracted in Asia in 2010.
Table 4-8: Groundwater abstraction – ranking of the countries with the highest abstraction in the world
Figure 4-29 shows spatial distribution of groundwater abstraction in the 2010s and its increase until
the 2050s. In total, 800 km3/year of groundwater is used globally in the 2010s and more than 1100
km3/year will be used in the 2050s. This is an increase of 39% compared to the 2010s18. India, USA,
China, Iran and Pakistan will remain the top five consumers of groundwater. Groundwater abstraction
in China will even increase by 50% in the 2050s (see Table 4-8). Some countries such as Bulgaria and
Georgia with an already high rate of groundwater abstraction will more than double their abstractions
by the 2050s.
18 Note that this projection assumes constant irrigation area at year 2000. It is expected that groundwater
abstraction will be larger due to expansion of irrigated area.
Groundwater Abstraction Change rate
Ranking Countries 2010 Share 2050 Share (% of 2010)
1 India 201 25% 278 25% 139
2 USA 103 13% 118 11% 114
3 China 102 13% 152 14% 150
4 Iran 60 8% 73 7% 122
5 Pakistan 60 8% 70 6% 116
6 Mexico 25 3% 32 3% 127
7 Russian Federation 22 3% 37 3% 168
8 Saudi Arabia 22 3% 29 3% 135
9 Bangladesh 11 1% 13 1% 117
10 Japan 11 1% 12 1% 109
11 Turkey 11 1% 17 2% 162
12 Italy 9 1% 11 1% 115
13 Taiwan 9 1% 19 2% 202
14 Uzbekistan 9 1% 12 1% 132
15 Bulgaria 8 1% 23 2% 292
16 Brazil 8 1% 12 1% 154
17 Germany 7 1% 9 1% 137
18 France 6 1% 7 1% 125
19 Spain 5 1% 6 1% 116
20 Argentina 5 1% 8 1% 164
World 800 100% 1113 100% 139
[ km3/year ]

55
Figure 4-29: Groundwater abstraction in the 2010s - Middle of the Road scenario
Top: Groundwater abstraction in the 2010s. Bottom: Change (in Mio m3/year) till 2050
Rapid aquifer depletion due to overexploitation (abstraction exceeds recharge) is a growing issue
globally. It gives rise to many economic and environmental problems such as rising of pumping costs,
desiccation of wetlands, decline of river
flows, and increase of pollution risk.
Figure 4-30 shows groundwater abstraction
in India, China and Pakistan originating from
both renewable and non-renewable
resources. Abstraction from non-renewable
resources in India, China, and Pakistan
represents approximately 24%, 12%, and
55% of their groundwater abstraction,
respectively. Although the absolute amount
of groundwater abstraction in Pakistan is
the smallest, the share of abstraction
originating from nonrenewable
groundwater resources is the largest.
Figure 4-30: Groundwater abstraction in India, China and Pakistan

56
Austria and priority countries of the Austrian Development Agency
Table 4-9 shows groundwater abstraction in
the 2010s and its increase until the 2050s for
Austria and ADA priority countries. Results
indicate that countries with a lower
abstraction rate in the 2010s such as Uganda
and Mozambique show a high increase rate.
Georgia will be within the top twenty biggest
groundwater users around the world in the
2050s, with an increase rate of more than
100%. In the next phase of its work WFaS will
determine whether this level of groundwater
use is sustainable or not, and what solutions
can be implemented to prevent the
overexploitation of groundwater.
4.4.4 Tra s ou dar depe de of ater resour es
A out % of the o ld s populatio li es i a d a ou d i e a d lake asi s that o p ise t o o more countries and over 90% lives in countries that share basins. The existing 263 transboundary lake
and river basins cover ea l o e half of the Ea th s la d su fa e a d a ou t fo a esti ated % of global freshwater flows (UN-Water 2008).
The water dependency ratio is defined by (Food and Agriculture Organization (FAO) 2010) as the
proportion of renewable water resources within a country that originates outside its borders therefore
it is an indicator of the level of dependence of a country on its neighbors in terms of water resources.
A country with a ratio of 1 receives all its renewable water from upstream countries. Figure 4-31 shows
three examples of water dependency. Ethiopia has a low water dependency of 4%, Syria has a high
dependency of 73%, and Egypt imports almost all its water (94% dependency rate). Results indicate
also that water availability and the linked dependency ratio change during the year.
Figure 4-31: Flow regime and water dependency in the 2010s (2005-2014) at the example of Ethiopia, Syria and Egypt
In contrast to the historical ratio given by FAO AQUASTAT, the indicator is calculated using five
different GCMs and 3 different GHMs. The water dependency ratio does not include groundwater use
or possible allocation of water to downstream countries through water transfer.
Figure 4-32 shows the percentage of total renewable water resources originating from outside a
country and it depicts main areas of water dependency in Europe (Danube, Volga), in Asia (Syr Darya,
Amu Darya, Indus, Ganges–Brahmaputra), Africa (Nile, Niger, Okavango, Zambezi, Congo) and in South
America (Rio Paraguay, Rio Uruguay). The dependency ratio does not change significantly by 2050.
The water dependency ratio does not take into account the total water demand. It is only based on
the water supply and does not indicate if the local (by country) freshwater is sufficient to meet total
water demand.
0
20
40
60
80
100
0
20
40
60
80
100
Jan Feb Mar Apr May Jun Jul Aug Sep Oct Nov Dec
De
pe
nd
en
cy r
ati
o [
%]
Acc
um
ula
ted
ru
no
ff [
km3/m
on
th] Ethiopia
Internal External Dependency ratio
0
10
20
30
40
50
60
70
80
90
100
0
2
4
6
8
10
12
Jan Feb Mar Apr May Jun Jul Aug Sep Oct Nov Dec
De
pe
nd
en
cy r
ati
o [
%]
Acc
um
ula
ted
ru
no
ff [
km3/m
on
th] Syria
Internal External Dependency ratio
0
10
20
30
40
50
60
70
80
90
100
0
20
40
60
80
100
120
Jan Feb Mar Apr May Jun Jul Aug Sep Oct Nov Dec
De
pe
nd
en
cy r
ati
o [
%]
Acc
um
ula
ted
ru
no
ff [
km3/m
on
th] Egypt
Internal External Dependency ratio
Table 4-9: Groundwater abstraction – ADA priority countries
Groundwater Abstraction Change rate
[ Mio m3/year ] 2010 2050 (% of 2010)
Austria 1249 1571 126
Albania 460 569 124
Moldova 609 1724 283
Armenia 773 1337 173
Georgia 4260 10320 242
Bhutan 18 48 269
Burkina Faso 0.5 6 1190
Ethiopia 10 21 201
Uganda 3 17 559
Mozambique 33 71 212

57
Figure 4-32: Dependency ratio 2010 (definition based on FAO AQUASTAT)
Austria and priority countries of the Austrian Development Agency
Figure 4-33 shows the water dependency ratio over the year (average for each month from 2005 to
2014) for Austria and the ADA priority countries. The water dependency rate for Austria is quite high,
mainly because of the inflow from the Upper Danube but the flow regime does not show pronounced
dry and wet seasons. This is different for almost all the other countries where seasonal variations
might lead to water shortage in some months and the need for inter-countries policy guidance to
share the scarce water resources in these months.
Figure 4-33: Dependency ratio of the ADA priority countries
0
20
40
60
80
100
0
2
4
6
8
10
12
Jan Feb Mar AprMay Jun Jul Aug Sep Oct Nov Dec
De
pe
nd
en
cy r
ati
o [
%]
Acc
um
ula
ted
ru
no
ff
[km
3/m
on
th]
Austria - avg. dep. ratio: 45%
Internal External Dependency ratio
0
20
40
60
80
100
0
1
1
2
2
Jan Feb Mar AprMay Jun Jul Aug Sep Oct Nov Dec
De
pe
nd
en
cy r
ati
o [
%]
Acc
um
ula
ted
ru
no
ff
[km
3/m
on
th]
Armenia - avg. dep. ratio: 25%
Internal External Dependency ratio
0
20
40
60
80
100
0
2
4
6
8
Jan Feb Mar AprMay Jun Jul Aug Sep Oct Nov Dec
De
pe
nd
en
cy r
ati
o [
%]
Acc
um
ula
ted
ru
no
ff
[km
3/m
on
th]
Albania - avg. dep. ratio: 41%
Internal External Dependency ratio
0
20
40
60
80
100
0
2
4
6
8
10
12
Jan Feb Mar AprMay Jun Jul Aug Sep Oct Nov Dec
De
pe
nd
en
cy r
ati
o [
%]
Acc
um
ula
ted
ru
no
ff
[km
3/m
on
th]
Georgia - avg. dep. ratio: 16%
Internal External Dependency ratio
0
20
40
60
80
100
0
2
4
6
8
10
12
Jan Feb Mar AprMay Jun Jul Aug Sep Oct Nov Dec
De
pe
nd
en
cy r
ati
o [
%]
Acc
um
ula
ted
ru
no
ff
[km
3/m
on
th]
Bhutan - avg. dep. ratio: 26%
Internal External Dependency ratio
0
20
40
60
80
100
0
20
40
60
80
100
Jan Feb Mar AprMay Jun Jul Aug Sep Oct Nov Dec
De
pe
nd
en
cy r
ati
o [
%]
Acc
um
ula
ted
ru
no
ff
[km
3/m
on
th]
Ethiopia - avg. dep. ratio: 4%
Internal External Dependency ratio
0
20
40
60
80
100
0
2
4
6
8
10
12
Jan Feb Mar AprMay Jun Jul Aug Sep Oct Nov Dec
De
pe
nd
en
cy r
ati
o [
%]
Acc
um
ula
ted
ru
no
ff
[km
3/m
on
th]
Burkina Faso - avg. dep. ratio: 23%
Internal External Dependency ratio
0
20
40
60
80
100
0
5
10
15
20
25
30
Jan Feb Mar AprMay Jun Jul Aug Sep Oct Nov Dec
De
pe
nd
en
cy r
ati
o [
%]
Acc
um
ula
ted
ru
no
ff
[km
3/m
on
th]
Uganda - avg. dep. ratio: 42%
Internal External Dependency ratio
0
20
40
60
80
100
0
50
100
150
Jan Feb Mar AprMay Jun Jul Aug Sep Oct Nov Dec
De
pe
nd
en
cy r
ati
o [
%]
Acc
um
ula
ted
ru
no
ff
[km
3/m
on
th]
Mozambique - avg. dep. ratio: 54%
Internal External Dependency ratio
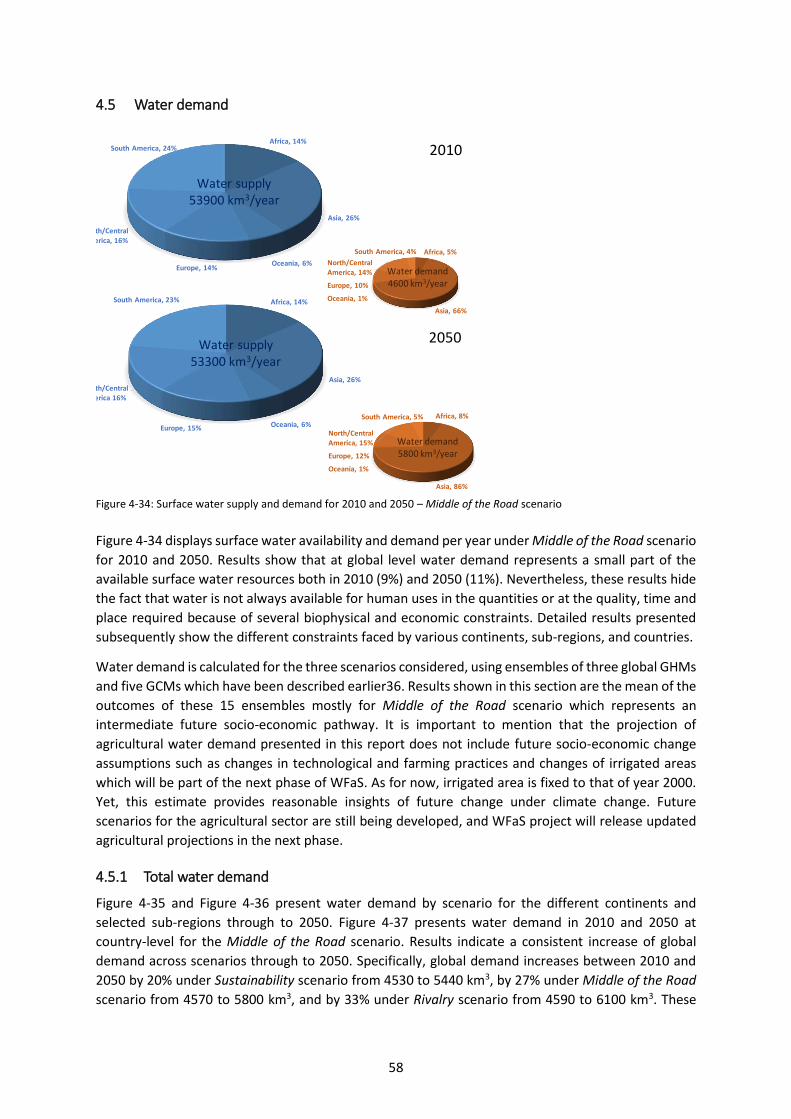
58
4.5 Water de a d
Figure 4-34: Surface water supply and demand for 2010 and 2050 – Middle of the Road scenario
Figure 4-34 displays surface water availability and demand per year under Middle of the Road scenario
for 2010 and 2050. Results show that at global level water demand represents a small part of the
available surface water resources both in 2010 (9%) and 2050 (11%). Nevertheless, these results hide
the fact that water is not always available for human uses in the quantities or at the quality, time and
place required because of several biophysical and economic constraints. Detailed results presented
subsequently show the different constraints faced by various continents, sub-regions, and countries.
Water demand is calculated for the three scenarios considered, using ensembles of three global GHMs
and five GCMs which have been described earlier36. Results shown in this section are the mean of the
outcomes of these 15 ensembles mostly for Middle of the Road scenario which represents an
intermediate future socio-economic pathway. It is important to mention that the projection of
agricultural water demand presented in this report does not include future socio-economic change
assumptions such as changes in technological and farming practices and changes of irrigated areas
which will be part of the next phase of WFaS. As for now, irrigated area is fixed to that of year 2000.
Yet, this estimate provides reasonable insights of future change under climate change. Future
scenarios for the agricultural sector are still being developed, and WFaS project will release updated
agricultural projections in the next phase.
4.5.1 Total ater de a d
Figure 4-35 and Figure 4-36 present water demand by scenario for the different continents and
selected sub-regions through to 2050. Figure 4-37 presents water demand in 2010 and 2050 at
country-level for the Middle of the Road scenario. Results indicate a consistent increase of global
demand across scenarios through to 2050. Specifically, global demand increases between 2010 and
2050 by 20% under Sustainability scenario from 4530 to 5440 km3, by 27% under Middle of the Road
scenario from 4570 to 5800 km3, and by 33% under Rivalry scenario from 4590 to 6100 km3. These
Africa, 14%
Asia, 26%
Oceania, 6%Europe, 14%
North/Central
America, 16%
South America, 24%
Africa, 14%
Asia, 26%
Oceania, 6%Europe, 15%
North/Central
America 16%
South America, 23%
Africa, 5%
Asia, 66%
North/Central
America, 14%
Europe, 10%
Oceania, 1%
South America, 4%
Africa, 8%
Asia, 86%
North/Central
America, 15%
Europe, 12%
Oceania, 1%
South America, 5%
Water supply
53900 km3/year
Water supply
53300 km3/year
Water demand
4600 km3/year
Water demand
5800 km3/year
2010
2050

59
considerable differences among water demand projections (ranging from 360 to 660 km3 per year)
u de the a ious s e a ios u de li e the i po ta e of hu a so iet s hoi e of owadays policies
that will shape its future socio-economic and climatic conditions.
During the next decades, the most intensive growth in water demand across the world is expected to
occur in Africa, South America, and Asia, under all scenarios, and in Europe under Middle of the Road
and Rivalry scenarios. Water demand in Africa will expand rapidly (up to 60% by 2050 compared to
2010) compared to all other continents driven by the intensive growth of population and income,
although its share from global demand remains small (about 6%). Water demand in South America
will also rise significantly (up to 50% by 2050 compared to 2010) owing to both population and income
growth, but its share from global demand is at present 4% and in 2050 it will be 5%. At present, 65%
of global water demand takes place in Asia, where the major irrigated land of the world is located. By
2050, water demand in Asia will grow by 30%, to represent about 70% of global demand, brought
about primarily by income growth. The increase of water demand in Europe depends on the scenario
considered. It increases slightly (by 9%) under the sustainability scenario due to the assumed
technological improvement, but it escalates substantially under Middle of the Road and Rivalry
scenarios (between 25 and 35%), driven mainly by the limited technological progress. Its share from
global demand will amount to 10% by 2050.
Figure 4-35: Total water demand by continent until 2050.
Figure 4-36: Total water demand by sub-region in Africa, Asia and Europe until 2050
The smallest changes of water demand across the world by 2050 compared to 2010 will be seen in
Oceania, and North and Central America. Water demand in Oceania will moderately increase under
all scenarios up to 18% owing to the slow growth of GDP compared to other continents. Oceania holds
the lowest share of global demand (about 1%).
0
1000
2000
3000
4000
5000
6000
2010 2020 2030 2040 2050
Africa Asia
North and Central America South America
Europe Oceania
0
1000
2000
3000
4000
5000
6000
2010 2020 2030 2040 2050
Africa Asia
North and Central America South America
Europe Oceania
0
1000
2000
3000
4000
5000
6000
2010 2020 2030 2040 2050
Africa Asia
North and Central America South America
Europe Oceania
Total water demand - Sustainability Total water demand - Middle of the Road Total water demand - RivalryKm3/yr Km3/yr Km3/yr
0
100
200
300
400
2010 2020 2030 2040 2050
Northern Africa Western Africa Middle Africa
Eastern Africa Southern Africa
0
1000
2000
3000
4000
2010 2020 2030 2040 2050
Western Asia Southern Asia
Central Asia Eastern Asia
South-Eastern Asia
0
200
400
600
2010 2020 2030 2040 2050
Western Europe Southern Europe
Northern Europe Eastern Europe
Europe - Total water demand - Middle of the RoadAsia - Total water demand - Middle of the RoadAfrica - Total water demand - Middle of the RoadKm3/yr Km3/yrKm3/yr
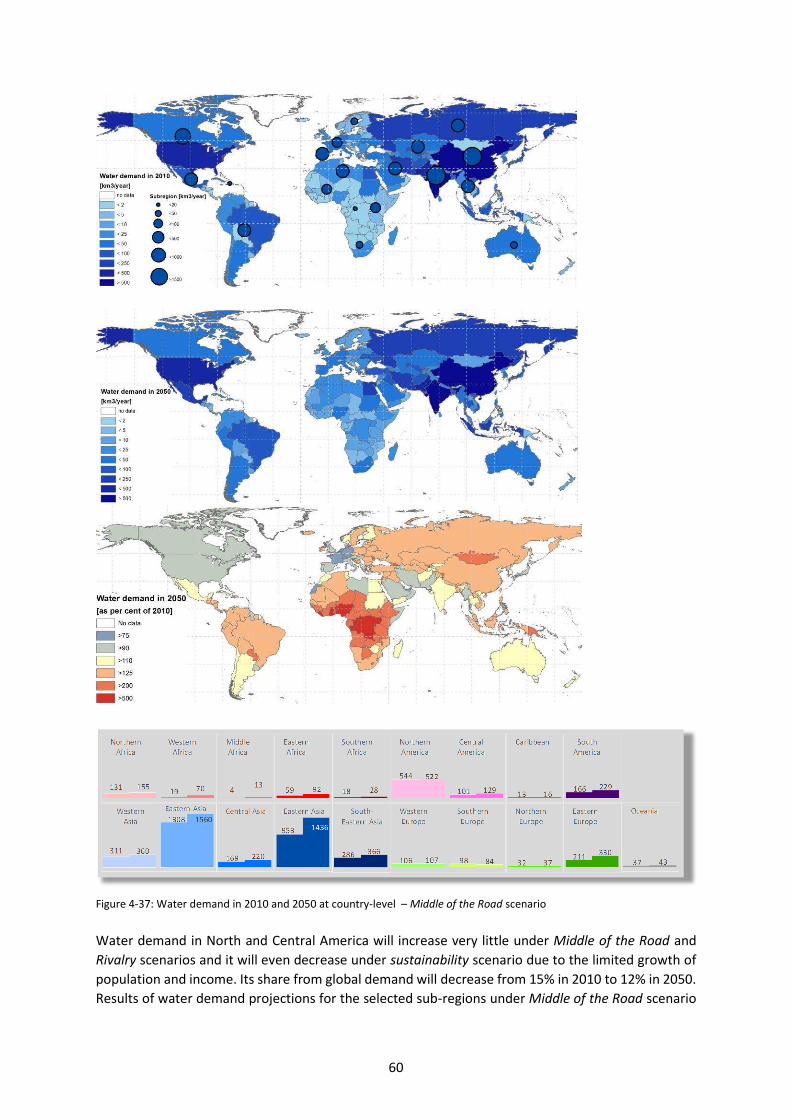
60
Figure 4-37: Water demand in 2010 and 2050 at country-level – Middle of the Road scenario
Water demand in North and Central America will increase very little under Middle of the Road and
Rivalry scenarios and it will even decrease under sustainability scenario due to the limited growth of
population and income. Its share from global demand will decrease from 15% in 2010 to 12% in 2050.
Results of water demand projections for the selected sub-regions under Middle of the Road scenario

61
show significant differences among these sub-regions. In fact, water demands are very unevenly
distributed by the sub-regions of the continents and do not generally coincide with the availability of
water resources. For Africa, water demand in northern Africa remains the largest in the continent.
It increases by 18% between 2010 and 2050, although its share in total African demand is falling from
60 to 40% in the same period. By contrast, the share of western Africa sub-region of total African
demand is rising markedly from 8 to 20% between 2010 and 2050, sustained by a rapid demand
increase of more than three and a half times (about 51 km3). Water demand in Middle Africa will
increase threefold, with its share from Africa total demand increasing from 2 to 4% between 2010 and
2050. Water demand in eastern and southern Africa sub-regions will increase steadily, maintaining
their shares in Africa total demand.
For Asia, water demand in Southern Asia remains the largest by 2050 (40% of Asia total demand),
although it increases slightly between 2010 and 2050. Water demand in eastern Asia will increase
considerably between 2010 and 2050 (by 50% or 483 km3), to represent about 36% of Asia total
demand by 2050. Water demand in the other sub-regions will increase steadily, maintaining their
shares in Asia total demand.
For Europe, water demand in Eastern Europe in 2010 is the largest across the continent, and it will
remain so by 2050, with an increase of demand by 56% (or 119 km3) between 2010 and 2050. On the
other hand, the shares of water demand in Western and Southern Europe of total European demand
will fall as the demand will be almost the same in Western Europe and will decrease in Southern
Europe by 2050 compared to 2010 because of the technological change assumptions to use water
more efficiently (see sector 3.4 and table 3.2) and low population growth. Water demand in Northern
Europe will increase steadily, due to a higher population growth compared to Western and Southern
Europe. Northern Europe will maintaining its share in Europe total demand.
Results at country-level indicate that water demands in China, India, United States, Russia, and
Pakistan are at present the largest across the world and they will remain so in the 2050s. Major
absolute increases of demand worldwide will take place in China (478 km3), India (203 km3), and Russia
(66 km3). However, the major relative increases in water demand worldwide will be seen in many
African countries such as Uganda, Rwanda, Liberia, DR Congo, Congo, Gambia, and Nigeria, with
demands are expected to increase more than six fold by 2050 for the Middle of the Road scenario. In
Asia, water demand will double by 2050 compared to 2010 in many countries including Armenia,
Georgia, Papua New Guinea, and Mongolia. In Europe, water demand will rise in the Eastern part
between 2010 and 2050, especially in Moldova, Ukraine, Bulgaria, and Czech Republic. In South
America, water demand will rise in all countries between 2010 and 2050, especially in Paraguay,
Columbia, and Bolivia. In North and Central America, water demand will increase significantly between
2010 and 2050 in some countries such as Panama, Guatemala, and Nicaragua.
The present assessment does not analyze the impacts of demand change on water quality. However,
it is expected that the growth of water demand, the increasing importance of domestic and industrial
waste water discharges, and the potential increase of fertilizers utilization, due to the need to improve
agricultural productivity, will impair water quality if no adequate abatement measures are
implemented.

62
Figure 4-38: Share of agricultural water demand in 2010 and changes by 2050
4.5.2 Water de a d ha ge se tor
Table 4-10 shows water demand in 2010 and
2050 by continent and sector and Figure 4-38
shows changes of the share of agricultural
water demand by 2050 at country level under
Middle of the Road scenario. It is important to
analyze the contribution of each sector to
total water demand in each continent, sub-
region, and country because it indicates in
which sector water policy interventions
should mostly be implemented to address
water scarcity.
Results indicate that agriculture currently
represents the major water demand sector at
global level and in all continents, except in
Europe. The share of agricultural water
demand represents about 70% of total global
demand, about 80% of total demand in
Africa, Asia, and Oceania, and about 50% in
North, Central and South America. In Europe,
industry represents the major water demand
sector, with its share exceeding 50% of total
demand. By 2050, the share of agricultural
demand will decrease in all continents,
except in North and Central America, due to
the intensive expansion of other water uses,
driven by population and income growth.
Agriculture will remain the major demand
sector at global level, representing 60% of
total demand. The loss of the relative
Table 4-10: Water demand by continent and sector under the
Middle of the road scenario.
Total water demand Change rate
[ km3/year ] 2010 Share 2050 Share (% of 2010)
Africa 231 100% 359 100% 155
Asia 3026 100% 3941 100% 130
North and Central Amer 659 100% 667 100% 101
South America 166 100% 229 100% 137
Europe 447 100% 558 100% 125
Oceania 37 100% 43 100% 115
World 4566 100% 5796 100% 127
Agr. water demand Change rate
[ km3/year ] 2010 Share 2050 Share (% of 2010)
Africa 187 81% 194 54% 103
Asia 2508 83% 2617 66% 104
North and Central Amer 348 53% 367 55% 106
South America 97 58% 99 44% 103
Europe 133 30% 139 25% 105
Oceania 30 80% 31 73% 105
World 3302 72% 3447 100% 104
Ind. water demand Change rate
[ km3/year ] 2010 Share 2050 Share
Africa 18 8% 64 18% 353
Asia 316 10% 760 19% 240
North and Central Amer 229 35% 182 27% 80
South America 31 19% 47 21% 153
Europe 241 54% 325 58% 135
Oceania 2 5% 3 7% 144
World 838 18% 1381 24% 165
Dom. water demand Change rate
[ km3/year ] 2010 Share 2050 Share
Africa 26 11% 101 28% 390
Asia 202 7% 565 14% 280
North and Central Amer 82 13% 118 18% 143
South America 39 23% 82 36% 211
Europe 72 16% 93 17% 128
Oceania 6 15% 9 21% 160
World 427 9% 967 17% 227
Amount
Amount
Amount
Amount

63
importance of agricultural demand will be
especially pronounced in Africa and Asia
where most of global population and
economic growth will take place.
Agricultural water demand will change
between 2010 and 2050 for all sub-regions.
Major absolute increases will be seen in
Southern Asia (61 km3), Eastern Asia (25
km3), Western Asia (14 km3), and Northern
America (14 km3). Agricultural demand will
decrease slightly only in Northern Europe.
In relative term, demand changes will
range between -2% in northern Europe and
+8% in Southern Africa. On the other hand,
domestic water demand will increase
significantly in all sub-regions, except in
Western Europe where it stagnates. Major
absolute increases will be seen in Eastern
Asia (159 km3), Southern Asia (114 km3),
South-eastern Asia (45 km3), and South
America (43 km3). In relative term,
domestic demand will rise by more than
threefold in All African and Asian sub-
regions, and it will more than double in
Central and South America. Industrial
water demand will increase in all sub-
regions, except Northern America, and
western and Southern Europe. Major
absolute increases will be seen in Eastern
Asia (300 km3), Eastern Europe (100 km3),
and Southern Asia (77 km3). In relative
term, industrial demand will grow up to
eight times in Western, Middle, Eastern
and Southern Africa, but from a much
lower base compared to other sub-regions
across the world. Industrial demand will
also increase significantly in Southern,
Central, and Eastern Asia up to two and a
half times.
Table 4-11: Water demand by sector in ADA priority countries
under
Middle of the road scenario
Total water demand Change rate
[ km3/year ] 2010 Share 2050 Share (% of 2010)
Austria 3.4 100% 3.3 100% 94
Albania 1.9 100% 2.4 100% 124
Moldova 3.1 100% 7.6 100% 244
Armenia 3.4 100% 5.4 100% 157
Georgia 3.0 100% 8.3 100% 273
Bhutan 0.7 100% 0.9 100% 142
Burkina Faso 0.5 100% 2.1 100% 384
Ethiopia 3.0 100% 12.8 100% 420
Uganda 0.4 100% 5.8 100% 1350
Mozambique 1.0 100% 2.0 100% 192
Agr. water demand Change rate
[ km3/year ] 2010 Share 2050 Share (% of 2010)
Austria 0.17 5% 0.18 5% 103
Albania 1.20 62% 1.40 59% 117
Moldova 1.08 35% 1.10 15% 102
Armenia 1.54 45% 1.70 31% 110
Georgia 0.79 26% 0.91 11% 115
Bhutan 0.65 97% 0.66 69% 102
Burkina Faso 0.23 42% 0.23 11% 101
Ethiopia 1.93 63% 1.98 15% 102
Uganda 0.03 8% 0.03 1% 94
Mozambique 0.76 73% 0.8 42% 111
Ind. water demand Change rate
[ km3/year ] 2010 Share 2050 Share (% of 2010)
Austria 2.57 75% 2.33 72% 91
Albania 0.25 13% 0.36 15% 144
Moldova 1.81 58% 5.96 79% 329
Armenia 0.71 21% 1.24 23% 174
Georgia 1.40 46% 4.97 60% 356
Bhutan 0.01 0% 0.18 19% 2224
Burkina Faso 0.05 1% 0.35 17% 703
Ethiopia 0.22 7% 3.01 23% 1358
Uganda 0.10 23% 0.78 14% 792
Mozambique 0.03 3% 0.13 7% 469
Dom. water demand Change rate
[ km3/year ] 2010 Share 2050 Share (% of 2010)
Austria 0.70 20% 0.75 23% 106
Albania 0.48 25% 0.62 26% 129
Moldova 0.20 7% 0.50 7% 248
Armenia 1.19 35% 2.48 46% 208
Georgia 0.84 28% 2.40 29% 285
Bhutan 0.01 2% 0.11 11% 795
Burkina Faso 0.27 49% 1.51 72% 567
Ethiopia 0.89 29% 7.83 61% 875
Uganda 0.29 69% 4.94 86% 1677
Mozambique 0.25 24% 1.01 51% 402
Amount
Amount
Amount
Amount

64
Austria and priority countries of the Austrian Development Agency
Table 4-11 provides information on total and sectoral water demand for Austria and ADA priority
countries in 2010 and 2050. Total water demand will decrease slightly in Austria, but is expected to
increase in the other countries. The largest increases will be seen in Ethiopia, Uganda, Burkina Faso,
Georgia, and Moldova. Agriculture is at present the largest water demand sector in the lower and
middle income economies such as Bhutan, Mozambique, and Ethiopia, representing more than 60%
of total demand. However, industry is the major water demand sector in high income economies
such as Austria. By 2050, the share of agricultural water demand will decrease in all countries,
except in Austria where it will not change. Industrial and domestic water demands and their shares
will rise significantly in several countries including Bhutan, Ethiopia, Uganda, and Moldova, driven by
strong demographic and economic growth.
Results indicate that the changes of total and sectoral water demand in ADA priority countries depend
strongly on the current level of development of each country. For instance, total water demand in
Austria is expected to decrease. The reason is the decline of the already large industrial water demand
driven by investments in water efficiency and less-water intensive technologies. In contrast owing to
the huge increase of domestic water demand, total water demand in Uganda will increase rapidly, but
from a much lower base.

65
4.6 Water se urit
As shown in the sections on population and GDP (section 4.1) and on water supply and demand
(section 4.4 and 4.5), the increasing world population, rising demand for food production and
economic development, and changing spatial and temporal pattern of water supply are the main
causes for water becoming a more scarce resource. The World Economic Forum ranked water crises
as the largest global risk for the next decade, as climate change and increasing demand for water are
expected to worsen the World s water future (World Economic Forum 2015).
4.6.1 Water s ar it - I ala e et ee suppl a d de a d
The integrated WFaS modelling approach is to assess current and future imbalances between water
supply and demand. We employ the water resources vulnerability index (Raskin et al. 1997) also
known as Water Exploitation Index (WEI) (EEA 2005), defined as the ratio of total annual withdrawals
for human use to total available renewable surface water resources. Regions are considered water
scarce if annual withdrawals are between 20-40% of annual supply, and severely water scarce if
withdrawals exceed 40%.
Figure 4-39: Water scarcity - Middle of the Road Scenario for each grid cell (0.5o grid or ~ 50km by 50km)
In the WFaS framework, we consider annual as well as seasonal variations of water demand and supply,
as water scarcity often occurs in a certain time of the year. We also look into the most water scarce
month to characterize the regional water scarcity.

66
Figure 4-39 top shows hotspots of water scarcity for the 2010s in Western South America and Mexico,
North East Brazil, Chile, North Africa, Afghanistan - Pakistan – India and North-Eastern China, South-
Western Australia, and South Africa. By 2050 (Figure 4-39 bottom), additionally regions including
Northern and Southern Africa, Middle East, Central and Eastern Asia are projected to experience
severe water scarcity condition. Figure 4-39 highlights changes in water scarcity class between 2010
and 2050 for the Middle of the Road scenario (SSP2) on annual basis.
4.6.2 Pote tial populatio e posed to future se ere ater s ar it
Combining the future projections of global population with the WFaS scenario analysis on water
scarcity reveals an increasing number of people exposed to conditions of severe water scarcity by
2050. In the 2010s on average 1.9 billion people (27% of the total global population) live in potential
severe water scarce areas and in 2050 it will increase to 2.7 to 3.2 billion depending on the socio-
economic scenarios (see Figure 4-40) (32% for all scenarios).
When considering monthly variability of supply and demand into account, currently 3.6 billion people
worldwide (51%) are living in potential severe water scarcity areas and this figure will increase to 4.8
to 5.7 billion by 2050 (57% to 58%). 73% of the affected people live in Asia in 2010 (69% in 2050).
These numbers agree well with a recent study by (Mekonnen et al. 2015), who estimated about four
billion people living currently under conditions of severe water scarcity at least for one month of the
year.
Figure 4-40: Potential Population under severe water scarcity for all three scenarios from 2010 to 2050.
Left: On annual basis. Right: On basis of the most water scarce month
Figure 4-41 shows the potential population under severe water scarcity. Especially dense populated
countries like India and China show the large fraction under severe water scarcity. The symbols in
Fig 4-41 show the percentage of people in the sub-regions (i.e. Eastern Africa) under severe water
scarcity.
The bottom part of Figure 4-41 shows the difference between 2050 and 2010. In sub-Saharan Africa
the absolute number but also the percentage of people living under severe water scare condition will
increase up to two times (Western and Eastern Africa). In all the other sub regions the number of
people under water scarcity will increase but the percentage of people will only slightly increase. In
China in many areas the number of people and also the percentage will decline, but this will be
superimposed by an increasing number of people in big cities under water scarcity conditions. Mainly
in the belt from 10 to 40 northern latitude (South USA, Mexico and Morocco to India) the number
and the percentage of people under severe water scarcity will increase.
1.5
2.0
2.5
3.0
3.5
2010 2020 2030 2040 2050
Nu
mb
er
of
pe
op
le [
bill
ion
]
Sustainability
Middle of the Road
Regional Rivalry
3.0
3.5
4.0
4.5
5.0
5.5
6.0
2010 2020 2030 2040 2050
Nu
mb
er
of
pe
op
le [
bill
ion
]
Sustainability
Middle of the Road
Regional Rivalry

67
Figure 4-41: Potential Population under severe water scarcity in 2050 – Middle of the Road Scenario
Figure 4-42: Most water scare month in the period 2005-2014 – Middle of the Road Scenario
While there are variations in precipitation during the year, it is important to look into the intra annual
variability of water scarcity. Figure 4-42 shows the month at which the rate between total water
demand and water supply is highest (most water scarce month). Figure 4-43 shows the percentage of
Percentage of people
under severe water scarcity (red)
Size dependent on total population
36 million 1.6 billion

68
people under severe water scarcity for the most water scarce month in the 2010s and the 2050s for
the Middle of the Road Scenario (SSP2) aggregated to country scale. It indicates an increase for a
number of countries mainly in the belt from 10 to 40 northern latitude. The estimation of water
scarcity in this study takes upstream discharge (exogenous runoff) from into account. For example,
Egypt freshwater supply comes mainly from the Nile which flow across ten different countries before
arriving in Egypt. Since half of the population in Egypt lives along the Nile, they are potentially not
affected by water scarcity. This study does not include the aspect of water quality, inter-basin water
transfer or water management.
Figure 4-43: Potential Population under severe water scarcity in 2050 – Middle of the Road Scenario
Austria and priority countries of the Austrian Development Agency
Table 4-12 shows the possible
affected percentage of people from
severe water scarcity for Austria and
the ADA priority countries. From This
assessment Austria, Bhutan,
Mozambique have no or a low
percentage of people under water
scarcity. But water scarcity will be an
increasing problem for Albania,
Moldova, Armenia, Georgia and
Burkina Faso but also for Ethiopia and
Uganda.
Table 4-12: Potential Population under severe water scarcity in 2010
and 2050 - ADA countries– Middle of the Road Scenario
[% of population] Year Month Year Month
Austria 0 0 0 0
Albania 0 69 0 83
Moldova 34 49 47 47
Armenia 35 94 76 100
Georgia 5 6 42 49
Bhutan 0 4 0 4
Burkina Faso 0 37 6 44
Ethiopia 0 3 3 19
Uganda 0 0 5 13
Mozambique 0 0 0 2
2010 2050Population under
severe water scarcity

69
4.7 H dro-e o o i lassifi atio
To facilitate presentation of results, we applied an integrated assessment, the Hydro-Economic (HE)
classification, and have grouped 178 country results into four classes depending on their hydro-
climate complexity and economic-institutional coping capacity (Appendix C). The HE classification
places countries or watersheds in a two-dimensional space where the x- and y-axes proxy water
challenges and economic-institutional coping capacity
respectively (Figure 4-44). The water challenges are
composed of four indicators; renewable water resources per
capita, water use intensity, variability in runoff and
dependency of external water resources. The economic-
institutional coping capacity (Y-axis) is represented by GDP
per capita. (See details in section 3.3 and section 4.1-4.6). For
simplicity these are termed HE-1 Water secure and poor; HE-
2 Water secure and rich; HE-3 Water stress and rich, HE-4
Water stress and poor (see Figure 4-33). For example,
countries/watersheds classified into HE-4 face significant
hydro-economic challenges as their hydrological-climatic
conditions are complex while their economic-institutional
coping capacity is low.
Location of countries/watersheds move over time in the two-dimensional space of HE classes
according to hydro-climatic and socioeconomic conditions. Each of the three scenarios 'Sustainability',
'Middle of the Road' and 'Regional rivalry' presents different plausible future pathways. All scenarios
foresee significant levels of economic growth (i.e. increasing GDP) in all countries, and every country
shows increase in their GDP per capita at least in the 2050s as well (except Angola under the Regional
Rivalry scenario).
Table 4-13: The number of countries in each Hydro-Economic classes. Country results are accumulated at subregional level
Total HE1 HE2 HE3 HE4 HE1 HE2 HE3 HE4 HE1 HE2 HE3 HE4 HE1 HE2 HE3 HE4Global 178 112 44 7 15 36 114 22 6 51 96 19 12 66 79 13 20
Northern Africa 5 3 1 0 1 0 1 4 0 0 1 4 0 0 0 3 2
Western Africa 16 15 0 0 1 10 3 1 2 11 1 0 4 12 0 0 4
Middle Africa 9 8 1 0 0 5 4 0 0 5 4 0 0 7 2 0 0
Eastern Africa 17 16 0 0 1 15 1 1 0 14 1 0 2 13 1 0 3
Southern Africa 5 5 0 0 0 1 4 0 0 1 3 0 1 2 2 0 1
Western Asia 15 1 0 7 7 0 1 11 3 0 1 11 3 0 1 9 5
Southern Asia 7 5 0 0 2 2 3 1 1 2 3 1 1 2 3 0 2
Central Asia 8 5 0 0 3 1 4 3 0 2 3 2 1 2 3 0 3
Eastern Asia 4 2 2 0 0 0 3 1 0 0 3 1 0 0 3 1 0
South-Eastern Asia 11 9 2 0 0 1 10 0 0 5 6 0 0 7 4 0 0
Northern America 2 0 2 0 0 0 2 0 0 0 2 0 0 0 2 0 0
Central America 7 7 0 0 0 0 7 0 0 2 5 0 0 4 3 0 0
Caribbean 10 6 4 0 0 1 9 0 0 2 8 0 0 4 6 0 0
South America 12 12 0 0 0 0 12 0 0 1 11 0 0 4 8 0 0
Western Europe 12 5 7 0 0 0 12 0 0 0 12 0 0 2 10 0 0
Southern Europe 8 0 8 0 0 0 8 0 0 0 8 0 0 0 8 0 0
Northern Europe 10 1 9 0 0 0 10 0 0 0 10 0 0 0 10 0 0
Eastern Europe 10 6 4 0 0 0 10 0 0 0 10 0 0 1 9 0 0
Oceania 10 6 4 0 0 0 10 0 0 6 4 0 0 6 4 0 0
Number of
countries
2010 2050
Sustainability Middle of the Road Regional Rivalry
Figure 4-44: Hydro-Economic dimension

70
This results in an upward shift along the y-axes moving more countries into the classes HE-2 or HE-3.
By the 2050s, the number of countries in HE-1 is therefore lower compared to 2010 while the number
of countries in other classes increases (Table 4-13). Depending on the actual implementation of the
potential of increased economic strength, this may increase the countries' coping capacity for
adaptation and risk management related to water challenges. The class HE-1 has 112 countries and is
dominant in the 2010s. However many of them will shift over time into the class HE-2, and by 2050,
HE-2 will be dominant in the Sustainability (114 countries), Middle of the Road (96 countries) and the
Regional Rivalry (79 countries) scenario (Figure 4-45).
Figure 4-45: Country-level Hydro-economic class in 2010 and 2050 - Middle of the Road scenario
The share of global population living in HE-3 and HE-4 countries will increase until 2050, slightly less
than half (43-47%) of global population will live in these higher water challenge classes throughout all
scenarios (Table 4-14). Concerning population living in class HE-4 countries, there is a significant
difference between the Sustainability scenario and the other two scenarios. The Middle of the Road
and Regional Rivalry scenario suggests a significant increase of population living in these countries
with lower coping capacity and high hydrologic complexity. In 2010 one fourth of global population
lives in countries classified into HE4 including Southern Asia (1.4 billion), followed by Western Asia
(200 million). By 2050 population in the class HE-4 under the Sustainability scenario will decrease to
470 million because some countries will shift to the class HE-3. But under the Middle of the Road and
Regional Rivalry scenario, population in HE4 will be about 630 million and 3.0 billion, respectively.

71
Consistently, Southern Asia has the largest population in this class in the 2050s, too. Western Asia has
the second largest population, followed by Western Africa and Northern Africa.
GDP will have increased in every country by 2050 (Table 4-15). As a result, total GDP will be 4.3, 3.4
and 2.7 times higher compared to current GDP (in 2010) under the Sustainability, the Middle of the
Road and the Regional Rivalry scenario respectively. Nevertheless, the total share of GDP in the classes
HE-1 and HE-4 (i.e. non-rich classes) is in reverse order among the three scenarios. It is about 35% in
the 2010s and it will be 7% by 2050 under the Sustainability scenario, while it will be 9% and 25% in
the Middle of the Road and Regional Rivalry scenario.
Table 4-14: Population for each Hydro-Economic classes
Table 4-15: GDP for each Hydro-Economic classes. Country results are accumulated at subregional level.
Total HE1 HE2 HE3 HE4 Total HE1 HE2 HE3 HE4 Total HE1 HE2 HE3 HE4 Total HE1 HE2 HE3 HE410
6 cap 10
6 cap 10
6 cap 10
6 cap
Global 6814 60 15 1 24 8398 16 41 37 6 9097 23 33 37 7 9875 30 23 17 30
Northern Africa 159 80 0 0 20 204 0 55 45 0 224 0 56 44 0 256 0 0 60 40
Western Africa 304 100 0 0 0 588 28 63 0 9 678 79 5 0 17 801 82 0 0 18
Middle Africa 127 99 1 0 0 238 95 5 0 0 267 96 4 0 0 299 99 1 0 0
Eastern Africa 366 100 0 0 0 651 100 0 0 0 757 98 0 0 2 892 96 0 0 4
Southern Africa 58 100 0 0 0 72 4 96 0 0 73 4 94 0 2 72 9 89 0 2
Western Asia 316 23 0 16 61 483 0 18 48 34 544 0 18 46 37 617 0 18 34 49
Southern Asia 1599 13 0 0 87 2048 11 1 76 12 2298 11 1 75 13 2629 11 1 0 88
Central Asia 77 49 0 0 51 84 7 41 52 0 91 16 33 40 12 105 18 31 0 51
Eastern Asia 1519 88 12 0 0 1390 0 12 88 0 1422 0 11 89 0 1448 0 10 90 0
South-Eastern Asia 593 99 1 0 0 689 6 94 0 0 742 30 70 0 0 812 84 16 0 0
Northern America 344 0 100 0 0 460 0 100 0 0 450 0 100 0 0 372 0 100 0 0
Central America 148 100 0 0 0 177 0 100 0 0 199 16 84 0 0 239 21 79 0 0
Caribbean 40 86 14 0 0 40 30 70 0 0 43 36 64 0 0 51 58 42 0 0
South America 392 100 0 0 0 449 0 100 0 0 490 0 100 0 0 552 10 90 0 0
Western Europe 156 13 87 0 0 167 0 100 0 0 164 0 100 0 0 143 9 91 0 0
Southern Europe 189 0 100 0 0 213 0 100 0 0 206 0 100 0 0 175 0 100 0 0
Northern Europe 99 2 98 0 0 124 0 100 0 0 122 0 100 0 0 102 0 100 0 0
Eastern Europe 291 78 22 0 0 263 0 100 0 0 269 0 100 0 0 260 0 100 0 0
Oceania 36 24 76 0 0 56 0 100 0 0 57 25 75 0 0 50 32 68 0 0
2010
SustainabilityPopulation
2050
% %%%
Middle of the Road Regional Rivalry
Total HE1 HE2 HE3 HE4 Total HE1 HE2 HE3 HE4 Total HE1 HE2 HE3 HE4 Total HE1 HE2 HE3 HE4Billion
US$2005/yr
Billion
US$2005/yr
Billion
US$2005/yr
Billion
US$2005/yr
Global 66340 37 53 2 8 283008 5 51 42 2 228253 7 52 39 2 176105 11 48 27 14
Northern Africa 945 85 0 0 15 5814 0 57 43 0 4887 0 57 43 0 3787 0 0 66 34
Western Africa 521 100 0 0 0 8145 20 73 0 7 5842 83 8 0 9 4006 91 0 0 9
Middle Africa 236 91 9 0 0 2454 86 14 0 0 1620 83 17 0 0 1112 91 9 0 0
Eastern Africa 429 100 0 0 0 6689 99 1 0 0 4523 98 1 0 1 3091 98 1 0 1
Southern Africa 522 100 0 0 0 2307 1 99 0 0 1925 1 98 0 1 1423 4 95 0 1
Western Asia 3524 26 0 40 34 14623 0 24 64 12 13525 0 24 65 11 12013 0 22 59 19
Southern Asia 4426 8 0 0 92 43805 7 2 84 7 32634 6 2 84 8 22499 6 2 0 92
Central Asia 435 60 0 0 40 2315 4 59 38 0 2006 8 56 28 8 1843 8 60 0 32
Eastern Asia 14352 64 36 0 0 78722 0 13 87 0 59828 0 15 85 0 45505 0 15 85 0
South-Eastern Asia 2813 90 10 0 0 19887 3 97 0 0 15104 16 84 0 0 11268 68 32 0 0
Northern America 14289 0 100 0 0 33687 0 100 0 0 29929 0 100 0 0 24750 0 100 0 0
Central America 1618 100 0 0 0 6122 0 100 0 0 5350 8 92 0 0 4543 9 91 0 0
Caribbean 290 62 38 0 0 964 15 85 0 0 797 17 83 0 0 663 32 68 0 0
South America 3965 100 0 0 0 15688 0 100 0 0 12989 0 100 0 0 10688 6 94 0 0
Western Europe 3679 4 96 0 0 6933 0 100 0 0 6189 0 100 0 0 4666 4 96 0 0
Southern Europe 6257 0 100 0 0 12263 0 100 0 0 11301 0 100 0 0 8751 0 100 0 0
Northern Europe 3183 1 99 0 0 7351 0 100 0 0 6692 0 100 0 0 5129 0 100 0 0
Eastern Europe 3919 70 30 0 0 12257 0 100 0 0 10535 0 100 0 0 8469 0 100 0 0
Oceania 937 2 98 0 0 2983 0 100 0 0 2576 6 94 0 0 1898 6 94 0 0
GDP
% % % %
2010 2050
Middle of the Road Regional RivalrySustainability

72
The number of countries in the classes HE-3 and HE-4, which are subject to high hydro-climatic
complexity and often thus suffer from larger water challenges, will increase in every scenario (Table
4-13). All countries classified into HE-3 or HE-4 in the 2010s will remain in one of these classes. By
2050s additional countries will have moved into these categories (Table 4-16), all of them countries in
Asia or Africa. Especially the class HE-4 countries face significant water challenges because they have
low levels of socio-economic coping capacity combined with large hydro-climatic complexity. Although
the number of countries in class HE-4 will decrease under the Sustainability scenario from 15 to six
and to 12 under the Middle of the Road scenario, HE-4 countries will increase under Regional Rivalry.
The following seven countries remain consistently HE4 counties in all scenarios; Burkina Faso, Cape
Verde, Djibouti, Iraq, Pakistan, Senegal and Yemen.
Table 4-16: Countries which is categorized into larger water challenge classes in the 2010s and in the 2050s under three
future scenarios
Note that these average values in the 2050s are categorized by the World Bank as a low level of income
(< 10000 US$2005/cap/year). Furthermore, zero, two and four countries among HE-4 countries are
classified as countries with very low level of income (<3000 US$2005/cap/year). For instance in the
2050s in the Regional Rivalry scenario Afghanistan, Eritrea, Niger and Somalia still exhibit very low
levels of per capita GDP.
Subregion Country HE [US$2005/cap/yr] HE [US$2005/cap/yr] HE [US$2005/cap/yr] HE [US$2005/cap/yr]
Algeria 41 7564 3 22094 3 16835 4 11883
Egypt 1 5544 2 29449 2 22413 3 15092
Morocco 4 4297 3 29769 3 22291 4 13832
Tunisia 1 8564 3 39315 3 33630 3 26606
Cape Verde 4 3474 4 19441 4 13039 4 9172
Burkina Faso 1 1136 4 9620 4 5725 4 3060
Niger 1 650 1 5976 4 2867 4 1531
Senegal 1 1738 4 12404 4 7266 4 3861
Djibouti 4 2120 4 15194 4 11932 4 8302
Eritrea 4 490 4 3049 4 1348 4 697
Somalia 1 34 1 872 1 266 4 92
Southern Africa Swaziland 1 4754 2 16478 4 11456 4 7020
Afghanistan 4 1185 3 7526 3 4183 4 2891
Bahrain 3 21345 3 46425 3 42670 3 31657
Iran (Islamic Republic of) 4 10954 3 26863 3 24054 3 20180
Iraq 4 3231 4 14696 4 11113 4 10656
Israel 3 26710 3 58059 3 53230 3 48597
Jordan 4 5131 3 25776 3 20353 4 14449
Kuwait 3 45623 3 93874 3 84044 3 91852
Lebanon 4 12619 3 41914 3 36289 3 27156
Oman 3 24559 3 64385 3 47995 3 35392
Qatar 3 69798 3 115901 3 118003 3 119605
Saudi Arabia 3 20534 3 44828 3 39642 3 38910
Syrian Arab Republic 4 4749 3 27961 4 20580 4 14119
United Arab Emirates 3 42353 3 79488 3 71008 3 66455
Yemen 4 2373 4 8585 4 6566 4 4280
India 4 2983 3 23798 3 15883 4 9587
Pakistan 4 2411 4 12427 4 8475 4 5070
Armenia 4 4901 3 23175 3 16821 4 12612
Azerbaijan 4 8783 3 17690 4 14131 4 11214
Uzbekistan 4 2866 3 20839 3 15717 4 10764
Eastern Asia China 1 6800 3 55893 3 40350 3 294101 in 2010 Algeria is in HE1 in one scenario and in HE4 in two scenarios
20102050
Middle of the Road Regional Rivalry
Northern Africa
Western Africa
Eastern Africa
Western Asia
Southern Asia
Central Asia
Sustainability

73
For HE4 countries, average per capita GDP will also increase over time but they are still low compared
to the global average (Table 4-17). Between 2010 and 2050 per capita GDP in HE4 countries will
increase from 3350 US$2005/cap/year (34% of the average global GDP per capita) to 7400-11500
US$2005/cap/year (29-48% of the average GDP per capita) depending on the scenario.
Table 4-17: Information about GDP per capita in HE4
Austria and priority countries of the Austrian Development Agency
With regard to the priority countries of the Austrian Development Agency (ADA), Mozambique,
Ethiopia and Uganda will remain in the class HE-1, Albania, Moldova, Georgia and Bhutan will shift
into the class HE-2, Armenia will move into HE-3 and Burkina Faso will move into HE-4 in the 2050s
under the Middle of the Road scenario. Growth in per capita GDP in African countries tends to be
smaller than in Asian and European countries (Table 4-15). Countries with lower coping capacity in the
classes HE-1 and HE-4 show relatively larger deterioration in terms of hydro-climatic complexity,
although every country improves its coping capacity. Burkina Faso moves into HE-4 in all scenarios and
Armenia moves into the HE-4 class by 2050 in the Regional Rivalry scenario only.
Figure 4-46: Change in Hydro-Economic classes for the priority countries of the Austrian Development Cooperation –
Middle of the Road scenario
SustainabilityMiddle of the
Road
Regional
Rivalry
Average GDP per cap. [US$2005/cap/yr] 4714 11927 9542 7755
low level (<10,000$) 15 3 6 12
very low level (<3000$) 7 0 2 4
2010 2050
Number of countries
GDP per capita in HE4

74
Using the HE classification, we have identified countries who have higher hydro-climate complexity
from multiple perspectives in combination with coping capacity. Practical and specific coping methods
to overcome hydro-climatic complexity are described in the next section. In the assessment
framework presented per capita GDP is used as proxy for coping capacity. Increased levels of internal
(own GDP growth) or external funding (donations) could thus help improve the situation. However it
must be noted that external financial aid may not always be used efficiently. For example, some
countries in the class HE-4 show high values in the Fragile State Index (FSI)19 (Messner et al. 2015). The
FSI annually assesses countries based on 12 variables representing social, economic and political
conditions. The higher the value, the more 'fragile' a state. Countries with high FSIs may indicate that
central governments could be weak or ineffective in transforming external financial support into
improving domestic conditions. In Table 4-16, Somalia, Yemen, Afghanistan, Syria, Iraq, Pakistan and
Niger were in the top twenty countries of the FSI in 2015. Thus not only financial support but also
improvements in governance and management will be required for tackling urgent water issues in
many HE-4 countries.
19 http://fsi.fundforpeace.org/

75
Outlook - u o eri g ater solutio s
5.1 Poli respo ses for opi g ith gro i g ater s ar it
This section presents an assessment of the outcomes and tradeoffs of the different water policies
available to policymakers and some of the policies already used in several countries, based on
literature review. However, we do not provide here definitive recommendations on specific policies
to address the growing water scarcity. This is the focus of continuing work within the WFaS initiative.
Many countries worldwide face important water scarcity challenges, which will be aggravated in the
coming decades, driven by economic and population growth (shown in section 4.1) and climate change
impacts (shown in section 4.4). Therefore water allocation of the future will continue to become
increasingly more and more complex as competition for limited resources intensifies, and will become
more and more intertwined with other sectors like agriculture, energy, and the environment. Policy
interventions are needed to address the multiple future water challenges. The objective of
implementing water policies is to balance freshwater supplies with demands in a way that ensures
water availability in both adequate quantity and quality.
Policymakers possess a wide range of policy instruments to address the multiple future water
challenges, but all of these instruments entail financial and social costs. Current evidence suggests
that the benefits of many policy options validate their costs. For instance, practitioners of
management of disasters, such as droughts and floods indicate that it is typically more cost-effective
to invest in disaster risk reduction measures to reduce the impact of a disaster than to provide
emergency relief measures once the disaster has occurred. The Stern Review has documented several
examples of the economic feasibility of water policy interventions to address climate change impacts
in a number of countries (Stern 2007).
Water policies are typically divided into supply-side measures and demand-side measures. Supply-side
measures aim at increasing water supply by using new sources of water to meet growing water
demand. Historically, the focus for most countries worldwide in addressing water challenges has been
to consider supply-side measures through the construction of large infrastructures for storing, moving,
and treating water (Gleick 2003). These infrastructures played a key role in sustaining economic
growth. (Sadoff et al. 2015). However, as these engineering solutions have become increasingly
limited and expensive, demand-side measures have become more common. In addition, some supply-
side measures entail negative environmental impacts and they may also be inconsistent with climate
change mitigation because they involve high energy consumption and greenhouse gases emission
(Bates et al. 2008). Unlike supply expansion, demand management avoids water scarcity by promoting
water efficiency and conservation. It relieves scarcity by making greater use of existing supplies,
reducing demand or altering the timing of demands, all of which can avoid the need for new supplies.
Demand management aims to squeeze more beneficial use out of existing supplies in several ways
(Brooks 2003).
Most of the solutions reported in the literature so far include planned measures, which require a
deliberate policy decision and investment, on contrast to autonomous measures, which occur
spontaneously among individuals triggered by natural and human changes. Water solutions can be
both proactive and reactive. Proactive measures aim at avoiding damage due to water scarcity (e.g.
avoiding restrictions in water supply and groundwater overexploitation). Reactive measures, on the
other hand, help to deal with damage once it has occurred (e.g. regeneration of employment and

76
assistance to farmers after extreme events). Measures can be also classified as short-run or long-run
interventions depending on the economic life of capital investment.
Water resources management approaches around the world are changing significantly. These changes
include a shift away from mainly dependence on finding new sources of supply to address perceived
new demands, a growing emphasis on incorporating environmental values into water policy, a
reemphasis on meeting basic human needs for water services, and a decoupling between economic
growth and water use (Gleick 2000). It is recognized that the solution to such problems calls for an
integrated approach. Integrated water resources management is formally defined by the Technical
Advisory Committee of Global Water Partnership as the coordinated development and management
of water, land, and related resources in order to maximize the resultant economic and social welfare
in an equitable manner without compromising the sustainability of valuable ecosystems. From an
economic stance, integrated management embraces the principle that water supplies and demands
can be managed jointly in the search for the least-cost and sustainable mix of measures to avoid
scarcity. With proper planning, it can be achieved at a lower cost than either demand management or
supply expansion alone (Ward 2012).
Most water experts agree that infrastructural modifications and supply and demand management
form the core of the water sector strategy to confront climate change. However, less attention has
been devoted to the institutional aspects of water management when designing water policy
interventions, although these aspects play a crucial role in determining the adaptive capacity of basins.
Water institutions are defined as encompassing all the water-related laws, organizations, networks,
and coalitions that govern the whole range of water-related activities (Saleth and Dinar 2004). Water
technologies and management capabilities play a direct role in climate change adaptation, water
institutions will play an indirect but indispensable role in providing the economic incentives and
organizational basis for the adoption of existing technologies and management options as well as the
development of new ones. Moreover, water institutions can perform an important role in determining
the overall social impacts of a change in water availability, as well as the distribution of gains and
losses across different stakeholders.
Tables 5-1 and Table 5-2 provide a summary of water policy intervention alternatives to address water
scarcity problems including institutional measures based on literature review. The tables identify the
stakeholders that should be involved in the decision making and implementation processes for each
intervention, and present a further classification of the interventions that could guide policymakers in
prioritizing between them. The next step (Phase 2 of WFaS) is to incorporate the water supply and
demand-side measures into comprehensive portfolios of policy recommendations and to quantify
their benefits and their trade-offs.

77
Table 5-1: Water supply-side interventions.
Measures Purpose/Specific actions Involved Stakeholders Long-term Short-term Planned Autonomous Proactive Reactive
Development of water
storage and retention
infrastructures
Enhancing existing storage capacity and/or building new
storage facilities (dams, pond and tanks, aquifers, soil
moisture, natural wetlands) to increase water supply for
downstream uses, reduce the risks of extreme events such
as droughts and floods, and produce hydropower
Government
Development and funding
agencies
Experts
Basin authority
Industries
Irrigation districts
Environmental NGO's
X X X
Rainwater harvesting Collecting and storing rainwater for reuse
Farmers and irrigation districts
Households
Government
Water utilities
X X X X
Groundwater development
and use
Increasing water availability in normal years and mitigate
fluctuations in surface water supply in drought years,
conjunctive use of surface and ground waters
Farmers and irrigation districts
Industries
Basin authority
Experts
Government
Environmental NGO's
X X X X X X
Treatment and use of
wastewater
Removing pollutants from wastewater and reuse it for
different purposes depending on the treatment level
Water utilities
Industries
Government
Environmental NGO's
Development and funding
agencies
Experts
X X X X
Desalination Removing salts from saline water in order to produce
freshwater
Government
Development and funding
agencies
Environmental NGO's
Experts
Basin authority
X X X X
Inter-basin transfer Moving water from water-abundant regions to water-scarce
regions through man-made conveyance schemes
Government
Basin authority
Development and funding
agencies
Environmental NGO's
Farmers and irrigation districts
Industries
Households
X
X
X X

78
Table 5-2: Water demand-side interventions
Measures Purpose/Specific actions Involved Stakeholders Long-term Short-term Planned Autonomous Proactive Reactive
Demand-side measures
The adoption of efficient
water technologies
Increasing water use efficiency and water productivity
through the use of efficient irrigation technologies (sprinkler
and drip) and retrofit of water devices in houses and the
implementation of special public programs promoting their
adoption
Farmers and irrigation districts
Households
Government
Basin authority
Development and funding agencies
Experts
Media
X X X X X
Land use planning and
management
Promoting water saving and best management practices
such as crop residue management, conservation tillage,
irrigation metering and scheduling, deficit irrigation, water
recycling in fields, conversion to rainfed agriculture, change
in crop pattern and cropping intensity, and use of drought-
tolerant and early-maturing varieties
Farmers and irrigation districts
Government
Basin authority
Development and funding agencies
Experts
X X X X
River basin planning and
management
Setting limits on water extractions, efficient and fair
allocation rules, clear property rights, adjustment of
operation rules, extreme event management plans
Basin authority
Farmers and irrigation districts
Industries
Households
Environmental NGO's
Government
Experts
X X X X X
Awareness rising Information, education and communication
Government
Environmental NGO's
Experts
Media
Development and funding agencies
Civil society
X X X X X X
79
5.2 Differe t path a s for a agi g ater s ar it
Countries around the world have opted for different pathways to address water scarcity and to achieve
sustainable water use. We review subsequently the outcomes and tradeoffs of some of these pathways.
Rising concerns in the European Union about water scarcity and droughts led the European Commission
to propose in 2007 a set of policy measures to address these issues (European Commission 2007). The
most important measures are enforcing the full recovery of the costs of water services, considering
additional water supply infrastructure, and fostering the adoption of water efficient technologies and
practices. The water pricing policy advocated by the European Water Framework Directive aims at
recovering the full cost of water services including the resource and environmental costs, following the
polluter pays principle (European Commission 2012). The objective of this policy is to encourage the
efficient use of water resources and to assure the financial viability of water supply agencies, which could
guarantee their operation without the need of public subsidies.
Water pricing to achieve water conservation, has been the subject of debate since the 1990s. There is a
strong consensus among experts that water pricing could achieve sizable gains in efficiency and welfare
in urban and industrial water networks (Hanemann 1998). However, a string of the literature finds that
irrigation water pricing has limited effects on water conservation and involves disproportionate costs to
farmers (Cornish et al. 2004), (Kahil et al. 2016). In contrast, (Tsur et al. 2004) indicate that water pricing
ould a hie e a effi ie t allo atio of i igatio ate ithout da agi g fa e s e efits, if the p i i g policy guarantees that all or part of the revenue collected by water agencies remains in the area and is
reinvested in improving water use efficiency.
Improving water use efficiency has become also a policy objective in the European Union and in many
other countries around the world. Different technological options are available to improve water use
efficiency such as the adoption of efficient irrigation systems, improving pipelines and lining canals, and
the adoption of low flow showers and toilets in cities. Many studies analyze the adoption of efficient
irrigation systems. They find that these efficient systems enable a reasonably uniform distribution of
water across a field and good control on the depth of application compared to surface irrigation.
Moreover, the use of efficient irrigation systems seems to be profitable because it reduces land
abandonment, facilitates the adoption of diversified and high-value cropping patterns, and improves crop
yield (Perry et al. 2014). However, contrary to widespread expectations, improving irrigation water use
efficiency may increase water depletion at basin level through enhanced crop evapotranspiration and
reduction of return flows. These flows contribute to instream flow and groundwater replenishment that
could be essential for downstream consumptive and environmental uses (Huffaker 2008). Experts suggest
that irrigation efficiency gains should be accompanied by a set of regulatory measures on water
allocations or irrigation areas to prevent the unintended effects (Ward and Pulido-Velazquez 2008).
In many basins around the world, the sharing of water is governed by administrative rules dictating who
receives how much, depending on overall supply. These rules may not properly reflect the value of water
across users and uses, and may be more damaging for certain water users than for others. In recent
decades, the water market approach has been gaining ground in some parts of the world to allocate water
such as in Australia and Chile. Water markets increase water use efficiency, avoid the development of new
costly water resources, and achieve significant welfare gains by reallocating water from lower to higher
value uses (Dinar et al. 1997).

80
The Murray-Darling Basin (MDB) in Australia is at present the most active water market in the world, and
during the drought of 2002–2012, this market generated benefits in the range of several hundred million
to 1 billion US dollars per year (Kirby et al. 2014). A challenge to water markets is the third party effects
such as environmental impacts. Water markets reduce streamflows because previously unused water
allocations are traded, and also because gains in irrigation efficiency at parcel level reduce drainage and
return flows to the environment downstream (Howe et al. 1986), (Qureshi et al. 2010). Another worrying
effect is the large surge in groundwater extractions, as shown in the last drought in the MDB. Groundwater
extractions between 2002 and 2007 were seven times above the allowed limits placed on groundwater
users (Blewett 2012). These environmental impacts reduce the benefits of trading and increase adaptation
costs. For instance, water authorities in Australia are implementing very expensive public programs on
infrastructure upgrading investments and environmental water buyback, in order to recover water for the
environment in the MDB (Wheeler et al. 2013).
Most developed countries invested heavily in infrastructure such as construction of reservoirs,
desalinization of saline water, reusing treated wastewater, and groundwater development and use in
order to ensure their water security, often starting early on their path to growth. These developed nations
a e o elati el ate se u e. Ho e e , ost of the o ld s de elopi g ou t ies still do not have
enough water infrastructure and remain relatively water insecure (Vörösmarty et al. 2010).
The option of building reservoirs is limited by silting and available runoff to fill the reservoirs. Most of the
cost effective and viable sites for reservoirs in developed countries have been identified and used, and
the remaining sites are not cost effective. Furthermore, environmental concerns and restrictions have
strongly limited the potential for additional reservoir construction throughout the world (Gleick 2003).
However, many developing countries lack enough water storage capacity such as Ethiopia, Senegal,
Rwanda, Haiti, Bangladesh, Nepal, Vietnam, and Albania (Brown and Lall 2006). The future development
of new water storage infrastructures should consider the full set of costs and benefits for different water
users and uses including ecosystems needs. Drawing on lessons from previous failures to estimate the
real costs of these projects could be useful in that regard. Considering more ecosystem-friendly forms of
water storage, such as natural wetlands and soil moisture, could be more cost-effective and sustainable
than traditional infrastructure such as dams in certain areas (OECD 2016).
Desalination of saline water is an expensive and energy intensive option that is available to municipalities
because the cost can be passed on to the consumer. This option is used in many settings such as Australia,
Israel, United States, the Gulf countries, and some Mediterranean countries. The environmental concerns
with desalination relate to the disposal of the brine and the energy used in the process. Desalination is
generally not an available option for agriculture because of the high cost of water along with the volume
of water required for production. Desalination costs have dropped significantly over the past decades due
to technological advances (Ghaffour et al. 2013). This has increased the attractiveness of desalination to
policymakers as a mean to address water supply shortages in all sectors including agriculture.
Treated municipal wastewater has become a viable option for both municipal and agricultural uses in
many countries in Europe and in the United States (Schwabe et al. 2013). Tertiary treated wastewater is
being used for groundwater recharge and subsequently municipal water supply. Secondary, and in some
cases tertiary (e.g., Spain), treated wastewater has become a source of water for irrigated agriculture
adjacent to large municipalities. Secondary treated wastewater is also being used for groundwater
recharge to replenish aquifer systems used for irrigated agriculture. Given the rate of urban population

81
growth in all countries, this source of water is likely to increase. In addition to managing the buildup of
salts and nutrients in soils through reuse of water, there is a challenge of moving water from the source
to the end use as the energy cost of pumping water can be excessive.
Groundwater is an increasingly important water supply source globally, brought about by the adoption of
pumping technologies with falling costs. However, significant negative impacts are already occurring in
many basins worldwide with extraction rates well above recharge. An illustration is the finding that a third
of the world biggest groundwater systems are in distress (Richey et al. 2015). Therefore, the use of
groundwater resources during drought spells and under future climate change scenarios requires the
design of adequate regulations that protect groundwater systems and assure their sustainable use.
As a final remark, we suggest that it is necessary to select a portfolio of policies that integrates both supply
and demand-side measures supported by well-functioning water institutions in order to achieve efficient,
sustainable and equitable outcomes. Countries should prioritize between the different policies when
outlining possible policy responses. Some policy interventions may be excessively costly, may not lead to
the intended benefits, may result in harmful and perhaps unintended impacts upon people and the
environment, or may close off more beneficial future investment opportunities. Selected policies should
be tailored to the political, institutional, and financial contexts of countries. A successful policy in one
setting do not necessarily work in other settings because water policies are driven by a complex
interaction of multi-layer and path-dependent influences, with policy reforms building up on many
previous waves of institutional reform.
The future work of WFaS aims at identifying a portfolio of workable water solutions that should be
considered in policy and investment decisions. This identification will be based on assessing the technical
and environmental feasibility of these solutions, quantifying their costs and benefits, testing their
robustness, and assessing the trade-offs and synergies among them, under alternative future scenarios
based on the Shared Socio-Economic Pathways and the Representative Concentration Pathways. Their
appropriateness will always depend on the context within which they are to be applied. Stakeholder
consultations can inform decision-makers.

82
Co lusio
The Water Futures and Solutions (WFaS) initiative has produced a consistent and comprehensive
projection for global possible water futures. To carry out this assessment, new narratives of water use
were established as an extension of the Shared Socio-economic Pathways20, giving three future scenarios;
the Sustainability Scenario, the Middle of the Road Scenario and the Regional Rivalry Scenario. Focusing
on the near future until the 2050s, WFaS assessed how water future changes over time, employing a multi-
model projection with 15 ensemble members (five General Circulation Models x three Global Hydrological
Models). The impacts of socioeconomic and climatic changes on water security have been assessed
through the development of a hydro-economic classification system that aggregates indicators of
hydrological challenges and adaptation capacities.
The assessment indicates that the impact of socioeconomic change on water resources is significant. It is
expected that food and energy production will consistently increase in coming decades, driven by
population growth and economic development. WFaS projects that water demand in agriculture,
industrial and domestic sectors will increase between 20 and 33% in the next decades throughout three
future scenarios considered. Industrial and domestic water demand will grow much more rapid than
agricultural demand, though agriculture will remain the dominant water demand sector. At continental
scale, Asia remains the largest water user in the world in all sectors especially for agricultural water use.
Significant rises in total water demand are expected to occur in Western, Eastern and Southern Africa, as
well as in Southern and Eastern Asia. At country level, India and China have the largest demand, followed
by USA, Pakistan and Russia. Water availability per capita is expected to decrease in a belt around 10 to
40 northern latitude from Morocco to India during the early half of the 21st century under all scenarios
considered
Groundwater abstraction covers an important share of water demand. The largest abstractions are in
India, USA, China, Iran and Pakistan. They account for 67% of total groundwater abstraction worldwide.
In many countries, there are areas where groundwater abstraction has already exceeded recharge,
leading to the overexploitation and degradation of important aquifer systems. In the 2050s, groundwater
abstraction will increase by 39% compared to current situation. For instance, in 2010 25% of total ground
water abstraction in India, China and Pakistan is unsustainable groundwater i.e. the groundwater
abstraction is bigger than rate of replenishment.
Finally, this report assesses the imbalance between surface water supply and demand under the different
scenarios. Results show that area of the planet which is already under severe water scarcity will further
expand in the future. The three scenarios indicate an increase by 40% to 60% of the number of people
living in severe water-scarce areas by 2050.
A hydro-economic classification, which categorizes countries based on their hydro-climatic complexity
and economic-institutional capacity, was performed. Results of this analysis show that 22 countries are in
the water stress categories (rich and poor economies remaining water stressed) in 2010 and 28 to 33
countries will be in the water stress categories in the 2050s, depending on the scenario considered. The
consequence is that about 3.6 to 4.6 billion people (43-47% of total population who will produce 41-44%
of total GDP) will be under the water stress category. 91 to 96% of the affected population will live in Asia
20 Scenarios used by the Intergovernmental Panel on Climate Change (IPCC)

83
(mainly Southern and Eastern Asia). Our analysis reveals that Somalia, Eritrea, Niger, Burkina Faso,
Senegal, Yemen, Afghanistan and Pakistan will be the most vulnerable countries globally, as they will be
highly stressed with low adaptive capacity under most of the scenarios.
Results in this report indicate that the next few decades will see an increase in demand for water, food,
and energy. At the same time, these resources will be put under growing pressure by complex
interactions, the exhaustion of low cost supply options, and climate change impacts. The different sectors
of the nexus are inextricably linked but water, food, and energy policies are typically addressed separately
within sectoral boundaries. The results of this study which applies an integrated approach based on a
broader systems perspective highlight that the sustainable management of water, food and energy
systems should be conducted from a cross-cutting perspective. Although a fully integrated model and
assessment of nexus feedbacks is beyond the scope of this assessment, this report underlines that
understanding and managing the cross-sectoral impacts of socio-economic behavior, as well as climate
changes, is crucial for water security; if not water constraints could affect all socio-economic
development.
Policymakers possess a wide range of policy instruments to address the multiple future water challenges.
Water policies are typically divided into supply-side measures, which seek to increase water supply by
finding new sources of water in space and time, and demand-side measures, which promote water
efficiency and conservation. The adoption of best governance practices and well-functioning institutions
can contribute to both improved supply and reduced demand. All of these instruments entail financial
and social costs that need to be considered when designing future water adaptation strategies to socio-
economic and climatic changes. This report presents a review of some of the pathways chosen by different
countries around the world to address water scarcity and achieve sustainable water use. These pathways
include a careful investment in water infrastructures, an improvement of water use efficiency, the design
of effective institutions, and the use of economic instruments for a better allocation of scarce water
resources among competing uses.
Consistent portfolios of solution that work across various sectors and scales of management will need to
be identified. Regional and local options must be applied within context of global communications and
markets, and development paths chosen in other countries and regions. To determine how these external
factors may influence their choices, the robustness of solutions can be tested by modifying local scenarios
to see if they produce improved results under all global scenarios. Identifying portfolios of solution that
work together synergistically in different regions to improve water, energy, and food security, human
wellbeing, and the sustainability of development projects is the focus of continuing work of the WFaS
initiative and will be the focus of future reports.

84
Refere e
Arnell, N. W. and B. Lloyd-Hughes (2014). "The global-scale impacts of climate change on water resources and
flooding under new climate and socio-economic scenarios." Climatic Change 122(1-2): 127-140.
Bates, B. C., Z. W. Kundzewicz, S. Wu and J. P. Palutikof (2008). Climate Change and Water. Technical Paper of
the Intergovernmental Panel on Climate Change. Geneva, Switzerland, IPCC Secretariat.
Blewett, R. (2012). Shaping a Nation. A Geology of Australia. Canberra, Australia, Geoscience Australia-ANU
Press.
Brooks, D. B. (2003). Another Path Not Taken: A Methodological Exploration of Water Soft Paths for Canada
and Elsewhere. Report to Environment Canada. Ottawa, ON, Canada, Friends of the Earth Canada.
Brown, C. and U. Lall (2006). "Water and economic development: The role of variability and a framework for
resilience." Natural Resources Forum 30(4): 306-317.
Butz, W. P., W. Lutz a d J. “e dzi i . “pe ial Featu e, Edu atio a d Diffe e tial Vul e a ilit to Natural Disasters".
Chateau, J., R. Dellink, E. Lanzi and B. Magne (2012). "Long-term economic growth and environmental pressure:
reference scenarios for future global projections". Conference Paper presented at the 15th Annual
Conference on Global Economic Analysis, Geneva, Switzerland.
Chaturvedi, V., M. Hejazi, J. Edmonds, L. Clarke, P. Kyle, E. Davies and M. Wise (2013). "Climate mitigation policy
implications for global irrigation water demand." Mitigation and Adaptation Strategies for Global
Change: 1-19.
Cornish, G., B. Bosworth, C. Perry and J. Burke (2004). Water Charging in Irrigated Agriculture. An Analysis of
International Experience. FAO Water Report No. 28. Rome, Italy.
Cosgrove, W. J. and D. P. Loucks (2015). "Water management: Current and future challenges and research
directions." Water Resources Research 51(6): 4823-4839.
Dankers, R., N. W. Arnell, D. B. Clark, P. D. Falloon, B. M. Fekete, S. N. Gosling, J. Heinke, H. Kim, Y. Masaki, Y.
Satoh, T. Stacke, Y. Wada and D. Wisser (2014). "First look at changes in flood hazard in the Inter-
Sectoral Impact Model Intercomparison Project ensemble." Proc Natl Acad Sci U S A 111(9): 3257-
3261.
Dellink, R., J. Chateau, E. Lanzi and B. Magné (2015). "Long-term economic growth projections in the Shared
Socioeconomic Pathways." Global Environmental Change.
Dinar, A., M. Rosegrant and R. Meinzen-Dick (1997). Water Allocation Mechanisms: Principles and Examples.
Policy Research Working Paper No. WPS 1779. Washington, DC, USA, World Bank.
EEA (2005). The European Environment - State and Outlook 2005. Copenhagen, European Environment Agency.
European Commission (2007). Addressing the challenge of water scarcity and droughts in the European Union.
COM(2007) 414 Brussels, Belgium, European Commission.
Eu opea Co issio . A Bluep i t to “afegua d Eu ope s Wate ‘esou es. B ussels, The Eu opea Commission. COM(2012) 673.
Falkenmark, M. (1989). "The massive water scarcity now threatening Africa - why isn't it being addressed?"
Ambio 18(2): 112-118.
Field, C. B., V. Barros, T. F. Stocker, Q. Dahe, D. Jon Dokken, K. L. Ebi, M. D. Mastrandrea, K. J. Mach, G. K.
Plattner, S. K. Allen, M. Tignor and P. M. Midgley (2012). Managing the risks of extreme events and
disasters to advance climate change adaptation: Special report of the intergovernmental panel on
climate change, Cambridge University Press.
Fischer, G. (2011). How can climate change and the development of bioenergy alter the long-term outlook for
food and agriculture. Looking Ahead in World Food and Agriculture: Perspectives to 2050. P. Conforti.
Rome, FAO: pp. 95-155.
Fischer, G., E. Hizsnyik, S. Prieler, M. Shah and H. T. van Velthuizen (2009). Biofuels and Food Security. Final
Report to Sponsor. Vienna, Austria, The OPEC Fund for International Development (OFID).

85
Fischer, G., E. Hizsnyik, S. Tramberend and D. Wiberg (2015). Towards indicators for water security - A global
hydro-economic classification of hydrological challenges and socio-economic coping capacity. IIASA
Interim Report IR-15-01. Laxenburg, Austria, International Institute for Applied Systems Analysis.
Fischer, G., F. Nachtergaele, S. Prieler, E. Teixeira, G. Toth, H. van Velthuizen, L. Verelst and D. Wiberg (2012).
Global Agroecological Zones (GAEZ v3.0). I. a. FAO. Laxenburg, Austria.
Fischer, G., F. N. Tubiello, H. van Velthuizen and D. A. Wiberg (2007). "Climate change impacts on irrigation
water requirements: Effects of mitigation, 1990–2080." Technological Forecasting and Social Change
74(7): 1083-1107.
Flörke, M., E. Kynast, I. Bärlund, S. Eisner, F. Wimmer and J. Alcamo (2013). "Domestic and industrial water
uses of the past 60 years as a mirror of socio-economic development: A global simulation study."
Global Environmental Change 23(1): 144-156.
Food and Agriculture Organization (FAO) (2010). AQUASTAT online database, Total renewable water resources.
T. F. a. A. O. o. t. U. Nations. Rome, Italy.
Food and Agriculture Organization (FAO) (2012). Irrigation water requirement and water withdrawal by
country. Available online at: http://www.fao.org/nr/water/aquastat/water_use_agr/IrrigationWaterUse.pdf.
Frieler, K., M. Meinshausen, M. Mengel, N. Braun and W. Hare (2012). "A scaling approach to probabilistic
assessment of regional climate change." Journal of Climate 25(9): 3117-3144.
Ghaffour, N., T. M. Missimer and G. L. Amy (2013). "Technical review and evaluation of the economics of water
desalination: Current and future challenges for better water supply sustainability." Desalination 309:
197-207.
Gleick, P. H. (2000). "The changing water paradigm a look at twenty-first century water resources
development." Water International 25(1): 127-138.
Gleick, P. H. (2003). "Global Freshwater Resources: Soft-Path Solutions for the 21st Century." Science
302(5650): 1524-1528.
Grey, D., D. Garrick, D. Blackmore, J. Kelman, M. Muller and C. Sadoff (2013). "Water security in one blue planet:
Twenty-first century policy challenges for science." Philosophical Transactions of the Royal Society A:
Mathematical, Physical and Engineering Sciences 371(2002).
Hall, J. W., D. Grey, D. Garrick, F. Fung, C. Brown, S. J. Dadson and C. W. Sadoff (2014). "Coping with the curse
of freshwater variability: Institutions, infrastructure, and information for adaptation." Science
346(6208): 429-430.
Hanasaki, N., S. Fujimori, T. Yamamoto, S. Yoshikawa, Y. Masaki, Y. Hijioka, M. Kainuma, Y. Kanamori, T. Masui,
K. Takahashi and S. Kanae (2013). "A global water scarcity assessment under Shared Socio-economic
Pathways - Part 1: Water use." Hydrology and Earth System Sciences 17(7): 2375-2391.
Hanemann, W. (1998). Determinants of Urban Water Use. In Urban Water Demand Management and Planning.
New York, USA, McGraw-Hill.
Howe, C. W., D. R. Schurmeier and W. D. Shaw, Jr. (1986). "Innovative Approaches to Water Allocation: The
Potential for Water Markets." Water Resources Research 22(4): 439-445.
Huffaker, R. (2008). "Conservation potential of agricultural water conservation subsidies." Water Resources
Research 44(7).
International Energy Agency (IEA) (2012). Water for Energy - Is energy becoming a thirstier resource (Excerpt
from the World Energy Outlook 2012). World Energy Outlook 2012. Paris, OECD/IEA: 33.
International Energy Agency (IEA) (2012). Water for energy: Is energy becoming a thirstier resource? Excerpt
from the World Energy Outlook 2012.
International Energy Agency (IEA) (2015). World Energy Outlook 2015. Paris, OECD/IEA.
IPCC (2007). Climate Change 2007: The Physical Science Basis. Contribution of Working Group I to the Fourth
Assessment Report of the Intergovernmental Panel on Climate Change [Solomon, S., D. Qin, M.
Manning, Z. Chen, M. Marquis, K.B. Averyt, M.Tignor and H.L. Miller (eds.)]. Cambridge University
Press, Cambridge, United Kingdom and New York, NY, USA
Jones, B. and B. C. O'Neill (2013). "Historically grounded spatial population projections for the continental
United States." Environmental Research Letters 8(4).

86
Kahil, M. T., J. Albiac, A. Dinar, E. Calvo, E. Esteban, L. Avella and M. Garcia-Molla (2016). "Improving the
Performance of Water Policies: Evidence from Drought in Spain." Water (Switzerland) 8(34).
KC, S. and W. Lutz (2014). "The human core of the shared socioeconomic pathways: Population scenarios by
age, sex and level of education for all countries to 2100." Global Environmental Change.
King, C. W., A. S. Holman and M. E. Webber (2008). "Thirst for energy." Nature Geosci 1(5): 283-286.
Kirby, M., R. Bark, J. Connor, M. E. Qureshi and S. Keyworth (2014). "Sustainable irrigation: How did irrigated
agriculture in Australia's Murray-Darling Basin adapt in the Millennium Drought?" Agricultural Water
Management 145: 154-162.
Lehner, B., G. Czisch and S. Vassolo (2005). "The impact of global change on the hydropower potential of
Europe: A model-based analysis." Energy Policy 33(7): 839-855.
Lehner, B., C. R. Liermann, C. Revenga, C. Vörömsmarty, B. Fekete, P. Crouzet, P. Döll, M. Endejan, K. Frenken,
J. Magome, C. Nilsson, J. C. Robertson, R. Rödel, N. Sindorf and D. Wisser (2011). "High-resolution
mapping of the world's reservoirs and dams for sustainable river-flow management." Frontiers in
Ecology and the Environment 9(9): 494-502.
Liu, J., H. Mooney, V. Hull, S. J. Davis, J. Gaskell, T. Hertel, J. Lubchenco, K. C. Seto, P. Gleick, C. Kremen and S.
Li (2015). "Systems integration for global sustainability." Science 347(6225).
Lutz, W., R. Muttarak and E. Striessnig (2014). "Universal education is key to enhanced climate adaptation."
Science 346(6213): 1061-1062.
Magnuszewski, P., D. Wiberg, W. Cosgrove, G. Fischer, M. Flörke, E. Hizsnyik, C. Pahl-Wostl, A. Segrave, G. Toth,
S. Tramberend, M. van Vliet, P. Yillia and D. Zeller (2015). Conceptual framework for scenarios
development in the Water futures and Solutions project. IIASA Interim Report IR-15-011. Laxenburg,
Austria, International Institute for Applied Systems Analysis (IIASA).
Mekonnen, M. M., P. W. Gerbens-Leenes and A. Y. Hoekstra (2015). "The consumptive water footprint of
electricity and heat: a global assessment." Environmental Science: Water Research & Technology 1(3):
285-297.
Messner, J. J., N. Haken, P. Taft, H. Blyth, K. Lawrence, S. Pavlou and F. Umaña (2015). Fragile States Index 2015.
T. F. f. Peace. Washington, D.C., USA.
Moss, R. H., J. A. Edmonds, K. A. Hibbard, M. R. Manning, S. K. Rose, D. P. Van Vuuren, T. R. Carter, S. Emori, M.
Kainuma, T. Kram, G. A. Meehl, J. F. B. Mitchell, N. Nakicenovic, K. Riahi, S. J. Smith, R. J. Stouffer, A.
M. Thomson, J. P. Weyant and T. J. Wilbanks (2010). "The next generation of scenarios for climate
change research and assessment." Nature 463(7282): 747-756.
O'Neill, B. C., E. Kriegler, K. L. Ebi, E. Kemp-Benedict, K. Riahi, D. S. Rothman, B. J. van Ruijven, D. P. van Vuuren,
J. Birkmann, K. Kok, M. Levy and W. Solecki (2015). "The roads ahead: Narratives for shared
socioeconomic pathways describing world futures in the 21st century." Global Environmental Change.
O'Neill, B. C., E. Kriegler, K. Riahi, K. L. Ebi, S. Hallegatte, T. R. Carter, R. Mathur and D. P. van Vuuren (2014). "A
new scenario framework for climate change research: The concept of shared socioeconomic
pathways." Climatic Change 122(3): 387-400.
OECD (2016). Mitigating Droughts and Floods in Agriculture: Policy Lessons and Approaches. OECD Studies on
Water. Paris, OECD Publishing.
Pe , C., D. Wi hel s a d P. “teduto . "The th that ate effi ie ill e adi ate hu ge a d poverty." Waterfront 4, 10.
Pound, D., K. Hardcastle, P. Magnuszewski, P. T. Yillia and E. Hizsnyik (2013). Water Futures and Solution: World
Water Scenarios Initiative, Scenario Focus Group Workshop 1, 4-6 November 2013 - Workshop outputs
Word for Word Report. IIASA WFaS report. Laxenburg, Austria, International Institute for Applied
Systems Analysis.
Qureshi, M. E., K. Schwabe, J. Connor and M. Kirby (2010). "Environmental water incentive policy and return
flows." Water Resources Research 46(4).
Raskin, P., P. Gleick, P. Kirshen, G. Pontius and K. Strzepek (1997). Water Futures: Assessment of Long-range
Patterns and Problems. Stockholm, Sweden, Stockholm Environment Institute.

87
Richey, A. S., B. F. Thomas, M. H. Lo, J. T. Reager, J. S. Famiglietti, K. Voss, S. Swenson and M. Rodell (2015).
"Quantifying renewable groundwater stress with GRACE." Water Resources Research 51(7): 5217-
5237.
Sadoff, C. W., J. W. Hall, D. Grey, J. C. J. H. Aerts, M. Ait-Kadi, C. Brown, A. Cox, S. Dadson, D. Garrick, J. Kelman,
P. McCornick, C. Ringler, M. Rosegrant, D. Whittington and D. Wiberg (2015). Securing Water,
Sustaining Growth: Report of the GWP/OECD Task Force on Water Security and Sustainable Growth.
University of Oxford, UK.
Saleth, R. M. and A. Dinar (2004). The Institutional Economics of Water: A Cross- Country Analysis of Institutions
and Performance. Cheltenham, UK and Northampton, MA, USA, Edward Elgar.
Schewe, J., J. Heinke, D. Gerten, I. Haddeland, N. W. Arnell, D. B. Clark, R. Dankers, S. Eisner, B. M. Fekete, F. J.
Colón-González, S. N. Gosling, H. Kim, X. Liu, Y. Masaki, F. T. Portmann, Y. Satoh, T. Stacke, Q. Tang, Y.
Wada, D. Wisser, T. Albrecht, K. Frieler, F. Piontek, L. Warszawski and P. Kabat (2014). "Multimodel
assessment of water scarcity under climate change." Proceedings of the National Academy of Sciences
of the United States of America 111(9): 3245-3250.
Schmied, H. M., S. Eisner, D. Franz, M. Wattenbach, F. T. Portmann, M. Flörke and P. Döll (2014). "Sensitivity of
simulated global-scale freshwater fluxes and storages to input data, hydrological model structure,
human water use and calibration." Hydrology and Earth System Sciences 18(9): 3511-3538.
Schmitz, C., H. van Meijl, P. Kyle, G. C. Nelson, S. Fujimori, A. Gurgel, P. Havlik, E. Heyhoe, D. M. d'Croz, A. Popp,
R. Sands, A. Tabeau, D. van der Mensbrugghe, M. von Lampe, M. Wise, E. Blanc, T. Hasegawa, A.
Kavallari and H. Valin (2014). "Land-use change trajectories up to 2050: Insights from a global agro-
economic model comparison." Agricultural Economics (United Kingdom) 45(1): 69-84.
Schwabe, K., J. Albiac, J. Connor, R. Hassan and L. Meza (2013). Drought in arid and semi-arid regions: A multi-
disciplinary and cross-country perspective. Dordrecht, Springer.
Siebert, S., J. Burke, J. M. Faures, K. Frenken, J. Hoogeveen, P. Döll and F. T. Portmann (2010). "Groundwater
use for irrigation - A global inventory." Hydrology and Earth System Sciences 14(10): 1863-1880.
Stern, N. (2007). The Economics of Climate Change: The Stern Review. Cambridge, UK, Cambridge University
Press.
Tramberend, S., D. Wiberg, Y. Wada, M. Flörke, G. Fischer, Y. Satoh, P. Yillia, M. van Vliet, E. Hizsnyik, L. F. Nava
Jimenéz and M. Blokker (2015). Building Global Water Use Scenarios. IIASA Interim Report IR-15-014.
Laxenburg, Austria, International Institute for Applied Systems Analysis.
Tsur, Y., A. Dinar, R. M. Doukkali and T. Roe (2004). "Irrigation water pricing: Policy implications based on
international comparison." Environment and Development Economics 9(6): 735-755.
UN-Water (2008). Transboundary Waters: UN-Water Thematic Paper Sharing Benefits, Sharing Responsibilities.
UN-Water Thematic Paper.
Van Beek, L. P. H., Y. Wada and M. F. P. Bierkens (2011). "Global monthly water stress: 1. Water balance and
water availability." Water Resources Research 47(7).
van Vliet, M., D. Wiberg, S. Leduc and K. Riahi (2016). "Power-generation system vulnerability and adaptation
to changes in climate and water resources." Nature Climate Change.
Van Vliet, M. T. H., S. Vögele and D. Rübbelke (2013). "Water constraints on European power supply under
climate change: Impacts on electricity prices." Environmental Research Letters 8(3).
Van Vliet, M. T. H., J. R. Yearsley, F. Ludwig, S. Vögele, D. P. Lettenmaier and P. Kabat (2012). "Vulnerability of
US and European electricity supply to climate change." Nature Climate Change 2(9): 676-681.
van Vuuren, D. P., J. Edmonds, M. Kainuma, K. Riahi, A. Thomson, K. Hibbard, G. C. Hurtt, T. Kram, V. Krey, J. F.
Lamarque, T. Masui, M. Meinshausen, N. Nakicenovic, S. J. Smith and S. K. Rose (2011). "The
representative concentration pathways: An overview." Climatic Change 109(1): 5-31.
van Vuuren, D. P., E. Kriegler, B. C. O'Neill, K. L. Ebi, K. Riahi, T. R. Carter, J. Edmonds, S. Hallegatte, T. Kram, R.
Mathur and H. Winkler (2014). "A new scenario framework for Climate Change Research: Scenario
matrix architecture." Climatic Change 122(3): 373-386.

88
Veldkamp, T. I. E., Y. Wada, J. C. J. H. Aerts and P. J. Ward (2016). "Towards a global water scarcity risk
assessment framework: incorporation of probability distributions and hydro-climatic variability."
Environmental Research Letters 11(2): 024006.
Vörösmarty, C. J., P. B. McIntyre, M. O. Gessner, D. Dudgeon, A. Prusevich, P. Green, S. Glidden, S. E. Bunn, C.
A. Sullivan, C. R. Liermann and P. M. Davies (2010). "Global threats to human water security and river
biodiversity." Nature 467(7315): 555-561.
Wada, Y., M. Flörke, N. Hanasaki, S. Eisner, G. Fischer, S. Tramberend, Y. Satoh, M. van Vliet, P. Yillia, C. Ringler,
P. Burek and D. Wiberg (2016). "Modeling global water use for the 21st century: Water Futures and
Solutions (WFaS) initiative and its approaches." Geoscientific Model Development Volume 8: 6417-
6521.
Wada, Y., D. Wisser and M. F. P. Bierkens (2014). "Global modeling of withdrawal, allocation and consumptive
use of surface water and groundwater resources." Earth System Dynamics 5(1): 15-40.
Ward, F. A. (2012). "Cost-benefit and water resources policy: A survey." Water Policy 14(2): 250-280.
Ward, F. A. and M. Pulido-Velazquez (2008). "Water conservation in irrigation can increase water use."
Proceedings of the National Academy of Sciences of the United States of America 105(47): 18215-
18220.
Warszawski, L., K. Frieler, V. Huber, F. Piontek, O. Serdeczny and J. Schewe (2014). "The inter-sectoral impact
model intercomparison project (ISI-MIP): Project framework." Proceedings of the National Academy
of Sciences of the United States of America 111(9): 3228-3232.
WFaS, W. F. a. S. (2013). Project Group Meeting - 30th Sep – 2nd Oct 2013. Laxenburg, Austria, International
Institute for Applied Systems Analysis (IIASA).
Wheeler, S., A. Loch, A. Zuo and H. Bjornlund (2013). "Reviewing the adoption and impact of water markets in
the Murray-Darling Basin, Australia." Journal of Hydrology 518(PA): 28-41.
Winsemius, H. C., J. C. J. H. Aerts, L. P. H. van Beek, M. F. P. Bierkens, A. Bouwman, B. Jongman, J. C. J. Kwadijk,
W. Ligtvoet, P. L. Lucas, D. P. van Vuuren and P. J. Ward (2015). "Global drivers of future river flood
risk." Nature Clim. Change advance online publication.
World Economic Forum, G. R., 10th Edition (2015). Global Risks 2015, 10th Edition. Geneva, Switzerland, World
Economic Forum.
WWAP (2014). United Nations World Water Assessment Programme - The United Nations World Water
Development Report 2014: Water and Energy. Paris, UNESCO.
WWAP (2015). The United Nations World Water Development Report 2015: Water for a Sustainable World.
Paris, UNESCO.

I
Appe di
Appe di A: ““P “tor li es
The SSP storylines served as the starting point for the development of the quantitative SSP elements. Each
storyline provides a brief narrative of the main characteristics of the future development path of an SSP.
The storylines were identified at the joint IAV and IAM workshop in Boulder, November 2011. A brief
summary of the storylines are provided here for comprehensiveness. For further details and extended
des iptio s of the sto li es, see O Neill et al. .
SSP1 - Sustainability:
This is a world making relatively good progress towards sustainability, with sustained efforts to achieve
development goals, while reducing resource intensity and fossil fuel dependency. Elements that
contribute to this are a rapid development of low-income countries, a reduction of inequality (globally
and within economies), rapid technology development, and a high level of awareness regarding
environmental degradation. Rapid economic growth in low-income countries reduces the number of
people below the poverty line. The world is characterized by an open, globalized economy, with relatively
rapid technological change directed toward environmentally friendly processes, including clean energy
technologies and yield-enhancing technologies for land. Consumption is oriented towards low material
growth and energy intensity, with a relatively low level of consumption of animal products. Investments
in high levels of education coincide with low population growth. Concurrently, governance and institutions
facilitate achieving development goals and problem solving. The Millennium Development Goals are
achieved within the next decade or two, resulting in educated populations with access to safe water,
improved sanitation and medical care. Other factors that reduce vulnerability to climate and other global
changes include, for example, the successful implementation of stringent policies to control air pollutants
and rapid shifts toward universal access to clean and modern energy in the developing world.
SSP 2 - Middle of the Road (or Dynamics as Usual, or Current Trends Continue, or Continuation):
In this world, trends typical of recent decades continue, with some progress towards achieving
development goals, reductions in resource and energy intensity at historic rates, and slowly decreasing
fossil fuel dependency. Development of low-income countries proceeds unevenly, with some countries
making relatively good progress while others are left behind. Most economies are politically stable with
partially functioning and globally connected markets. A limited number of comparatively weak global
institutions exist. Per-capita income levels grow at a medium pace on the global average, with slowly
converging income levels between developing and industrialized countries. Intra-regional income
distributions improve slightly with increasing national income, but disparities remain high in some regions.
Educational investments are not high enough to rapidly slow population growth, particularly in low-
income countries. Achievement of the Millennium Development Goals is delayed by several decades,
leaving populations without access to safe water, improved sanitation, medical care. Similarly, there is
only intermediate success in addressing air pollution or improving energy access for the poor as well as
other factors that reduce vulnerability to climate and other global changes.

II
SSP 3 - Fragmentation (or Fragmented World):
The world is separated into regions characterized by extreme poverty, pockets of moderate wealth and a
bulk of countries that struggle to maintain living standards for a strongly growing population. Regional
blocks of countries have re-emerged with little coordination between them. This is a world failing to
achieve global development goals, and with little progress in reducing resource intensity, fossil fuel
dependency, or addressing local environmental concerns such as air pollution. Countries focus on
achieving energy and food security goals within their own region. The world has de-globalized, and
international trade, including energy resource and agricultural markets, is severely restricted. Little
international cooperation and low investments in technology development and education slow down
economic growth in high-, middle-, and low-income regions. Population growth in this scenario is high as
a result of the education and economic trends. Growth in urban areas in low-income countries is often in
unplanned settlements. Unmitigated emissions are relatively high, driven by high population growth, use
of local energy resources and slow technological change in the energy sector. Governance and institutions
show weakness and a lack of cooperation and consensus; effective leadership and capacities for problem
solving are lacking. Investments in human capital are low and inequality is high. A regionalized world leads
to reduced trade flows, and institutional development is unfavorable, leaving large numbers of people
vulnerable to climate change and many parts of the world with low adaptive capacity. Policies are oriented
towards security, including barriers to trade
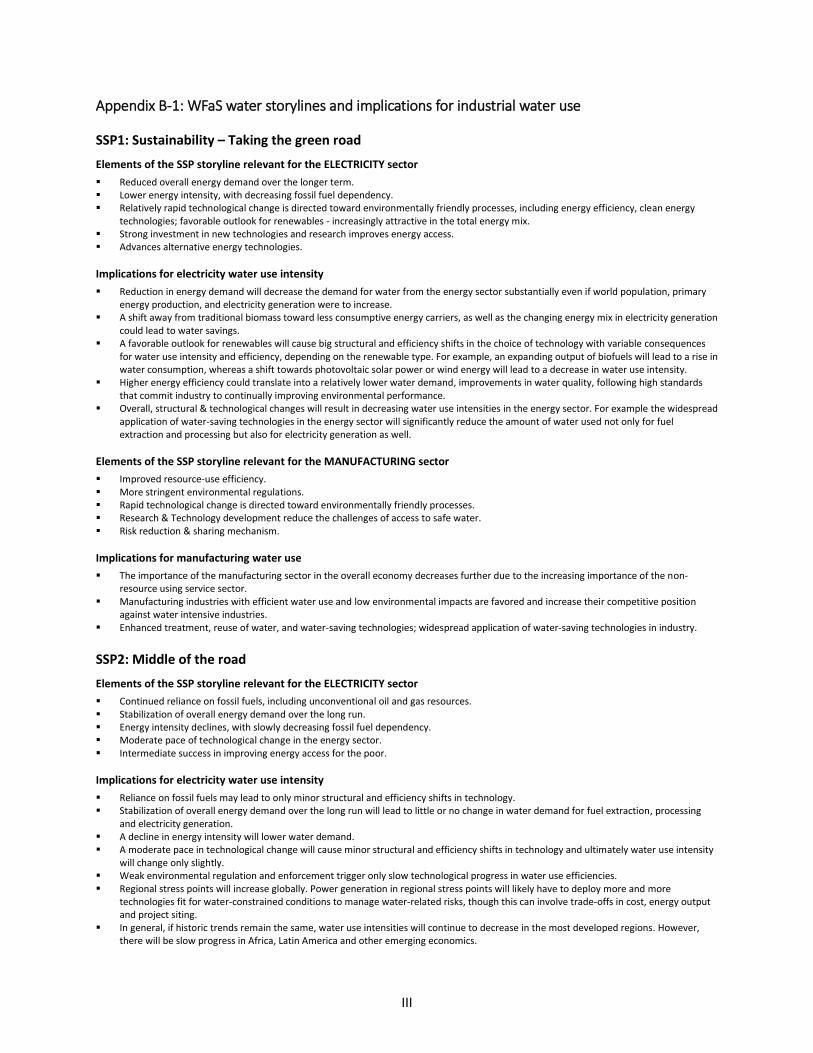
III
Appe di B- : WFa“ ater stor li es a d i pli atio s for i dustrial ater use
SSP1: Sustainability – Taking the green road
Elements of the SSP storyline relevant for the ELECTRICITY sector
Reduced overall energy demand over the longer term.
Lower energy intensity, with decreasing fossil fuel dependency.
Relatively rapid technological change is directed toward environmentally friendly processes, including energy efficiency, clean energy
technologies; favorable outlook for renewables - increasingly attractive in the total energy mix.
Strong investment in new technologies and research improves energy access.
Advances alternative energy technologies.
Implications for electricity water use intensity
Reduction in energy demand will decrease the demand for water from the energy sector substantially even if world population, primary
energy production, and electricity generation were to increase.
A shift away from traditional biomass toward less consumptive energy carriers, as well as the changing energy mix in electricity generation
could lead to water savings.
A favorable outlook for renewables will cause big structural and efficiency shifts in the choice of technology with variable consequences
for water use intensity and efficiency, depending on the renewable type. For example, an expanding output of biofuels will lead to a rise in
water consumption, whereas a shift towards photovoltaic solar power or wind energy will lead to a decrease in water use intensity.
Higher energy efficiency could translate into a relatively lower water demand, improvements in water quality, following high standards
that commit industry to continually improving environmental performance.
Overall, structural & technological changes will result in decreasing water use intensities in the energy sector. For example the widespread
application of water-saving technologies in the energy sector will significantly reduce the amount of water used not only for fuel
extraction and processing but also for electricity generation as well.
Elements of the SSP storyline relevant for the MANUFACTURING sector
Improved resource-use efficiency.
More stringent environmental regulations.
Rapid technological change is directed toward environmentally friendly processes.
Research & Technology development reduce the challenges of access to safe water.
Risk reduction & sharing mechanism.
Implications for manufacturing water use
The importance of the manufacturing sector in the overall economy decreases further due to the increasing importance of the non-
resource using service sector.
Manufacturing industries with efficient water use and low environmental impacts are favored and increase their competitive position
against water intensive industries.
Enhanced treatment, reuse of water, and water-saving technologies; widespread application of water-saving technologies in industry.
SSP2: Middle of the road
Elements of the SSP storyline relevant for the ELECTRICITY sector
Continued reliance on fossil fuels, including unconventional oil and gas resources.
Stabilization of overall energy demand over the long run.
Energy intensity declines, with slowly decreasing fossil fuel dependency.
Moderate pace of technological change in the energy sector.
Intermediate success in improving energy access for the poor.
Implications for electricity water use intensity
Reliance on fossil fuels may lead to only minor structural and efficiency shifts in technology.
Stabilization of overall energy demand over the long run will lead to little or no change in water demand for fuel extraction, processing
and electricity generation.
A decline in energy intensity will lower water demand.
A moderate pace in technological change will cause minor structural and efficiency shifts in technology and ultimately water use intensity
will change only slightly.
Weak environmental regulation and enforcement trigger only slow technological progress in water use efficiencies.
Regional stress points will increase globally. Power generation in regional stress points will likely have to deploy more and more
technologies fit for water-constrained conditions to manage water-related risks, though this can involve trade-offs in cost, energy output
and project siting.
In general, if historic trends remain the same, water use intensities will continue to decrease in the most developed regions. However,
there will be slow progress in Africa, Latin America and other emerging economics.

IV
Elements of the SSP storyline relevant for the MANUFACTURING sector
The SSP2 World is characterized by dynamics similar to historical developments.
Moderate awareness of environmental consequences from natural resource use.
Modest decline in resource-intensity.
Consumption oriented towards material-growth.
Technological progress but no major breakthrough.
Persistent income inequality (globally & within economies)
Implications for manufacturing water use.
Manufacturing GVA further declines in relative terms.
Moderate & regionally different decreases of manufacturing water use intensities.
Following historic trends water use intensities further decrease in the most developed regions but less progress in Africa, Latin America
and other emerging economics.
Weak environmental regulation and enforcement trigger only slow technological progress in water use efficiencies.
SSP3: Regional Rivalry – A rocky road
Elements of the SSP storyline relevant for the ELECTRICITY sector
Growing resource intensity and fossil fuel dependency.
Focus on achieving energy and food security goals within their own region.
Barriers to trade, particularly in the energy resource and agricultural markets.
Use of domestic energy results in some regions increase heavy reliance on fossil fuels.
Increased energy demand driven by high population growth and little progress in efficiency.
Implications for electricity water use intensity
Barriers in trade may trigger slow technological progress in water use efficiencies. A moderate pace in technological change will cause
minor structural and efficiency shifts in technology and ultimately water use intensity will change only slightly.
Reliance on fossil fuels may lead to only minor structural and efficiency shifts in technology.
An increase in energy intensity will increase water demand where as little progress in efficiency would trigger increased water demand as
energy use intensifies.
Weak environmental regulation and enforcement hamper technological progress in water use efficiencies, hence very low progress in
water-saving technologies.
Elements of the SSP storyline relevant for the MANUFACTURING sector
Low priority for addressing environmental problems.
Resource-use intensity is increasing.
Low investment in education and technological development.
Persistent income inequality (globally & within economies).
Weak institutions & global governance.
Implications for manufacturing water use
Manufacturing GVA in relative terms (% of GDP) declines slower than historic trends.
Weak environmental regulation and enforcement hamper technological progress in water use efficiencies.
Very low progress in water-saving technologies.
Water use intensities increase only marginally, primarily in the most developed regions.

V
Appe di B- : WFa“ ater stor li es a d i pli atio s for do esti ater use
SSP1: Sustainability – Taking the green road Elements of the SSP storyline relevant for the DOMESTIC sector
Inequality reduction across and within economies.
Effective and persistent cooperation and collaboration across the local, national, regional and international scales and between public
organizations, the private sector and civil society within and across all scales of governance.
Resource use efficiency optimization associated with urbanizing lifestyles.
Changing consumption and investment patterns.
Civil society helps drives the transition from increased environmental degradation to improved management of the local environment and
the global commons.
Research and technology development reduce the challenges of access to safe water.
Emphasis on promoting higher education levels, gender equality, access to health care and to safe water, and sanitation improvements.
Investments in human capital and technology lead to a relatively low population.
Better-educated populations and high overall standards of living confer resilience to societal and environmental changes with enhanced
access to safe water, improved sanitation, and medical care.
Implications for domestic water use intensity
Management of the global commons will slowly improve if cooperation and collaboration of local, national, and international
organizations and institutions, the private sector, and civil society is enhanced.
A demographic transition to lower population levels can be achieved if education and health investments are increased.
Inequality can be reduced both across and within countries if development goals are achieved.
Sustainability relies on increasing environmental awareness in societies around the world.
Industrialized countries support developing countries in their development goals by providing access to human and financial resources
and new technologies.
SSP2: Middle of the road Elements of the SSP storyline relevant for the DOMESTIC sector
Moderate awareness of the environmental consequences of choices when using natural resources.
There is relatively weak coordination and cooperation among national and international institutions, the private sector, and civil society
for addressing environmental concerns.
Education investments are not high enough to rapidly slow population growth.
Access to health care and safe water and improved sanitation in low-income countries makes steady progress.
Gender equality and equity improve slowly.
Consumption is oriented towards material growth, with growing consumption of animal products.
Conflicts over environmental resources flare where and when there are high levels of food and/or water insecurity.
Growing energy demand lead to continuing environmental degradation.
Implications for domestic water use intensity
Weak environmental awareness trigger slow water security and progress in water use efficiencies.
Global and national institutions lack of cooperation and collaboration make slow progress in achieving sustainable development goals.
Growing population and intensity of resource leads to environmental systems degradation.
Lower education investments do not promote slow population growth.
Access to health care, safe water, and sanitation services are affected by population growth and heterogeneities within countries.
Conflicts over natural resources access and corruption trigger the effectiveness of development policies.
SSP3: Regional Rivalry – A rocky road Elements of the SSP storyline relevant for the DOMESTIC sector
Societies are becoming more skeptical about globalization.
Countries show a weak progress in achieving sustainable development goals.
Environmental policies have a very little importance. Serious degradation of the environment becomes more important.
Cooperation among organizations and institutions is weak. Their leadership is highly questionable.
Low investments in education and in technology increases socioeconomic vulnerability.
Growing population and limited access to health care, safe water and sanitation services challenge human and natural systems.
Gender equality and equity remain stable.
Consumption is material intensive and economic development remains stratified by socioeconomic inequalities.
Implications for domestic water use intensity
Countries are pushed to focus on domestic issues.
National and regional security issues foster stronger national policies to secure water resources access and sanitation services.
Consumption is primarily material-intensive and water use important.

VI
A move towards sustainable development goals will lead to authoritarian forms of government and, consequently to a rise in social water
awareness.
Water security and environmental systems health is trigger by high levels of water consumption and limited development on human
capital.
National rivalries between the countries in a certain region weak progress toward development goals and increases competition for
natural resources.
Appe di B- : WFa“ ater stor li es a d i pli atio s for agri ultural ater use
SSP1: Sustainability – Taking the green road
In SSP1 the world is gradually moving toward sustainability. Sustainability concerns; more stringent environmental regulation implemented.
Rapid technological change.
Energy efficiency and improved resource efficiency.
Relatively low population growth; emphasis on education.
Effective institutions.
Wide access to safe water.
Emphasis on regional production.
Some liberalization of agricultural markets.
Risk reduction and sharing mechanisms in place.
The above general tendencies of development in the SSP1 World can be interpreted to have the following agriculture/irrigation related
implications:
Improved agricultural productivity and resource use efficiency.
Quite rapid reduction of prevailing yield gaps toward environmentally sustainable and advanced technology yield levels.
Improving nutrition with environmentally benign diets with lower per capita consumption of livestock products.
Enforced limits to groundwater over-exploitation.
Large improvements of irrigation water use efficiency.
Reliable water infrastructure and water sources.
Enhanced treatment and reuse of water.
Concern for pollution reduction and water quality, implying widespread application of precision farming and nutrient management.
Risk management and related measures implemented to reduce and spread yield risks.
SSP2: Middle of the road
In SSP2 the world is the world is progressing along past trends and paradigms.
Most economies are politically stable.
Markets are globally connected but function imperfectly.
Slow progress in achieving development goals of education, safe water, health care.
Technological progress but no major breakthrough.
Modest decline in resource use intensity.
Population growth levels off in second half of century.
Urbanization proceeds according to historical trends.
Consumption is oriented towards material growth.
Environmental systems experience degradation.
Significant heterogeneities exist within and across countries.
Food and water insecurity remain in areas of low-income countries.
Barriers to enter agricultural markets are reduced only slowly.
Moderate corruption slows effectiveness of development policies
The SSP2 World is characterized by dynamics similar to historical developments. This would imply continuation of agricultural growth paths and
policies, continued protection of national agricultural sectors, and further environmental damages caused by agriculture:
Modest progress of agricultural productivity.
Slow reduction of yield gaps especially in low-income countries.
Increasing per capita consumption of livestock products with growing incomes.
Persistent barriers and distortions in international trade of agricultural products.
No effective halt to groundwater over-exploitation.
Some improvements of water use efficiency, but only limited advances in low-income countries.
Some reduction of food insecurity due to trickle down of economic development.
Food and water insecurity remain as problems in some areas of low-income countries.
No effective measures to prevent pollution and degradation by agricultural practices; environmental risks caused by intensive application
of fertilizers and agro-chemicals, and intensive and concentrated livestock production systems.
Only moderate success in reducing climate risks and vulnerability.

VII
SSP3: Regional rivalry
In SSP3 the world development is stagnating. Growing concerns about globalization and focus on national/regional issues and interests.
Markets (agriculture, energy) are protected and highly regulated.
Global governance and institutions are weak.
Low priority for addressing environmental problems.
Slow economic growth.
Low investment in education and technology development.
Poor progress in achieving development goals of education, safe water, health care.
Increase in resource use intensity.
Population growth low in developed, high in developing countries; overall large increase.
Urbanization proceeds slowly; disadvantaged continue to move to unplanned settlements.
Serious degradation of environmental systems in some regions.
Large disparities within and across countries.
Weak institutions contribute to slow development.
Development in the SSP3 World will lead to manifold problems in food and agriculture, with implications for irrigation development and water
challenges, characterized by:
Poor progress with agricultural productivity improvements in low-income countries due to lack of investment and education.
Widespread lack of sufficient investment and capacity for yield gap reduction in developing countries.
Growing protection of national agricultural sectors and increasing agricultural trade barriers. Low priority to halt environmental
degradation caused by agriculture (erosion, deforestation, poor nutrient management, water pollution and exploitation).
Widespread pollution and deterioration of ecosystems.
Continued deforestation of tropical rain-forests.
Only modest improvements of irrigation water use efficiency.
Persistent over-exploitation of groundwater aquifers
Widespread lack of access to safe water and sanitation.
Unreliable water and energy supply for agricultural producers.
Food and water insecurity persist as major problems in low-income countries.
High population growth and insufficient development leave behind highly vulnerable human and environmental systems.

VIII
Appe di C: H dro E o o i lassifi atio su regio s a d ou tries
2010 2020 2030 2040 2050 2010 2020 2030 2040 2050 2010 2020 2030 2040 2050
Algeria 1 4 4 3 3 4 4 4 4 3 4 4 4 4 4
Egypt 1 1 1 2 2 1 1 1 2 2 1 1 1 4 3
Morocco 4 4 4 3 3 4 4 4 3 3 4 4 4 4 4Tunisia 1 1 3 3 3 1 4 3 3 3 1 4 3 3 3
Benin 1 1 1 1 1 1 1 1 1 1 1 1 1 1 1Burkina Faso 1 1 1 4 4 1 1 1 4 4 1 1 1 4 4
Cape Verde 4 4 4 4 3 4 4 4 4 4 4 4 4 4 4
Cote d'Ivoire 1 1 1 1 2 1 1 1 1 2 1 1 1 1 1Gambia 1 1 1 1 1 1 1 1 1 1 1 1 1 1 1
Ghana 1 1 1 1 1 1 1 1 1 1 1 1 1 1 1
Guinea 1 1 1 1 2 1 1 1 1 1 1 1 1 1 1
Guinea-Bissau 1 1 1 1 1 1 1 1 1 1 1 1 1 1 1
Liberia 1 1 1 1 1 1 1 1 1 1 1 1 1 1 1
Mali 1 1 1 1 1 1 1 1 1 1 1 1 1 1 1
Mauritania 1 1 1 1 1 1 1 1 1 1 1 1 1 4 1
Niger 1 1 1 1 1 1 1 1 4 4 1 1 1 4 4
Nigeria 1 1 1 1 2 1 1 1 1 1 1 1 1 1 1
Senegal 1 1 1 1 4 1 1 1 4 4 1 1 4 4 4
Sierra Leone 1 1 1 1 1 1 1 1 1 1 1 1 1 1 1
Togo 1 1 1 1 1 1 1 1 1 1 1 1 1 1 1
Angola 1 1 1 1 1 1 1 1 1 1 1 1 1 1 1
Cameroon 1 1 1 1 1 1 1 1 1 1 1 1 1 1 1
Central African Republic 1 1 1 1 1 1 1 1 1 1 1 1 1 1 1
Chad 1 1 1 1 1 1 1 1 1 1 1 1 1 1 1
Congo 1 1 1 2 2 1 1 1 1 2 1 1 1 1 1
Democratic Republic of the Congo 1 1 1 1 1 1 1 1 1 1 1 1 1 1 1
Equatorial Guinea 2 2 2 2 2 2 2 2 2 2 2 2 2 2 2
Gabon 1 2 2 2 2 1 2 2 2 2 1 2 2 2 2
Sao Tome and Principe 1 1 1 2 2 1 1 1 2 2 1 1 1 1 1
Burundi 1 1 1 1 1 1 1 1 1 1 1 1 1 1 1
Comoros 1 1 1 1 1 1 1 1 1 1 1 1 1 1 1
Djibouti 4 4 4 4 3 4 4 4 4 4 4 4 4 4 4Eritrea 1 1 1 1 1 1 1 1 1 4 1 1 1 1 4
Ethiopia 1 1 1 1 1 1 1 1 1 1 1 1 1 1 1
Kenya 1 1 1 1 1 1 1 1 1 1 1 1 1 1 1
Madagascar 1 1 1 1 1 1 1 1 1 1 1 1 1 1 1
Malawi 1 1 1 1 1 1 1 1 1 1 1 1 1 1 1
Mauritius 1 2 2 2 2 1 2 2 2 2 1 2 2 2 2
Mozambique 1 1 1 1 1 1 1 1 1 1 1 1 1 1 1
Rwanda 1 1 1 1 1 1 1 1 1 1 1 1 1 1 1
Somalia 1 1 1 1 1 1 1 1 1 1 1 1 1 1 4
Sudan 1 1 1 1 1 1 1 1 1 1 1 1 1 1 1
Uganda 1 1 1 1 1 1 1 1 1 1 1 1 1 1 1
United Republic of Tanzania 1 1 1 1 1 1 1 1 1 1 1 1 1 1 1
Zambia 1 1 1 1 1 1 1 1 1 1 1 1 1 1 1
Zimbabwe 1 1 1 1 1 1 1 1 1 1 1 1 1 1 1
Botswana 1 2 2 2 2 1 2 2 2 2 1 2 2 2 2
Lesotho 1 1 1 1 1 1 1 1 1 1 1 1 1 1 1
Namibia 1 1 1 2 2 1 1 1 1 2 1 1 1 1 1
South Africa 1 1 2 2 2 1 1 2 2 2 1 1 2 2 2
Swaziland 1 1 1 1 2 1 1 1 1 4 1 1 1 1 4
Regional Rivalry
Southern Africa
Eastern Africa
Middle Africa
Western Africa
Northern Africa
Hydro-economic classSustainability Middle of the Road

IX
2010 2020 2030 2040 2050 2010 2020 2030 2040 2050 2010 2020 2030 2040 2050
Afghanistan 4 4 4 4 4 4 4 4 4 4 4 4 4 4 4
Bahrain 3 3 3 3 3 3 3 3 3 3 3 3 3 3 3
Iran (Islamic Republic of) 4 4 3 3 3 4 4 3 3 3 4 4 4 3 3
Iraq 4 4 4 4 4 4 4 4 4 4 4 4 4 4 4
Israel 3 3 3 3 3 3 3 3 3 3 3 3 3 3 3
Jordan 4 4 4 3 3 4 4 4 4 3 4 4 4 4 4
Kuwait 3 3 3 3 3 3 3 3 3 3 3 3 3 3 3
Lebanon 4 3 3 3 3 4 3 3 3 3 4 3 3 3 3
Oman 3 3 3 3 3 3 3 3 3 3 3 3 3 3 3
Qatar 3 3 3 3 3 3 3 3 3 3 3 3 3 3 3
Saudi Arabia 3 3 3 3 3 3 3 3 3 3 3 3 3 3 3
Syrian Arab Republic 4 4 4 3 3 4 4 4 4 3 4 4 4 4 4
Turkey 1 2 2 2 2 1 2 2 2 2 1 2 2 2 2
United Arab Emirates 3 3 3 3 3 3 3 3 3 3 3 3 3 3 3
Yemen 4 4 4 4 4 4 4 4 4 4 4 4 4 4 4
Bangladesh 1 1 1 1 1 1 1 1 1 1 1 1 1 1 1
Bhutan 1 1 2 2 2 1 1 2 2 2 1 1 2 2 2
India 4 4 4 3 3 4 4 4 4 3 4 4 4 4 4
Maldives 1 1 1 2 2 1 1 1 2 2 1 1 1 1 2
Nepal 1 1 1 1 1 1 1 1 1 1 1 1 1 1 1
Pakistan 4 4 4 4 4 4 4 4 4 4 4 4 4 4 4
Sri Lanka 1 1 1 2 2 1 1 1 2 2 1 1 1 1 2
Armenia 4 4 4 3 3 4 4 4 4 3 4 4 4 4 4
Azerbaijan 4 4 4 4 3 4 4 4 4 4 4 4 4 4 4
Georgia 1 1 1 2 2 1 1 1 2 2 1 1 1 1 2
Kazakhstan 1 2 2 2 2 1 2 2 2 2 1 2 2 2 2
Kyrgyzstan 1 1 1 1 1 1 1 1 1 1 1 1 1 1 1
Tajikistan 1 1 1 1 2 1 1 1 1 1 1 1 1 1 1
Turkmenistan 1 2 2 2 2 1 2 2 2 2 1 1 2 2 2
Uzbekistan 4 4 4 4 3 4 4 4 4 3 4 4 4 4 4
China 1 1 3 2 3 1 1 3 3 3 1 1 3 3 3
Japan 2 2 2 2 2 2 2 2 2 2 2 2 2 2 2
Mongolia 1 1 2 2 2 1 1 2 2 2 1 1 1 2 2
Republic of Korea 2 2 2 2 2 2 2 2 2 2 2 2 2 2 2
Brunei Darussalam 2 2 2 2 2 2 2 2 2 2 2 2 2 2 2
Cambodia 1 1 1 1 2 1 1 1 1 1 1 1 1 1 1
Indonesia 1 1 1 2 2 1 1 1 2 2 1 1 1 1 1
Lao People's Democratic Republic 1 1 1 1 2 1 1 1 1 1 1 1 1 1 1
Malaysia 1 2 2 2 2 1 2 2 2 2 1 2 2 2 2
Myanmar 1 1 1 1 1 1 1 1 1 1 1 1 1 1 1
Philippines 1 1 1 1 2 1 1 1 1 1 1 1 1 1 1
Singapore 2 2 2 2 2 2 2 2 2 2 2 2 2 2 2
Thailand 1 1 2 2 2 1 1 2 2 2 1 1 2 2 2
Timor-Leste 1 1 1 1 2 1 1 1 1 1 1 1 1 1 1
Viet Nam 1 1 1 1 2 1 1 1 1 2 1 1 1 1 1
Hydro-economic classSustainability Middle of the Road Regional Rivalry
Western Asia
Southern Asia
South-Eastern Asia
Eastern Asia

X
2010 2020 2030 2040 2050 2010 2020 2030 2040 2050 2010 2020 2030 2040 2050
Canada 2 2 2 2 2 2 2 2 2 2 2 2 2 2 2
United States of America 2 2 2 2 2 2 2 2 2 2 2 2 2 2 2
Belize 1 1 1 2 2 1 1 1 1 2 1 1 1 1 1
Costa Rica 1 1 2 2 2 1 1 2 2 2 1 1 2 2 2
El Salvador 1 1 1 2 2 1 1 1 1 2 1 1 1 1 1
Guatemala 1 1 1 1 2 1 1 1 1 1 1 1 1 1 1
Mexico 1 2 2 2 2 1 2 2 2 2 1 2 2 2 2
Nicaragua 1 1 1 1 2 1 1 1 1 1 1 1 1 1 1
Panama 1 2 2 2 2 1 2 2 2 2 1 2 2 2 2
Bahamas 2 2 2 2 2 2 2 2 2 2 2 2 2 2 2
Barbados 2 2 2 2 2 2 2 2 2 2 2 2 2 2 2
Cuba 1 1 1 2 2 1 1 1 1 2 1 1 1 1 1
Dominican Republic 1 1 2 2 2 1 1 2 2 2 1 1 1 2 2
Haiti 1 1 1 1 1 1 1 1 1 1 1 1 1 1 1
Jamaica 1 1 1 1 2 1 1 1 1 1 1 1 1 1 1
Puerto Rico 2 2 2 2 2 2 2 2 2 2 2 2 2 2 2
Saint Lucia 1 1 1 2 2 1 1 1 1 2 1 1 1 1 1
Saint Vincent and the Grenadines 1 1 2 2 2 1 1 1 2 2 1 1 1 1 2
Trinidad and Tobago 2 2 2 2 2 2 2 2 2 2 2 2 2 2 2
Argentina 1 2 2 2 2 1 2 2 2 2 1 2 2 2 2
Bolivia 1 1 1 2 2 1 1 1 1 2 1 1 1 1 1
Brazil 1 1 2 2 2 1 1 2 2 2 1 1 2 2 2
Chile 1 2 2 2 2 1 2 2 2 2 1 2 2 2 2
Colombia 1 1 2 2 2 1 1 1 2 2 1 1 1 1 2
Ecuador 1 1 1 2 2 1 1 1 2 2 1 1 1 1 1
Guyana 1 1 1 1 2 1 1 1 1 1 1 1 1 1 1
Paraguay 1 1 1 2 2 1 1 1 1 2 1 1 1 1 1
Peru 1 1 2 2 2 1 1 2 2 2 1 1 2 2 2
Suriname 1 1 2 2 2 1 1 1 2 2 1 1 1 2 2
Uruguay 1 2 2 2 2 1 2 2 2 2 1 2 2 2 2
Venezuela 1 1 2 2 2 1 1 2 2 2 1 1 2 2 2
Sustainability Middle of the Road Regional Rivalry
South America
Caribbean
Central America
Northern America
Hydro-economic class

XI
2010 2020 2030 2040 2050 2010 2020 2030 2040 2050 2010 2020 2030 2040 2050
Albania 1 1 1 2 2 1 1 1 1 2 1 1 1 1 1
Bosnia and Herzegovina 1 1 2 2 2 1 1 1 2 2 1 1 1 2 2
Croatia 2 2 2 2 2 2 2 2 2 2 2 2 2 2 2
Cyprus 2 2 2 2 2 2 2 2 2 2 2 2 2 2 2
Greece 2 2 2 2 2 2 2 2 2 2 2 2 2 2 2
Italy 2 2 2 2 2 2 2 2 2 2 2 2 2 2 2
Montenegro 1 1 2 2 2 1 1 2 2 2 1 1 1 2 2
Portugal 2 2 2 2 2 2 2 2 2 2 2 2 2 2 2
Serbia 1 1 1 2 2 1 1 1 1 2 1 1 1 1 1
Slovenia 2 2 2 2 2 2 2 2 2 2 2 2 2 2 2
Spain 2 2 2 2 2 2 2 2 2 2 2 2 2 2 2
The former Yugoslav Republic of
Macedonia1 1 2 2 2 1 1 2 2 2 1 1 2 2 2
Austria 2 2 2 2 2 2 2 2 2 2 2 2 2 2 2
Belgium 2 2 2 2 2 2 2 2 2 2 2 2 2 2 2
France 2 2 2 2 2 2 2 2 2 2 2 2 2 2 2
Germany 2 2 2 2 2 2 2 2 2 2 2 2 2 2 2
Luxembourg 2 2 2 2 2 2 2 2 2 2 2 2 2 2 2
Malta 2 2 2 2 2 2 2 2 2 2 2 2 2 2 2
Netherlands 2 2 2 2 2 2 2 2 2 2 2 2 2 2 2
Switzerland 2 2 2 2 2 2 2 2 2 2 2 2 2 2 2
Denmark 2 2 2 2 2 2 2 2 2 2 2 2 2 2 2
Estonia 2 2 2 2 2 2 2 2 2 2 2 2 2 2 2
Finland 2 2 2 2 2 2 2 2 2 2 2 2 2 2 2
Iceland 2 2 2 2 2 2 2 2 2 2 2 2 2 2 2
Ireland 2 2 2 2 2 2 2 2 2 2 2 2 2 2 2
Latvia 1 2 2 2 2 1 2 2 2 2 1 2 2 2 2
Lithuania 2 2 2 2 2 2 2 2 2 2 2 2 2 2 2
Norway 2 2 2 2 2 2 2 2 2 2 2 2 2 2 2
Sweden 2 2 2 2 2 2 2 2 2 2 2 2 2 2 2
U.K. of Great Britain and Northern
Ireland2 2 2 2 2 2 2 2 2 2 2 2 2 2 2
Belarus 1 2 2 2 2 1 2 2 2 2 1 2 2 2 2
Bulgaria 1 2 2 2 2 1 2 2 2 2 1 2 2 2 2
Czech Republic 2 2 2 2 2 2 2 2 2 2 2 2 2 2 2
Hungary 2 2 2 2 2 2 2 2 2 2 2 2 2 2 2
Poland 2 2 2 2 2 2 2 2 2 2 2 2 2 2 2
Romania 1 1 2 2 2 1 1 2 2 2 1 1 2 2 2
Russian Federation 1 2 2 2 2 1 2 2 2 2 1 2 2 2 2
Slovakia 2 2 2 2 2 2 2 2 2 2 2 2 2 2 2
Ukraine 1 1 2 2 2 1 1 1 2 2 1 1 1 2 2
Moldova Republic of 1 1 1 2 2 1 1 1 1 2 1 1 1 1 1
Australia 2 2 2 2 2 2 2 2 2 2 2 2 2 2 2
Fiji 1 1 1 1 2 1 1 1 1 1 1 1 1 1 1
French Polynesia 2 2 2 2 2 2 2 2 2 2 2 2 2 2 2
New Caledonia 2 2 2 2 2 2 2 2 2 2 2 2 2 2 2
New Zealand 2 2 2 2 2 2 2 2 2 2 2 2 2 2 2
Papua New Guinea 1 1 1 1 2 1 1 1 1 1 1 1 1 1 1
Samoa 1 1 1 1 2 1 1 1 1 1 1 1 1 1 1
Solomon Islands 1 1 1 1 2 1 1 1 1 1 1 1 1 1 1
Tonga 1 1 1 1 2 1 1 1 1 1 1 1 1 1 1
Vanuatu 1 1 1 1 2 1 1 1 1 1 1 1 1 1 1
Hydro-economic classSustainability Middle of the Road Regional Rivalry
Northern Europe
Southern Europe
Western Europe
Oceania
Eastern Europe

XII
Appe di D: Additio al results for all s e arios
Continent, subregional, country level
Content of the supplement Excel file
Level Name of the
Excel-sheet
Description Unit Scenario
CountryList List of countries
Hydro-Economic
classification
HE-Summary Classification HE1-HE4 for
each country for each
scenario
HE-class All
SummaryADA.NC Number of countries in each
HE-Class
- All
SummaryADA.POP Population in each HE-Class Million of people Middle of the Road
SummaryADA.GDPpc GDP (PPP) and GDP(PPP) per
capita in each HE-class
Billion US$2005/yr
& US$2005/yr/cap
Regional Rivalry
Population & GDP POP.ssp1 Population Number of capita Sustainability
POP.ssp2 Population Number of capita Middle of the Road
POP.ssp3 Population Number of capita Regional Rivalry
GDP ssp1 GDP (PPP) Billion US$2005/year Sustainability
GDP ssp2 GDP (PPP) Billion US$2005/year Middle of the Road
GDP ssp3 GDP (PPP) Billion US$2005/year Regional Rivalry
GDPpc.ssp1 GDP (PPP) per capita US$2005/year/cap Sustainability
GDPpc.ssp2 GDP (PPP) per capita US$2005/year/cap Middle of the Road
GDPpc.ssp3 GDP (PPP) per capita US$2005/year/cap Regional Rivalry
Area Area Area km2
Water Supply TotASWR.rcp4p5 Total Available Surface
Water Resouces
m3/year Sustainability
TotASWR.rcp6p0 Total Available Surface
Water Resouces
m3/year Middle of the Road &
Regional Rivalry
TotASWRpc.ssp1 Total Available Surface
Water Resouces per cap
m3/year/cap Sustainability
TotASWRpc.ssp2 Total Available Surface
Water Resouces per cap
m3/year/cap Middle of the Road
TotASWRpc.ssp3 Total Available Surface
Water Resouces per cap
m3/year/cap Regional Rivalry
Water demand TotDem.ssp1.rcp4p5 Total Water Demand km3/year Sustainability
TotDem.ssp2.rcp6p0 Total Water Demand km3/year Middle of the Road
TotDem.ssp3.rcp6p0 Total Water Demand km3/year Regional Rivalry
AgrDem.rcp4p5 Agricultural water demand km3/year Sustainability
AgrDem.rcp6p0 Agricultural water demand km3/year Middle of the Road &
Regional Rivalry
IndDem.ssp1 Industrial Water Demand km3/year Sustainability
IndDem.ssp2 Industrial Water Demand km3/year Middle of the Road
IndDem.ssp3 Industrial Water Demand km3/year Regional Rivalry
DomDem.ssp1 Domestic Water Demand km3/year Sustainability
DomDem.ssp2 Domestic Water Demand km3/year Middle of the Road
DomDem.ssp3 Domestic Water Demand km3/year Regional Rivalry

XIII
WATER FUTURES AND SOLUTIONS The Water Futures and Solutions Initiative (WFaS) is a
cross-sector, collaborative global project. Its objective is
to developing scientific evidence and applying systems
analysis to help identify water-related policies and
management practices that work together consistently
across scales and sectors to improve human well-being
through water security.
A stakeholder informed, scenario-based assessment of
water resources and water demand, employing
ensembles of state-of-the-art socio-economic and
hydrological models, examines possible futures and tests
the feasibility, sustainability and robustness of options
that can be implemented today and can be sustainable
and robust across a range of possible futures and
associated uncertainties we face.
The Water Futures and Solutions (WFaS) initiative has
produced a consistent and comprehensive projection for
global possible water futures. Focusing on the near future
until the 2050s, WFaS assessed how water future changes
over time, employing a multi-model projection.
The impacts of socioeconomic and climatic changes on
water security have been assessed through the
development of a hydro-economic classification system
that aggregates indicators of hydrological challenges and
adaptation capacities.