water flow and transport of chloride in unsaturated …
TRANSCRIPT
WATER FLOW AND TRANSPORT OF CHLORIDE IN UNSATURATED CONCRETE
A Thesis Submitted to the College of Graduate Studies and Research
in Partial Fulfillment of the Degree of Master of Science in
the Department of Civil and Geological Engineering,
University of Saskatchewan, Saskatoon, Canada
By
Ajeet Kumar
© Copyright Ajeet Kumar, July 2010. All rights reserved.
brought to you by COREView metadata, citation and similar papers at core.ac.uk
provided by University of Saskatchewan's Research Archive
i
PERMISSION TO USE
In presenting this thesis in partial fulfillment of the requirements for a Postgraduate
degree from the University of Saskatchewan, I agree that the Libraries of this University
may make it freely available for inspection. I further agree that the permission for
copying of this thesis in any manner, in whole or in part, for scholarly purposes may be
granted by the professor or professors who supervised my thesis work or, in their
absence, by the Head of the Department or the Dean of the College in which my thesis
work was done. It is understood that any copying or publication or use of this thesis or
parts thereof for financial gain shall not be allowed without my written permission. It is
also understood that due recognition shall be given to me and the University of
Saskatchewan in any scholarly use which may be made of any material in my thesis.
Requests for permission to copy or to make other use of material in this thesis in whole
or in part should be addressed to:
Head of the Department of Civil and Geological Engineering,
University of Saskatchewan
57 Campus Drive
Saskatoon, Saskatchewan
Canada, S7N 5A9.
ii
ABSTRACT
Concrete structures deteriorate in their operating environment under the combined action
of harsh environmental conditions and external loading. Although the applied load can
lead to a certain degradation of the structure, the main long-term deterioration
mechanism involves moisture movement and the transport of chlorides within concrete.
In order to build durable and reliable structures, it is necessary to be able to accurately
predict the movement of moisture and chlorides within concrete.
In the case of unsaturated concrete, the transport of chloride ions is integrally associated
with prediction of moisture fluxes in concrete. Even the diffusion of chloride ions
depends on the degree of saturation of the concrete since concrete must have a
continuous liquid phase for diffusion to occur. Therefore, simple diffusion theory, used
in the current literature, is not sufficient to predict the diffusion of chloride ions in the
case of unsaturated concrete. Most diffusion models described in the current published
literature are applicable to concrete structures that are permanently wet and invariably
underestimate the amount of chlorides penetrating the concrete of structures subjected to
wetting and drying cycles. The research presented in this thesis reviews current
knowledge, mathematical models and test methods pertinent to the movement of
moisture and transport of chloride ions in unsaturated concrete.
A laboratory testing program was established to characterize the material properties of
concrete mixes with water-cement ratios 0.4, 0.5 and 0.6. Concrete was characterized by
its saturated hydraulic conductivity, moisture retention function and dependence of
diffusion coefficient on degree of saturation. A geotechnical centrifuge was used to
determine the saturated hydraulic conductivity of the concrete samples. Values of the
saturated hydraulic conductivity of the samples were in the range of 10-11-10-12 m/s.

iii
The moisture retention function of concrete samples was determined using a vapour
equilibrium technique. The experimental moisture retention data was used to determine
van Genuchten parameters for each of the concrete mixtures and subsequently used to
determine the capillary pressure-degree of saturation relationship and relative
permeability-degree of saturation relationship as a ``closed- form`` analytical expression.
An electrical resistivity technique was used to determine the dependence of the chloride
diffusion coefficient on the degree of saturation of the concrete. The result was
compared with the Millington and Quirk model. Most of the experimental results should
be useful to researchers in the field, as well as the engineering community at large,
considering that they are rarely found in the concrete literature.
Simulations were made to determine the influence of various parameters measured
during experiment on movement of moisture and transport of chloride ions in
unsaturated concrete using TOUGH2, a multiphase, multicomponent, model that
simulates coupled heat, moisture and salt transport in saturated and unsaturated rocks.

iv
ACKNOWLEDGEMENTS
This work would not have been possible without the whole-hearted support and
encouragement of many individuals. Their contribution, in assorted ways to the research
and the making of the thesis, deserved special mention. It is a pleasure to convey my
gratitude to them all in my humble acknowledgment.
First and foremost, I want to thank the Department of Civil and Geological Engineering
for giving me permission to commence this thesis in the first instance. I offer my
sincerest gratitude to my supervisor, Dr. M. Boulfiza, who has supported me throughout
my thesis with his patience and knowledge whilst allowing me the room to work in my
own way. I am grateful to him for being a part of this project, which has proven to be
very interesting and challenging at times.
I have to thank Professors S.L. Barbour, J. Sharma and B.F. Sparling, the members of
my advisory committee, for their expertise, constructive criticism, guidance and valuable
comments during the course of this research. Their involvement with originality has
triggered and nourished my intellectual maturity that I will benefit from, for a long time
to come.
I am grateful for the financial support provided by the Natural Sciences and Engineering
Research Council of Canada (NSERC) and Intelligent Sensing for Innovative Structures
(ISIS) Canada.
I would like to thank Mr. Alex Kozlow, Mr. Doug Fisher, Mr. Dale Pavier, for their
assistance and direction throughout the laboratory component of the research.

v
My parents and family deserve special acknowledgement for encouraging me to pursue
my degree. I have relied on their love and support throughout all my academics. Their
unflinching courage and conviction always inspired me. It is to them that I dedicate this
work.
I cannot end without thanking the friendly and cheerful group of fellow students, who
helped and stood by me during the course of my stay at the University. I would also like
to thank any others whom I may have missed, who have, directly or indirectly,
contributed to my research.
Last but not the least; I would like to thank The Almighty, for having made everything
possible by giving me strength and courage to do this work
vi
Table of Contents
PERMISSION TO USE...................................................................................................................... i
ABSTRACT ........................................................................................................................................ ii
ACKNOWLEDGEMENTS............................................................................................................. iv
Table of Contents.............................................................................................................................vi
List of Figures................................................................................................................................... ix
List of Tables..................................................................................................................................... xi
1 Introduction................................................................................................................................. 1
1.1 Background........................................................................................................................ 1
1.2 Unsaturated Flow and Transport of Chlorides ................................................................ 2
1.3 Objective and Scope of Research ..................................................................................... 4
1.4 Research Methodology...................................................................................................... 4
1.5 Outline of the thesis........................................................................................................... 5
2 Literature Review ....................................................................................................................... 7
2.1 Moisture movement in concrete ....................................................................................... 7
2.1.1 Water flow under saturated conditions ........................................................................ 7
2.1.2 Water flow under unsaturated conditions.................................................................... 9
2.1.3 Experiments................................................................................................................. 15
2.2 Chloride Transport .......................................................................................................... 22
2.2.1 Chloride transport by diffusion .................................................................................. 23
2.2.2 Chloride transport by advection ................................................................................. 25
2.2.3 Experiments................................................................................................................. 26
2.3 Models for Predicting Chlorides Ingress ....................................................................... 30
2.3.1 Diffusion Models ........................................................................................................ 30
2.3.2 Advection-Diffusion Models ..................................................................................... 31
2.3.3 Multiphase Multicomponent Models......................................................................... 32

vii
2.4 Literature Survey Summary............................................................................................ 33
3 Materials and Methods............................................................................................................. 36
3.1 Materials and concrete mixtures..................................................................................... 36
3.2 Centrifuge Technique...................................................................................................... 41
3.2.1 Equipments and Materials .......................................................................................... 41
3.2.2 Testing Method ........................................................................................................... 45
3.3 Vapour Equilibrium Technique ...................................................................................... 47
3.3.1 Equipments and Materials .......................................................................................... 47
3.3.2 Testing Method ........................................................................................................... 49
3.4 Resistivity Test ................................................................................................................ 52
3.4.1 Equipments and Materials .......................................................................................... 52
3.4.2 Testing Method ........................................................................................................... 53
3.5 Summary .......................................................................................................................... 54
4 Results and Discussion............................................................................................................. 56
4.1 Centrifuge Technique...................................................................................................... 56
4.1.1 Measurement of Saturated Hydraulic Conductivity ................................................. 56
4.2 Vapour Equilibrium Technique ...................................................................................... 59
4.2.1 Moisture Retention Function...................................................................................... 59
4.3 Resistivity Test ................................................................................................................ 65
4.3.1 Saturation Dependence of Chlorides Diffusion ........................................................ 65
4.4 Numerical Modelling ...................................................................................................... 72
4.4.1 Influence of degree of saturation on chloride penetration........................................ 76
4.4.2 Influence of concrete mix on chloride penetration ................................................... 78
4.4.3 Influence of degree of saturation on chloride diffusion ........................................... 80
4.5 Summary .......................................................................................................................... 82
5 Conclusions & Recommendations .......................................................................................... 85
5.1 Summary of work ............................................................................................................ 85
5.2 Important findings ........................................................................................................... 86

viii
5.3 Conclusions...................................................................................................................... 88
5.4 Recommendations for future work................................................................................. 88
6 References................................................................................................................................. 90
ix
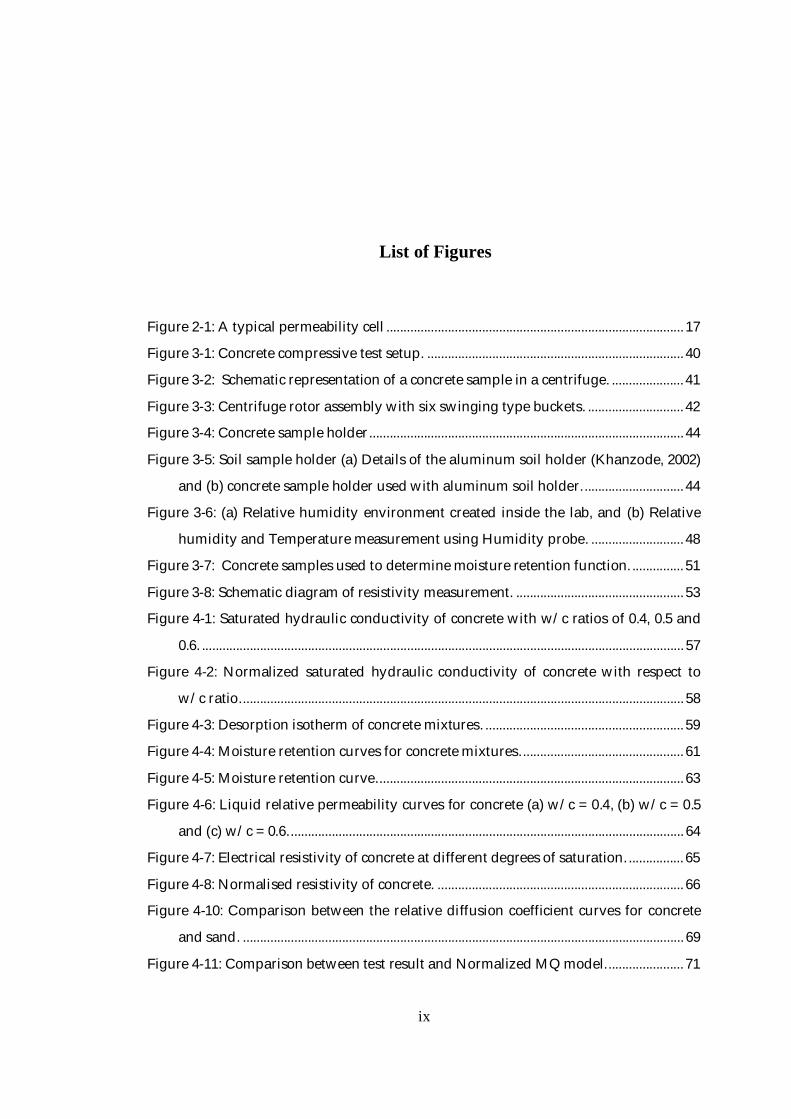
List of Figures
Figure 2-1: A typical permeability cell ....................................................................................... 17
Figure 3-1: Concrete compressive test setup. ........................................................................... 40
Figure 3-2: Schematic representation of a concrete sample in a centrifuge. ..................... 41
Figure 3-3: Centrifuge rotor assembly with six swinging type buckets. ............................ 42
Figure 3-4: Concrete sample holder............................................................................................ 44
Figure 3-5: Soil sample holder (a) Details of the aluminum soil holder (Khanzode, 2002)
and (b) concrete sample holder used with aluminum soil holder.............................. 44
Figure 3-6: (a) Relative humidity environment created inside the lab, and (b) Relative
humidity and Temperature measurement using Humidity probe. ........................... 48
Figure 3-7: Concrete samples used to determine moisture retention function. ............... 51
Figure 3-8: Schematic diagram of resistivity measurement. ................................................. 53
Figure 4-1: Saturated hydraulic conductivity of concrete with w/c ratios of 0.4, 0.5 and
0.6. ............................................................................................................................................. 57
Figure 4-2: Normalized saturated hydraulic conductivity of concrete with respect to
w/c ratio.................................................................................................................................. 58
Figure 4-3: Desorption isotherm of concrete mixtures. .......................................................... 59
Figure 4-4: Moisture retention curves for concrete mixtures................................................ 61
Figure 4-5: Moisture retention curve.......................................................................................... 63
Figure 4-6: Liquid relative permeability curves for concrete (a) w/c = 0.4, (b) w/c = 0.5
and (c) w/c = 0.6.................................................................................................................... 64
Figure 4-7: Electrical resistivity of concrete at different degrees of saturation. ................ 65
Figure 4-8: Normalised resistivity of concrete. ........................................................................ 66
Figure 4-10: Comparison between the relative diffusion coefficient curves for concrete
and sand. ................................................................................................................................. 69
Figure 4-11: Comparison between test result and Normalized MQ model....................... 71
x
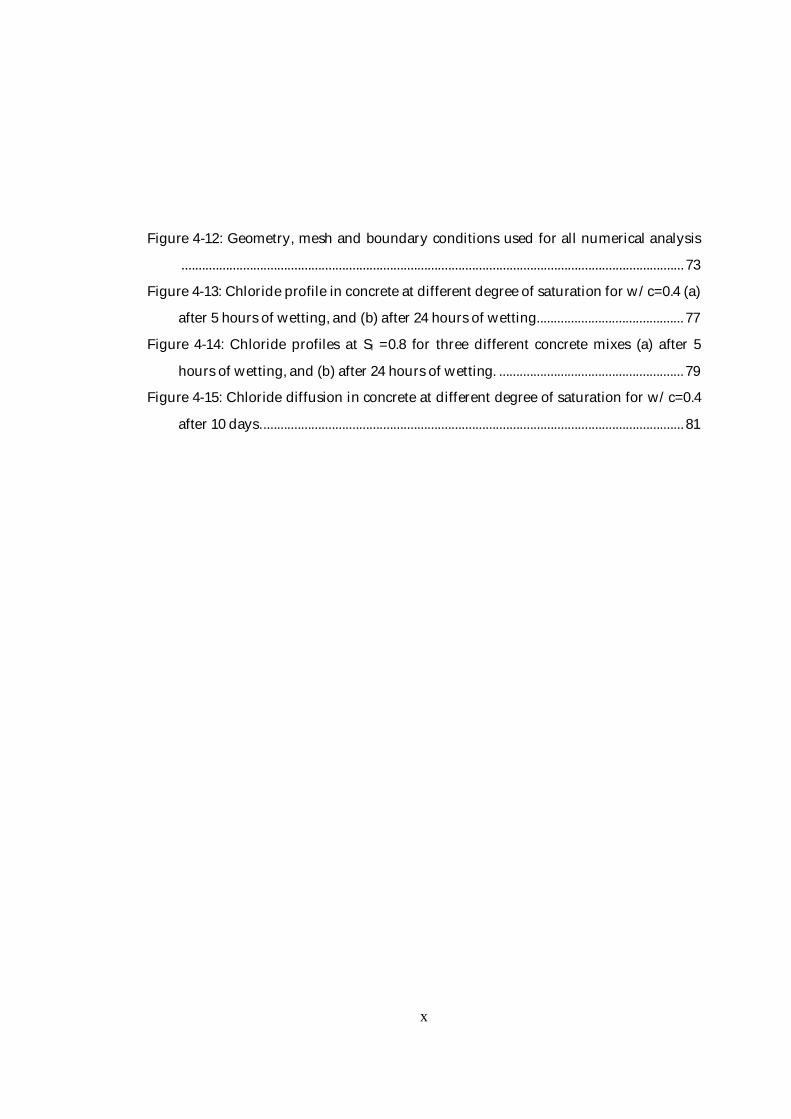
Figure 4-12: Geometry, mesh and boundary conditions used for all numerical analysis
................................................................................................................................................... 73
Figure 4-13: Chloride profile in concrete at different degree of saturation for w/c=0.4 (a)
after 5 hours of wetting, and (b) after 24 hours of wetting........................................... 77
Figure 4-14: Chloride profiles at Sl =0.8 for three different concrete mixes (a) after 5
hours of wetting, and (b) after 24 hours of wetting. ...................................................... 79
Figure 4-15: Chloride diffusion in concrete at different degree of saturation for w/c=0.4
after 10 days............................................................................................................................ 81
xi
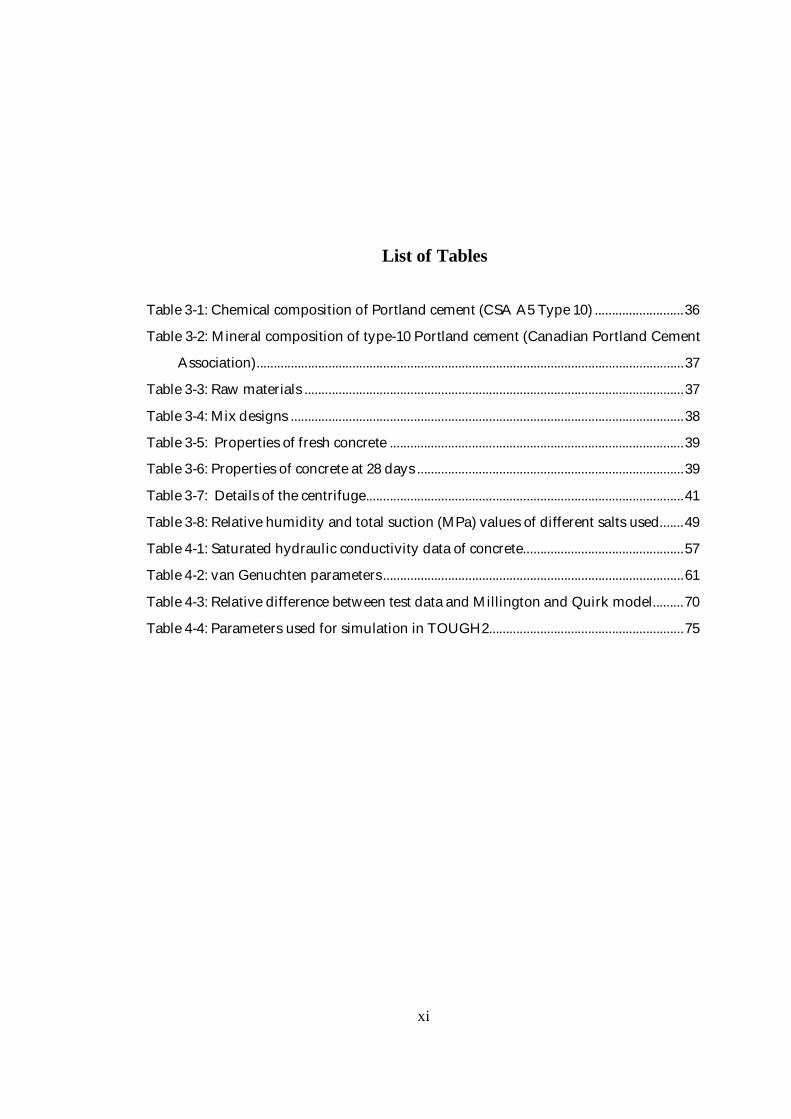
List of Tables
Table 3-1: Chemical composition of Portland cement (CSA A5 Type 10) ..........................36
Table 3-2: Mineral composition of type-10 Portland cement (Canadian Portland Cement
Association).............................................................................................................................37
Table 3-3: Raw materials ...............................................................................................................37
Table 3-4: Mix designs ...................................................................................................................38
Table 3-5: Properties of fresh concrete ......................................................................................39
Table 3-6: Properties of concrete at 28 days ..............................................................................39
Table 3-7: Details of the centrifuge.............................................................................................41
Table 3-8: Relative humidity and total suction (MPa) values of different salts used.......49
Table 4-1: Saturated hydraulic conductivity data of concrete...............................................57
Table 4-2: van Genuchten parameters........................................................................................61
Table 4-3: Relative difference between test data and Millington and Quirk model.........70
Table 4-4: Parameters used for simulation in TOUGH2.........................................................75

1
1 Introduction
1.1 Background Service life prediction has emerged, over the last few years, as a major task in the design
of concrete structures. The main long-term concrete deterioration mechanism involves
moisture movement and the transport of dissolved harmful chemical species within
concrete. In particular, the ingress of chlorides is a major cause of early deterioration of
reinforced concrete structures. Although chloride ions in concrete do not directly cause
severe damage to the concrete, they initiate and contribute to the corrosion of rebar in
the structures when the chloride concentration at the surface of the rebar reaches a
threshold level. The formation of rust is associated with large volume expansions which
may result in cracking, spalling, and delamination of the concrete cover. In addition,
severe corrosion reduces the load-carrying capacity of structures by reducing the cross-
sectional area of reinforcement. In cold countries, the use of de-icing salt on roads and
bridges in winter causes a premature deterioration of structures. Typically, bridge decks
are exposed to cyclic wetting and drying conditions, and are subject to direct impact and
repeated loading by traffic. These conditions, combined with salt applications, create a
severe environment for the concrete.
One of the worst types of environmental exposure conditions leading to the premature
degradation of structures is the case of concrete that is subject to repeated drying and
wetting cycles. Although a very large number of concrete structures do operate under
unsaturated conditions, most researchers in the concrete community have devoted their
efforts to study transport of chloride in concrete under saturated conditions with little
published data on the case of unsaturated concrete. Most diffusion models in the
published literature are applicable to concrete structures that remain fully saturated at all
times. They underestimate the amount of chloride penetrating a structure subjected to
2
wetting and drying cycles, as is the case for the splash and tidal zones of structures
exposed to marine environments or for highway structures exposed to de-icing salts.
Chloride profiles in these structures depend strongly on moisture fluctuation in the
concrete cover. Other fields, such as soil physics and rock mechanics have made
considerable progress in the modelling of unsaturated moisture movement by developing
and/or applying the general theory of porous media which gives a powerful and
consistent framework for addressing these issues.
1.2 Unsaturated Flow and Transport of Chlorides In general, the pore space of concrete is not fully saturated (Kelham 1988; Hall 1989;
Hall 1994). When the moisture content inside concrete is less than the saturation
moisture content, water may be absorbed by the concrete through large capillary forces
arising from the contact of the very small pores of the concrete with the liquid phase.
This is an important mechanism of fluid invasion in concrete in most practical situations.
Under unsaturated conditions, the water flux and subsequently the transport of dissolved
chloride ions in response to a specified potential gradient is strongly dependent on the
saturation of the material. The equilibrium state of water in an unsaturated porous
material is characterized by its capillary pressure-degree of saturation function (also
known as moisture retention function). Therefore, determination of the moisture
retention function is necessary for the modelling of moisture flow and transport of
chlorides in concrete. There has been very little effort to establish relationships for the
capillary pressure as a function of degree of saturation for concrete.
Chloride diffusion can only occur if a continuous water phase is present in the capillary
pores of concrete to provide a path for diffusion. Therefore, in the case of unsaturated
concrete the diffusion process is hindered since the number of water filled pores
decreases and that decreases the continuity of pore solution (Saetta et al. 1993). Under
unsaturated conditions, the effective diffusion coefficient is no longer a constant but a
function of saturation (Bazant and Najjar 1972; Garboczi 1990; Saetta et al. 1993;
McCarter, et al. 2001) and therefore can not be described by simple diffusion theories
that are typically used in the present literature. Dependence of the diffusion coefficient

3
on the degree of saturation is essential for determining the moisture flow and transport
of chlorides in unsaturated concrete, in addition to the basic physical properties of
concrete e.g. porosity, density, saturated hydraulic conductivity and moisture retention
function. Up to now, relatively few authors, have focused on the effect of water
saturation upon the diffusion coefficient in unsaturated porous materials, despite the fact
that this is an essential component needed to model the transport of ions under
unsaturated conditions. There is no direct experimental method found in the concrete
literature to determine the dependence of the diffusion coefficient on the degree of
saturation of concrete.
The complexity of the microstructure of concrete makes the theoretical and experimental
investigation of its transport properties a great challenge. Depending on the mix design,
preparation and environmental exposure, the material properties can be highly variable.
The movement of moisture and the transport of chloride ions depend on a large number
of factors such as porosity, pore size distribution, connectivity, and tortuosity. Currently,
there are no standards test methods to measure key transport properties of concrete such
as permeability and capillary- driven moisture transfer. However, some test methods
developed and used by some other disciplines like soil sciences, rock sciences and
petroleum sciences can also be used for concrete.
Multiphase multicomponent models are widely used for the determination of flow and
transport processes in a porous medium. Concrete can be considered as a multiphase
porous system where the pores are partly filled with liquid water and partly with a
gaseous mixture of air and water vapour. In recent years, several models for simulating
multiphase flow in porous media under unsaturated condition have been developed and
can be very well used for concrete. These mathematical models normally consist of
conservation equations (mass conservation of water, mass conservation of air, mass
conservation of chlorides and energy conservation of the whole medium) completed by
an appropriate set of constitutive equations (Darcy’s law of mass flux, Fick’s law of
diffusion, capillary pressure, absolute and relative permeability, effective diffusion
coefficient, effective thermal conductivity, etc.) as well as some thermodynamic

4
relationships. The decisive parameters which influence the flow and transport process
can be determined experimentally.
1.3 Objective and Scope of Research The overall objective for this research is to evaluate moisture flow and the transport of
chlorides in unsaturated concrete. This objective is important for the evaluation of
service life performance of concrete structures operating under unsaturated conditions.
This will help in determining design criteria, which may enhance the service life
performance of concrete structures.
The overall objective has been pursued through a series of more specific objectives.
These specific objectives include: (1) developing a sound theoretical framework for
evaluating moisture flow by using the developments from different fields other than
concrete, such as soil science and the petroleum industry and apply them to the case of
concrete; (2) experimental determination of the key parameters required for modelling
moisture flow and transport of chlorides in unsaturated concrete, such as saturated
hydraulic conductivity, moisture retention function and the dependence of the diffusion
coefficient on the degree of saturation of concrete; and, (3) simulating moisture flow
and transport of chlorides in unsaturated concrete using experimental parameters and
determining the influence of those parameters on the movement of moisture and
transport of chloride ions in unsaturated concrete.
The scope of the research work is limited to uncracked concrete. Chloride binding is also
not considered while determining the transport of chlorides in concrete.
1.4 Research Methodology The research methodology is divided into two components:
1. Laboratory Tests
2. Numerical Modelling

5
Laboratory tests involved the preparation of three standard concrete mixtures and the
determination of key parameters such as the hydraulic conductivity, the moisture
retention function and the diffusion coefficient-degree of saturation relationship, needed
for modelling moisture flow and transport of chlorides.
The numerical modelling component involved using a multiphase multicomponent
model simulator, TOUGH2, to evaluate the influence of various parameters measured
during the experiments on the movement of moisture and transport of chloride ions in
unsaturated concrete.
1.5 Outline of the thesis Chapter 2 presents a review of current knowledge, mathematical models and test
methods pertaining to the moisture flow and transport of chlorides in unsaturated
concrete. The chapter focuses on identifying a sound theoretical framework for
evaluating moisture flow by using the developments from different fields other than
concrete, such as soil sciences and the petroleum industry and applying them to the case
of concrete.
Chapter 3 presents all the details concerning the materials and methods used to perform
the experiment. All the experimental procedures are presented as well as the method
used to obtain the necessary parameters needed to model unsaturated moisture flow and
transport of chlorides in unsaturated concrete.
Chapter 4 presents experimental determination of the necessary parameters needed to
model unsaturated moisture flow and transport of chlorides in unsaturated concrete. The
results of the experimental testing are discussed in this Chapter, the conclusions that can
be drawn from the results as well as influence of various parameters measured during
the experiments on the movement of moisture and transport of chloride ions in
unsaturated by using a multiphase multicomponent model.

6
The last chapter present a summary of the research, the conclusion that can be drawn
from the results and recommendations for future work.

7
2 Literature Review
Moisture movement coupled with transport of chlorides in concrete is one of the main
causes of deterioration of concrete structures. This chapter presents a review of current
knowledge, mathematical models and test methods pertinent to the main transport
properties of unsaturated concrete. The main properties and transport mechanisms
affecting moisture movement and chloride ions transport include permeability, capillary
absorption, and diffusion.
2.1 Moisture movement in concrete
Concrete is a porous material and when the pores inside concrete are filled with water it
is referred to as a saturated concrete. When the pores are occupied by both water and gas
it is called unsaturated concrete. The movement of moisture and associated transport of
dissolved chlorides depend on the saturation level of concrete. The driving potential for
moisture movement in both saturated and unsaturated concrete is a pressure gradient.
2.1.1 Water flow under saturated conditions
Water movement under saturated conditions can be described by the well-known
Darcy’s Law. Darcy’s Law states that the volumetric flow rate in one dimension through
a porous medium is proportional to the cross-sectional area and the hydraulic gradient.
Darcy’s Law can be expressed as:
dhQ = - K Adl
[2-1]
where:
Q = volumetric discharge [m3s-1],
K = hydraulic conductivity [m s-1],
A = cross-sectional area [m2],
8
h = hydraulic head [m] = (P/ wg) + z
p = fluid pressure [N m-2],
w = fluid density [kg m-3],
g = acceleration due to gravity [m s-2]
z = elevation [m]
l = flow path length [m], and
dh/dl = hydraulic gradient [-].
Hydraulic conductivity, K, also known as coefficient of permeability, is a function of the
properties of the fluid and the porous medium in which the fluid flows. A more rational
concept of permeability which is independent of the fluid properties and depends only
on the characteristics of the porous medium is intrinsic permeability. Hydraulic
conductivity and intrinsic permeability are related by the following equation:
wk gK = [2-2]
where:
k = intrinsic permeability [m2], and
µ = dynamic viscosity of fluid [kg m-1 s-1].
Equation [2-1] can be rewritten in terms of the Darcy flux or volume flux (q), defined as
the flow per unit cross sectional area of the medium:
Q dhq= = - K A dl
[2-3]
Although the volume flux has the units of velocity, it does not describe the velocity of
fluid is flowing through the pores. This is due to the fact that only the portion of the
medium that is filled with the fluid contributes to flow.
The law of mass conservation applies to any mass transport process and provides a
differential equation which, when solved, gives the hydraulic head and flow rate in the
flow domain. The continuity equation states that divergence ( ) of the mass flux
9
equals change in mass in a control volume. Under steady state, considering water to be
incompressible ( w is constant), the continuity equation can be written as
0q
[2-4]
2.1.2 Water flow under unsaturated conditions
In general, the pore space of concrete is not fully saturated (Kelham 1988; Hall 1989;
Hall 1994). The degree of saturation of the pore space can depend on different factors
such as relative humidity and the previous exposure of concrete to moisture. When the
moisture content inside a concrete material is less than its saturation level, water may be
absorbed into the concrete by large capillary forces arising from the contact of the very
small pores of concrete with the liquid phase. This is an important mechanism of water
flow into concrete that is often observed in field applications subjected to wetting/drying
cycles.
Single phase flow Richards (1931) was among the first authors to study the mechanism of water flow in
unsaturated porous materials. The movement of water through the unsaturated
zone is commonly described using Richards’ equation. Darcy’s Law, which has
been applied to saturated flow in porous media, can be generalized to unsaturated water
flow where it can be written for the liquid phase as (Scheidegger 1974):
l
k .krlq = - ( P - g)l ll [2-5]
where ql is the volumetric flux of the liquid phase, k is the intrinsic permeability, krl is
the relative permeability of liquid, l is the liquid phase density and Pl is the liquid
phase pressure.
Richards applied a continuity requirement to Darcy’s law, and obtained a general partial
differential equation describing water movement in unsaturated soils. He proposed the
following equation to describe the flow of water under capillary suction:

10
( ll
S ) = - qt
[2-6]
where is the porosity and Sl is the saturation of the liquid phase.
This equation assumes that the water - air system can be simplified by considering air
to be infinitely mobile and neglecting the effect of displaced air during liquid flow. The
pressure in the air phase is then zero gauge everywhere and spatial derivatives of the air
phase pressure are zero as well. As a result, only the wetting phase equation is
necessary to describe the flow system. Combining equations [2-5] and [2-6] results
in the wetting phase equation referred to as Richards’ equation:
( ) . ( )l rll l
l
S k k P gt
[2-7]
Multiphase multicomponent models Multiphase multicomponent models are more general models widely used for the
determination of flow in porous media in situations where Richards’ equation is no
longer adequate. Multiphase multicomponent models are a generalisation of the
modelling used in two-phase flow to cases where more than two phases are present. The
‘phase state’ indicates which phases are present locally in the control volume. Darcy’s
Law, which has been applied to single phase flow in porous media, can be generalized
for multiphase flow or unsaturated flow assuming that the flow of a phase in the
presence of another phase can be viewed as a single phase flow through a reduced pore
network, with permeability replaced by phase permeability, and is written for phase as
(Scheidegger 1974):
. ( )rk kq P g [2-8]
where q is the volumetric flux in the fluid phase (liquid or gas) , k is the relative
permeability, and P is the fluid pressure in phase . Relative permeability quantifies the
interference of one phase with the other and varies between 0 to 1. Each of the phases is
considered to have a separately defined volume fraction with the sum equal to unity. The

11
pressure P in phase is the sum of the pressure P of a reference phase (usually taken to
be the gas phase), and the capillary pressure P .
cP P P [2-9]
In general, capillary pressure is defined as the pressure difference between the non-
wetting phase (air) and the wetting phase (water) (Bear 1972). Capillary pressure
depends on the saturation of concrete and is expressed as:
( )g l c lP P P S [2-10]
The movement of each phase through an unsaturated porous media occurs under the
combined action of gravity, and pressure forces and can be described by the general
mass balance equation as (Scheidegger 1974; Dullien 1992):
( ) ( )S q Ft
[2-11]
where is the porosity, is the density of phase , S is the saturation of phase , or
fraction of void space occupied by phase , F is a source or sink term, and ( )q is
the divergence of fluid flux. Mass balance equation for each phase can be written
separately.
Using the multiphase multicomponent mathematical models one could consider concrete
as a multiphase multicomponent porous material. The pore volume of concrete is
considered to be occupied by two phases: water (index l) and gas (index g). The phases
are considered to be immiscible (i.e. separate from each other). The two fluid
components of interest in the case of concrete are water and air; each of which can
partition into each phase. The gas phase is treated as a mixture of air and water vapour,
where each constituent may exist in any fraction between zero and one. On the other
hand, the liquid phase is mostly water, although small amounts of dissolved air can exist
in solution. For the non-isothermal multiphase processes taking place in the porous
media under consideration, the assumption of local equilibrium is valid since flow
velocities are small. Effects of hysteresis in the constitutive relationships are not
accounted for. Component mass balances are developed under the assumption of

12
thermodynamic phase equilibrium. Component balance equations for water and air take
the form:
w
a
d M Ftd M Ft
w w
a a
[2-12]
where wd ( ad ) is the bulk density of water (air), M w ( Ma ) denotes the net mass flux of
water (air), and Fw ( Fa ) denotes mass source for water (air). The bulk density is given
by:
w wl l l wg g g
a al l l ag g g
d X S X S
d X S X S [2-13]
where wlX ( alX ) denotes the mass fraction of the water (air) component in the liquid
phase, wgX ( agX ) mass fraction of the water (air) component in gas phase, l ( g ) is
the liquid (gas) phase density, lS ( gS ) is the liquid (gas) phase saturation, and is the
porosity. The pore space is assumed to be fully occupied by the fluid phase, and hence,
1l gS S .
The water and air net mass fluxes appearing in the balance equation [2-12], are assumed
to be a superposition of component fluxes in each phase,
w wl wgM M M [2-14]
where lM w denotes the net mass flux of water in the liquid phase, and gM w denotes the
net mass flux of water in the gas phase. Mass flux of dissolved air in the liquid phase has
been neglected. Each component phase-flux can be written as a sum of an advective flux
and a diffusive flux,
+ J+ J
+ J
wl wl l l wl
wg wg g g wg
a ag g g ag
M X qM X q
M X q [2-15]

13
where J is the diffusive flux of component in the bulk of fluid phase . The
advective fluxes are assumed to be properly described by the extended Darcy law, in
which relative permeabilities are introduced to account for the multiphase motion of
fluids as defined by equation [2-8]. Assuming that each phase has its own phase pressure,
the mass fluxes of liquid and gas phases are given by
g
g
rll l l
l
rgg g g
g
kq k P
kq k P
[2-16]
where Pl(Pg) is the liquid (gas) phase pressure. The phase pressures are related via the
capillary pressure as defined by equation [2-9].
It is clear from equation [2-16], both the capillary pressure-saturation function and
relative permeability-saturation function are fundamental for a realistic modelling of
moisture flow in unsaturated concrete. The common parameter, degree of saturation,
serves to link the two constitutive relationships and provides further coupling of the flow
equations through the additional constraint that the fluid saturations must sum to unity.
The equilibrium state of water in an unsaturated porous material is characterized by its
capillary pressure-saturation function, Pc(Sl ), also known as moisture retention function.
The Van Genuchten mathematical model (1980) which is based on Mualem’s research
(1976), has been used extensively for representing the moisture retention function in the
field of soil sciences and has been validated for concrete by Savage (1997) and used by
others (Mainguy et al. 2001; Monlouis et al. 2004; Pont et al. 2004). While it remains a
challenge to measure relative permeability in concrete, it is reasonable to expect that
some of the experimental methods developed in the field of soil sciences to determine
relative permeability should be applicable to concrete (Hall 1989; Dullien 1992).
One alternative to the direct measurement of the relative permeability is to use
theoretical methods which predict the permeability from more easily measured moisture
retention data. Measured moisture retention data can be expressed by means of closed-
form analytical expressions which contain parameters that are fitted to the observed data.

14
The use of analytical functions allow for a more efficient representation of the hydraulic
properties and at the same time provide a method for interpolating or extrapolating to
parts of the retention or permeability curves for which no data are available.
Relative permeability and the capillary pressure are represented by the van Genuchten-
Mualem model (Mualem 1976; van Genuchten 1980) and van Genuchten function
(1980), respectively.
* * 1/ 2{1 (1 [ ] ) }m mrlk S S [2-17]
11
*1 ( ) 1n
mcP S [2-18]
*
1l lr
lr
S SS
S [2-19]
where m, n and are empirical material parameters , with m=1-1/n
The diffusive fluxes of component in phase are given by
0J D X [2-20]
where is porosity, 0 is the tortuosity of the porous medium, is the phase density
and, D is the diffusion coefficient of component in the bulk of fluid phase .
Although chloride transport can be represented by the above equation, only diffusive
fluxes of water and air will be described here. The transport of chlorides will be
discussed in section 2.2. Application of equation [2-20] to the case of water and air
yields the following equations.
0
0
0
wl l l wl wl
wg g g wg wg
ag g g ag ag
J D XJ D XJ D X
[2-21]

15
2.1.3 Experiments
In order to measure key transport properties of any materials, standard experimental test
methods are needed. Without standard experimental test methods, it is difficult to
develop criteria needed for the prediction and assessment of the service life of concrete
structures. Currently, there are no standard test methods for measuring key transport
properties of concrete, such as permeability and capillary- driven moisture transfer. The
following sections explain experimental methods used to determine the major transport
properties of porous materials. The methods discussed here are not only from the field of
concrete, but also from soil sciences and the petroleum industry.
Determination of saturated permeability Saturated permeability measurements are often made on small-scale laboratory samples.
Although there are numerous Portland Cement Concrete (PCC) permeability
measurement methods, none is recognized as a standard test method. In one method,
borrowed from soil science, a head of water is placed above the concrete sample and
then the height of the head is monitored over time to determine the volumetric flow
through the concrete. The permeability of the sample is then determined using Darcy’s
law. The main drawback of this method is that it may take weeks or longer to obtain
sufficient flow to determine permeability due to the low permeability of concrete. For
low hydraulic gradients and reasonable sample sizes, the quantity of flow through a
sample can be expected to be quite small. The value of saturated permeability for typical
concrete is l0-12 m2. These values of permeability are orders of magnitude lower than for
common porous media such as soil and sandstone rock and, hence, are much more
difficult to measure.
To establish even a small flow rate through concrete requires a relatively high pressure
and an effective seal is required during the test to reduce leakage of fluids along the side
[Martys 1995]. Therefore, most permeability tests require the application of high
pressures and the use of custom made permeameters for measurement of the
permeability of concrete. The test method is difficult to standardize due to different test

16
pressures, duration of the test, methods used to seal the specimen in the cell, and test
procedures (Nyame and Illston 1981; Nyame 1985; Dhir et al. 1989; Ludirdja et al.
1989; El-Dieb and Hooten 1994).
The most direct experimental arrangement for determining permeability involves
measuring the steady flow of water through a sample of uniform cross- sectional area
with the sample sides sealed to prevent leakage and the flow under an applied pressure
(Basheer 2001). For a constant head setup, the coefficient of permeability is calculated
from the knowledge of sample geometry and fluid characteristics, together with the
measurement of flow rate and applied pressure using equations [2-1] and [2-2]. For a
falling head setup, the flow rate is measured under the action of diminishing pressure
head. If during the test, the level of water in the water tube falls from an initial height h0
at t=0 to some height ht at time t, the permeability of the concrete sample is calculated as
follows:
0
t
haLK = lnAt h
[2-22]
where a = cross-sectional area of water tube
A = cross sectional area of the sample, and
L = length of the specimen parallel to the direction of flow.
In addition to the traditional permeability cell which is commonly used to measure the
permeability of a concrete, there are some other methods which also can be used for
determining the permeability of concrete. A geotechnical centrifuge is one of them.
Geotechnical centrifuges have been used in recent years to understand and simulate
transport mechanisms in soils under accelerated–gravity environments. The centrifuge
can be used in two very distinct ways: as a testing apparatus to obtain characteristic
parameters, such as hydraulic conductivity and diffusion coefficient; and as a modelling
apparatus to examine theory and in order to validate the capabilities of numerical
simulations (Alemi et al. 1976; Cargill and Ko Hon-Yim 1983; Arulanandan 1988;
Mitchell 1991; Mitchell 1994; Singh and Gupta 2000; Khanzode et al. 2002; Singh and
Kuriyan 2002). When used for testing, no real prototype is actually modelled in the

17
centrifuge and the capabilities of the machine are utilized to produce data from which
parameters can be derived.
The principles of both standard permeability cell technique and centrifuge technique are
described in the following sections.
a) Permeability Cell Technique
The most commonly used test set-up (Figure 2-1) consists of a permeability cell to hold
the sample, a set of inlet controls to admit water at the specified pressure while
measuring the inflow, and a set of outlet controls to allow the discharge from the test
specimen to be monitored along with the outlet pressure. The permeability cell itself is
specifically made to seal the sides of the specimen and allow the permeating liquid,
usually water, to go through the sample without any leakage. The coefficient of
permeability is then calculated from the sample geometry, fluid characteristics, flow rate
and applied pressure using Darcy’s law.
Figure 2-1: A typical permeability cell
b) Centrifuge Technique
The magnitude of the acceleration experienced by the sample in a centrifuge with an
operative centrifuge radius of R, and a rotational speed of is given by:

18
2a = Rcen [2-23]
The increase in the sample acceleration is used to define the centrifuge scale factor N:
cenaN =g
[2-24]
For centrifuge studies involving flow of fluids, it has been established (Goodings 1985;
Mitchell 1991) that an N-fold increase in gravity in a centrifuge model results in an N-
fold increase in velocity of flow through soil over that in the prototype.
When introducing the scale factor, the falling head setup equation [2-22] changes to
0
t
h1 aLK = lnN At h
[2-25]
When analyzing the above two experimental methods it was realized that the centrifuge
technique was the more suitable method for determining the permeability of concrete
considering the short duration of the tests. The permeability of concrete can be measured
within a day using a centrifuge.
Unsaturated Water Movement
Under unsaturated conditions, the water flux occurring through a porous material in
response to a specified potential gradient is strongly dependent on the saturation of that
material. As discussed earlier, capillary pressure-saturation relationships and relative
permeability-saturation curves describe this dependence. Direct measurement of relative
permeability in concrete is still a challenge and a subject of considerable research.
Typically, these relationships are estimated using water retention and saturated hydraulic
conductivity measurements and fitting them to a particular mathematical model (e.g.,
Mualem 1976; van Genuchten 1980). Within numerical models, these relationships can
be represented by specific mathematical functions containing one or more fitted
parameters. The parameters are fitted to the moisture retention data. Therefore, water
retention data needs to be determined first to get those parameters.

19
The equilibrium water saturation inside concrete at a given capillary pressure, Pc,
depends on the process corresponding to either material drainage or imbibition i.e. water
retention in concrete exhibits hysteresis. Models have been developed for describing this
hysteresis (Lenhard and Parker 1987; Parker and Lenhard 1987; Meyer et al. 2004), but
the data on which the parameters of hysteresis can be estimated are often not available.
There are two common methods found in the literature for measuring the moisture
retention relationship for a porous material using controlled-suction techniques. The
experimental methods are described in the following sections:
a) Pressure Membrane Technique
The pressure membrane technique was developed based on the fundamental definition of
matric suction. Matric suction, Pc, is defined as the pressure difference across the air-
water interface, namely (Pa-Pw), where Pa is the pore air pressure and Pw is the pore
water pressure. In a pressure plate extractor, the pore water pressure is maintained as a
constant, usually at zero pressure, while the air pressure is elevated to produce the
desired matric suction (Richards 1941, ASTM D3152-72 1977; ASTM D2325-68 1981).
A porous ceramic disk is used that allows air and water pressure to be applied separately.
The ceramic disk is a high air entry disk that allows water to readily flow through the
ceramic disk, while restricting airflow up to certain pressure. The air pressure required to
cause air to flow through the disk is called the air entry pressure of the high air entry
disk being used.
In the case of a draining sample, the experiment is started with an initially saturated
sample. The saturated sample is sealed inside the pressure vessel and the internal gas
pressure is raised to a predetermined level. The sample is allowed to equilibrate at the
new pressure. Once the sample is at equilibrum, the pressure vessel is opened and the
sample is taken out and weighed to determine its gravimetric water content. It may take
days or weeks for the sample to attain equilibrium water content at any predetermined
value of pressure. The sample is subjected to multiple predetermined pressures and the

20
water content is measured at each step. The wetting data are obtained starting at a high
pressure with an initially dry sample.
The pressure membrane technique is used frequently in soil sciences. However, this
technique can only be used for suction up to 14 MPa (Tang and Cui 2005). The capillary
pressure value of concrete over the full range of saturation is very large in comparison to
that of soil. A sufficiently large gas pressure is needed to overcome the suction forces in
the low saturation range for concrete (Hall and Hoff 2002). Therefore, the pressure
membrane technique can be only used for high saturation levels of concrete, and hence,
is not commonly used for concrete.
b) Vapour Equilibrium Technique
The vapour equilibrium technique is widely used for measuring moisture retention data
of concrete (Savage and Janssen 1997; Baroghel-Bouney et al. 1999; Romero et al.
2001; Homand et al. 2004; Tang and Cui 2005) since the pressure required to remove
water from concrete is much greater than that which could be obtained by most other
techniques (Hall 1989; Hall 1994; Martys 1995). This technique can be used for suctions
ranging from 3 to 1000 MPa (Romero et al. 2001; Tang and Cui 2005). The capillary
pressure of water in a porous material can be determined from measurements of the
vapour phase in equilibrium with the liquid phase in the pores (Rockhold et al. 1993).
When a porous material is placed in an environment of controlled humidity, it either
takes or releases water until its vapour pressure becomes equal to that of its environment.
The water content of the material at equilibrium can then be determined by weighing the
sample. For a given temperature T, the vapour pressure and the total suction, summation
of capillary pressure and osmotic pressure, are connected through Kelvin’s equation:
lncs
RT pPM p
[2-26]
where,
Pc= total suction (MPa)
M= molecular weight of water vapour (0.01802 kg mol-1)

21
R= ideal gas constant (8.3143 × 10⁻³ kg MPa mol-1 K-1)
T = Temperature of the liquid phase in Kelvin (° C + 273.16)
p = water vapour pressure in equilibrium with the liquid phase (Pa)
ps= saturated water vapour pressure at temperature T(Pa)
If the osmotic pressure is negligible, the total suction is equivalent to the capillary
pressure (matric suction) defined in the equation [2-26]. Bailey and Hampsen (1982)
estimated that the osmotic pressure for cement is approximately 0.03MPa. This value
of osmotic pressure is considered to be very small in comparison to the capillary
pressure of concrete. Therefore the total suction in the equation [2-26] can safely be
considered to be equal to the capillary pressure, without any corrections for osmotic
pressure (Rockhold et al. 1993; Savage and Janssen 1997; Baroghel-Bouney et al. 1999)
while calculating water retention parameters.
Saturated salt solutions are normally used in the vapour equilibrium technique. The
advantage of using a saturated solution is that the molar fraction of water in solution
does not change as water vapour exchanges between the liquid phase and the gaseous
phase. The imposed suction, which is related to the molar fraction of water, is therefore
kept constant (Tang and Cui 2005).
The experiment consists of putting samples of concrete into relative humidity (RH)
controlled sealed cells, and subjecting the samples to a step-by-step desorption. Each
step lasts until moisture equilibrium is reached inside the sample. Each relative humidity
atmosphere represents a different constant boundary condition. The capillary pressure
corresponding to the relative humidity boundary condition is calculated using Kelvin’s
equation [2-26]. The attainment of equilibrium is assured by checking the mass
constancy of the samples. Once the sample attains a constant weight over time and there
is no further decrease in the weight of the sample, the corresponding equilibrium weight
of the sample is measured with their natural water contents, mh, just after removing them
from their controlled humidity enclosures. The sample is then oven dried at 105 °C for
24 hours to measure the dry weight, md. The degree of water saturation for the sample is
then determined by using:

22
100h dl
s d
m mSm m
[2-27]
This method is well established and most commonly used for determining moisture
retention curves or water vapour desorption isotherms (meaning “equilibrium mass
water content vs. RH curves) of concrete. In order to obtain such curves, water vapour
sorption experiments are normally carried out at a temperature of 22 ± 1°C on thin
samples. For concrete usually the typical size of the sample is ~20 mm in diameter and
~2 mm in thickness (Hall and Hoff 2002).
2.2 Chloride Transport
Capillary sorption, diffusion and permeation are the three major processes by which
chloride ions can penetrate concrete. In the case of saturated concrete, chloride ions
penetrate concrete under a chloride ions concentration gradient known as diffusion.
Concrete must have a continuous liquid phase for diffusion to occur. Diffusion is usually
the dominant transport mechanism for chloride ions ingress in the case of fully saturated
concrete.
A more common transport mechanism in other porous media and unsaturated concrete is
advection through capillary sorption. When water (possibly containing chlorides)
encounters a dry surface, it is drawn into the pore structure though capillary suction.
Advection through capillary suction is the dominant transport mechanism for chloride
ions in the case of unsaturated concrete.
Another mechanism for chloride ingress is advection through permeation, driven by
moving fluids under pressure gradients. If there is an applied hydraulic head on one face
of the concrete and chlorides are present, they may permeate into the concrete. A
situation where a hydraulic head is maintained is rare for most practical situations,
however.

23
2.2.1 Chloride transport by diffusion
Chloride diffusion results in chloride transport from regions of high chloride ions
concentration to regions of lower ions concentration and occurs as a result of the random
motion of molecules and atoms. Chloride ions move through the pore solution of
concrete due to concentration gradient within the pore solution. Under steady state
conditions, the diffusion of ions in a porous medium is usually described by Fick’s 1st
law of diffusion, according to which the rate of transfer of diffusing chlorides through a
plane perpendicular to the direction of diffusion is proportional to the gradient of the
concentration of free chloride ions, which for one-dimensional flow, is given by:
effCJ Dx
[2-28]
where J is the flux of chlorides due to diffusion in the x-direction (kg/m2.s), Deff is the
effective chloride diffusion coefficient of concrete (m2/s), and C is the concentration of
chlorides dissolved in the pore solution (kg/m3 of pore solution) at depth x. The negative
sign in equation [2-28] indicates that diffusion occurs in the opposite direction to that of
increasing concentration. In practical terms, equation [2-28] is only useful after the
steady-state condition has been reached, i.e. there is no change in concentration with
time.
When the concentration of chloride ions inside concrete changes with time (i.e., transient
condition) the law of mass conservation in an infinitesimal volume of the pore solution
of concrete gives the changes with time of the chloride ions concentration in that unit
volume of concrete, often referred to as Fick’s Second Law:
( )lS C Jt x
[2-29]
The term on the left hand side represents the rate at which chloride ions enter inside the
concrete and the term on the right hand side represents divergence of chloride flux in
pure solution. In a porous medium, the cross-sectional area available for diffusion in the
aqueous phase is reduced by the volume fraction of the void space present inside the
porous medium, known as porosity. The above equation changes to:
24
)()(
xCD
xtCS
effl [2-30]
where is the porosity.
A closed-form solution of equation [2-30] for the initial condition C(x >0, t=0) = 0 (the
initial concentration in the concrete is 0) and boundary condition C(x =0, t >0) = C0 (the
surface concentration is constant at C0) for a semi-infinite medium, can be shown to be
as follows (Crank 1975):
0
( , ) 1 ( )4 eff
C x t xerfC D t
[2-31]
where C(x,t) is the concentration of chlorides at depth x after time t (kg/m3 of pore
solution), C0 is the chloride concentration at the surface (kg/m3 of solution) and erf is the
error function. This solution is only valid when both the diffusion coefficient and the
surface concentration are assumed to be constant in space and time.
Chloride diffusion is a process which can only occur if water is present in the capillary
pores of concrete and provide a continuous path for diffusion. Therefore, in the case of
unsaturated concrete, the diffusion process is hindered since the number of water filled
pores decreases and that decreases the continuity of pore solution (Saetta et al. 1993).
Under unsaturated conditions, the effective diffusion coefficient is no longer a constant
but is a function of saturation as defined below:
eff oD D [2-32]
where Do is the diffusion coefficient in a continuum, e.g., ionic diffusion coefficient in
bulk water, is the porosity and is a pore structure parameter, discussed below.
The diffusion paths in a porous medium are usually constrained by pore structures that
are tortuous, non-uniform in cross-section and constricted or disconnected at certain
points (Atkinson et al., 1984). These considerations of diffusion in the porous medium
are reflected by the parameter . If all the pores were straight, non intersecting tubes, the
factor would be one. Its value, however, will always be less than one, and takes into

25
account all the tortuosity and connectivity of the pore network (Garboczi 1990). It is a
function of the pore structure and degree of saturation (Sl) of the pores (Bachmat et al.
1986; McCarter et al. 2001):
o [2-33]
where, o is a porous medium dependent factor and depends on phase saturation. The
saturation dependence on tortuosity is not well understood at present in the field of
concrete. No method could be found in the literature to evaluate directly under
unsaturated conditions.
The Millington and Quirk (1961) model for variably saturated porous media, has
frequently been used in concrete (Mainguy et al. 2001; Pont and Ehrlacher 2004). The
tortuosity factor in Millington and Quirk model is expressed as:
1/3 10/3lS [2-34]
where, is porosity and Sl degree of saturation of concrete.
2.2.2 Chloride transport by advection
Transport by advection is the transport of chloride ions associated with the movement of
water in which they are dissolved. It is mathematically described as the product of the
moisture flux through concrete and the concentration of dissolved chloride ions. The
advective flux of chloride ions is given as:
'
' .sat
unsat l
J C q
J C q [2-35]
where 'satJ is the advective flux of chloride ions (kg/m2.s) in saturated case, '
unsatJ is the
advective flux of chloride ions (kg/m2.s) in unsaturated case, q is the moisture flux given
by equation [2-3] and ql is the moisture flux given by equation [2-5].
A dimensionless number characterizing the relative strength of advection and diffusion
is the Peclet number, Pe. When Pe is >> 1, advection dominates, and when Pe << 1,
diffusion dominates (Martys 1995). In the majority of practical situations; involving

26
unsaturated transport through concrete, Pe>10 (Puyate and Lawrence, 1998). The high
value of Peclet number suggests dominance of advective flow over diffusive flow in
case of unsaturated transport through concrete.
2.2.3 Experiments
As discussed earlier, characterizing the dependence of the diffusion coefficient on the
degree of water saturation is essential for an accurate determination of moisture flow and
transport of chlorides in unsaturated concrete, in addition to the basic physical properties
of concrete e.g. porosity, density, saturated hydraulic conductivity and moisture
retention function. Up to now, relatively few authors have focused on the effect of
degree of water saturation upon the diffusion coefficient in unsaturated porous materials,
despite the fact that this is an essential component needed to model the transport of ions
in multiphase flow simulators. No direct experimental method could be found in the
concrete literature for determining the dependence of the diffusion coefficient on the
degree of water saturation of concrete.
Direct and indirect techniques have been used to measure diffusion coefficients in
porous media. Fick’s first law is used for evaluating steady state experiments, while
Fick’s second law is used for transient state experiments. The diffusive fluxes through
unsaturated porous materials of low porosity, e.g. gravel, concrete are anticipated to be
many orders of magnitude lower than in pure solution. Due to its lower magnitude, very
long time periods are needed to collect sufficient data from transient experiments.
Moreover, it is very difficult to maintain proper boundary conditions; in addition, the
experimental setup is not easy (Conca and Wright 1990). Therefore, indirect methods
are used to measure diffusion coefficients in unsaturated porous materials of low
porosity. The most widely used indirect method is the measurement of electrical
conductivity or electrical resistivity, which provides reliable estimates of diffusion
coefficients in unsaturated porous materials (Atkinson et al. 1984; Conca and Wright
1990).
27
The Resistivity technique is an indirect method that has been used reliably to estimate
diffusion coefficients in unsaturated porous materials. The electrical resistivity of
concrete shows a strong dependence on the degree of saturation and type of concrete.
Furthermore, the electrical resistivity of a porous material is related to its effective
diffusion coefficient (Atkinson et al. 1984; Garboczi 1990). Also, the experimental
measurement of resistivity of unsaturated concrete can be used to get a relationship
between the diffusion coefficient and the degree of saturation of concrete.
The “salt ponding test” is one direct experimental method which at least in part, depends
on capillary transport, which has frequently been used in the concrete literature.
Unfortunately, even the salt ponding test does not separate capillary effects from pure
diffusion (Martys 1995; Martys and Ferraris 1997) and at the same time it is very
difficult to characterize the result of this test. The experimental data from this test can
not be used in models to predict the long term durability of concrete structure due to its
qualitative nature and can only be used to compare different concrete qualities.
The principles of the two experimental methods are described in the following section:
a) AASHTO T259: Salt Ponding Test
The salt ponding test is a commonly used test for determining the ingress of chlorides
into concrete which, at least in part, depends on capillary transport. Test samples of size
300x300x75 mm are immersed on the top surface with 3% (0.5 M) sodium chloride
solution for a period of 90 days. Prior to the test, the samples are moist cured for 14 days,
then stored in a drying room at 50 percent relative humidity for 28 days before applying
the salt solution. The penetration of chloride ions is then monitored by taking cores and
measuring the amount of acid-soluble chlorides as a function of depth.
Since the concrete samples are dried for four weeks prior to the ponding test, it is likely
that capillary transport is the main driving mechanism for the chloride ion transport, at
least during the early times. But, it is not clear how the ponding test separates capillary
effects from pure diffusion (Martys 1995; Martys and Ferraris 1997). It is very difficult
to characterize the result of this test since two different transport mechanisms may be

28
present in the structure at the same time and the relative importance of each is not
necessarily reflected by this test procedure. The relative amount of chloride ions
penetrated into the concrete by capillary absorption to the amount entering by diffusion
will be greater when the test is only 90 days than when compared to the relative
quantities entering during the lifetime of a structure (Stanish et al. 1997).
b) Resistivity Techniques
Resistivity techniques can be used indirectly to measure the dependence of the diffusion
coefficient on the degree of water saturation of concrete. For cementitious materials, the
diffusion process usually considered is that of the diffusion of ions through water-filled
pores. The effective diffusion coefficient (Deff) and the electrical conductivity ( )of a
porous material can be expressed by the following relationship with the pore structure
parameter (Atkinson et al. 1984; Garboczi 1990):
eff
o o
DD
[2-36]
where Do is the diffusion coefficient in a continuum, is the conductivity (Siemens/m)
of the porous material, when it is regarded as an effective medium, o is the conductivity
in a continuum, e.g., conductivity in bulk water, is the porosity and is a pore
structure parameter.
For a concrete sample, if the conductivity of the pore fluid remains constant over time,
the bulk conductivity of the concrete would be controlled by the level of pore saturation
only. As the level of saturation in the capillary pores changes, there is a change in the
bulk electric properties of concrete which can vary over several orders of magnitude.
Saturated concrete (Sl 100 %) behaves as an electrolyte with a typical resistivity of
about 50 m, which is within the range associated with semiconductors. However, dry
concrete (Sl 0 %) shows a resistivity of around 109 m (Nilsson et al. 1996).
The conductivity of the material is defined as the reciprocal of resistivity, , i.e.
29
1= [2-37]
The electrical resistivity of any material is defined as the resistance, in ohms, between
opposite faces of a unit cube of the material (Whittington et al.1981). Thus, if R is the
resistance in of a block of concrete having a length L (m), and a cross-sectional area,
A (m2), the resistivity, m), is expressed by the formula,
RA=L
[2-38]
Resistivity, being a fundamental property of the material, is independent of the volume
of the specimen, whereas resistance depends upon its shape and size.
Electrical resistivity measurements on concrete can be done by applying either a direct
current (DC) or an alternating current (AC) (Hansson et al. 1983). The use of a DC
voltage results in polarization of the electrolyte and the formation of hydrogen and
oxygen gas at the measuring electrodes (Monofore 1968; Hansson et al. 1983). The
polarized layers in the vicinity of the electrodes produce an effective polarization
potential known as “back emf”. This polarization potential opposes the flow (Monofore
1968) and manifests itself in the form of a reduced current for a given applied voltage, V,
IVVR P [2-39]
where Vp is the polarization potential, I is the current and R is the electrical resistance
across the sample. If it is assumed that this polarization effect is constant at different
applied voltages, this effect can be accounted for by taking current measurements at two
different applied voltages. The polarization potential is given by (Monofore 1968):
21
1221
IIIVIVVP [2-40]
where V1 and V2 are the two applied voltages and I1 and I2 are the corresponding currents.
After analyzing the above two experimental methods, it was decided that the resistivity
technique was the more suitable method for determining the dependence of the diffusion

30
coefficient on saturation of concrete for the following reasons: a) The experimental data
could be used to determine the necessary parameters required in models when predicting
the transport of chlorides in unsaturated concrete, and b) the experimental set-up is easy
and the experiment can be performed in a very short time compared to other experiments.
2.3 Models for Predicting Chlorides Ingress
There are mainly three different approaches to model moisture movement and chloride
ions ingress in unsaturated concrete:
1. Diffusion Models;
2. Advection-Diffusion Models; and
3. Multiphase Multicomponent Models.
2.3.1 Diffusion Models Diffusion models are applicable to concrete structures that are permanently wet.
However, they underestimate the amount of chlorides that may penetrate concrete
structures subjected to wetting and drying cycles, as is the case of structures exposed to
marine environments in the splash and tidal zones or for highway structures exposed to
de-icing salts. Chloride profiles in these structures depend strongly on moisture
distribution in the concrete cover. Diffusion is a very slow process compared to the
advective movement (Peclet number, Pe >10) in unsaturated conditions (Martys 1995,
Puyate and Lawrence, 1998).
A large amount of the work done on service life modelling associated with chloride
induced corrosion has used diffusion as the main transport mechanism of chloride ions
within concrete, under the assumption that the concrete cover is fully saturated. The
effect of capillary sorption on chloride diffusion coefficient has sometimes been
included in these types of models by modifying the boundary conditions and material
properties. However, some researchers (Bazant and Najjar 1972; Saetta et al 1993) have
modelled chloride transport in unsaturated concrete by modifying the effective diffusion
coefficient through the use of a humidity factor.
31
Saetta et al. (1993) introduced an empirical relationship wherein the chloride diffusion
coefficient decreases with a decrease in the concrete pore relative humidity, as follows:
14
4
( )
(1 )( ) 1(1 )
cl eff
c
D D f h
hf hh
[2-41]
where h is the concrete pore relative humidity and hc is the humidity at which Deff drops
halfway between its maximum and minimum values, taken to be 0.75 from the work
done by Bazant and Najjar (1971) on drying of concrete.
2.3.2 Advection-Diffusion Models
The advection–diffusion equation is a partial differential equation, which describes
physical phenomena where chloride is transferred inside concrete due to two processes:
advection and diffusion. The total mass flux can be written as a sum of an advective flux
and a diffusive flux. The equation can be derived from the continuity equation, which
states that the rate of change of a scalar quantity in a differential control volume is given
by flow and diffusion into and out of that part of the system along with any generation or
consumption inside the control volume.
Saturated conditions
In its simplest form under saturated condition (when the diffusion coefficient and the
advection velocity are constant and there are no sources or sinks) the equation takes the
form:
2
2effC C CD qt x x
[2-42]
The two terms on the right hand side represent different physical processes: the first
term represents the diffusion flux while the second describes advective flux. The
advective flux is caused by the bulk movement of the fluid and the diffusive flux is
attributed to the gradient in the solute concentration. Under full saturation, all of the
pores are available to transmit a fluid. The advection-diffusion equation expressed in
Cartesian coordinates is

32
2 2 2
2 2 2( ) ( )eff x y zC C C C C C CD q q qt x y z x y z
[2-43]
where qx, qy and qz are the velocity components in the x, y, and z directions, respectively.
Unsaturated conditions
Unlike the saturated condition, all of the pores are not available to transmit a fluid in the
unsaturated condition. In an unsaturated porous medium, the cross sectional area
available for flow not only depends on the porosity of the material but also on the
saturation of the liquid phase. Therefore, the cross section available for flow is only a
fraction of the porosity. The advective-diffusion equation for unsaturated condition
takes the form:
)()( CqxCD
xtCS
leffl [2-44]
where ql is the moisture flux given by equation [2-5].
2.3.3 Multiphase Multicomponent Models
The chloride mass balance equation for multiphase multicomponent models can be
written similar to equation [2-44], with ql given by equation [2-16].
As with flow, boundary conditions must be defined to represent solute transport through
a boundary value problem. The problem can then be solved to find the distribution of
solute mass throughout a domain either numerically or analytically. In order to solve the
advection–diffusion equation or multiphase multicomponent models, transport boundary
conditions must be defined for the entire boundary of a domain. However, the values
and types of boundary conditions may change with time. Often, the most challenging
aspect of analyzing flow is the definition of boundary conditions that represent the
physical flow system. In some cases, it is not possible to define boundary conditions
33
based on physical features. In these cases, boundary conditions must be chosen based
on an understanding of the effects of such choices on the flow regime being represented.
There are two primary types of boundary conditions that are used to analyze water flow
and the transport of chlorides. The first type defines the value of the primary variables,
such as pressure, temperature, etc. along the boundary and is known as a Dirichlet
boundary condition. The second type of boundary condition defines the gradient of the
primary variables and is known as a Neumann boundary conditions. The flux can be
defined based on the hydraulic conductivity and the hydraulic head gradient using
Darcy’s equation or Richard’s equation. If the boundary condition is defined based on
the water flux, then the hydraulic conductivity of the medium must be defined at the
boundaries to determine the gradient.
One of the below two conditions can be applied to define the transport of solutes across
a boundary.
1. The concentration can be defined at the boundary as a function of time, forming a
type one, or Dirichlet type boundary condition. The boundary condition is of the
form:
( )C C t [2-45]
2. The derivative of the concentration perpendicular to the boundary can be defined as
a function of time, controlling the diffusive mass fluxes across the boundary. This
forms a type two, or Neumann, boundary condition of the form:
( )C C t
x x [2-46]
2.4 Literature Survey Summary
In the case of unsaturated concrete, water flux and, subsequently, the transport of
dissolved chloride ions in response to a specified potential gradient are strongly
34
dependent on the saturation of concrete. Darcy’s Law, which has been applied to single
phase flow in porous media, can be generalized for unsaturated flow or multiphase flow,
with permeability replaced by phase permeability. There has been very little work
reported in the literature related to moisture flow and transport of chlorides under
unsaturated concrete. Presently, there are no standard test methods for measuring key
transport properties of concrete, such as permeability and capillary- driven moisture
transfer. However, some test methods developed and used by other disciplines like soil
sciences, rock sciences and petroleum sciences should be equally applicable to concrete.
The equilibrium state of water in an unsaturated porous material is characterized by its
capillary pressure-degree of saturation function (also known as moisture retention
function). There has been very little effort to establish relationships for the capillary
pressure as a function of degree of saturation for concrete. In addition to the capillary
pressure-saturation function, the relative permeability-saturation function is also
necessary for modelling moisture transport in concrete. The direct measurement of
relative permeability in concrete is still a challenge and subject of considerable research.
Typically, these functions are estimated using water retention and saturated hydraulic
conductivity measurements together with the choice of a suitable mathematical model
(e.g., Mualem 1976; van Genuchten 1980). Therefore, determination of the moisture
retention functions is necessary for the modelling of moisture flow and transport of
chlorides in unsaturated concrete. There are two common methods found in the literature
for measuring moisture retention data of a porous material in the high capillary pressure
range using controlled-suction techniques: the pressure membrane technique and the
vapour equilibrium technique. The vapour equilibrium technique is widely used for
measuring moisture retention data of concrete and will be used in this research.
In unsaturated concrete, the effective diffusion coefficient is no longer a constant but a
function of saturation (Bazant and Najjar 1972; Garboczi 1990; Saetta et al. 1993;
McCarter, et al. 2001) and, therefore, can not be described by simple diffusion theories
that are typically used in the present literature on concrete. Dependence of the diffusion
coefficient on the degree of saturation is essential for determining the moisture flow and

35
transport of chlorides in unsaturated concrete, in addition to the basic physical properties
of concrete e.g. porosity, density, saturated hydraulic conductivity and moisture
retention function. Up to now, relatively few authors have focused on the effect of water
saturation upon the diffusion coefficient in unsaturated porous materials, despite the fact
that this is an essential component needed when modelling the transport of ions under
variably saturated conditions. Direct and indirect techniques have been used for
measuring diffusion coefficients in porous media. However, due to some practical
complexity, such as maintaining proper boundary conditions and the difficulty in
experimental setup involved with direct techniques, indirect methods are used to
measure diffusion coefficients in unsaturated porous materials of low porosity. The most
widely used indirect method is the measurement of electrical conductivity or electrical
resistivity, which provides reliable estimates of diffusion coefficients in unsaturated
porous materials (Atkinson et al. 1984; Conca and Wright 1990).
Diffusion models are applicable to concrete structures that are permanently wet.
However, they underestimate the amount of chlorides penetrating the concrete structures
operated under unsaturated condition. Unsaturated flow models and associated solute
transport models are widely used for the study of flow and transport processes in porous
media under unsaturated conditions and should be applicable to concrete for modelling
moisture flow and transport of chlorides under unsaturated conditions.
36
3 Materials and Methods
Three different experiments were conducted to determine the parameters necessary for
modeling moisture flow and the transport of chlorides in unsaturated concrete. Concrete
mixes with three different water-cement ratios were used. A centrifuge test was
performed to determine the saturated hydraulic conductivity of the concrete. The vapour
equilibrium technique was used for determining the moisture retention characteristic of
the concrete. A resistivity technique was performed to determine the dependence of the
diffusion coefficient on the degree of water saturation.
3.1 Materials and concrete mixtures Normal Portland cement (CSA A5 Type 10) was used as the cementitious material. Type
10 Normal Portland cement is a general-purpose cement, suitable for all uses where the
special properties of other cement types are not required. The chemical composition and
mineral composition of Type-10 cement are given in Table 3-1 and Table 3-2.
Table 3-1: Chemical composition of Portland cement (CSA A5 Type 10)
Chemical composition (%)
SiO2 20.70
Al2O3 3.68
CaO 63.00
Fe2O3 2.95
MgO 4.21
Na2O 0.14
K2O 0.59
SO3 2.62
Free CaO 1.02
Loss on ignition 2.70
37
Table 3-2: Mineral composition of type-10 Portland cement (Canadian Portland Cement
Association)
Mineral Composition (%)
C3S 50
C2S 24
C3A 11
C4AF 8
The raw materials used for the concrete mixes are shown in Table 3-3.
Table 3-3: Raw materials
Material Type/ Source Comments
Cement Lafarge CSA A5 Type 10
Coarse Aggregate (5/14
mm)
Lafarge, washed gravel CSA A23.2-12A
Absorption
Fine Aggregate Pit run, Coarse sand CSA A23.2-6A Absorption
Water Tap water
Superplasticizer Master Builders, DARCEM-
19
ASTM C-494 Type A & F
Air Entrainer Master Builders-AE 90 ASTM C-260
Three concrete mix proportions, representing a range of water to cement (w/c) ratios,
were used for this study. For easy identification, all samples were labelled according to
their w/c ratio. All samples from mix-1(w/c ratio=0.4) were designated as A, and
similarly from mix- 2 (w/c ratio=0.5) and 3 (w/c ratio=0.6) were designated as B and C,
respectively. The mix designs are shown in Table 3-4.
A few days prior to mixing, the coarse aggregates were washed with water to remove
dust or other coatings from the surface of the aggregates. The wet coarse aggregate was
then immersed in water at room temperature for a period of 24 hours. The aggregate was
removed from the water and allowed to partially air dry for about 15 minutes, on an

38
inclined metal pan to remove the excess surface water. After that, the surface moisture
was wiped off using a large absorbent cloth.
Table 3-4: Mix designs
W/C 0.4 0.5 0.6
Portland Cement (kg/m3) 446 357 298
Coarse Aggregate (kg/m3) 900 900 900
Fine Aggregate (kg/m3) 670 750 800
Water (kg/m3) 178 178 178
Superplasticizer
(% by weight of cement)
1.0 0.5 0.0
Air Entrainer
(% by weight of cement)
0.35 0.35 0.35
A power-driven upright mortar mixer was used for the mixes. The superplasticizer was
pre-blended with the mix water. The coarse aggregate was placed first in the mixer and
some of the mixing water was added to it. The mixer was started and then the fine
aggregate, cement, and water were added with the mixer running. Once all the
ingredients were in the mixer, the concrete was mixed for 3 minutes, followed by a 3
minutes rest, followed by 2 minutes of final mixing. An air entrainer was evenly added
during the 2 minutes of final mixing. To eliminate segregation, the machine-mixed
concrete was placed on a damp mixing pan and remixed by shovel until it appeared to be
uniform. At the end of the mixing, the slump and air content of the mix were measured
in accordance with CSA standard A23.2-5C and A23.2-7C, respectively. The concrete
mixes were then introduced and vibrated in cylindrical moulds ( 75x150 mm). All the
cylindrical moulds were placed under water-soaked burlap and a plastic sheet in the
concrete lab for initial curing. After 24 hours, the concrete cylinders were demolded,
labelled and submerged in a saturated lime water tank at room temperature for 27 more
days. Keeping the samples in saturated lime water prevented lime from leaching out of
the concrete. Saturated lime water can be obtained by dissolving 1.5 g of Ca(OH)2 in one

39
litre of tap water. To prevent carbonation, concrete samples were stored in lime water
until testing.
The properties of the fresh concrete used in the present study are shown in Table 3-5.
Table 3-5: Properties of fresh concrete
W/C 0.4 0.5 0.6
Slump (mm) 59 58 61
Air Content (%) 6.4 6.6 7.8
Density (kg/m3) 2420 2390 2340
The compressive strength was measured at 28 days. Three 75 mm diameter150 mm long
cylinders from each concrete mix were tested for compression by loading the saturated
specimens. The cylinders were capped with sulphur shortly before they were tested to
avoid any stress concentration, as shown in Fig. 3-1. The sulphur was applied in a
molten state and allowed to harden with the specimen in a jig which ensured a plane and
square ended surface. The diameter of the cylinders was measured at five different
places and the average diameter was used to calculate the average area of the cylinder.
The ultimate failure load and average area were used to determine the compressive
strength of the concrete cylinders.
Porosity of the concrete samples was measured in accordance with ASTM C 642-97.
Table 3-6 shows the porosity and compressive strength values of three concrete mixes.
Both the porosity and compressive strength values given in Table 3-6 are the average of
three concrete samples from similar mixes at 28 days.
Table 3-6: Properties of concrete at 28 days
W/C 0.4 0.5 0.6
Porosity (%) 11.56 12.19 13.10
Compressive Strength (MPa) 41.75 37.63 31.76
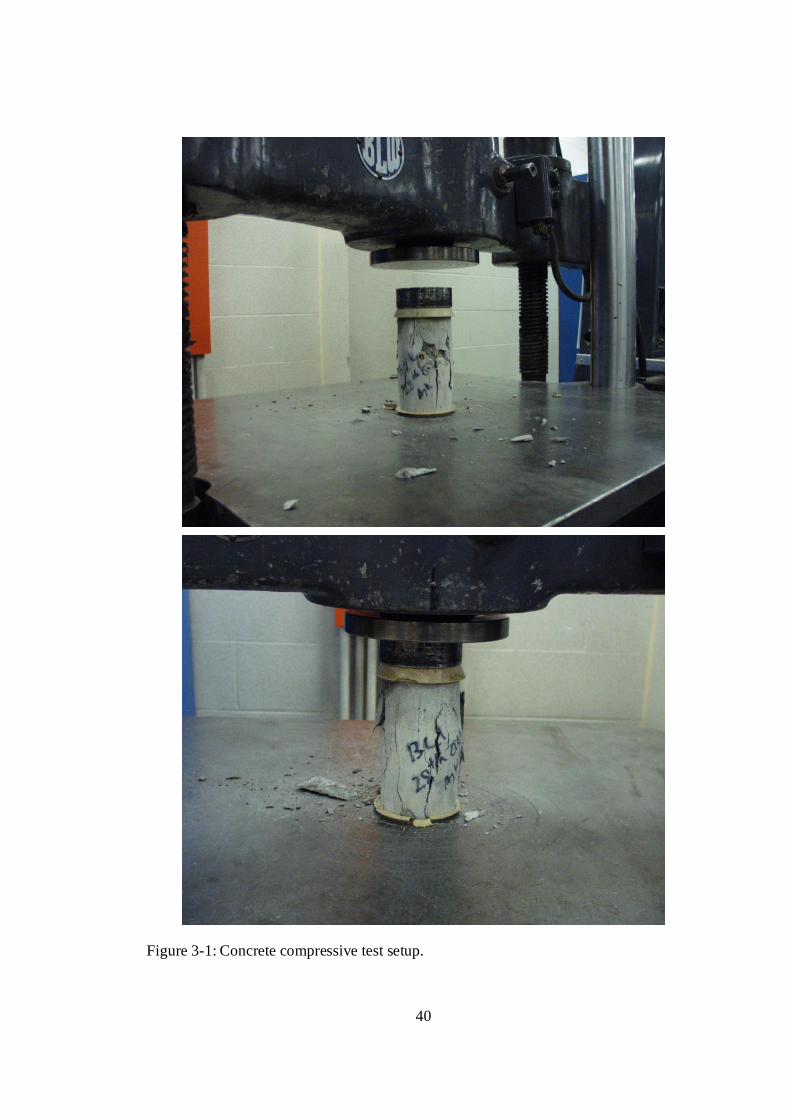
40
Figure 3-1: Concrete compressive test setup.

41
3.2 Centrifuge Technique
The centrifugation technique was used to determine the saturated hydraulic conductivity
of the concrete samples. Centrifugation provided a very large driving force which
reduced the experimental time significantly. The other advantage of using a centrifuge is
that the centripetal force exerted by a centrifuge is a body force similar to gravity and
acts simultaneously over the entire system and independently of other driving forces
such as gravity (Conca and Wright 1990). The schematic representation of a concrete
sample in the centrifuge is shown in Figure 3-2
Figure 3-2: Schematic representation of a concrete sample in a centrifuge.
3.2.1 Equipments and Materials
Details of the geotechnical centrifuge used for this study are presented in Table 3-7.
Table 3-7: Details of the centrifuge
Type Swinging buckets on both sides of the arm
Model J6-HC Centrifuge- Beckman Coulter
Rotor JS-4.2 swinging bucket
Operative arm radius 190 mm
Maximum radius 254 mm
Centrifugation angular velocity 800-900 rpm
Maximum angular velocity 4200 rpm
Direction of Rotation
R= 20.0 cm
R0=25.4 cm
Sample
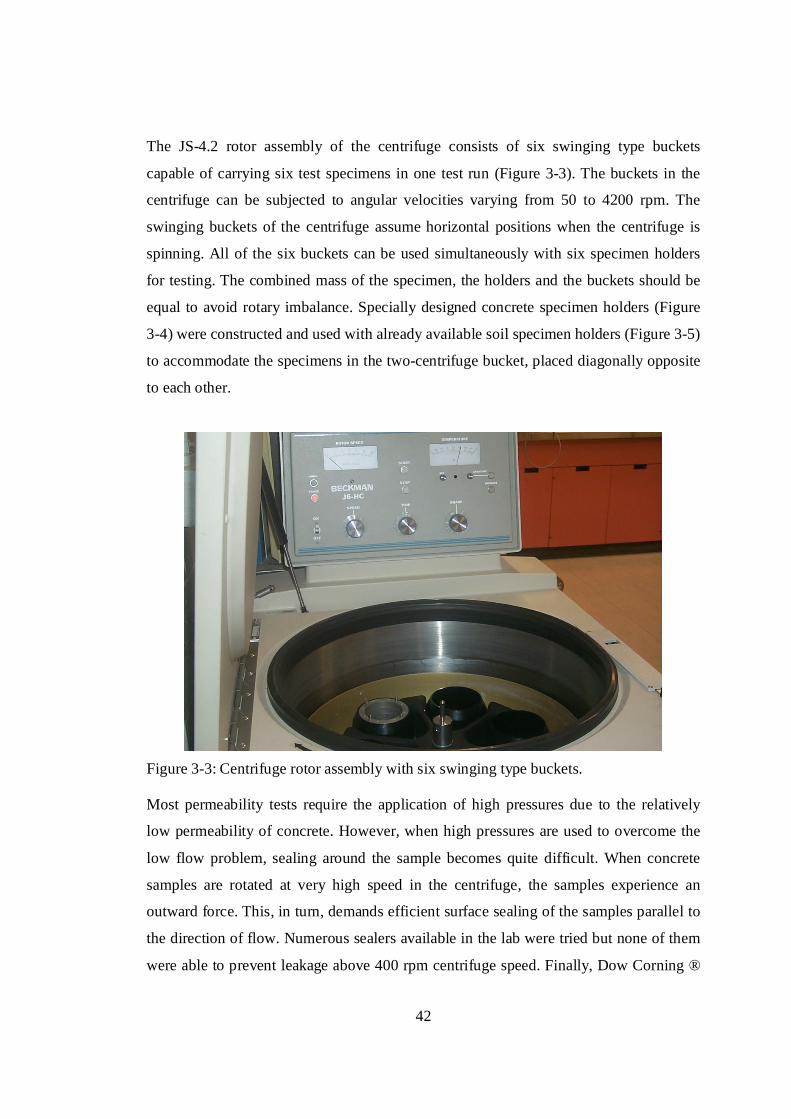
42
The JS-4.2 rotor assembly of the centrifuge consists of six swinging type buckets
capable of carrying six test specimens in one test run (Figure 3-3). The buckets in the
centrifuge can be subjected to angular velocities varying from 50 to 4200 rpm. The
swinging buckets of the centrifuge assume horizontal positions when the centrifuge is
spinning. All of the six buckets can be used simultaneously with six specimen holders
for testing. The combined mass of the specimen, the holders and the buckets should be
equal to avoid rotary imbalance. Specially designed concrete specimen holders (Figure
3-4) were constructed and used with already available soil specimen holders (Figure 3-5)
to accommodate the specimens in the two-centrifuge bucket, placed diagonally opposite
to each other.
Figure 3-3: Centrifuge rotor assembly with six swinging type buckets.
Most permeability tests require the application of high pressures due to the relatively
low permeability of concrete. However, when high pressures are used to overcome the
low flow problem, sealing around the sample becomes quite difficult. When concrete
samples are rotated at very high speed in the centrifuge, the samples experience an
outward force. This, in turn, demands efficient surface sealing of the samples parallel to
the direction of flow. Numerous sealers available in the lab were tried but none of them
were able to prevent leakage above 400 rpm centrifuge speed. Finally, Dow Corning ®

43
888 silicon joint concrete sealant was tried and used. It is a ready-to-use one-component
silicon rubber which meets the requirements of ASTM D5893 Type NS. To verify that
there was no leakage through the sealant, an acrylic disc was used in the sample holder
in the place of the concrete sample. Tests were run three times, each lasting for an hour,
with the acrylic disc. The disc was centrifuged up to an angular velocity of 1200 rpm in
all the three test runs. The water level in the water tube of sample holder remained
constant during each of the three tests, which confirmed that there was no leakage of
water through the sealant when the angular velocity of centrifuge was less than 1200
rpm. Even though there was no leakage up to 1200 rpm, it was decided that the entire
test would be performed below an angular velocity of 1000 rpm even though the
maximum angular velocity of the centrifuge is 4200 rpm.
Sample Holder
Two acrylic concrete sample holders, which can hold 13 mm thick concrete samples,
were specially designed to apply the principle of the falling head permeability method
using a centrifuge. Figure 3-4 shows a typical acrylic concrete sample holder used in this
study. The concrete sample holders were designed such that they could be used easily
with already available aluminum soil holders. The inner diameter of the water tube of
concrete holder was kept small so that even low flow rates of water through the sample
could be accurately measured. In addition to the silicon sealant, a rubber O-ring was
used to keep the sample in position and also to prevent water leakage along the sides of
the sample. The sealant was used over the full depth of the concrete specimen. A gap of
1-2 mm was always maintained between the concrete sample and water tube of the
sample holder to make sure that the water was in contact with the full surface area of the
concrete sample during the test, as shown in Figure 3-4.
Sample preparation
Samples of diameter 50 mm were cored from concrete cast as 75 mm diameter150 mm
long cylinders. The mix designs used are shown in Table 3-4. All the samples were cast
as explained in Section 3.1. After 45 days of curing, 12.5 mm thick disks were cut from
the

44
Figure 3-4: Concrete sample holder
Figure 3-5: Soil sample holder (a) Details of the aluminum soil holder (Khanzode, 2002) and (b) concrete sample holder used with aluminum soil holder.
Concrete sealant
Specimen holder
75 mm50 mm
19 mm
75 mm
14 mm
10 mm
Rubber 0-ringspecimen
75 mm50 mm
19 mm
75 mm
14 mm
10 mm
Rubber 0-ring
75 mm50 mm
19 mm
75 mm
14 mm
10 mm
75 mm50 mm
19 mm
75 mm
14 mm
10 mm
75 mm50 mm
19 mm
75 mm
14 mm
10 mm
75 mm50 mm
19 mm
75 mm
14 mm
75 mm50 mm
19 mm
75 mm
14 mm
75 mm50 mm
19 mm
75 mm
14 mm
10 mm
Rubber 0-ringspecimen
sealant

45
cored samples using a diamond saw with water as a coolant. Cooling with water
minimizes the risk of drying the specimen during sawing.
3.2.2 Testing Method At the start of each test, the circumferences of each concrete sample, as well as the
inside of the sample holder, were coated with the sealant before inserting the sample into
the sample holder. The sealant was allowed to cure overnight. After that, the concrete
sample holder, with the sample sealed inside was placed inside the aluminium soil
sample holder, as shown in Fig. 3-5 (b). The water tube of the concrete holder was filled
with water and the top of the water tube was covered with an aluminium foil to prevent
any moisture loss by evaporation. When the sample tube was filled with water, it was
ensured that all the air bubbles between the concrete sample and the tube were
eliminated. The initial height of the water in the tube was also noted. The weight of the
concrete sample holder with the concrete specimen sealed and the water tube filled was
determined at the start of each experiment. All experiments were conducted at
23 ± 0.5°C by setting the temperature of the centrifuge at 23°C. Both aluminium soil
holders were then placed in the centrifuge bucket.
The pairs of samples were centrifuged at speeds ranging from 800-900 rpm for nearly
25-30 hours until a sufficient number of data points were collected. Samples from
concrete mixes with w/c ratios of 0.5 and 0.6 were centrifuged at 800 rpm while samples
from the concrete mix with w/c ratio of 0.4 were centrifuged at 900 rpm. The higher
angular velocity of centrifugation for a w/c ratio of 0.4 was chosen to keep the
experimental time short since, depending upon the porosity and water contents, different
periods of time are required for hydraulic equilibrium. To make sure that the sample was
fully saturated during the test, not only the initial and final water level in the water tube
was measured, but also the initial and final weight of sample holder with concrete
specimen and water was measured after every centrifuge run. Only those values where
the loss of water in the water tube was equal to the difference in weight of the sample
holder set up were considered for the results. Water coming out of the concrete samples
was collected in the reservoir cup of the sample holder. In some cases, when there were

46
invisible minor cracks in the sample or when the samples were not properly sealed, the
water tube emptied within an hour of centrifugation. Cracked samples were discarded
and poorly sealed samples were resealed. Due to the very low saturated hydraulic
conductivity of concrete, it is reasonable to assume that even a slow leak could make a
significant difference in the measured saturated hydraulic conductivity of concrete.
Keeping this fact in mind, the cross sectional area of the water tube of concrete sample
holder was designed to be very small to make sure that even a small water leak should
make a significant difference in the conductivity calculation and get noticed easily. None
of the samples, except the samples already discarded or resealed, showed any indication
of even a slow water leak.
For every pair of samples, during its 25-30 hours of experimental time period, the
centrifuge was stopped nearly five to six times to get a number of data sets. Each data
set consisted of initial and final level of water in the water tube, centrifugation time, and
initial and final weight of concrete sample holder set up. The diameter-length of the
samples was measured at three locations by means of dial gauge and the average value
was used for calculations.
Once the hydraulic conductivity measurements were taken on a pair of samples, the
samples had to be taken out of the concrete sample holder without damaging either. This
was done safely by centrifuging the concrete sample inside the sample holder at an
angular velocity higher than 1500 rpm. The concrete seal broke at that speed and
concrete samples came out easily without any damage.

47
3.3 Vapour Equilibrium Technique
The basic tools for a good understanding, quantification and prediction of moisture
movement in concrete are provided through water vapour desorption and adsorption
isotherms. In order to obtain such curves, a vapour equilibrium technique was used. The
experiments were carried out on three different concrete mixes at a constant temperature
at 22±0.5°C. The vapour equilibrium technique was used so that suction pressures
ranging from 3 to 1000 MPa could be created, using salt or acid solutions. The principle
of this technique was discussed in section 2.1.3.
3.3.1 Equipments and Materials The three different concrete mixes used for sample preparations are shown in Table 3-4.
Concrete cylinders 75 mm in diameter and 150 mm in length were cast from concrete
mixes, as explained in section 3.1, and cured for 45 days in saturated lime water. The
cylinders were cured for 45 days to minimize the water loss due to the cement hydration
process during the long duration of the experiments. The water loss due to the cement
hydration process can therefore be assumed to be negligible during the experiments.
After 45 days, the cylinders were taken out of the lime bath and 50 mm diameter
concrete cylinders were cored from them. This was done to avoid any possible skin
effect during the experiments. The samples, 12 mm in thickness and 50 mm in diameter,
were then wet-sawed from the cored concrete cylinders. The 12 mm thick discs were
used to obtain moisture equilibrium reasonably quickly.
Twelve different desorption environments, ranging from RH = 8.2 to 97.3 %, were
imposed on concrete samples by using twelve different salts for this study. The
desorption environments were created by means of saturated salt solutions, kept in
closed containers at normal room temperature (22±0.5°C), as shown in Figure 3-6.
Table 3-8 shows the saturated salt solutions used and the corresponding equilibrium
relative humidity environment (European Standard 1996; Waxler 1954) when pure salt
and distilled water is used.

48
The relative humidity created by a saturated salt solution depends upon the quality of
salt and water used. The function of a saturated salt solution is to create a specific
humidity condition by giving off or absorbing moisture from the vapour space above it.
Any porous material present in the environment will absorb or give off moisture and
may cause a shift in the equilibrium relative humidity condition (Labuza 1963).
a)
b)
Figure 3-6: (a) Relative humidity environment created inside the lab, and (b) Relative humidity and Temperature measurement using Humidity probe.

49
Therefore, a relative humidity probe with an accuracy of ± 1% previously calibrated
with saturated salt solution over the range 10%-100% was used to measure the actual
RH inside the humidity boxes. The salt solutions were prepared as per European
Standard (ISO/DIS 1257 1996).
Table 3-8: Relative humidity and total suction (MPa) values of different salts used
Symbol Salt RH Total Suction(MPa)
1 Potassium Sulphate 97.3 3.7
2 Potassium Nitrate 93.5 9.2
3 Potassium Chloride 84.3 23.3
4 Ammonium Chloride 78.5 33.0
5 Sodium Chloride 75.3 38.6
6 Potassium Iodide 68.9 50.8
7 Sodium Bromide 57.6 75.2
8 Potassium Carbonate 43.2 114.4
9 Magnesium Chloride 32.9 151.9
10 Potassium Acetate 22.5 203.3
11 Lithium Chloride 11.3 297.1
12 Sodium Hydroxide 8.2 340.8
3.3.2 Testing Method At the start of the experiment, saturated salt solutions were prepared from twelve
different salts as mentioned in the Table 3-8. The salt solutions were prepared in the
environmental laboratory under the guidance of an experienced technician due to the
high corrosiveness of some of the salts. It was ensured that there were always some
excess solid salts in the saturated solution. In total, 36 wide mouth acrylic square bottles
were used as humidity chambers. The square bottles contained the saturated salt
solutions. In order to avoid any misplacement of samples, all the bottles were labelled.
The first part of the label represented the type of concrete mix and the second part
represented the type of salt solution, as shown in Figure 3-6. In order to obtain values

50
representative of the concrete material, it was decided that three samples would be used
for each relative humidity boundary condition from each of the concrete mixes. Four
holes were made in the cap of each bottle; three for suspending the samples and the forth
for inserting a relative humidity probe inside the bottle for measuring the actual RH
during the experiment. It was found during the set up that suspending the samples
separately was not convenient. Therefore, it was decided that the samples would be
suspended together. Now, since only two out of the four holes in the cap were necessary
during the experiments; one for suspending the three tied samples and other for inserting
the humidity probe; the other two holes were sealed using rubber stoppers.
Concrete samples were taken out of the lime bath and the excess surface moisture was
dried by wiping the samples with tissue paper. The weight of the samples, initial
saturated surface dry (SSD) weight, ms, were recorded and samples were temporarily
submerged in lime baths. The mass of all the samples was measured to the nearest 0.001
gm. Three samples from each mix type were taken and tied together using copper wire
for each humidity boxes. Copper was used for wire material simply to avoid rusting due
to water condensation at its surface, inside the humidity boxes. In addition, the samples
were separated from each other using O-rings having diameter much less than that of the
exposed surface area of samples. The use of O-rings kept the side faces of the samples
apart and at the same time provided a sufficient gap between the samples for air
circulation. The tied samples were then suspended, for desorption, inside the humidity
boxes using copper wire and rubber stoppers. Figure 3-7 shows the way the samples
were tied together and suspended inside the humidity boxes. It was ensured that
suspended samples were not in contact with the salt solution directly.
The water content of the samples was monitored by weighing the suspended samples,
copper wire and rubber stopper together every 3 days until the weight became stable.
The weighing was necessary to know the attainment of equilibrium during the
desorption process. Relative humidity and temperature inside the boxes were also
measured before taking the samples out for weighing each time. Weighing of the tied
samples was done within 15 s of samples being taken out of the boxes. This procedure

51
was quick enough that any water evaporation during the weighing process could be
neglected.
Figure 3-7: Concrete samples used to determine moisture retention function.
Equilibrium was assumed to be reached when the mass loss did not exceed 0.001 gm
over a week period. Although the samples in higher relative humidity environments
reached equilibrium within two weeks, the samples were kept inside the relative
humidity boxes for 28 days. Upon reaching the equilibrium, the samples were taken out
of the chamber and the equilibrium weight of the samples, mh, was measured. The
samples were then oven dried at 105 °C for 24 h in order to measure their dry weight, md.
The degree of water saturation of the samples was then determined using equation [2-13].

52
3.4 Resistivity Test The resistivity technique using DC voltage was used to characterize the effect of the
degree of saturation on the effective diffusion coefficient. In unsaturated porous
materials, the diffusion coefficients of ions depend on the degree of water saturation, as
discussed in Section 2.2.3. The effect of degree of water saturation on the diffusion
coefficient is an essential parameter needed for modelling the transport of ions under
unsaturated conditions. The most widely used indirect method is the measurement of
electrical conductivity, which provides reliable estimates of diffusion coefficients
(Atkinson et al. 1984; Garboczi 1990; Conca and Wright 1990).
3.4.1 Equipments and Materials The three different concrete mixes used for sample preparations are shown in Table 3-4.
Concrete cylinders 75 mm in diameter and 150 mm in length were cast from concrete
mixes as explained in Section 3.1 and cured for 60 days in saturated lime water before
testing. The 60 days of curing period was selected considering that most of the cement
hydration ceases by this time. After 60 days, concrete samples, 25 mm in height and 75
mm in diameter, were cut from the concrete cylinders.
In order to obtain values representative of concrete material, three samples were tested
from each concrete mix. To measure the resistivity with accuracy, it is essential that the
current traverses the full area of the samples, and this was ensured by using external
brass plate electrodes (diameter 75 mm) of the same shape as the surface of the samples.
The surface of the brass plates was made smooth by machine filing. The external brass
plate electrodes were placed at opposite faces of the specimens as shown in the Figure
3-8. A G-clamp was used to secure the electrodes to the specimens. A cement paste of
water-cement ratio 0.5 was used to ensure intimate contact between the electrodes and
concrete specimens. Using cement paste makes the resistivity measurement of concrete
specimens more accurate without affecting the resistance being measured since the paste
has a very low resistivity (2 m) in comparison to the concrete resistivity (Whittington
et al. 1981). The brass plate and cement paste combination ensured a uniform

53
distribution of current across the surface of the specimen. Before testing, the samples
were surface-dried by wiping off any moisture present on the surface with a towel, to
ensure that there were no surface conduction effects and that the resistance measured
was the volume resistance. Direct current was used for determining the electrical
resistivity of concrete samples. The electrical resistance of the samples was measured
using a commercially available ohm-meter.
A
V
brass plate electrode
specimenwooden backing
A
V
A
V
A
V
A
V
A
V
A
V
brass plate electrodebrass plate electrode
specimenspecimenwooden backingwooden backing
Figure 3-8: Schematic diagram of resistivity measurement.
3.4.2 Testing Method Initially saturated, surface dry (SSD), weights, ms, of the samples were measured and
samples were temporarily submerged in lime baths. All samples were weighed to the
nearest 0.001 gm. Samples were then placed in an oven and dried at 50 °C for different
periods of times, ranging from 0.5 h to 48 h, to create different degrees of saturation
inside the samples. The samples were then removed from the oven and covered with
cellophane and aluminium paper before placing them in watertight bags. The samples
were kept in the bag for the time equal to its drying time in the oven. That was done to
make sure that the samples had a uniform saturation throughout the depth (Carcasses et

54
al. 2002). It can be assumed that a good saturation state uniformity had been achieved,
accounting for the slow drying process, due to step-by-step drying, the relatively small
specimen thickness and the lack of mass loss during the water redistribution period.
The samples were taken out of the bag and weighed (mh) just before measuring the
resistance. Each electrical resistivity measurement took about 3-4 minutes and that was
the only time when samples came in contact with the environment. The measurement
time was so short that it can be safely assumed that the saturation of the samples
remained essentially the same during testing. At the end of the experiment, all samples
were oven dried at 105 °C for 24 hours in order to measure their dry weight, md. The
degree of water saturation of the samples was then determined using equation [2-27].
Two different voltages, 5.0 V and 2.5 V, were applied on each sample and the current, I,
corresponding to each voltage was measured. The currents were allowed to decay to a
steady state value before measuring. The decay time was in the order of a few minutes.
The polarization potential was calculated for each set of measurements using equation
[2-40]. Once the polarization potential was known, the resistance was obtained using
equation [2-39]. The use of higher voltage levels was avoided since higher voltage
produces heat during measurement that could change the saturation of the specimens. It
is noted that the voltage levels (5.0 V and 2.5 V) were all above the level of polarization
potential drop, which is typically ~ 1.5 V. The electrical resistivity of the specimens was
calculated using equation [2-38].
3.5 Summary Three different experiments were performed for determining the saturated hydraulic
conductivity, moisture retention function and saturation dependence of the effective
diffusion coefficient of concrete. The experiments were carried out on samples prepared
from three different concrete mixes; w/c ratio 0.4, 0.5 and 0.6. The physical properties of
the concrete mixes were determined experimentally.

55
A centrifugation technique was used to determine the saturated hydraulic conductivity of
the three concrete mixes. A geotechnical centrifuge was used for centrifugation. The
experiment was carried out on twelve concrete samples; four from each concrete mix.
Using this technique the saturated hydraulic conductivity measurements were made
reasonably quickly.
A vapour equilibrium technique was used for determining moisture retention function of
concrete. The experiments were carried out on three different concrete mixes at the
constant temperature of 22 ± 0.5°C. Twelve different desorption environments were
imposed on concrete specimens by using twelve different saturated salt solutions kept in
closed containers. The degree of water saturation of the samples was determined at the
end of the experiment.
The resistivity technique was used to characterize the effect of the degree of saturation
on the effective diffusion coefficient. DC voltage was used for determining the electrical
resistivity of concrete. Three samples were tested from each concrete mix. Two different
voltages, 5.0 V and 2.5 V, were applied on each sample at different degrees of water
saturation. The degree of water saturation of the samples and currents corresponding to
each voltage were measured during the experiment.

56
4 Results and Discussion
4.1 Centrifuge Technique
Saturated hydraulic conductivity was obtained using a centrifuge technique. Twelve
concrete samples were used to determine the saturated hydraulic conductivity for three
different concrete mixes.
4.1.1 Measurement of Saturated Hydraulic Conductivity Tests were conducted on 12 concrete samples, 4 samples from each concrete mix. The
primary data consisted of the initial and final level of water in the water tube,
centrifugation time, centrifugation angular velocity, cross sectional area of concrete
sample, cross sectional area of the water tube of concrete sample holder and the length
of the sample parallel to the direction of flow. Knowing all the parameters, the values of
saturated hydraulic conductivities were obtained using equations [2-23], [2-24] and [2-
25]. The results of all the centrifugal analysis are given in Table 4-1.
The largest coefficient of variation of measured saturated hydraulic conductivity is
11.1%, which indicates that the centrifugal technique has the potential for yielding
reliable estimates of the saturated hydraulic conductivity in a very short period of time
as compared to other standard methods.
Figure 4-1 shows a comparison of the saturated hydraulic conductivity values of twelve
different concrete samples. One can easily see that the saturated hydraulic conductivity
of concrete depends on the the w/c ratio. The data was characterized by a gradual
increase in the saturated hydraulic conductivity as the w/c ratio increased.
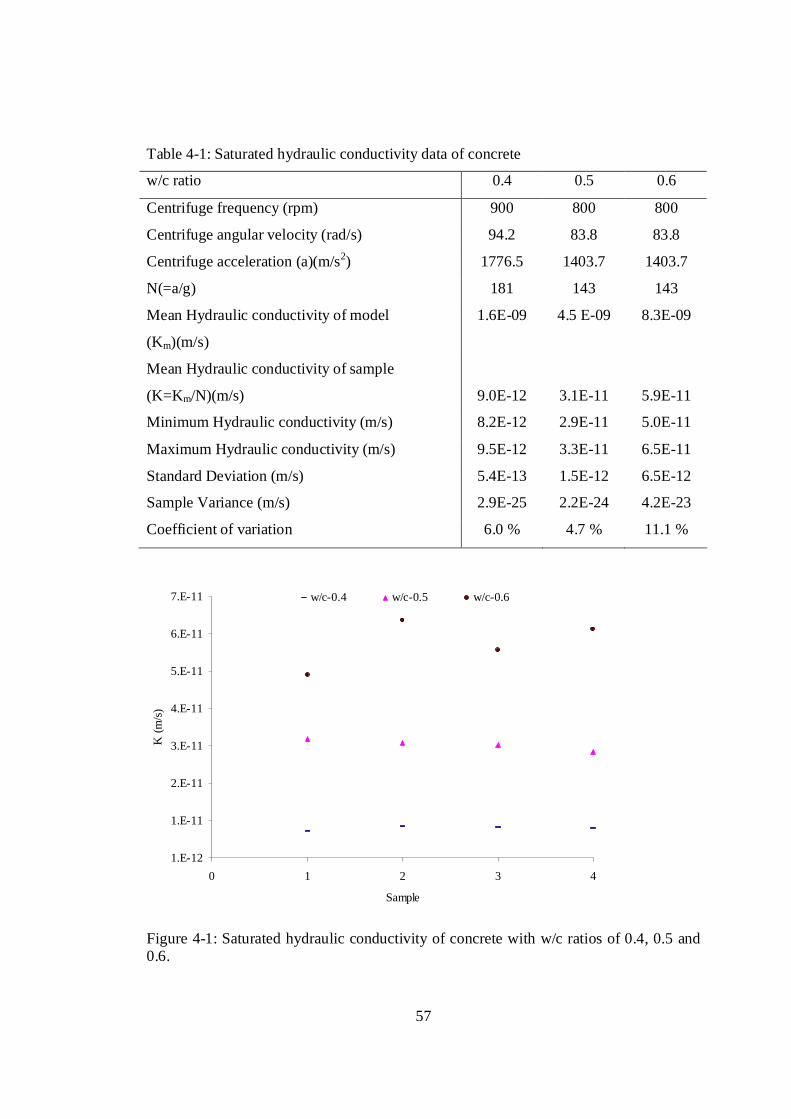
57
Table 4-1: Saturated hydraulic conductivity data of concrete
w/c ratio 0.4 0.5 0.6
Centrifuge frequency (rpm) 900 800 800
Centrifuge angular velocity (rad/s) 94.2 83.8 83.8
Centrifuge acceleration (a)(m/s2) 1776.5 1403.7 1403.7
N(=a/g) 181 143 143
Mean Hydraulic conductivity of model
(Km)(m/s)
1.6E-09 4.5 E-09 8.3E-09
Mean Hydraulic conductivity of sample
(K=Km/N)(m/s)
9.0E-12 3.1E-11 5.9E-11
Minimum Hydraulic conductivity (m/s) 8.2E-12 2.9E-11 5.0E-11
Maximum Hydraulic conductivity (m/s) 9.5E-12 3.3E-11 6.5E-11
Standard Deviation (m/s) 5.4E-13 1.5E-12 6.5E-12
Sample Variance (m/s) 2.9E-25 2.2E-24 4.2E-23
Coefficient of variation 6.0 % 4.7 % 11.1 %
1.E-12
1.E-11
2.E-11
3.E-11
4.E-11
5.E-11
6.E-11
7.E-11
0 1 2 3 4
Sample
K (m
/s)
w/c-0.4 w/c-0.5 w/c-0.6
Figure 4-1: Saturated hydraulic conductivity of concrete with w/c ratios of 0.4, 0.5 and 0.6.

58
To reflect the effect of w/c ratio on the saturated hydraulic conductivity of concrete the
measured saturated hydraulic conductivity data were converted to normalized saturated
hydraulic conductivity with respect to the saturated hydraulic conductivity of concrete
with a w/c of 0.4. Figure 4-2 shows the normalized saturated hydraulic conductivity of
three different concrete mixes. The results in Figure 4-2 showed that an increase in the
water-cement ratio from 0.4 to 0.6 increased the saturated hydraulic conductivity by
almost seven times.
0.0
1.0
2.0
3.0
4.0
5.0
6.0
7.0
0.4 0.5 0.6
W/C ratio
Nor
mal
ised
(K)
Figure 4-2: Normalized saturated hydraulic conductivity of concrete with respect to w/c
ratio.

59
4.2 Vapour Equilibrium Technique
Moisture retention functions were obtained using the vapour equilibrium technique for
three different concrete mixes. In addition, van Genuchten parameters were determined
for capillary pressure-saturation and relative permeability-saturation functions, over the
entire saturation range. The measurements were conducted only on drained samples.
4.2.1 Moisture Retention Function
Thirty three samples from each concrete mix type were tested in eleven different relative
humidity environments. Average values of the saturation from the three identical
samples were used for a given relative humidity (RH) condition. The conversion from
RH to capillary suction was obtained by using equation [2-26]. Figure 4-3 shows the
variation of degree of water saturation with relative humidity (also known as sorption
isotherm) for three different concrete mixes. The water saturation of the specimens
tested varied in the range of 0.1 to 0.92. The results in Figure 4-3 showed that the degree
of saturation decreased with decreasing RH.
0.0
0.2
0.4
0.6
0.8
1.0
0 10 20 30 40 50 60 70 80 90 100Relative Humidity(%)
Deg
ree
of S
atur
atio
n
wc-0.4 wc-0.5 wc-0.6
Figure 4-3: Desorption isotherm of concrete mixtures.
The results in Figure 4-3 showed that for a given relative humidity boundary condition,
the degree of saturation was higher for the samples with lower w/c ratios. That could be
60
attributed to a reduced porosity and smaller pore sizes, which makes desorption more
difficult. In general, the form of the functional relationship between degree of saturation
and RH was slightly non-linear. The results in Figure 4-3 also showed that an increased
w/c ratio increased the non–linearity of the functional relationship.
The moisture retention characteristics or the variations of the degree of saturation at
different capillary suction are shown in the Figure 4-4 for the three concrete mixes. The
results showed that capillary suction strongly depended on the degree of saturation and
the w/c ratio of the concrete. The relationship was characterized by a gradual increase in
capillary pressure as degree of saturation decreased at higher degrees of saturation,
followed by a steep increase at lower degree of saturation. Similarly shaped profiles
were obtained for all the concrete mixes. It is evident from Figure 4-4 that, at a given
capillary suction, the degree of saturation was higher for the samples with lower w/c
ratios. This could be attributed to the presence of smaller size of pores in lower w/c ratio
concrete mixes which require larger suction pressures to desaturate. In general, the
functional relationship between capillary suction and degree of saturation was non-linear.
Moisture retention in concrete exhibits hysteresis that is., the observed degree of
saturation at a given capillary suction depends on whether the concrete is being wetted
or dried. However the data on which the parameters of hysteresis could be estimated was
not measured due to the inability to carefully control wetting. In general, hysteresis is
important only near the cover region where the degree of saturation changes with time is
the largest (Meyer et al. 2004).

61
0.0
0.2
0.4
0.6
0.8
1.0
1 10 100 1000
Deg
ree o
f Sat
urat
ion
Capillary Pressure (MPa)
w/c=0.4 w/c=0.5 w/c=0.6
Figure 4-4: Moisture retention curves for concrete mixtures.
Water retention data is typically represented in simulation codes using one of a number
of water retention models that have been presented in the literature. In this thesis, the
model proposed by van Genuchten (1980) is used. Parameters in the model are as
defined for the moisture retention function and can be estimated using moisture retention
data.
The experimental moisture retention data was used to determine van Genuchten
parameters for each concrete mix type. The retention parameters m and were fitted to
water retention data using the nonlinear, least square, curve-fitting program known as
RETC (van Genuchten et. al. 1991). The van Genuchten parameters and m were
obtained for each concrete mix type and are presented in Table 4-2. No standard method
for defining residual saturation could be found in the present literature in the case of
concrete. The residual water saturation is interpreted here as an empirical parameter and,
thus, is generally a fitted parameter. The residual saturation of the concrete mixtures was
taken as 0.2. In real field conditions, concrete seldom achieves residual state and
therefore this value is not of much importance.
Table 4-2: van Genuchten parameters
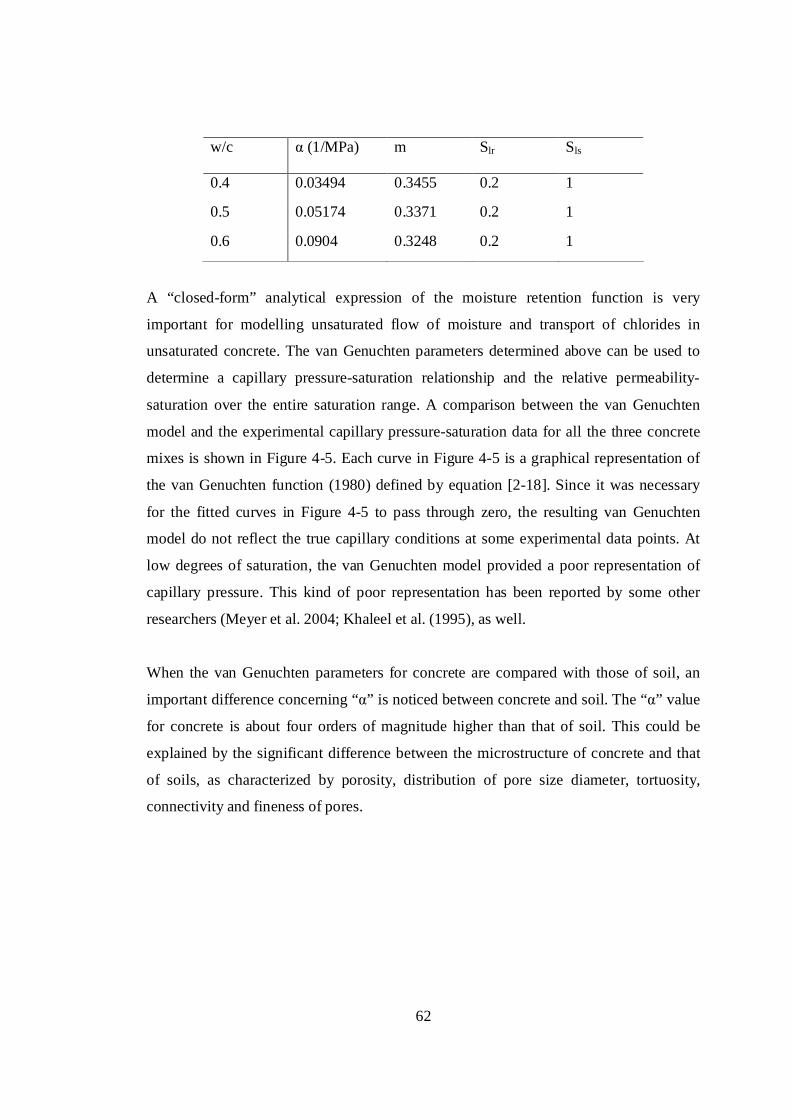
62
w/c (1/MPa) m Slr Sls
0.4 0.03494 0.3455 0.2 1
0.5 0.05174 0.3371 0.2 1
0.6 0.0904 0.3248 0.2 1
A “closed-form” analytical expression of the moisture retention function is very
important for modelling unsaturated flow of moisture and transport of chlorides in
unsaturated concrete. The van Genuchten parameters determined above can be used to
determine a capillary pressure-saturation relationship and the relative permeability-
saturation over the entire saturation range. A comparison between the van Genuchten
model and the experimental capillary pressure-saturation data for all the three concrete
mixes is shown in Figure 4-5. Each curve in Figure 4-5 is a graphical representation of
the van Genuchten function (1980) defined by equation [2-18]. Since it was necessary
for the fitted curves in Figure 4-5 to pass through zero, the resulting van Genuchten
model do not reflect the true capillary conditions at some experimental data points. At
low degrees of saturation, the van Genuchten model provided a poor representation of
capillary pressure. This kind of poor representation has been reported by some other
researchers (Meyer et al. 2004; Khaleel et al. (1995), as well.
When the van Genuchten parameters for concrete are compared with those of soil, an
important difference concerning “ ” is noticed between concrete and soil. The “ ” value
for concrete is about four orders of magnitude higher than that of soil. This could be
explained by the significant difference between the microstructure of concrete and that
of soils, as characterized by porosity, distribution of pore size diameter, tortuosity,
connectivity and fineness of pores.
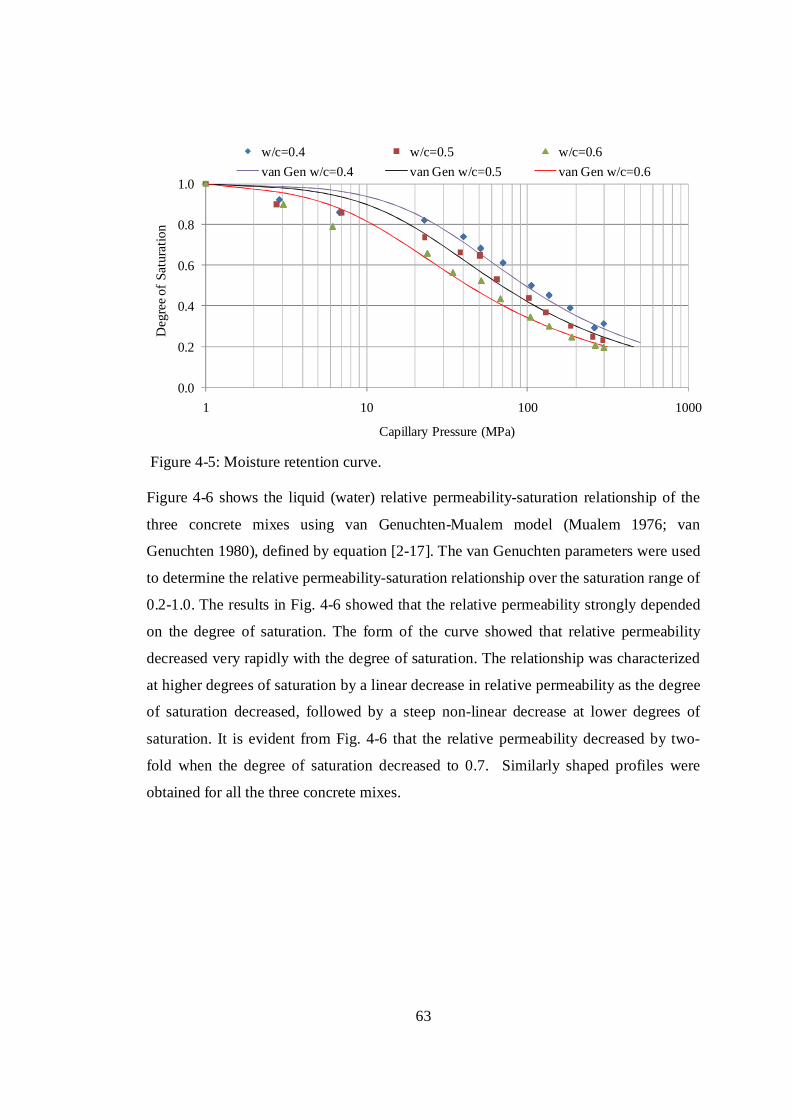
63
0.0
0.2
0.4
0.6
0.8
1.0
1 10 100 1000
Deg
ree o
f Sat
urat
ion
Capillary Pressure (MPa)
w/c=0.4 w/c=0.5 w/c=0.6van Gen w/c=0.4 van Gen w/c=0.5 van Gen w/c=0.6
Figure 4-5: Moisture retention curve. Figure 4-6 shows the liquid (water) relative permeability-saturation relationship of the
three concrete mixes using van Genuchten-Mualem model (Mualem 1976; van
Genuchten 1980), defined by equation [2-17]. The van Genuchten parameters were used
to determine the relative permeability-saturation relationship over the saturation range of
0.2-1.0. The results in Fig. 4-6 showed that the relative permeability strongly depended
on the degree of saturation. The form of the curve showed that relative permeability
decreased very rapidly with the degree of saturation. The relationship was characterized
at higher degrees of saturation by a linear decrease in relative permeability as the degree
of saturation decreased, followed by a steep non-linear decrease at lower degrees of
saturation. It is evident from Fig. 4-6 that the relative permeability decreased by two-
fold when the degree of saturation decreased to 0.7. Similarly shaped profiles were
obtained for all the three concrete mixes.

64
0
0.2
0.4
0.6
0.8
1
1.0E-10 1.0E-08 1.0E-06 1.0E-04 1.0E-02 1.0E+00
Degree of Saturation
w/c =0.4
0
0.2
0.4
0.6
0.8
1
1.0E-10 1.0E-08 1.0E-06 1.0E-04 1.0E-02 1.0E+00
Degree of Saturation
w/c =0.5
0
0.2
0.4
0.6
0.8
1
1.0E-10 1.0E-08 1.0E-06 1.0E-04 1.0E-02 1.0E+00
Degree of Saturation
Liquid Relative Permeability, log10 krl
w/c =0.6
Figure 4-6: Liquid relative permeability curves for concrete (a) w/c = 0.4, (b) w/c = 0.5
and (c) w/c = 0.6.
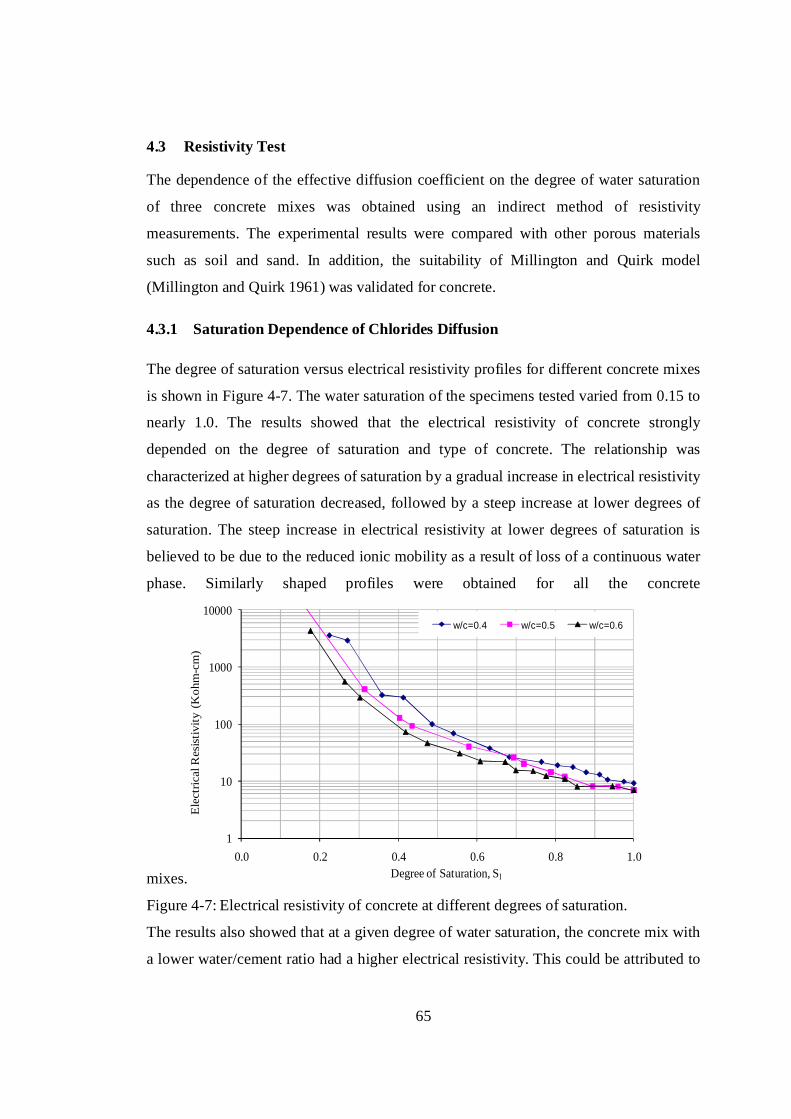
65
4.3 Resistivity Test
The dependence of the effective diffusion coefficient on the degree of water saturation
of three concrete mixes was obtained using an indirect method of resistivity
measurements. The experimental results were compared with other porous materials
such as soil and sand. In addition, the suitability of Millington and Quirk model
(Millington and Quirk 1961) was validated for concrete.
4.3.1 Saturation Dependence of Chlorides Diffusion The degree of saturation versus electrical resistivity profiles for different concrete mixes
is shown in Figure 4-7. The water saturation of the specimens tested varied from 0.15 to
nearly 1.0. The results showed that the electrical resistivity of concrete strongly
depended on the degree of saturation and type of concrete. The relationship was
characterized at higher degrees of saturation by a gradual increase in electrical resistivity
as the degree of saturation decreased, followed by a steep increase at lower degrees of
saturation. The steep increase in electrical resistivity at lower degrees of saturation is
believed to be due to the reduced ionic mobility as a result of loss of a continuous water
phase. Similarly shaped profiles were obtained for all the concrete
mixes.
1
10
100
1000
10000
0.0 0.2 0.4 0.6 0.8 1.0
Ele
ctric
al R
esis
tivity
(K
ohm
-cm
)
Degree of Saturation, Sl
w/c=0.4 w/c=0.5 w/c=0.6
Figure 4-7: Electrical resistivity of concrete at different degrees of saturation.
The results also showed that at a given degree of water saturation, the concrete mix with
a lower water/cement ratio had a higher electrical resistivity. This could be attributed to

66
the decreased connectivity and larger tortuosity of the pore network with decreasing
water/cement ratio (Bachmat et al. 1986, McCarter et al. 2001).
To reflect the effect of degree of saturation on the electrical resistivity, the measured
electrical resistivity data, shown in Figure 4-7, was converted to normalized resistivity
( N ) with respect to the electrical resistivity at full saturation:
s
N [4-1]
where s is the electrical resistivity measured when the degree of saturation was equal to
1.0, and is the electrical resistivity measured at any other saturation. The normalized
resistivity values were used to determine the relative changes in resistivity with
changing levels of saturation. The effect of the degree of saturation on the electrical
resistivity is shown in Figure 4-8 for different concrete mixes. The results in Figure 4-8
show that the normalized resistivity increases with a decrease in the degree of saturation.
1
10
100
1000
10000
0.0 0.2 0.4 0.6 0.8 1.0
Nor
mal
ized
Res
istiv
ity
Degree of Saturation, Sl
w/c=0.4 w/c=0.5 w/c=0.6
Figure 4-8: Normalised resistivity of concrete.
As discussed in Section 2.2.3(b), the electrical conductivity of a porous medium and the
effective diffusion coefficient are directly related to each other. Martys (1999) and
67
Polder et al. (2002) used electrical conductivity measurements in concrete to calculate
the relative diffusion coefficient; the results were in good agreement with experimental
results. Diffusion coefficients calculated from electrical conductivity measurements have
been compared with self-diffusion coefficients obtained by transient state methods in
soils and gravels (Conca and Wright 1990).
The normalized electrical resistivities, shown in Figure 4-8, were converted to
normalized electrical conductivities using equation [2-37]. The effect of the degree of
water saturation on normalized electrical conductivity and, analogously, on the relative
diffusion coefficient, Deff (Sl < 1.0) / Deff (Sl = 1.0), is shown in Figure 4-9 for three
different concrete mixes. The results in Fig. 4-9 showed that the relative diffusion
coefficient decreased with decreases in the degree of saturation. The decrease was quite
rapid initially for all the three concrete mixes, especially for a w/c ratio of 0.4. However,
below a degree of saturation of about 0.7, the decrease was less rapid. There was a
significant decrease in relative diffusion coefficient at, or around, a degree of saturation
of about 0.6. The relative diffusion coefficient was about 0.2 for the concrete mix with
w/c ratios of 0.4 and 0.5 and slightly higher for the concrete mix with a w/c ratio of 0.6
at a degree of saturation of about 0.6. It was found that the relative diffusion coefficient
decreased much more quickly than the degree of saturation, and goes to zero at, or
around, a degree of saturation of about 0.2. This could be possibly due to the
development of a discontinuous liquid phase at, and below, a degree of saturation of
around 0.2. Figure 4-10 shows that, for the concrete mix with a w/c ratio of 0.6, the
value of the relative diffusion coefficient at any given degree of saturation was much
higher than those for w/c ratios of 0.4 and 0.5. In general, the relative diffusion
coefficient decreased with a decrease in the degree of saturation. Also, the form of the
functional relationship between the relative diffusion coefficient and the degree of
saturation was non-linear for all the concrete mixes.

68
0.0
0.2
0.4
0.6
0.8
1.0
0.0 0.2 0.4 0.6 0.8 1.0
Rel
ativ
e D
iffus
ion
Coe
ffici
ent,
Dr
Degree of Saturation, Sl
Test Data: w/c=0.4 Idealized functional relation
0.0
0.2
0.4
0.6
0.8
1.0
0.0 0.2 0.4 0.6 0.8 1.0
Rel
ativ
e D
iffus
ion
Coe
ffici
ent,
Dr
Degree of Saturation, Sl
Test Data: w/c=0.5 Idealized functional relation
0.0
0.2
0.4
0.6
0.8
1.0
0.0 0.2 0.4 0.6 0.8 1.0
Rel
ativ
e D
iffus
ion
Coe
ffic
ient
, Dr
Degree of Saturation, Sl
Test Data: w/c=0.6 Idealized functional relation
Figure 4-9: Relative diffusion coefficient curves for concrete: (a) w/c ratio=0.4, (b) w/c ratio=0.5, and (c) w/c ratio=0.6.

69
The relationship between the degree of saturation and the relative diffusion coefficient
for concrete is compared with experimental data for sand from Barbour et al. (1996) and
Lim et al. (1998), as shown in Figure 4-10. Although, the form of the functional
relationship between the degree of saturation and the relative diffusion coefficient for
sand showed a decrease in the relative diffusion coefficient with a decrease in degree of
saturation similar to that of concrete, the functional relationship was not as non-linear as
that of concrete.
The results in Figure 4-10 showed that, with an increased w/c ratio, the non-linearity of
the functional relationship between the degree of saturation and the relative diffusion
coefficient decreased. This could possibly be attributed to the increased porosity
associated with the increased water-cement ratio, and is consistent with the fact that sand,
having a larger porosity in comparison to concrete showed much less non-linearity.
0.0
0.2
0.4
0.6
0.8
1.0
0.0 0.2 0.4 0.6 0.8 1.0
Rel
ativ
e D
iffus
ion
Coe
ffic
ient
, Dr
Degree of Saturation, Sl
Barbour et al. 1996 w/c=0.4 w/c=0.5 w/c=0.6
Figure 4-10: Comparison between the relative diffusion coefficient curves for concrete and sand.
The effect of degree of saturation on the relative diffusion coefficient of concrete was
found to be adequately representable with the Millington and Quirk (1961) model (MQ).

70
To compare the effect of degree of saturation on the relative diffusion coefficient with
MQ model, the model needs to be normalized with respect to the porosity term. The
saturation dependent tortuosity of the normalized MQ model is given by:
10/34/3( )l ls S [4-2]
where (sl) is the saturation dependent tortuosity.
A comparison between the normalized MQ model and the experimental degree of
saturation versus relative diffusion coefficient data is shown in Figure 4-11. The results
in Figure 4-11 showed that similarly shaped profiles were obtained using both
experimental data and the normalized MQ model. The results in Figure 4-11 clearly
showed that the experimental relative diffusion coefficient values were in very good
agreement with normalized MQ model for concrete mixes with w/c ratios of 0.4 and 0.5.
For a water cement ratio of 0.6, however the experimental values were nearly 15%
higher than those calculated using the normalized Millington-Quirk model. Table 4-3
shows a comparison between the test results and the Millington and Quirk model.
Table 4-3: Relative difference between test data and Millington and Quirk model
w/c-0.4 w/c-0.5 w/c-0.6
Correlation coefficient (R2) 0.99 0.97 0.96
Root mean-squared error (%) 3.41 6.86 9.71
Mean absolute error (%) 2.42 4.27 6.92
Relative absolute error (%) 7.51 15.03 23.70
The experimental results show that the Millington and Quirk model, which was
originally developed for soils, is also applicable to concrete.

71
0.0
0.2
0.4
0.6
0.8
1.0
0.0 0.2 0.4 0.6 0.8 1.0
Rel
ativ
e D
iffus
ion
Coe
ffici
ent,
Dr
Degree of Saturation, Sl
Test Data: w/c=0.4 Normalized MQ model
0.0
0.2
0.4
0.6
0.8
1.0
0.0 0.2 0.4 0.6 0.8 1.0
Rel
ativ
e D
iffus
ion
Coe
ffici
ent,
Dr
Degree of Saturation, Sl
Test Data: w/c=0.5 Normalized MQ model
0.0
0.2
0.4
0.6
0.8
1.0
0.0 0.2 0.4 0.6 0.8 1.0
Rel
ativ
e D
iffus
ion
Coe
ffic
ient
, Dr
Degree of Saturation, Sl
Test Data: w/c=0.6 Normalized MQ model
Figure 4-11: Comparison between test result and Normalized MQ model.

72
4.4 Numerical Modelling
The experimental results discussed earlier were used as input parameters in a computer
simulator, TOUGH2, to determine their influences on water flow and transport of
chlorides in unsaturated concrete. TOUGH2 (Pruess et al. 1999), is a multicomponent,
multiphase simulator of water dynamics in porous media. It has been extensively
validated on a series of unsaturated flow problems (Moridis and Pruess 1992; Pruess et
al. 1996). It solves mass and energy balance equations (see Section 2.1.2) that describe
fluid flow and heat transfer in general multiphase, multicomponent systems. Fluid
advection is described with a multiphase extension of Darcy’s law; in addition there is
diffusive mass transport in all phases. It is capable of modelling both isothermal and
non-isothermal conditions. It uses a variety of different functions to model relative
permeability and capillary pressure, including the functions of van Genuchten (van
Genuchten 1980) and Mualem (Mualem 1976), among others. The EWASG module of
TOUGH2 was used to run the simulations. The EWASG (Water-Salt-Gas) module
models two phase salt dynamics, along with unsaturated flow. EWASG represents the
active system components (water, NaCl, air) as two-phase (liquid and gas) mixtures. A
detailed description of EWASG is outside the scope of this work.
Influence of various parameters on ionic transport The numerical solutions were carried out on a 200 mm thick concrete specimen,
modeled as a one grid block wide column with cross-sectional area of 1cm2. The
problem simulates one-dimensional flow with constant surface chloride concentration.
The concrete was discretized by using one 1mm, one 2mm, one 3mm, one 4 mm, and
thirty eight 5mm rectangular elements, respectively. The smaller elements were used at
the boundary to accurately capture the transient conditions at the boundary. The
numerical solutions obtained for other mesh sizes (up to 15 mm) were also identical in
the case of wetting phase. The geometry, mesh and boundary conditions used are shown
in Figure 4-12. The concrete was subjected to constant chloride concentrationalong the
right-hand boundary to simulate an atmospheric boundary. The atmospheric boundary
was modelled as a 0.1 mm thick element with a volume factor of 1E+50 to make the
boundary volume infinite. The atmospheric boundary element was modeled as an

73
“inactive” element in order to maintain its properties as constant throughout the
simulations. In TOUGH2, constant Dirichlet (essential) boundary conditions are set by
using an “inactive” grid block (i.e. grid block which gets involved in flow equations but
whose initial conditions remain constant). The top, bottom and left-hand boundaries of
concrete were modeled as no flow boundaries, to simulate the concrete edge.
Figure 4-12: Geometry, mesh and boundary conditions used for all numerical analysis
The input parameters to the simulations were evaluated from experimental results and
shown in Table 4-4. The initial chloride concentration inside the concrete was set at zero
for all the analyses. The temperature was kept constant during the analysis at 22 °C since
all the experiments were carried out at this temperature. The diffusion coefficient and
surface chloride concentration values were chosen arbitrarily for the purpose of these
simulations. The initial conditions and boundary conditions used for the simulations are
shown in Table 4-4. All the simulation results reported here were made for concrete
during its wetting phase.
The drying phase results are not reported here due to the large amount of chloride loss
during the drying phase. The chloride loss could be attributed to the very strong capillary
pressure that develops inside a drying concrete. In reality, chloride binding plays a major
role in the stability of the solution under evaporative boundary conditions and cannot be
ignored or accounted for, indirectly, through a lower diffusion coefficient. TOUGH2
Constant Head Boundary
No Flow Boundary
Exposed Surface Boundary Condition (Chloride Solution)
No Flow Boundary
200 mm
10 mm Concrete
200 190 10 15 75 6 0 3 65 90
No Flow Boundary
(Area= 1 cm2)

74
does not have a provision to implement chloride binding. Therefore, chloride
concentration profiles during the drying phase were not in good agreement with those
present in the literature. There is a need for further study to resolve the issue of chloride
loss during the drying phase simulation using TOUGH2.
The influence of the experimental parameters, measured above, on chloride ingress was
studied by analyzing three different cases: one in which the initial saturation of a given
concrete mix (w/c=0.4) was varied (0.5 Sl 1.0) (diffusion and convection); a second
one in which for a given initial saturation (Sl=0.8) the concrete mix properties were
varied (diffusion and convection); and, a third one in which the initial saturation of a
given concrete mix (w/c=0.4) was varied (0.2 Sl 1.0) (only diffusion). The concrete
was subjected to a constant chloride concentration at the boundary in all the three cases.
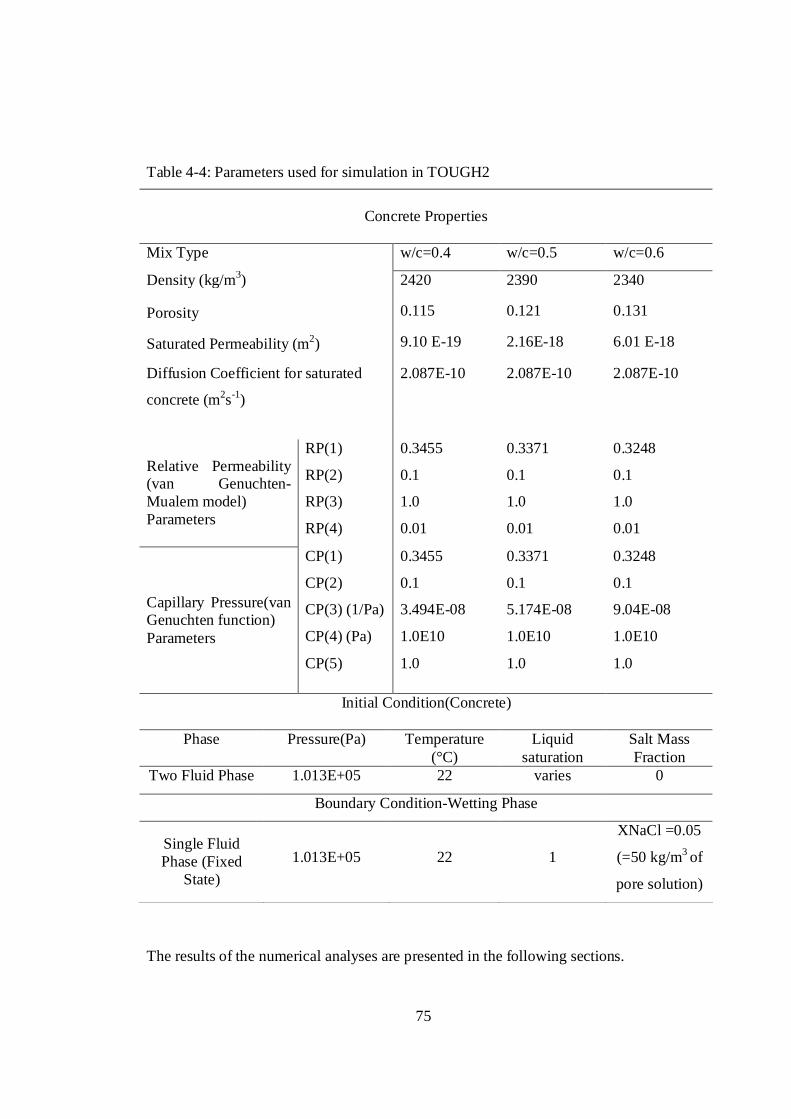
75
Table 4-4: Parameters used for simulation in TOUGH2
Concrete Properties
Mix Type w/c=0.4 w/c=0.5 w/c=0.6
Density (kg/m3)
2420
2390 2340
Porosity 0.115 0.121 0.131
Saturated Permeability (m2) 9.10 E-19 2.16E-18 6.01 E-18
Diffusion Coefficient for saturated
concrete (m2s-1)
2.087E-10 2.087E-10 2.087E-10
Relative Permeability (van Genuchten-Mualem model) Parameters
RP(1)
RP(2)
RP(3)
RP(4)
0.3455
0.1
1.0
0.01
0.3371
0.1
1.0
0.01
0.3248
0.1
1.0
0.01
Capillary Pressure(van Genuchten function) Parameters
CP(1)
CP(2)
CP(3) (1/Pa)
CP(4) (Pa)
CP(5)
0.3455
0.1
3.494E-08
1.0E10
1.0
0.3371
0.1
5.174E-08
1.0E10
1.0
0.3248
0.1
9.04E-08
1.0E10
1.0
Initial Condition(Concrete)
Phase Pressure(Pa) Temperature (°C)
Liquid saturation
Salt Mass Fraction
Two Fluid Phase 1.013E+05 22 varies 0
Boundary Condition-Wetting Phase
Single Fluid Phase (Fixed
State) 1.013E+05 22 1
XNaCl =0.05
(=50 kg/m3 of
pore solution)
The results of the numerical analyses are presented in the following sections.

76
4.4.1 Influence of degree of saturation on chloride penetration The effect of the degree of saturation on chloride penetration was studied by running an
example where the initial degree of saturation of a given concrete mix (w/c=0.4) was
varied (0.5 Sl 1.0). Input parameters used to run the simulation are listed in Table 4-4.
To evaluate the influence of the degree of saturation on chloride penetration, only the
initial degree of saturation of concrete was varied while maintaining the other concrete
properties, as well as the boundary conditions, was constant. The results of the
numerical analysis are shown in Figure 4-13 (a) and 4-13 (b), where chloride
concentration profiles after an exposure period of 5 hours and 24 hours are plotted with
depth, respectively.
The results show that the initial level of saturation greatly affects the resulting chloride
profile. The concrete with initial lower saturation values showed higher chloride
concentrations at a given depth compared to a concrete with higher saturation values,
even though the same external boundary conditions were applied in all cases. This result
can be explained as follows: with a decrease in saturation, capillary pressure increased
(see Figure 4-5) which, in turn, increased the liquid flux drawn inside the concrete
through advection according to equation [2-16]. The increased liquid flux resulted in
more chloride transport. For the same reason, the chloride penetration depth was also
higher for the case of lower saturation.
Figure 4-13 (b) shows that there was a large increase in the penetration depth from 5
hours to 24 hours; the chloride concentration was also higher at this time. However, the
rate of increase of chloride concentrations reduced; the reduced rate of increase of
chloride concentrations is mainly due to the effect of time on the saturation of concrete.
With time, the saturation of the concrete increased, as more moisture was drawn inside
the concrete. That decreased the capillary pressure and moisture flux. Moisture flow due
to capillary pressure contributed to pull the penetration front inward and thus increased
the penetration depth. When the saturation of concrete was low, advective transport was
the dominant transport mechanism. However, as saturation level increased to near full
saturation diffusive transport became a dominant transport mechanism.

77
(a)
0.0E+005.0E-031.0E-021.5E-022.0E-022.5E-023.0E-023.5E-024.0E-024.5E-025.0E-02
0 20 40 60 80 100 120 140
Cl C
once
ntra
tion
(kg/
m3
of so
lutio
n)
Depth(mm)
Sl=1.0 Sl=0.9 Sl=0.8 Sl=0.7 Sl=0.6 Sl=0.5
(b)
0.0E+005.0E-031.0E-021.5E-022.0E-022.5E-023.0E-023.5E-024.0E-024.5E-025.0E-02
0 20 40 60 80 100 120 140Cl C
once
ntra
tion
(kg/
m3
of so
lutio
n)
Depth(mm)
Sl=1.0 Sl=0.9 Sl=0.8 Sl=0.7 Sl=0.6 Sl=0.5
Figure
4-13: Chloride profile in concrete at different degree of saturation for w/c=0.4 (a) after 5
hours of wetting, and (b) after 24 hours of wetting.
It is observed in Figure 4-13 that both the chloride concentration and penetration depths
were higher in concrete with saturation values lower than 1.0 (unsaturated concrete)
compared to concrete with saturation value 1.0 (fully saturated concrete). This is due to
the dominance of combined diffusive and advective transport of chlorides in unsaturated
concrete compared to purely diffusive transport in fully saturated concrete, as mentioned

78
in Section 2.2.2. This result emphasizes the importance of modelling water flow and the
transport of chlorides in unsaturated conditions when predicting the service life of a
concrete structure.
It is expected that similar results will be obtained for other concrete mixes. This is the
reason why the example was run using only one concrete mix.
4.4.2 Influence of concrete mix on chloride penetration
The effect of the concrete mix design on chloride penetration was studied by running an
example in which for a given initial saturation (Sl =0.8), the concrete mix properties
were varied. Three different concrete mixes, with w/c ratios of 0.4, 0.5 and 0.6 were
used for this example. Input parameters used to run the simulation are listed in Table 4-4.
The initial saturation of the concrete was chosen arbitrarily. To evaluate the influence of
the concrete mix on chloride penetration, only concrete mix properties were varied while
maintaining the initial saturation as well as chloride concentration at the boundary
constant. The results of the numerical analysis are shown in Figure 4-14 (a) and 4-14 (b),
where chloride concentration profiles after an exposure period of 5 hours and 24 hours
are plotted with depth, respectively.
The results showed that the w/c ratio of concrete greatly affects the resulting chloride
profile. Note that concrete with higher water-cement ratios showed higher chloride
concentrations at a given depth compared to the concrete with lower water-cement ratios,
even though the same external, constant concentration boundary condition was applied
in all cases. This result can be explained as follows: with an increased water-cement
ratio, the saturated hydraulic conductivity of the concrete increased (see Figure 4-1;
Table 4-1). The increase was so substantial that the liquid flux drawn inside the concrete
increased (see equation [2-16]), even though the capillary pressure was lower compared
to concrete with lower w/c ratios (see Figure 4-5). The increased liquid flux resulted in
more chloride transport. For the same reason, the chloride penetration depth was also
higher for the case of higher water-cement ratios.
(a)

79
0.0E+005.0E-031.0E-021.5E-022.0E-022.5E-023.0E-023.5E-024.0E-024.5E-025.0E-02
0 20 40 60 80 100 120 140
Cl C
once
ntra
tion
(kg/
m3
of so
lutio
n)
Depth (mm)
w/c=0.4 w/c=0.5 w/c=0.6
(b)
0.0E+005.0E-031.0E-021.5E-022.0E-022.5E-023.0E-023.5E-024.0E-024.5E-025.0E-02
0 20 40 60 80 100 120 140Cl C
once
ntrat
ion (k
g/m3
of so
lution
)
Depth (mm)
w/c=0.4 w/c=0.5 w/c=0.6
Figure 4-14: Chloride profiles at Sl =0.8 for three different concrete mixes (a) after 5
hours of wetting, and (b) after 24 hours of wetting.
Figure 4-14 (b) showed that there was a large increase in the penetration depth from 5
hours to 24 hours, the chloride concentration was also higher at this time. However, the
rate of increase of chloride concentration was lower. The reduced rate of increase of the
chloride concentration was mainly due to the effect of time on the saturation of concrete.
With time, saturation of the concrete increased, as more moisture was drawn inside the
80
concrete. That decreased the capillary pressure and moisture flux. Moisture flow due to
capillary pressure contributed to pulling the penetration front inward and, thus, increased
the penetration depth.
It is expected that similar results will be obtained for other concrete saturations.
4.4.3 Influence of degree of saturation on chloride diffusion The effect of the degree of saturation on chloride diffusion was studied by running an
example where the initial degree of saturation of a given concrete mix (w/c=0.4) was
varied (0.2 Sl 1.0). Input parameters used to run the simulation are listed in Table 4-4.
To evaluate the influence of the degree of saturation on chloride penetration due to
diffusion, only the degree of saturation of the concrete was varied while maintaining all
the other concrete properties as well as the boundary conditions. The value of the
saturated hydraulic permeability of the concrete mix was set at zero to force the chloride
transport due to diffusion only. The Millington and Quirk model was used to model the
saturation dependence of the diffusion coefficient in the simulator. The results of the
numerical analysis are shown in Figure 4-15, where chloride concentration profiles after
an exposure period of 10 days are plotted with depth. The exposure period was chosen to
be longer compared to the previous examples due to the slow process of diffusion.

81
0.0E+005.0E-031.0E-021.5E-022.0E-022.5E-023.0E-023.5E-024.0E-024.5E-025.0E-02
0 20 40 60 80
Cl C
once
ntra
tion
(kg/
m3
of so
lutio
n)
Depth (mm)
Sl=1.0 Sl=0.9 Sl=0.8 Sl=0.7Sl=0.6 Sl=0.5 Sl=0.4 Sl=0.2
Figure 4-15: Chloride diffusion in concrete at different degree of saturation for w/c=0.4 after 10 days.
The results showed that the saturation of concrete greatly affects the resulting chloride
profile. Note that the concrete with higher saturation values showed higher chloride
concentrations at a given depth compared to concrete with a lower saturation value, even
though the same external boundary conditions were applied to all cases. This was as
expected, since, with increased saturation the effective diffusion coefficient increased
(see Figure 4-9 and 4-11) which, in turn, increased the diffusive flux inside the concrete,
according to equation [2-28]. The increased diffusive flux resulted in more chloride
transport. For the same reason, the chloride penetration depth was also higher for the
case of higher saturation.
It is expected that similar results would be obtained for other concrete mixes as well
with the only difference in the amount and depth of chloride penetration due to different
porosity and diffusion coefficient value, if used different values for each mix.

82
The above simulations suggest that how the transport properties measured in this study
affect the ingress of chlorides in unsaturated concrete. They also suggest that multiphase,
multicomponent approaches can be used as a powerful tool for predicting the long term
performance of concrete under unsaturated conditions.
4.5 Summary
The saturated hydraulic conductivity of three concrete mixes was obtained using a
centrifuge technique. Twelve concrete samples were tested, four for each of three w/c
ratios. The mean saturated hydraulic conductivity was 9.0E-12 m/s for w/c of 0.4, 3.1E-
11 m/s for w/c of 0.5 and 5.9E-11 m/s for w/c of 0.6. The results showed that an
increase in water-cement ratio increased the hydraulic conductivity of concrete. An
increase in the w/c ratio from 0.4 to 0.6 resulted in an increase in the saturated hydraulic
conductivity by almost seven times.
The moisture retention curves of three concrete mixes were determined using the vapour
equilibrium technique. The test results showed that the degree of water saturation of the
concrete samples decreased with a decrease in relative humidity. For a given relative
humidity boundary condition, the degree of saturation was higher for the samples with
lower w/c ratios. The results also showed that the capillary pressure increased gradually
as the degree of water saturation decreased. Similarly shaped profiles were obtained for
all the three concrete mixes. The experimental moisture retention data was used to
determine the van Genuchten parameters for each concrete mix type. The van Genuchten
parameters provide the means for determining a closed-form relationship between
capillary pressure-saturation and relative permeability-saturation over the entire
saturation range. The results showed that the relative permeability strongly depended on
the degree of saturation. The relationship between saturation and relative permeability
was characterized at higher degrees of saturation by a decrease in relative permeability
as the degrees of saturation decreased, followed by a steep non-linear decrease at lower
degree of saturation. It was found that, for all the three concrete mixes the relative

83
permeability decreased by a factor of two orders of magnitude when the degree of water
saturation decreased from 1.0 to 0.7.
The dependence of the effective diffusion coefficient on the degree of water saturation
was determined using a resistivity technique for three different concrete mixes. This
experimental result is very valuable, considering the fact that there are very little data
available in the literature showing this dependence for concrete. The results showed that
the electrical resistivity of concrete strongly depended on the degree of water saturation,
as well as the w/c ratio of concrete. The normalized electrical resistivities were
converted to relative diffusion coefficients. These results showed that the relative
diffusion coefficient decreased with a decrease in the degree of saturation. The decrease
was quite rapid initially for all the three concrete mixes, especially for a w/c ratio 0.4.
However, below a degree of saturation of about 0.6, the decrease was less rapid. There
was a significant decrease in the relative effective diffusion coefficient at, or around, a
degree of saturation of about 0.6. In general, the relative diffusion coefficient decreased
with a decrease in the degree of saturation. Also, the form of the functional relationship
between the relative diffusion coefficient and the degree of saturation was non-linear for
all the concrete mixes.
The degree of saturation versus relative diffusion coefficient relationship for concrete
was compared with experimental data on sand that was taken from the literature. The
form of the functional relationship between the degree of saturation and the relative
diffusion coefficient for sand also showed a decrease in the relative diffusion coefficient,
with a decrease in degree of saturation similar to that of concrete, although the
functional relationship was not as non-linear as that of concrete. A comparison was also
made between the normalized form of the Millington and Quirk (MQ) model and the
experimental degree of saturation versus relative diffusion coefficient data. The results
showed that similarly shaped profiles were obtained using both experimental data and
the normalized Millington and Quirk model. The results clearly showed that the
experimental relative diffusion coefficient values were in very good agreement with
normalized MQ model for concrete mixes with w/c ratios of 0.4 and 0.5. For a water

84
cement ratio of 0.6, the experimental values were nearly 15% higher than those
calculated using the normalized Millington-Quirk model.
Numerical modelling was carried out to investigate the influence of various parameters
measured in this study on water flow and the transport of chloride in unsaturated
concrete. TOUGH2, a multicomponent, multiphase simulator, was used to run the
simulations.
Simulations were run to show the effect of the degree of saturation on chloride
penetration using concrete with a w/c of 0.4. Simulations were carried out on concrete
with different initial degrees of water saturation. The results showed that the chloride
penetration profile strongly depended on the degree of saturation of the concrete. The
relationship was characterized by an increasing amount of chloride penetration as the
initial degree of water saturation of concrete was decreased.
Simulations were run to reflect the effect of three different concrete mixes, with w/c
ratios of 0.4, 0.5 and 0.6, on the depth of chloride penetration at a given degree of water
saturation. The results showed that the chloride penetration profile strongly depended on
the w/c ratio of the concrete mix. The relationship was characterized by a higher degree
of chloride penetration with a higher w/c ratio.
Simulations were also run to reflect the effect of the degree of saturation on the depth of
chloride penetration due to a purely diffusive transport. A concrete mix with a w/c ratio
of 0.4 was used for this study. The Millington and Quirk model was used for
determining the saturation dependence of the diffusion coefficient. The degrees of water
saturation of the concrete were varied from 0.2 to 1.0. The results showed that the
chloride penetration due to a diffusive transport depended strongly on the degree of
water saturation of the concrete. The relationship was characterized by an increased
amount of chloride penetration as the initial degree of water saturation of concrete was
increased.

85
5 Conclusions & Recommendations This chapter provides a summary of the work and conclusions, with reference to the
objectives of the research. Recommendations are also provided for future research on
this subject matter.
5.1 Summary of work
1. The principles of moisture flow and the transport of chlorides in unsaturated
concrete were discussed. The standard experimental methods available in the
literature were also discussed in terms of their applicability to the case of unsaturated
flow.
2. Three different experiments were performed to determine the saturated hydraulic
conductivity, the moisture retention function, and the dependence of the effective
diffusion coefficient of concrete on saturation. The experiments were carried out on
samples prepared from three different concrete mixes, with w/c ratios of 0.4, 0.5 and
0.6. The physical properties of the concrete mixes were determined experimentally.
3. A centrifugation technique was used to determine the saturated hydraulic
conductivity of the three concrete mixes. The experiment was carried out on twelve
concrete samples, four from each of three concrete mixes. Using this technique, the
saturated hydraulic conductivity measurements were made within 24 hours.
4. A vapour equilibrium technique was used for determining the moisture retention
function of concrete. The experiments were carried out on three different concrete
mixes at a constant temperature of 22±0.5°C. Twelve different desorption
environments were imposed on the concrete specimens by using twelve different
saturated salt solutions kept in closed containers. The degree of water saturation of
the samples was determined at the end of the experiment. The experimental moisture
retention data was used to determine van Genuchten

86
parameters for each concrete mix type. The van Genuchten parameters provided the
means for determining a closed-form relationship between the capillary pressure-
saturation and the relative permeability-saturation over the entire saturation range.
5. The resistivity technique was used to characterize the effect of the degree of
saturation on the effective diffusion coefficient. DC voltage was used for
determining the electrical resistivity of concrete. Three samples were tested from
each concrete mix. Two different voltages, 5.0 V and 2.5 V, were applied on each
sample at different degrees of water saturation. The degree of water saturation of the
samples and currents corresponding to each voltage were measured during the
experiment. The degree of saturation versus relative diffusion coefficient relation of
the concrete was compared with experimental data on sand that was presented in the
literature. A comparison was also made between the normalized form of the
Millington and Quirk (MQ) model and the experimental degree of saturation versus
relative diffusion coefficient data.
6 .Numerical simulations were carried out to show the influence of various parameters
measured in this study on water flow and the transport of chlorides in unsaturated
concrete. TOUGH2, a multicomponent, multiphase simulator was used to perform
the simulations.
5.2 Important findings
1. The mean value of saturated hydraulic conductivity was 9.0E-12 m/s for w/c of 0.4,
3.1 E-11 m/s for w/c of 0.5 and 5.9E-11 m/s for w/c of 0.6. The results showed that
an increase in water-cement ratio increased the hydraulic conductivity of concrete.
An increase in the w/c ratio from 0.4 to 0.6 increased the saturated hydraulic
conductivity by almost seven times. The largest coefficient of variation in the
measured saturated hydraulic conductivity was 11.1 %, which confirms that the
centrifugal technique has the potential for yielding reliable estimates of the saturated
hydraulic conductivity in a very short period of time as compared to other standard
methods.
87
2. The test results showed that the degree of water saturation of the concrete samples
decreased with a decrease in relative humidity. For any particular relative humidity
boundary condition, the degree of saturation was higher for the samples with lower
w/c ratios. The results also showed that capillary pressure increased gradually as the
degree of water saturation decreased. Similarly shaped profiles were obtained for all
the three concrete mixes. The results showed that the relative permeability strongly
depended on the degree of saturation. The relationship between saturation and
relative permeability was characterized at higher degrees of saturation by a linear
decrease in relative permeability as the degree of saturation decreased, followed by a
steep non-linear decrease at lower degree of saturation. It is found that, for all the
concrete mixes, the relative permeability decreased by a factor of two orderswhen
the degree of water saturation decreased from 0.1 to 0.7.
3. The results showed that the relative diffusion coefficient decreased with decreasing
degrees of saturation. The decrease was initially quite rapid for all the three concrete
mixes, especially for a w/c ratio of 0.4. However, below a degree of saturation of
about 0.6, the decrease was less rapid. There was a significant decrease in the
relative effective diffusion coefficient at, or around, a degree of saturation of about
0.6. In general, the relative diffusion coefficient decreased with a decrease in the
degree of saturation. Also, the form of the functional relationship between the
relative diffusion coefficient and the degree of saturation was non-linear for all the
concrete mixes tested. When compared with Millington and Quirk(MQ) model, the
results showed that similarly shaped profiles were obtained using both experimental
data and the normalized Millington and Quirk model. The results clearly showed that
the experimental relative diffusion coefficient values were in very good agreement
with normalized MQ model for concrete mixes with w/c ratios of 0.4 and 0.5. For a
water cement ratio of 0.6, the experimental values were nearly 15% higher than
those calculated using the normalized Millington-Quirk model. The above
experimental results are very valuable, considering the fact that there are very little
data available in the literature showing this dependence in the case of concrete.
4. The simulation results showed that the chloride penetration profile strongly
depended on the degree of saturation of the concrete. The relationship was

88
characterized by an increasing amount of chloride penetration as the initial degree of
water saturation of the concrete decreased.
5. The simulation results showed that the chloride penetration profile strongly
depended on the w/c ratio of the concrete. The relationship was characterized by a
higher amount of chloride penetration with higher w/c ratios of the concrete.
6. The simulation results showed that the chloride penetration due to diffusive
transport depended strongly on the degree of water saturation of the concrete. The
relationship was characterized by an increased amount of chloride penetration as
degree of water saturation of the concrete increased. When the degree of water
saturation decreased to 0.2, the chloride diffusion into the concrete decreased to
almost zero.
5.3 Conclusions
1. A sound theoretical framework has been proposed for modeling water flow and
transport of chlorides in concrete under unsaturated condition.
2. Novel experimental techniques, initially developed in other areas such as soil
sciences and petroleum engineering, have been used and shown to work very nicely
for concrete.
3. Using the experimental data generated in this study, numerical simulations have
been carried out to investigate the effect of each parameter on the movement of
moisture and the transport of chlorides in unsaturated concrete.
5.4 Recommendations for future work
1. The experimental program could be extended by varying more parameters than
simply the w/c ratio (for example, the cement type, mineral additions, admixtures,
etc.) and studying their effects on the transport properties of concrete.

89
2. It is believed that improved performance predictions of concrete structures would be
achieved by integrating direct modelling of chloride binding and corrosion into the
current model. This would lead to a more realistic prediction of time to cracking of
reinforced concrete structures and, hence, allowing the implementation of effective
maintenance strategies for our aging infrastructure.
3. The ”salt transport” doesn’t “work quite well” for drying phase using TOUGH2.
There is a need for further study to resolve this issue.

90
6 References Alemi, M.H., Nielsen, D.R., and Biggar, J.W., 1976, Determining the Hydraulic Conductivity of Soil Cores by Centrifugation, Soil Science Society American Journal, Vol. 40. Andrade, C., Alonso, C., and Goni, S., 1993, Possibilities for Electrical Resistivity to Universally Characterise Mass Transport Process in Concrete, Proceedings of the Concrete 2000 Conference, Vol. 2., R. K. Dhir and M. R. Jones, Eds. E & FN Spon, London, pp. 1639-1652 Arulanandan, K., 1988, Centrifuge Modelling of Transport Processes for Pollutants in Soils, Journal of Geotechnical Engineering, Vol. 114, No. 2. Atkinson, A., and Nickerson, A.K., 1984, The diffusion of ions through water-saturated cement, Journal of Materials Sciences, Vol. 19, pp. 3068-3078. Babaei, K. and Hawkins, N.M. 1988. Evaluation of Bridge Deck Protective Strategies. Concrete International, American Concrete Institute, v.10, No.12, pp. 56-66 Bachmat, Y., and Bear, J., 1986, Macroscopic modelling of transport phenomena in porous media, Vol. 1, pp. 213-240. Bailey, J. E. and Hampsen, C. J. 1982. The Chemistry of the Aqueous Phase of Portland Cement. Cement and Concrete Research, Vol. 12, pp. 227-236 Baroghel-Bouny, V., Mainguy, M., Lassabatere, T., and Coussy, O., 1999, Characterization and identification of equilibrium and transfer moisture properties for ordinary and high-performance cementitious materials, Cement and Concrete Research, Vol. 29, pp. 1225-1238. Basheer, Muhammed P. A., 2001. Permeation Analysis, Handbook of Analytical Techniques in Concrete Science and Technology, edited by Ramachandran, V.S.; Beaudoin, J.J., William Andrew Publishing/Noyes. pp. 658-737. Battistelli, A., Calore, C., and Pruess, K., 1997, The Simulator TOUGH2/EWASG for modelling geothermal reservoirs with brines and non-condensible gas, Geothermics, Vol. 26, No. 4, pp. 437-464

91
Barbour, S. L., Lim, P. C., and Fredlund, D. G. 1996. A New Technique for Diffusion Testing of Unsaturated Soil, Geotechnical Testing Journal, GTJODJ, Vol. 19, No. 3, pp. 247-258. Bazant, Z.P., and Najjar, L.J., 1972, Nonlinear Water Diffusion in Nonsaturated Concrete, Materials and Strustures (Rilem, Paris), Vol. 5, Issue 1, pp. 3-20. Bear, J., Dynamics of fluids in porous Media, Elsevier, 1972 Bear, J., and Bachmat, Y., 1990, Introduction to Modelling of Transport Phenomena in Porous Media, Kluwer Academic Publishers, Dordrecht. Brakel, J. van, and Heertjes, P.M., 1974, Analysis of diffusion in macroporous media in terms of a porosity, a tortuosity and a constructivity factor, Int. J. Heat and Mass Transfer, Vol. 17, pp. 1092-1103. Brooks, R.H., and Corey, A.T., 1966, Properties of porous media affecting fluid flow, Proc. Amer. Soc. Civil Eng., 92, 61–87. Carcasses, M., Abbas, A., Olliver, J.P., and Verdier, J., 2002, An optimised pre-conditioning procedure for gas permeability measurement, Material and Structures, Vol. 35, pp. 22-27. Cargill, K.W., and Ko Hon-Yim, 1983, Centrifuge Modelling of Transient Water Flow, Journal of Geotechnical Engineering, Vol. 109, No. 4. Conca, J. L. and Wright, J., 1990, Diffusion Coefficients in Gravel under Unsaturated Conditions, Water Resource Research, Vol. 26, No. 5, pp. 1055-1066 Crank, J., 1975, The Mathematics of Diffusion, 2nd ed., Oxford University Press, London, pp. 414. Dhir, R. K., et al., 1989, Near-Surface Characteristics of Concrete: Prediction of Carbonation Resistance, Magazine of Concrete Research, 41(148), 137-143. Dullien, F.A.L., 1992, Porous Media: Fluid Transport and Pore Structures, Second edition, Academic Press, Inc. El-Dieb, A.S., and Hooten, R.D., 1994, A High Pressure Triaxial Cell with improved measurement sensitivity for saturated water permeability of high performance concrete, Cement and Concrete Research, Vol. 24, No. 5, pp. 854-862 European Standard, 1996, Building materials-Determination of hygroscopic sorption curves, ISO/DIS 1257:1996.

92
Garboczi, E.J., 1990, Permeability, Diffusivity, and Microstructural Parameters: A Critical Review, Cement and Concrete Research, Vol. 20, pp. 591-601. Gardner, W.R., 1958, Some steady state solutions of the unsaturated moisture flow equation, with application to evaporation from a water table, Soil Sci., 85, 228–232.
Goodings, D.J. 1985, Relationships for modelling water effects in geotechnical centrifuge models. In Application of centrifuge modelling to geotechnical design, Edited by W.H. Craig, A.A. Balkema. Rotterdam, The Netherlands. Pp. 1-24. Hall, C.,1989, Water sorptivity of mortars and concretes: a review, Magazine of Concrete Research, 41, 51-61. Hall, C., 1994, Barrier performance of concrete: A review of fluid transport theory, Materials and Structures, 27, 291-306. Hall, C., and Hoff, W.D., 2002, Water in porous materials, Water Transport in Brick, Stone and Concrete, Spon press, pp. 52-53. Hansson, I.L.H., and Hansson, C.M., 1983, Electrical Resistivity Measurements of Portland Cement based Materials, Cement and Concrete Research, Vol. 13, pp. 675-683. Homand, F. et al. 2004. Permeability determination of a deep argillite in saturated and partially saturated conditions, In. Jr. of Heat and Mass Transfer, vol. 47, pp. 3517-3531 Kelham, S., 1988, A water absorption test for concrete, Magazine for Concrete Research, 40, 106-110. Khaleel, R., J.F. Relyea, and J.L. Conca. 1995. Evaluation of van Genuchten-Mualem relationships to estimate unsaturated hydraulic conductivity at low water contents. Wat. Resour. Res., Vol. 31(11), pp. 2659-2668. Khanzode, R. M, Vanapalli, S.K, and Fredlund, D.G., 2002, Measurement of soil-water characteristic curves for fine-grained soils using a small-scale centrifuge, Canadian Geotech. J., 39, 1209-1217. Labuza T., 1963. Creation of Moisture Sorption Isotherms for Hygroscopic materials. Sorption Isotherm Methods. International Symposium on Humidity and Moisture. (www.fsci.umn.edu/Ted_Labuza/PDF_files/papersCreation_Moisture _Isotherms.PDF) Richards, Lorenzo A. 1931. Capillary conduction of liquids through porous mediums, Physics, 1, 318-333 Lenhard, R. J. and Parker, J. C. 1987. A model for hysteretic constitutive relations governing multiphase flow, 2. Permeability-saturation relations. Wat. Resour. Res., Vol. 23(12), pp. 2197-2206.
93
Lim, P. C., Barbour, S. L., and Fredlund, D. G. 1998. The influence of degree of saturation on the coefficient of aqueous diffusion. Can. Geotech. J., Vol. 35, pp. 811-827. Ludirdja, D., Berger, R. L., and Young, J. F., 1989, Simple method for measuring water permeability of concrete, ACI Material Journal, Vol. 86, pp. 433-439 McCarter, W.J., 1996, Monitoring the influence of water and ionic ingress on cover-zone concrete subjected to repeated absorption, Cement Concrete and Aggregate, ASTM, 18(1), pp. 55-63. Mainguy, M., Coussy, O., and Baroghel-Bouny, V., 2001. Role of Air Pressure in Drying of Weakly Permeable Materials, Journal of Engineering Mechanics, Vol. 127, No. 6, pp. 582-592. Martys, N.S., 1995, Survey of Concrete Transport Properties and Their Measurement, NISTIR 5592, U.S. Department of Commerce, National Institute of Standards and Technology, Gaithersburg. Martys, N.S., and Ferraris, C.F., 1997, Capillary Transport in Mortars and Concrete, Cement and Concrete Research, Vol. 27, No.5, pp. 747-760. Martys, N.S., 1999, Diffusion in partially-saturated porous material, Materials and Structures, Vol. 32, October 1999, pp. 555-562. McCarter, W.J., Chrisp, T.M., Butler, A., and Basheer, P.A.M, 2001, Near-surface sensors for conduction monitoring of cover-zone concrete, Construction and Building Materials, 15, pp. 115-124. Meyer, P.D., Saripalli, K. P. and Freedman, V. L., 2004. Near- Field Hydrology Data Package for the Integrated Disposal Facility 2005 Performance Assessment. PNNL-14700, Pacific Northwest National laboratory, Richland, Washington Millington, R.J., 1959, Gas diffusion in porous media, Science, Vol. 130, pp. 100-102.
Millington, R.J. and Quirk, J.P., 1961, Permeability of Porous Solids, Transactions of the Faraday Society, 57, 1200-1207. Mitchell, R.J. 1991, Centrifuge modelling as a consulting tool, Canadian Geotechnical Journal, 28: 162-167. Mitchell, R.J., 1994, Matrix suction and diffusive transport in centrifuge models, Canadian Geotechnical Journal, 31, 357-363.
94
Monlouis-Bonnaire, J.P., Verdier. J., and Perrin, B., 2004, Prediction of the relative permeability to gas flow of cement-based material, Cement and Concrete Research, Vol. 34, pp. 737-744. Monofore, G.E., 1968, The Electrical Resistivity of Concrete, Journal of The PCA Research and Development Laboratories, pp. 35-48. Mualem, Y., 1976, A new model for predicting the hydraulic conductivity of unsaturated porous media. Water Resour. Res., 12, 513-522. Mualem, Y., 1976, Hysteresis models for prediction of the hydraulic conductivity of unsaturated porous media, Water Resour. Res., 12(6), 1248–1254. Nilsson, L.O., 1993, Penetration of chlorides into concrete structures – an introduction and some definitions, Chloride Penetration Into Concrete Structures, pp. 7-17. Nilsson, L.O., Poulsen, E., Sandberg, P., Sorensen, H.E., and Klinghoffer, O., 1996, HETEK- Chloride penetration into concrete, State-of-the Art, Transport Processes, Corrosion initiation, Test Methods and Prediction Models, Report No. 53, The Road Directorate, Copenhagen. Nyame, B. K., 1985. Permeability of Normal and Lightweight Mortars, Magazine of Concrete Research, Vol. 37 (130), pp. 44-48. Nyame, B. K., and Illston, J. M., 1981, Relationship between Permeability and Pore Structures of Hardened Cement Paste, Magazine of Concrete Research, Vol.33(116), pp. 139-146. Parker, J. C. and Lenhard, R. J. 1987. A model for hysteretic constitutive relations governing multiphase flow, 1. Saturation-pressure relations. Wat. Resour. Res., Vol. 23(12), pp. 2187-2196. Polder, R. B., and Peelen, W. H. A., 2002. Characterisation of chloride transport and reinforcement corrosion in concrete under cyclic wetting and drying by electrical resistivity, Cement and Concrete Composite, Vol. 24, pp. 427-435. Pont, S.D., and Ehrlacher, A., 2004. Numerical and experimental analysis of chemical dehydration, heat and mass transfer in a concrete hollow cylinder submitted to high temperatures, Int. J. of Heat and Mass Transfer, Vol. 47, pp. 135-147 Pruess, K., Oldenburg, C., and Moridis, G., 1999. TOUGH2 User’s Guide, Version 2.0, Lawrence Berkeley National Laboratory, Berkeley. Pruess, K., Simmons, A., Wu, Y.S., and Moridis, G., 1996. TOUGH2 Software Qualification Lawrence Berkeley National Laboratory, Berkeley, California.

95
Puyate, Y. T. and Lawrence, C. J., 1998, Chloride transport models for wick action in concrete at large Peclet number, Physics of Fluids , Vol. 10, No. 3. Puyate, Y. T. and Lawrence, C. J., 1998. Wick action at moderate Peclet number, Physics of Fluids , Vol. 10, No. 8. Richards, L.A. 1941. A pressure-membrane extraction apparatus for soil solution. Soil Science, Vol. 51, No. 5, pp. 377–386. Ritcey, A.C., and Wu, Y.S. 1999. Evaluation of the effect of future climate change on the distribution and movement of moisture in the unsaturated zone at Yucca Mountain, NV. Journal of Containment Hydrology, vol. 38, pp. 257-279. Rockhold, M. L., Fayer, M. J. and Heller, P.R., 1993. Physical and Hydraulic Properties of Sediments and Engineered Materials Associated with Grouted Double-Shell Tank Waste Disposal at Hanford. PNL-8813, Pacific Northwest laboratory, Richland, Washington Romero, E., Gens, A., and Lloret, A. 2001. Temperature effects on the hydraulic behaviour of an unsaturated clay. Geotechnical and Geological Engineering, 19, pp. 311–332. Scheidegger, A.E., 1974, The Physics of Flow Through Porous Media, University of Toronto Press, Toronto. Saetta, A.V., Scotta, R.V. and Vitaliani, R.V., 1993, Analysis of Chloride Diffusion into Partially Saturated Concrete, ACI Materials Journal, 90-M47. Savage, B.M. and Janssen, D.J., 1997, Soil Physics Principles Validated for Use in Predicting Unsaturated Moisture Movement in Portland Cement Concrete, ACI Materials Journal, 94-M8. Samson, E., Marchand, J., Snyder, K.A., and Beaudoin, J.J., 2005, Modeling ion and fluid transport in unsaturated cement systems in isothermal conditions, Cement and Concrete Research, Vol. 35, pp.141-153. Singh, D.N., and Gupta, A.K., 2000, Modelling hydraulic conductivity in a small centrifuge, Canadian Geotechnical Journal, 37, 1150-1155. Singh, D.N., and Kuriyan, S.J., 2002, Estimation of hydraulic conductivity of unsaturated soils using a geotechnical centrifuge, Canadian Geotechnical Journal, 39, 684-694. Shi, C., 2004, Effect of mixing proportions of concrete on its electrical conductivity and the rapid chloride permeability test results, Cement and Concrete Research, 34, 537-545.

96
Standard Method of Test for Resistance of Concrete to chloride ion Penetration, 1980, T259-80, American Association of State Highway and Transportation Officials, Washington, D.C., U.S.A. Stanish, K.D., Hooton, R.D., and Thomas, M.D.A., 1997, Testing the Chloride Penetration Resistance: a Literature Review, FHWA Contract DTFH61-97-R-00022. Sosoro, M., and Reinhardt, H.W., 1996, The Modelling of Microstructure and Its Potential for Studying Transport Properties and Durability, Jennings, H., et al. (eds), Kluwer Academic Publishers, Netherlands, 443. Tang, L., and Nilsson, L. O., 1992. Rapid Determination of the Chloride Diffusivity in Concrete by Applying an Electric Field, ACI Materials Journal, 89(1), pp. 49-53. Tang, A., and Cui, Y., 2005. Controlling suction by the vapour equilibrium technique at different temperatures and its application in determining the water retention properties of MX80 clay. Can. Geotech. J., Vol. 42, pp. 287-296. van Genuchten, M.T., 1978, Calculating the Unsaturated Hydraulic Conductivity with a New Closed Form Analytic Model. Report 78-WR-08, Princeton University, Princeton, NJ van Genuchten, M.Th., 1980. A closed-form equation for predicting the hydraulic conductivity of unsaturated soils. Soil Sci Soc. Am J,. 44:892-898. van Genuchten, M.Th., Leij, F.J., and Yates, S.R., 1991, The RETC Code for Quantifying the Hydraulic Functions of Unsaturated Soils, U.S. Salinity Laboratory, U.S. Department of Agriculture, Agricultural Research Service, Riverside, California. Khaleel, R., J.F. Relyea, and J.L. Conca. 1995. Evaluation of van Genuchten-Mualem relationships to estimate unsaturated hydraulic conductivity at low water contents. Wat. Resour. Res., 31(11):2659-2668. Webb, S.W., and Phelan, J.M. 2003. Implementation of land surface boundary conditions in TOUGH2. TOUGH Symposium 2003 Proceedings. Weyers, R. E. and Cady, P.D. 1987. Deterioration of Concrete Bridge Decks from Corrosion of Reinforcing Steel. Concrete International, American Concrete Institute, v. 9, No. 1, pp. 15-20. Wexler, A. and Hasegawa, S. "Relative humidity-temperature relationship of some saturated salt solutions in the temperature range 0° to 50°C". J. Research NBS 53, 19 (1954) Whitaker, S., 1977, Simultaneous heat, mass and momentum transfer in porous media: a theory of drying porous media, Adv. Heat Transfer, 119–203;

97
Whittington, H.W., McCarter, J., and Forde, M.C., 1981, The conduction of electricity through concrete, Magazine of Concrete Research, Vol. 33, No. 114, pp. 48-60. Whiting, D., and Cady, P.D., 1992, SHRP-S/FR-92-109, Strategic Highway Research program, National Research Council, Washington, DC.