water disposal: disposal wells, recycling and seismic risks€¦ · water disposal: disposal wells,...
TRANSCRIPT
Water Disposal: Disposal Wells, Recycling and Seismic Risks
George E. King

Seismic Risk – How has it changed?
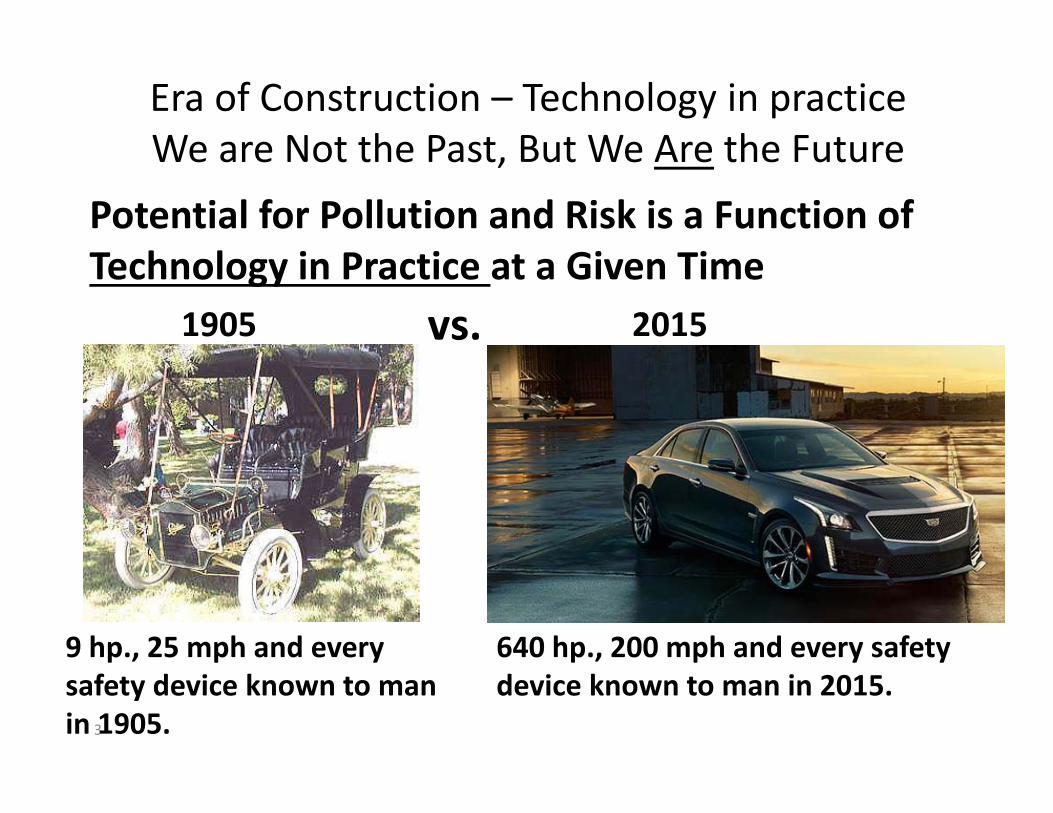
Era of Construction – Technology in practiceWe are Not the Past, But We Are the Future
3
Potential for Pollution and Risk is a Function of Technology in Practice at a Given Time
1905 vs. 2015
9 hp., 25 mph and every safety device known to man in 1905.
640 hp., 200 mph and every safety device known to man in 2015.

Pollution Potential ‐ Changes with Time.Technology is the Driver.
8/31/2015 4
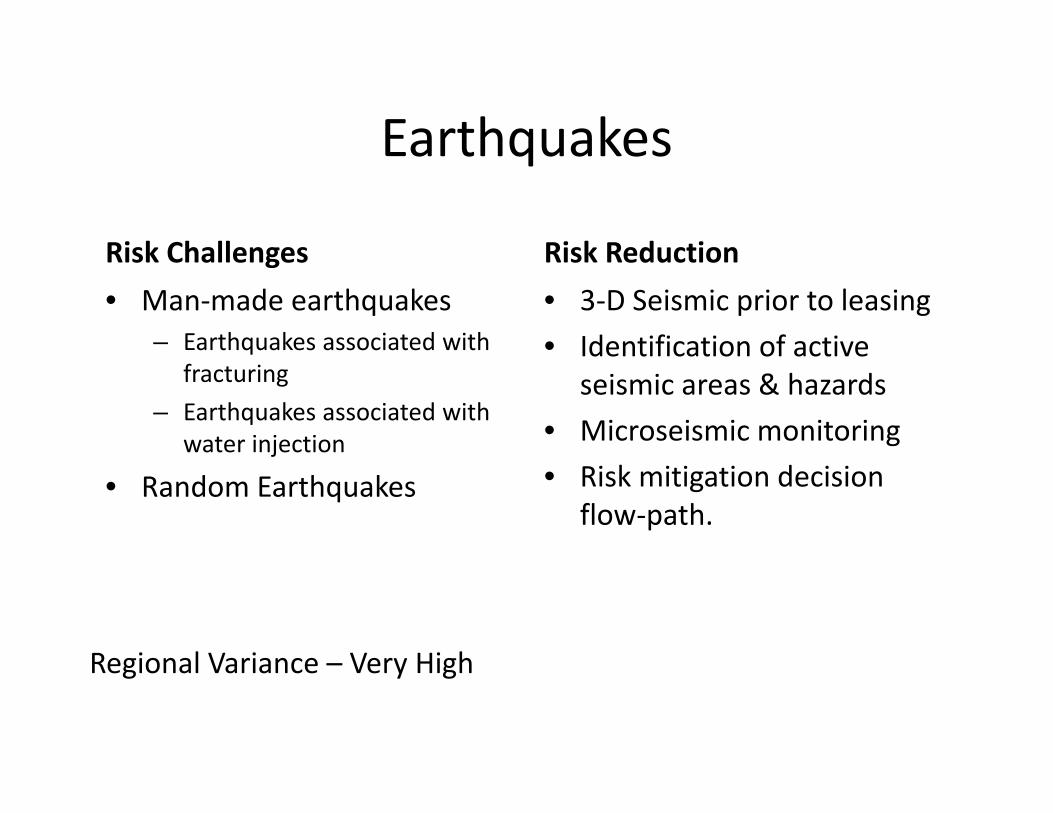
Earthquakes
Risk Challenges• Man‐made earthquakes
– Earthquakes associated with fracturing
– Earthquakes associated with water injection
• Random Earthquakes
Risk Reduction• 3‐D Seismic prior to leasing• Identification of active
seismic areas & hazards• Microseismic monitoring• Risk mitigation decision
flow‐path.
Regional Variance – Very High
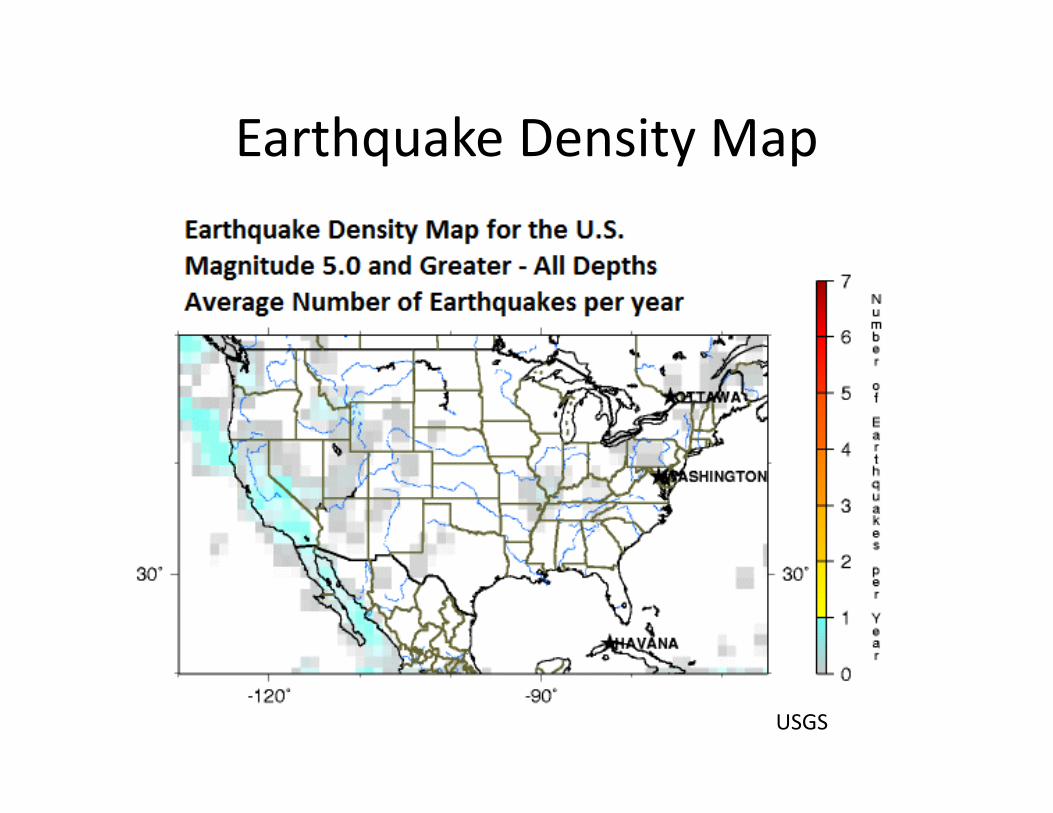
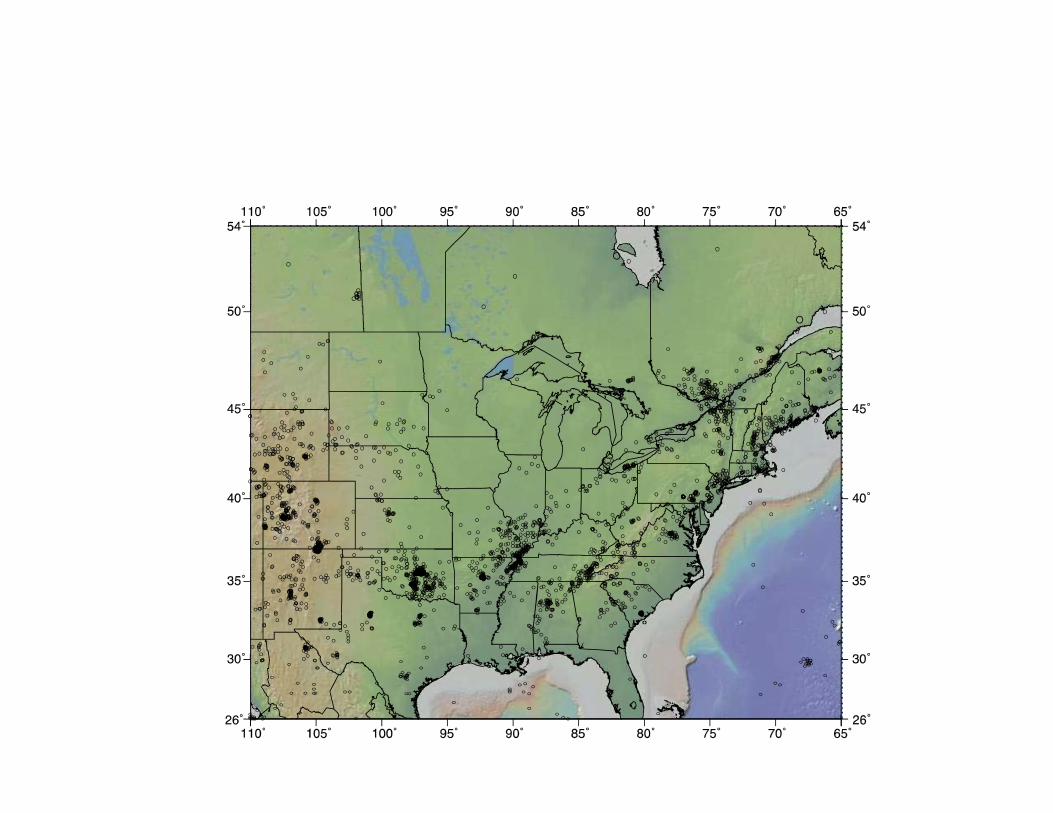
Earthquake Density Map
USGS
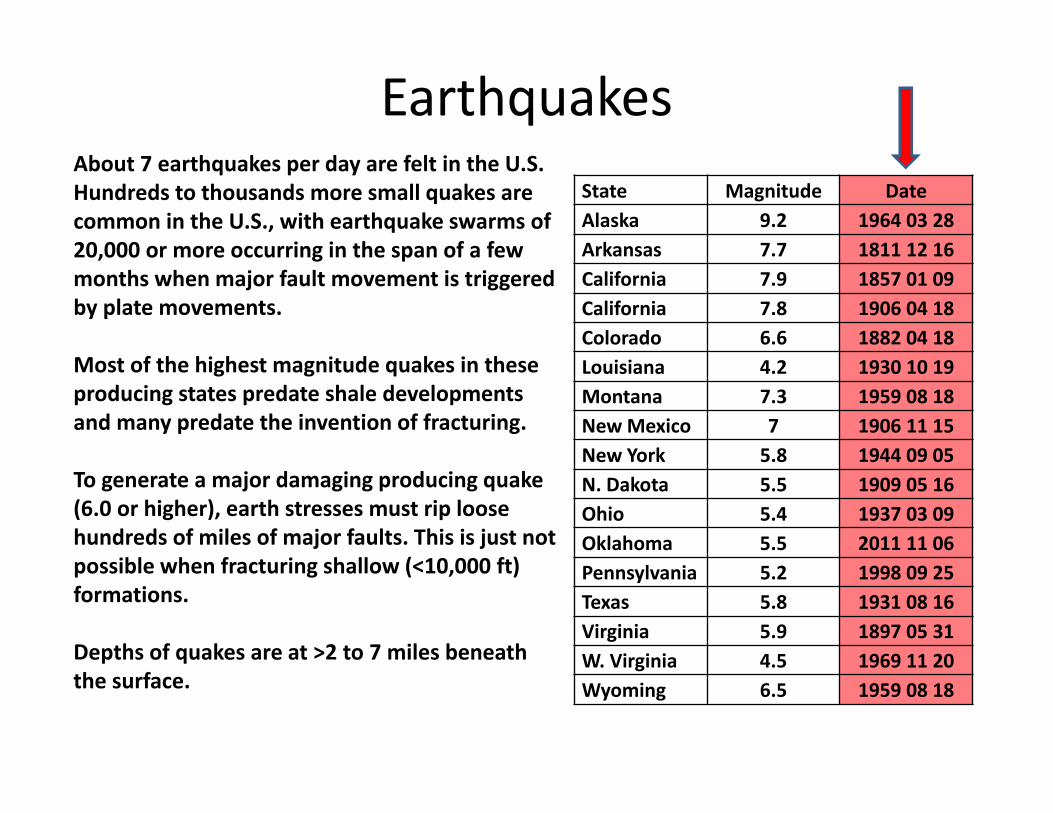
EarthquakesState Magnitude DateAlaska 9.2 1964 03 28Arkansas 7.7 1811 12 16California 7.9 1857 01 09California 7.8 1906 04 18Colorado 6.6 1882 04 18Louisiana 4.2 1930 10 19Montana 7.3 1959 08 18New Mexico 7 1906 11 15New York 5.8 1944 09 05N. Dakota 5.5 1909 05 16Ohio 5.4 1937 03 09Oklahoma 5.5 2011 11 06Pennsylvania 5.2 1998 09 25Texas 5.8 1931 08 16Virginia 5.9 1897 05 31W. Virginia 4.5 1969 11 20Wyoming 6.5 1959 08 18
About 7 earthquakes per day are felt in the U.S. Hundreds to thousands more small quakes are common in the U.S., with earthquake swarms of 20,000 or more occurring in the span of a few months when major fault movement is triggered by plate movements.
Most of the highest magnitude quakes in these producing states predate shale developments and many predate the invention of fracturing.
To generate a major damaging producing quake (6.0 or higher), earth stresses must rip loose hundreds of miles of major faults. This is just not possible when fracturing shallow (<10,000 ft) formations.
Depths of quakes are at >2 to 7 miles beneath the surface.

Risk Mitigation• If, and only if, induced seismicity suspected
• And if surface motions exceed thresholds: amber/red traffic light
• Goal is to manage and continue operations safely
Investigation ‐ steps
1. Characterize event – magnitude, location, depth2. Assess surface effects – motion, impact (distress, damage)
3. Calibrate seismicity to operations4. Re‐visit subsurface data – faults?5. Improve monitoring
Investigation ‐ steps
1. Characterize event – magnitude, location, depth2. Assess surface effects – motion, impact (distress, damage)
3. Calibrate seismicity to operations4. Re‐visit subsurface data – faults?5. Improve monitoring
Re‐evaluation ‐ steps
1. Refresh evaluation – re‐analyze2. Analyze impact – ground motion studies, damage3. Perform geomechanical and hydrologic analysis & modeling
• Fault, stress, connection route of fluids• Pore pressure analysis
4. Explore all possible causes – e.g. geothermal, meteorological, production, volcanic
5. Catalog findings to inform mitigation actions
Re‐evaluation ‐ steps
1. Refresh evaluation – re‐analyze2. Analyze impact – ground motion studies, damage3. Perform geomechanical and hydrologic analysis & modeling
• Fault, stress, connection route of fluids• Pore pressure analysis
4. Explore all possible causes – e.g. geothermal, meteorological, production, volcanic
5. Catalog findings to inform mitigation actionsAction
1. Take steps defined in Risk Management Plan (“Traffic Lights”)
2. Expand data gathering, monitoring, and analysis3. Implement outreach plan4. As necessary modify injection parameters
Action
1. Take steps defined in Risk Management Plan (“Traffic Lights”)
2. Expand data gathering, monitoring, and analysis3. Implement outreach plan4. As necessary modify injection parameters
As necessary, utilize evaluationtool boxes
AXPC / Industry inducedseismicity SME presentation
9
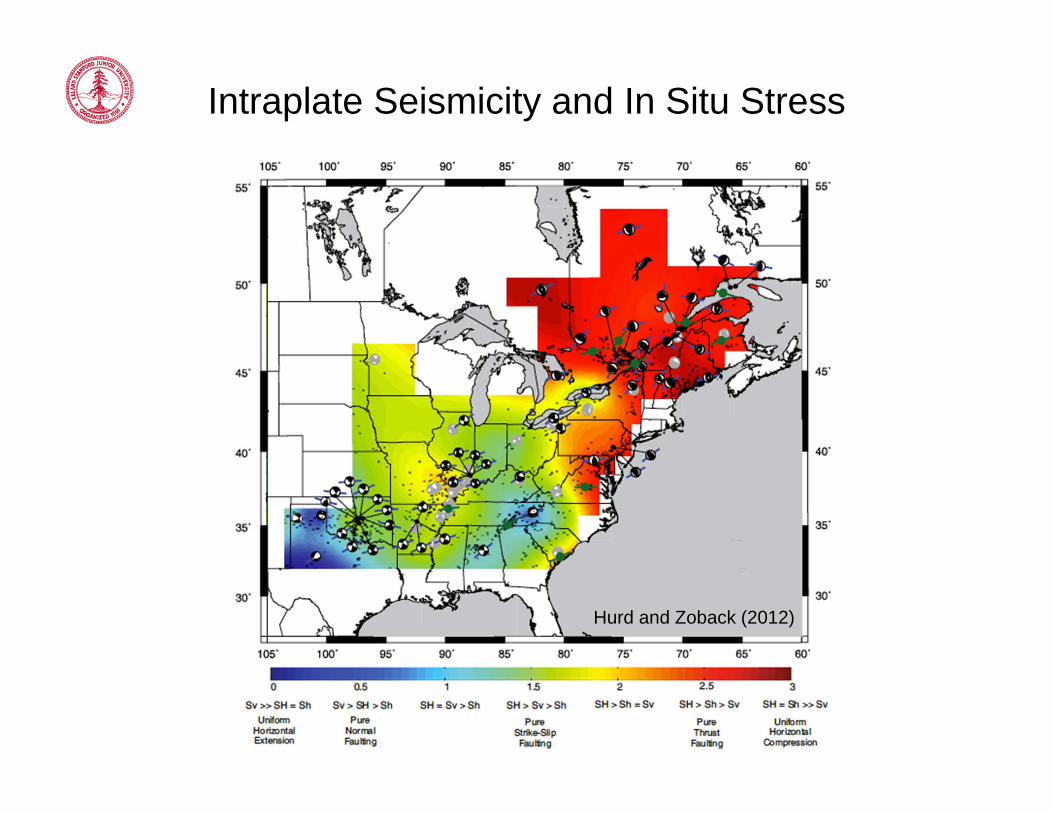
Intraplate Seismicity and In Situ Stress
Hurd and Zoback (2012)
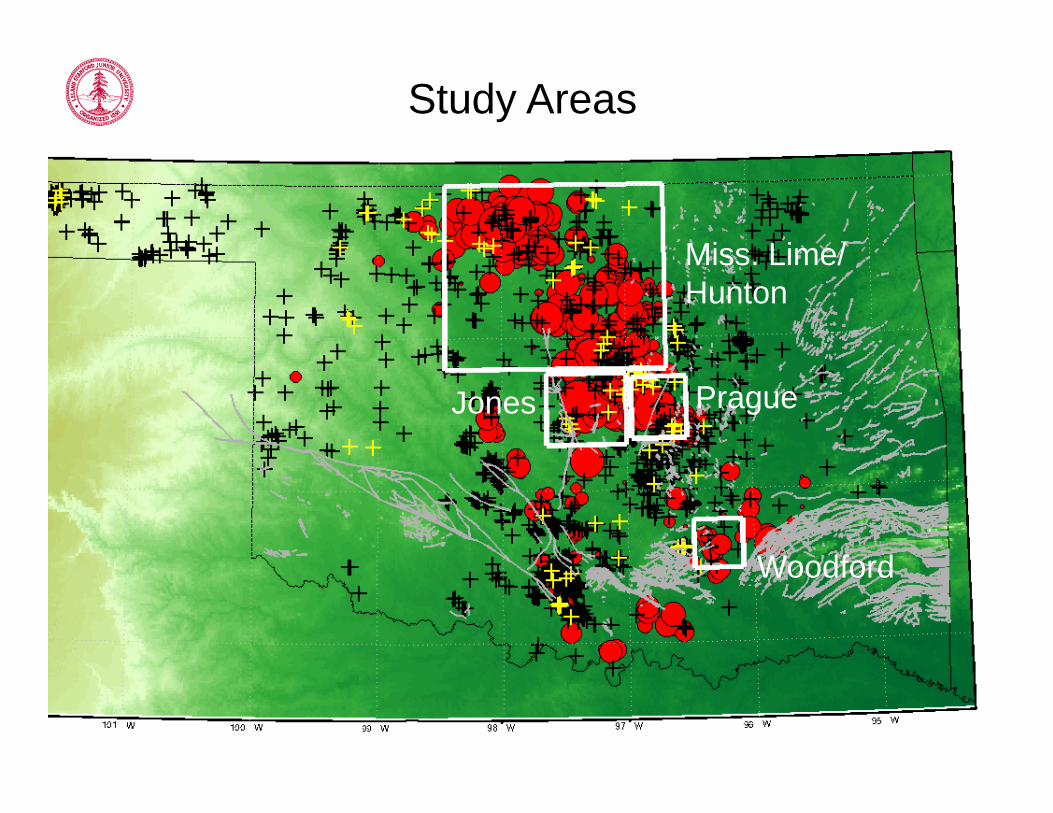
Study Areas
Miss. Lime/Hunton
Woodford
PragueJones
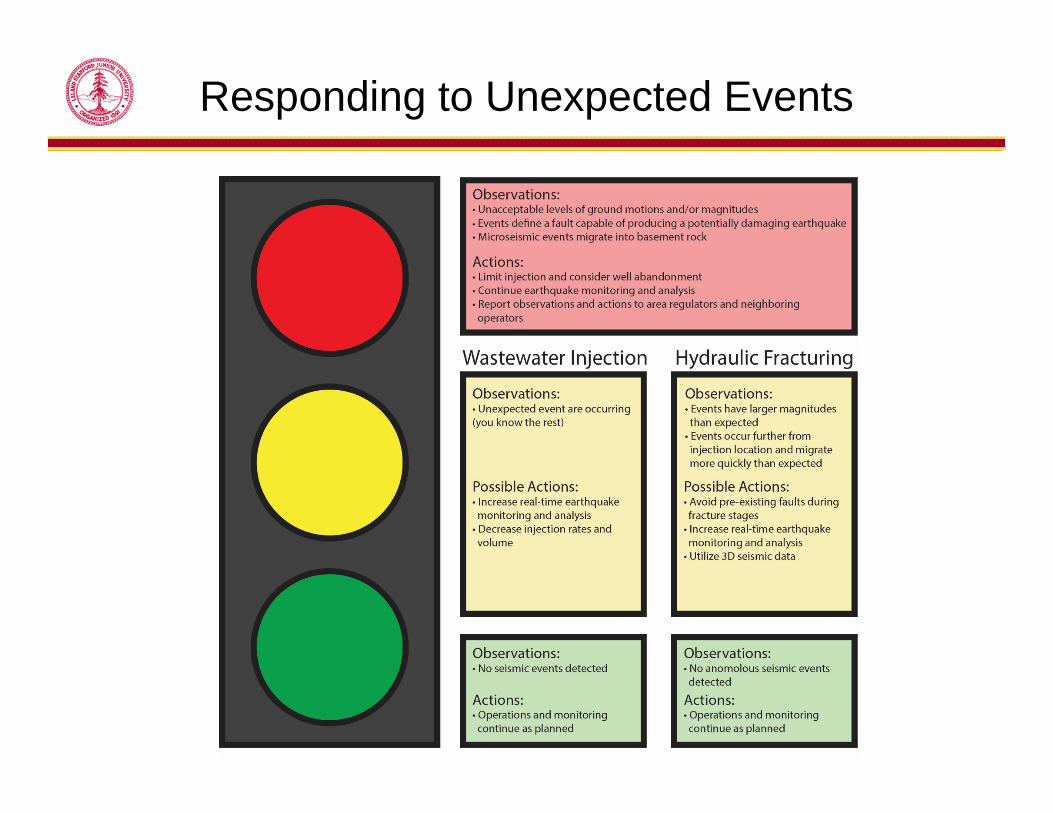
Responding to Unexpected Events
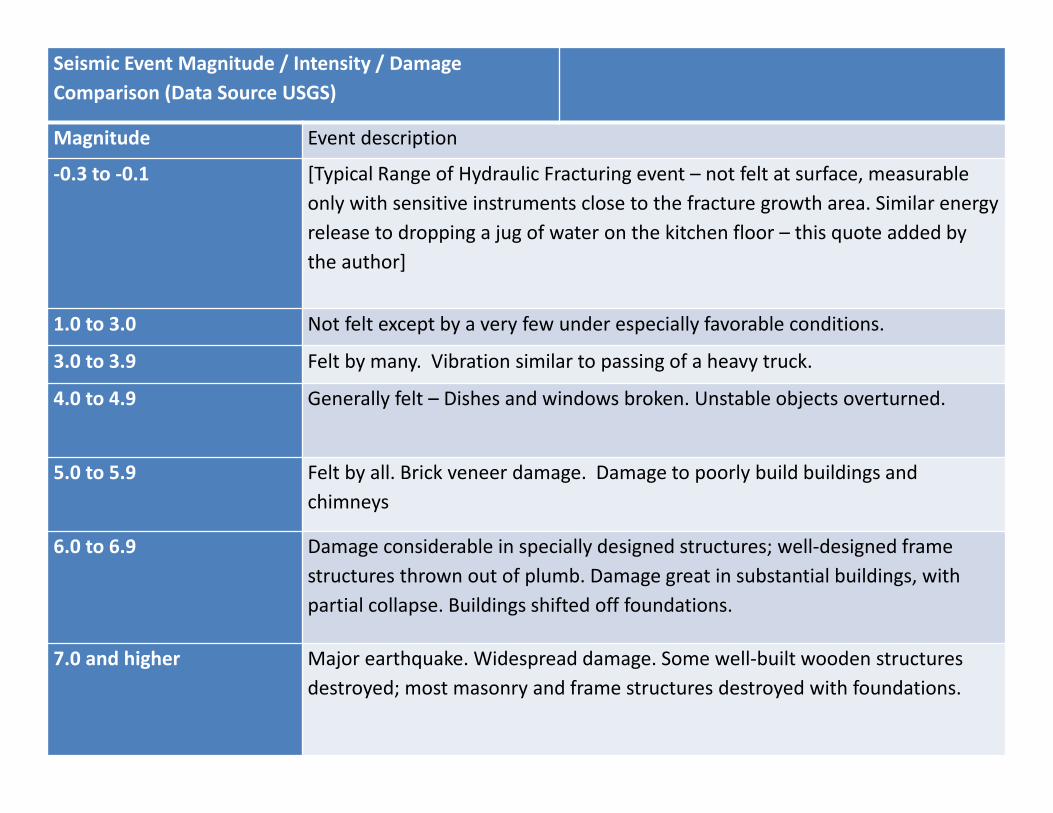
Seismic Event Magnitude / Intensity / Damage Comparison (Data Source USGS)
Magnitude Event description
‐0.3 to ‐0.1 [Typical Range of Hydraulic Fracturing event – not felt at surface, measurable only with sensitive instruments close to the fracture growth area. Similar energy release to dropping a jug of water on the kitchen floor – this quote added by the author]
1.0 to 3.0 Not felt except by a very few under especially favorable conditions.
3.0 to 3.9 Felt by many. Vibration similar to passing of a heavy truck.
4.0 to 4.9 Generally felt – Dishes and windows broken. Unstable objects overturned.
5.0 to 5.9 Felt by all. Brick veneer damage. Damage to poorly build buildings and chimneys
6.0 to 6.9 Damage considerable in specially designed structures; well‐designed frame structures thrown out of plumb. Damage great in substantial buildings, with partial collapse. Buildings shifted off foundations.
7.0 and higher Major earthquake. Widespread damage. Some well‐built wooden structures destroyed; most masonry and frame structures destroyed with foundations.