water consumption...
TRANSCRIPT

1
Optimization of Energy and Water
Consumption in Corn–based Ethanol Plants
Elvis Ahmetović, Mariano Martín, Ignacio E. Grossmann1
Department of Chemical Engineering, Carnegie Mellon University,
Pittsburgh PA 15213
January 2010
Abstract
In this paper we study the simultaneous energy and water consumption in corn–based ethanol plants.
The goal is to reduce the freshwater consumption and waste water discharge. We consider the corn-based
ethanol plant reported in Karuppiah et al. (2008). First, we review the major alternatives in the optimization of
energy consumption and its impact in water consumption. Next, for each of the alternatives we synthesize an
integrated process water network. This requires closing the loops for process and cooling water and steam
and implementing the proper treatments for the water streams. We show that minimizing energy consumption
leads to process water networks with minimum water consumption. As a result, freshwater use is reduced to
1.17 gal water /gal ethanol, revealing that it is possible to achieve levels of freshwater consumption that are
significantly lower than the ones in current industrial operation and waste water is no longer discharged.
Keywords: Energy, Biofuels, Alternative fuels, Water, Ethanol
1 Corresponding author. Tel.: +1-412-268-3642; Fax: +1-412-268-7139. Email address: [email protected] (I.E. Grossmann)

2
1. Introduction
Water is the most valuable raw material for life on earth, but its wide availability in many regions in the
world has made its price to be inexpensive. Fig. 1 shows the price of water and its increase in different
countries over certain periods of time. In spite of an average annual increase of 6.7% according to the
GWI/OECD (2008), the price still remains low. As water is essential for economic development and for
maintaining healthy ecosystems, and as world population grows and development requires increased
consumption of water for the domestic, agricultural and industrial sectors, the pressure on water resources
intensifies. Fig. 2 shows the water availability across the world. Based on the assessment on water resources,
two thirds of the world population will face water stress by year 2025 (Rosegrant et al, 2002). It is also
estimated that by 2025, industrial water usage (which includes utility cooling and heating, processing,
transportation, air conditioning, cleaning, etc.) will climb to 235 km3, accounting for about 11% of the total world
water consumption (Sparks Companies, 2003; Rosegrant et al, 2002). Thus, water consumption has become a
major concern (Elcock, 2008; Wenchiu, 2009) making water resource management an important operational
and environmental issue. In particular, the increasing costs of dependable water supplies and wastewater
disposal have increased the economic incentive for implementing technologies that are more environmentally
friendly, and that can ensure efficient use of water resources, including the treatment and recycling of waste
water (Petrakis, 2008) as shown later in this paper.
The task of synthesizing optimal process water networks has been performed using two different
approaches:
(a) Conceptual engineering approach based on the water pinch heuristics and engineering
experience (Wang and Smith, 1994a, 1994b, 1995; Kuo and Smith, 1998; Forstmeier, 2005; Foo, 2009)
(b) Systematic methods based on mathematical programming (Takama et al., 1980; Doyle and Smith,
1997; Alva-Argaez, 1999; Bagajewicz, 2000; Bagajewicz et al, 2000; Saeedi and Hosseinzadeh, 2006;
Karrupiah & Grossmann, 2006)

3
Synthesis of heat exchanger networks has also been the topic of extensive research for a long time
(Linnhoff et al, 1982; Papoulias & Grossmann, 1983). However, research concerning simultaneous synthesis
of process water and heat exchanger networks is not at the same level of development. The importance of
simultaneous minimization of energy and water was first addressed by Savelski and Bagajewicz (1997).
Conceptual techniques (Savulescu and Smith, 1998; Zheng et al., 2003; Savulescu et al., 2002, 2005a,b; Feng
et al., 2008) and mathematical approaches have been used since then (Bagajewicz et al ,1998; Du et al.,
2004; Liao et al., 2008; Dong et al., 2008; Bogataj and Bagajewicz, 2008; Leewongtanawit and Kim, 2008; Kim
et al., 2009; Xiao Feng et al., in press). Recently, a combined approach, conceptual and mathematical
modeling, has been proposed by Manan et al (2009). Their method consists of three steps, namely, setting the
minimum water and wastewater targets; design of minimum water utilization network, and finally, heat recovery
network design. However, it is restricted to one contaminant which makes its application to be rather limited.
a) b)
Figure 1.‐ a) Prices of water (http://www.obsamericas.com/ecobella/wp‐content/uploads/2009/08/China.jpg) & b) Price increase OCDE 2001

4
Figure 2. Water availability across the world (IWMI 2006)
2. Problem statement
We consider in this paper the corn-based ethanol plant reported in Karuppiah et al. ( 2008). We
review first the major alternatives in the optimization of energy consumption. Next, for each of the alternatives
we synthesize an integrated process water network. This requires closing the loops for process water and
steam in order to establish the actual demand of water in all process units. In this case study we show that
minimizing energy consumption leads to process water networks with minimum water consumption.
Furthermore, we also show that it is possible to achieve levels of freshwater consumption that are significantly
lower than the ones in current operation.

5
The paper is organized as follows. Section 3 providess an overview of the current consumption of
energy and water in plants for the production of bioethanol from growing corn grains to fuel grade ethanol.
In section 4, we revisit the results obtained in the paper by Karuppiah et al (2008) to identify the
energy consumption and cooling utilities used in the different stages of the optimization denoted along this
paper from (a) to (d): (a) superstructure optimization with no heat integration, (b) superstructure optimization
with heat integration, (c) substitution of distillation columns by multieffect columns in the optimized
superstructure followed by heat integration and finally (d) alternative (c) with the optimization of reflux ratio in
the multieffect columns.
Due to the fact that water was not considered in the model by Karuppiah et al (2008), in section 5 we
design the loops for cooling water and steam to establish the actual demand of water for bioethanol production
for the cases (a) to (d) cited above. Thus, we introduce the modeling of the operation of the boiler and the
cooling tower. No treatment for the waste water is considered at this point. We show in detail the application of
the closed loops to cases (a) and (d) cited before, but we report the water use for the two other cases too.
Finally, in section 6 we implement the recently proposed global optimization approach for the
synthesis of process water networks by Ahmetović and Grossmann (2009) to the cases (a) – (d) from the
paper by Karuppiah et al (2008). Two contaminants, suspended solids and organics (e.g. ethanol, organic
acids, cells), are considered, and different specific treatment units are used. Only two examples are shown in
detail in this section, but we report the results for the application of the water networks to all the four cases (a)
to (d). It is shown that the energy optimization achieved in Karuppiah’s et al paper (Karuppiah et al, 2008)
together with the implementation of the water network, leads to a minimum water usage value of 1.17 gal water
/gal ethanol, the lowest that the authors are aware of.
3. Corn-based ethanol production process
Ethanol production has become one of the most important alternatives for the production of
renewable biofuel due to its compatibility with the current automobiles (Cole 2007) and the supply chain of

6
gasoline. Thus, governmental policies have been supporting its production. In 2007, President Bush in his
State of the Union Address announced the so called 20–10 Plan asking for a reduction of 20% of conventional
fuels by 2017 as well as proposing an Alternative Fuels Standard (AFS) of 35 BGPY by 2017 increasing the
mandates of the previous acts, (Bush, 2007).
Currently, more than 95% of U.S. bioethanol is produced using corn. In spite of bioethanol’s
environmental benefits like lower emissions (Chiu et al, 2009), the volume of production of corn ethanol to
meet this last policy (see Fig. 3) has raised questions regarding its technological feasibility as an alternative
fuel. A discussion has been presented on the availability of land for corn production (Hart et al, 2003;
Hammond, 2008; Keeney, 2009; EU, 2007; USDA, 2009), the energy demand either reporting favorable
values (Shapouri, Duffield, and Wang, 2002; Shapouri and others, 2004; Archer, Daniels, Midland (McCain,
2003), Marland & Turhollow ,1991; Morris & Ahmed, 1992; Shapouri, 1995; Lorentz & Morris, 1995; Wang,
1999; Levelton Engineering, 2000; Graboski, 2002; Andres, 2002) or negative returns (Ho, 1989; Keeney &
DeLuca, 1992; Citizens for Tax Justice, 1997; Giampietro et al, 1997; Youngquist, 1997; Pimentel, 1998, 2001,
2003; NPRA, 2002; Croysdale, 2001; CalGasoline, 2002; Lieberman, 2002; Ferguson, 2003, 2004; Patzek,
2004) and the emissions, where there seems to be an agreement in favor of biofuel compared to gasoline.
Apart from these concerns, the National Research Council has recently warned that corn ethanol production
increases may significantly impact water consumption, highlighting ethanol’s dependence on water (NRC,
2008).
In this paper, we focus on the problem of water consumption. In order to produce bioethanol, water is
needed at two stages of the process. In the first one, irrigation is required to grow the corn. In the second
stage, water is used as raw material or utility in the production process.

7
Figure 3. US. Renewable fuels production and requirements. (Source US dept of energy)
Generally speaking, the biomass needed to produce one liter of biofuel (under currently available
conversion techniques) evaporates between 250 and 1000 gal of water (CA, 2007). In particular, corn
production on irrigated lands accounts for a major proportion of water use in agriculture, and often involves
depletion of aquifers. The corn devoted to ethanol production represents 13.3% of the total harvested corn. It
is reported that between 263 and 832 gallons water per gallon of ethanol are necessary to produce corn,
(Aden, 2007; Elcock, 2008; Jacosen, 2009; Wenchiu, 2009). For sugar cane, values ranging between 927 and
1391 gallons of water per gallon of ethanol are reported (SIU, 2007). As potable water becomes less available
in developed and developing countries, priorities for water use may affect the development of biofuel
production. (Keeney, 2006; NRC, 2008; Keeney, 2009; Jacobsen, 2009).

8
However, not all the results are so pessimistic because irrigation depends heavily on the region. That
is the case of the production of sugar cane in Brazil whose climate conditions, a 365-day growing season and
ample rainfall at the right times, allows sugarcane production at high yields with minimal or no irrigation (Leite,
2009). Moreover, different feedstocks may reduce water needs. For example, switchgrass, a perennial warm-
season grass grown for decades on marginal lands that are not well suited for conventional crop production.
Different studies have been carried out to analyze the impact of the current policies in favor of the
production of biofuels. Fig. 4 shows that the effect of biofuels production policies can be important in certain
regions in terms of water consumption, but on the whole, it will affect less than 5%. In contrast, if the amount to
be produced is far larger in order to fully replace the current consumption of gasoline and diesel, the
production regions must be carefully selected not to have a big impact on food production and water
availability.
Figure 4. Effect of the production of ethanol on water reserves (Adapted from: De fraiture et al 2008)

9
The second stage in water consumption for the production of ethanol is in the production process
itself. The ethanol production processes used so far, like wet mill or dry mill, are water intensive. Sometimes
the process water required is more than the one that is available locally. A wide range of water consumption
for the conversion process is reported, ranging from about 3 gallons of water per gallon of produced ethanol to
as much as 15 gallons of water per gallon of produced ethanol (Keeney, 2006). Recycling of this process
water becomes important. Claims such as "zero liquid discharge" may elicit hope for very low water
consumption of bioethanol plants.
Approximately three quarters of the bioethanol produced in the United States employs the dry milling
process (Gen Solutions, 2007). To identify the water consumption we describe the general flowsheet for the
ethanol production process in Fig. 5. Corn grain is first pretreated so that the physical and chemical structures
are broken down into the fermentable sugars. Milling breaks the shell of the grain so that saccharification and
liquefaction enzymatic processes can have better efficiency in liberating the sugars. Fermentation takes place
under anaerobic conditions using Saccharomyces cerevisiae, where ethanol concentration must be kept low
due to its toxicity for the yeast. The main product of the process is ethanol. The liquid phase is separated from
the solid phase by means of mechanical separation. The solids are dried to produce distiller’s dry grains with
solubles (DDGS), the only byproduct worth selling as animal feed. Ethanol is purified to its fuel grade by
distillation and further water removal (Jacques et al, 1999).
According to the literature (Pfromm, 2008) the best possible water consumption for corn dry grind
process is 2.85 gal water / gal ethanol, or a more realistic 4 gal water per gal of ethanol in case of considering the
water blowdown and evaporated from the cooling tower, as shown in Table 1 from Aden (2007).
Table 1. Water usage for ethanol production (Aden 2007)
Fresh Water Demands Corn Ethanol: Dry Grind
Cellulosic Ethanol: Biochemical
Cellulosic Ethanol: Thermochemical
Cooling tower make up (%) 68 71 71 Boiler and process make up (%) 32 29 29
Overall Water demand (gal H2O/ gal EtOH) 3-4 6 1.9

10
Figure 5. Dry milling ethanol production process.
4. Review of energy optimization in corn-based ethanol plant.
Given the dry milling ethanol process in Fig. 5, Karuppiah et al (2008) optimized a superstructure for a
plant producing 60M gal ethanol/yr. The plant consists of three different sections. The first section involves the
pretreatment of the corn grain to break the physical and chemical structure of the corn making the sugars
accessible for fermentation. The process units employed are grinding, direct contact with steam,
saccharification and liquefaction. At the end of this sequence of physical and chemical treatments, sugars are
liberated from the grain. The second section is the fermentation of the sugars, mainly glucose, into ethanol
using a yeast, Saccharomyces cerevisiae. Water must be fed to the reactor to keep the ethanol concentration
below the toxic levels for the yeast. After fermentation, two alternatives were proposed for the separation of
solids from the slurry exiting the fermentor: a) mechanical separation before the beer column (BC1), or b)
after the beer column. The third section comprises the technologies used for the purification and dehydration
of ethanol to fuel grade. Three different options were considered: (1) A rectification column which can
concentrate ethanol to the azeotropic composition, (2) adsorption of water in corn grits, and (3) molecular
sieves. The superstructure is optimized in terms of energy consumption. The optimized flowsheet is shown in
Fig. 6. The separation of the solids takes place before the beer column, while the dehydration stage consists of

11
the rectification column together with adsorption in corn grits with final stage in the molecular sieves. In Fig. 6
neither the heat exchanger network nor any structural changes to the distillation columns are shown.
The Karuppiah et al’s (2008) paper showed a great reduction in energy consumption, from 79.00 MW
(case a in Fig. 7) to 35.88 MW for the case with the overall heat integration in the plant and including
multieffect distillation columns (case d in Fig 7). The reduction in the energy consumption led to an important
reduction of the cooling requirements for the plant, from 58.98 MW to 21.50 MW as shown in Fig. 7.
Figure 6. Optimal design of the corn-based bioethanol plant.

12
Figure 7. Reduction of energy consumption and cooling needs by heat integration in the corn-based ethanol plant (Case studies: a- Superstrucure optimization , b-Superstructure + HEN; c-Superstructure + HEN + multieffect distilation, d-
Superstrucure + HEN + multieffect distilation + optimized reflux ratio)
As a result of the use of cooling and process water ( assuming T for the cooling water equal to 8
ºC), the water consumption is reduced from 250 gal/gal of ethanol to 100 gal/gal of ethanol due to energy
optimization, as seen Fig. 8. If no loops are used to recycle and reuse the water, those consumptions could be
impractical. Thus, closed loops for water consumption must be applied.
Figure 8.- Reduction in the water consumtion as a result of energy integration without water network.

13
5. Closed loops for cooling water and steam.
Karuppiah et al (2008) did not consider closed loops for the cooling water and steam used in the
process since they simply considered norminal prices for the utilities in their economic evaluation. To reduce
the freshwater consumption, closed loops for cooling tower and steam systems are used in industry. We use
the mass and energy balance of the bioethanol case study developed by Karuppiah et al (2008), and introduce
cycles of concentration for the cooling tower and the boiler to calculate the net water consumption for the
closed loops for cooling water and steam in the cases described above as (a) – (d).
The cycles of concentration (COC) are defined as the ratio of the concentration of salts or dissolved
solids in the circulating water or blowdown to that in the makeup water (Perry and Green, 1997; Mann and Liu,
1999). In industrial practice, the cycles of concentration normally range from three to seven, and they are
important in the design and operation of cooling towers (Fatigati, 2006).
Fig. 9 shows a closed loop of circulating water between the heat exchanger network and the cooling
tower.
Figure 9. Closed loop for circulating water in cooling tower system.

14
On the basis of the cooling requirements in the heat exchanger network (heat rejected in cooling
tower) )(kWQC , flow rate of circulating water RECf , between cooling tower and heat exchanger network can
be calculated from the equation:
,C REC p WQ f c T (1)
where cp = specific heat capacity of water (kJ/(kg ºC)), T= temperature difference between inlet and outlet
water in cooling tower (ºC).
For the calculation of the evaporation loss in the cooling tower, which is the water quantity evaporated
for cooling duty, an empirical correlation that is often used is the one by Perry and Green (1997):
30.00085 ( / ) 1.8E RECf T f m h (2)
The amount of water lost by drift, which is the water in the tower discharge vapors, varies between
0.1 and 0.2 percent of the water supplied to the tower. New developments in the drift-eliminator design make it
possible to reduce drift loss below 0.1 percent (Perry and Green, 1997). Further improvements in the design of
cooling towers will reduce the water lost and the overall water consumption.
The makeup requirements for cooling tower consist of the summation of evaporation loss, drift loss,
and blowdown:
M E D Bf f f f (3)
As mentioned earlier, the cycles of concentration (COC) are the ratio of the concentration of salts or
dissolved solids in the circulating water/blowdown cB (ppm) to that in the makeup water cM (ppm).

15
M
B
c
cCOC (4)
According to the literature (APHA, 1989) the concentration of total suspended solids (TSS) in the
outlet stream of the cooling tower is typically 50 ppm.
Fig. 10 shows the simplified boiler system consisting of a boiler, heat exchanger network (steam-
using operations) and deaerator.
Figure 10. A simplified boiler system.
The steam generated in the boiler is used for heating in the heat exchanger network, and steam
condensate is returned to the boiler. In the case that there is no steam loss SLf in the heat exchanger network,
the flow rate of generated steam in the boiler and returned steam condensate is the same S Cf f . In addition,
makeup requirements for the boiler system will be equal to the discharged blowdown.
According to this water balance for the boiler system, the mixer, and the heat exchanger network is
given by the equations:
M SL Bf f f (5)
FW M Cf f f (6)
S SL Cf f f (7)

16
The American Boiler Manufacturers Association specifies that the concentration of TSS in the
blowdown water from boilers is typically 10ppm.
The generated steam in the boiler can be calculated from the heat requirements in the heat
exchanger network.
H S vQ f H (8)
where Hv= latent heat of steam condensation (kJ/kg) for given temperature and pressure.
In order to control the buildup of contaminants in the closed boiler system, blowdown has to be
discharged and fresh makeup water supplied to the boiler so that none of contaminants exceeds its limit. As
for cooling tower, the cycles of concentration for the boiler can be determined from Eq. 4.
5.1. Water consumption in the optimized superstructure with no heat integration (Case a) after water
loop.
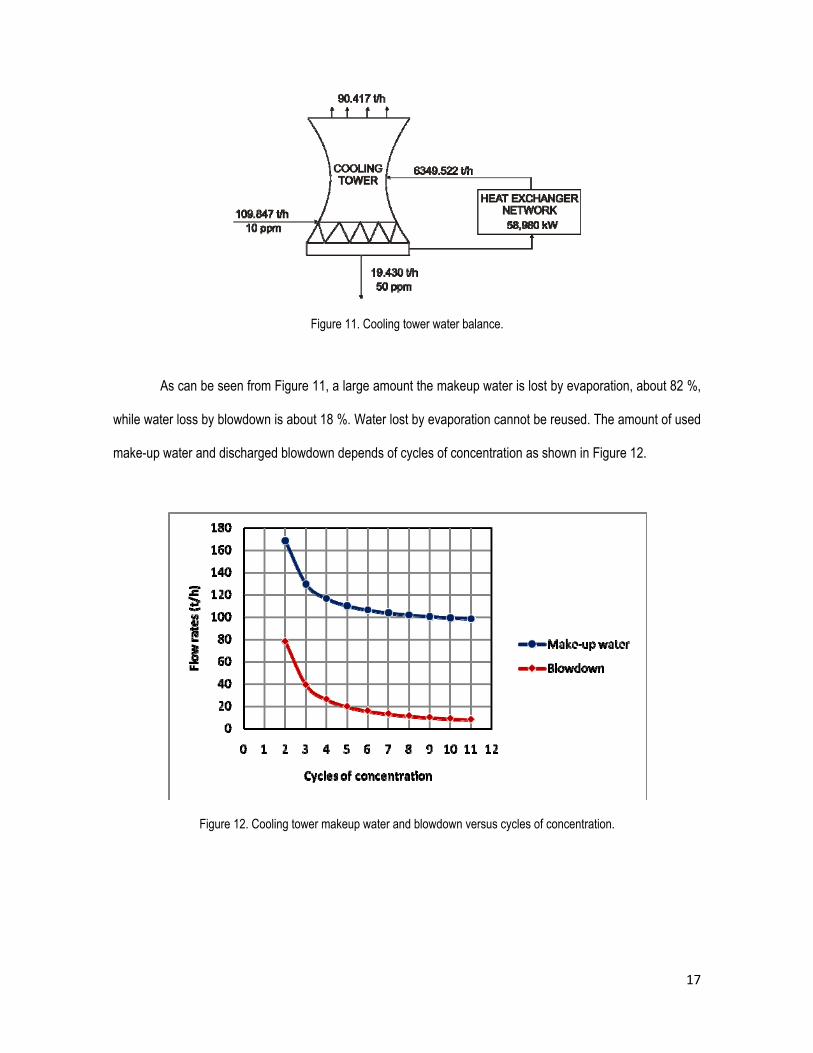
Considering the case of the optimized superstructure without heat integration (case a), the cooling
requirements are 58980 kW. We assume that the drift losses are 0.2 % of the supplied water to the cooling
tower, that the temperature difference between the inlet and outlet water in the cooling tower is 8 °C, and five
cycles of concentration (a typical value that will be used along the paper). According to that, Fig. 11 shows
results of the water balance of the cooling tower.
17
Figure 11. Cooling tower water balance.
As can be seen from Figure 11, a large amount the makeup water is lost by evaporation, about 82 %,
while water loss by blowdown is about 18 %. Water lost by evaporation cannot be reused. The amount of used
make-up water and discharged blowdown depends of cycles of concentration as shown in Figure 12.
Figure 12. Cooling tower makeup water and blowdown versus cycles of concentration.

18
For the optimized superstructure without heat integration (case a), the heat requirements for corn-
based bioethanol plant are 79.00 MW. Assuming five cycles of concentration, and steam pressure 30 bar and
temperature 233.8 ºC, Fig. 13 shows results of the boiler water balance. It should be noticed that superheated
steam is injected into Jet1 unit (direct heating) and there is no condensate returned to the boiler from this unit
(it could be considered as steam loss).
Figure 13. Boiler water balance.
Consumption of the boiler makeup water and feed water depends of cycles of concentration as shown
in Fig. 14.
Figure 14. Boiler make-up water and feedwater versus cycles of concentration.
19
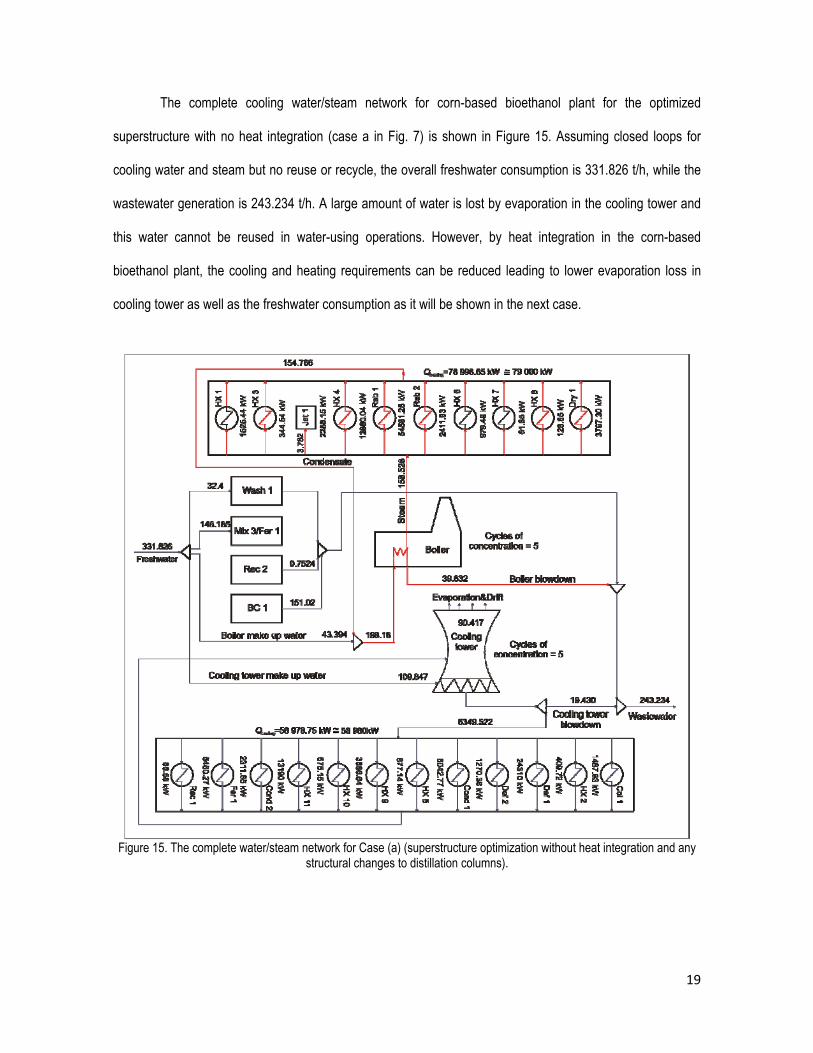
The complete cooling water/steam network for corn-based bioethanol plant for the optimized
superstructure with no heat integration (case a in Fig. 7) is shown in Figure 15. Assuming closed loops for
cooling water and steam but no reuse or recycle, the overall freshwater consumption is 331.826 t/h, while the
wastewater generation is 243.234 t/h. A large amount of water is lost by evaporation in the cooling tower and
this water cannot be reused in water-using operations. However, by heat integration in the corn-based
bioethanol plant, the cooling and heating requirements can be reduced leading to lower evaporation loss in
cooling tower as well as the freshwater consumption as it will be shown in the next case.
Figure 15. The complete water/steam network for Case (a) (superstructure optimization without heat integration and any
structural changes to distillation columns).

20
5.2. Water consumption in the optimized process for corn ethanol production (case (d))
In Figure 16 we present water balance for the case of complete heat integration in the bioethanol
plant using multieffect distillation columns (three columns for the beer column and two columns for the
rectification column), case d. The overall freshwater consumption is reduced from 331.829 t/h to 240.393 t/h
and the wastewater generation from 243.234 t/h to 209.255 t/h. It is worth pointing out that with complete heat
integration the water loss by evaporation in cooling tower is reduced about 63 % compared to the Case study
(a) shown in Figure 15 (from 90.417 t/h to 32.963 t/h)
Figure 16. The complete water/steam network for case d
In industrial practice water consumption in corn-based ethanol plants is expressed as gallon of water
per gallon of bioethanol produced. Fig. 17 shows the results of water consumption for the four cases given in

21
Fig. 8. To reduce further the water usage values presented in Fig. 17, integrated process water networks are
synthesized in the following section.
Figure 17. Freshwater consumption with closed loops for cooling water and steam but without water networks for case studies given in Fig. 7.
6. Water consumption optimization by implementation of water networks
6.1. Water network superstructure and model
In order to synthesize water networks in the corn-based bioethanol plant together with the cooling
water and stream loops, we use the global optimization approach at the superstructure of integrated process
water networks shown in Fig. 18 which has been recently proposed by Ahmetović and Grossmann (2009).
The superstructure consists of one or multiple sources of water of different quality, water-using
processes, and wastewater treatment operations. The unique feature is that all feasible connections are
considered between them, including water re-use, water regeneration and re-use, water regeneration
recycling, local recycling around process and treatment units and pre-treatment of feedwater streams. Multiple

22
sources of fresh water include water of different quality that can be used in the various operations, and which
may be sent first for pre-treatment. The superstructure incorporates both the mass transfer and non-mass
transfer operations. According to this, it can be used to represent separate subsystems as well as an
integrated total system. Furthermore, it enables modeling different types of water network optimization
problems.
The mathematical model of the generalized superstructure consists of mass balance equations for
water and the contaminants for every unit in the network. The model is formulated as a nonconvex nonlinear
programming (NLP) that is solved to global optimality. The objective function is to minimize the total network
cost consisting of the cost of freshwater, the investment cost on treatment units and the operating cost for the
treatment units as given by equation:
TUt
outtt
TUt
outtts
SWss FTUICFTUICARCFWFWHZ
3
1min
(9)
Subject to:
Splitter mass balances
Mixer mass balances (bilinear)
Process units mass balances
Treatment units mass balances
We assume the operating costs for treatment units to be one third of the investment cost (Cargill,
2006). All other equations of the mathematical model we use in this paper are given in Ahmetović and
Grossmann (2009).

23
Figure 18. Generalized superstructure for the design of integrated water networks. Ahmetovic and Grossmann (2009) PU: Process Unit; DU: Demand Unit; SU: Source Unit; TU: Treatment Unit.
6.2. Application of water network
To synthesize the water network for the bioethanol plant using the superstructure optimization
approach described above, the process and treatment units, and their corresponding flow rates must be
defined. First, the units that can be considered as water-using operations are the washing unit, the fermentor,
the boiler, and the cooling tower. In the washing unit there is direct contact between the process stream (corn
kernels) and the freshwater. The fermentor requires water, so this unit is considered as a water demand unit.
Furthermore, there is loss of water due to chemical reaction. The beer and rectification columns recover water

24
by separation and thus they are water source units. In addition to this, the flowrate of the boiler and cooling
tower make-up water and blowdown is different because of loss of steam in Jet 1 unit, and water by
evaporation in cooling tower.
The application of the water network to a particular case like the corn-ethanol plants requires the
specification of the treatment units in accordance with the contaminants. Wastewater streams are generated
from the boiler, cooling tower, and beer and rectification columns. Two main contaminants are considered,
suspended solids and organics. Suspended solids are present in the water used for washing the corn, while
the organics are the main contaminants in the streams coming out of the distillation columns. Furthermore, the
water fed to the fermentor must have no ethanol, with is toxic for the yeast. We assume that there are two
different wastewater treatment units, one for removing suspended solids and another one to remove organics.
In order to remove the solids, screens are widely used. Relatively large solids (0.7 mm or larger) can
be removed in a primary screening facility. The simplest configuration is that of flow-through static screens,
which have openings of about 1 mm. The removal rates vary depending on the size of the solids. Fig. 19
shows a basic scheme for the screens (Wang et al, 2004). We assume 99.9% removal for suspended solids.
Figure 19.- Example of the operation of the screen.

25
In order to purify the water from the distillation columns, a system of anaerobic and aerobic treatment
is required. The anaerobic stage will remove 90% of the organics generating biogas rich in methane that can
be reused to obtain energy. Later, the water is treated in an aerated lagoon to obtain relatively clean water that
can be recycled to the process according to the results presented by Zhang et al (2009). For this study, both
treatments are integrated and modeled as a single treatment unit.
The cost correlation for the equipment involved in the network, screens
(http://www.matche.com/EquipCost/Screen.htm), aerobic and anaerobic treatment
(www.fao.org/docrep/003/V9922E/V9922E04.htm updated from EPA 1978), boiler and cooling tower
(http://www.matche.com/EquipCost/Cooling.htm, http://www.matche.com/EquipCost/Boiler.htm) are as follows:
0.59
0.7
3229·( ( )) (10)
2328.3·( ( ))
Coolingtower
Furnance
C E kW
C E kW
2 0.43
3
(11)
10085· ( ) (12)
( / )
( / )
ScreensC A m
Q m sA
v m s
0.43
(13)
v(m/s)=1.6 (depends on sedimentation velocity)
4750·( ( / )) ScreensC m ton h1.13
biological treatment Aeration tank Anaerobic treatment
(14)
1500( ( / )) (15)C C C m ton h
The annualized factor for investment on the treatment units is taken to be 0.1, and the total time for
the network plant operation in a year is assumed to be 8640 h. To compare results with the published one by
Karuppiah et al (2008), we used the same freshwater cost ($8.7110-3/ton) as given in their paper. The relative
optimality tolerance was set to zero, and we used the general purpose optimization software BARON
(Sahinidis, 1996) to solve the global optimization of the nonconvex NLP problem.

26
6.2.1. Water network for the optimized superstructure with no heat integration (Case a). The optimal design of water network for the case of the optimized superstructure with no heat
integration is shown in Fig. 20. As it can be seen, the freshwater consumption is reduced from 331.829 t/h to
88.592 t/h. This value represents a reduction of 73% compared to the same case study without application of
water reuse, regeneration and recycling. It should also be mentioned that in this case there is no wastewater
discharge, all water is reused/recycled in the network. The only loss of water is due to evaporation in the
cooling tower (90.417 t/h). The water use for this case study is 3.34 gallon of water per gallon of ethanol, which
is a value in the range of the ones reported in the literature for new bioethanol plants (Minnesota Technical
Assistance Program, MTAP, 2008). The total water network cost is $205,805.95/year.
Figure 20. Optimal water network for the superstructure of the bioethanol production. Case a.

27
6.2.2. Water network for the optimized corn-based ethanol plant (Case d)
Fig. 21 shows the optimal design of water network for case study (d), the optimized heat integrated
corn-based ethanol plant. The freshwater consumption is reduced from 240.393 t/h to 31.138 t/h. This
represents an 87% reduction compared to the same case study without application of water networks.
Evaporation loss in cooling tower is 32.963 t/h and there is no wastewater discharge from the network. The
total network cost ($201,266.95/year) is similar to the previous case ($205,805.95/year). The reason is that the
contribution of the cost of the freshwater compared to the total cost is rather small.
It is worth pointing out that water consumption for this case is only 1.17 gallon of water per gallon of
ethanol, which is much less compared to the data published in the literature, and that aims for 1.5 as the best
possible value (Fatigati, 2006). Thus, this result is at great practical significance.
Fig. 22 shows water use for Case studies a-d with the integrated water networks. Thus, we show that
minimizing energy consumption leads to process water networks with minimum water consumption.

28
Figure 21. Optimal water network for the optimized process production of corn based bioethanol .Case study d.
Figure 22. Water usage after the application of water network to cases a-d.

29
The results presented in Fig. 22 are very promising. In industrial practice, the water usage in ethanol
plants has improved in the last decade. Figure 23 shows some interesting values (MTAP, 2008)
Sample of plants (older single letters, newer double letters)
Figure 23.-Reported data of water usage (source MTAP 2008)
In Fig. 23, it can be seen that the newest plants show values in the range of the ones calculated in
section 6.2.1. That example corresponded with the case when no heat integration neither multieffect columns
were used in order to optimize energy consumption. However, this value can be reduced further to meet the
claims of Delta T Company that states that values of 1.5 gal/gal are possible. There is discussion whether 1.5
gal water /gal ethanol is achievable but there is no demonstration of this in an operating plant. On the other hand,
values of 2 gal water /gal ethanol have already been demonstrated for the production of ethanol (Tao et al., 2009).
According to the results presented in this paper, the values claimed by Delta – T Company can be reached
even in a conservative case, case study (c) from Karrupiah et al (2008) paper., (see Fig. 22). More importantly,
30
our results suggest that it is possible to achieve levels below 1.5 gal/gal since we have calculated a value of
1.17 gal/gal for case d.
6. Costs and Benefits The implementation of the integrated water networks results in a cost that has to be added to the
operating costs. Two main utilities are minimized, steam and fresh water. However, the cost for the equipment
as well the natural gas to feed the boiler will have to be added. At this point it is important to see including the
new equipment has a large impact on the operating costs of ethanol. In order to be consistent with the results
presented in Karuppiah et al (2008) the cost for natural gas is was calculated as 0.167$/kg. If we take the
production cost of corn ethanol reported in Karuppiah et al (2008), for case (a) it is 1.34 $/gallon, for case (d) it
is 1.24 $/gallon. If we add the cost of the water network (screens, biological treatment, furnace with 80%
efficiency (Walas S.M., 1990), cooling tower ) and the utilities required (natural gas to feed the furnance) to
these values, the operating costs for both cases increase only by a modest amount, to 1.37 $/gallon and 1.30
$/gallon respectively . The higher the cost of water, the more significant the application of water networks will
be in terms of process economics since the decrease of water consumption is quite large as shown in Figs. 8,
17 and 22.
7. Conclusions Water and energy are the most extensively used commodities in process industries. Water scarcity
and environmental regulations on water wastes are a major concern nowadays. In particular, corn-based
bioethanol plants are water and energy intensive. In this paper we have studied the energy and water
consumption of such plants.
31
Water consumption can be reduced by energy optimization together with the recycle and reuse of
process and cooling water and steam. Mathematical programming techniques have been used to optimize
energy consumption and to synthesize an optimal process water network for corn - based bioethanol plants.
The optimization of water consumption has been presented in three steps to show the contribution of
energy optimization, water reuse and recycle. The optimized water network yields the very promising value of
water consumption of 1.17 galwater / gal ethanol , which is the lowest value to the knowledge of the authors even
lower than the industry goal of 1.5 galwater / gal ethanol . Furthermore, the optimal process water network does not
discharge waste water. Further decrease in water consumption can be achieved by improving the performance
of the cooling towers.
Acknowledgments
The authors gratefully acknowledge the Center for Advanced Process Decision-making at Carnegie
Mellon University. Dr. Mariano Martín acknowledges the Ministry of Education and Science of Spain and
Fulbright commission for providing a MICINN – Fulbright Posdoctoral fellowship. Dr. Elvis Ahmetović would
like to express his gratitude to the Fulbright Program for Fulbright Scholar Grant and support throughout this
work.
8. References Ahmetović, E., & Grossmann, I. E. (2009). General superstructure and global optimization for the design of integrated process water networks Submitted to AIChE J. Alva-Argaez, A., 1999. Integrated design of water systems. Ph.D. Thesis, UMIST, Manchester, UK Andres D. (2002). Ethanol energy balances. David Andres & Associates, Inc. Aden, A. (2007) Water Usage for Current and Future Ethanol Production. Southwest Hydrology, September/October 2007. 22-23

32
APHA (1989) American Public Health Association Standard methods for the examination of water and wastewater, American Public Health Association, 17th edn (1989). Bagajewicz, M.J., Pham, R., Manousiouthakis, V., (1998). On the state space approach to mass/heat exchanger network design. Chemical Engineering Science 53, 2595–2621. Bagajewicz, M. (2000) A review of recent design procedures for water networks in refineries and process plants. Computers and Chemical Engineering 24, 2093–2113 Bagajewicz, M., Rodera, H., Savelski M (2000) A robust method to obtain optimal and sub optimal design and retrofit solutions of water utilization systems with multiple contaminants in process plants. In proceeding of the Sevenths International Sysmposium on Process System Engineering (PSE) Bogataj, M. and Bagajewicz, M.J., (2008) Synthesis of non-isothermal heat integrated water networks in chemical Processes. Computers and Chemical Engineering, 32: 3130–3142 Bush, G.W. (2007) Presidential State of the Union Address (2007) Hart D, Bauen A, Chase A, Howes J. Liquid biofuels and hydrogen from renewable resources in the UK to 2050: a technical analysis, E4tech (UK) Ltd. Study carried out for the UK Department for Transport. <http://www.senternovem.nl/mmfiles/TechanalBiofuelsandH22050_tcm24-187065.pdf>; 2003 [accessed 15th March 2007 CA (2007). http://www.iwmi.cgiar.org/WhatsNew/Biofuels/index.htm CalGasoline, (2002) Ethanol is not a suitable replacement for MTBE. www.calgasoline.com/factetha.htm (9/17/2002). Citizens for Tax Justice, 1997, More corporate giveaways high on congressional agenda: Citizens for Tax Justice, July 22, 1997. http://www.ctj.org/html/cgive97.htm (9/17/2002).
Cargill (2006) Personal communication.
Chiu, Yi-Wen, Walseth‡, B., Suh, S. (2009) Water Embodied in Bioethanol in the United States Environ. Sci. Technol., 2009, 43 (8), pp 2688–2692
Croysdale, D., (2001) Belatedly, DNR concedes our air is clean: The Daily Reporter. November 6, 2001. http://www. dailyreporter.com/editorials/eds/nov07/asa11–7.shtml. (9/17/2002). Cole, D. E. (2007) Issues facing the Auto Industry: Alternative Fuels, Technologies, and Policies ACP Meeting Eagle Crest Conference Center June 20, 2007 Hammond G.P. . Kallu, S., and McManus, M.C. (2008) Development of biofuels for the UK automotive market, Applied Energy. 85, 6, 506-515 Debbie Elcock (2008) Baseline and Projected Water Demand Data for Energy and Competing Water Use Sectors, ANL/EVS/TM/08-8, Dong, H.G., Lin, C.Y. and Chang, C.T., (2008) Simultaneous optimization approach for integrated water-allocation and heat-exchange networks. Chemical Engineering Science, 63, 3664–3678. Doyle, S.J., Smith, R., (1997) Targeting water reuse with multiple constraints. Transaction of IChemE 75 (Part B), 181–189.

33
Du, J., Meng, X., Du, H., Yu, H., Fan, X. and Yao, P., (2004) Optimal design of water network with energy integration in process industries. Chinese Journal of Chemical Engineering, 12, 247–255. EPA (Environmental Protection Agency), (1978) Construction costs for municipal wastewater treatment plants: 1973-1977. Technical Report MCD-37, U.S. E.P.A. Washington, D. C., U. S. A. Adapted in http://www.fao.org/DOCREP/003/V9922E/V9922E09.htm EU (2007) Energy Policy for Europe http://eur-lex.europa.eu/LexUriServ/site/en/com/2007/com2007_0001en01.pdf Fatigati, M., (2006) Conserving Water in Ethanol Plants. Wester Region BBI Biofuels Workshop San Diego CA http://www.bbibiofuels.com/biofuelsworkshop/2006/docs/speakerpapers/west/bww/BWW06-14-Fatigati.pdf Ferguson, A. R. B., (2003) Implications of the USDA 2002 update on ethanol from corn: The Optimum Population Trust, Manchester, U.K., p. 11–15. Ferguson, A. R. B.,(2004) Further implications concerning ethanol from corn: Draft manuscript for the Optimum Population Trust Feng, X., Li, Y. and Yu, X., (2008) Improving energy performance of water allocation networks through appropriate stream merging. Chinese Journal of Chemical Engineering, 16:480–484 Foo, D. C. Y. (2009). State-of-the-Art Review of Pinch Analysis Techniques for Water Network Synthesis. Industrial & Engineering Chemistry Research, 489(11), 5125-5159. Feng, X., Li, Y. and Shen, R., (2009) A new approach to design energy efficient water allocation networks. Applied Thermal Engineering. 29, 11-12, 2302-2307 de Fraiture, Charlotte et al. (2008) Biofuels and Implications for agricultural water use: blue impacts of green energy. Water Policy 10: 67-81. Forstmeier, M., Goers, B., Wozny. G. (2005) Water network optimisation in the process industrydcase study of a liquid detergent plant Journal of Cleaner Production 13, 495-498 Gen Solutions (2007) Risk assessment for bioenergy manufacturing facilities in Alberta Report E 06 019 Giampietro, M., Ulgiati, S., and Pimentel, D., (1997) Feasibility of large-scale biofuel production. BioScience, 47, 9, 587–600. Graboski M. (2002). Fossil energy use in the manufacture of corn ethanol. Prepared for the NCGA. Colorado School of Mines, US. GWI/OCDE (2008) http://www.globalwaterintel.com/archive/9/9/analysis/world-water-prices-rise-by-67.html Ho, S. P., (1989), Global warming impact of ethanol versus gasoline: presented at 1989 National Conf. Clean Air Issues and Am. Motor Fuel Business, October 1989.Washington, DC. Jacobson, M. Z. (2009) Review of solutions to global warming, air pollution, and energy security. Energy Environ. Sci., 2009, 2, 148–173

34
Jacques K, Lyons TP, Kelsall DR. (1999) The Alcohol Textbook, 3rd ed.Nottingham, United Kingdom: Nottingham University Press. Karuppiah, R., Grossmann, I.E: (2006) Global optimization for the synthesis of integrated water systems in chemical processes. Computers and Chemical Engineering 3, 650–673 Karuppiah, R., Peschel, A., Grossmann, I.E., Martín, M., Martinson, W. Zullo, L., (2008) Energy optimization of an Ethanol Plant. AICHE Journal. 54, 1499-1525. Kim, J.Y., Kim, J.K., Kim, J.H., Yoo, C.K. and Moon, I., (2009) A simultaneous optimization approach for the design of wastewater and heat exchange networks based on cost estimation. Journal of Cleaner Production, 17: 162–171. Keeney D.R. & DeLuca T.H. (1992). Biomass as an energy source for the mid-western US. In Amer. J. Alternative Agric., 7, 137-143. Keeney, D. R.; Muller, M. (2006) Water Use by Ethanol Plants: Potential Challenges; www.agobservatory.org/library.cfm?refid)89449. Keeney, D. (2009) Ethanol USA Environ. Sci. Technol., 43 (1), 8-11 Kuo, W.J., Smith, R., (1998) Designing for the interactions between water-use and effluent treatment. Transaction of IChemE 76 (Part A), 287–301. Leite, R. C. C. Leal,, M. R. L. V, Cortez, L.A.B.W., Griffin, M., Gaya Scandiffio, M. I. G. (2009) Can Brazil replace5% of the 2025 gasoline world demand with ethanol? Energy 34, 655–661 Leewongtanawit, B. and Kim, J.K., (2008) Synthesis and optimisation of heat-integrated multiple-contaminant water systems. Chemical Engineering and Processing, 27: 670–694. Levelton Engineering Ltd. (2000). Agriculture and Agro-Food Canada, 1999, Assessment of Net Emissions of Greenhouse Gasesfrom Ethanol-Gasoline Blends in Southern Ontario, prepared by Levelton Engineering Ltd. And (S&T)2 Consulting, Inc., Ottawa, Canada, Aug. Liao, Z., Wu, J., Jiang, B., Wang, J. and Yang, Y., (2008) Design energy efficient utilization systems allowing operation split. Chinese Journal of Chemical Engineering, 1: 16–20. Lieberman, B., (2002) The ethanol mistake: one bad mandate replaced by another: Competitive Enterprise Ins. http://www.nationalreview.com/comment/comment-lieberman 031202.shtml (9/17/2002). Linnhoff, B., et al., (1982). User Guide on Process Integration for the Efficient Use of Energy. Institute of Chemical Engineers, UK Lorenz D. & Morris D. (1995). How much energy does it take to make a gallon of ethanol? Updated and revised. Institute for Local Self-Reliance, US. http://www.ethanol.org/pdf/contentmgmt/ILSR_energy_balance.pdf Manan, Z. A., Tea, S. Y., Alwi, S. R. W. (2009) A new technique for simultaneous water and energy minimisation in process plant, Chem Eng Res Des, doi:10.1016/j.cherd.2009.04.013

35
Mann, J. G., & Liu, Y. A. (1999). Industrial water reuse and wastewater minimization. New York, USA: McGraw-Hill. Marland G. & Turhollow A.F. (1990). CO2 emissions from the production and combustion of fuel ethanol from corn. Oak Ridge National Laboratory. Report No. 3301. McCain, J., (2003) Statement of Senator McCain on the Energy Bill: Press Release. Wednesday, November 2003. Minnesota Technical Assistance Program, MTAP, (2008) Ethanol Benchmarking and best practices. The production process and potential for improvement www.mntap.umn.edu/MnTAP%20Ethanol%20Report.pdf Moore, R., (2007) Producing Greener Ethanol, Ethanol Producer Magazine, September , 2007 Morris D. & Ahmed I. (1992). How much energy does it take to make a gallon of ethanol? Institute for Self Reliance, US. http://www.p2pays.org/ref/24/23824.pdf National Research Council. (2008) Water Implications of Biofuel Production in the United States; National Academies Press:Washington, DC, 2008. NPRA (2002) NPRA Opposes ethanol mandate; asks Congress not to hinder efforts to maintain supply: National Petrochemical and Refiners Association, Washington, DC. http://www.npradc.org/news/releases/detail.cfm?docid = 164&archive = 1 (9/17/2002). National Research Council (2008). Water Implications of Biofuels Production in the United States; National Academies Press: Washington, D.C., 19-25. Papoulias, S.A., Grossmann, I.E., (1983) A structural optimisation approach in process synthesis. II—Heat recovery networks. Computers and Chemical Engineering 7, 707–721. Patzek, P., (2004)Thermodynamics of the corn-ethanol biofuel cycle: Critical Reviews in Plant Sciences, 23 (6) 519 - 567 Perry, R. H, & Green, D. W. (1997). Perry's Chemical Engineer's Handbook, New York: McGraw-Hill.
Petrakis S. (2008) Reduce cooling water consumption. New closed loop cooling method improves process cooling tower operations. Hydrocarbon Processing, December, 95-98 Pimentel, D., (1991) Ethanol fuels: energy security, economics, and the environment: Journal of Agricultural and Environmental Ethics, 4, 1–13. Pimentel, D., and Pimentel, M., (1996) Food, energy and society: Colorado Univ. Press, Boulder, CO, 363 p. Pimentel, D., (1998) Energy and dollar costs of ethanol production with corn: Hubbert Center Newsletter #98/2, M. King Hubbert Center for Petroleum Supply Studies, Colorado Sch. Mines.Golden, CO., 7 p. Pimentel,D., (2001) The limitations of biomass energy, in Meyers, R.,ed., Encyclopedia of Physical Science and Technology. (3rd edn.), Vol. 2: Academic, San Diego, CA, 159–171.

36
Pimentel, D., (2003) Ethanol fuels: energy balance, economics, and environmental impacts are negative: Natural Resources Research, 12, 2, 127–134 Pimentel, D: and Patzek, T. W. (2005) Ethanol Production Using Corn, Switchgrass, and Wood; Biodiesel Production Using Soybean and Sunflower Natural Resources Research, 14, 1, 65-76 Pfromm, P. H. (2008) The minimum water consumption o Ethanol production via Biomass fermentation. The open Chemical Engineering Journal, 2, 1-5 Rosegrant, M.W. Cai, X. Cline, (2002) Global Water Outlook to 2025 – Averting an Impending Crisis. International Food Policy Research institute, Washington Saeedi, M. Hosseinzadeh M (2006) Optimization of Water consumption in industrial Systems using lineal and nonlinear programming. J Applied Science 6, 2386-2393 Savelski, M.J. and Bagejewicz, M.J., (1997) Design and retrofit of water utilization systems in refineries and process plants, In AIChE Annual Meeting Los Angeles, paper 188g, Savulescu, L.E. and Smith, R., (1998), Simultaneous Energy and Water Minimisation. AIChe Annual Meeting, November 15–20, Miami Beach, Florida, Unpublished Savulescu, L., Sorin, M. and Smith, R., (2002), Direct and indirect heat transfer in water network systems. Applied Thermal Engineering, 22, 981–988. Savulescu, L., Kim, J.K. and Smith, R., (2005), Studies on simultaneous energy and water minimisation—part 1: systems with no water re-use. Chemical Engineering Science, 60, 3279–3290. Savulescu, L., Kim, J.K. and Smith, R., (2005), Studies on simultaneous energy and water minimisation—part 2:systems with maximum re-use of water. Chemical Engineering Science, 60, 3291–3308. Shapouri H., et al. (1995). Estimating the net energy balance of corn ethanol. In U.S. Department of Agriculture (USDA), Economic Research Service, Agricultural Economic Report No. 721. Shapouri, H., Duffield, J. A., and Wang, M., (2002) The energy balanceof corn ethanol: an update: USDA, Office of Energy Policy and New Uses, Agricultural Economics. Rept. No. 813. 14 p. Shapouri, H., Duffield, J., McAloon, A., and Wang, M. (2004) The 2001 Net Energy Balance of Corn-Ethanol (Preliminary): US Dept. Agriculture, Washington, DC. SIU (2007) Sugarcane Industry Union, UNICA, Sao Paulo, Brazil, March 2007 Smith R. (1995) Wastewater minimization. In: Rossiter A, editor. Waste minimization through process design. New York: McGraw-Hill; 93–108 Sparks Companies Inc. (2003) Global water and food outlook (2003) Takama, N., Kuriyama, T., Shiroko, K. & Umeda, T. (1980). Optimal water allocation in a petroleum refinery. Computers & Chemical Engineering, 4, 251-258.

37
Tao, L., Aden, A., Humbird, D., Dutta, A., Kinchin, C., Inman, D., Hsu, D.D., Dugeon, D., Lukas, J., Olthof, B., Schoen, P., Worley, M. (2009) Lignocellulosic Biomass to ethanol. Process Desing and Economics for corn stover. Paper 239c. AICHE annual meeting 2009, Nashville. Tennesse. USDA (2009) Agricultural Projections to 2018 (2009) www.ntis.gov Wang, Y.P., Smith, R., (1994) Wastewater minimisation. Chemical Engineering Science 49 (7), 981–1006. Wang, Y.P. & Smith, R. (1994b). Design of distributed effluent treatment systems. Chemical Engineering Science, 49(18), 3127-3145. Wang, Y. P. & Smith, R. (1995). Wastewater Minimization with Flowrate Constraints. Chem. Eng. Res. Des., 73, 889. Wang M., Saricks, C. and D. Santini , D.(1999). Effects of fuel ethanol use on fuel-cycle energy and greenhouse gas emissions.USDOE Argonne National laboratory, Center for Transportation Research, Argonne, IL. ANL/ESD-38 http://www.transportation.anl.gov/pdfs/TA/58.pdf Wang, L.K Hung, Y-T,Howard H. Lo, H.H, Yapijakis, C., Li, K. H. (Eds.) (2004) Handbook of industrial and Hazardous wastes treatment Second Edition, Marcel Dekker, Inc., New York-Basel, ISBN 0-8247-4114-5, 2004, Wallas, S.M. (1990) Chemical Process Equipment: selection and design Butterworth-Heinemann 3rd ed Youngquist, W. (1997) GeoDestinies: The inevitable control of Earth resources over nations and individuals. Portland, Oregon: National Book Company Zhang S., Marechal, F., Gassner, M., Perin-Levasseur, Z., Qi, W., Ren, Z., Yan, Y. and Favrat, D. (2009) Process Modeling and Integration of Fuel Ethanol Production from Lignocellulosic Biomass Based on Double Acid Hydrolysis, Energy Fuels, 23 (3), pp 1759–1765 Zheng, X.S., Feng, X. and Cao, D.L., (2003) Design water allocation network with minimum freshwater and energy consumption. Computer Aided Chemical Engineering, 15, 388–393.