water conservation campaigns in sharjah, united arab
TRANSCRIPT

Water Conservation Campaigns in Sharjah,
United Arab Emirates
Omar Algarni
Kyla Egenberger
Pooja Patel
Rafael Pimentel
Sponsored by:
Sharjah Electricity and Water Authority

Water Conservation Campaigns in Sharjah,
United Arab Emirates
An Interactive Qualifying Project Report
Submitted to the Faculty of
WORCESTER POLYTECHNIC INSTITUTE
in partial fulfillment of the requirements for the
Degree of Bachelor of Science
By:
Omar Algarni
Kyla Egenberger
Pooja Patel
Rafael Pimentel
Date: December 13, 2019
Report Submitted to:
Professor Joseph Doiron, Department of
Interdisciplinary & Global Studies, Worcester
Polytechnic Institute
Professor John Bergendahl, Department of
Environmental Engineering, Worcester
Polytechnic Institute
This report represents work of WPI undergraduate students submitted to the faculty as
evidence of a degree requirement. WPI routinely publishes these reports on its web site
without editorial or peer review. For more information about the projects program at WPI,
see http://www.wpi.edu/Academics/Projects.

I
ABSTRACT
The Water Conservation Campaigns in Sharjah, United Arab Emirates project was
sponsored by the Sharjah Electricity and Water Authority (SEWA) and in collaboration with
the American University of Sharjah. The project includes the following three studies: The
Exploration of Conservation Efforts in Sharjah, UAE; Design Sprint Workshop: Ideating
Water Conservation Campaigns at the American University of Sharjah; and Feedback on
Water Conservation Campaigns Ideated by Residents of Sharjah. The first study was an
exploratory qualitative study using methods of observation and interviews. The second study
was a design study using a Design Sprint methodology. The third study was a user-feedback
study using interviews and in--person surveys. Based on the findings of each study,
recommendations were then developed.

II
EXECUTIVE SUMMARY
When a region lacks sufficient water resources to meet demands, the region is
considered to be water stressed. A completely diminished state of water resources, referred to
as water scarcity, becomes a possibility for these regions. Areas in the Middle East and North
Africa (MENA) are especially susceptible to these threats due to their arid climates and
geography. One of these regions, the United Arab Emirates (UAE), is currently experiencing
water stress. Despite limited rainfall and surface water, the UAE ranks among the highest per
capita water consumers in the world. The increase of the water demand in the UAE has
developed concerns from different government organizations, one of which is the Sharjah
Electricity and Water Authority (SEWA).
SEWA, a local government organization, has begun to focus their attention on the
increased demands for water. As a result, SEWA has made it their priority to ensure water
demands are met, while the population is increasing (“About Sharjah”. n.d.). As a member of
the Ministry of Energy and Industry, SEWA has been providing sufficient water and electricity
resources to the consumers of Sharjah. SEWA has not only increased the supply to meet the
demand, but also encouraged Sharjah residents to conserve water through various methods.
The three research questions guiding the studies in the following chapters are:
1. “What are the social benefit campaigns that have already been created in
Sharjah?”
2. “How can we design three creative campaigns aimed to change the behavior of
water consumers and encourage water conservation?”
3. “How will each of three campaigns produced in the Design Study be perceived
by Sharjah residents?”
This project has been broken up into three studies, each guided by a research question.
The studies are as follows: The Exploration Study (Chapter Two), the Design Study (Chapter
Three), and the Feedback Study (Chapter Four). The goal was to understand, design, and
evaluate campaigns that suggest limiting water consumption in Sharjah.

III
Study 1: The Exploration of Conservation Efforts in Sharjah, UAE
The residential sector of Sharjah accounts for 61.8% of the water produced by SEWA
(SEWA, 2018). Because residents are the primary water consumers, SEWA has been
attempting to decrease water consumption among the citizens of Sharjah. This includes
implementing varying water conservation campaigns to encourage behavior changes. The first
study explores past and current social benefit campaigns aimed to encourage people to change
behaviors.
Two methods were used to explore the social benefit campaigns in Sharjah. First, an
observational study was executed to identify the current campaigns in Sharjah. The campaigns
we observed were not limited to water conservation; we observed campaigns that functioned to
influence behavior of the target audience. Campaigns were photographed on the AUS campus
and screen captured from the SEWA’s achievements report. We used two marketing
frameworks to analyze the campaigns. Each campaign was annotated by the four elements of
the Hook Model (Trigger, Action, Reward, Investment) and the seven from the Marketing Mix
(Product, Price, Place, Promotion, People, Process, and Physical Evidence). The corresponding
elements were documented and then organized using a qualitative analysis software called
NVivo. NVivo helped make comparisons between campaigns and allow emergent themes to
become visible.
Secondly, we interviewed campaign creators to get more insight on the design process.
We audio recorded interviews with representatives from the SEWA Conservation Department
and the AUS Office of Sustainability. A protocol was created for each interview which
included the informed consent process and questions relating to campaign design and
outcomes. Using the recorded and transcribed interviews, main points were highlighted and
grouped together to identify themes.
The main findings of the observational study are listed as follows:
1. A campaign’s location is key to its success.
2. Design elements help convey messages.
3. Campaigns should reach their target audiences through different methods.
4. Campaigns do not normally involve monetary investments.
5. Messages of campaigns are framed differently.

IV
6. Rewards convince the audience of potential benefits.
The main findings from our interviews with SEWA officials are the following:
1. Designing a campaign takes time and reiterations.
2. Relating the campaign’s message to the target audience encourages
engagement.
3. Different target audiences necessitate different delivery methods.
4. Targeting the next generation helps create lasting impacts.
5. Water conservation campaigns aren’t the only social benefit campaigns in
Sharjah.
6. Incentives can be used to attract people towards a campaign.
7. The success of a campaign can be measured through surveys.
A list of recommendations based on the findings were presented:
• Use a marketing framework to provide structure in a campaign’s design
process.
• Use rewards to pique the interest of the target audience.
• Publish campaigns in high traffic areas to increase visibility.
• Use campaign formats that best suit the target audience.
• Use a qualitative analysis software, such as NVivo, to help organize campaigns
based upon their elements.
Study 2: Design Sprint Workshop: Ideating Water Conservation Campaigns at the
American University of Sharjah
To alleviate the UAE’s water stress, SEWA is currently implementing water
conservation campaigns mostly targeted towards residents of Sharjah. Part of this target
includes the 171,698 students, some of which belong to the 15 institutions in University City.
The research question this poses is “How can we design three creative campaigns aimed to
change the behavior of water consumers and encourage water conservation?”. Campaigns can
be ideated by the locals of Sharjah through a Design Sprint methodology, where individuals
work in teams to generate lots of creative ideas and rapidly prototype.

V
Our study functioned to answer the research question by creating three water
conservation campaigns from the products of Design Sprint workshops. We recruited members
of the AUS community, including students, staff, and faculty, to participate in our study.
Participants signed up and consented through a registration form. Links to this form were
presented on a flyer which was advertised via several distribution channels. We held a pilot
test, where two researchers facilitated and two participated alongside three additional
participants. After the pilot test, we held two Design Sprint workshops in the Sharjah
Entrepreneurship Center on the AUS campus. At these two-hour-long sessions, participants
worked in teams of 3-5 to complete each of the six stages of the Design Sprint (Understand,
Define, Diverge, Decide, Prototype, Validate). Each team finished the workshop with one
campaign prototype.
Several themes emerged in the pilot test, Design Sprint workshops, and three
campaigns. The four findings from our pilot test were:
1. Prior to conducting a Design Sprint workshop ensure the time needed for each
stage is correct.
2. Instructions must be clearly written for participants.
3. Reminding participants of the time remaining to fulfill the activity will help the
participant manage their time.
4. Check for understanding after directions are given out to participants.
From the Design Sprint workshops, we used marketing frameworks to analyze and
categorize the products. Our findings were:
1. Nine prototypes were produced from the Design Sprint workshops.
2. Themes regarding content, delivery, incentives, and messaging emerged from
the prototypes.
3. Five campaign deliveries emerged: Informative, App, Event, Device, and
Games.
4. Three campaigns were created from the findings of the Design Sprint:
I. Social Media
II. Event
III. App

VI
Several recommendations came out of this study:
• Run and participate in Design Sprint workshops involving the target audience
• Use different challenges and topics for Design Sprint workshops
• Complete pilot tests to determine strengths and weaknesses of protocols
Study 3: Feedback on Water Conservation Campaigns Ideated by Residents of Sharjah
From our second study, three overarching themes from the prototypes arose:
Informative, Application, and Event. From these themes, we designed three water conservation
campaigns, which were a social media post, a smart phone app, and an awareness event. The
three finalized prototypes from the Design Sprint Workshops then posed the research question
guiding the third study of our project: “How will each of three campaigns produced in the
Design Study be perceived by Sharjah residents?” We approached this question by inquiring
feedback on the campaigns from representatives of SEWA and members of the Sharjah
community. We chose to interview SEWA in order to get input from campaign creators; we
chose to survey the Sharjah community so we could receive feedback directly from the target
audience of the campaigns.
In our interviews with SEWA representatives of the Conservation Department, we
presented our three campaigns and asked for feedback on content, design, and delivery. The
SEWA representatives were asked to rank the campaigns. Additionally, we surveyed members
of the Sharjah community at AUS and Sharjah National Park by presenting one campaign and
asking questions about content, design, and engagement. For example, questions asked in
regard to the event campaign are “Was the message clear?”, “Do you like the design and
layout?”, and “Would you attend this event?”. Responses were inputted by the researchers into
a Qualtrics form.
From the interview with SEWA representatives of the Conservation Department, the
main points of feedback were:
1. Release the social media campaign as multiple posts, instead of one with
multiple pictures.
2. For the event, to use influencers to spread the word.

VII
3. An event, like the one we designed, would require a large amount of
preparation.
4. The app redesign was not considered a campaign by the Conservation
Department.
5. SEWA primarily uses social media and events to for awareness.
From the surveys, the three campaigns received 118 feedback responses in total: forty
for the social media post, thirty-eight for the app, and forty for the event. The main findings for
the surveys were:
1. Social media and app campaigns were deemed valuable campaign deliveries
contrastingly to the event campaign.
2. Participant engagement would be higher the less the campaign asked of them.
3. Many participants would engage with social media campaigns that were across
multiple social media platforms.
Based on the findings and analysis from this study the researchers generated the
following four recommendations:
• Continue requesting feedback on campaigns
• Continue social media campaigns
• Redesign the SEWA app with water consumption tracking feature
• Continue awareness events to promote conservation
Conclusion
The objective of our three studies was to find an impactful method for designing water
conservation campaigns. In our first study, we explored the current status of social benefit
campaigns implemented in Sharjah through an observational study on the AUS campus and
interviews with campaign creators at AUS and SEWA. For the second study, we held two two-
hour-long Design Sprint workshops for members of the AUS community to brainstorm and
prototype water conservation campaigns. From the nine campaigns produced, we developed
three water conservation campaigns (social media, event, and an app). In our third study, we
presented these three campaigns to SEWA representatives of the Conservation Department and

VIII
the Sharjah community to receive feedback on design, content, and engagement. Further
research and projects are required to answer the following questions:
• What are the short- and long-term impacts of social change campaigns within
communities or universities?
• What is the best method of delivery to target incoming generations?
• Does implementing a five-day design sprint methodology produce different
outcomes than that of a two-hour workshop?
• What other campaigns have been conducted in Sharjah besides those from AUS
and SEWA?
A condensed presentation of the relevant background information, methods, findings, and
recommendations of our three studies can be seen in Appendix Q.

IX
ACKNOWLEDGEMENTS
We would like to acknowledge several individuals and groups for their contributions and
support towards this project, including:
Our advisors, Dr. Joseph Doiron and Dr. John Bergendahl, for providing essential
feedback and guidance through the entire process of this project, for providing us with various
opportunities to make the most of our time, and for helping us to improve our professional
skills.
Our sponsor, Sharjah Electricity and Water Authority, for providing us with this
research opportunity. We would like to thank, Dr. Idris AlaEldin, Head of SEWA Research &
Studies Department, Ms. Mayyada Al Bardan, Manager of Research & Studies Department,
and Mr. Waleed El Damaty, Research Project Engineer. Additionally, we would like to thank
the SEWA Conservation Department.
The American University of Sharjah (AUS) College of Engineering and Department of
Civil Engineering for providing support and a space to conduct our research studies, including,
the following offices that have helped us through this process: International Exchange Office,
Office of Sustainability, the Office of Strategic Communications and Marketing, and the Office
of Student Affairs. We would like to thank Ibrahim Abulaila and Mohammad Said
Abuhalimeh, our AUS Civil Engineering partners, for their insight and guidance.
Additionally, we would like to thank the participants in our studies of which include,
the AUS students and faculty, and Sharjah residents.

X
AUTHORSHIP
Our approach for the writing involved in this project was collaborative. When tasked to
compose our first drafts for each chapter, we divided the authorship initially so that each team
member had a section to write. After all sections of a chapter were drafted, the team worked
together to edit the entire document. For following drafts, the group continued to edit the
document together, and sections that were originally written by one member sometimes were
combined with other sections. As such, we have listed the primary authorship for each
respective section.

XI
AUTHORSHIP TABLE
Section Author
Abstract Patel
Executive Summary All
1.0 Introduction and Background All
1.1 Environmental Constraint on Sharjah’s Water Resources Patel, Pimentel
1.2 Establishment of Water Management in Sharjah Patel, Pimentel
1.2.1 SEWA’s Vision and Goals Patel
1.3 Conventional and Non-Conventional Water Resources Egenberger
1.4 MENA Water Conservation Educational Campaigns Algarni,
Egenberger
1.5 Using Marketing Techniques in a Campaign Egenberger,
Patel
1.5.1 The Hook Model Algarni
1.5.2 Seven P’s of The Marketing Mix Patel
1.5.3 Psychology of Marketing Campaigns Egenberger
1.6 Overview of Methods Patel
1.7 Summary Patel
2.0 The Exploration of Conservation Efforts in Sharjah, UAE All
2.1 Introduction Egenberger
2.2 Methods Patel
2.2.1 Participants Algarni
2.2.2 Data Collection Pimentel
2.2.2.1 Observational Study Egenberger
2.2.1.2 Interviews Patel
2.2.2.3 Summary of Data Collection Algarni
2.2.3 Data Analysis Pimentel
2.2.3.1 Observational Study Egenberger
2.2.3.2 Interviews Patel
2.2.3.3 Summary of Data Analysis Algarni
2.2.4 Summary of Methods Pimentel
2.3 Findings Egenberger
2.3.1 Observational Study Patel
2.3.2 Interviews Algarni
2.3.3 Summary of Findings Pimentel
2.4 Discussion Egenberger
2.5 Conclusion Patel
3.0 Design Sprint Workshop: Ideating Water Conservation Campaigns
at the American University of Sharjah All
3.1 Introduction Pimentel

XII
3.2 Methods Algarni
3.2.1 Participants Egenberger
3.2.2 Data Collection Patel
3.2.2.1 Materials Algarni
3.2.2.2 Pilot Test Pimentel
3.2.2.3 Design Sprint Workshops All
3.2.2.4 Summary of Data Collection Egenberger
3.2.3 Data Analysis Patel
3.2.4 Summary of Methods Algarni
3.3 Findings Pimentel
3.3.1 Pilot Test Egenberger
3.3.2 Design Sprint Workshop Patel
3.3.3 Three Campaign Designs Algarni
3.3.4 Summary of Findings Pimentel
3.4 Discussion Egenberger
3.5 Conclusion Patel
4.0 Feedback on Water Conservation Campaigns Ideated
By Residents Of Sharjah All
4.1 Introduction Pimentel
4.2 Methods Algarni
4.2.1 Participants Egenberger
4.2.2 Data Collection Patel
4.2.2.1 SEWA Algarni
4.2.2.2 Sharjah Residents Pimentel
4.2.2.3 Summary of Data Collection Egenberger
4.2.3 Data Analysis Patel
4.2.3.1 SEWA Algarni
4.2.3.2 Sharjah Residents Pimentel
4.2.3.3 Summary of Data Analysis Egenberger
4.2.4 Summary of Methods Patel
4.3 Findings Algarni
4.3.1 SEWA Interview Pimentel
4.3.2 Sharjah Community Surveys Egenberger
4.3.3 Summary of Findings Patel
4.4 Discussion Algarni
4.5 Conclusion Pimentel
5.0 Conclusion All
5.1 Discussion Egenberger
5.1.1 Recommendations Patel
5.1.2 Next Steps Algarni

XIII
TABLE OF CONTENTS
ABSTRACT I
EXECUTIVE SUMMARY II
ACKNOWLEDGEMENTS IX
AUTHORSHIP X
AUTHORSHIP TABLE XI
TABLE OF CONTENTS XIII
LIST OF FIGURES XVII
LIST OF TABLES XIX
GLOSSARY AND ABBREVIATIONS XX
1.0 INTRODUCTION AND BACKGROUND 1
1.1 ENVIRONMENTAL CONSTRAINT ON SHARJAH’S WATER RESOURCES 3
1.2 ESTABLISHMENT OF WATER MANAGEMENT IN SHARJAH 4
1.2.1 SEWA’s Vision and Goals 4
1.3 CONVENTIONAL AND NON-CONVENTIONAL WATER RESOURCES 6
1.4 MENA WATER CONSERVATION EDUCATIONAL CAMPAIGNS 8
1.5 USING MARKETING TECHNIQUES IN A CAMPAIGN 10
1.5.1 The Hook Model 11
1.5.2 Seven P’s of The Marketing Mix 12
1.5.3 Psychology of Marketing Campaigns 14
1.6 OVERVIEW OF METHODS 15
1.7 SUMMARY 16
2.0 THE EXPLORATION OF CONSERVATION EFFORTS IN SHARJAH, UAE 18
2.1 INTRODUCTION 18
2.2 METHODS 19
2.2.1 Participants 19

XIV
2.2.2 Data Collection 20
2.2.2.1 Observational Study 20
2.2.1.2 Interviews 20
2.2.2.3 Summary of Data Collection 25
2.2.3 Data Analysis 25
2.2.3.1 Observational Study 26
2.2.3.2 Interviews 27
2.2.3.3 Summary of Data Analysis 27
2.2.4 Summary of Methods 28
2.3 FINDINGS 29
2.3.1 Observational Study 29
2.3.2 Interviews 39
2.3.3 Summary of Findings 42
2.4 DISCUSSION 42
2.5 CONCLUSION 44
3.0 DESIGN SPRINT WORKSHOP: IDEATING WATER CONSERVATION CAMPAIGNS
AT THE AMERICAN UNIVERSITY OF SHARJAH 46
3.1 INTRODUCTION 46
3.2 METHODS 47
3.2.1 Participants 48
3.2.2 Data Collection 51
3.2.2.1 Materials 52
3.2.2.2 Pilot Test 53
3.2.2.3 Design Sprint Workshops 53
3.2.2.4 Summary of Data Collection 61
3.2.3 Data Analysis 61
3.2.4 Summary of Methods 62

XV
3.3 FINDINGS 63
3.3.1 Pilot Test 63
3.3.2 Design Sprint Workshop 64
3.3.3 Three Campaign Designs 69
3.3.4 Summary of Findings 74
3.4 DISCUSSION 75
3.5 CONCLUSION 77
4.0 FEEDBACK ON WATER CONSERVATION CAMPAIGNS IDEATED BY
RESIDENTS OF SHARJAH 79
4.1 INTRODUCTION 79
4.2 METHODS 80
4.2.1 Participants 80
4.2.2 Data Collection 81
4.2.2.1 SEWA Interview 81
4.2.2.2 Sharjah Residents Survey 83
4.2.2.3 Summary of Data Collection 85
4.2.3 Data Analysis 85
4.2.3.1 SEWA Interview 85
4.2.3.2 Sharjah Residents Survey 86
4.2.3.3 Summary of Data Analysis 86
4.2.4 Summary of Methods 86
4.3 FINDINGS 87
4.3.1 SEWA Interview 87
4.3.2 Sharjah Residents Surveys 89
4.3.3 Summary of Findings 98
4.4 DISCUSSION 100
4.4.1 Limitations 101

XVI
4.4.2 Recommendations 101
4.5 CONCLUSION 102
5.0 CONCLUSION 105
5.1 DISCUSSION 106
5.1.1 Recommendations 107
5.1.2 Suggested Next Steps 109
REFERENCES 110
APPENDIX A: IRB Approval 114
APPENDIX B: Informed Consent Form (General Public) 115
APPENDIX C: Informed Consent Form (SEWA Study I) 118
APPENDIX D: Informed Consent Form AUS Community (Study I) 121
APPENDIX E: Informed Consent Form (SEWA Study III) 124
APPENDIX F: Interviews with SEWA Representatives Study I 127
APPENDIX G: Interviews with AUS Students and Faculty Study I 128
APPENDIX H: Interviews with SEWA Representatives Study III 129
APPENDIX I: OBSERVATIONAL STUDY CAMPAIGNS 130
APPENDIX J: NVIVO NODAL STRUCTURE EXPANDED 132
APPENDIX K: DESIGN SPRINT WORKSHOP QUALTRICS REGISTRATION FORM 133
APPENDIX L: DESIGN SPRINT WORKSHOP PROTOCOL 136
APPENDIX M: Design Sprint Workshop Presentation 141
APPENDIX N: DESIGN SPRINT WORKSHOP DEFINE STAGE QUESTIONS 145
APPENDIX O: Study III: AUS COMMUNITY AND SHARJAH RESIDENTS FEEDBACK
PROTOCOL 146
APPENDIX P: FEEDBACK QUALTRICS SURVEY 150
APPENDIX Q: FINAL PRESENTATION SLIDES 156

XVII
LIST OF FIGURES
Figure 1: Water withdrawal by Sector in the UAE (Food and Agriculture Organization of the
United Nations, 2005)...................................................................................................................1
Figure 2: Water Production by Sector in Sharjah (SEWA Annual Report, 2018)........................2
Figure 3: 1934-2014 Mean Annual Rainfall in Sharjah (Merabtene, 2016)................................3
Figure 4: SEWA 2020 Vision Pillars…………………………………………………………...5
Figure 5: Desalinated Water and Groundwater Production in Sharjah, UAE (SEWA, 2014-
2018).............................................................................................................................................8
Figure 6: The Hook Model (Eyal, 2013)...................................................................................11
Figure 7: Elements of the Marketing Mix (Booms and Bitner, 1981).......................................12
Figure 8: Methodology Objectives……………………………………………………………16
Figure 9: Marketing frameworks used for campaign analysis…………………...……………27
Figure 10: NVivo codes of a SEWA campaign……………………………………………….30
Figure 11: Similarities and differences between two SEWA campaigns……………………..30
Figure 12: Campaign Topic Report from Observational Study……………………………….31
Figure 13: Campaign Location Report from Observational Study……………………………32
Figure 14: Campaign Font Size Reports from Observational Study………………………….33
Figure 15: Campaign Colors Report from Observational Study…………………….………..33
Figure 16: Campaign Layout Reports from Observational Study…………………………….34
Figure 17: Campaign Physical Evidence Reports from Observational Study………….…..…34
Figure 18: AUS Target Audience Report from Observational Study……………………...….35
Figure 19: Campaign Delivery Method Report from Observational Study…...………………35
Figure 20: SEWA Target Audience Report from Observational Study………………………36
Figure 21: Campaign Investment Report from Observational Study…………………………36
Figure 22: Campaign Message Types Reports from Observational Study……………………37
XVIII
Figure 23: Campaign Trigger Reports from Observational Study……………………………38
Figure 24: Campaign Rewards Report from Observational Study……………………………39
Figure 25: Digital Screen promoting Design Sprint Workshops……………………………...50
Figure 26: Design Sprint Six Stages.………………………………………………………….51
Figure 27: Certificate of Participation for Design Sprint Workshop participants………...…..53
Figure 28: Design Thinking Workshop Understand Stage……………………………………55
Figure 29: Design Thinking Workshop Define Stage………………………………………...56
Figure 30: Design Thinking Workshop Diverge Stage……………………………………….57
Figure 31: Design Thinking Workshop Decide Stage……………………….………………..58
Figure 32: Design Thinking Workshop Prototype Stage…………………….………………..59
Figure 33: Design Thinking Workshop Validate Stage……………………………………….60
Figure 34: Marketing framework nodes in NVivo……………………………………………62
Figure 35: Flyer for the World Water Day Event……………………………………………..73
Figure 36: Map of the Event…………………………………………………………………..74
Figure 37: Respondent Distribution for Feedback Surveys………………….….…………….90
Figure 38: Eye-Catching Elements of Social Media Campaign………………………...…….91
Figure 39: Suggested Delivery of Social Media Campaign…………………………….…….92
Figure 40: Eye-catching Elements of App Campaign……………………………….…….….94
Figure 41: User Friendliness of App Campaign………………………………………………96
Figure 42: Eye-Catching Elements of Event Campaign………………………………….…...96
Figure 43: Interesting Elements of the Event Campaign………………….………………..…97

XIX
LIST OF TABLES
Table 1: Interview Protocol for SEWA Representatives Study I……………….…………22-23
Table 2: Interview Protocol for AUS Students and Faculty Study I………………….…...24-25
Table 3: The Elements of Selected Marketing Frameworks…………………………..…........26
Table 4: Published flyers for Design Sprint Workshop……………………………………….49
Table 5: Number of flyers distributed for each building on the AUS campus………………..50
Table 6: Materials used during the Design Sprint Workshops………………………………..52
Table 7: Campaigns produced from Design Sprint Workshops………………………............65
Table 8: All Campaign Prototypes Matrix……………………………………………..…..67-68
Table 9: Campaign Prototype Deliverable Matrix………………………………..…………...69
Table 10: Social Media Campaign Post……………………………………………….………70
Table 11: App Campaign Mockup...…………………………………………………………..72
Table 12: Interview Protocol for SEWA Representatives Study III…………..…………...82-83
Table 13: Survey Protocol for Sharjah Residents Study III……………………………….84-85
Table 14: SEWA Representatives Ranking of our Campaigns………………………………..89
Table 15: Liked and Disliked Design Elements of Social Media Campaign………………….93
Table 16: Additional Comments for Social Media Campaign………………………………...94
Table 17: Liked and Disliked Design Elements of App Campaign…………………..……….95
Table 18: Additional Comments Distribution Event Campaign………………………………98
Table 19: Campaign response distribution for “Is this campaign valuable?”……………..…..99
Table 20: Campaign response distribution for “Would you engage with this campaign?”.…100

XX
GLOSSARY AND ABBREVIATIONS
American University of Sharjah (AUS): a higher education institution located in Sharjah,
UAE.
Campaign: a planned set of activities that people carry out over a period in order to achieve
something such as social or political change (Collins Dictionary, n.d).
Design Sprint: a methodology where people are tasked to answer questions and solve
challenges within a time-constraint. It is used to generate a large amount of creative
ideas around any situation. (G.V., n.d.)
Hook Model: framework to market a product, the four main components are, Trigger, Action,
Variable Reward, and Investment. (Eyal, 2013)
Marketing Mix: variables that businesses control to implement a marketing strategy directed
at a specific target audience. The comments of this framework are: Product, Price,
Place, Promotion, People, Process, and Physical Evidence. (Booms and Bitner, 1981)
Middle East and North Africa (MENA): the countries in the northern region of Africa and
the western region of Asia, including Jordan, UAE, Saudi Arabia, Israel, and Egypt.
Sharjah Electricity and Water Authority (SEWA): a local government institution involved
in water management in Sharjah, UAE.
United Arab Emirates (UAE): a country in the Middle East comprised of seven Emirates,
including Sharjah, Abu Dhabi, and Dubai.

1
1.0 INTRODUCTION AND BACKGROUND
Water is an essential part of everyday life, and in recent decades, the importance of
conserving it has greatly increased. When a region lacks enough water resources to fulfill water
consumption demands, it is water stressed. Intensifying water stress can then lead to a severely
diminished state of water resources, which is referred to as water scarcity. Areas in the Middle
East and North Africa (MENA) are especially susceptible to such threats due to their climates
and locations. The United Arab Emirates’ (UAE) arid climate, rising population, and flourishing
tourism ranks it among the most water stressed regions, along with Kuwait, Qatar, and Saudi
Arabia.
The UAE is located in the Middle East between the Arabian Gulf and the Gulf of Oman.
Its climate is characterized by infrequent precipitation and high temperatures which adversely
contribute to the conservation of water resources and induce a water stressed state. Despite these
conditions, the UAE ranks among the highest per capita water consumers in the world (Khaleej
Times, 2016). Water usage by sector in the UAE can be seen in Figure 1. For the seven Emirates
overall, the largest water withdrawal is from irrigation and livestock, followed by municipalities
and industry.
Figure 1: Water withdrawal by Sector in the UAE (Food and Agriculture Organization of the
United Nations, 2005)

2
Even though the agricultural sector is one of the largest water consumers in the world,
this doesn’t apply to Sharjah in particular. In 2018, the residential sector consumed 61.8% of
water produced by the Sharjah Electricity and Water Authority (SEWA, 2018). Showers, tap,
and clothes washers account for most of this consumption (Willis, 2013). Second to that, the
commercial sector accounted for 24.06% of total consumption. This sector is preceded by the
government sector (9.11%), industrial sector (4.93%), and the agricultural sector (0.09%). The
water consumption breakdown by sector in Sharjah can be seen in Figure 2 below.
Figure 2: Water Production by Sector in Sharjah (SEWA Annual Report, 2018)
With over one million inhabitants, Sharjah is experiencing a population growth of urban
areas at a rate of 6.32% per year since 2015 (World Population Review, 2019). Consequently,
several government organizations have developed concerns regarding increased demands for
water (“About Sharjah”. n.d.). One of these organizations, SEWA, has made it their priority to
ensure water demands are met, despite an increasing population. This entails increasing water
supply through desalination and groundwater extraction, as well as alleviating demands by
encouraging water conservation.

3
Our project functions to further explore the efforts of water conservation in Sharjah. This
chapter of our paper provides a literary review that establishes the relevant context to approach
this problem. First, we discuss the environmental effects on Sharjah’s current water-stressed
state and SEWA’s role with water management. Then, we introduce the available water
resources in Sharjah to meet water consumption needs. Additionally, we provide example case
studies of ways other arid, urban areas similar to Sharjah have addressed water consumption.
Lastly, we explore the design elements and marketing strategies for educational campaigns.
1.1 ENVIRONMENTAL CONSTRAINT ON SHARJAH’S WATER
RESOURCES
According to the widely used climate classification system, the Köppen climate
classification, the UAE is considered a “hot desert climate”. There are two distinct seasons:
summer and winter. The summer period is characterized by high humidity and temperatures.
This season’s dust storms and scarce rainfall contribute to the desertification of the region. Most
rainfall occurs in the winter season. The amount of rainfall has decreased by between 3.0 mm
and 9.4 mm every decade since 1934, making surface water a limited resource (Merabtene,
2016). This trend can be seen in Figure 3 below.
Figure 3: 1934-2014 Mean Annual Rainfall in Sharjah (Merabtene, 2016)

4
Consequently, instead of relying on surface water, Sharjah uses two neighboring bodies
of water, the Arabian Gulf and the Gulf of Oman, as its primary source of water. The combination
of arid climate, limited surface water, and convenient access to seawater make desalination the
most feasible way to get water resources to the citizens of Sharjah. Ultimately, these
environmental issues of desertification, water pollution, and limited natural water resources have
led the UAE government to increase their funding for desalination plants. (Environmental
Threats, 2019)
1.2 ESTABLISHMENT OF WATER MANAGEMENT IN SHARJAH
Formed in 1971, SEWA, a member of the Ministry of Energy and Industry, has been
working to supply enough water and electricity resources to the consumers of Sharjah. The high
costs of desalination and population growth has led SEWA to find new alternatives to process
and store water (Almulla, 2005). Conversely, instead of solely increasing supply to meet
demand, SEWA has also taken the approach of decreasing demand by encouraging water
conservation among the citizens of Sharjah. SEWA, in collaboration with His Highness, Dr.
Sheikh Sultan bin Muhammad Al Qasimi, Supreme Council Member and Ruler of Sharjah, has
implemented diverse programs to educate the consumers about their water consumption
behaviors.
1.2.1 SEWA’S VISION AND GOALS
SEWA functions to enforce national and local water policies in Sharjah. The system
priorities of SEWA include reducing their impact on the climate and environment, having
sustainable growth, and building a culture that fosters national identity (“SEWA Vision 2020”,
n.d.). SEWA is passionate about being an impactful organization and has a vision of being one
of the most authentic organizations in the world.
Although SEWA began as a private company, it was nationalized once the economy,
industry, and civilization began to develop. His Highness Sheikh Dr. Sultan Bin Mohammed Al-
Qassimi, Supreme Council Member and Ruler of Sharjah, established SEWA as a financially
and administratively independent entity to distribute electricity, water, and natural gas to their

5
customers: the nationals and residents of Sharjah. As a government institution, SEWA has seen
tremendous growth in their infrastructure. For electric power, several new generation units,
distribution substations, and transmission substations were installed to increase power
generation. Similarly, SEWA has introduced additional desalination plants and well fields to
increase water production and increase water supply. Also, piped natural gas was introduced by
SEWA for domestic, commercial, and industrial purposes as a first of its kind in Sharjah.
(“SEWA About Us”, n.d.)
SEWA’s vision for 2020 is “to lead a globally successful, highly innovative, and
sustainable tomorrow”. This vision contains eight pillars as seen in Figure 4 to represent their
core priorities and to highlight their focus for their 2020 goals.
Figure 4: SEWA 2020 Vision Pillars
The eight pillars of SEWA’s vision are People, Performance, Planet, Project, Positioning,
Partners, Prosperity, and Profit. Within the first pillar, People, SEWA has a goal to be one of the
greatest employers in the world. The aims of this pillar are to attract the right talent to build an
experienced workforce, to integrate smart technology to support their business, and to have
effective Emiratization. The main goal of the second pillar, Performance, is to exceed customer
satisfaction and expectations through delivering reliable services of electricity, water, and natural
gas. The third pillar, Planet, has the goal to reduce energy and water consumption, carbon
emissions, and the environmental impact of their operations. A large part of this goal is to
promote water and energy conservation awareness to their over two million consumers,
6
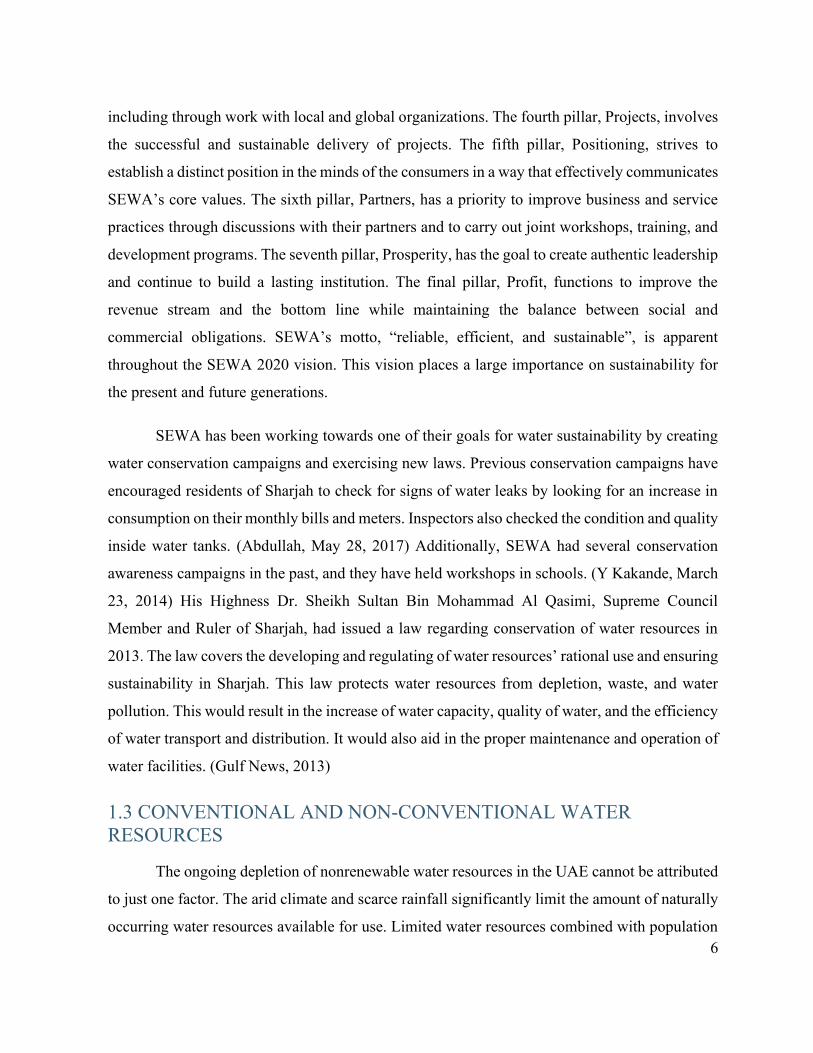
including through work with local and global organizations. The fourth pillar, Projects, involves
the successful and sustainable delivery of projects. The fifth pillar, Positioning, strives to
establish a distinct position in the minds of the consumers in a way that effectively communicates
SEWA’s core values. The sixth pillar, Partners, has a priority to improve business and service
practices through discussions with their partners and to carry out joint workshops, training, and
development programs. The seventh pillar, Prosperity, has the goal to create authentic leadership
and continue to build a lasting institution. The final pillar, Profit, functions to improve the
revenue stream and the bottom line while maintaining the balance between social and
commercial obligations. SEWA’s motto, “reliable, efficient, and sustainable”, is apparent
throughout the SEWA 2020 vision. This vision places a large importance on sustainability for
the present and future generations.
SEWA has been working towards one of their goals for water sustainability by creating
water conservation campaigns and exercising new laws. Previous conservation campaigns have
encouraged residents of Sharjah to check for signs of water leaks by looking for an increase in
consumption on their monthly bills and meters. Inspectors also checked the condition and quality
inside water tanks. (Abdullah, May 28, 2017) Additionally, SEWA had several conservation
awareness campaigns in the past, and they have held workshops in schools. (Y Kakande, March
23, 2014) His Highness Dr. Sheikh Sultan Bin Mohammad Al Qasimi, Supreme Council
Member and Ruler of Sharjah, had issued a law regarding conservation of water resources in
2013. The law covers the developing and regulating of water resources’ rational use and ensuring
sustainability in Sharjah. This law protects water resources from depletion, waste, and water
pollution. This would result in the increase of water capacity, quality of water, and the efficiency
of water transport and distribution. It would also aid in the proper maintenance and operation of
water facilities. (Gulf News, 2013)
1.3 CONVENTIONAL AND NON-CONVENTIONAL WATER
RESOURCES
The ongoing depletion of nonrenewable water resources in the UAE cannot be attributed
to just one factor. The arid climate and scarce rainfall significantly limit the amount of naturally
occurring water resources available for use. Limited water resources combined with population
7
growth and growing tourism necessitates the use of water processed by engineering systems,
which is referred to as non-conventional water resources. (Murad, 2010)
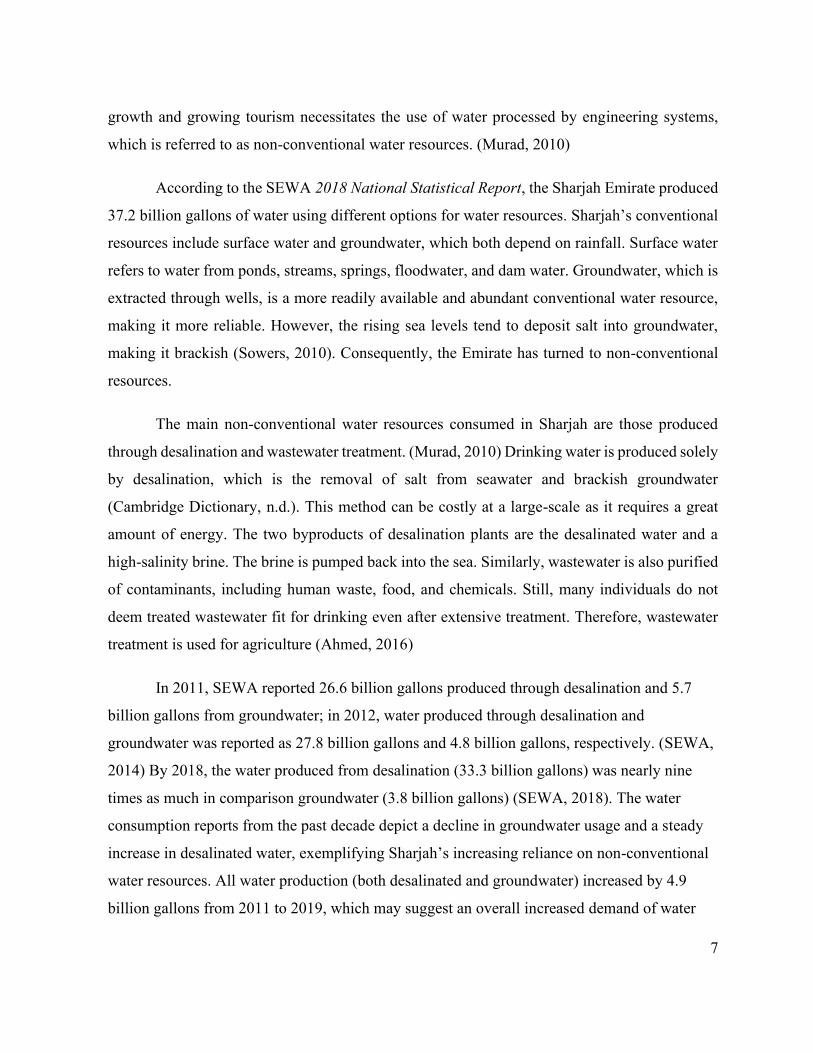
According to the SEWA 2018 National Statistical Report, the Sharjah Emirate produced
37.2 billion gallons of water using different options for water resources. Sharjah’s conventional
resources include surface water and groundwater, which both depend on rainfall. Surface water
refers to water from ponds, streams, springs, floodwater, and dam water. Groundwater, which is
extracted through wells, is a more readily available and abundant conventional water resource,
making it more reliable. However, the rising sea levels tend to deposit salt into groundwater,
making it brackish (Sowers, 2010). Consequently, the Emirate has turned to non-conventional
resources.
The main non-conventional water resources consumed in Sharjah are those produced
through desalination and wastewater treatment. (Murad, 2010) Drinking water is produced solely
by desalination, which is the removal of salt from seawater and brackish groundwater
(Cambridge Dictionary, n.d.). This method can be costly at a large-scale as it requires a great
amount of energy. The two byproducts of desalination plants are the desalinated water and a
high-salinity brine. The brine is pumped back into the sea. Similarly, wastewater is also purified
of contaminants, including human waste, food, and chemicals. Still, many individuals do not
deem treated wastewater fit for drinking even after extensive treatment. Therefore, wastewater
treatment is used for agriculture (Ahmed, 2016)
In 2011, SEWA reported 26.6 billion gallons produced through desalination and 5.7
billion gallons from groundwater; in 2012, water produced through desalination and
groundwater was reported as 27.8 billion gallons and 4.8 billion gallons, respectively. (SEWA,
2014) By 2018, the water produced from desalination (33.3 billion gallons) was nearly nine
times as much in comparison groundwater (3.8 billion gallons) (SEWA, 2018). The water
consumption reports from the past decade depict a decline in groundwater usage and a steady
increase in desalinated water, exemplifying Sharjah’s increasing reliance on non-conventional
water resources. All water production (both desalinated and groundwater) increased by 4.9
billion gallons from 2011 to 2019, which may suggest an overall increased demand of water

8
throughout the years from population growth. (SEWA, 2014-2018).This trend of decreasing
groundwater and increasing desalinated water is depicted in Figure 5.
Figure 5: Desalinated Water and Groundwater Production in Sharjah, UAE (SEWA, 2014-
2018)
1.4 MENA WATER CONSERVATION EDUCATIONAL CAMPAIGNS
Educational campaigns that encourage water conservation are widely implemented to
relieve stress on water resources. These campaigns tend to put the responsibility of water
conservation on the consumers, rather than the government or water suppliers. Thus, the
effectiveness of educational campaigns relies on the individual’s willingness to make sacrifices
for the common good. Hence, the success of an educational campaign depends primarily on the
persuasiveness of the material and its impact on consumer behavior long-term.
Two research studies of behavioral change campaigns from the MENA region are
explored in the following paragraphs. One study assesses the effectiveness of an educational

9
campaign, and the other explores the impact of tone and language on a campaign’s
effectiveness.
In 2016, Zietlow, Michalscheck, and Weltin conducted a research study, Water
conservation under scarcity conditions: testing the long-run effectiveness of a water
conservation awareness campaign in Jordan, to quantify the long-term effects of a water
conservation campaign on consumer behavior. This campaign promoted individual water
conservation strategies by putting a cartoon figure of a Jordanian man at the forefront of
advertisements. The data was collected five years after the campaign through the Public Action
for Water, Energy, and Environment Project with a survey (n=367) that randomly selected
people who managed their household’s water, fuel, and waste. This survey assessed the
participants’ awareness of the scarcity itself, their consequent responsibility, and their water
conservation actions.
The campaign was found to have a long-term effect on water conservation awareness.
The campaign increased people’s sense of accountability and responsibility for the water
scarcity. Though people may have felt more responsible for their effect on water scarcity, it did
not induce behavioral changes to the extent where people would adjust their water usage. It was
determined that the effectiveness of a campaign cannot be seen in such a short period of time; it
must be over a longer period.
Another case study similar to our project was detailed in the article Still Waters Run
Deep: Comparing the assertive and suggestive language in water conservation campaigns by
Katz in 2018. The article’s focus is to indicate and compare the effectiveness of using assertive
and suggestive messages in water conservation campaigns in Israel. An example of assertive
language would be “You must conserve water”, whereas a suggestive message would be “Please
consider conserving water”. The style of communication can affect the consumer’s water
consumption rate, as the authors described. They used the method of conducting the study in a
real-life environment to determine the effectiveness of the assertive and suggestive messages
within a three-month time frame on water consumption rate. The study found that both assertive
and suggestive messages had an impact on reducing water consumption rate; however, the

10
suggestive had a stronger impact in both magnitude and duration. This article’s method of
collecting the campaign’s data suggests a concise and practical method. Katz focused primarily
on comparing between two styles of communication rather than determining the behavioral
impact of conservation campaigns.
Both case studies share a campaign location with our study: The Middle East. Thus,
similar environment and climate appear in both locations, which makes these studies more
relevant in our literature review to provide context to water conservation campaigns in MENA.
The research study conducted by Zietlow, Michalscheck, and Weltin presented campaigns to
change behavior but it was determined that more personal responsibility was needed and that it
would take more time to see changes in behavior. Although both Katz’s and our research pertain
to water conservation, Katz’s primary focus was on the messaging. Both case studies provide
integral background on the messaging and time required for campaigns to influence behavior.
1.5 USING MARKETING TECHNIQUES IN A CAMPAIGN
A campaign is defined as “a planned set of activities that people carry out over a period
of time in order to achieve something such as social or political change” (Collins Dictionary,
n.d). A campaign can be delivered in a multitude of ways, including social media, television, and
newspaper.
Like products and commodities, campaigns are “sold” to the consumer, in that they
require consumer engagement. In order to market a campaign for consumers to be receptive of
it, marketing frameworks are used to plan and organize (Mangles, 2019). The Hook Model is a
framework which helps to invest the customer into a product by creating a habit; the Seven P's
of the Marketing Mix shows the essential core components of a product, such as the price and
place. Additionally, principles of psychology play a major role in the interaction between the
consumer and products created from marketing frameworks.

11
1.5.1 THE HOOK MODEL
One framework to market a product is the Hook Model. It is used to build a habit-
forming relationship between a product and a customer. The components of the Hook Model
can be seen in Figure 6 below.
Figure 6: The Hook Model (Eyal, 2013)
The main purpose of this model is to hook consumers to use a product or complete certain
actions to build a habit. The Hook Model is cyclic and contains four main components: Trigger,
Action, Variable Reward, and Investment (Eyal, 2013).
The Trigger is what draws the consumer towards the product, beginning the cycle. The
message can vary in language, tone, design, delivery, and in other respects. Now that the
attention of the consumer has been gained, the consumer can perform an action in expectancy to
get a reward. In this model, the Action is expected to be a small amount of work which can be
done quickly (e.g. repairing water leaks). Then, the consumer is rewarded for doing the action.
The Variable Reward is a random result which is caused by the consumer’s actions. The
anticipation of being rewarded creates a strong positive reaction from the consumer when
rewarded. In some cases, the consumer is not rewarded immediately after completing the action.
For example, a smaller water bill at the end of the year is not an immediate reward. Moreover,
the reward does not have to be of materialistic value. For instance, it could be personal
gratification. Finally, after putting in much time and effort, the consumer will be invested in the
cycle. This Investments will start the cycle again by making the consumer continuously complete

12
the action again to receive rewards. For example, a consumer who checks for any water leaks
every six months would be invested in this cycle. (Filippou, 2016)
1.5.2 SEVEN P’S OF THE MARKETING MIX
The Marketing Mix refers to variables that businesses control to implement a marketing
strategy directed at a specific target audience. Moreover, this framework is used to describe the
different kinds of choices organizations must make to achieve their marketing objectives. The
original Marketing Mix framework was created by E. Jerome McCarthy in 1960 and consisted
of four elements: Product, Price, Place, and Promotion. Later, the model was extended by Booms
and Bitner in 1981 to include a total of seven elements. (Marketing Theories, n.d.) The seven
elements included in the Extended Marketing Mix framework are illustrated in Figure 7.
Figure 7: Elements of the Marketing Mix (Booms and Bitner, 1981)
The Seven P’s of the Marketing Mix include Product, Price, Place, Promotion, People,
Process, and Physical Evidence.
Product

13
Product refers to the service and the range of products that will be sold. This element
includes the quality, branding, and reputation of the product. An important aspect is the support
provided for the consumer after the purchase. An example of this is when campaigns include a
contact number to answer any questions the consumer may have.
Price
Price refers to how much the business will charge for the purchase of its product.
Organizations may use different approaches to pricing, including value-based pricing. Value-
based pricing includes setting the price based on the consumer’s perception of value rather than
the organization’s cost as well as using a marketing strategy to enhance the perceived value in
the consumer’s mind.
Place
Place refers to where the product or service is being distributed. This includes the
location and accessibility of the product. Some distribution channels include producer-consumer,
producer-retailer-consumer, and producer-wholesaler-retailer-consumer. The choice of
distribution channel influences the types of customers the product attracts, the perception of the
product in the market, and the ease with which the consumer can access the product.
Promotion
Promotion refers to how a business communicates with consumers about the product.
Furthermore, there is a Promotional Mix which includes personal selling, relationship marketing,
advertising, sales promotion, and public relations. Mediums of advertising include television,
radio, social media, and pamphlets.
The following elements belong to the extended Marketing Mix framework:
People
People refers to how the business’s staff and consumers differ from those of a
competitor’s organization. It is important to have the right people to support the business’s
products, as this is reflected through the customer service. Customer service is critical to selling
the business’s product.

14
Process
Process refers to how the product is sold, delivered, and accessed. This element includes
the consumers’ complete experience of buying the product from beginning to end; this is how
the product is bought by the consumer. Customer service is integral to this element for the buying
process to improve customer satisfaction.
Physical Evidence
Physical Evidence refers to how the product becomes tangible. Physical Evidence is the
physical appearance of the product across every aspect of its presentation to the consumer (e.g.
packaging). Each aspect of Physical Evidence is crucial in attracting consumers to the product.
(Farall, Lindsley, March 2008)
Ultimately, the elements in the Marketing Mix model (Product, Price, Place, Promotion,
People, Process, and Physical Evidence) are strategies to connect a product or service with a
consumer. With the consideration of each of these elements, an organization will have a clear
idea of the methods needed to get the final product to their target audience.
1.5.3 PSYCHOLOGY OF MARKETING CAMPAIGNS
A marketing campaign’s message, delivery, and design can be polished, but ultimately,
the success relies on the marketer’s ability to engage the consumer. Thus, psychological concepts
can be utilized in marketing to persuade the consumer to invest in a product. Language style, the
Foot-in-the-door technique, persuasive rhetoric, and rewards are a few of the many ways
psychology can be incorporated into a campaign to promote consumer engagement.
Language is a factor that must be considered when delivering a campaign or any product;
the communication of the product from the marketer to the consumer is crucial when trying to
successfully spark interest and engage the consumer. The style and tone used to present a
campaign can greatly impact the reception of such. As for water conservation campaigns,
according to Katz (2018), both assertive and suggestive messages had an impact on reducing
water consumption; however, the suggestive had a stronger impact in both magnitude and

15
duration. Consequently, the consumer’s perception of educational campaigns can have a major
influence on how much water they conserve (Masoud, 2014).
The Foot-in-the-door Technique is a phenomenon where the marketer asks the customer
to complete tasks in increasing size over time (Dolinski, 2012). For example, the marketer may
ask the customer to recycle bottles at home in one campaign. The next campaign may then be to
buy a water filter and then a reusable water bottle. The first request builds the relationship with
the customer and increases the chance they will fulfill the additional requests.
Rhetoric, a style of writing with the purpose to influence the reader, is useful when trying
to persuade a consumer into engaging with a product. (Cambridge Dictionary, n.d) The three
types of rhetoric are pathos, ethos, and logos. Pathos is used to persuade the audience by
appealing to their emotions, such as pity and sympathy. This can be seen in campaigns
encouraging individuals to conserve water by presenting footage of underprivileged people who
do not have access to clean water. Ethos appeals to the audience’s ethics and morals; therefore,
religion plays a large role in this. For instance, individuals who believe the creation of the planet
was from a divine nature then may be more inclined to take care of the environment, especially
when the religious texts ask them to do so. Finally, logos persuades through logic, which is
primarily done through descriptive statistics and facts. (Varpio, 2018)
Positive reinforcement through rewards encourage continued participation from the
customer. Many organizations implement this technique in their marketing through point
systems. For instance, some restaurants give customers “points” for each purchase. Once
customers reach a certain number of points, they would then earn a free item. Similarly, some
water conservation campaigns make use of incentives to save water, such as receiving a
percentage off a water bill or a voucher for free items. In addition to these fixed-ratio rewards,
there are also variable rewards where the earnings are sporadic. These incite curiosity in the
customers to come back and gamble their chances of receiving a reward.
1.6 OVERVIEW OF METHODS
Our project focuses on the use of educational campaigns to encourage the Sharjah
community to conserve water. The goal of this project is to design and evaluate campaigns for

16
SEWA that suggest limiting water consumption. This goal can be broken up into three studies:
The Exploration Study (Study I), the Design Study (Study II), and the Feedback Study (Study
III). The tasks relating to our goal is seen in Figure 8.
Figure 8: Methodology Objectives
In Chapter Two: Study I, the group analyzed both previous and ongoing campaigns.
Based on the perceived strengths of these campaigns, the appropriate elements to fulfill each
component of our marketing framework were determined. In Chapter Three: Study II, the
researchers held Design Sprint workshops to receive a large pool of prototypes. Additionally,
the researchers narrowed down the prototypes to three campaigns and determined the respective
methods of delivery. In Chapter Four: Study III, the researchers inquired feedback on the three
campaign prototypes produced from Study II, and formulated recommendations.
1.7 SUMMARY
The high temperatures and scarce rainfall in regions of MENA pose greater risks to the
naturally occurring water resources; limited water resources combined with excessive water
consumption leads to a phenomenon known as water stress. Among these water stressed regions
is the UAE, which ranks as one of the highest per capita water consumers in the world. To
alleviate water stress, governments in places like the UAE, Jordan, and Israel have implemented
educational campaigns to spread awareness of water conservation and sustainability as well as
to mitigate water consumption. These campaigns require strong messages to change behavior.
To do this, campaign creators can take into consideration marketing frameworks when
developing a campaign from beginning to end. Additionally, applying psychological principles,

17
such as rewards and persuasive language, can help to influence and engage the consumer.
Ultimately, building a culture which emphasizes the importance of water conservation holds
many benefits when attempting to discourage excessive water consumption.

18
2.0 THE EXPLORATION OF CONSERVATION EFFORTS IN
SHARJAH, UAE
In this chapter, we will discuss our exploratory qualitative study of current and previous
campaigns focused on changing behavior of the residents of Sharjah in the United Arab Emirates
(UAE). First, we will establish relevant context and our research questions. Then, we will discuss
the exploratory methods we used to collect qualitative data. An analysis of the data will be
presented, which included a deconstruction of the campaigns’ elements using two marketing
frameworks, the Marketing Mix and the Hook Model. Finally, we will end with a discussion,
recommendations, and a conclusion based on our findings.
2.1 INTRODUCTION
The UAE’s arid climate, characterized by infrequent precipitation and high temperatures,
limits the total amount of water resources dependent on rainfall. Despite this, the UAE ranks
among the highest per capita water consumers in the world (Khaleej Times, 2016). The high
water consumption, combined with a rising population, increased tourism, and limited water
resources, has led the country to become one of the most water stressed regions in the world,
along with Kuwait, Qatar, and Saudi Arabia. (ICARDA, 2019)
The UAE’s current state of water stress has led authorities within the Emirates to find
new alternatives to meet water demands. Particularly in the Emirate of Sharjah, the Sharjah
Electricity and Water Authority (SEWA) has been attempting to limit water consumption
through studies and campaigns promoting water conservation. Instead of solely focusing on
increasing water supply to meet the demands, SEWA has also been taking the approach of
alleviating demands by encouraging water conservation among the citizens of Sharjah.
In order to impact water consumption among the citizens, it is important to understand
the demographics of Sharjah. There are 171,698 students in the Emirate of Sharjah. These
students are a high priority from the government of Sharjah—His Highness Dr. Sheikh Sultan
bin Muhammad Al-Qasimi, Supreme Council Member and Ruler of Sharjah, advocates for
higher education and established University City, which is a district that hosts over 15

19
educational institutions. (Gulf News, 2015) His Highness is the President of one of these
institutions: American University of Sharjah (AUS).
When attempting to implement water conservation campaigns in Sharjah, an exploration
of all campaigns that influence behaviors of the Sharjah community is helpful; whether the
campaign is centered on water conservation or other topics, similar methods can be utilized to
appeal to the same target. This then poses the primary research question guiding our study:
“What are the social benefit campaigns that have already been created in Sharjah?''. Our
exploratory study functions to answer this through methods of observation and interview.
In the following sections of this chapter, we first present the observation and interview
methodologies used to explore our research question and achieve our research objectives.
Then, we present our findings from the observational study and the interviews. Lastly, we end
this chapter with a discussion, recommendations, and a conclusion.
2.2 METHODS
The goal of this study is to explore social benefit change campaigns within Sharjah. In
order to achieve the goals of the study, we created and followed a methodology that consisted of
the collection and analysis of observational and interview data. Our objectives of this study were
to first identify the types of campaigns and then characterize common themes between them. In
this section, we will describe in detail the research and data collection methods that we used to
achieve our research objectives and goals.
First, we executed an observational study to identify current campaigns, including but
not limited to those pertaining to sustainability. Then, we conducted interviews to get more
insight on the campaign design process. From these two methods, data was collected and then
analyzed.
2.2.1 PARTICIPANTS
The participants in our study include representatives from SEWA’s Conservation
Department and the AUS Office of Sustainability. We planned to gain insight from these

20
representatives through interviews. The interview with SEWA representatives was scheduled in
advance by contacting a liaison to recruit participants from the SEWA Conservation Department.
For the Office of Sustainability interview, we discovered the Office of Sustainability during our
observational study and set up an interview with one of the representatives.
2.2.2 DATA COLLECTION
Our study consists of two data collection procedures, an observational study and
interviews. We conducted an observational study on the AUS campus. Additionally, we
interviewed representatives from the SEWA Conservation Department and the AUS
Sustainability Office.
2.2.2.1 Observational Study
The observational study was conducted on the AUS campus. The buildings that were
explored included the Engineering and Sciences Building, Main Hall, Student Center, Business
and Management Building, Library, and Dormitories. We spent several days photographing
instances of campaigns and uploading them to a shared folder.
In addition to our data collection efforts on the AUS campus, SEWA also provided us
with information about their previous campaigns. The document listed all their achievements in
2018, which included summaries of each campaign as well as statistical data indicating their
respective successes. Each of the campaigns pertaining to conservation was screen captured and
uploaded to a shared folder.
2.2.1.2 Interviews
Prior to the start of the interviews, the interviewees were presented with the Informed
Consent Form (Appendix C and D). Once the form was signed, each researcher audio recorded
the interview on their digital devices. One researcher used Otter, a voice transcription service, to
automatically transcribe the audio recorded during the interviews. Similar protocols were
followed for both the AUS and the SEWA interviews, with some minor differences. The
protocols for each interview are discussed in the following paragraphs.

21
Regarding the SEWA Conservation Department interview, four researchers were present
to conduct the interview. This interview lasted 40 minutes. The protocol can be seen in Table 1.

22
Table 1: Interview Protocol for SEWA Representatives Study I
Prior to the interview:
We want to thank you for accepting this interview. We are working on a research study for
SEWA. Part of our study is understanding the current state of water conservation efforts in
Sharjah. This background will help us in the next step of our study which involves the
designing of water conservation campaigns. The purpose of this interview is to gather
information on the best ways to educate people on water conservation.
Could you please indicate by signing the Informed Consent Form that we have your
permission to audio record this interview to help us in the transcription process of this
interview?
[Informed Consent Form is given to interviewees]
[We confirm yes or no with the participant to being audio recorded]
[If yes]
Thank you for your permission; we will now begin the interview and begin recording.
[If no]
Thank you for letting us know; we will continue with the interview by only taking notes.
Topic Area Explanation of Topic Area Examples of a Type of
Question
Interviewee’s Background Describe the role the
interviewee has with the
SEWA Conservation
Department.
“Can you explain what your
job and your role is with
SEWA?"
Design Process Describe the methods used
to design a campaign (target,
cost, media, duration,
deliverable, etc.).
“How long does it take to
design each campaign?” and
“How do you create a name
for a campaign?”

23
Ongoing and Future
Campaigns
Describe current and future
campaigns. “What are the upcoming
campaigns?”
Measurement of Outcome Describe how the success of
a campaign is measured
after its execution.
“How do you measure other
campaigns?”
Interviewee’s
Recommendation
Provide any additional input,
especially on how to design
a campaign.
“What do you believe is the
cost-effective way to spread
the message?”
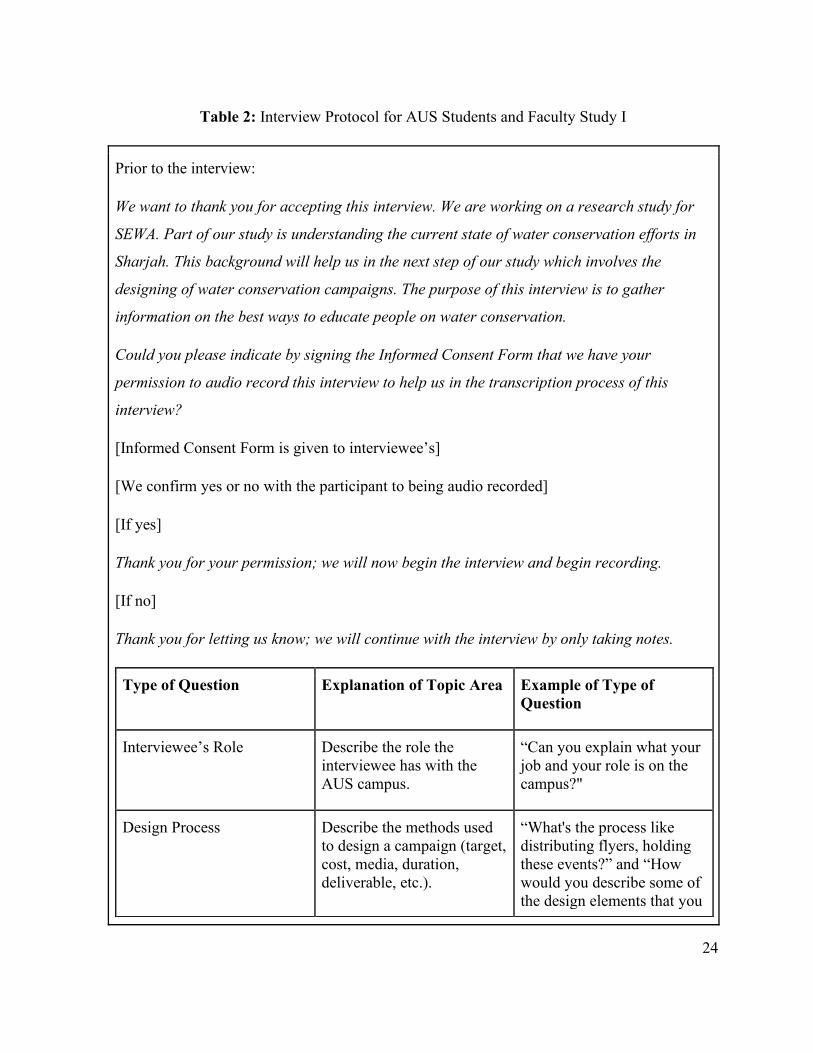
For the interview with the representative of the AUS Office of Sustainability, three
researchers were present to conduct the interview. This interview lasted 25 minutes and was
audio recorded. The protocol is presented in Table 2.
24
Table 2: Interview Protocol for AUS Students and Faculty Study I
Prior to the interview:
We want to thank you for accepting this interview. We are working on a research study for
SEWA. Part of our study is understanding the current state of water conservation efforts in
Sharjah. This background will help us in the next step of our study which involves the
designing of water conservation campaigns. The purpose of this interview is to gather
information on the best ways to educate people on water conservation.
Could you please indicate by signing the Informed Consent Form that we have your
permission to audio record this interview to help us in the transcription process of this
interview?
[Informed Consent Form is given to interviewee’s]
[We confirm yes or no with the participant to being audio recorded]
[If yes]
Thank you for your permission; we will now begin the interview and begin recording.
[If no]
Thank you for letting us know; we will continue with the interview by only taking notes.
Type of Question Explanation of Topic Area Example of Type of
Question
Interviewee’s Role Describe the role the
interviewee has with the
AUS campus.
“Can you explain what your
job and your role is on the
campus?"
Design Process Describe the methods used
to design a campaign (target,
cost, media, duration,
deliverable, etc.).
“What's the process like
distributing flyers, holding
these events?” and “How
would you describe some of
the design elements that you

25
use?”
Ongoing/ Future Campaigns Describe current and future
campaigns. “Are there any other
upcoming campaigns,
maybe they're not in the
works, but something you
guys plan to implement in
the future?”
Measurement of Outcome Describe how the success of
a campaign is measured
after its execution.
“How do you measure other
campaigns?”
Interviewee’s
recommendations
Provide any additional input,
especially on how to design
a campaign.
“Do you have any
recommendations?”
2.2.2.3 Summary of Data Collection
Our exploratory study collected data on social benefit campaigns through an
observational study and interviews. For the observational study, we explored different buildings
on the AUS campus and documented the campaigns that we saw. The campaigns were
photographed and uploaded to a shared folder. Additionally, the campaigns listed in the report
of SEWA’s achievements in 2018 were screen captured and uploaded to the folder. The target
of our interviews were people directly involved with campaign design processes. Therefore, we
interviewed representatives from the SEWA Conservation Department and the AUS Office of
Sustainability. Interview topics included the interviewees’ background and position, as well as
the design, execution, and outcomes of their campaigns.
2.2.3 DATA ANALYSIS
For the observational study, we thematically coded the collected campaigns based upon
their corresponding elements to two marketing frameworks: The Hook Model and the Marketing
Mix. We completed this through NVivo, a qualitative analysis software. We transcribed the

26
interviews using Otter, a real-time transcription software. Once transcribed, the interviews were
summarized into the key points and themes.
2.2.3.1 Observational Study
We analyzed the data from the observational study by using the two marketing
frameworks, which are composed of design elements that aid in the marketing of a product. The
Hook Model explores the campaign’s message, especially with behavioral changes, and the
Marketing Mix focuses on the campaign’s physical structure and deliverables. We used these
models as an analytical framework to determine each campaign’s executed elements. For
example: What was the campaign’s hook? What was the product? The elements of each
framework are presented in Table 3.
Table 3: The Elements of Selected Marketing Frameworks
The Hook Model The Marketing Mix
Trigger Product
Action Promotion
Variable Reward Price
Investment Place
People
Process
Physical Evidence
Images of each campaign was pasted into a document, where we noted the corresponding
elements from the marketing frameworks. We imported the images into a qualitative analysis
software, NVivo, in order to thematically code campaigns based upon the marketing frameworks
elements. The nodes or “categorizations” were created corresponding to each element of both
marketing frameworks. The campaign images were then coded. In other words, campaigns were
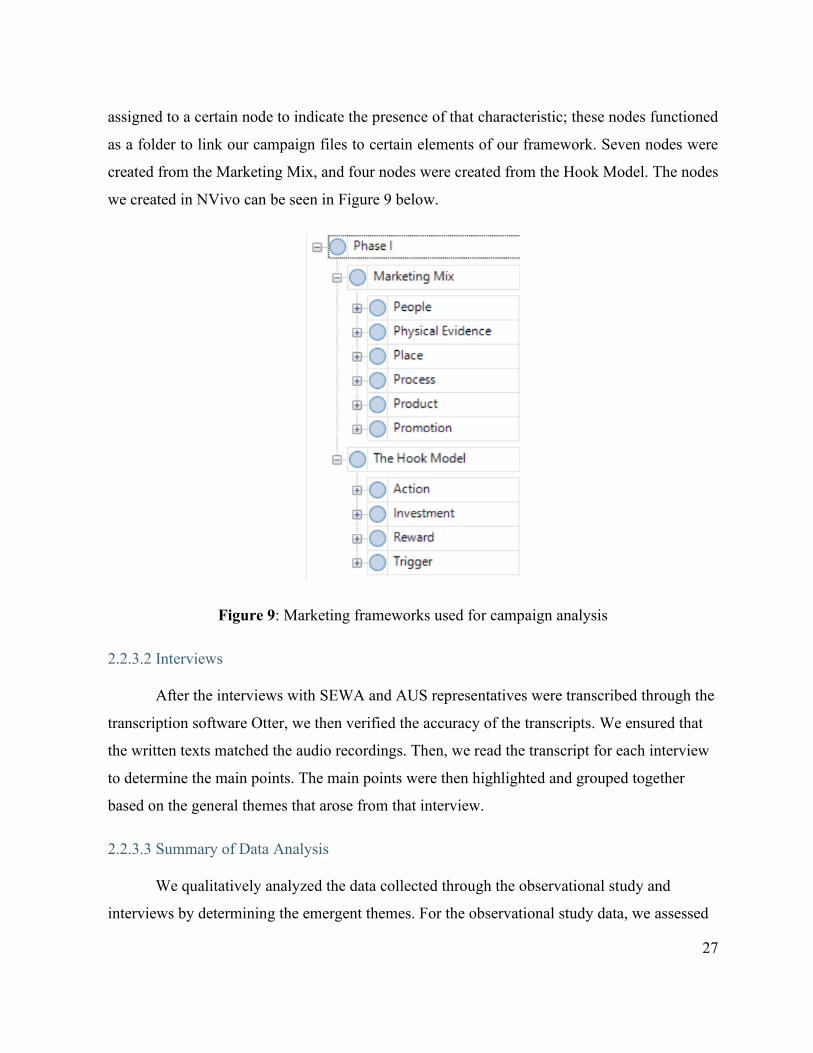
27
assigned to a certain node to indicate the presence of that characteristic; these nodes functioned
as a folder to link our campaign files to certain elements of our framework. Seven nodes were
created from the Marketing Mix, and four nodes were created from the Hook Model. The nodes
we created in NVivo can be seen in Figure 9 below.
Figure 9: Marketing frameworks used for campaign analysis
2.2.3.2 Interviews
After the interviews with SEWA and AUS representatives were transcribed through the
transcription software Otter, we then verified the accuracy of the transcripts. We ensured that
the written texts matched the audio recordings. Then, we read the transcript for each interview
to determine the main points. The main points were then highlighted and grouped together
based on the general themes that arose from that interview.
2.2.3.3 Summary of Data Analysis
We qualitatively analyzed the data collected through the observational study and
interviews by determining the emergent themes. For the observational study data, we assessed
28
campaigns one at a time by recording the elements of each campaign that corresponded to two
marketing frameworks. These elements included Trigger, Action, Reward, Investment (from
the Hook Model) and Product, Price, Place, Promotion, People, Process, Physical Evidence
(from the Marketing Mix). A qualitative software called NVivo was used to thematically code
each campaign by these elements. Once each campaign was annotated by its elements,
comparisons were made across the campaigns; NVivo aided in determining similarities and
differences between campaigns. We denoted these comparisons as themes.
Similarly, interviews were deconstructed into themes. Once the interviews were
transcribed through a transcription software called Otter, the key points were highlighted.
Themes from the interviews with representatives from SEWA and AUS were analyzed
independently of each other.
2.2.4 SUMMARY OF METHODS
In this section, we discussed the methods we used to explore social benefit campaigns
implemented in Sharjah. Our methods include techniques of observation and extended
interviews. We touched upon participant identification and recruitment, data collection
procedures, and data analysis.
In our observational study, we reported AUS and SEWA campaigns we saw. AUS
campaigns were found on campus and were photographed; SEWA campaigns were found in
the report of SEWA’s achievements in 2018 and were screen captured. We documented the
elements of each campaign corresponding to the marketing frameworks. A qualitative analysis
software, NVivo, allowed us to organize each campaign along with its elements. Once each
campaign was inputted, we could make comparisons and identify themes.
For the second part of this study, we conducted interviews. We interviewed
representatives from the SEWA Conservation Department and the AUS Office of
Sustainability. We created a protocol for each interview that included a script and list of
questions. During these interviews, questions were asked regarding the campaign design
process. The interviews were recorded and transcribed in real-time. Following the interviews,

29
the researchers confirmed the transcription was accurate and began highlighting the main
points of each interview and grouping them to create themes.
2.3 FINDINGS
First, we will present the findings from the observational study on the AUS campus,
then we will present the findings from the interviews with the SEWA conservation department
and the AUS Office of Sustainability.
2.3.1 OBSERVATIONAL STUDY
In this section, we present the findings that emerged from the data collection and
analysis procedures detailed in the previous section. Our thematic coding of the campaigns we
observed produced several key findings that arose when we attempted to answer the research
question. We identified common themes between seventy campaigns created by individuals
affiliated with either AUS or SEWA; images of each campaign are included in Appendix K.
Thematic Coding of Campaigns
For instances where certain campaigns did not fit into a node, a new node was created
to represent a more fitting categorization. This allowed the categorization process to be
emergent with new themes actively being discovered to accurately represent each campaign,
rather than forcing individual campaigns to fit into the pre-existing nodes. An illustration of
our final marketing frameworks used in NVivo can be seen in Appendix L. In the sections
below, we discuss the main themes we saw among both the AUS and SEWA campaigns.
Within each node, we created additional nodes to subcategorize the photographs of
campaigns. Each campaign was coded into at least one subcategory for every marketing
framework node. For the instances when certain campaigns could not be coded into a certain
node, we created new nodes to fit the data. An example of the coding of a SEWA campaign
can be seen below in Figure 10.
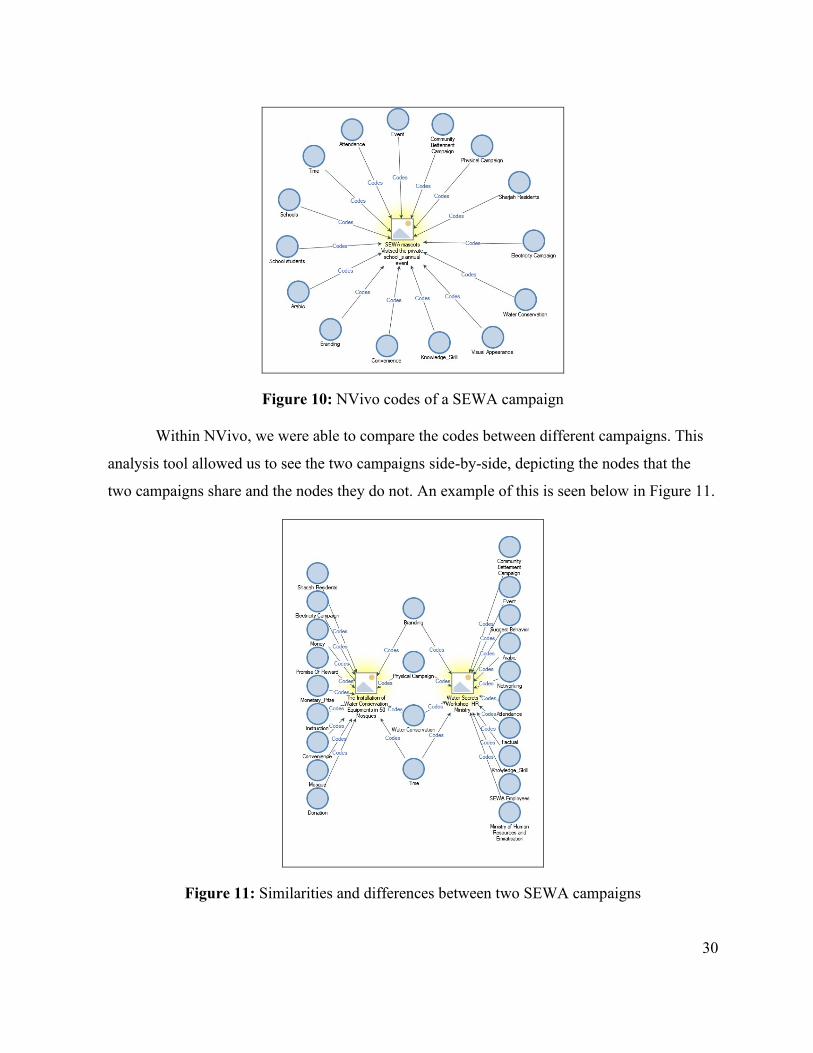
30
Figure 10: NVivo codes of a SEWA campaign
Within NVivo, we were able to compare the codes between different campaigns. This
analysis tool allowed us to see the two campaigns side-by-side, depicting the nodes that the
two campaigns share and the nodes they do not. An example of this is seen below in Figure 11.
Figure 11: Similarities and differences between two SEWA campaigns

31
One example of the subcategories that emerged from the thematic coding is seen in
Figure 12 below, which indicates the topics of each campaign.
Figure 12: Campaign Topic Report from Observational Study
By comparing the subcategorized nodes of each campaign, we were able to visualize
themes. In the following sections, we discuss our six findings regarding campaigns’ location,
design elements, target audience, investments, messaging, and rewards.
Finding #1: A campaign’s location is key to its success.
During our observational study, the physical campaigns we saw on the AUS campus
were almost always placed in high-traffic areas to increase the level of outreach. In the Student
Center, flyers were pasted on mobile bulletin boards which were positioned around the floor.
The placement of these mobile bulletin boards increased the visibility, as the bulletin boards
essentially lined the pathway for people entering the space. Additionally, there were many
bulletin boards on the outside walls of buildings with many flyers. Some flyers were pasted on
bathroom doors, such as on the Library’s main floor. Large stand-alone banners were placed by
staircases or tables in large open spaces.
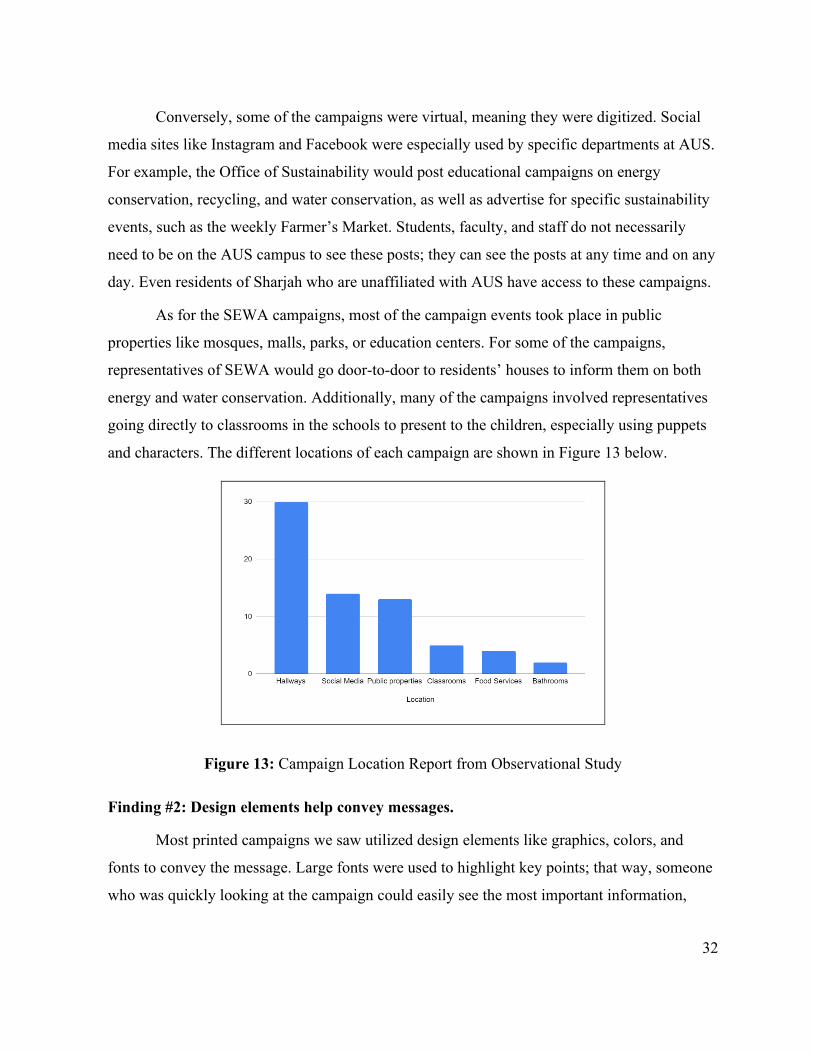
32
Conversely, some of the campaigns were virtual, meaning they were digitized. Social
media sites like Instagram and Facebook were especially used by specific departments at AUS.
For example, the Office of Sustainability would post educational campaigns on energy
conservation, recycling, and water conservation, as well as advertise for specific sustainability
events, such as the weekly Farmer’s Market. Students, faculty, and staff do not necessarily
need to be on the AUS campus to see these posts; they can see the posts at any time and on any
day. Even residents of Sharjah who are unaffiliated with AUS have access to these campaigns.
As for the SEWA campaigns, most of the campaign events took place in public
properties like mosques, malls, parks, or education centers. For some of the campaigns,
representatives of SEWA would go door-to-door to residents’ houses to inform them on both
energy and water conservation. Additionally, many of the campaigns involved representatives
going directly to classrooms in the schools to present to the children, especially using puppets
and characters. The different locations of each campaign are shown in Figure 13 below.
Figure 13: Campaign Location Report from Observational Study
Finding #2: Design elements help convey messages.
Most printed campaigns we saw utilized design elements like graphics, colors, and
fonts to convey the message. Large fonts were used to highlight key points; that way, someone
who was quickly looking at the campaign could easily see the most important information,

33
such as the core message or name of event. Below in Figure 14, the distribution between small
fonts and large fonts is shown.
Figure 14: Campaign Font Size Reports from Observational Study
Different colors were used for each campaign. In many instances, the colors were
associated with the message. Greens were often used for recycling and blues were used for
water conservation. Figure 15 below shows the distribution of different color themes.
Figure 15: Campaign Colors Report from Observational Study
The layouts of printed campaigns were generally based upon the amount of text. We
saw that campaigns with more details were sometimes crowded; there was a lot of content to fit
into one campaign. Majority of the campaigns we saw had a crowded layout. Figure 16 below
shows the ratio of minimalistic designs to crowded designs.

34
Figure 16: Campaign Layout Reports from Observational Study
The most telling design element we saw used in printed campaigns was graphics and
branding. A large majority used either one or both. Graphics were usually supplemental to the
message, and branding helped with contact information. In Figure 17 below, the frequency of
branding and graphics used in the campaign is shown.
Figure 17: Campaign Physical Evidence Reports from Observational Study
Finding #3: Campaigns should reach their target audiences through different methods.
AUS comprises a broader demographic, consisting of students and faculty from all
backgrounds and ages. The breakdown of the target audience of AUS campaigns is shown in
Figure 18 below.

35
Figure 18: AUS Target Audience Report from Observational Study
The diverse nature of the AUS campus poses challenges when targeting campaigns
towards the larger community of AUS, as individuals have different commitments and schedules
on campus. Therefore, AUS uses different methods to reach their community of students, staff,
and faculty rather than disrupt their tight schedules. These delivery methods include social
media, events, and flyers. Each one of the campaigns reaches a similar demographic. For
example, AUS announces events through multiple social media, reaching out to Facebook and
Instagram users involved in the AUS community. The target audience has access to these
campaigns for extended periods of time; for example, a social media post lasts longer than a
verbal campaign. The different deliverables are shown in Figure 19.
Figure 19: Campaign Delivery Method Report from Observational Study

36
Conversely, some campaigns are targeted to narrower demographics which requires
different delivery approaches. SEWA’s primary targets in the 2018 campaigns were children,
families, mosques, students, and government departments. The targets of SEWA’s campaigns
we observed are shown in Figure 20 below.
Figure 20: SEWA Target Audience Report from Observational Study
Each campaign strategically focused on one small group at one time, such as with
workshops held in schools for young children. Since SEWA has a narrower demographic as the
goal of their campaigns, the events need to be more tailored and focused. The narrower focus
allows SEWA to execute more interactive campaigns, such as going door-to-door to educate
families on how to conserve.
Findings #4: Campaigns do not normally involve monetary investments.
From the found campaigns, most included some sort of investment from the audience.
The types of investments we saw are shown in Figure 21.
Figure 21: Campaign Investment Report from Observational Study

37
Most asked for the audience to use their time to engage with the campaign. In some
cases, the messages of the campaigns encouraged continual engagement by forming a habit.
We noticed that very few campaigns required a monetary investment from the target audience;
a potential example of this type of campaign would be a fundraising or a competition that
needed materials or had an entrance fee.
Findings #5: Messages of campaigns are framed differently.
Most of the campaigns consisted of a central message or hook with supporting details.
Generally, the types of messages we saw fell into the categories Factual, Instructional,
Behavioral Change, and Event Advertisement, to which we assigned nodes in NVivo. Many
campaigns overlapped between these areas, such as a Smoking Kills campaign listing the
negative implications on health (Factual) while also encouraging individuals to quit smoking
(Behavioral Change). However, some campaigns fit into only one category, such as a step-by-
step picture guide on proper handwashing (Instructional). The frequency of each category of
message are shown in Figure 22.
Figure 22: Campaign Message Types Reports from Observational Study
Each type of message was framed to hook the audience in a unique way. We saw that
many campaigns targeted moral obligation, such as by telling people to do their part. For other
campaigns, the trigger was the visual appearance; recycling bins in the hallway catch people’s
attention. The frequency of the trigger themes we saw are shown in Figure 23 below.

38
Figure 23: Campaign Trigger Reports from Observational Study
Findings #6: Rewards convince the audience of potential benefits.
We found a considerable amount of campaigns at AUS that offered an incentive or
promise of reward in exchange for participation. Most campaigns that offered big prizes were
events and competitions, which were promoted through flyers and posters with the reward in
large font. Surveys offered a small amount for completion. SEWA also has offered economic
incentives in return for participation in competitions and events. An example would be giving
mosques water efficient devices or having them compete over decreasing consumption for a
monetary prize.
Some rewards were more explicit than others. Monetary rewards were easily identified,
while other rewards were more implied, like gratification, gaining new knowledge, or learning
something for safety. The frequency of rewards based on themes is envisioned in Figure 24
below.

39
Figure 24: Campaign Rewards Report from Observational Study
2.3.2 INTERVIEWS
The interview with a representative from the AUS Office of Sustainability was twenty-
five minutes; the interview with the SEWA Conservation Department was fifty minutes. From
this, we determined the important elements of a campaign. The primary findings involved the
campaign design process, message, delivery methods, target audience, incentives, and measure
of outcomes.
Finding #1: Designing a campaign takes time and reiterations.
There are many stages to the design process of a campaign, such as drafting, inquiring
feedback, and adjusting accordingly. During the design process, many decisions must be made
including the language used, logos, budget, and method of delivery. These designs require
approval before they can be published because the Conservation Department represent not only
themselves, but also SEWA as a whole and the Emirate of Sharjah. Thus, the process often
takes many iterations of the design and time. For example, one of SEWA’s largest and most
successful projects is Peak Hour. Once a year, residents of Sharjah are encouraged to limit
their energy consumption on July 1st from 2:30-3:30 p.m. Each year the Peak Hour campaign
has occurred, the energy consumption has decreased. Even though this is a recurring campaign,

40
extensive planning is required each year to decide the theme, create advertisements, and have
enough time to post the advertisements.
Finding #2: Relating the campaign’s message to the target audience encourages
engagement.
We found that the language used in a campaign should strike the audience in a personal
way. An example would be using language that appeals to their emotions and has them
thinking of a personal experience associated with scarcity. For the AUS Office of
Sustainability, the context of location is an important factor for their campaign messaging, as
the students are removed from the mental context of living in the desert. AUS, located in
University City, is an urbanized region, with many fountains, large buildings, roads, pavement,
grass, and trees—it does not appear to be a desert at first glimpse. Campaigns must then
remind students of the importance of conserving water in a desert climate.
Finding #3: Different target audiences necessitate different delivery methods.
The campaign’s delivery platforms can help promote the campaign to the target audience.
Each audience has a different way to engage and attract; therefore, SEWA determines the
message and delivery in the best way to attract targeted audience. Children, for example, are
easily distracted and may not comprehend hard or difficult words. Thus, the message of the
campaign is aimed to be understandable, fun, and interactive. Additionally, mascots and puppet
shows are used to deliver the message in that manner. Moreover, SEWA has used different
methods to target different audiences such as TV advertisements, newspaper, radio, brochures,
table settings, lectures, banners in soccer stadiums, social media, events, and school visits.
Similarly, the AUS sustainability uses flyers, both physical and digital, to inform their
audience. Physical campaigns are distributed around the campus on the bulletin boards, digital
screens, and large posters typically placed in high-traffic locations. The digital flyers are posted
to the AUS Sustainability Instagram and Facebook to notify their followers. Additionally, AUS
also likes to randomize the deliveries of various campaigns to keep the community engaged.
For example, four or five flyers may be created for one event to be switched out periodically to
keep the audience's attention.

41
Finding #4: Targeting the next generation helps create lasting impacts.
SEWA has implemented different campaigns targeted to Sharjah residents, which
includes children, housewives, and laborers. Many of these campaigns are primarily targeting
children because they are the most receptive to new information, as they are the next
generation. For example, SEWA has created cartoon characters Kahroob (Electricity), Qatora
(Water), and Peak Man (Peak Hour) to promote conservation. Moreover, SEWA tends to
educate housewives and families on conservation in hopes that they share and educate their
children. For example, Clean Energy Pioneers and Afternoon Tea campaigns.
Finding #5: Water conservation campaigns aren’t the only social benefit campaigns in
Sharjah.
Educational campaigns at AUS have focused primarily on conveying the importance of energy
conservation and recycling to students, faculty, and staff. The AUS campus focuses their
campaigns towards sustainability regarding energy and recycling rather than water
conservation. One of the AUS Office of Sustainability’s biggest projects is a single-use plastic
ban, which includes most water bottles and plastic shopping bags. In addition, the Engineering
and Sciences Building and the Business and Management building have implemented
categorized recycling bins.
Finding #6 Incentives can be used to attract people towards a campaign.
Campaigns on the AUS campus often use incentives when they are being executed to
attract more people. For example, the AUS Sustainability Instagram has given away reusable
water bottles for the first forty AUS students who follow the account, like the photo, and tag
three other users. In return, the AUS Sustainability Instagram is getting more engagement and
followers while also promoting sustainability and the campaign.
Finding #7: The success of a campaign can be measured through surveys.
The SEWA Conservation Department determines their campaigns’ success by
measuring the campaign's impact on consumer behavior either by measuring consumption as
well as distributing surveys. For the We Can Change campaign, after every lecture, the
Conservation Department would distribute surveys to determine the strengths and weaknesses
42
of each lecture to determine how to move forward stronger. As a result of the We Can Change
campaign success, departments and government agencies requested the SEWA Conservation
Department to hold lectures at their offices. The Peak Hour campaign was directly measured
by looking at energy consumption data.
2.3.3 SUMMARY OF FINDINGS
From the observational study, we found several themes that emerged across the
campaigns. Our analysis of these themes produced six main findings which were as follows: 1)
A campaign’s location is key to its success. 2) Design elements help convey messages. 3)
Campaigns should reach their target audiences through different methods. 4) Campaigns do not
normally involve monetary investments. 5) Messages of campaigns are framed differently. 6)
Rewards convince the audience of potential benefits.
Additionally, several themes emerged from the transcription and analysis of the
interviews with the SEWA Conservation Department and AUS Office of Sustainability.
Consequently, we noted seven findings: 1) Designing a campaign takes time and reiterations.
2) Relating the campaign’s message to the target audience encourages engagement. 3)
Different target audiences necessitate different delivery methods. 4) Targeting the next
generation helps create lasting impacts. 5) Water conservation campaigns aren’t the only social
benefit campaigns in Sharjah. 6) Incentives can be used to attract people towards a campaign.
7) The success of a campaign can be measured through surveys.
2.4 DISCUSSION
Our methods were observation and interviews to explore social benefit campaigns in
Sharjah. These produced several findings—six findings from the observational study and seven
from the interviews. There were many commonalities between the two sets of findings, which
can be summarized in the following categories: campaign design, target audience, delivery
method, messaging, location, investments, and rewards. All these elements help contribute to
the effectiveness of the campaign.

43
Campaigns should be visible, and the delivery should cater to the target audience. The
question “What’s in it for me?” should be answered by including a message relevant to the
audience or using incentives. Design elements like graphics and suggestive colors help the
audience understand the message of the campaign before reading text. Ultimately, campaigns
should be created with the intention of the target audience to engage and invest, whether it’s
time, habit, or money. The level of engagement can be measured through surveys or data
reporting behaviors after the campaign, such as reporting drops in water consumption.
Limitations
Although there were many strong findings from our study, we did face a few
limitations. The SEWA campaigns we observed were solely from a report given to us by
SEWA, which listed their achievements in 2018. The 80-page report was written entirely in
Arabic, and therefore had to be translated by one of the researchers. The document focused
mostly on outcomes of each campaign. For the AUS campaigns, we observed the campaigns
while they were actively being implemented, whereas the SEWA campaigns we observed were
simply documents of campaigns already executed. This means we were not able to access
certain elements such as their promotion of the events.
Recommendations
Based upon our findings, we have formed several recommendations, which are listed in
the sections below.
Recommendation #1: Use a marketing framework to provide structure in a campaign’s
design process.
Marketing frameworks can act as a skeleton during the design of a campaign. Starting
the design with a clear layout helps to ensure the campaign’s elements were carefully
considered in a multitude of areas.
Recommendation #2: Use rewards to pique the interest of the target audience
Incentives are a useful tool to attract the target audience. They prove to the audience the
benefits for engaging with the campaign.

44
Recommendation #3: Publish campaigns in high traffic areas to increase visibility.
Placing campaigns in high traffic areas is one of the keys for a campaign’s success. For a
campaign to be engaged with, it must be seen first. The use of popular public properties and
social media to spread a campaign can help increase the outreach of the desired message.
Recommendation #4: Use campaign formats that best suit the target audience.
Different demographics require different delivery methods. For example, campaign
deliveries could be tailored to a specific age group. (While children might be easier to reach
through events like puppet and mascot shows, teenagers might be more susceptible to engage
with different types of social media and events.)
Recommendation #5: Use a qualitative analysis software, such as NVivo, to help organize
campaigns based upon their elements.
A qualitative analysis software like NVivo can help organize data collection of
campaigns. Some nodes that would be beneficial in categorizing are target audiences, location,
and method of delivery. This would help to see which campaigns were the most similar. It
would also be a useful way to store any data regarding campaign outcomes. Pictures, videos,
and feedback of each campaign can be imported, classified, and renamed to be easily
identified.
2.5 CONCLUSION
The research question guiding our study was “What are the social benefit campaigns
that have already been created in Sharjah?''. Our approach to this study was to explore how
educational campaigns are currently delivered in Sharjah. More specifically, this Exploratory
Study was done to establish a baseline of the current efforts made by AUS and SEWA in their
water conservation campaigns. Additionally, the observational study and interviews associated
with this study helped us to get insight on the design process for campaigns that are aimed to
educate and change behaviors.
We began our study by conducting an observational study on the AUS campus. We
observed campaigns presently implemented around the campus while also looking at

45
campaigns SEWA had completed in the year 2018. For each campaign, we recorded their
characteristics corresponding to the elements from two marketing frameworks: The Hook
Model and the Marketing Mix. We used a software called NVivo to categorize each campaign
based upon such characteristics in order to determine general themes across the AUS and
SEWA campaigns.
Alongside the observational study, we conducted interviews with a representative of the
AUS Office of Sustainability and representatives of the SEWA Conservation Department.
Each person we interviewed had experience with conservation campaigns, sustainability, and
public awareness which helped us understand essential background regarding the design of
educational water conservation campaigns. The interviews were automatically transcribed
using Otter, which accelerated the analysis process.
From our analysis of the observational study and interview data, we saw that each
campaign was carefully cultivated in a way to appeal to the specific audience in order to
inform or change behavior. We discovered that AUS does in fact have many campaigns
regarding sustainability, although most were centered on energy conservation and recycling.
Conversely, SEWA heavily focuses on both energy and water conservation. While this study
was an exploration on the current state of water conservation in Sharjah, the findings pertaining
to the design of behavioral campaigns will help provide background and detail for the
forthcoming articles in this series.
46
3.0 DESIGN SPRINT WORKSHOP: IDEATING WATER
CONSERVATION CAMPAIGNS AT THE AMERICAN
UNIVERSITY OF SHARJAH
This chapter focuses on our design study. First, we discuss the relevant context and the
research questions guiding our study. Then, we introduce our methods, which consists of
Design Sprint workshops conducted at the American University of Sharjah (AUS) with the
intent to ideate water conservation campaign ideas. Next, we discuss the procedures used to
collect and analyze the data produced from the Design Sprint workshops. Then, we explain the
steps taken to produce three water conservation campaigns from the findings. We end with a
discussion, recommendations, and a conclusion.
3.1 INTRODUCTION
Limited water resources and a high per capita water consumption places the United
Arab Emirates (UAE) among the most water stressed regions in the world. The largest source
of water consumption in the UAE is from irrigation and livestock, which accounts for 83%.
However, in the third most populous of the seven emirates, Sharjah, the largest water consumer
is the residential sector, which accounts for 61.8% of water produced (SEWA, 2018). Thus,
authorities, such as the Sharjah Electricity and Water Authority (SEWA), have been attempting
to alleviate the water stress by encouraging water conservation. Due to the nature of Sharjah’s
water consumption by sector, the primary target of SEWA’s water conservation campaigns
have been nationals and residents (refer to Chapter Two).
Before water conservation campaigns can be designed, the demographics of Sharjah’s
residents must be understood. Sharjah’s urban areas population growth is at a rate of 6.32% per
year since 2015 (World Population Review, 2019). The Sharjah Electricity and Water
Authority is responsible for providing water to meet the demand of their consumers—the over
one million inhabitants of Sharjah. Within SEWA’s jurisdiction is University City, which holds
fifteen educational institutions and 171,698 students (Gulf News, 2015). His Highness Dr.
Sheikh Sultan bin Muhammad Al-Qasimi, Supreme Council Member and Ruler of Sharjah, is
the President of one of these institutions, the American University of Sharjah.

47
To fulfill this need for water conservation campaigns targeted to the residents of
Sharjah, the primary research question guiding our design study is “How can we design three
creative campaigns aimed to change the behavior of water consumers and encourage water
conservation?”. We will approach this question by utilizing Design Sprints, where people are
tasked to answer questions and solve challenges within a time-constraint. This methodology
was developed by many creators, including those within GV (formerly Google Ventures). This
method is used by software development companies to brainstorm new ideas applications and
features within a limited amount of time. The Design Sprint methodology goes beyond just
software development; it is used to generate a large amount of creative ideas around any
situation. (GV, n.d) Similarly, our goal is to use this framework to acquire ideas about water
conservation campaigns directly from people who reside in Sharjah.
In the following sections of this chapter, we first present our methodology for Design
Sprint workshops, which we will use to answer our research question and achieve our research
objectives. Then, we present our findings from the Design Sprint workshops and our process to
create three campaign prototypes. Lastly, we end this chapter with a discussion,
recommendations, and a conclusion.
3.2 METHODS
The goal of this study was to create three water conservation campaigns. To achieve
this goal, we executed Design Sprint workshops. A Design Sprint is a process where
participants work together to solve questions or problems using rapid brainstorming and
prototyping. Usually, a Design Sprint is a five-day-long workshop consisting of five stages
which are Understand, Diverge, Decide, Prototype, and Validate. Our methods modified the
five-day Design Sprint to become one two-hour-long workshop with the addition of a sixth
stage, Define.
Our methods began with the identification of our participants, who we recruited
through flyers and registration forms. Then, we completed a pilot test before the event in order
to determine any areas for improvement. Two sessions of the Design Sprint workshop were
held and were two hours in length. In this section, we will describe in detail the research and

48
data collection methods that we used to achieve our research objectives and goals. From this
methodology, data was collected and then analyzed.
3.2.1 PARTICIPANTS
The intended target audience for the Design Sprint workshops were members of the
AUS community. This included students, faculty, staff, and any other individuals affiliated
with AUS, such as family members of faculty.
Recruitment
In order to recruit participants for the workshop, we designed a flyer to distribute
around the AUS campus. There were many design steps taken to publish the final flyer. When
creating each version of the flyer, we aimed to make the focus the title, which was strategically
placed in the center in a large font. We also incorporated supporting details in the flyer,
especially the date, time, and location. The QR code and condensed link, both attached to the
registration form, were placed at the top of each version of the flyer.
The original version of the flyer went through many rounds of feedback, which resulted
in several iterations of flyers. We received feedback primarily on clarity, design, and wording.
After receiving feedback, we made changes accordingly, such as renaming titles and changing
graphics. We received feedback on the flyer from the AUS Office of Sustainability, AUS
Office of Student Affairs, professors, the Sharjah Entrepreneurship Center, and the AUS Office
of Strategic Communications and Marketing.
Upon receiving this critique, we were able to publish the flyer; however, due to the
limited time from the last round of feedback we received, there were two different designs
published through the distribution channels. The two designs are seen in Table 4.

49
Table 4: Published flyers for Design Sprint Workshops
To reach a diverse group of students and faculty, we aimed to distribute our flyers
through as many distribution channels at AUS, including social media, email, in-person, and
physical advertisement. To promote our workshops through social media, we first determined
the correct offices at AUS that had social media audiences that would be receptive to our
event; these include the Office of Sustainability, the Office of Student Affairs, and the Office
of International Exchange. Our flyer was posted through Instagram, WhatsApp, and Facebook.
Additionally, the flyer was sent via email. The Office of Sustainability emailed the flyer to the
AUS Sustainability Club; the Associate Dean in the College of Engineering emailed all
Engineering students; the Provost of Student Life at AUS emailed all registered students and
faculty. Moreover, we reached out to three professors in person from different departments,
who agreed to announce the workshop to their students during class. Lastly, the flyer was
displayed on digital screens around the AUS campus through the Office of Strategic
Communications and Marketing, as shown in Figure 25 below.

50
Figure 25: Digital Screen promoting Design Sprint Workshops
Along with this method of physical advertising, we printed thirty posters of the
workshop flyer to post on the bulletin boards of all the different buildings around campus. The
breakdown of where the campaigns were posted is seen below in Table 5.
Table 5: Number of flyers distributed for each building on the AUS campus
Location Number of Posters
Student Center 10
Main Building 2
Academic Buildings 16
Library 2
Enrollment
In order to register for the Design Sprint workshop, participants used either the link or
the QR code from the distributed flyers. The registration form was created using a Qualtrics

51
survey as seen in Appendix M. Qualtrics is a software used to design forms and analyze data.
The first question on the form was the Informed Consent. If the participants agreed, they
continued with the form; otherwise, they were directed to the end of the survey. For
participants that consented, the remaining questions required them to answer the following
fields: first name, last name, email, major and the session they would like to attend. At the end
of the registration, individuals had the choice for photo release. Participants who attended the
workshop without registering online were given the Informed Consent Form and Photo-
Release Form upon arrival before they could participate.
Summary of Participants
For the design workshop, the target population was the AUS community, which
included AUS students, staff, and faculty. The flyer used to advertise the event included a sign-
up link and was distributed through several distribution channels. Participants signed up for the
workshop, either by registering in advance through the registration form or upon arrival at the
workshop. Registration included Informed Consent, Photo Release, and a choice for which
session the participant will be attending.
3.2.2 DATA COLLECTION
In order to obtain ideas for water conservation campaigns, we held two-hour-long
Design Sprint workshops, which was adapted from the five-day-long methodology; the Design
Sprint framework was condensed to better accommodate the schedules and availability of the
participants. Our Design Sprint workshop consisted of six stages, which are Understand,
Define, Diverge, Decide, Prototype, and Validate. The six stages included in our Design Sprint
workshops can be seen below in Figure 26.
Figure 26: Design Sprint Six Stages

52
3.2.2.1 Materials
For the workshop, participants were given tools to ideate and prototype educational
campaigns. Below is a table of the materials used during the workshops.
Table 6: Materials used during the Design Sprint Workshops
Product Purpose
Ideate
Black markers For writing/brainstorming
Sticky notes (different colors) Write pros/cons of campaigns
Sticky tabs Used for voting
Prototype
Packs of Markers Writing utensils for sketching
and prototyping
Colored Printer Paper For designing campaigns that
require certain colors
Colored pencils Used for sketching and
prototyping
Scissors & Glue Sticks Cut and adhere paper
To increase interest for the event, we decided to include an incentive that would attract
members of the AUS community. We created a Certificate of Participation, which was given to
the attendees after finishing the six stages of the design sprint. This certificate was signed by
the Head of Research Section at SEWA and an assistant professor from Worcester Polytechnic
Institute (WPI).

53
Figure 27: Certificate of Participation for Design Sprint Workshop participants
3.2.2.2 Pilot Test
Before the workshops, we executed a test Design Sprint to assess the workshop
protocol we had created. The purpose of this test was to give us important insight on how the
actual workshops would run and determine if there should be any modifications regarding the
timing and delivery of tasks. The pilot test included two facilitators, five participants, and two
observers. Out of the four researchers, two acted as facilitators and two acted as participants;
this combination of roles for the researchers provided the perspectives of facilitator and
participant, equally. The two observers took notes during the test run and determined main
areas to improve on. The pilot test followed the protocol. The researchers, participants, and
observers then debriefed.
3.2.2.3 Design Sprint Workshops
After the feedback from the pilot test was considered, we moved forward with the
Design Sprint workshops. There were two sessions for the workshop; the sessions were on 12th
and 13th of November 2019. Each session had a capacity of twenty-eight participants, who
were grouped into teams of four. After participants signed in, they randomly selected a token

54
with a letter written on it; each letter corresponded to a table to determine where the
participants would sit. The protocol for the Design Sprint workshop is seen in Appendix N.
The workshops were hosted in the Sharjah Entrepreneurship Center, which is located
on the AUS campus. This center is managed by a government agency called SHERAA and
primarily focuses on the creation of businesses and startups. The layout of the room consisted
of seven circle tables with four chairs each, as well as a digital screen to present on.
Throughout the workshop, there was a presentation that was displayed on the digital screen to
guide the event. This presentation can be seen in Appendix O.
Introductions
The workshop began with the researchers introducing themselves to the participants.
This was followed by a quick ice-breaker activity within groups to familiarize them with the
workshop setup and each other. In forty-five second intervals, the participants were asked to
brainstorm both colors and animals that began with the letter assigned to their table. They were
then given forty-five seconds to decide on a group name, composed of one color and one
animal (e.g. Pink Panther). Finally, each group announced their team names. For each of the
following rounds, there were timers on the presentation slides to indicate the remaining time to
complete the tasks. At the end of the timer, an alarm would sound to alert the room. Prior to
beginning a new stage, the researchers would command the attention of the room to quickly
recap the previous stage and check understanding of the directions for the current stage.

55
Understand
The first stage was Understand. This stage is meant for participants to understand and
learn more about the problem. Researchers presented the goal of the Design Sprint, which is to
create water conservation campaigns for SEWA. There was no activity for this stage. Instead,
the participants were informed on the situation: the stress on Sharjah’s water resources. The
participants were challenged to find an impactful way to change consumer behavior on water
consumption. Finally, it was stated that the outcome of the sprint would be prototyping a
campaign that could take any form. The researchers presenting the Understand stage can be
seen in Figure 28.
Figure 28: Design Thinking Workshop Understand Stage

56
Define
In the Define stage of the workshop, participants were asked to think about the broader
problem, being water stress in Sharjah, and tasked to further dissect the problem. Each team
was given the same list of twelve questions to aid them in their discussion. Ten minutes was
allocated for the group discussion. It was emphasized that the questions were more so to guide
the conversation than dictate it; any relevant topics were encouraged to be covered as well. The
questions focused on the presence of water conservation in Sharjah, personal experiences with
water scarcity, perceived causes of water stress, and potential approaches through campaigns.
Some examples of the questions used are “What water conservation campaigns have you
already seen around Sharjah?” and “What do you think is the largest source of wasting water?”
The remainder of the questions can be seen in Appendix P. By the end of this stage, each team
should have had a better idea on what route they were going to take for the next stage. An
example of the discussion questions given to the participants is shown in Figure 29 below.
Figure 29: Design Thinking Workshop Define Stage

57
Diverge
In the next stage, Diverge, the researchers communicated the outcome to the
participants, which was a campaign idea that later could be developed into a prototype. For five
minutes, each group would engage in a short group brainstorming session, where participants
would individually contribute ideas for water conservation campaigns. This entailed each
participant writing as many ideas on yellow sticky notes with black markers and then placing
them in the middle of the table; all supplies were the same color to maintain anonymity of
ideas. There was no group collaboration in this portion. Examples of sticky notes during the
brainstorming portion are shown in the image on the left side of Figure 15 below.
For the following ten minutes, teams were tasked to categorize their ideas and find any
common themes; this portion was collaborative. Additional sticky notes of different colors
were given to each team to help organize or label the categorizations. This was done to help the
participants in the next part of the Design Sprint, Decide. Examples of categorized sticky notes
are shown in the image on the right side of Figure 30 below.
Figure 30: Design Thinking Workshop Diverge Stage

58
Decide
During the Decide stage, the goal was for each team to agree on one idea to prototype
in the next part of our Design Sprint workshop. At the beginning of this stage, participants
were allotted ten minutes to discuss the pros and cons of each campaign or category they
created. These conversations were driven solely by the participants; the researchers only
intervened when participants asked for assistance. There were no guiding prompts for this
discussion.
After the discussion, the teams were allotted five minutes to vote on one campaign to
develop during the next step of the Design Sprint. The researchers then distributed one sticky
tab to each participant to vote with. The participants would indicate their votes by adhering
their sticky tabs to the idea they would prefer to use in the next stage. It was strongly
encouraged that the selected idea was unanimous. If the vote was not unanimous, the group
would need to discuss further and reach a compromise. By the end of this stage, each team
must have had only one idea to move forward with. In Figure 31 below, a sticky note
representing a campaign idea with voting tabs pasted onto it can be seen.
Figure 31: Design Thinking Workshop Decide Stage

59
Prototype
The next stage of our Design Sprint workshop was Prototype. The outcome from this
twenty-five-minute stage was that each team must have one campaign prototype completed by
the end to present to the other groups. During this stage, teams worked together to create one
finalized campaign from the idea voted on in the Decide stage. The teams were presented with
a variety of materials that were used for prototyping. The researchers were available to answer
any questions but did not interfere in the prototyping. At the end of the twenty-five minutes,
the timer on the presentation alerted the teams. The researchers examined the teams’ progress
and determined if five additional minutes should be given to complete the final touches. An
example of a team prototyping a campaign is shown in Figure 32 below.
Figure 32: Design Thinking Workshop Prototype Stage

60
Validate
The Design Sprint workshop concluded with the last stage, Validate. This stage was
allocated for the teams to present their prototypes to the other teams. There was no defined
time limit for the presentations, as it depended on how lengthy each one was. The researchers
allowed teams to volunteer when to present, and in the case no group offered, the researchers
randomly decided. At the end of each presentation, the audience would applaud the presenters,
ask questions, and make comments. After the final group presented, the researchers concluded
the workshop, thanked the participants, and acknowledged contributors to the workshop. The
participants were handed their Certificates of Participation prior to leaving the workshop.
Shown in Figure 33 below, a group photograph was taken of SEWA representatives,
researchers, and the participants with their prototypes.
Figure 33: Design Thinking Workshop Validate Stage
There were several methods used to capture the process and outcome of the Design
Spring workshops. Firstly, we documented the event through photographs and videos.
Photographs were taken during each round of the workshops; these photos captured the final
products of each stage and the participants working together. Presentations of the campaign
prototypes from the Validate stage were video recorded. Additionally, at the end of the
workshop, we collected the physical campaigns produced by each of the teams during the
event.

61
3.2.2.4 Summary of Data Collection
Members of the AUS community were recruited to participate in our Design Sprint
workshop, where they would help ideate water conservation campaigns. Flyers were
distributed with links to the registration form for the event. A pilot test was run before the
event to determine any necessary changes to be made; two researchers facilitated and two
participated alongside three additional participants. The workshops were split into two-hour-
long sessions on two consecutive days; participants were encouraged to attend either one. Each
session was split up into six stages: Understand, Define, Diverge, Decide, Prototype, and
Validate. The workshops began with the Understand stage, where researchers discussed the
problem and its context as well as projected outcomes of the participants. This was followed by
the Define stage, where the participants split into teams of three to five to begin thinking about
the problem in a narrower scope. Next, the Diverge stage participants brainstormed ideas of
how to approach the problem. In the Decide stage, each team was prompted to choose one idea
to create in the Prototype stage by using the materials provided at the event. The event
concluded with the Validate stage, where each team presented their prototype to the other
teams. Upon completion of the Design Sprint, participants received a Certificate of
Participation.
3.2.3 DATA ANALYSIS
The campaigns produced from the Design Sprint were analyzed by comparing the
strengths and weaknesses of each. The marketing frameworks—The Hook Model and the
Marketing Mix—were used to segment each campaign by its corresponding elements.
Components of a campaign that were not represented in the marketing frameworks were not
inputted into NVivo, instead they were observations. Photographs of the campaign prototypes
were taken and assessed by these frameworks. A qualitative software program called NVivo
helped us to organize our categorizations of the campaigns.
Through NVivo, the images of the campaigns were imported using the same methods
described in Chapter Two. These images of the campaigns were thematically coded or, in other

62
words, linked to the design elements from the marketing frameworks. The elements of each
campaign were coded to a node. Each node was an element from one of the marketing
frameworks. From the Hook Model, four nodes were created, and from the Marketing Mix, six
nodes were created. The nodes can be seen in the figure below.
Figure 34: Marketing framework nodes in NVivo
In addition to the data representations from NVivo, charts were made to help compare
the products of the Design Sprint. We looked for commonalities as well as differences among
the campaigns. From these, we formed generalizations and noted emergent themes.
3.2.4 SUMMARY OF METHODS
Two Design Sprint workshops were used as a process for members of the AUS
community to collaborate and create different water conservation campaigns for Sharjah.
Participants included the AUS community and were recruited through a flyer distributed by
emails, social media, bulletin boards, and printouts. Participants registered for the event either
through the registration form or by completing printed forms at the event.

63
The two-hour-long sessions of the workshop were held on the AUS campus. Before the
workshops were executed, a pilot test was held by the researchers to see the efficiency of the
protocol, time, and delivery of the stages. After the results of the pilot test were considered, we
executed our Design Sprint workshops. Each session included six stages: Understand, Define,
Diverge, Decide, Prototype, and Validate. Participants worked in teams of three to five to
brainstorm ideas for water conservation campaigns. The participants were provided markers
and sticky notes to brainstorm ideas as well as other materials for campaign prototyping. At the
completion of each session, there was one campaign prototype produced from each group.
Each participant was given a Certificate of Participation as a reward for finishing the Design
Sprint. The campaigns produced from the Design Sprint workshops were collected and
photographed. Finally, marketing frameworks were used to dissect the elements of each
campaign to make comparisons and determine strengths and weaknesses.
3.3 FINDINGS
First, we will present the findings from the pilot test of the workshop protocol, the two
Design Sprint workshops, and the campaigns produced by the researchers from the prototypes
created during the workshops.
3.3.1 PILOT TEST
The pilot test for the Design Sprint workshop lasted two hours. The pilot test was to test
our protocol, as such we structured the test as close to real as possible. The final prototype the
group produced was a social media campaign about a water efficient device. Below are our
findings from the pilot test.
Finding #1: Prior to conducting a Design Sprint workshop, ensure the time needed for
each stage is correct
We found that even though the original timing was mostly correct, less time was
needed for the Define stage and Diverge stage. The timing was a critical aspect of the Design
Sprint workshops. Each stage was allotted a certain amount of time for the participants to
64
complete an activity. Ensuring there was enough time for the activities to be done was critical
for the workshop to run smoothly.
Finding #2: Instructions must be clearly written for participants
It was determined that the clarity of the presentation could be improved by specifying
the objectives of each stage before the participants began each activity, as well as having the
specific details listed out directly on the slides for the Understand stage. In other words, we
included the outcome for each stage on the same slide as the timer to ensure the participants
knew what the task was at any given moment of the stage.
Finding #3: Reminding participants of the time remaining to fulfill the activity will help
the participant manage their time
Additionally, we found it would be a good idea to remind participants of the time
remaining (e.g. by stating “Five minutes left”). The participants were often engaging in
activities that were meant to be quick, so reminding them to utilize their time wisely would
help them manage their time and prioritize objectives to meet the outcome of the stage.
Finding #4: Check for understanding after directions are given out to participants
A final finding from the Design Sprint workshops pilot test was that it was critical to
check for understanding after delivering instructions. This would allow for questions to be
asked. By clarifying the tasks, the participants would know exactly what was required of them.
As such, we implemented checking for understanding after giving directions out.
3.3.2 DESIGN SPRINT WORKSHOP
The Design Sprint workshop had two sessions, each session lasted approximately two
and a half hours. From our registration form, a total of fifty-four participants registered for the
workshops. The first session had nineteen participants and the second workshop had twelve
participants. A total of thirty-one participants joined a session. This means that there were
people who registered but failed to attend a session of the workshop. Below are our findings
from the Design Sprint workshops.

65
Finding #1: Nine prototypes were produced from the Design Sprint workshops
There were nine campaigns prototypes that were generated from the design sprint. Six
of these campaigns were created during the first session, and three campaigns were from the
second session. All the teams used the materials provided from the workshop to prototype their
campaigns. There were no restrictions on how each team could present their campaign, which
led to more creativity during the prototyping stage. The campaigns produced from the Design
Sprint workshops can be seen labeled below in Table 7.
Table 7: Campaigns produced from Design Sprint Workshops
1
2
3
4
5
6
7
8
9
66
Finding #2: Themes regarding content, delivery, incentives, and messaging emerged from
the prototypes
The campaign prototypes produced in the Design Sprint workshops were analyzed
using the marketing frameworks and observation, as a result, several themes emerged. Many of
the campaign prototypes shared similar messages and framing of the problem; there was a
motive for the consumer to reduce water consumption. For example, money was used as an
incentive in several campaigns to promote water conservation. Also, some teams used the local
culture to reach the target population, such as by incorporating the respect for elders as well as
using Arabic terms. Table 8 is a matrix of the campaign prototypes labeled as they were in
Table 7 and the themes that emerged from each.

67
Table 8: All Campaign Prototypes Matrix
Campaign
1 2 3 4 5 6 7 8 9
Theme Culture ✔ ✔ ✔
Environment ✔ ✔
Device ✔
Graphics ✔ ✔ ✔ ✔ ✔ ✔ ✔ ✔
Influencers ✔
Rewards/
Incentive
✔ ✔ ✔ ✔ ✔
Social Media ✔
Competition ✔
Game ✔
Flyer ✔ ✔ ✔ ✔
App ✔ ✔
Event ✔ ✔ ✔
Consumption
Tracker
✔ ✔ ✔
Minimal ✔ ✔ ✔ ✔

68
Cluttered ✔ ✔ ✔
Statistics ✔ ✔ ✔ ✔
Informative ✔ ✔ ✔ ✔
Finding #3: Five campaign deliveries emerged: Informative, App, Event, Device, and
Game
From our analysis, we found some groups used phone applications as a method for
delivering their campaigns; others used events, social media posts, or water-saving devices.
The prototypes were then categorized by their deliverables and additional themes. The
categories of deliverables were Informative, which includes social media and flyers, App,
Event, Device, and Game. The themes that emerged include content, target audience, and
location. In Table 9 is a reduced matrix of the one seen in Table 8.

69
Table 9: Campaign Prototype Deliverable Matrix
Campaign
Informative
(1,2,5,6-9)
App
(4,5)
Event
(1,3,8)
Device
(8)
Game
(9)
Theme Conservation ✔ ✔ ✔ ✔ ✔
Target:
Adults ✔ ✔ ✔ ✔ ✔
Target:
Students ✔ ✔
Target:
Children
✔ ✔
Location:
Outdoors
✔
Location:
Digital ✔ ✔
3.3.3 THREE CAMPAIGN DESIGNS
Out of the nine campaigns produced in the Design Sprint, three were redesigned from
the deliverables present in the reduced matrix in Table 9 to be presented to the Sharjah
community for feedback. The three campaigns’ deliverables that were redesigned includes
social media, phone app, and an event. For the social media campaign, a series of Instagram
posts were created depicting five tips for conserving water. For the phone app campaign, we
created a redesigned mockup of SEWA’s app to track monthly water consumption. Lastly for
the event campaign, we created an agenda and map for a water conservation awareness event.

70
Finding #1: Social Media campaign was a final prototype
The first campaign we produced was one Instagram post, consisting of six images. This
idea was reproduced but with modifications to the content and designs of each slide. We used a
free graphic design software called Crello to make each picture, which we then pasted onto an
Instagram post mockup. The topic for these posts was “Five Tips to Conserve Water”, as
depicted on the title slide. The content of the following five slides were adapted from the tips
Sustainable Living Plan Project Leader at Unilever Gulf, May Tahboubin, gave in the article
18 Ways to Cut Your Water Bill. (Tahboub, 2015) Each of the next five slides correspond to
one tip for conserving water. These posts can be seen in Table 10 below.
Table 10: Social Media Campaign Post

71
The design and spatial layout of each post was considered in order to catch the attention
of someone using Instagram. In some of these slides, statistics were incorporated to justify the
importance of following the tip. Numbers were emphasized to stand out amongst the other text.
Minimal text was used to make each point. Blue colors and graphics were used to represent
water. White, black, and red were used as accent colors to contrast with the blue.
Finding #2: Mobile App campaign was a final prototype
For our second campaign, we created a redesign of SEWA’s mobile application, mainly
focused on improving the user experience. A mockup for the application was created using
Invision, a design tool to make a clickable and interactive software interfaces. This redesign
included the addition of a water conservation tracker, o from one of the ideas created during
our Design Sprint workshop. A water savings tips page was also added to encourage water
conservation. Users log into the app with their SEWA account number. Then, the app redirects
them to the water conservation tracker, which displays a water drop mascot. The mascot’s
mood changes depending on the user’s water savings level. For example, a happy expression
will be displayed if the users are consuming less water than average and a sad expression if
they are exceeding their average water consumption. Users are also prompted to visit the water
saving tips page if their water consumption is higher than average. The users are also able to
reach any of the features of the previous version of the app through the redesigned menu. The
app and its features are seen in Table 11.
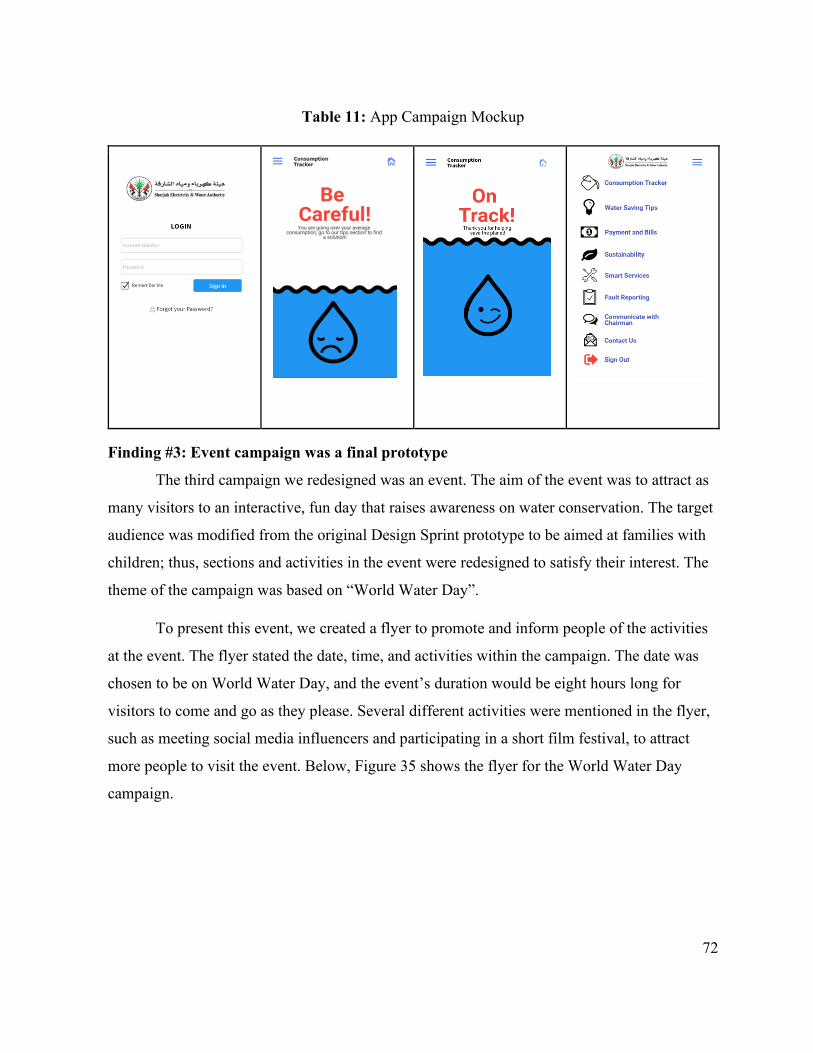
72
Table 11: App Campaign Mockup
Finding #3: Event campaign was a final prototype
The third campaign we redesigned was an event. The aim of the event was to attract as
many visitors to an interactive, fun day that raises awareness on water conservation. The target
audience was modified from the original Design Sprint prototype to be aimed at families with
children; thus, sections and activities in the event were redesigned to satisfy their interest. The
theme of the campaign was based on “World Water Day”.
To present this event, we created a flyer to promote and inform people of the activities
at the event. The flyer stated the date, time, and activities within the campaign. The date was
chosen to be on World Water Day, and the event’s duration would be eight hours long for
visitors to come and go as they please. Several different activities were mentioned in the flyer,
such as meeting social media influencers and participating in a short film festival, to attract
more people to visit the event. Below, Figure 35 shows the flyer for the World Water Day
campaign.

73
Figure 35: Flyer for the World Water Day Event
Additionally, we created a map that showcased the set-up of the event and activities
within each section. There are four sections, a main stage, and food trucks at the event. The
first section is a SEWA booth where visitors can ask for tips on conservation and can buy
water-saving devices. The art booth has different activities, such as face painting, painting
competition, and an art auction. In addition, visitors can meet social media influencers and take
pictures. Lastly, there is a kids’ booth, where parents can watch their kids play games, attend a
puppet show, and meet the SEWA mascots Qatora and Kahroob. The main stage will host a
water conservation short film competition and live music for most of the event.

74
Figure 36: Map of the Event
3.3.4 SUMMARY OF FINDINGS
Several themes emerged in the pilot test, Design Sprint workshops, and three
campaigns. Findings were produced from the debriefing on the pilot test. We noted the
following four findings: 1) Prior to conducting a Design Sprint workshop ensure the time
needed for each stage is correct. 2) Instructions must be clearly written for participants. 3)
Reminding participants of the time remaining to fulfill the activity will help the participant
manage their time. 4) Check for understanding after directions are given out to participants.
Three findings from the Design Sprint workshops are as follows: 1) Nine prototypes
were produced from the Design Sprint workshops. 2) Themes regarding content, delivery,
incentives, and messaging emerged from the prototypes. 3) Five campaign deliveries emerged:
Informative, App, Event, Device, and Game.
Using these themes, we created three campaigns. The following three findings reflect
the type of campaign that was designed: 1) Social Media campaign was a final prototype. 2)
Mobile app campaign was a final prototype. 3) Event campaign was a final prototype.
75
3.4 DISCUSSION
We found that the Design Sprint workshops are a valuable process to generate a lot of
unique and creative ideas in a short period of time. The benefits of our workshop lie in the
proximity of the participants to the problem; the water stress of Sharjah is their everyday
reality. Our findings can be attributed to the planning, execution, and products of the Design
Sprint workshops. We assessed the nine prototypes produced from the Design Sprint to
determine emergent themes, which we found to be content, delivery, incentives, and
messaging. Regarding delivery, we came up with five main categories (Informative, App,
Event, Device, and Game). From these deliveries, three were created into new prototypes—
social media post, smartphone app, and awareness event. In the sections below, we detail
observations we made that led us to our findings.
Observation #1: Giving clear instructions and checking for understanding is a learning
process for the facilitators.
After the pilot test of our Design Sprint, we learned that we could improve the clarity of
our instructions to make sure the participants were on track. Additionally, we learned that our
timings allotted for each stage could be adjusted and that reminders for time remaining would
help participants. Based upon this feedback, we decided to better explain the goal of each stage
and check for understanding before the participants began the activity. We also added prompts
to the timer slides to remind them of the objectives.
Although we made changes accordingly, similar problems with clarity arose during the Design
Sprint workshops. For example, during the Decide stage, some participants were not certain
about the purpose of the given sticky tabs. This made us realize we needed to improve on our
delivery of the outcome for each activity before each group began working independently.
Asking “Is everything clear?” before the start of each stage made a significant improvement on
the clarity of each step of the Design Sprint. This improvement was seen on the second day of
the workshop; the participants asked fewer questions and needed less guidance from the
researchers during each activity. With each run of the Design Sprint workshop, we learned
better ways to facilitate the workshops.

76
Observation #2: Two different types of team dynamics arose during the workshops.
Another observation of the Design Sprint workshops was that some teams were
homogeneous (entirely students or entirely faculty), while some teams were heterogeneous,
with a mixture of both. When observing and facilitating the design sprint, we noticed different
dynamics depending on which of the three types. Discussions appeared more productive when
the groups were homogeneous, as there were less obvious power differences. We observed that
heterogeneous groups had differing levels of participation from each group member; some
individuals took the initiative as the leader while others contributed less.
Observation #3: Facilitators should be mindful of their ability to impact participant’s
approach to the problem.
One challenge that arose during the Design Sprint was with helping teams who were
stuck in the process of moving their ideas into the prototyping stage. We needed to find a way
to support and guide the participants, while also not swaying them towards specific approaches
and ideas. Since this was a process where we would not influence the outcome of the teams, we
gave the participants a multitude of options on how to proceed. By giving a variety of solutions
instead of one or two, we ultimately allowed it to be their decision on how to create the
prototype.
Limitations
During our study, we were presented with one limitation, which was our lack of a large
sample size of local participants in our workshops. We were unable to capture the perspectives
of local residents, who were not students or faculty, because everyone who participated in the
workshop was affiliated with AUS as students or faculty. Expanding participation to other
members of the Sharjah community may have presented more ideas that otherwise wouldn’t
have with participants solely from AUS.
Recommendations
Based on the findings and analysis from this study the researchers generated the
following three recommendations:

77
Recommendation #1: Run and participate in Design Sprint workshops to generate a large
amount of ideas around a topic.
We recommend facilitating Design Sprint Workshops on different subject areas. From
our workshops, we have seen firsthand how Design Sprint Workshops generate a multitude of
ideas. Though our theme for the workshops was water conservation, we believe this method
would be beneficial for other topics as well. For example, this type of workshop would be
beneficial to generate ideas around improving a product. The two workshops we facilitated
produced nine prototypes, all with unique ideas and characteristics. Due to the flexibility of
Design Sprints, adapting and modifying the stages to fit the theme or expected outcome of the
workshop is easily done. As a result, SEWA would be able to take the framework we used
for the Design Sprint Workshops and modify them to fit different subject areas.
Recommendation #2: Test protocols for workshops to check for proof of concept
By testing the protocol for the workshop, issues such as clarity and understanding can
be determined and resolved. Feedback from participants and observers can help guide the
workshop to be better. Also, by conducting a pilot test, the time required for each stage can be
checked to ensure the participants have enough time for the activities of the stage.
Recommendation #3: Involve the target audience in workshops
Additionally, we recommend facilitating Design Sprint workshops to the target
audience of the intended theme. This process would be beneficial in gathering a large pool of
ideas from the anticipated audience. Moreover, this type of workshop would be a good method
to engage the public in the development of a new product. The Design Sprint workshop
ultimately produces a large amount of creative ideas in a limited time frame.
3.5 CONCLUSION
The research question that prompted this study was “How can we design three creative
campaigns aimed to change the behavior of water consumers and encourage water
conservation?”. Our approach to this primarily consisted of a Design Sprint methodology used
to generate a large amount of creative ideas on water conservation campaigns. The methods

78
used consisted of several steps—recruiting participants, acquiring materials, completing a pilot
test of the Design Sprint, and executing two Design Sprint workshops.
In order to obtain meaningful input, we targeted the locals of Sharjah; thus, the
participants we recruited were members of the AUS community, including students, faculty,
and staff. Participants were enrolled in the study by registering through links presented on
flyers which were distributed on campus in a multitude of ways. Additional planning for the
workshop required the creation of a Certificate of Participation and list of materials with
estimated costs. A pilot test was conducted to assess the effectiveness of the Design Sprint
protocol we created.
Two Design Sprint workshops were held as two-hour-long sessions. The workshops
were broken into six stages: Understand, Define, Diverge, Decide, Prototype, and Validate.
Participants sat in randomly assigned teams of three to five. The Understand stage introduced
the problem and presented relevant context to all participants simultaneously. Then, in the
Define stage, participants discussed the problem in more detail within their teams. The third
stage, Diverge, prompted participants to brainstorm campaign ideas individually and then
categorize them as a group. In the next stage, Decide, the teams were tasked to weigh the pros
and cons of each campaign to ultimately select one idea to actualize in the following stage,
Prototype, where teams were provided a variety of materials. The final stage, Validate, was
allocated for the teams to present their prototypes to the other teams. Each stage of the Design
Sprint workshops was photographed, and the group presentations were video recorded.
At the end of the Design Sprint workshops, the campaign prototypes were collected and
photographed. Each campaign was analyzed by its elements corresponding to the two
marketing frameworks—The Hook Model and Marketing Mix. The qualitative software NVivo
was used to categorize campaigns based on commonalities to determine emergent themes. As a
result, we discovered that groups tended to produce campaigns that were either informative, an
app, or an event. We then narrowed these themes into specific deliveries (apps, social media,
and events) which we then designed into three new prototypes. While this study heavily
focuses on the Design Sprint workshop process, the outcomes of this study will guide the next
chapter, which functions to inquire feedback on the three prototyped campaigns.

79
4.0 FEEDBACK ON WATER CONSERVATION CAMPAIGNS
IDEATED BY RESIDENTS OF SHARJAH
In this chapter, we will discuss the evaluation of three water conservation campaign
prototypes designed by members of the Sharjah community. First, we will establish all relevant
context for this study, which includes the design of the three prototypes (described in Chapter
Three) and the consequent research questions. We will then detail our methods of receiving
feedback from Sharjah Electricity Water Authority (SEWA) and the Sharjah community
regarding our three water conservation campaign prototypes. Finally, we will conclude this
chapter with an assessment of these campaigns based on the feedback we received, and we
provide recommendations.
4.1 INTRODUCTION
Due to infrequent precipitation and high temperatures, the arid climate and
desertification of the United Arab Emirates (UAE) has adversely contributed to a scarcity of
water resources. Thus, water stress brought on by scarce water resources and a high per capita
water consumption has necessitated the efforts of water conservation in the UAE. In the third
most populous emirate, Sharjah, a variety of campaigns aimed to encourage water conservation
have been implemented by the Sharjah Electricity and Water Authority. Many of these
campaigns have targeted the residents of Sharjah, as the resident sector accounts for 61.8% of
water produced by SEWA. (SEWA, 2018) Included in this demographic are students; in
University City alone, there are 171,698 students belonging to fifteen educational institutions
(Gulf News, 2015).
Through the first study of our three-study project, detailed in Chapter Two, we found
that one institution within University City, namely the American University of Sharjah (AUS),
has also been making efforts towards conservation and sustainability. However, majority of the
social benefit campaigns at AUS center on energy conservation or recycling rather than water
conservation. Consequently, our second study focused to gather ideas for water conservation
campaigns directly from the locals of Sharjah. This was carried out through Design Sprint
workshops at AUS, which ultimately produced nine campaign prototypes. The prototypes were

80
compared and assessed based on strengths and weaknesses. This analysis produced three
overarching themes of the prototypes: Informative, Application, and Event. From these themes,
we designed three water conservation campaigns, which were a social media post, a smart
phone app, and an awareness event.
The research question guiding the third study of our project was: “How will each of
three campaigns produced in the Design Study be perceived by Sharjah residents?” We
approach this question by inquiring feedback on the campaigns from representatives of SEWA
and members of the Sharjah community. Our objective is to receive meaningful responses that
evaluate the three campaigns in terms of design, message, and delivery.
In the following sections of this chapter, we first present the interview and survey
methodologies used to receive feedback and answer our research question. Then, we present
the responses from the interviews and surveys and our resulting interpretations. Lastly, we
finish this chapter with a discussion, our recommendations, and a conclusion.
4.2 METHODS
Feedback on the three water conservation campaigns designed in the previous study,
Chapter Three, was obtained by presenting the campaigns to the participants and obtaining
responses through interviews and surveys. The surveys assessed the participants’ perception of
the design, content, and engagement of one campaign. The participants’ responses were
transcribed for the interview and inputted into a digital survey by the researchers for the
surveys. The data was then analyzed based on sentiment and occurrences.
4.2.1 PARTICIPANTS
The participants in the first part of the study include SEWA representatives. The
SEWA interview participants were the same participants from the study presented in Chapter
Two. The participants were two SEWA representatives from the SEWA Conservation
Department. We scheduled the interview in advance by contacting them through email. The
interview was held at the SEWA Customer Happiness Center- Halwan.

81
The participants in the second part of the study include the Sharjah community. The
Sharjah community includes the AUS students and faculty and Sharjah residents. We surveyed
people in the following two locations: the American University of Sharjah (AUS) campus, and
Sharjah National Park.
4.2.2 DATA COLLECTION
This study’s objective was to receive feedback on the three water conservation
campaign prototypes from SEWA and the Sharjah community. To answer our research
objectives, we collected the participants’ responses to analyze. For the interview and the
survey, we determined methods of collecting and organizing the data.
4.2.2.1 SEWA Interview
The four researchers conducted an interview with two SEWA representatives from the
SEWA Conservation Department to get their feedback on the three campaigns we designed.
Prior to the interview, the SEWA interviewees were taken through the Informed Consent
process, the form can be seen in Appendix H. Once the participants consented, the interview
began, and the researchers started to record the interview on their recording devices. In
addition to the standard audio recording, one researcher used the software Otter during the
interview. This application transcribed the voice recording in real time. We asked questions
about the content, design, and delivery of the campaigns and then asked the interviewee’s to
rank campaigns based on what they perceived to be the best. Table 12 presents an abbreviated
protocol of the interview.

82
Table 12: Interview Protocol for SEWA Representatives Study III
Prior to the interview:
We want to thank you for accepting this interview. We are working on a research study for
SEWA. Part of our study is to get feedback on three water conservation campaigns that we
have designed based upon the ideas of AUS students and faculty. The purpose of this
interview is to gather information on some of the best ways to educate people on water
conservation.
Could you please indicate by signing the Informed Consent Form that we have your
permission to audio record to help us in the transcription process of this interview?
[Informed Consent Form is given to interviewees]
[We confirm yes or no with the participant to being audio recorded]
[If yes]
Thank you for your permission; we will now begin the interview and begin recording.
[If no]
Thank you for letting us know; we will continue with the interview by only taking notes.
Topic Area Explanation of Topic Area Examples of a Type of Question
Content Assess the clarity of each
campaign’s core message
“Is the campaign clear?”
Design Assess the design elements of
the campaigns and their
effectiveness
“Does the layout effectively
display the message?”
Delivery Assess whether the delivery
method chosen was suitable
“Was the delivery method used
appropriate for this message?”
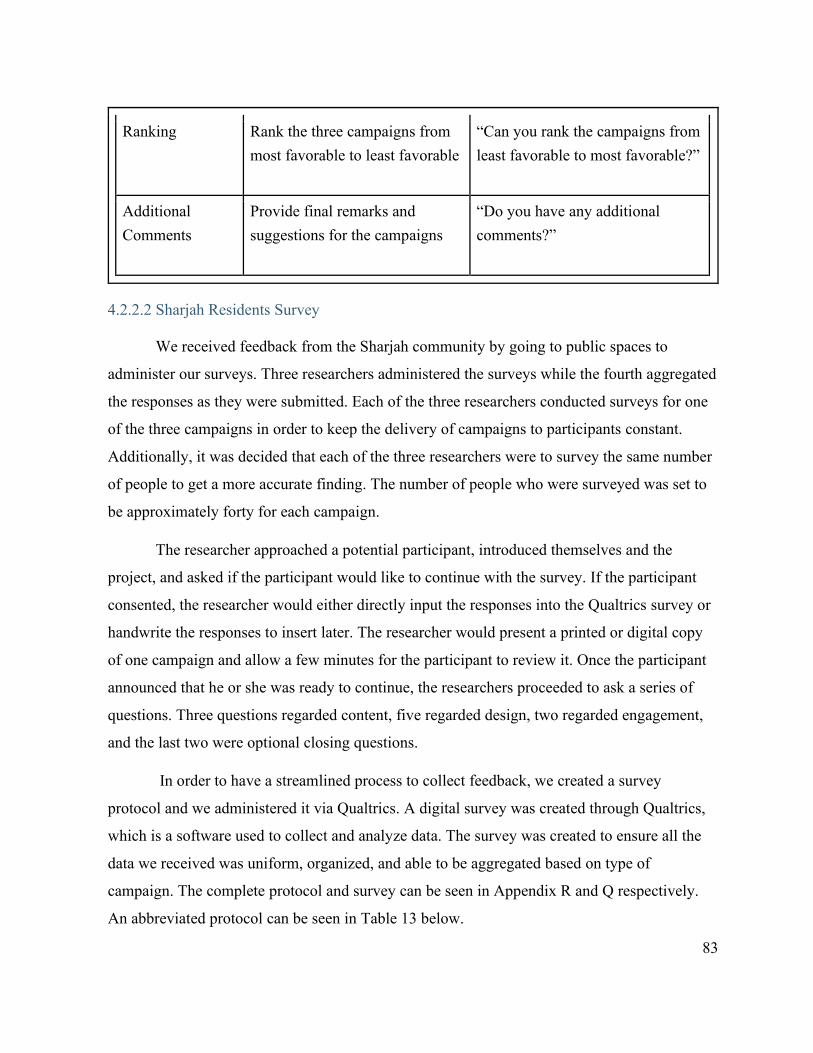
83
Ranking Rank the three campaigns from
most favorable to least favorable
“Can you rank the campaigns from
least favorable to most favorable?”
Additional
Comments
Provide final remarks and
suggestions for the campaigns
“Do you have any additional
comments?”
4.2.2.2 Sharjah Residents Survey
We received feedback from the Sharjah community by going to public spaces to
administer our surveys. Three researchers administered the surveys while the fourth aggregated
the responses as they were submitted. Each of the three researchers conducted surveys for one
of the three campaigns in order to keep the delivery of campaigns to participants constant.
Additionally, it was decided that each of the three researchers were to survey the same number
of people to get a more accurate finding. The number of people who were surveyed was set to
be approximately forty for each campaign.
The researcher approached a potential participant, introduced themselves and the
project, and asked if the participant would like to continue with the survey. If the participant
consented, the researcher would either directly input the responses into the Qualtrics survey or
handwrite the responses to insert later. The researcher would present a printed or digital copy
of one campaign and allow a few minutes for the participant to review it. Once the participant
announced that he or she was ready to continue, the researchers proceeded to ask a series of
questions. Three questions regarded content, five regarded design, two regarded engagement,
and the last two were optional closing questions.
In order to have a streamlined process to collect feedback, we created a survey
protocol and we administered it via Qualtrics. A digital survey was created through Qualtrics,
which is a software used to collect and analyze data. The survey was created to ensure all the
data we received was uniform, organized, and able to be aggregated based on type of
campaign. The complete protocol and survey can be seen in Appendix R and Q respectively.
An abbreviated protocol can be seen in Table 13 below.

84
Table 13: Survey Protocol for Sharjah Residents Study III
Prior to the survey:
Researchers will explain the study briefly and ask if the participants wish to continue:
Hi! My name is _______, and I’m a student from WPI in the United States. My research
team and I are working with SEWA and the AUS College of Engineering to design water
conservation campaigns. Here, we have a campaign based upon the ideas from AUS
students and faculty. Would you be interested in giving your feedback on this campaign?
If yes, continue script.
If no, thank the participant for their time.
Social Media Campaign Script
Imagine you’re scrolling through your Instagram feed, and you see this post about water
conservation tips.
App Campaign Script
Imagine you downloaded this app to track your monthly water consumption.
Event Campaign Script
Imagine you’re walking around, and you see this flyer advertising an event on World Water
Day.
Topic Area Explanation of Topic Area Examples of a Type of Question
Content Assess the clarity and value of
the message
“What do you think the purpose of
this campaign is?”
Design Assess the aesthetics of the
campaign (graphics, color, and
layout)
“What do you like about the layout
and design?”

85
Engagement Gauge if people would
participate in the campaign
“Would you keep using this app to
track your water consumption?”
Additional
Comments
Provide final remarks and
suggestions for the campaigns
“Do you have any additional
comments?”
4.2.2.3 Summary of Data Collection
We presented the three campaigns to SEWA representatives and the Sharjah
community by conducting an interview and surveys to receive feedback on the water
conservation campaigns. We created a protocol for the interview and the surveys. Based on the
surveys, a Qualtrics form was created for the researchers to input the responses during or after
the survey. We asked the participants questions regarding content, design, and engagement.
4.2.3 DATA ANALYSIS
Responses were collected from the SEWA Conservation Department representatives
and the participants of the surveys. The SEWA interview had notes taken during the interview
as well as a transcription. The survey responses had all been inputted into a digital Qualtrics
form. Thus, the data was organized upon exporting. The data was analyzed based on sentiment
and occurrences.
4.2.3.1 SEWA Interview
During the interview with SEWA representatives, one researcher was recording the
interview with Otter, a transcription software. Otter was used to record and transcribe the
SEWA interview. Additionally, during the interview two researchers were taking notes of the
key feedback the interviewees said. Before the analysis, the accuracy of the interview transcript
was verified by ensuring that the written script and notes matched the audio recording.

86
4.2.3.2 Sharjah Residents Survey
The feedback responses were all collected in Qualtrics. The first step in our analysis
was to first export the data from Qualtrics. The data was exported into Google Sheets for data
analysis. All the data from the survey was compiled into one sheet. In order to make sense of
the data, we segmented the feedback data into the following sheets labeled as: Master, Social
Media, App, and Event. The Master sheet included all the response data that Qualtrics
exported. The following three sheets only included the responses for the respective campaign.
For example, all the social media campaign’s responses were stored in the Social Media sheet.
In addition to these sheets, there were three more sheets—one sheet per campaign dedicated to
organizing charts.
There were two types of responses we collected, multi-word and Yes/No. The multi-
word responses for positive questions were highlighted green. For example, “What do you like
about layout and graphics?”. The responses from the negative questions were highlighted red.
For example, “What do you dislike about the layout and graphics?”. For the additional
comments, the responses were highlighted green or red based on the sentiment. For the
highlighted positive/negative responses and additional comments, we counted the occurrences
of certain keywords that appeared often. For example, “statistics” and “colors”. These
occurrences were measured in bar graphs. For the responses that were Yes/No, we determined
the count of occurrences for each and then produced pie charts.
4.2.3.3 Summary of Data Analysis
Data for each feedback method was analyzed differently. The SEWA interview was
transcribed and important feedback was noted. The surveys were analyzed by organizing the
data and then by sentiment and the occurrence of keywords in responses. The data was
organized by segmenting the data by campaign type.
4.2.4 SUMMARY OF METHODS
The three campaigns produced in Chapter Three were presented to two representatives
of the SEWA Conservation Department and the Sharjah community to receive feedback. The

87
surveys to collect feedback from Sharjah residents were administered in two public spaces: the
AUS campus and the Sharjah National Park. For the surveys, three researchers were assigned
one of the three campaigns to present to participants. The fourth researcher was aggregating the
responses as they were being submitted. The researchers asked participants to give feedback on
open-ended questions regarding the design, content, and engagement of the water conservation
campaign. The responses were inputted into a survey, based on a protocol, through Qualtrics.
The data was then exported for analysis. The data was analyzed based on the main points made
in the SEWA interview and the sentiment and occurrence of responses for the surveys.
Regarding the surveys, each researcher had the goal to receive thirty responses for their
campaign on the AUS campus and ten at the Sharjah National Park. Collectively, the goal was
to reach 120 responses.
4.3 FINDINGS
First, we will present the findings that presented themselves during the SEWA
interview and then from the Surveys with the AUS community and Sharjah residents.
4.3.1 SEWA INTERVIEW
The interview with the SEWA representative took around forty-five minutes. We
structured the interview to present one campaign at a time and ask for feedback after each one.
The campaigns were presented in the following order: social media posts, app, and event.
Finding #1: Social media is the best method to deliver campaigns
The SEWA representatives were pleased with the social media post’s message and
content of the Instagram post campaign. They found the blue colors of the post suitable and
indicative of the message presented. The SEWA representatives stated that social media is one
of most methods of delivery they used for campaigns, due to features that allow campaigns to
be easily advertised.
For example, hashtags can make posts more interactive, and Instagram allows for posts
to be sponsored by an organization. Some suggestions they made were to include a source for
the statistics and to separate the five tips to be posted on different days. In addition, they

88
recommended to change the colors of the images depending on the theme of the post and
season, in order to keep people interested in the design of each tip.
Finding #2: User-friendly designs are preferred over cluttered designs
Regarding the redesign of the app, the SEWA representatives appreciated the simple
and clear layout of the app in comparison to SEWA’s current mobile application. They
mention that the tracker is very valuable, as they would personally use it in their daily lives to
help keep track of their water consumption. Recommendations for this campaign were mostly
regarding the water conservation tips page; they noted it might be useful to make the font
bigger and the graphics smaller. It was also mentioned to change the colors of the label on the
tracker; making the “On Track” label green and keeping the “Be careful” label red would
provide a clear contrast between good and bad water consumption.
Finding #3: Social media influencers would be a good draw to engage the public
For the event, SEWA representatives were pleased with the campaign. Even though it is
similar to previous campaigns that SEWA has done, some of the activities and sections our
event had were different. They liked the SEWA, social media, and children’s sections. They
recommended to use a lot of influencers to promote water conservation and the event; people
would be drawn to the event to take pictures with them. In addition, even with the variety of
these different sections, they still believe that the water conservation message of the campaign
will not get distracted. Because there are a lot of responsibility that comes with hosting an
international event, there must be extensive preparation and planning.
Finding #4: SEWA’s ranking of our water conservation campaigns
When prompted to rank the campaigns, the SEWA representatives ranked the
campaigns in the following order:
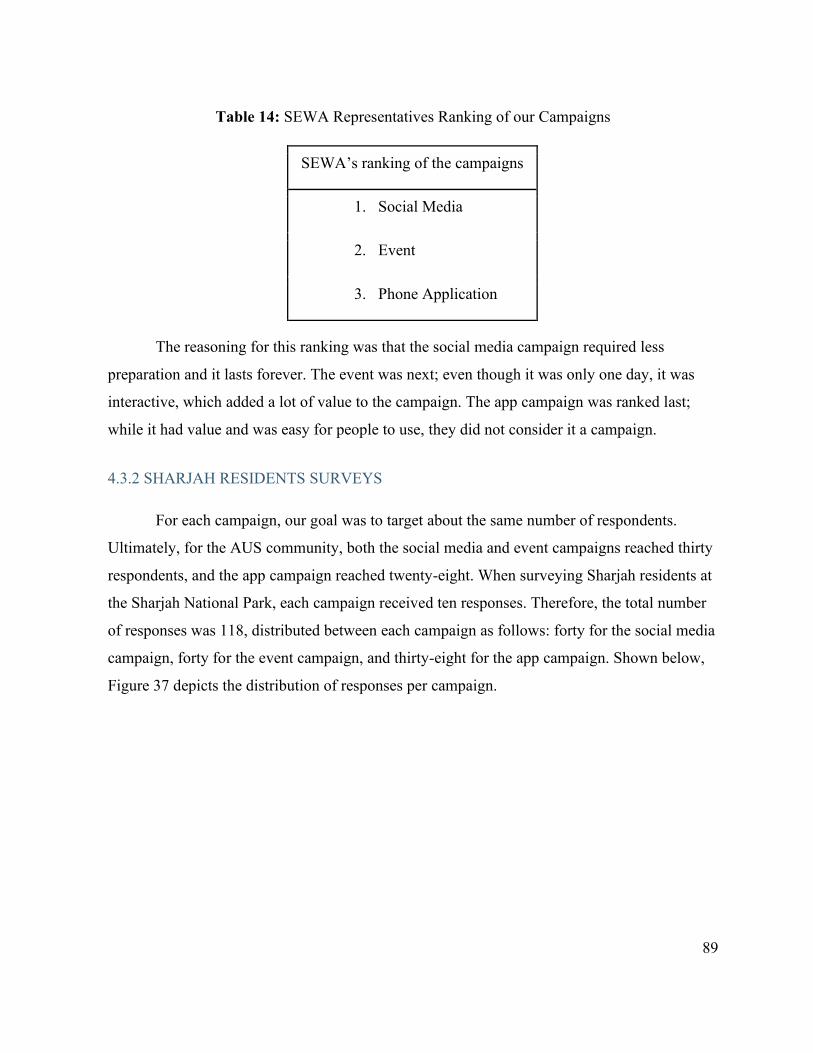
89
Table 14: SEWA Representatives Ranking of our Campaigns
SEWA’s ranking of the campaigns
1. Social Media
2. Event
3. Phone Application
The reasoning for this ranking was that the social media campaign required less
preparation and it lasts forever. The event was next; even though it was only one day, it was
interactive, which added a lot of value to the campaign. The app campaign was ranked last;
while it had value and was easy for people to use, they did not consider it a campaign.
4.3.2 SHARJAH RESIDENTS SURVEYS
For each campaign, our goal was to target about the same number of respondents.
Ultimately, for the AUS community, both the social media and event campaigns reached thirty
respondents, and the app campaign reached twenty-eight. When surveying Sharjah residents at
the Sharjah National Park, each campaign received ten responses. Therefore, the total number
of responses was 118, distributed between each campaign as follows: forty for the social media
campaign, forty for the event campaign, and thirty-eight for the app campaign. Shown below,
Figure 37 depicts the distribution of responses per campaign.

90
Respondent Distribution for Feedback Surveys
Figure 37: Respondent Distribution for Feedback Surveys
Social Media Campaign
Regarding the social media campaign, there were forty responses total. Thirty responses
were received on the AUS campus, and ten responses were received at a Sharjah National Park
event. People of varying demographics were targeted.
When asked which elements of the campaign were eye-catching, many participants
chose design; second to that was content. The distribution of responses for this question can be
seen in Figure 38.
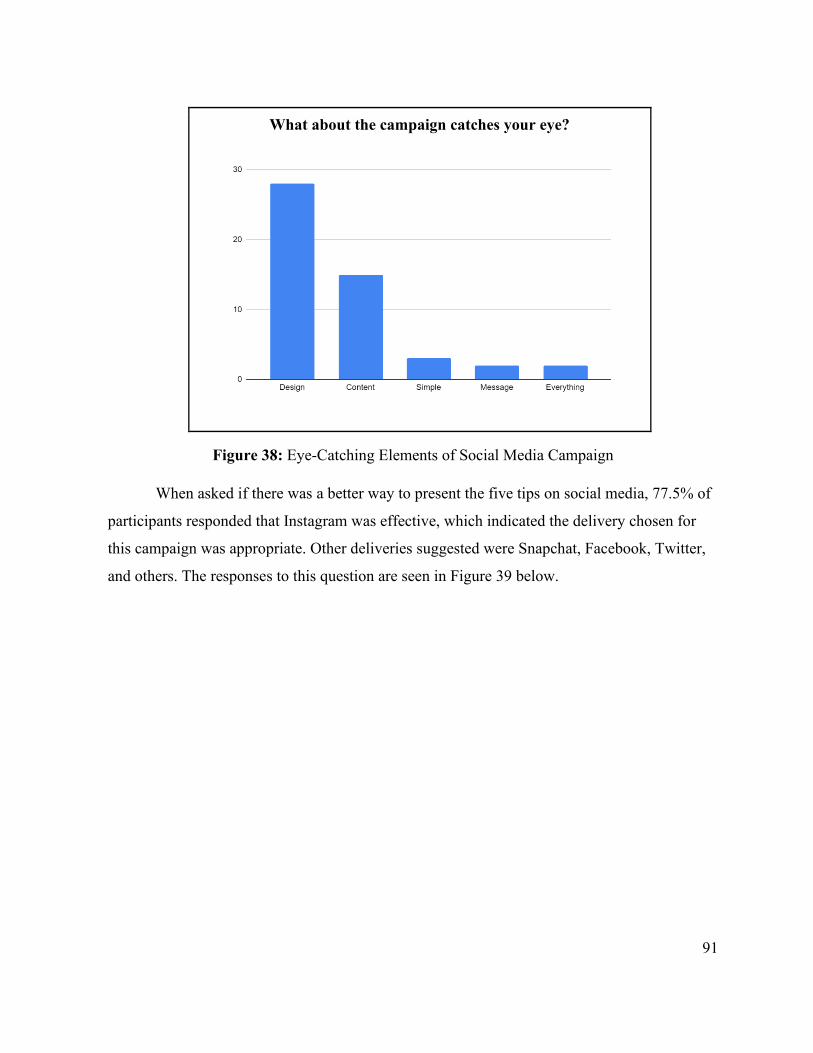
91
What about the campaign catches your eye?
Figure 38: Eye-Catching Elements of Social Media Campaign
When asked if there was a better way to present the five tips on social media, 77.5% of
participants responded that Instagram was effective, which indicated the delivery chosen for
this campaign was appropriate. Other deliveries suggested were Snapchat, Facebook, Twitter,
and others. The responses to this question are seen in Figure 39 below.

92
How would you present these tips on social media?
Figure 39: Suggested Delivery of Social Media Campaign
Participants were asked to list elements they liked and disliked about the design of
social media campaign. Responses regarding the colors were split between being liked and
disliked, with 45% of participants responding they liked the colors and 42.5% responding they
disliked them. One important note is how out of these responses, only a very small fraction of
the disliked elements affected the clarity of the message; the top four disliked elements were
purely in regard to aesthetics, while the last two were the only to regard the content of the
campaign.

93
Table 15: Liked and Disliked Design Elements of Social Media Campaign
What do you like about the
layout and graphics?
What do you dislike about the
layout and graphics?
The interview for the social media campaign concluded with additional comments. 50%
of the respondents had no additional comments. 12.5% voiced their approval for the campaign,
meaning they did not have any suggestions. 37.5% of respondents provided suggestions to
improve the campaign. 20% of responses gave suggestions for delivery, such as saying to
expand the outreach through Snapchat, events, or themed t-shirts. The 40% that regarded
content focused on clarity of the message or provided additional topics to cover (e.g. wastewater
reuse). Lastly, the 40% responses giving suggestions for design covered colors, fonts, order of
the slides, and the addition of graphics.
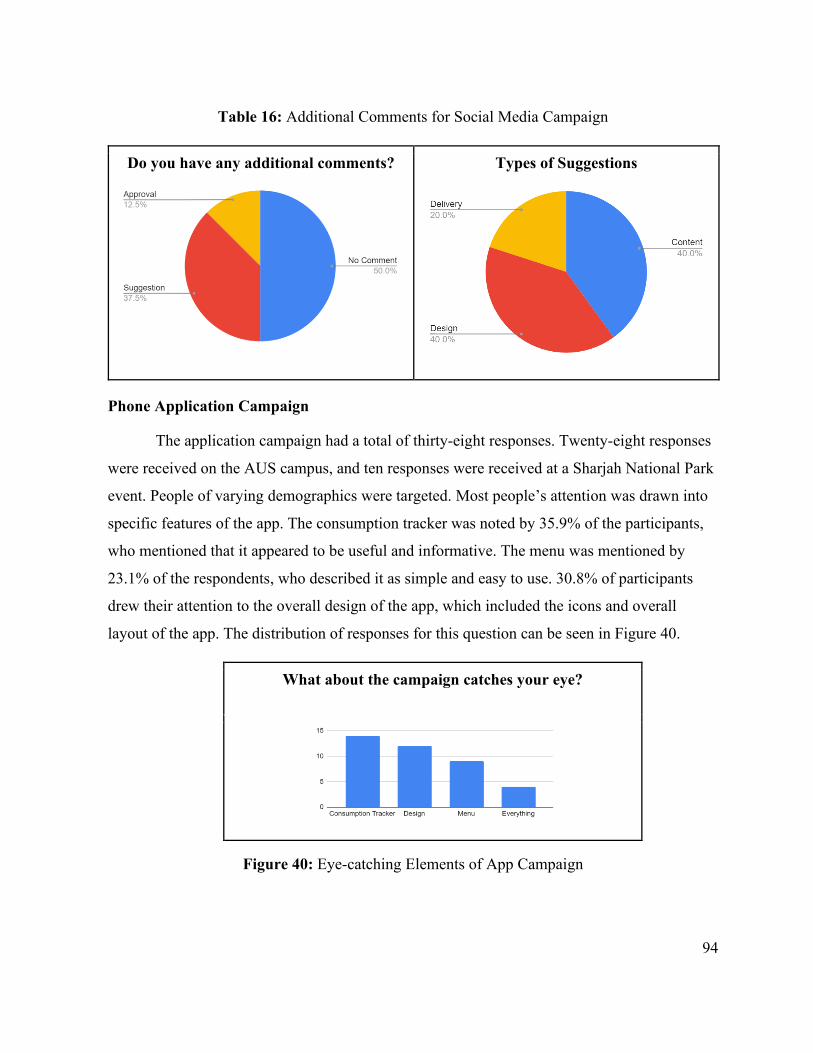
94
Table 16: Additional Comments for Social Media Campaign
Do you have any additional comments?
Types of Suggestions
Phone Application Campaign
The application campaign had a total of thirty-eight responses. Twenty-eight responses
were received on the AUS campus, and ten responses were received at a Sharjah National Park
event. People of varying demographics were targeted. Most people’s attention was drawn into
specific features of the app. The consumption tracker was noted by 35.9% of the participants,
who mentioned that it appeared to be useful and informative. The menu was mentioned by
23.1% of the respondents, who described it as simple and easy to use. 30.8% of participants
drew their attention to the overall design of the app, which included the icons and overall
layout of the app. The distribution of responses for this question can be seen in Figure 40.
What about the campaign catches your eye?
Figure 40: Eye-catching Elements of App Campaign

95
When asked more in depth what they liked about the app, participants emphasized the
menu, the overall design, easy navigation, and the consumption tracker. When specifically
asked what they disliked about the layout and graphics, 18.4% of participants mentioned that
the mascot used in the consumption tracker could be improved. Additionally, 7.9% of
participants mentioned that the design could be improved. Another 7.9% mentioned they
disliked the tracker. 5.2% mentioned that the app was too simple. The last 60.6% of the
participants mentioned they disliked nothing about the app. The distribution of responses for
this question can be seen in Figure 17.
Table 17: Liked and Disliked Design Elements of App Campaign
What do you like about the
layout and graphics?
What do you dislike about the
layout and graphics?
When asked about the user-friendliness of the app, 94.6% of participants agreed that it was
user-friendly. The participants that were familiar with the SEWA app expressed admiration for
the app campaign, due to the redesigned menu and less crowded screens. The distribution of
responses for this question can be seen in Figure 41.
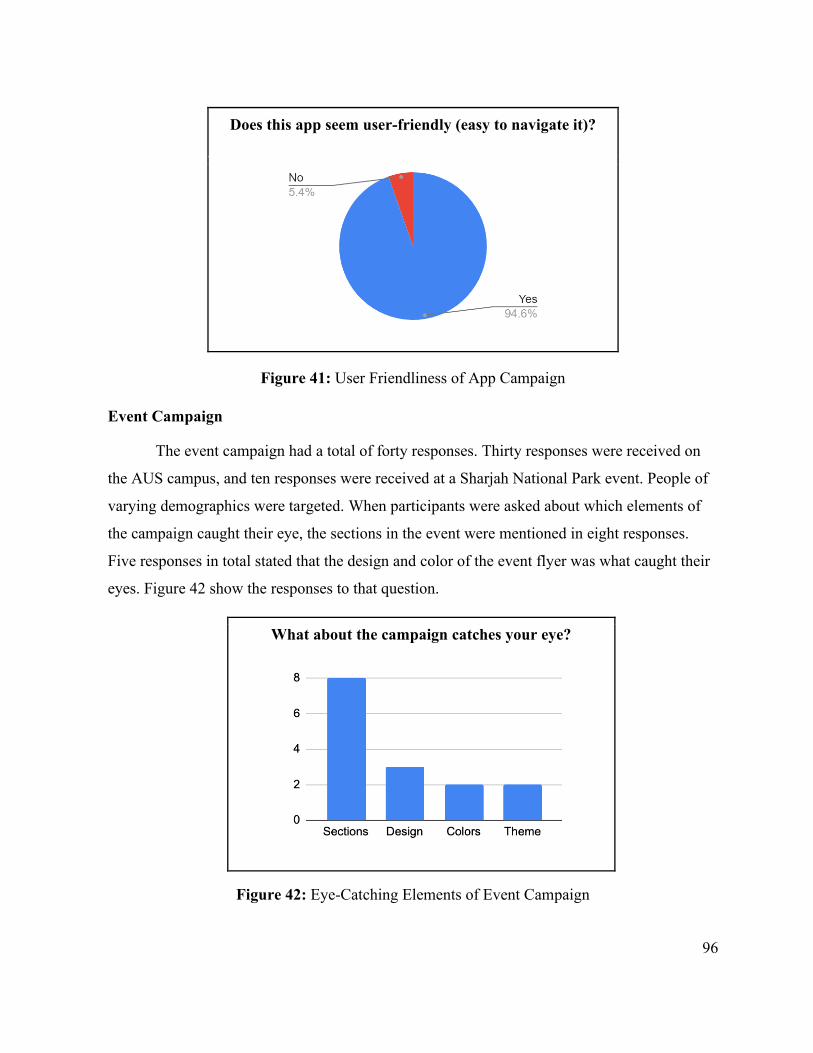
96
Does this app seem user-friendly (easy to navigate it)?
Figure 41: User Friendliness of App Campaign
Event Campaign
The event campaign had a total of forty responses. Thirty responses were received on
the AUS campus, and ten responses were received at a Sharjah National Park event. People of
varying demographics were targeted. When participants were asked about which elements of
the campaign caught their eye, the sections in the event were mentioned in eight responses.
Five responses in total stated that the design and color of the event flyer was what caught their
eyes. Figure 42 show the responses to that question.
What about the campaign catches your eye?
Figure 42: Eye-Catching Elements of Event Campaign

97
When the participants were asked about what interested them the most about the event
campaign, around 25% of the responses mentioned the food trucks. Moreover, 37.5% of the
responses were interested in SEWA’s booth and water conservation topic in general. The
distribution of responses to this question can be seen in Figure 43.
What interested you the most?
Figure 43: Interesting Elements of the Event Campaign
Around 37.5% of the total responses had additional comments on the event campaign.
A theme has emerged from these comments; they were either suggestive, questioning, or
informative comments. The suggestive comments are comments where participants suggest or
state something that they want to change or don't like about the event. Some examples are
creating a website for the event or shortening the duration of the event. The informative
comments showed participants’ interest, opinion, or information about the event, such as the
event is good initiative or that they are not interested in water conservation. Table 18 below
showcase the distribution of additional comments from the responses and a pie chart that
depicts the themes of the comments.

98
Table 18: Additional Comments Distribution Event Campaign
Additional Comments vs. No Comments
Themes Emerged in Additional
Comments Distribution
4.3.3 SUMMARY OF FINDINGS
We showed the three produced campaigns to SEWA representatives from the
conservation department for feedback. For the social media campaign, most of the
recommendations were regarding methods of delivery, noting that it might be better to release
it as multiple posts, instead of one with multiple pictures. For the event, they considered it an
interactive and engaging activity, and they recommended to use influencers to spread the word
about the event. Also, they noted that for an event like this to happen, it would need lots of
planning and preparation. The app was met with positive feedback, focusing on the design,
simplicity and the conservation tracker.
The three campaigns produced from the Design Sprint were presented to members of
the AUS community and the Sharjah community for feedback. 118 responses were received in
total: forty for the social media post, thirty-eight for the app, and forty for the event. In addition
to the individual findings for each campaign, there were overall findings between the three
campaigns. Majority of the questions were consistent among the three campaigns, which
allowed for comparisons between responses to be visualized.
The first question was “Is this campaign valuable?”. We asked this question to
determine a baseline, which indicated whether participants found value in the type of campaign

99
they were presented. We found that 100% of respondents for the social media and app
campaigns found the campaigns to be valuable. However, for the event campaign we found
that 90.9% of respondents viewed the event campaign as valuable. Below in Table 19 is the
distribution of Yes and No responses for the participants value for each campaign.
Table 19: Campaign response distribution for “Is this campaign valuable?”
Is this campaign valuable?
Social Media App Event
The second question was “Would you engage with this campaign?”. This question was
asked to determine if respondents would like the social media post, use the consumption
tracker app regularly, or if they would attend the event. We found that 90.9% of respondents
for the social media campaign would like the Instagram post and that 97.3% of respondents for
the app redesign campaign would keep the app downloaded. Finally, we found that 77.6% of
respondents said they would attend the event. In Table 20 is the distribution of Yes/No
responses for participants engagement for each campaign.

100
Table 20: Campaign response distribution for “Would you engage with this campaign?”
Would you engage with this campaign?
Social Media App Event
The campaigns that required the most time and level of effort generally had a greater
number of responses that were “no” or negative. This reasoning is generally consistent with our
findings and evaluation. The campaigns that required less engagement from the participants,
the social media posts and app, had more ‘yes’ responses regarding value and engagement.
Conversely, the event required the most time commitment and may be part of the reasoning
behind the percentage of “no” responses from participants.
4.4 DISCUSSION
We found that the three campaigns we asked for feedback on all had varying responses.
Because the campaigns had different delivery, each faced unique difficulties when being
presented. The social media campaign was the easiest to visualize, as the five tips were pasted
onto an Instagram post mockup. The app campaign was also presented as a mockup but
required participation from the participants to navigate through the different windows and
elements of the app. The event was the most difficult to visualize. A flyer and a map of the
event were the only visualizations; there was no mockup for this.
The conclusions we have drawn from the feedback we have received are the following:
the social media and app campaigns were deemed valuable campaign deliveries and participant
engagement would be higher the less the campaign’s level of engagement was. We found that
SEWA primarily uses social media and events to create awareness on a campaign. From our

101
feedback survey responses, we found that many participants would engage with social media
campaigns that were across multiple social media platforms.
4.4.1 LIMITATIONS
During our study we were presented with two limitations. The two limitations regarding
the presenting of the design mockups and the participants background knowledge. The
limitations are the following:
Limitation 1: Presenting design mockups
One limitation of the study concerns the findings for the campaigns. Firstly, some
respondents did not understand that all six images comprised one singular Instagram post; they
interpreted the campaign as individuals posts to be compared amongst the others. For the event
campaign, it was difficult to determine if participants had responded to the flyer or the event
itself. For the app campaign, the app was presented on a digital form to the AUS community, it
was not possible to present the interactive app mockup to the Sharjah residents; this was
largely due to the nature of the setting posing technical difficulties with internet access.
Developing a more standardized method, with more clarity of instructions, while also
anticipating some of the technology issues that occurred, might have solicited more or different
feedback.
Limitation 2: Participant’s lack of background knowledge
There were some respondents who were unfamiliar with Instagram. This posed
challenges for the researchers when explaining the layout of the post and asking, “Would you
like this post?”. It appeared as if these individuals were more receptive of the campaign, which
may be because they did not have personal experience viewing other Instagram posts as a
means of comparison.
4.4.2 RECOMMENDATIONS
Based on the findings and analysis from this study the researchers generated the
following recommendations:

102
Recommendation 1: Continue requesting feedback on campaigns
First, we recommend SEWA to continue asking for feedback on the different
campaigns. By doing so, SEWA can determine the elements of a campaign that are most
desirable by the community of Sharjah and those that are not. By using online surveys, SEWA
can collect data in an organized way to analyze the feedback they received. Getting direct
feedback and suggestions from the target audience will help to design campaigns to be more
receptive.
Recommendation 2: Continue social media campaigns
The social media campaigns can be broadened to more than just what is currently being
used by SEWA, which is primarily Instagram. We found that respondents suggested posting
the campaigns on different social media including Snapchat, Facebook, and Twitter.
Respondents also suggested using different formats including short videos and animations in
the campaigns to catch people’s attention.
Recommendation 3: Redesign the SEWA app with a user-friendly design
The app campaign was a redesign of SEWA’s existing app. The redesign featured a
water consumption tracker that many people were interested in. Also, the design of the app was
more minimalistic and user-friendly which many people liked.
Recommendation 4: Continue awareness events to promote conservation
The event campaign was taking an approach to cover a variety of demographics and
interests by offering a multitude of booths. By doing so, we were able to pique the interest of
anyone we asked, as it was likely there would be at least one component they liked. Many
respondents said they liked the different activities available and the food trucks. For a large
event, SEWA should involve activities that anyone could participate in. This would increase
the turnout of attendants.
4.5 CONCLUSION
In this feedback study, the researchers asked for feedback from SEWA and the Sharjah
community. The researchers created a protocol that included a script and a series of questions

103
for the participant; these questions focused on each campaign’s content, design, and
engagement. Following the protocol, a survey was created using Qualtrics, a survey and
analysis software. The survey was intended for the researchers to input the participants’
responses. This was done to organize and aggregate the data collection by campaign type. The
survey first asked the researcher if the participants consented. If they answered yes, the survey
would proceed to ask the researcher which campaign was being inputted for. If the participant
did not consent, then the survey would end.
Once the survey was created, the researchers were able to begin asking for feedback.
The goal for feedback responses was to receive roughly the same number of responses for each
campaign. The goal was set to thirty responses per campaign on the AUS campus and ten for
the Sharjah National Park. The actual breakdown of responses goes as follows: forty responses
for the social media and event campaigns and thirty-eight for the app campaign on the AUS
campus.
After all responses were inputted into the Qualtrics survey, we exported and segmented
the data into separate spreadsheets for each campaign. Within each spreadsheet, charts were
created to visualize the responses for each question. The multi-word responses were first
highlighted based on their sentiment; a positive response would be highlighted green and a
negative response would be highlighted red. These responses were then categorized into
themes based on the occurrence of certain keywords. The other type of questions asked were
Yes/No. To analyze these questions, the count for each ‘Yes’ and for each ‘No’ was recorded.
From our analysis of the feedback received for each campaign, we saw certain themes
arise. We found that for the social media campaign many people first noticed the designed
when looking at the campaign, followed by the content, simplistic design, and messaging.
Additionally, majority of the respondents agreed with the use of Instagram, while others
suggested different social media platforms. For the app campaign, we found that many
respondents liked the user-friendliness and straightforward design. Most respondents did not
dislike anything about the design of the app. For the event campaign, we found that most
respondents did like the event for the activities and food truck options. Moreover, we found

104
that the event had the lowest engagement; we infer this was because the event requires more
participation from the participants.
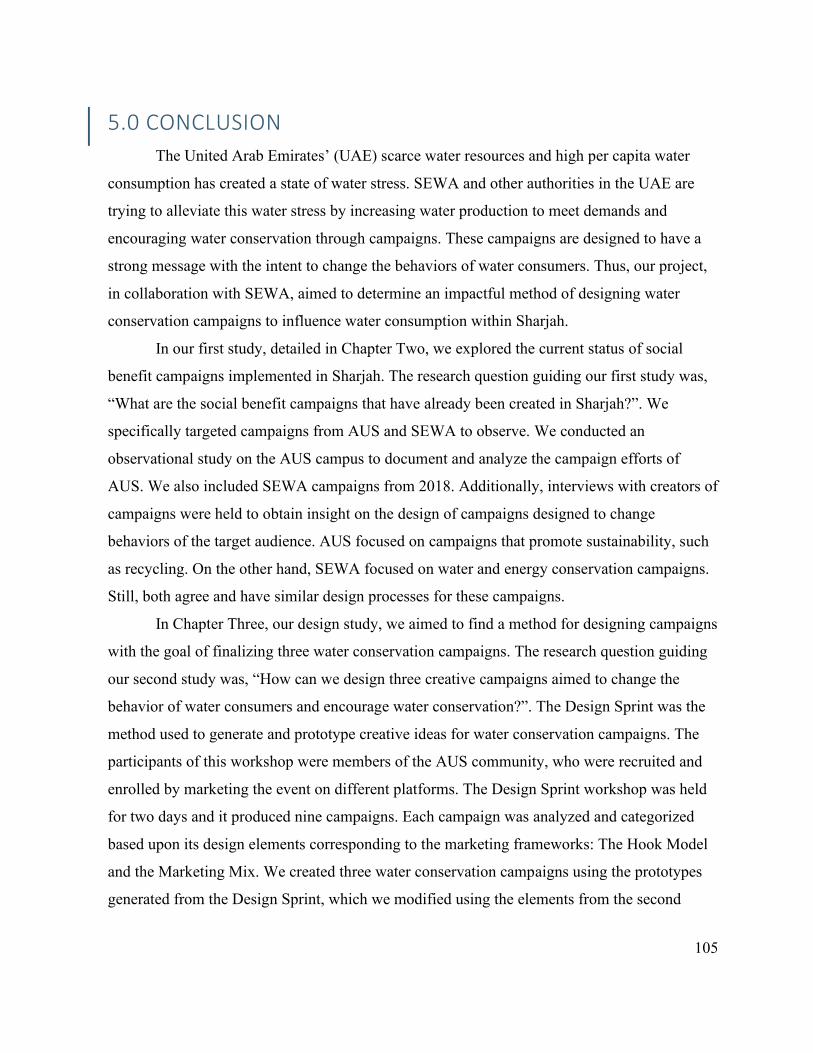
105
5.0 CONCLUSION
The United Arab Emirates’ (UAE) scarce water resources and high per capita water
consumption has created a state of water stress. SEWA and other authorities in the UAE are
trying to alleviate this water stress by increasing water production to meet demands and
encouraging water conservation through campaigns. These campaigns are designed to have a
strong message with the intent to change the behaviors of water consumers. Thus, our project,
in collaboration with SEWA, aimed to determine an impactful method of designing water
conservation campaigns to influence water consumption within Sharjah.
In our first study, detailed in Chapter Two, we explored the current status of social
benefit campaigns implemented in Sharjah. The research question guiding our first study was,
“What are the social benefit campaigns that have already been created in Sharjah?”. We
specifically targeted campaigns from AUS and SEWA to observe. We conducted an
observational study on the AUS campus to document and analyze the campaign efforts of
AUS. We also included SEWA campaigns from 2018. Additionally, interviews with creators of
campaigns were held to obtain insight on the design of campaigns designed to change
behaviors of the target audience. AUS focused on campaigns that promote sustainability, such
as recycling. On the other hand, SEWA focused on water and energy conservation campaigns.
Still, both agree and have similar design processes for these campaigns.
In Chapter Three, our design study, we aimed to find a method for designing campaigns
with the goal of finalizing three water conservation campaigns. The research question guiding
our second study was, “How can we design three creative campaigns aimed to change the
behavior of water consumers and encourage water conservation?”. The Design Sprint was the
method used to generate and prototype creative ideas for water conservation campaigns. The
participants of this workshop were members of the AUS community, who were recruited and
enrolled by marketing the event on different platforms. The Design Sprint workshop was held
for two days and it produced nine campaigns. Each campaign was analyzed and categorized
based upon its design elements corresponding to the marketing frameworks: The Hook Model
and the Marketing Mix. We created three water conservation campaigns using the prototypes
generated from the Design Sprint, which we modified using the elements from the second

106
chapter’s findings. Each campaign used a different delivery method, which were a social media
post, an app, and an event.
In Chapter Four, we did an evaluation of the three campaigns that were created from
the Design Sprint workshops to receive feedback. The research question guiding the third study
was, “How will each of three campaigns produced in the Design Study be perceived by Sharjah
residents?”. An interview was conducted with the same SEWA representatives we interviewed
in our first study. Additionally, we surveyed the AUS community and Sharjah residents to get
their feedback on the campaigns. For both the interview and the surveys, the campaigns were
presented to these participants, and they were asked to give their opinion on the design,
content, and engagement of these campaigns; the only difference was participants generally
reviewed only one campaign, while SEWA reviewed all three. From the interview, we learned
that SEWA representatives were keen to social media campaigns, using social media
influencers, and having a user-friendly designed. The responses from the survey was collected
to the Qualtrics survey and categorized into different themes that emerged when analyzing the
responses.
5.1 DISCUSSION
The findings from each of our three studies contributed to our goal of determining an
impactful method to design water conservation campaigns in Sharjah. In our first study, we
reported what we perceived as the most critical components of social benefit campaigns from
what we observed. Marketing frameworks acted as a skeleton to help us identify common
themes of each campaign we analyzed. We concluded that campaign design is a timely process
that requires many iterations. Additionally, we found that campaigns should be visible,
accessible, and cater to the target audience in terms of delivery, messaging, and rewards.
For the second part of our study, we executed Design Sprint workshops for the AUS
community, which resulted in nine water conservation campaign prototypes. By completing a
similar analysis to that of the previous study, we determined five main categories of the
campaigns: Informative, Event, App, Device, and Game. Three water conservation campaigns
(Social Media Post, App, and Event) were then created based on our findings from both
studies.
107
In the third study, we received feedback from the AUS community and Sharjah
residents on the content, design, and engagement of the campaigns we created. We found that
participants were more likely to engage with the campaign that required the least investment
from them—when participants were asked if they would engage in the campaign, more
participants answered “no” to the event than the app and social media. In conclusion, we
learned the different design elements of social benefit campaigns, gained insight from
campaign creators, received nine water conservation campaign prototypes, and acquired
meaningful feedback from the Sharjah community on campaigns we created. In the next
sections, we present our recommendations based on the outcome of the three studies and list
potential limitations.
5.1.1 RECOMMENDATIONS
In the following sections, we provide recommendations for SEWA in terms of the
design, organization, and evaluation of campaigns, based upon our findings from our three
studies.
Recommendations Based on Study I: The Exploration of Conservation Efforts in
Sharjah, UAE
Based on the qualitative analysis of observational data and interviewee’s responses, we have
the following recommendations for SEWA:
• Use a marketing framework to aid in the design process. By doing so, each
campaign’s elements are organized and repeatable. Using the Hook Model and the
Marketing Mix allows for campaigns elements to be categorized, which makes the
identification of themes an easier process.
• Continue to use rewards to pique the interest of the target audience. Rewards prove
to the audience the benefits of their participation, which can potentially increase the
engagement of the campaign.
• Publish campaigns in high traffic areas to increase visibility. By publishing a
campaign that can be distributed broadly and viewed by many people, the opportunities
for people to engage increase.

108
Continue to use campaign formats that best suit the target audience. Audiences of
differing demographics are more receptive of the deliveries that cater to them (e.g. kids and
puppet shows).
Recommendations Based on Study II: Design Sprint Workshop: Ideating Water
Conservation Campaigns at the American University of Sharjah
Based on the analysis of our pilot test workshop, Design Sprint Workshops, and three
campaign designs, we have the following recommendations for SEWA:
• Run and participate in Design Sprint workshops involving the target audience.
This process would be beneficial in gathering a large pool of ideas from the
anticipated audience.
• Use different challenges and topics for Design Sprint workshops. Due to the
flexibility of Design Sprints, adapting and modifying the stages to fit the theme or
expected outcome of the workshop is easily done. A multitude of unique ideas can be
produced from different workshops.
• Complete pilot tests to determine strengths and weaknesses of protocols. By
doing so, changes can be made to better facilitate a workshop. Feedback from
participants and observers can help guide the workshop to be better.
Recommendations Based on Study III: Feedback on Water Conservation Campaigns
Ideated by Residents of Sharjah
Based on the qualitative analysis of interviewees’ responses and survey responses, we have the
following recommendations for SEWA:
• Continue requesting feedback on campaigns. By doing so, SEWA can determine
the elements of a campaign that are most desirable by the community of Sharjah and
those that are not. By using an online survey method or in-person survey
methodology, feedback can be received to help better the campaign design process.
• Continue using social media to distribute campaigns. The social media campaigns
can be broadened to more than just what is currently being used by SEWA, which is

109
primarily Instagram. Using different formats including short videos and animations in
the campaigns would be a way to catch the audience's attention.
• Redesign the SEWA app with a user-friendly design. By doing so, the SEWA app
will look more appealing to the users. By choosing a design that is minimalistic and
incorporating an easily understood menu, users may be more likely to engage with the
app. Including a feature like a water consumption tracker may appeal to the audience
while promoting the idea of water conservation.
• Continue to promote conservation through awareness events. Events have the
ability to have a big impact on the community. By continuing to hold events,
SEWA’s message will be able to be projected to a large audience.
Additionally, we recommend longer term studies measuring the impact of campaigns
By conducting long-term studies, SEWA will be able to measure the impact of
campaigns on their target audience. This will help the campaign design process to determine
elements of campaigns that worked and did not work. Long term studies allow for changes to
be seen in the target audience, including behavioral and social changes. This would be
beneficial to SEWA to see how campaigns are directly impacting water and energy
consumption.
5.1.2 SUGGESTED NEXT STEPS
We were unable to explore several topics and questions due to time constraints and the nature
of our project. Further research is required to address the following questions:
1. What are the short and long term impacts of social change campaigns within
communities or universities?
2. What is the best method of delivery to target incoming generations?
3. Does implementing a five-day design sprint methodology produce different
outcomes than that of a two-hour workshop?
4. What other campaigns have been conducted in Sharjah besides those from AUS and
SEWA?

110
REFERENCES
Abdullah, Afkar. (May 28, 2017). SEWA offers free water leakage screenings. Khaleej Times.
Retrieved from: https://www.khaleejtimes.com/nation/sewa-offers-free-water-leakage-
screenings
About Sharjah. (n.d.). Government Arab Emirates. Retrieved from
https://www.government.ae/en/about-the-uae/the-seven-emirates/sharjah
Ahmed, F. (2016, January 11). Enriching Treated Wastewater Systems to Meet UAE's
Growing Irrigation Needs. Retrieved from https://www.ku.ac.ae/enriching-treated-
wastewater-systems-to-meet-uae-s-growing-irrigation-needs/.
Al-Katheeri, E. S. (2007). Towards the Establishment of Water Management in Abu Dhabi
Emirate. Water Resources Management, 22(2), 205–215. doi: 10.1007/s11269-006-
9151-y
Almulla, A., Hamad, A., & Gadalla, M. (2005). Aquifer storage and recovery (ASR): A
strategic cost-effective facility to balance water production and demand for Sharjah.
Desalination, 174(2), 193–204. doi: 10.1016/j.desal.2004.08.042
American University of Sharjah. (n.d.).Our Vision. American University of Sharjah.
https://www.aus.edu/sustainability/our-vision
Cambridge Dictionary. (n.d). Desalination. Cambridge Dictionary. Retrieved from:
https://dictionary.cambridge.org/dictionary/english/desalination
Cambridge Dictionary. (n.d). Rhetoric. Cambridge Dictionary. Retrieved from:
https://dictionary.cambridge.org/dictionary/english/rhetoric
Collins Dictionary. (n.d). Campaign. Collins Dictionary. Retrieved from:
https://www.collinsdictionary.com/dictionary/english/campaign
Dolinski, D. (2012). The Nature of the First Small Request as a Decisive Factor in the
Effectiveness of the Foot‐in‐the‐Door Technique. Applied Psychology, 61(3), 437–453.
https://doi.org/10.1111/j.1464-0597.2011.00477.x
Farrall, Cate, Lindsley, Marianne. (March 2008). Professional English in Use Marketing: The
Marketing Mix. Cambridge University Press. Retrieved from
https://assets.cambridge.org/97805217/02690/excerpt/9780521702690_excerpt.pdf

111
Filippou, Justin, Christopher Cheong, and France Cheong. (2016). "Combining the Fogg
Behavioural Model and Hook Model to Design Features in A Persuasive App to
Improve Study Habits." arXiv preprint arXiv:1606.03531
Government.ae. (2019). Environmental Threats. Government.ae. Retrieved from:
https://www.government.ae/en/information-and-services/environment-and-
energy/environmental-challenges-in-the-uae
Gulf News. (February 12, 2013). Shaikh Sultan issues law on water conservations in Sharjah.
Gulf News. Retrieved from https://gulfnews.com/uae/environment/shaikh-sultan-issues-
law-on-water-conservation-in-sharjah-1.1145648#
GV. (n.d.). The Design Sprint. GV. Retrieved from: https://www.gv.com/sprint/
ICARDA. (August 6, 2019). Middle East and North Africa (MENA) is the most water-stressed
region on Earth. International Center for Agriculture Research in the Dry Areas.
Retrieved from: https://www.icarda.org/media/news/middle-east-and-north-africa-
mena-most-water-stressed-region-earth
Kakande, Y. (March 23, 2014). Sharjah steps up campaign to save water. The National.
Retrieved from https://www.thenational.ae/uae/environment/sharjah-steps-up-
campaign-to-save-water-1.278
Katz, D., Kronrod, A., Grinstein, A., Nisan, U., Marketing, & Amsterdam Business Research
Institute. (2018). Still waters run deep: Comparing assertive and suggestive language in
water conservation campaigns. Water (Switzerland), 10(3), 1–10.
https://doi.org/10.3390/w10030275928
Khaleej Times. (March 22, 2016). 550 litres of water used per day by a UAE resident. Khaleej
Times. Retrieved from: https://www.khaleejtimes.com/550-litres-of-water-used-per-
day-by-a-uae-resident
Mangles, Carolanne. (January 24, 2019). How to organize a campaign plan using the RACE
framework. Smart Insights. Retrieved from: https://www.smartinsights.com/digital-
marketing-strategy/organize-campaign-plan-race-framework/
M.A. Dawoud. (April 2011). Water import and transfer versus desalination in arid regions:
GCC countries case study. Desalination and water treatment 28(1-3):153-163.
Retrieved from:
https://wedocs.unep.org/bitstream/handle/20.500.11822/16110/dawoud_2011.pdf?sequ
ence=1&isAllowed=y
112
Tahboub, May. (January 19, 2015). 18 ways to cut your water bill. What’s On. Retrieved from:
https://whatson.ae/2015/01/go-green-in-the-uae-cut-your-water-bill/
Merabtene, T., Siddique, M., & Shanableh, A. (2016). Assessment of Seasonal and Annual
Rainfall Trends and Variability in Sharjah City, UAE. Advances in Meteorology, 2016,
1–13. doi: 10.1155/2016/6206238
Murad, A. A. (2010). An Overview of Conventional and Non-Conventional Water Resources
in Arid Region: Assessment and Constrains of the United Arab Emirates
(UAE). Journal of Water Resource and Protection, 2(2), 181-190. doi:
10.4236/jwarp.2010.22020
Nazzal, N. (2018, October 29). A look at Sharjah University City. Retrieved from
https://gulfnews.com/uae/education/a-look-at-sharjah-university-city-1.1528466.
Professional Academy. (n.d.). Marketing Theories- The Marketing Mix. Professional
Academy. Retrieved from https://www.professionalacademy.com/blogs-and-
advice/marketing-theories---the-marketing-mix---from-4-p-s-to-7-p-s
Sharjah Electricity and Water Authority. (n.d.). SEWA 2020 Roadmap Towards a Brighter
Future. Sharjah Electricity and Water Authority. Retrieved from
https://www.sewa.gov.ae/uploads/pdfs/SEWAVISION2020.pdf
Sharjah Electricity and Water Authority. (n.d.). SEWA About Us. Sharjah Electricity and
Water Authority. Retrieved from
https://www.sewa.gov.ae/en/content.aspx?P=mMVyU3I8qgk%2BJD3MkzcmSA%3D
%3D&mid=I82X5exjK422E8H%2BqZdAJg%3D%3D
Sharjah Electricity and Water Authority (SEWA). (2014) Annual Statistical Report. Sharjah
Electricity and Water Authority. Retrieved from
https://www.sewa.gov.ae/uploads/statspdfen/2014/WATER2014.pdf
Sharjah Electricity and Water Authority (SEWA). (2015) Annual Statistical Report. Sharjah
Electricity and Water Authority. Retrieved from
https://www.sewa.gov.ae/uploads/statspdfen/2014/WATER2014.pdf
Sharjah Electricity and Water Authority (SEWA). (2016) Annual Statistical Report. Sharjah
Electricity and Water Authority. Retrieved from
https://www.sewa.gov.ae/uploads/statspdfen/2016/WATER2016.pdf

113
Sharjah Electricity and Water Authority (SEWA). (2017) Annual Statistical Report. Sharjah
Electricity and Water Authority. Retrieved from
https://www.sewa.gov.ae/uploads/statspdfen/2017/CH2Water.pdf
Sharjah Electricity and Water Authority (SEWA). (2018) Annual Statistical Report. Sharjah
Electricity and Water Authority. Retrieved from
https://www.sewa.gov.ae/uploads/statspdfar/Finalbook2018.pdf
Sowers, J., Vengosh, A., & Weinthal, E. (2010). Climate change, water resources, and the
politics of adaptation in the Middle East and North Africa. Climatic Change, 104(3),
599–627. doi: 10.1007/s10584-010-9835-4
Tadajewski, M. (2009). The foundations of relationship marketing: reciprocity and trade
relations. Marketing Theory, 9(1), 9–38. https://doi.org/10.1177/1470593108100058
Varpio, L. (2018). Using rhetorical appeals to credibility, logic, and emotions to increase your
persuasiveness. Perspectives on Medical Education, 7(3), 207-210.
doi:10.1007/s40037-018-0420-2
World Population Review. (2019). Sharjah Population Demographics. World Population
Review. Retrieved from: http://worldpopulationreview.com/world-cities/sharjah-
population/
Zietlow, K. J., Michalscheck, M., & Weltin, M. (2016). Water conservation under scarcity
conditions: testing the long-run effectiveness of a water conservation awareness
campaign in Jordan. International Journal of Water Resources Development, 32(6),
997–1009. doi: 10.1080/07900627.2016.1159947

114
APPENDIX A: IRB Approval

115
APPENDIX B: Informed Consent Form (General Public)
Informed Consent Agreement for Participation in a Research Study
General Public Consent Form
Investigator:
Omar Algarni, Kyla Egenberger, Pooja Patel, Rafael Pimentel
Contact Information:
[email protected], [email protected], [email protected], [email protected]
Title of Research Study:
Water Conservation Campaigns in Sharjah, United Arab Emirates
Sponsor:
Sharjah Electricity and Water Authority (SEWA)
Introduction
You are being asked to participate in a research study. Before you agree, however, you
must be fully informed about the purpose of the study, the procedures to be followed,
and any benefits, risks or discomfort that you may experience as a result of your
participation. This form presents information about the study so that you may make a
fully informed decision regarding your participation.
Purpose of the study:
The purpose of our research study is to determine an impactful method for designing
water conservation campaigns in Sharjah. We will be working closely with the Sharjah
Electricity and Water Authority to explore past SEWA campaigns as well as other
campaigns. From this exploration, we will determine the elements of design for our
three pilot campaigns to present to SEWA representatives and the general public of
Sharjah for feedback.
Procedures to be followed:

116
Two investigators for this research study will present three campaigns to you and ask a
series of questions to receive your feedback. This interview will take around 10-15
minutes. It will begin with preliminary questions regarding campaigns in general. The
three campaigns will be introduced to you sequentially, with time in between for you to
answer questions about each campaign. The interview will be concluded with a series
of questions specifically regarding the three pilot campaigns.
Risks to study participants:
There are not any foreseeable risks associated with this study. You will be able to
withdraw from the interview at any point. There are no consequences for early
withdrawal.
Benefits to research participants and others:
Your benefit to participating in the study is that you will have a voice in the design of
future water conservation campaigns distributed in Sharjah.
Record keeping and confidentiality:
Your interview responses will be audio recorded to be transcribed later. Records of
your participation in this study will be held confidential so far as permitted by law.
However, the study investigators, the sponsor or its designee and, under certain
circumstances, the Worcester Polytechnic Institute Institutional Review Board (WPI
IRB) will be able to inspect and have access to confidential data that identify you by
name. Any publication or presentation of the data will not identify you. Sensitive
information will not be recorded in this study. You may remove responses from the
records as you wish.
For more information about this research or about the rights of research participants, or
in case of research-related injury, contact:
Investigators: See contact information at the top of the first page
IRB Chair: Professor Kent Rissmiller, Tel. 508- 831-5019, Email: [email protected]
Human Protection Administrator: Gabriel Johnson, Tel. 508-831-4989,
Email:[email protected]
Your participation in this research is voluntary.

117
Your refusal to participate will not result in any penalty to you or any loss of benefits to
which you may otherwise be entitled. You may decide to stop participating in the
research at any time without penalty or loss of other benefits. The project investigators
retain the right to cancel or postpone the experimental procedures at any time they see
fit.
By signing below, you acknowledge that you have been informed about and consent to be a
participant in the study described above. Make sure that your questions are answered to your
satisfaction before signing. You are entitled to retain a copy of this consent agreement.
___________________________ Date: ___________________
Study Participant Signature
___________________________
Study Participant Name (Please print)
____________________________________ Date: ___________________
Signature of Person who explained this study

118
APPENDIX C: Informed Consent Form (SEWA Study I)
Informed Consent Agreement for Participation in a Research Study
SEWA Study I Consent Form
Investigator:
Omar Algarni, Kyla Egenberger, Pooja Patel, Rafael Pimentel
Contact Information:
[email protected], [email protected], [email protected], [email protected]
Title of Research Study:
Water Conservation Campaigns in Sharjah, United Arab Emirates
Sponsor:
Sharjah Electricity and Water Authority (SEWA)
Introduction
You are being asked to participate in a research study. Before you agree, however, you
must be fully informed about the purpose of the study, the procedures to be followed,
and any benefits, risks or discomfort that you may experience as a result of your
participation. This form presents information about the study so that you may make a
fully informed decision regarding your participation.
Purpose of the study:
The purpose of our research study is to determine an impactful method for designing
water conservation campaigns in Sharjah. We will be working closely with the Sharjah
Electricity and Water Authority to explore past SEWA campaigns as well as other
campaigns. From this exploration, we will determine the elements of design for our
three pilot campaigns.
Procedures to be followed:
The investigators for this research study will ask you a series of questions about your
involvement with SEWA campaigns as well as any additional input to aid the campaign
design process. This interview will take around 20-25 minutes.

119
Risks to study participants:
There are not any foreseeable risks associated with this study. You will be able to
withdraw from the interview at any point. There are no consequences for early
withdrawal.
Benefits to research participants and others:
Your responses are beneficial to the investigators in their design process to develop
three pilot water conservation campaigns.
Record keeping and confidentiality:
Your interview responses will be audio recorded to be transcribed later. Records of
your participation in this study will be held confidential so far as permitted by law.
However, the study investigators, the sponsor or its designee and, under certain
circumstances, the Worcester Polytechnic Institute Institutional Review Board (WPI
IRB) will be able to inspect and have access to confidential data that identify you by
name. Any publication or presentation of the data will not identify you. Sensitive
information will not be recorded in this study. You may remove responses from the
records as you wish.
For more information about this research or about the rights of research participants, or
in case of research-related injury, contact:
Investigators: See contact information at the top of the first page
IRB Chair: Professor Kent Rissmiller, Tel. 508- 831-5019, Email: [email protected]
Human Protection Administrator: Gabriel Johnson, Tel. 508-831-4989,
Email:[email protected]
Your participation in this research is voluntary.
Your refusal to participate will not result in any penalty to you or any loss of benefits to
which you may otherwise be entitled. You may decide to stop participating in the
research at any time without penalty or loss of other benefits. The project investigators
retain the right to cancel or postpone the experimental procedures at any time they see
fit.

120
By signing below, you acknowledge that you have been informed about and consent to be a
participant in the study described above. Make sure that your questions are answered to your
satisfaction before signing. You are entitled to retain a copy of this consent agreement.
___________________________ Date: ___________________
Study Participant Signature
___________________________
Study Participant Name (Please print)
____________________________________ Date: ___________________
Signature of Person who explained this study

121
APPENDIX D: Informed Consent Form AUS Community
(Study I)
Informed Consent Agreement for Participation in a Research Study
AUS STUDENTS & FACULTY Study I
Investigator:
Omar Algarni, Kyla Egenberger, Pooja Patel, Rafael Pimentel
Contact Information:
[email protected], [email protected], [email protected], [email protected]
Title of Research Study:
Water Conservation Campaigns in Sharjah, United Arab Emirates
Sponsor:
Sharjah Electricity and Water Authority (SEWA)
Introduction
You are being asked to participate in a research study. Before you agree, however, you
must be fully informed about the purpose of the study, the procedures to be followed,
and any benefits, risks or discomfort that you may experience as a result of your
participation. This form presents information about the study so that you may make a
fully informed decision regarding your participation.
Purpose of the study:
The purpose of our research study is to determine an impactful method for designing
water conservation campaigns in Sharjah. We will be working closely with the Sharjah
Electricity and Water Authority to explore past SEWA campaigns as well as other
campaigns. From this exploration, we will determine the elements of design for our
three pilot campaigns to present to SEWA representatives and the general public of
Sharjah for feedback.
Procedures to be followed:

122
The investigators for this research study will ask a series of questions regarding
conservation campaigns and designing campaigns. This interview will take around 15-
25 minutes. It will begin with preliminary questions regarding campaigns in general
and then more specific. The interview will be concluded with a series of questions
specifically regarding the design process of campaigns.
Risks to study participants:
There are not any foreseeable risks associated with this study. You will be able to
withdraw from the interview at any point. There are no consequences for early
withdrawal.
Benefits to research participants and others:
Your benefit to participating in the study is that you will have a voice in the design of
future water conservation campaigns distributed in Sharjah.
Record keeping and confidentiality:
Your interview responses will be audio recorded to be transcribed later. Records of
your participation in this study will be held confidential so far as permitted by law.
However, the study investigators, the sponsor or its designee and, under certain
circumstances, the Worcester Polytechnic Institute Institutional Review Board (WPI
IRB) will be able to inspect and have access to confidential data that identify you by
name. Any publication or presentation of the data will not identify you. Sensitive
information will not be recorded in this study. You may remove responses from the
records as you wish.
For more information about this research or about the rights of research participants, or
in case of research-related injury, contact:
Investigators: See contact information at the top of the first page
IRB Chair: Professor Kent Rissmiller, Tel. 508- 831-5019, Email: [email protected]
Human Protection Administrator: Gabriel Johnson, Tel. 508-831-4989,
Email:[email protected]
Your participation in this research is voluntary.

123
Your refusal to participate will not result in any penalty to you or any loss of benefits to
which you may otherwise be entitled. You may decide to stop participating in the
research at any time without penalty or loss of other benefits. The project investigators
retain the right to cancel or postpone the experimental procedures at any time they see
fit.
By signing below, you acknowledge that you have been informed about and consent to be a
participant in the study described above. Make sure that your questions are answered to your
satisfaction before signing. You are entitled to retain a copy of this consent agreement.
___________________________ Date: ___________________
Study Participant Signature
___________________________
Study Participant Name (Please print)
____________________________________ Date: ___________________
Signature of Person who explained this study

124
APPENDIX E: Informed Consent Form (SEWA Study III)
Informed Consent Agreement for Participation in a Research Study
SEWA Study III Consent Form
Investigator:
Omar Algarni, Kyla Egenberger, Pooja Patel, Rafael Pimentel
Contact Information:
[email protected], [email protected], [email protected], [email protected]
Title of Research Study:
Water Conservation Campaigns in Sharjah, United Arab Emirates
Sponsor:
Sharjah Electricity and Water Authority (SEWA)
Introduction
You are being asked to participate in a research study. Before you agree, however, you
must be fully informed about the purpose of the study, the procedures to be followed,
and any benefits, risks or discomfort that you may experience as a result of your
participation. This form presents information about the study so that you may make a
fully informed decision regarding your participation.
Purpose of the study:
The purpose of our research study is to determine an impactful method for designing
water conservation campaigns in Sharjah. We will be working closely with the Sharjah
Electricity and Water Authority to explore past SEWA campaigns as well as other
campaigns. From this exploration, we will determine the elements of design for our
three pilot campaigns to present to SEWA representatives and the general public of
Sharjah for feedback.
Procedures to be followed:

125
The investigators for this research study will present three campaigns to you and ask a
series of questions to receive your feedback. This interview will take around 10-15
minutes. It will begin with preliminary questions regarding your experience with
SEWA campaigns. Then, the three campaigns will be introduced to you sequentially,
with time in between for you to answer questions about each campaign. The interview
will be concluded with a series of questions specifically regarding the three pilot
campaigns.
Risks to study participants:
There are not any foreseeable risks associated with this study. You will be able to
withdraw from the interview at any point. There are no consequences for early
withdrawal.
Benefits to research participants and others:
Your benefit to participating in the study is that you will have a voice in the design of
future water conservation campaigns distributed in Sharjah.
Record keeping and confidentiality:
Your interview responses will be audio recorded to be transcribed later. Records of
your participation in this study will be held confidential so far as permitted by law.
However, the study investigators, the sponsor or its designee and, under certain
circumstances, the Worcester Polytechnic Institute Institutional Review Board (WPI
IRB) will be able to inspect and have access to confidential data that identify you by
name. Any publication or presentation of the data will not identify you. Sensitive
information will not be recorded in this study. You may remove responses from the
records as you wish.
For more information about this research or about the rights of research participants, or
in case of research-related injury, contact:
Investigators: See contact information at the top of the first page
IRB Chair: Professor Kent Rissmiller, Tel. 508- 831-5019, Email: [email protected]
Human Protection Administrator: Gabriel Johnson, Tel. 508-831-4989,
Email:[email protected]
Your participation in this research is voluntary.

126
Your refusal to participate will not result in any penalty to you or any loss of benefits to
which you may otherwise be entitled. You may decide to stop participating in the
research at any time without penalty or loss of other benefits. The project investigators
retain the right to cancel or postpone the experimental procedures at any time they see
fit.
By signing below, you acknowledge that you have been informed about and consent to be a
participant in the study described above. Make sure that your questions are answered to your
satisfaction before signing. You are entitled to retain a copy of this consent agreement.
___________________________ Date: ___________________
Study Participant Signature
___________________________
Study Participant Name (Please print)
____________________________________ Date: ___________________
Signature of Person who explained this study

127
APPENDIX F: Interviews with SEWA Representatives Study I
Interview Protocol for SEWA Representatives
We introduce ourselves and identify our affiliation with SEWA. We give a brief overview of
our project through an informed consent process. We explain our project involves the design of
water conservation campaigns specifically in Sharjah. Then, we explain that the purpose of this
interview is to gather information on the best ways to educate people on water conservation.
1. SEWA representative’s job description
2. Degree of involvement in past campaigns
3. Overview of the conservation program
4. Methods used for campaign design and delivery
5. Perceived successes and failures
6. Preferred campaign elements and deliverables
7. Campaign outcomes
8. Input on current campaigns
9. Additional comments

128
APPENDIX G: Interviews with AUS Students and Faculty
Study I
Interview Protocol for AUS Students & Faculty
We introduce ourselves and identify our affiliation with SEWA and AUS. We give a brief
overview of our project through an informed consent process. We explain our project involves
the design of water conservation campaigns specifically in Sharjah. Then, we explain that the
purpose of this interview is to gather information on the best ways to educate people on water
conservation.
1. Subject’s role at AUS
2. Degree of involvement in campaigns on campus
3. Methods used for campaign design and delivery
4. Perceived successes and failures of campaigns
5. Preferred campaign elements and deliverables
6. Campaign outcomes
7. Input on current campaigns
8. Additional comments

129
APPENDIX H: Interviews with SEWA Representatives
Study III
Interview Protocol for SEWA Representatives
We introduce ourselves and identify our affiliation with SEWA. We give a brief overview of
our project through an informed consent process. We explain our project involves the design of
water conservation campaigns specifically in Sharjah. Then, we explain that the purpose of this
interview is to gather information on the best ways to educate people on water conservation.
Topics covered before the three campaigns are presented:
1. SEWA representative’s job description
2. Degree of involvement in past campaigns
3. Preferred campaign elements and deliverables
Topics covered after the three campaigns are presented:
1) Perceived effective and ineffective elements of our campaigns
2) Input on campaign layout and delivery
3) Ranking of the three campaigns in the following areas:
A. Design
B. Message
C. Delivery
4) Additional comments

130
APPENDIX I: OBSERVATIONAL STUDY CAMPAIGNS

131
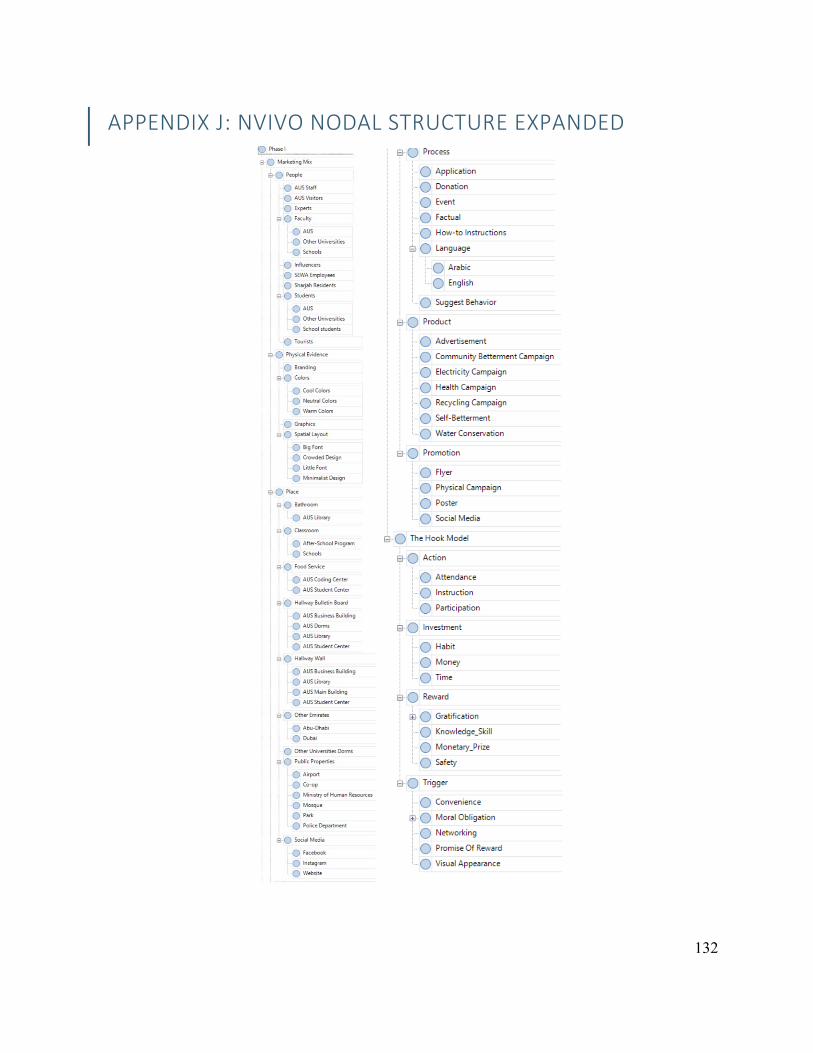
132
APPENDIX J: NVIVO NODAL STRUCTURE EXPANDED

133
APPENDIX K: DESIGN SPRINT WORKSHOP QUALTRICS
REGISTRATION FORM
[Start of survey]
Informed Consent
Introduction
You are being asked to participate in a research study. Before you agree, however, you
must be fully informed about the purpose of the study, the procedures to be followed, and
any benefits, risks that you may experience as a result of your participation. This form
presents information about the study so that you may make a fully informed decision
regarding your participation.
Purpose of the study:
The purpose of our research study is to determine an impactful method for designing water
conservation campaigns in Sharjah. We will be working closely with the Sharjah Electricity
and Water Authority to explore past SEWA campaigns as well as other campaigns. From
this exploration, we will determine the elements of design for our three pilot campaigns to
present to SEWA representatives and the general public of Sharjah for feedback.
Procedures to be followed:
You will participate in a group to ultimately create water conservation campaigns through a
design sprint. This will take approximately two hours. The researchers will facilitate each
step of the design sprint.
Risks to study participants:
There are not any foreseeable risks associated with this study. You will be able to withdraw
from the design sprint at any point. There are no consequences for early withdrawal.
Benefits to research participants and others:
Your benefit to participating in the study is that you will have a voice in the design of
future water conservation campaigns distributed in Sharjah.
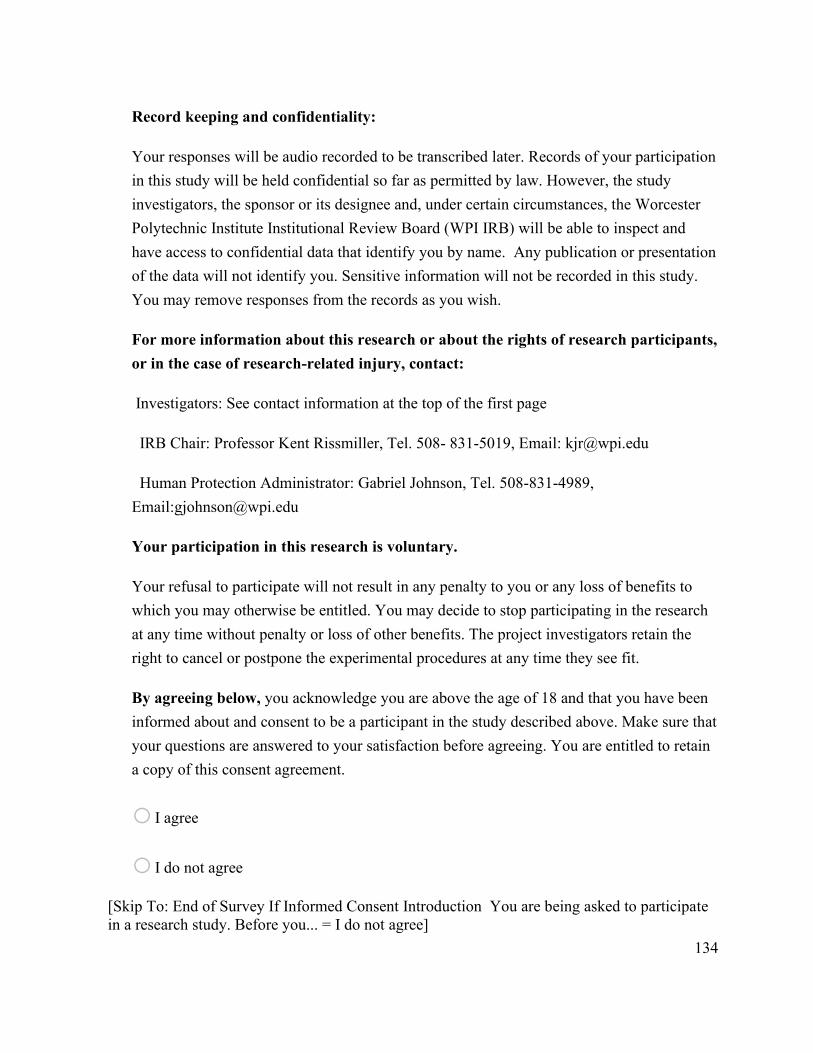
134
Record keeping and confidentiality:
Your responses will be audio recorded to be transcribed later. Records of your participation
in this study will be held confidential so far as permitted by law. However, the study
investigators, the sponsor or its designee and, under certain circumstances, the Worcester
Polytechnic Institute Institutional Review Board (WPI IRB) will be able to inspect and
have access to confidential data that identify you by name. Any publication or presentation
of the data will not identify you. Sensitive information will not be recorded in this study.
You may remove responses from the records as you wish.
For more information about this research or about the rights of research participants,
or in the case of research-related injury, contact:
Investigators: See contact information at the top of the first page
IRB Chair: Professor Kent Rissmiller, Tel. 508- 831-5019, Email: [email protected]
Human Protection Administrator: Gabriel Johnson, Tel. 508-831-4989,
Email:[email protected]
Your participation in this research is voluntary.
Your refusal to participate will not result in any penalty to you or any loss of benefits to
which you may otherwise be entitled. You may decide to stop participating in the research
at any time without penalty or loss of other benefits. The project investigators retain the
right to cancel or postpone the experimental procedures at any time they see fit.
By agreeing below, you acknowledge you are above the age of 18 and that you have been
informed about and consent to be a participant in the study described above. Make sure that
your questions are answered to your satisfaction before agreeing. You are entitled to retain
a copy of this consent agreement.
o I agree
o I do not agree
[Skip To: End of Survey If Informed Consent Introduction You are being asked to participate
in a research study. Before you... = I do not agree]

135
[Page break]
We are students from Worcester Polytechnic Institute in the United States conducting a
research study alongside SEWA and AUS students/ faculty. The goal of our project is to
design water conservation campaigns in Sharjah to present to SEWA. This event will be a
workshop where we will use your help and feedback for designing these campaigns.
1 Please fill out the following information.
o First Name ________________________________________________
o Last Name ________________________________________________
o Email Address ________________________________________________
o Major/ Degree ________________________________________________
2 Which day would you be interested in attending?
o Tuesday 11/12 at 2:45-5:00 PM in Sheraa
o Wednesday 11/13 at 2:45-5:00 PM in Sheraa
Photo-Release I hereby grant permission to the researchers of Worcester Polytechnic
Institute to use photographs and/or videos of me taken at the Design Sprint workshop in
publications, news releases, online, and in other communications related to the mission of
Worcester Polytechnic Institute.
o I agree
o I do not agree
[End of survey]

136
APPENDIX L: DESIGN SPRINT WORKSHOP PROTOCOL
COMPLETE DESIGN SPRINT WORKSHOP PROTOCOL
2:30PM Setup (15 minutes)
● Researchers will distribute supplies to tables for each team.
○ Sticky notes
○ Markers
○ Nametags
● Researchers will set up food table and materials tables.
2:45PM Participants’ Arrival (15 minutes)
● Upon arrival, participants’ names will be written down on a checklist. This checklist
will include names, photo-release consent, and extra empty spaces for people who
didn’t sign up.
● Participants who didn’t sign up will sign the photo-release and informed consent forms.
● All participants will randomly pick up a token with a letter, which will determine what
table they will be seated at. Each of the facilitators will be assigned to each one of the
tables
3:00PM Design Sprint Introductions (7 minutes)
● The research team will introduce themselves. (SLIDES ONE & TWO)
○ Names
○ Majors / institution
○ Project purpose / collaborators
■ The participants’ role in the study.
● The workshop time and outline will be explained. (SLIDE THREE)
3:07PM Icebreaker (3 minutes)

137
● An icebreaker will be performed. (SLIDE FOUR) Depending on their table letter, they
will decide on a group name, using a color and an animal (e.g. Pink Panther).
Participants will fill out name tags and introduce themselves to each other with:
○ Names
○ Major
○ Reason for coming
● For 30 seconds each participant will write down as many options for color starting with
the letter assigned
● For 30 seconds each participant will write down as many options for animal starting
with the letter assigned
● All teams will announce their group names to the other teams.
Stage One: Understand
3:10PM Goals/Context (5 minutes)
● Researchers will state the goal of the design sprint. (SLIDES FIVE & SIX)
○ “Our goal is to generate lots of creative campaign ideas on the reduction of
water consumption in Sharjah”
● Researchers will give context of the situation.
○ “Currently, Sharjah is experiencing a stress on their naturally-occurring water
resources. SEWA is attempting to encourage water conservation through
educational campaigns.”
● The participants will be included in the scenario by the researchers setting up a
challenge (How Might We…).
○ “How might we create an impactful way to change consumer behavior on water
consumption in Sharjah?”
● The outcome / deliverables of the workshop will be made clear.
○ “The outcome of the sprint will be designing a prototype of a water
conservation campaign. The campaigns can be in any form you see as fitting.”

138
○ “Potential deliverables include flyers, posters, social media, physical
campaigns, events, workshops, and such.”
Stage Two: Define
3:15PM Answering Prompts (15 minutes)
● The researchers will sit at their assigned table and present questions for participants to
answer. (SLIDES SEVEN & EIGHT & NINE)
○ See “Stage 2: Define Questions” document
Stage Three: Diverge
3:30PM Rapid Brainstorming (8 minutes)
● The researchers will ask the participants to brainstorm as many ideas and write them on
yellow sticky notes as fast as they can. The intention is to get as many ideas possible
After each participant finishes writing an idea, they will stick the sticky note in the
center of the table. (SLIDES TEN & ELEVEN & TWELVE)
○ “Silently, for the next five minutes, you will all individually write down as
many ideas as you can think of for water conservation campaigns, you have a
limited time. You will write one idea per sticky Note and stick it in the middle
of the table.”
● Researchers will help suggest certain areas to cover before the participants begin
brainstorming.
○ “You should take into consideration the target audience, location, type of
campaign / media, method of delivery, and incentive. ”
3:38PM Categorize (12 minutes)
● Participants will categorize sticky notes into groups. Each group of similar ideas will
have a non-yellow sticky note with a word representing the general theme.
Stage Four: Decide
3:50PM Discussing Each Group Ideas (10 minutes)

139
● Participants will discuss the pros and cons of each idea as a team. (SLIDES
THIRTEEN & FOURTEEN & FIFTEEN)
● Participants will be encouraged to consider differing perspectives, such as:
○ Optimist
○ Pessimist
○ Stakeholder
○ Idea generator
○ Technical feasibility
○ User advocate
4:00PM Vote for the Best Campaign (5 minutes)
● The researchers will ask the participants to vote and remind them by the end of this
activity, they must decide on only one campaign. (Each participant will get one voting
dot of the same color.)
○ If the final vote is tied, then more voting dots will be passed around to conclude
where there is one winning idea.
Stage Five: Prototype
4:05PM Creating a Campaign Prototype (25 minutes)
● The researchers will ask the participants to create a complete prototype the chosen idea
from Stage Four. (SLIDES SIXTEEN & SEVENTEEN & EIGHTEEN)
● The researchers will mention to the participants different ways of creating and
presenting their campaigns. The supplies for designing the prototype will be on a
separate table where all members of all groups are welcome to take from.
○ “You will create a campaign in any type of deliverable you would like to use.
The materials are provided to encourage creativity, but you are not required to
use them. You may use any of your own materials, such as smartphones,
laptops, and such.”
140
Stage Six: Validate
4:30PM Campaign Prototype Presentations (30 minutes)
● Participants will hand in their team’s campaign and researcher will put them up for
display. Each team will present their campaigns, discussing:
○ Reason for media
○ Target audience
○ Location for campaign
○ Message
● After participants analyze the campaigns, they will vote for the one that appeals to them
the most. Everyone will be given a final voting dot to vote on the best campaign out of
all the prototypes created. (SLIDES NINETEEN & TWENTY) The campaign
prototype with the most dots will be awarded as the winner.
● At the end of the event, participation certificates will be distributed. “Thank you.” and
acknowledgments are said. (SLIDES TWENTY-ONE & TWENTY-TWO)
5:00PM Workshop Completed
● Researchers will clean up the venue and participants will be ushered out.
● Materials will be brought back to Professor Doiron’s office in ESB.

141
APPENDIX M: DESIGN SPRINT WORKSHOP PRESENTATION

142

143
144

145
APPENDIX N: DESIGN SPRINT WORKSHOP DEFINE STAGE
QUESTIONS
Discussion Questions
1. What water conservation campaigns have you already seen around Sharjah?
a. Were any of these on campus?
b. Do you remember the last water campaign you saw? If yes, what was it?
2. Do you think there are enough water campaigns in Sharjah?
3. What’s a time where you personally experienced water scarcity?
4. What are the ways you use the most water (e.g. showers)?
a. What do you think is the largest source of wasting water?
b. How do you think you could tackle this?
5. What ways do you conserve water? Do you have water-efficient devices at home?
6. What do you think are the best ways to present a campaign?
7. What types of things catch your interest in an educational campaign?
a. What do you think makes people change their behavior?

146
APPENDIX O: STUDY III: AUS COMMUNITY AND SHARJAH
RESIDENTS FEEDBACK PROTOCOL
Exploratory Interviews Protocol: Social Media Campaign
Researchers will explain the study briefly and ask if the participants wish to continue.
“Hi! My name is _______, and I’m a student from WPI in the United States. My research team
and I are working with SEWA and the AUS College of Engineering to design water
conservation campaigns. Here, we have a campaign based upon the ideas from AUS students
and faculty. Would you be interested in giving your feedback on this campaign?”
If yes, continue script.
If no, thank the participant for their time.
Social Media Campaign Script
“Imagine you’re scrolling through your Instagram feed, and you see this post about water
conservation tips.”
● Content
○ What do you think the message is?
○ Is it valuable? (y/n)
○ Was this message clear?
● Design
○ Does this campaign catch your eye? (y/n)
○ What about it?
○ What do you like about the layout and graphics?
○ What do you dislike about the layout and graphics?
○ How would you present these tips on social media?
● Engagement
○ Would you like this post?
○ Do you think others will?
● Additional
○ What interested you the most?

147
○ Do you have any additional comments?

148
Exploratory Interviews Protocol: App Campaign
Researchers will explain the study briefly and ask if the participants wish to continue.
“Hi! My name is _______, and I’m a student from WPI in the United States. My research team
and I are working with SEWA and the AUS College of Engineering to design water
conservation campaigns. Here, we have a campaign based upon the ideas from AUS students
and faculty. Would you be interested in giving your feedback on this campaign?”
If yes, continue script.
If no, thank the participant for their time.
App Campaign Script
“Imagine you downloaded this app to track your monthly water consumption.”
● Content
○ What do you think the message is?
○ Is it valuable? (y/n)
○ Was this message clear?
● Design
○ Does this app catch your eye? (y/n)
○ What about it?
○ What do you like about the layout and graphics?
○ What do you dislike about the layout and graphics?
○ Does this app seem user-friendly (is it easy to navigate)?
● Engagement
○ Would you keep using this app to track water consumption?
○ Do you think others will?
● Additional
○ What interested you the most?
○ Do you have any additional comments?

149
Exploratory Interviews Protocol: Event Campaign
Researchers will explain the study briefly and ask if the participants wish to continue.
“Hi! My name is _______, and I’m a student from WPI in the United States. My research team
and I are working with SEWA and the AUS College of Engineering to design water
conservation campaigns. Here, we have a campaign based upon the ideas from AUS students
and faculty. Would you be interested in giving your feedback on this campaign?”
If yes, continue script.
If no, thank the participant for their time.
Event Campaign Script
“Imagine you’re walking around, and you see this flyer advertising an event on World Water
Day.”
● Content
○ What do you think the purpose of this event is?
○ Is it valuable? (y/n)
○ Was this message clear?
● Design
○ Does this event catch your eye? (y/n)
○ What about it?
○ Do you like the set-up of the event?
○ Do you think this is a good selection of activities for people of all ages?
● Engagement
○ Would you attend this event?
○ Do you think others will?
● Additional
○ What interested you the most?
○ Do you have any additional comments?

150
APPENDIX P: FEEDBACK QUALTRICS SURVEY
[Start of survey]
Did participant agree to participate and consent?
o Yes
o No
Skip To: End of Survey If Did participant agree to participate and consent? = No
What is the campaign?
o Social Media
o App
o Event
Display This Question:
If What is the campaign? = Social Media
Social Media: Content
o What do you think the message is? ________________________________________
o Was this message clear? ________________________________________________
Display This Question:
If What is the campaign? = Social Media
Is the post valuable?
o Yes
o No
Display This Question:
If What is the campaign? = Social Media
Social Media: Design Does this campaign catch your eye?
o Yes
o No

151
Display This Question:
If What is the campaign? = Social Media
o What about it? ________________________________________________
o What do you like about the layout and graphics?
________________________________________________
o What do you dislike about the layout and graphics?
________________________________________________
o How would you present these tips on social media?
________________________________________________
Display This Question:
If What is the campaign? = Social Media
Social Media: Engagement Would you like this post?
o Yes
o No
Display This Question:
If What is the campaign? = Social Media
Do you think others will?
o Yes
o No
Display This Question:
If What is the campaign? = Social Media
Social Media: Additional
o What interested you the most?
________________________________________________
o Do you have any additional comments?
________________________________________________
Display This Question:
152
If What is the campaign? = App
App: Content
o What do you think the message is?
________________________________________________
Display This Question:
If What is the campaign? = App
Is it valuable?
o Yes
o No
Display This Question:
If What is the campaign? = App
Was this message clear?
o Yes
o No
Display This Question:
If What is the campaign? = App
Q34 Does this campaign catch your eye?
o Yes
o No
Display This Question:
If What is the campaign? = App
App: Design
o What about it? ________________________________________________
o What do you like about the layout and graphics?
________________________________________________
153
o What do you dislike about the layout and graphics?
________________________________________________
Display This Question:
If What is the campaign? = App
Does this app seem user-friendly (easy to navigate it)?
o Yes
o No
Display This Question:
If What is the campaign? = App
App: Engagement Would you keep using this app to track water consumption?
o Yes
o No
Display This Question:
If What is the campaign? = App
Do you think others will?
o Yes
o No
Display This Question:
If What is the campaign? = App
App: Additional
o What interested you the most?
________________________________________________
o Do you have any additional comments?
________________________________________________
Display This Question:
If What is the campaign? = Event

154
Event: Content
o What do you think the purpose of this event is?
_______________________________________________
Display This Question:
If What is the campaign? = Event
Is the event valuable?
o Yes
o No
Display This Question:
If What is the campaign? = Event
Was this message clear?
o Yes
o No
Display This Question:
If What is the campaign? = Event
Event: Design Does this event catch your eye?
o Yes
o No
Display This Question:
If What is the campaign? = Event
o What about it? ________________________________________________
Display This Question:
If What is the campaign? = Event
Do you like the set-up of the event?
o Yes
155
o No
Display This Question:
If What is the campaign? = Event
Do you think this is a good selection of activities for people of all ages?
o Yes
o No
Display This Question:
If What is the campaign? = Event
Event: Engagement Would you attend this event?
o Yes
o No
Display This Question:
If What is the campaign? = Event
Do you think others will?
o Yes
o No
Display This Question:
If What is the campaign? = Event
Event: Additional
o What interested you the most?
________________________________________________
o Do you have any additional comments?
________________________________________________
[End of survey]

156
APPENDIX Q: FINAL PRESENTATION SLIDES
Omar Algarni, Kyla Egenberger, Pooja Patel, & Rafael Pimentel
WATER CONSERVATION
CAMPAIGNS IN SHARJAH, UAE
MISSION
01
To determine an
impactful method
for designing water
conservation
campaigns in
Sharjah.
The Situation
The WPI-AUS student team will need to understand the public
education campaigns that SEWA has already run and their impact
on consumer behavior. Then, working with the appropriate SEWA
department, they can test the effectiveness of their public
education campaign on actual water savings.
BACKGROUND
02

157
AGENDA
OUR MISSION
BACKGROUND
01
03
02
04METHODS FINDINGS
05
06
CONCLUSION
RECOMMENDATIONS
WATER STRESS IN THE UAE
WATER PRODUCTION BY TYPE
SEWA. (2014-2018) Annual Statistical Report.
● Groundwater
○ Decreasing
trend
● Desalinated
Water
○ Increasing
trend
PHASE 1:
Exploration
PHASE 2:
Design
PHASE 3:
Feedback
METHODOLOGY
In addition to producing more, we can teach to consume less
A DIFFERENT APPROACH
PHASE 1:
Exploration
PHASE 2:
Design
PHASE 3:
Feedback
METHODOLOGY

158
METHODS
03
Interviews with
SEWA & AUS
To explore educational campaigns implemented in Sharjah
Observational
Study
GOAL:
PHASE 1: INTRODUCTION
● 70 campaigns
○ AUS campus
○ SEWA 2018
Achievements
Report
PHASE 1: OBSERVATIONAL STUDY
AUS Office of Sustainability
Social Media Post
SEWA “Be Aware” and “Peak
Hour” Campaigns
PHASE 1:
Exploration
PHASE 2:
Design
PHASE 3:
Feedback
METHODOLOGY
PHASE 1: INTERVIEWS
Interview with SEWA Conservation Dept.
● Discussed campaign design
process and outcomes
○ SEWA Conservation
Department
○ AUS Office of
Sustainability
● Recorded and transcribed
● 2-hour Design Sprint workshop consisting of 6 stages:
1.
Understand
2.
Define
3.
Diverge
4.
Decide
5.
Prototype
6.
Validate
To generate creative ideas for water conservation
campaigns to create three campaign prototypes
PHASE 2: INTRODUCTION
GOAL:

159
● Categorize campaign elements into Marketing Frameworks
using a software called NVivo
PHASE 1: DATA ANALYSIS
PHASE 2: RECRUITMENT
● Participants
○ AUS community
○ Locals
● Flyer and registration form
● Certificate
● Pilot test
● Goal: Communicate the Goals, Situation, Challenge, and
Deliverables to the participants
1. UNDERSTAND
4. DECIDE
● Goal: Have one
campaign idea for the
next stage
● Activities: Discussing
the pros/cons of the
each campaign and
choosing one campaign
to proceed with
2. DEFINE
● Goal: Narrow down
the problem
● Activity: Discussing
given topics
5. PROTOTYPE
● Goal: Transform the
chosen idea into a
physical prototype
● Activity: Creating one
campaign using the
provided materials

160
3. DIVERGE
● Goal: Come up with ideas for Water Conservation
Campaigns
● Activities: Rapidly brainstorming and categorizing ideas
6. VALIDATE
● Goal: Present produced water conservation campaigns to the
other teams
PHASE 1:
Exploration
PHASE 2:
Design
PHASE 3:
Feedback
METHODOLOGY
PHASE 3: SURVEYS
Would you like this post?
Content Was this message clear?
Engagement
What do you like about the layout
and graphics?Design
PHASE 3: FEEDBACK
Interview with
SEWA
Surveys with
Sharjah
Residents
Present 3 campaigns and ask for feedback regarding
content, design, and engagementGOAL:
PHASE 1 FINDINGS
04

161
PHASE 3: INTERVIEWS
● Presented 3 campaigns to representatives of SEWA
Conservation Department
○ Content
○ Delivery
○ Design
○ Ranking
● Recorded and transcribed
Interview with SEWA Conservation Dept.
PHASE 1: FINDINGS
Trigger, Hook Model Promotion, Marketing Mix
● Subcategories of the Marketing Framework emerged
PHASE 1: FINDINGS
Location
Messaging
Target Audience
Delivery Method
Incentives
Design Process
PHASE 2: CAMPAIGN PROTOTYPES
Campaign
Type
# of
Campaigns
Flyer 2
Social
Media
1
Phone App 2
Device 1
Game 1
Event 2
PHASE 2 FINDINGS
04
PHASE 2: FINDINGS
Campaign Prototype
1 2 3 4
Theme Graphics ✔ ✔ ✔
Influencers ✔
Flyer ✔
App ✔
Event ✔ ✔
Statistics ✔ ✔
Informative ✔
Campaign
Informative
(1,2,5,6-9)
App
(4,5)
Event
(1,3,8)
Theme Content ✔ ✔
Target:
Adults
✔ ✔ ✔
Target:
Students
✔ ✔
Target:
Children
✔
Matrix Evaluation of 4 campaign prototypes Matrix Evaluation of 3 campaign delivery
methods

162
PHASE 2: FINDINGS
Workshop Process
Campaign Prototypes Types of campaign, messaging, target audience
Clear instructions, checking for understanding
Emergent ThemesContent, delivery, incentives, and messaging
Help save your home’s water resources by following
these 5 tips! #WeLoveWaterUAE
CAMPAIGN 1: SOCIAL MEDIA POST
CAPTION:
CAMPAIGN 2: AWARENESS EVENT
PHASE 3: FINDINGS
EventSocial Media App
Do you find the message valuable?
CAMPAIGN 3: MOBILE APP
PHASE 3: FINDINGS
EventSocial Media App
Would you engage with this campaign?

163
PHASE 3 FINDINGS
04
PHASE 3: FINDINGS
Social Media
App
Event
Effective method to deliver informational
campaigns through graphics
Minimalistic designs prefered over designs that
used multiple colors and themes
Incentives are a beneficial way to engage a target
audience
CONCLUSION
05
fffffrefesfsse
1. Run and participate in
Design Sprint workshops
2. Use different challenges
and topics for workshops.
3. Complete pilot test
1. Continue requesting
feedback
2. Continue using social
media.
3. Redesign the SEWA app
with a user-friendly design.
4. Continue to promote
conservation through
awareness events.
PHASE 1:
EXPLORATION
PHASE 2:
DESIGN
PHASE 3:
FEEDBACK
1. Use a marketing framework
2. Continue to use rewards
3. Publish campaigns in high
traffic areas
4. Continue to use campaign
formats that best suit the
target audience.
CONCLUSION
Determined the different elements of campaignsPHASE 1:
Created 3 water conservation campaigns based on
ideas from the AUS communityPHASE 2:
Received feedback from the Sharjah communityPHASE 3:
ACKNOWLEDGEMENTS
From Worcester Polytechnic Institute:
● Our Project Advisors, Dr. Joseph Doiron and Dr. John Bergendahl
From Sharjah Electricity and Water Authority:
● Dr. Idris AlaEldin
● Ms. Mayyada Al Bardan
● Mr. Waleed El Damaty
● Conservation Department

164
RECOMMENDATIONS
06
ACKNOWLEDGEMENTS
● College of Engineering
○ Dean Naif Darwish
○ Associate Dean Assim Sagahyroon
○ Dr. Maruf Mortula
Student Partners: Ibrahim Abulaila and Mohammad Abuhalimeh
From American University of Sharjah:
● Students and Faculty
● International Exchange Office
● Office of Sustainability
● Office of Student Affairs
QUESTIONS?