water-chemistry data for selected hot springs, geysers ... 20041316.pdf · water-chemistry data for...
TRANSCRIPT
U.S. Department of the Interior U.S. Geological Survey
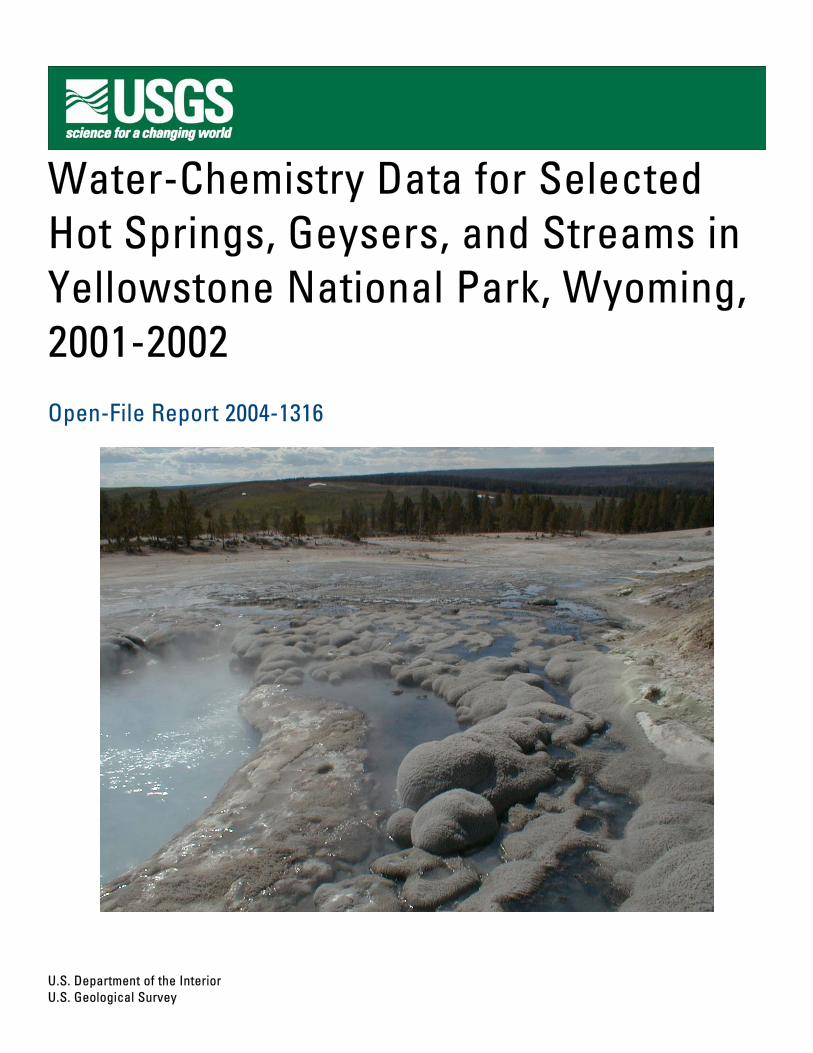
Water-Chemistry Data for Selected Hot Springs, Geysers, and Streams in Yellowstone National Park, Wyoming, 2001-2002 Open-File Report 2004-1316
Water-Chemistry Data for Selected Hot Springs, Geysers, and Streams in Yellowstone National Park, Wyoming, 2001-2002 By R. Blaine McCleskey, James W. Ball, D. Kirk Nordstrom, JoAnn M. Holloway, and Howard E. Taylor
Open-File Report 2004-1316
Any use of trade, firm, or product names is for descriptive purposes only and does not imply endorsement by the U.S. Government
Front Cover Photography: View taken in 2001 of Sulphur Spring, Crater Hills, Yellowstone National Park. Back Cover Photography: View taken in 2001 of Sulphur Spring, Crater Hills, Yellowstone National Park.
U.S. Department of the Interior U.S. Geological Survey
U.S. Department of the Interior Gale A. Norton, Secretary
U.S. Geological Survey Charles G. Groat, Director
U.S. Geological Survey, Boulder, Colorado 2004 Revised and reprinted: 2005
For product and ordering information: World Wide Web: http://www.usgs.gov/pubprod Telephone: 1-888-ASK-USGS
For more information on the USGS—the Federal source for science about the Earth, its natural and living resources, natural hazards, and the environment: World Wide Web: http://www.usgs.gov Telephone: 1-888-ASK-USGS
Although this report is in the public domain, permission must be secured from the individual copyright owners to reproduce any copyrighted material contained within this report.
ii
CONTENTS
Abstract .........................................................................................................................................................................1 Introduction ...................................................................................................................................................................2
Purpose and Scope..................................................................................................................................................2 Acknowledgments ..................................................................................................................................................2
Methods of Sample Collection, Preservation, and Analysis ..........................................................................................4 Sample Collection and Preservation.......................................................................................................................4 Analytical Measurements .......................................................................................................................................6 Field Measurements................................................................................................................................................6
pH Measurements............................................................................................................................................6 Hydrogen Sulfide Determinations...................................................................................................................7
Major-Cation and Trace-Metal Determinations ...................................................................................................13 Major-Anion Determinations ...............................................................................................................................13 Nutrient and Dissolved Organic Carbon Determinations .....................................................................................13 Water Isotope Determinations ..............................................................................................................................14 Acidity Determinations ........................................................................................................................................14 Revised pH Measurements ...................................................................................................................................15
Sample Locations and Cross-Reference Information ..................................................................................................18 Water-Chemistry Data.................................................................................................................................................35 References Cited..........................................................................................................................................................67 Appendix 1, Quality Assurance and Quality Control ..................................................................................................69 Appendix 2, Sample Site Photographs ........................................................................................................................78
FIGURES
1. Map showing location of sampling areas in Yellowstone National Park, Wyoming. .....................................3
2. Graph showing temperature dependence of hydrogen sulfide measurement using the methylene blue method.............................................................................................................................................................7
3. Flow-chart showing the sample pH selection process...................................................................................16
4-16. Maps showing:
4. Sampling locations with sample code numbers for hot springs, geysers, and surface waters at Norris Geyser Basin, Yellowstone National Park, Wyoming...................................................................................22
5. Sampling locations with sample code numbers for thermal features and one surface-water sample in the One Hundred Spring Plain area of Norris Geyser Basin, Yellowstone National Park, Wyoming...........23
6. Sampling locations with sample code numbers for hot springs and geysers in the southern part of Norris Geyser Basin, Yellowstone National Park, Wyoming. ......................................................................24
7. Sampling locations with sample code numbers for hot springs and one surface water sample in the Ragged Hills area of Norris Geyser Basin, Yellowstone National Park, Wyoming......................................25
8. Sampling locations with sample code numbers for Nymph Lake and Roadside Springs area, Bijah Spring, and Frying Pan Spring, Yellowstone Park, Wyoming ......................................................................26
9. Sampling locations with sample code numbers for Ojo Caliente Spring, Azure Spring, and Bath Spring, Lower Geyser Basin, Yellowstone Park, Wyoming. ........................................................................27
10. Sampling locations with sample code numbers for Octopus Spring and Mushroom Spring, Lower Geyser Basin, Yellowstone Park, Wyoming. ................................................................................................28
11. Sampling locations with sample code numbers for Washburn Hot Springs, Inkpot overflow channel, and Sulphur Creek, Yellowstone Park, Wyoming.........................................................................................29
iii
12. Sampling locations with sample code numbers for Canary Spring and its overflow channel, Mammoth Hot Springs area, Yellowstone Park, Wyoming............................................................................................30
13. Sampling locations with sample code numbers for thermal features at West Thumb Geyser Basin, Yellowstone Park, Wyoming. .......................................................................................................................31
14. Sampling locations with sample code numbers for thermal features in the Sulphur Springs area at Crater Hills, Yellowstone Park, Wyoming....................................................................................................32
15. Sampling location with sample code numbers for an unnamed spring downstream from Calcite Spring, Yellowstone Park, Wyoming. .......................................................................................................................33
16. Sampling locations with sample code numbers for Alluvium Creek and one of its tributaries, Brimstone Basin, Yellowstone National Park, Wyoming. ............................................................................34
17-23. Graphs showing:
17. Sample pH, temperature, Eh, and concentrations of H2S, As(T), As(III), Fe(T), and Fe(II) as a function of drainage distance for Nymph Creek..........................................................................................................36
18. Sample pH, temperature, Eh, and concentrations of H2S, NH4, NO2, and alkalinity as a function of drainage distance for Inkpot #1 in Washburn Springs...................................................................................37
19. Sample pH, temperature, and concentrations of As(T), As(III), and NO2 as a function of drainage distance for Mushroom Spring. .....................................................................................................................38
20. Sample pH, temperature, and concentrations of As(T), As(III), and NO2 as a function of drainage distance for Octopus Spring. .........................................................................................................................39
21. Sample pH, temperature, and concentrations of As(T), As(III), NH4 and NO2 as a function of drainage distance for Ojo Caliente Spring. ..................................................................................................................40
22. Frequency of charge imbalance for samples having major cation and anion determinations .......................70
23. Fluoride, total dissolved arsenic, and total dissolved iron concentrations determined by alternative methods .........................................................................................................................................................77
TABLES
1. Container preparation and stabilization methods for filtered samples .....................................................................5
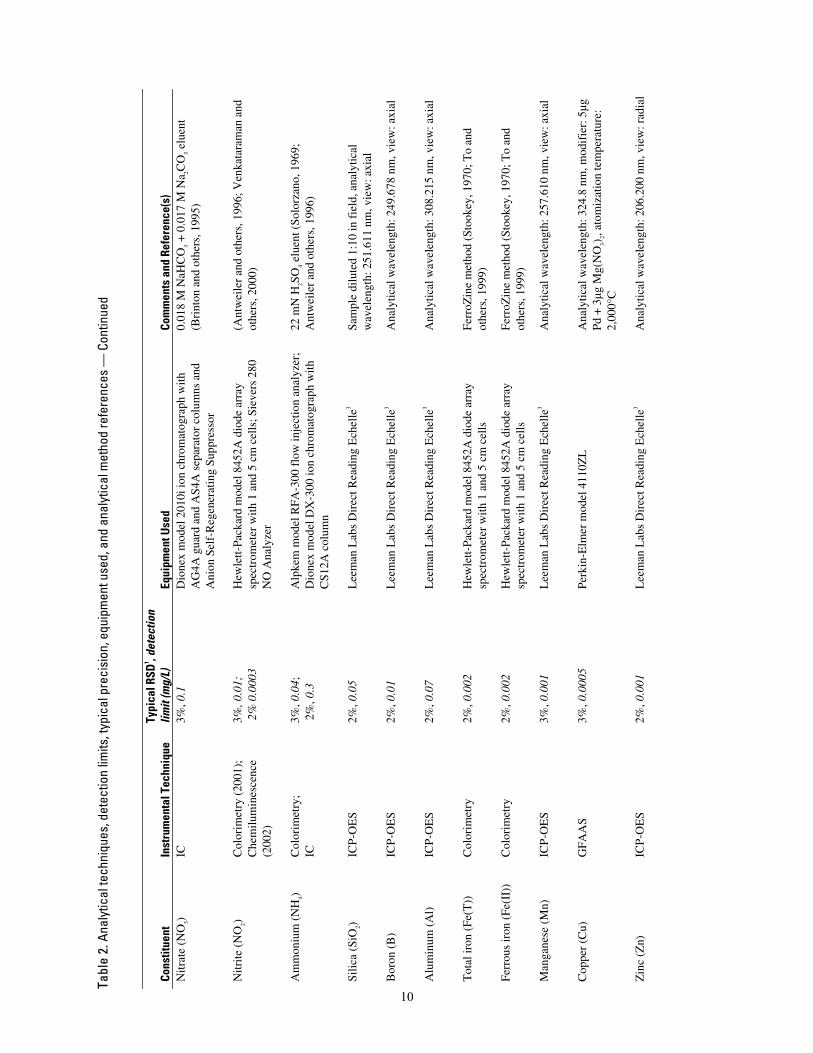
2. Analytical techniques, detection limits, typical precision, equipment used, and analytical method references ........................................................................................................................................................8
3. Sample pH measured in the field and laboratory and calculated from acidity titration and speciated charge imbalance, for samples with a pH less than 5 ....................................................................................17
4. Detailed sample site descriptions, locations, and map, photograph, and chemical data table reference .......19
5. Results of water analyses for Norris Geyser Basin, 2001-2002 ....................................................................41
6. Results of water analyses for Nymph Lake and Roadside, Frying Pan, and Bijah Springs, 2001-2002 .......51
7. Results of water analyses for Lower Geyser Basin, 2001-2002 ....................................................................58
8. Results of water analyses for Washburn Hot Springs, 2001-2002 ................................................................62
9. Results of water analyses for Calcite Springs, Crater Hills, Mammoth Hot Springs, and West Thumb Geryser Basin, 2001-2002.............................................................................................................................64
10. Results of water analyses for Brimstone Basin, 2001-2002 ..........................................................................66
11. Measurement of standard reference water samples .......................................................................................72
12. Water analyses for field blank.......................................................................................................................75
13. Spike recovery results ...................................................................................................................................76
iv

Explanation of Symbols and Abbreviations
--- not analyzed, measured, or calculated
< less than
°C degrees Celsius
C.I. charge imbalance
CVAFS cold-vapor atomic fluorescence spectrometry
DIW deionized water
DO dissolved oxygen
DOC dissolved organic carbon
EMF electromotive force
Eh redox potential
Fs pseudosigma
FA filtered-acidified
FU filtered-unacidified
FIAS flow injection analysis system
GFAAS graphite furnace atomic absorption spectrometry
GW ground water
HDPE high-density polyethylene
HGAAS hydride generation atomic absorption spectrometry
IC ion chromatography
ICP-OES inductively coupled plasma-optical emission spectrometry
ID identification
ISE ion-selective electrode
km kilometers
m meters
M moles per liter
mm millimeter
meq/L milliequivalents per liter
mM millimoles per liter
mg/L milligrams per liter
mV millivolts
MS mass spectrometry
MPV most probable value
μg/L micrograms per liter
μL microliter
μm micrometer
μS/cm microsiemens per centimeter
n number of analyses
N equivalents per liter
ng/L nanograms per liter
nm nanometer
PE polyethylene
RSD relative standard deviation
s standard deviation
SC specific conductance
SLAP standard light Antarctic precipitation
SRWS standard reference water sample
THGA transversely heated graphite atomizer
TISAB total ionic strength adjustment buffer
TOC total organic carbon
UV ultra-violet
VSMOW Vienna standard mean ocean water
v/v volume per volume
w/v weight per volume
v
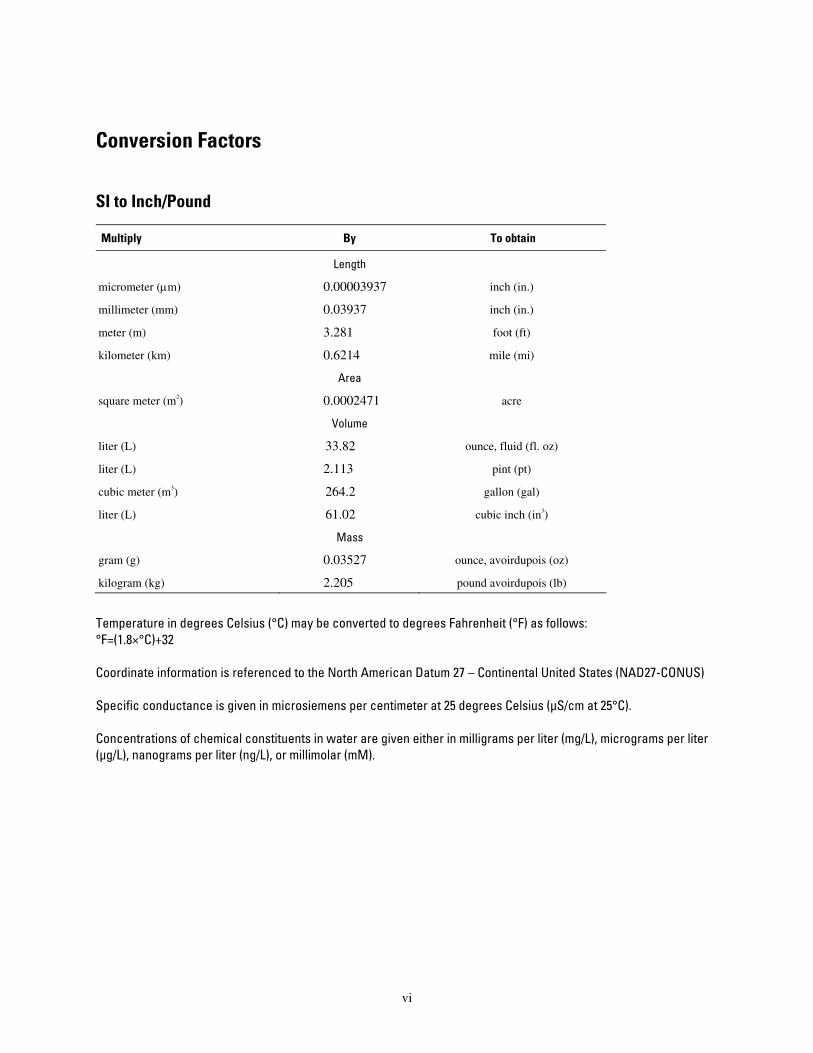
Conversion Factors
SI to Inch/Pound
Multiply By To obtain
Length
micrometer (μm) 0.00003937 inch (in.)
millimeter (mm) 0.03937 inch (in.)
meter (m) 3.281 foot (ft)
kilometer (km) 0.6214 mile (mi)
Area
square meter (m2) 0.0002471 acre
Volume
liter (L) 33.82 ounce, fluid (fl. oz)
liter (L) 2.113 pint (pt)
cubic meter (m3) 264.2 gallon (gal)
liter (L) 61.02 cubic inch (in3)
Mass
gram (g) 0.03527 ounce, avoirdupois (oz)
kilogram (kg) 2.205 pound avoirdupois (lb)
Temperature in degrees Celsius (°C) may be converted to degrees Fahrenheit (°F) as follows: °F=(1.8×°C)+32 Coordinate information is referenced to the North American Datum 27 – Continental United States (NAD27-CONUS) Specific conductance is given in microsiemens per centimeter at 25 degrees Celsius (µS/cm at 25°C). Concentrations of chemical constituents in water are given either in milligrams per liter (mg/L), micrograms per liter (µg/L), nanograms per liter (ng/L), or millimolar (mM).
vi
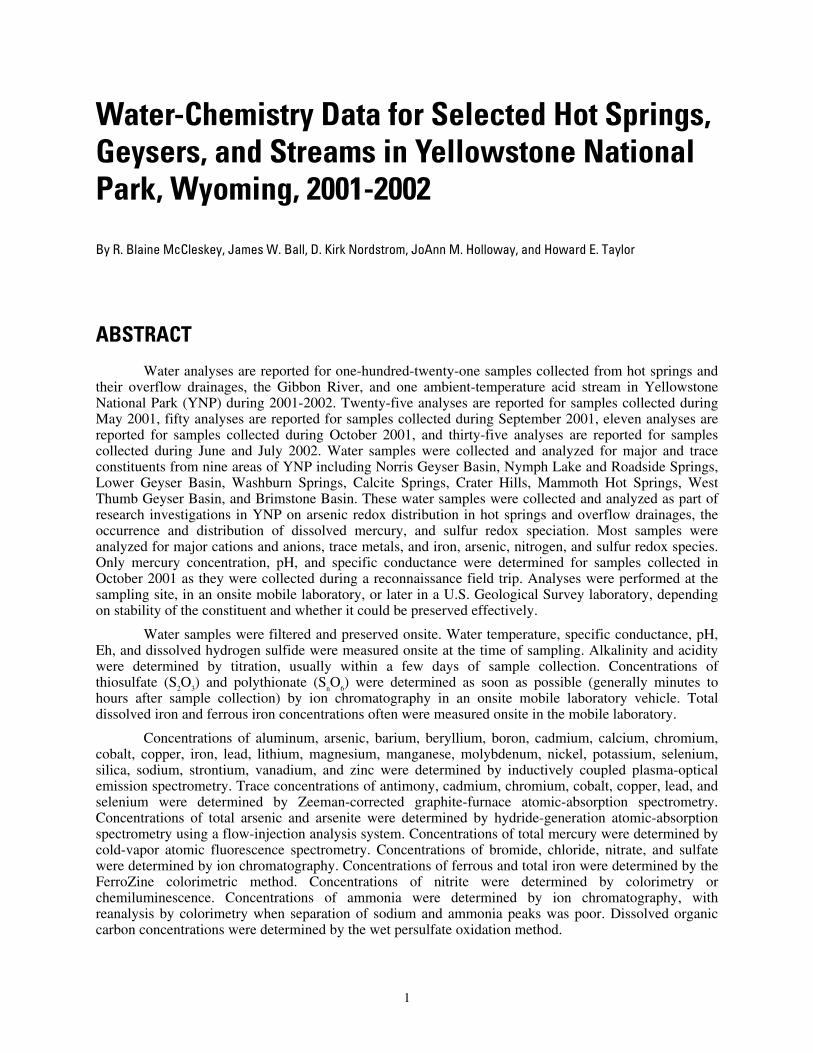
Water-Chemistry Data for Selected Hot Springs, Geysers, and Streams in Yellowstone National Park, Wyoming, 2001-2002
By R. Blaine McCleskey, James W. Ball, D. Kirk Nordstrom, JoAnn M. Holloway, and Howard E. Taylor
ABSTRACT
Water analyses are reported for one-hundred-twenty-one samples collected from hot springs and their overflow drainages, the Gibbon River, and one ambient-temperature acid stream in Yellowstone National Park (YNP) during 2001-2002. Twenty-five analyses are reported for samples collected during May 2001, fifty analyses are reported for samples collected during September 2001, eleven analyses are reported for samples collected during October 2001, and thirty-five analyses are reported for samples collected during June and July 2002. Water samples were collected and analyzed for major and trace constituents from nine areas of YNP including Norris Geyser Basin, Nymph Lake and Roadside Springs, Lower Geyser Basin, Washburn Springs, Calcite Springs, Crater Hills, Mammoth Hot Springs, West Thumb Geyser Basin, and Brimstone Basin. These water samples were collected and analyzed as part of research investigations in YNP on arsenic redox distribution in hot springs and overflow drainages, the occurrence and distribution of dissolved mercury, and sulfur redox speciation. Most samples were analyzed for major cations and anions, trace metals, and iron, arsenic, nitrogen, and sulfur redox species. Only mercury concentration, pH, and specific conductance were determined for samples collected in October 2001 as they were collected during a reconnaissance field trip. Analyses were performed at the sampling site, in an onsite mobile laboratory, or later in a U.S. Geological Survey laboratory, depending on stability of the constituent and whether it could be preserved effectively.
Water samples were filtered and preserved onsite. Water temperature, specific conductance, pH, Eh, and dissolved hydrogen sulfide were measured onsite at the time of sampling. Alkalinity and acidity were determined by titration, usually within a few days of sample collection. Concentrations of thiosulfate (S2O3) and polythionate (SnO6) were determined as soon as possible (generally minutes to hours after sample collection) by ion chromatography in an onsite mobile laboratory vehicle. Total dissolved iron and ferrous iron concentrations often were measured onsite in the mobile laboratory.
Concentrations of aluminum, arsenic, barium, beryllium, boron, cadmium, calcium, chromium, cobalt, copper, iron, lead, lithium, magnesium, manganese, molybdenum, nickel, potassium, selenium, silica, sodium, strontium, vanadium, and zinc were determined by inductively coupled plasma-optical emission spectrometry. Trace concentrations of antimony, cadmium, chromium, cobalt, copper, lead, and selenium were determined by Zeeman-corrected graphite-furnace atomic-absorption spectrometry. Concentrations of total arsenic and arsenite were determined by hydride-generation atomic-absorption spectrometry using a flow-injection analysis system. Concentrations of total mercury were determined by cold-vapor atomic fluorescence spectrometry. Concentrations of bromide, chloride, nitrate, and sulfate were determined by ion chromatography. Concentrations of ferrous and total iron were determined by the FerroZine colorimetric method. Concentrations of nitrite were determined by colorimetry or chemiluminescence. Concentrations of ammonia were determined by ion chromatography, with reanalysis by colorimetry when separation of sodium and ammonia peaks was poor. Dissolved organic carbon concentrations were determined by the wet persulfate oxidation method.
1
INTRODUCTION
Investigations into the water chemistry of hot springs, geysers, streams, and rivers in Yellowstone National Park (YNP) have been conducted by the U.S. Geological Survey (USGS), dating back to 1888. A table of publications describing these investigations can be found in Ball and others (2002). Waters at YNP have pH values ranging from less than 1 to 10, temperatures from ambient to about 93°C (boiling at YNP’s altitude), and high concentrations of alkalinity, arsenic, hydrogen sulfide, silica, and sulfate relative to many natural waters. Numerous redox reactions and mineral-precipitation reactions occur. In addition to being a valuable natural resource and tourist attraction, active geothermal areas such as those in YNP provide insight into formation of mineral deposits, microbiological processes in extreme environments, and water-rock interactions.
Purpose and Scope
The purpose of this report is to: (1) provide water-quality data from numerous sample sites in YNP; (2) describe methods used to collect and analyze the samples; (3) describe quality-control procedures; and (4) supplement interpretive reports. The samples were collected during four field trips to YNP during May, September, and October 2001 and June and July 2002. The primary purpose of the May and September 2001 and June 2002 field trips was to study the geochemical processes involving redox species of arsenic, iron, nitrogen, and sulfur in mineral springs and geothermal waters. Several papers have been published describing earlier phases of this project and of related collaborative research efforts (Ball and others, 1998a; 1998b; 2001; 2002; Xu and Schoonen, 1995; Xu and others, 1996; 1998; 2000). The evolution and chemical composition of several newly developed hydrothermal features of the Ragged Hills Area of Norris Geyser Basin also were studied. The occurrence and distribution of total dissolved mercury in geothermal waters was studied during the October 2001 and June 2002 field trips.
During 2001-2002, one-hundred-twenty-one water samples were collected from nine areas of YNP (fig. 1): Norris Geyser Basin, Nymph Lake and Roadside Springs including Bijah Spring and Frying Pan Spring, Lower Geyser Basin, Washburn Springs, Calcite Spring (near Tower Junction), Crater Hills, Mammoth Hot Springs, West Thumb Geyser Basin, and Brimstone Basin. Many of the analyses in this report contain the most complete data available for aqueous chemistry of YNP geothermal waters. Constituents analyzed include calcium (Ca), magnesium (Mg), strontium (Sr), barium (Ba), sodium (Na), potassium (K), lithium (Li), sulfate (SO4), thiosulfate (S2O3), polythionate (SnO6), hydrogen sulfide (H2S), alkalinity (HCO3), acidity, fluoride (F), chloride (Cl), bromide (Br), nitrate (NO3), nitrite (NO2), ammonium (NH4), silica (SiO2), boron (B), aluminum (Al), iron total (Fe(T)), ferrous iron (Fe(II)), manganese (Mn), copper (Cu), zinc (Zn), cadmium (Cd), chromium (Cr), cobalt (Co), mercury (Hg), nickel (Ni), lead (Pb), beryllium (Be), vanadium (V), molybdenum (Mo), antimony (Sb), selenium (Se), arsenic total (As(T)), arsenite (As(III)), dissolved organic carbon (DOC), and isotopes of hydrogen (δD) and oxygen (δ18O).
Acknowledgments
We extend our appreciation to the staff of Yellowstone National Park for permission to collect water samples and for their assistance on numerous occasions. In particular, we extend our thanks to Christi Hendrix, Katie Duffy, Wes Miles, Brian Thorpe, John Tebby, Bill Wise, and all of the Ranger staff at Norris Geyser Basin for escorting us and educating us about the many thermal features of Norris. We thank Steve Miller of the Yellowstone Spatial Analysis Center for assistance on numerous occasions with identifying and precisely locating Yellowstone Park thermal features. We also would like to extend our appreciation to Maria-Elvira Hernandez-Garcia and Sara LoVetere for their assistance with the 2001 sampling trips. We are especially thankful to John Varley, Director of the Center for Natural Resources at YNP, for his continued encouragement of our work.
2
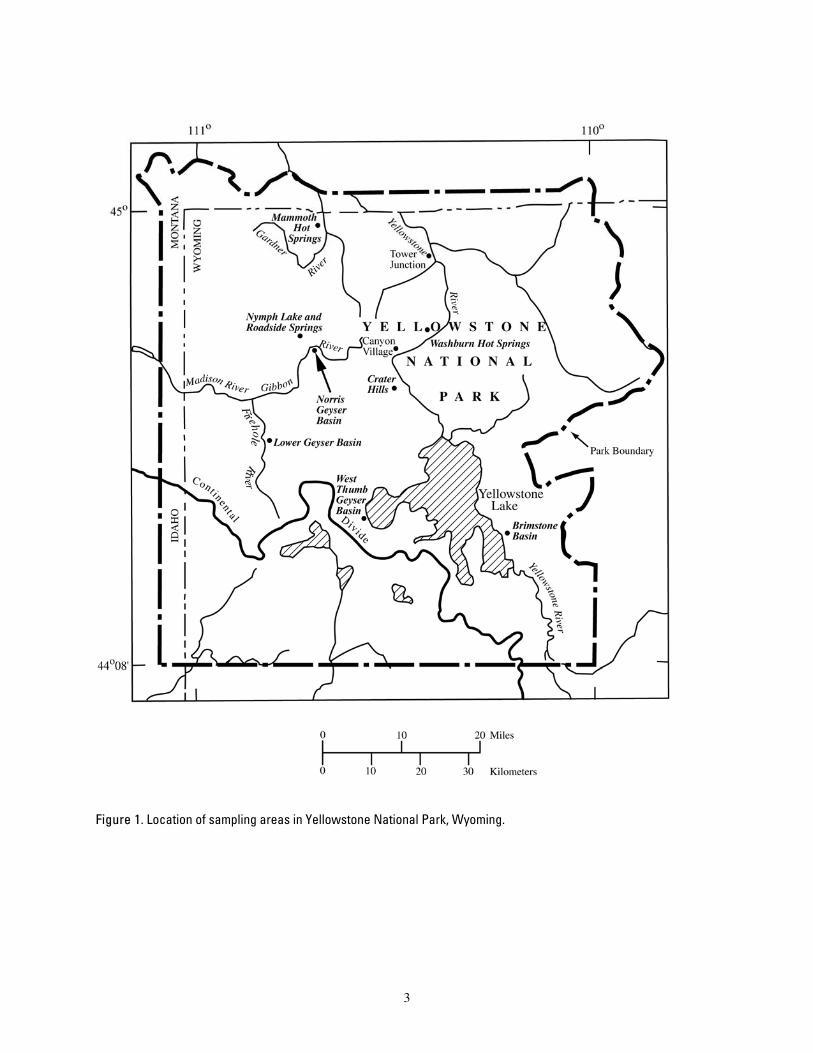
Figure 1. Location of sampling areas in Yellowstone National Park, Wyoming.
3
METHODS OF SAMPLE COLLECTION, PRESERVATION, AND ANALYSIS
Sample Collection and Preservation
Samples were collected from streams, tributaries, and overflow channels as close to the center of flow as possible and in areas that appeared to be well mixed. For hot springs and geysers, samples were collected as close to the discharge source as possible. Extreme care was taken to safely collect water samples from the larger geothermal sites, to protect fragile hot spring mineral formations, and to minimize changes in temperature, pH, and water chemistry during sampling. Samples were collected from the middle of large pools and geysers by positioning the sample tubing intake using a thermally insulated stainless steel container as a flotation device attached to the end of an extendable aluminum pole. At more easily accessible sites, the tubing intake was positioned in the source or channel by hand. A Teflon block attached to the end of the sampling tubing was used as a weight to keep the sample tubing in place (see photo 2 in the appendix). Grab samples also were collected from the source using the stainless-steel container or a syringe with Teflon tubing.
Samples were collected and filtered onsite by either or both of the following two techniques. The first technique involved pumping the water directly from the source with a battery-operated peristaltic pump fitted with medical-grade silicone tubing through a 142-mm diameter all-plastic filter holder (Kennedy and others, 1976) containing a 0.1-μm pore-size mixed-cellulose-ester filter membrane. The second technique consisted of filling a 60-mL syringe at the source or with source water collected in the stainless-steel container and immediately forcing the water through a 25-mm disposable filter having a mixed-cellulose-ester membrane with a pore size of 0.2 or 0.45 μm.
Sample splits were collected for analyses of inorganic constituents, redox species, hydrogen and oxygen isotopes, and dissolved organic carbon (DOC). Container preparation and storage and stabilization methods for filtered samples are summarized in table 1. Samples for the determination of major cations and trace metals (As, Al, B, Ba, Be, Ca, Cd, Co, Cr, Cu, Fe, Hg, K, Li, Mg, Mn, Mo, Na, Ni, Pb, Sb, Se, SiO2, Sr, V, and Zn), major anions (Br, Cl, F, NO3, and SO4), alkalinity (as HCO3), acidity, density, NH4, NO2, DOC , and water isotopes (δD and δ18O) were filtered and then stabilizing reagents, if needed, were added. Sample bottles were pre-rinsed with filtered water prior to sample collection. Stabilizing reagents for intermediate sulfur species were put into the sample bottle before the sample was collected; therefore, these bottles were not pre-rinsed. All sample splits were chilled as soon as practical after sample collection.
To prevent over-estimation of S2O3 concentrations, S(-II) oxidation was minimized by adding zinc chloride (ZnCl2). This technique caused zinc sulfide (ZnS) to precipitate. Polythionate (SnO6) was converted to thiocyanate (SCN) by the addition of potassium cyanide (KCN) to that sample split (Moses and others, 1984). For hot springs and geysers, a sample split for the determination of dissolved SiO2 was diluted onsite 1 to 9 with distilled water to prevent precipitation of SiO2 as the sample cooled. Samples for the determination of DOC were filtered through a 142-mm diameter all-plastic plate filter containing a 0.1-μm mixed-cellulose-ester filter membrane and collected in a glass bottle that was baked at 600°C. At least 1 L of sample was passed through the all-plastic plate filter assembly before a DOC sample was collected. An equipment blank processed in the field yielded a DOC value similar to DOC measured in double-distilled water from our laboratory storage container. Samples for δD and δ18O (water isotopes) determinations were filtered when the water filtered easily, otherwise water isotope samples were unfiltered.
4

Table 1. Container preparation and stabilization methods for filtered samples
[HCl, hydrochloric acid; HNO3, nitric acid; H2SO4, sulfuric acid; KCN, potassium cyanide; K2Cr2O7, potassium dichromate; M, moles per liter; mL, milliliters; N, equivalents per liter; NaOH, sodium hydroxide; v/v, volume per volume; w/v, weight per volume; ZnCl2, zinc chloride; °C, degrees Celsius; %, percent]
Sample type(s)
Storage container and preparation
Stabilization treatment in addition to refrigeration (4°C)
Major cations and trace metals (Al, B, Ba, Be, Ca, Cd, Co, Cr, Cu, K, Li, Mg, Mn, Mo, Na, Ni, Pb, Sb, Se, SiO
2, Sr,
V, and Zn)
Polyethylene bottles, soaked in 5% HCl and rinsed 3 times with distilled water
1% (v/v) concentrated redistilled HNO3
added, samples were not chilled
Total Mercury (Hg(T)) Borosilicate glass bottles, soaked with 5 % HNO
3 and rinsed 3 times with
deionized water
5 mL of concentrated redistilled HNO3
(added in the field) + 0.04% w/v K
2Cr
2O
7 per 125 mL of sample (added
in the laboratory)
Iron and arsenic redox species (Fe(T), Fe(II), As(T), and As(III))
Opaque polyethylene bottles, soaked in 5% HCl and rinsed 3 times with distilled water
1% (v/v) redistilled 6 N HCl added
Major anions (Br, Cl, F, and SO4),
alkalinity as HCO3, acidity, and density
Polyethylene bottles filled with distilled water and allowed to stand for 24 hours, then rinsed 3 times with distilled water
None
Ammonium (NH
4)
Same as major cations and trace metals
1% (v/v) 1:9 H
2SO
4 added
Nitrite (NO
2)
Same as anions
None
Silica (SiO
2)
Same as major anions, alkalinity, and density
Immediately diluted 1:9 with distilled water
Thiosulfate and polythionate (S
2O
3,
SnO
6)
30-mL polyethylene bottle
1.7% (v/v) 0.6 M ZnCl
2 plus 1% (v/v) 1
M NaOH added to precipitate S(-II), 1.7% (v/v) 1 M KCN also added to S
nO
6 bottle
Dissolved organic carbon (DOC)
Amber glass bottle baked at 600°C None
Water Isotopes (δD and δ 18O) 60-mL glass bottle None (unfiltered sample collected when filtration was not possible)
5
Analytical Measurements
Analytical methods, typical relative standard deviations, detection limits, equipment used, pertinent references, and comments are described briefly in table 2. Detection limits were equal to 3 times the sample standard deviation (s) of several dozen measurements of the constituent in a blank solution analyzed as a sample. Relative standard deviation for each analytical method is determined from the measurement of an analyte concentration at least ten times the detection limit. Quality assurance and quality control methods and results are presented in Appendix 1. Methods, general conditions, and variants from standard procedures are discussed in the following sections.
The purity of all reagents were equal to the reagent-grade standards of the American Chemical Society or higher. Double-distilled or de-ionized water and re-distilled or trace metal grade acids were used in all preparations. Samples were diluted as necessary to bring the analyte concentration within the optimal range of the method. Each sample was analyzed at least twice for each dilution and for all constituents.
Field Measurements
Temperature, specific conductance, pH, EMF, DO, and H2S were measured onsite. Measurements of EMF and pH were made on unfiltered sample water pumped from the source through an acrylic plastic flow-through cell to minimize sample contact with air. The flow-through cell contained a combination redox electrode, a pH electrode with integral thermistor, and test tubes containing buffer solutions for calibration of the pH electrode. All components were thermally equilibrated with the sample water before obtaining measurements. The redox potential (Eh) was calculated from the EMF value obtained at the temperature in the flow-through cell. Where possible, temperature, specific conductance, and DO measurements were made by immersing probes directly into the source as close to the sampling point as possible. Otherwise, probes were immersed into an unfiltered sample collected in a stainless steel insulated container, or into the flow-through cell. The DO probe does not function properly at temperatures greater than 55°C; therefore, DO was determined by the Winkler titration method for waters greater than 55°C.
A mobile laboratory truck containing an ion chromatograph, ultraviolet-visible spectrophotometer, autotitrator, and reagent-grade water system was set up as close to each sampling site as feasible so that unstable intermediate sulfur oxyanion species could be determined as soon as possible after sample collection. Iron redox species also were determined in the mobile laboratory to guide sampling strategies. Alkalinity and acidity titrations were performed before oxidation and hydrolysis reactions changed the sample composition.
pH Measurements
Field measurement of pH in geothermal waters is challenging because of high temperatures, complex sample matrices often supersaturated with CO2, and surging water resulting from gas discharge. We have found that many pH electrodes perform poorly in near-boiling water and some fail after only a few immersions. Thus, electrodes rated for boiling or near-boiling water temperatures were used. At each site, the flow-through cell, temperature probe, electrode, and calibration buffers were equilibrated to sample temperature prior to calibration and measurement. The system was calibrated using at least two bracketing standard buffers (chosen from among 1.68, 2.00, 4.01, 7.00, or 10.00) corrected to their values at the sample temperature. After calibration, the pH electrode was placed in the sample water in the flow-through cell and monitored until no change in temperature (± 0.1°C) or pH (± 0.01 standard unit) was detected for at least 30 seconds. Following sample measurement, the electrode was immersed in the standard buffer of pH closest to that of the sample and allowed to equilibrate. The entire calibration and measurement process was repeated as many times as necessary until the measured value for the buffer differed by no more than 0.05 standard units from its certified pH at the measured temperature.
6
7
20 30 40 50 600.4
0.6
0.8
1.0
1.2
1.4
1.6
Hydrogen Sulfide Determinations
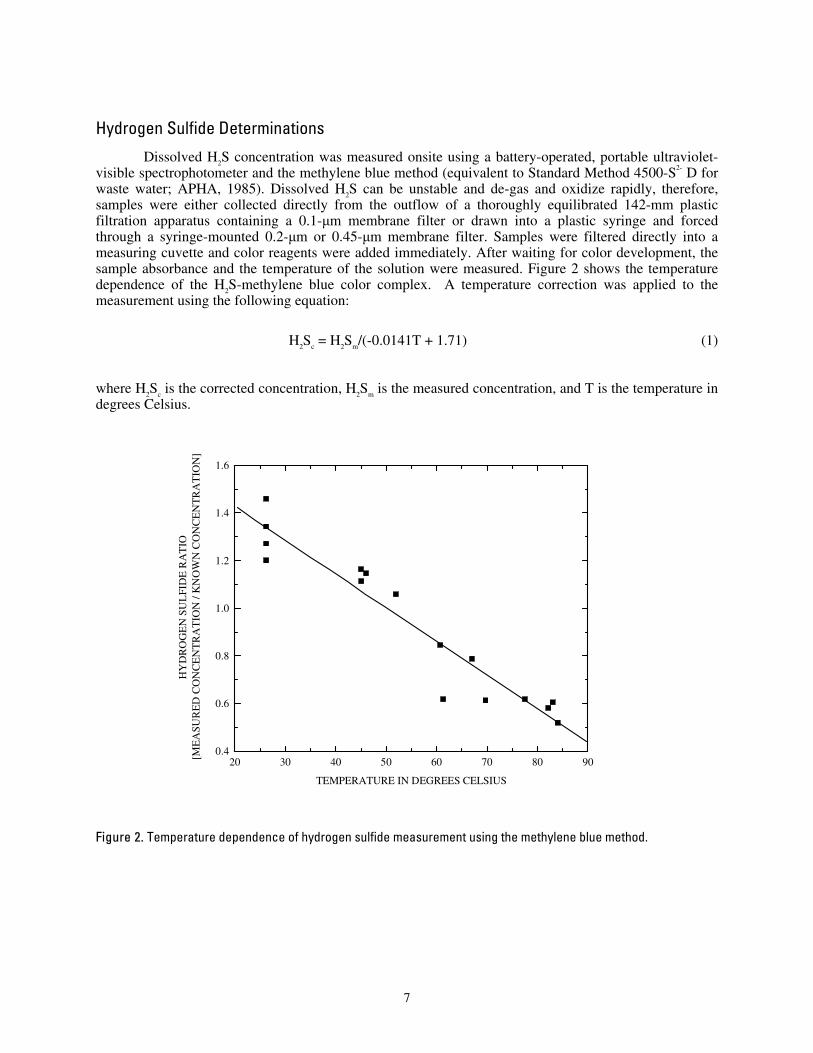
Dissolved H2S concentration was measured onsite using a battery-operated, portable ultraviolet-visible spectrophotometer and the methylene blue method (equivalent to Standard Method 4500-S2- D for waste water; APHA, 1985). Dissolved H2S can be unstable and de-gas and oxidize rapidly, therefore, samples were either collected directly from the outflow of a thoroughly equilibrated 142-mm plastic filtration apparatus containing a 0.1-μm membrane filter or drawn into a plastic syringe and forced through a syringe-mounted 0.2-μm or 0.45-μm membrane filter. Samples were filtered directly into a measuring cuvette and color reagents were added immediately. After waiting for color development, the sample absorbance and the temperature of the solution were measured. Figure 2 shows the temperature dependence of the H2S-methylene blue color complex. A temperature correction was applied to the measurement using the following equation:
H2Sc = H2Sm/(-0.0141T + 1.71) (1)
where H2Sc is the corrected concentration, H2Sm is the measured concentration, and T is the temperature in degrees Celsius.
Figure 2. Temperature dependence of hydrogen sulfide measurement using the methylene blue method.
70 80 90
EES CELSIUS
HY
DR
OG
EN
SU
LFI
DE
RA
TIO
[M
EA
SUR
ED
CO
NC
EN
TR
AT
ION
/ K
NO
WN
CO
NC
EN
TR
AT
ION
]
TEMPERATURE IN DEGR

Tabl
e 2.
Ana
lytic
al te
chni
ques
, det
ectio
n lim
its, t
ypic
al p
reci
sion
, equ
ipm
ent u
sed,
and
ana
lytic
al m
etho
d re
fere
nces
[cm
, cen
timet
er; C
VA
FS, c
old
vapo
r ato
mic
fluo
resc
ence
spec
trom
etry
; GFA
AS,
gra
phite
furn
ace
atom
ic a
bsor
ptio
n sp
ectro
met
ry; H
GA
AS,
hyd
ride
gene
ratio
n at
omic
abs
orpt
ion
spec
trom
etry
; IC
, ion
ch
rom
atog
raph
y; IC
P-O
ES, i
nduc
tivel
y co
uple
d pl
asm
a-op
tical
em
issi
on sp
ectro
met
ry; I
SE, i
on-s
elec
tive
elec
trode
; μg/
L, m
icro
gram
s per
lite
r; m
g/L,
mill
igra
ms p
er li
ter;
mM
, mill
imol
ar; m
N, m
illin
orm
al;
MS,
mas
s spe
ctro
met
ry; n
g/L,
nan
ogra
ms p
er li
ter;
nm, n
anom
eter
; RSD
, rel
ativ
e st
anda
rd d
evia
tion;
SC
, spe
cific
con
duct
ance
; SLA
P, st
anda
rd li
ght A
ntar
ctic
pre
cipi
tatio
n; T
ISA
B, t
otal
ioni
c st
reng
th
adju
stm
ent b
uffe
r; TO
C, t
otal
org
anic
car
bon;
VSM
OW
, Vie
nna
stan
dard
mea
n oc
ean
wat
er; %
, per
cent
]
Cons
titue
nt
Inst
rum
enta
l Tec
hniq
ue
Typi
cal R
SD1 ,
dete
ctio
n lim
it (m
g/L)
Eq
uipm
ent U
sed
Com
men
ts a
nd R
efer
ence
(s)
pH
Pote
ntio
met
ry
0.02
pH
uni
ts2
Bec
kman
265
pH
met
er w
ith O
rion
Ros
s co
mbi
natio
n el
ectr
ode
or O
rion
Res
earc
h m
odel
12
30 m
ulti-
para
met
er m
eter
with
pH
trio
de o
r O
rion
Ros
s co
mbi
natio
n el
ectr
ode
Tw
o- o
r th
ree-
buff
er c
alib
ratio
n at
sam
ple
tem
pera
ture
usi
ng 1
.68,
2.0
0, 4
.01,
7.0
0, a
nd
10.0
0 pH
buf
fers
Spec
ific
Con
duct
ance
(S
C)
C
ondu
ctom
etry
0.
5%
Ori
on R
esea
rch
mod
el 1
230
mul
ti-pa
ram
eter
m
eter
wit
h co
nduc
tivi
ty e
lect
rode
A
utom
atic
tem
pera
ture
cor
rect
ion,
cal
ibra
tion
w
ith 0
.010
0 N
KC
l
Eh
Pote
ntio
met
ry
10%
O
rion
Res
earc
h m
odel
96-
78-0
0 co
mbi
natio
n re
dox
elec
trod
e E
lect
rode
che
cked
usi
ng Z
oBel
l's s
olut
ion
(ZoB
ell,
1946
; Nor
dstr
om, 1
977)
Dis
solv
ed o
xyge
n
(DO
) T
itrat
ion
or
Pote
ntio
met
ry
1%
Bur
ette
and
Erl
enm
eyer
fla
sk o
r O
rion
Res
earc
h m
odel
123
0 m
ulti-
para
met
er m
eter
with
dis
solv
ed
oxyg
en p
robe
Win
kler
Titr
atio
n us
ing
man
gano
us s
ulfa
te,
alka
line
iodi
de-a
zide
, sul
fam
ic a
cid,
sta
rch
indi
cato
r, p
heny
l ars
ine
oxid
e (A
PHA
, 197
1).
Prob
e us
ed o
nly
at te
mpe
ratu
res
less
than
45°
C.
Cal
cium
(C
a)
ICP-
OE
S 2%
, 0.1
L
eem
an L
abs
Dir
ect R
eadi
ng E
chel
le3
Ana
lytic
al w
avel
engt
h: 3
15.8
87 n
m, v
iew
: rad
ial
Mag
nesi
um (
Mg)
IC
P-O
ES
2%, 0
.001
L
eem
an L
abs
Dir
ect R
eadi
ng E
chel
le3
Ana
lytic
al w
avel
engt
h: 2
80.2
70 n
m, v
iew
: axi
al
Sodi
um (
Na)
IC
P-O
ES
2%, 0
.1
Lee
man
Lab
s D
irec
t Rea
ding
Ech
elle
3A
naly
tical
wav
elen
gth:
589
.592
nm
, vie
w: r
adia
l
Pota
ssiu
m (
K)
ICP-
OE
S 3%
, 0.0
4 L
eem
an L
abs
Dir
ect R
eadi
ng E
chel
le3
1,00
0 m
g/L
Cs
ioni
zatio
n bu
ffer
, ana
lytic
al
wav
elen
gth:
766
.490
nm
, vie
w: a
xial
Stro
ntiu
m (
Sr)
ICP-
OE
S 2%
, 0.0
01
Lee
man
Lab
s D
irec
t Rea
ding
Ech
elle
3A
naly
tical
wav
elen
gth:
421
.611
nm
, vie
w: a
xial
Bar
ium
(B
a)
ICP-
OE
S 2%
, 0.0
01
Lee
man
Lab
s D
irec
t Rea
ding
Ech
elle
3A
naly
tical
wav
elen
gth:
455
.403
nm
, vie
w: a
xial
8

Tabl
e 2.
Ana
lytic
al te
chni
ques
, det
ectio
n lim
its, t
ypic
al p
reci
sion
, equ
ipm
ent u
sed,
and
ana
lytic
al m
etho
d re
fere
nces
— C
ontin
ued
Cons
titue
nt
Inst
rum
enta
l Tec
hniq
ue
Typi
cal R
SD1 ,
dete
ctio
n lim
it (m
g/L)
Eq
uipm
ent U
sed
Com
men
ts a
nd R
efer
ence
(s)
Lith
ium
(L
i)
ICP-
OE
S 2%
, 0.0
03
Lee
man
Lab
s D
irec
t Rea
ding
Ech
elle
31,
000
mg/
L C
s io
niza
tion
buff
er, a
naly
tical
w
avel
engt
h: 6
70.7
84 n
m, v
iew
: axi
al
Sulf
ate
(SO
4)
IC
3%, 1
.0
Dio
nex
mod
el 2
010i
ion
chro
mat
ogra
ph w
ith
AG
4A g
uard
and
AS4
A s
epar
ator
col
umns
and
A
nion
Sel
f-R
egen
erat
ing
Supp
ress
or
0.01
8 M
NaH
CO
3 + 0
.017
M N
a 2CO
3 elu
ent
(Bri
nton
and
oth
ers,
199
5)
Thi
osul
fate
(S 2O
3)
IC
3%, 0
.3
Dio
nex
mod
el 2
010i
ion
chro
mat
ogra
ph w
ith tw
o A
G4A
gua
rd c
olum
ns a
nd A
nion
Sel
f-R
egen
erat
ing
Supp
ress
or
0.02
8 M
NaH
CO
3 + 0
.022
M N
a 2CO
3 elu
ent
(Mos
es a
nd o
ther
s, 1
984)
Poly
thio
nate
(S nO
6)
IC
3%, 0
.3
Dio
nex
mod
el 2
010i
ion
chro
mat
ogra
ph w
ith tw
o A
G4A
gua
rd c
olum
ns a
nd A
nion
Sel
f-R
egen
erat
ing
Supp
ress
or
0.02
8 M
NaH
CO
3 + 0
.022
M N
a 2CO
3 elu
ent
(Mos
es a
nd o
ther
s, 1
984)
Hyd
roge
n su
lfid
e
(H2S
) C
olor
imet
ry
3%, 0
.002
H
ach
mod
el D
R-2
000
ultr
avio
let -
vis
ible
sp
ectr
omet
er a
nd H
ach
met
hod
# 81
31 r
eage
nts
Met
hyle
ne B
lue
Met
hod
base
d on
APH
A (
1985
)
Alk
alin
ity (
as H
CO
3)
Titr
atio
n 2%
, 1.0
O
rion
Res
earc
h m
odel
960
/940
aut
otitr
ator
, po
tent
iom
etri
c de
tect
ion,
end
-poi
nt d
eter
min
ed b
y th
e fi
rst d
eriv
ativ
e te
chni
que
(Bar
ring
er a
nd J
ohns
son,
198
9; F
ishm
an a
nd
Frie
dman
, 198
9)
Aci
dity
Tit
rati
on
2%, 0
.4 m
M
Ori
on R
esea
rch
mod
el 9
60/9
40 a
utot
itrat
or,
pote
ntio
met
ric
dete
ctio
n (B
arri
nger
and
Joh
nsso
n, 1
989;
Fis
hman
and
Fr
iedm
an, 1
989)
Fluo
ride
(F)
IS
E
3%, 0
.1
Ori
on R
esea
rch
mod
el 9
6-09
com
bina
tion
F-
elec
trod
e Sa
mpl
e m
ixed
1:1
with
TIS
AB
(B
arna
rd a
nd N
ords
trom
, 198
0)
Chl
orid
e (C
l)
IC
3%, 0
.05
Dio
nex
mod
el 2
010i
ion
chro
mat
ogra
ph w
ith
AG
4A g
uard
and
AS4
A s
epar
ator
col
umns
and
A
nion
Sel
f-R
egen
erat
ing
Supp
ress
or
0.01
8 M
NaH
CO
3 + 0
.017
M N
a 2CO
3 elu
ent
(Bri
nton
and
oth
ers,
199
5)
Bro
mid
e (B
r)
IC
3%, 0
.1
Dio
nex
mod
el 2
010i
ion
chro
mat
ogra
ph w
ith
AG
4A g
uard
and
AS4
A s
epar
ator
col
umns
and
A
nion
Sel
f-R
egen
erat
ing
Supp
ress
or
0.01
8 M
NaH
CO
3 + 0
.017
M N
a 2CO
3 elu
ent
(Bri
nton
and
oth
ers,
199
5)
9
Tabl
e 2.
Ana
lytic
al te
chni
ques
, det
ectio
n lim
its, t
ypic
al p
reci
sion
, equ
ipm
ent u
sed,
and
ana
lytic
al m
etho
d re
fere
nces
— C
ontin
ued
Cons
titue
nt
Inst
rum
enta
l Tec
hniq
ue
Typi
cal R
SD1 , d
etec
tion
limit
(mg/
L)
Equi
pmen
t Use
d Co
mm
ents
and
Ref
eren
ce(s
) N
itra
te (
NO
3)
IC
3%, 0
.1
Dio
nex
mod
el 2
010i
ion
chro
mat
ogra
ph w
ith
AG
4A g
uard
and
AS4
A s
epar
ator
col
umns
and
A
nion
Sel
f-R
egen
erat
ing
Supp
ress
or
0.01
8 M
NaH
CO
3 + 0
.017
M N
a 2CO
3 elu
ent
(Bri
nton
and
oth
ers,
199
5)
Nitr
ite (
NO
2)
Col
orim
etry
(20
01);
C
hem
ilum
ines
cenc
e (2
002)
3%, 0
.01;
2
% 0
.000
3 H
ewle
tt-Pa
ckar
d m
odel
845
2A d
iode
arr
ay
spec
trom
eter
with
1 a
nd 5
cm
cel
ls; S
ieve
rs 2
80
NO
Ana
lyze
r
(Ant
wei
ler
and
othe
rs, 1
996;
Ven
kata
ram
an a
nd
othe
rs, 2
000)
Am
mon
ium
(N
H4)
C
olor
imet
ry;
IC
3%, 0
.04;
2
%, 0
.3
Alp
kem
mod
el R
FA-3
00 f
low
inje
ctio
n an
alyz
er;
Dio
nex
mod
el D
X-3
00 io
n ch
rom
atog
raph
with
C
S12A
col
umn
22 m
N H
2SO
4 elu
ent (
Solo
rzan
o, 1
969;
A
ntw
eile
r an
d ot
hers
, 199
6)
Sili
ca (
SiO
2)
ICP-
OE
S 2%
, 0.0
5 L
eem
an L
abs
Dir
ect R
eadi
ng E
chel
le3
Sam
ple
dilu
ted
1:10
in f
ield
, ana
lyti
cal
wav
elen
gth:
251
.611
nm
, vie
w: a
xial
Bor
on (
B)
ICP-
OE
S 2%
, 0.0
1 L
eem
an L
abs
Dir
ect R
eadi
ng E
chel
le3
Ana
lytic
al w
avel
engt
h: 2
49.6
78 n
m, v
iew
: axi
al
Alu
min
um (
Al)
IC
P-O
ES
2%, 0
.07
Lee
man
Lab
s D
irec
t Rea
ding
Ech
elle
3A
naly
tical
wav
elen
gth:
308
.215
nm
, vie
w: a
xial
Tot
al ir
on (
Fe(T
))
Col
orim
etry
2%
, 0.0
02
Hew
lett-
Pack
ard
mod
el 8
452A
dio
de a
rray
sp
ectr
omet
er w
ith 1
and
5 c
m c
ells
Fe
rroZ
ine
met
hod
(Sto
okey
, 197
0; T
o an
d ot
hers
, 199
9)
Ferr
ous
iron
(Fe
(II)
) C
olor
imet
ry
2%, 0
.002
H
ewle
tt-Pa
ckar
d m
odel
845
2A d
iode
arr
ay
spec
trom
eter
with
1 a
nd 5
cm
cel
ls
Ferr
oZin
e m
etho
d (S
took
ey, 1
970;
To
and
othe
rs, 1
999)
Man
gane
se (
Mn)
IC
P-O
ES
3%, 0
.001
L
eem
an L
abs
Dir
ect R
eadi
ng E
chel
le3
Ana
lytic
al w
avel
engt
h: 2
57.6
10 n
m, v
iew
: axi
al
Cop
per
(Cu)
G
FAA
S 3%
, 0.0
005
Perk
in-E
lmer
mod
el 4
110Z
L
Ana
lytic
al w
avel
engt
h: 3
24.8
nm
, mod
ifie
r: 5μg
Pd
+ 3μg
Mg(
NO
3)2,
atom
izat
ion
tem
pera
ture
: 2,
000°
C
Zin
c (Z
n)
ICP-
OE
S 2%
, 0.0
01
Lee
man
Lab
s D
irec
t Rea
ding
Ech
elle
3A
naly
tical
wav
elen
gth:
206
.200
nm
, vie
w: r
adia
l
10

Tabl
e 2.
Ana
lytic
al te
chni
ques
, det
ectio
n lim
its, t
ypic
al p
reci
sion
, equ
ipm
ent u
sed,
and
ana
lytic
al m
etho
d re
fere
nces
— C
ontin
ued
Cons
titue
nt
Inst
rum
enta
l Tec
hniq
ue
Typi
cal R
SD1 , d
etec
tion
limit
(mg/
L)
Equi
pmen
t Use
d Co
mm
ents
and
Ref
eren
ce(s
) C
adm
ium
(C
d)
GFA
AS
5%, 0
.000
1 Pe
rkin
-Elm
er m
odel
411
0ZL
A
naly
tical
wav
elen
gth:
228
.8 n
m, m
odif
ier:
50μg
PO
4 + 3μg
Mg(
NO
3)2,
atom
izat
ion
tem
pera
ture
: 1,5
00°C
Chr
omiu
m (
Cr)
G
FAA
S ~5
%, 0
.000
5 Pe
rkin
-Elm
er m
odel
411
0ZL
A
naly
tical
wav
elen
gth:
357
.9 n
m, m
odif
ier:
15μg
Mg(
NO
3), a
tom
izat
ion
tem
pera
ture
: 2,
300°
C
Cob
alt (
Co)
G
FAA
S ~5
%, 0
.000
7 Pe
rkin
-Elm
er m
odel
411
0ZL
A
naly
tical
wav
elen
gth:
242
.5 n
m, m
odif
ier:
15μg
Mg(
NO
3)2,
ato
miz
atio
n te
mpe
ratu
re:
2,40
0°C
Tot
al m
ercu
ry (
Hg(
T))
C
VA
FS
2%, 0
.4 n
g/L
PS
Ana
lytic
al, m
odel
Gal
ahad
, dir
ect c
old-
vapo
r at
omic
flu
ores
cenc
e sp
ectr
omet
ry
Tay
lor
and
othe
rs (
1997
), R
oth
and
othe
rs
(200
1)
Nic
kel (
Ni)
IC
P-O
ES
2%, 0
.002
L
eem
an L
abs
Dir
ect R
eadi
ng E
chel
le3
Ana
lytic
al w
avel
engt
h: 2
31.6
04 n
m, v
iew
: axi
al
Lea
d (P
b)
GFA
AS
5%, 0
.000
8 Pe
rkin
-Elm
er m
odel
411
0ZL
A
naly
tical
wav
elen
gth:
283
.3 n
m, m
odif
ier:
50μg
PO
4 + 3μg
Mg(
NO
3)2,
atom
izat
ion
tem
pera
ture
: 1,6
00°C
Ber
ylliu
m (
Be)
IC
P-O
ES
2%, 0
.001
L
eem
an L
abs
Dir
ect R
eadi
ng E
chel
le3
Ana
lytic
al w
avel
engt
h: 3
13.0
42 n
m, v
iew
: axi
al
Van
adiu
m (
V)
ICP-
OE
S 3%
, 0.0
02
Lee
man
Lab
s D
irec
t Rea
ding
Ech
elle
3A
naly
tical
wav
elen
gth:
292
.401
nm
, vie
w: a
xial
Mol
ybde
num
(M
o)
ICP-
OE
S 3%
, 0.0
07
Lee
man
Lab
s D
irec
t Rea
ding
Ech
elle
3A
naly
tical
wav
elen
gth:
277
.540
nm
, vie
w: a
xial
Ant
imon
y (S
b)
GFA
AS
5%, 0
.001
Pe
rkin
-Elm
er m
odel
411
0ZL
A
naly
tical
wav
elen
gth:
217
.6 n
m, m
odif
ier:
5μg
Pd
+ 3μg
Mg(
NO
3)2,
atom
izat
ion
tem
pera
ture
: 1,
900°
C
Sele
nium
(Se
) G
FAA
S 5%
, 0.0
01
Perk
in-E
lmer
mod
el 4
110Z
L
Ana
lytic
al w
avel
engt
h: 1
96.0
nm
, mod
ifie
r: 5μg
Pd
+ 3μg
Mg(
NO
3)2,
atom
izat
ion
tem
pera
ture
: 2,
100°
C
11

Cons
titue
nt
Inst
rum
enta
l Tec
hniq
ue
Typi
cal R
SD1 , d
etec
tion
limit
(mg/
L)
Equi
pmen
t Use
d Co
mm
ents
and
Ref
eren
ce(s
) Se
leni
um (
Se)
GFA
AS
5%, 0
.001
Pe
rkin
-Elm
er m
odel
411
0ZL
A
naly
tical
wav
elen
gth:
196
.0 n
m, m
odif
ier:
5μg
Pd
+ 3μg
Mg(
NO
3)2,
atom
izat
ion
tem
pera
ture
: 2,
100°
C
Ars
enic
tota
l (A
s(T
))
HG
AA
S 2%
, 0.0
001
Perk
in-E
lmer
AA
naly
st 3
00 a
tom
ic a
bsor
ptio
n sp
ectr
omet
er w
ith a
FIA
S-10
0 fl
ow in
ject
ion
anal
ysis
sys
tem
, qua
rtz
cell
, and
fur
nace
Pre-
redu
ctio
n of
As(
V)
usin
g K
I +
asc
orbi
c ac
id
+ H
Cl (
McC
lesk
ey a
nd o
ther
s, 2
003)
Ars
enite
(A
s(II
I))
HG
AA
S 5%
, 0.0
005
Perk
in-E
lmer
AA
naly
st 3
00 a
tom
ic a
bsor
ptio
n sp
ectr
omet
er w
ith a
FIA
S-10
0 fl
ow in
ject
ion
anal
ysis
sys
tem
, qua
rtz
cell
, and
fur
nace
(McC
lesk
ey a
nd o
ther
s, 2
003)
Deu
teri
um (δD
) M
S 1
per
mil2
V.G
. Mic
rom
ass
mod
el 6
02 m
ass
spec
trom
eter
St
anda
rdiz
atio
n ag
ains
t VSM
OW
(δD
= 0
per
m
il) a
nd S
LA
P (δ
D =
-42
8 pe
r m
il) (
Cop
len
and
othe
rs, 1
991)
Oxy
gen
(δ18O
) M
S 0.
1 pe
r m
il2D
uPon
t mod
el 2
1-49
1 m
ass
spec
trom
eter
St
anda
rdiz
atio
n ag
ains
t VSM
OW
(δ18
O =
0 p
er
mil)
and
SL
AP
(δ18O
= -
55.5
per
mil
) (E
pste
in
and
May
eda,
195
3)
Dis
solv
ed o
rgan
ic
carb
on (
DO
C)
TO
C A
naly
zer
2%, 0
.1
Oce
anog
raph
y In
tern
atio
nal M
odel
700
TO
C
Ana
lyze
r W
et o
xida
tion
met
hod
(Aik
en, 1
992)
1 rela
tive
stan
dard
dev
iatio
n ex
pres
sed
in p
erce
nt (s
tand
ard
devi
atio
n ÷
mea
n ×
100
)
2 thes
e va
lues
are
exp
ress
ions
of p
reci
sion
or r
ange
, rat
her t
han
RSD
3 dual
vie
w, s
eque
ntia
l mul
tiele
men
t, in
duct
ivel
y co
uple
d pl
asm
a sp
ectro
met
er. H
ildeb
rand
grid
neb
uliz
er a
nd g
lass
Sco
tt sp
ray
cham
ber
Tabl
e 2.
Ana
lytic
al te
chni
ques
, det
ectio
n lim
its, t
ypic
al p
reci
sion
, equ
ipm
ent u
sed,
and
ana
lytic
al m
etho
d re
fere
nces
— C
ontin
ued
12
Major-Cation and Trace-Metal Determinations
Concentrations of major cations and trace metals were determined using inductively coupled plasma-optical emission spectrometry (ICP-OES). Major cation concentrations were determined using the radial view while the axial view was used for trace-metal determinations. A cesium chloride (CsCl) ionization buffer was added to the samples for ICP-OES measurement of lithium and potassium concentrations. Analytical wavelengths and plasma viewing orientations are specified in table 2.
Concentrations of Sb, Cd, Cr, Co, Cu, Pb, and Se were measured using graphite furnace atomic absorption spectrometry (GFAAS) with a transversely heated graphite atomizer (THGA) and Zeeman-effect background correction. The wavelength, atomization temperature, and matrix modifiers used are listed in table 2.
Hydride generation atomic absorption spectrometry was used to measure dissolved As(T) and dissolved As(III) concentrations in HCl-acidified samples. A flow-injection analysis system (FIAS) was used to generate arsine (McCleskey and others, 2003). Dissolved Fe(T) and Fe(II) concentrations were determined in samples preserved with HCl using a modification of the FerroZine colorimetric method (Stookey, 1970; To and others, 1999).
Major-Anion Determinations
Concentrations of SO4, Cl, and Br were determined using ion chromatography (IC) (Brinton and others, 1995). Fluoride concentrations were determined using an ion-selective electrode (ISE) and mixing samples one to one with a total ionic strength adjustment buffer (TISAB) (Barnard and Nordstrom, 1980). Alkalinity (as HCO3) was determined by automated titration using standardized H2SO4 (Barringer and Johnsson, 1989).
Nutrient and Dissolved Organic Carbon Determinations
Ammonium concentrations were determined using an IC with 50 mN H2SO4 eluent. Samples containing elevated Na concentrations often yielded poor peak resolution requiring secondary analyses by spectrophotometry. Ammonium concentrations measured using IC were compared with values from the same sample analyzed by spectrophotometry to ensure equivalent results. Nitrite concentrations were determined by colorimetry (Antweiler and others, 1996) for the samples collected in May 2001 and by chemiluminescence (Venkataraman and others, 2000) for all other samples. For the chemiluminescence NO2 determination, a 1 percent solution of KI in glacial acetic acid was used to convert NO2 to NO. The NO produced in this step reacted with ozone to form an excited state of NO2* proportional to the amount of NO in the sample, and was quantified using a chemiluminescence detector.
Dissolved organic carbon concentrations were measured using the wet oxidation method (Aiken, 1992) with Oceanography International Model 700 TOC Analyzer. Potassium biphthalate was used to calibrate the instrument, and sodium benzoate was used as a different organic carbon source to check the calibration. Analyses of an inorganic carbon, NaHCO3, alongside the samples provided a daily verification that the acid valve was functioning properly.
13
Water Isotope Determinations
Hydrogen isotope ratios were determined using a hydrogen equilibration technique (Coplen and others, 1991; Revesz and Coplen, 2003a). Oxygen isotope ratios were determined using the CO2 equilibration technique of Epstein and Mayeda (1953), which has been automated by Revesz and Coplen (2003b). The isotopic concentration is reported in “delta notation,” which compares the isotope ratio of a sample to that of a reference standard. For the example of 18O/16O ratios, delta notation is:
(2) 1000
OO
OO
OO
O‰δ
standard16
18
standard16
18
sample16
18
18 ×⎟⎠⎞⎜
⎝⎛
⎟⎠⎞⎜
⎝⎛−⎟
⎠⎞⎜
⎝⎛
= where ‰ is per mil, which is equivalent to parts per thousand.
Oxygen and hydrogen isotopic results are reported relative to the VSMOW (Vienna Standard
Mean Ocean Water) standard and normalized (Coplen, 1994) on scales such that the oxygen and hydrogen isotopic values of SLAP (Standard Light Antarctic Precipitation) are -55.5 per mil and -428 per mil, respectively.
Acidity Determinations
Total acidity was determined by titrating samples having pH less than 5 to pH greater than 7 using an autotitrator and standardized sodium hydroxide (NaOH) solution. The NaOH titrant (0.01 to 0.05 M) was standardized daily by titrating a known quantity of potassium hydrogen phthalate. The autotitrator was programmed for 50- to 100-μL constant-volume additions or constant change in millivolts (mV), typically 10 mV per addition. Equivalence points were determined using a modified Gran’s function (Barringer and Johnsson, 1989):
Facid = (v0 + vNaOH) × 10-pH (3)
where Facid is the Gran function, v0 is the sample volume and vNaOH is the volume of NaOH titrant added.
The portion of the titration curve for total acidity will lie in the basic region where free hydrogen
ion (H+) is negligible compared to hydroxide (OH-). Therefore, OH- may be substituted for H+, or 10-pOH for 10-pH in equation (3) (Barringer and Johnsson, 1996). The most important reactions contributing to total acidity are sulfate hydrolysis, iron oxidation and hydrolysis, and aluminum hydrolysis (Ball and others, 2002). Free H+ was derived by subtracting the hydrogen ions produced by hydrolysis of sulfate, iron, and aluminum from the total acidity. The bisulfate concentration was estimated using an interactive version (PHREEQCI, Charlton and others, 1997) of the geochemical modeling code PHREEQC (Parkhurst and Appelo, 1999) in conjunction with the WATEQ4F (Ball and Nordstrom, 1991) database. Sample pH from the acidity titration was calculated by combining the H+ activity coefficient determined by PHREEQCI with the free H+ molality and computing the common logarithm of the resulting activity. Total acidity and free H+ are expressed in millimoles per liter (mM).
14
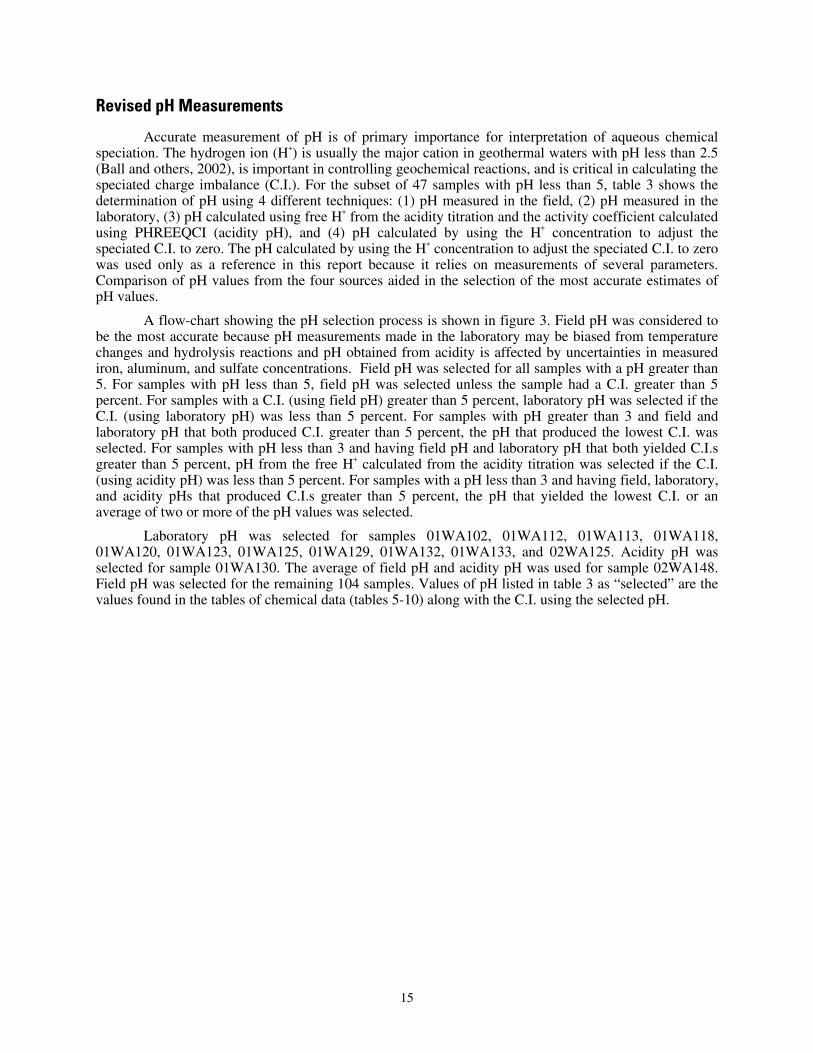
Revised pH Measurements
Accurate measurement of pH is of primary importance for interpretation of aqueous chemical speciation. The hydrogen ion (H+) is usually the major cation in geothermal waters with pH less than 2.5 (Ball and others, 2002), is important in controlling geochemical reactions, and is critical in calculating the speciated charge imbalance (C.I.). For the subset of 47 samples with pH less than 5, table 3 shows the determination of pH using 4 different techniques: (1) pH measured in the field, (2) pH measured in the laboratory, (3) pH calculated using free H+ from the acidity titration and the activity coefficient calculated using PHREEQCI (acidity pH), and (4) pH calculated by using the H+ concentration to adjust the speciated C.I. to zero. The pH calculated by using the H+ concentration to adjust the speciated C.I. to zero was used only as a reference in this report because it relies on measurements of several parameters. Comparison of pH values from the four sources aided in the selection of the most accurate estimates of pH values.
A flow-chart showing the pH selection process is shown in figure 3. Field pH was considered to be the most accurate because pH measurements made in the laboratory may be biased from temperature changes and hydrolysis reactions and pH obtained from acidity is affected by uncertainties in measured iron, aluminum, and sulfate concentrations. Field pH was selected for all samples with a pH greater than 5. For samples with pH less than 5, field pH was selected unless the sample had a C.I. greater than 5 percent. For samples with a C.I. (using field pH) greater than 5 percent, laboratory pH was selected if the C.I. (using laboratory pH) was less than 5 percent. For samples with pH greater than 3 and field and laboratory pH that both produced C.I. greater than 5 percent, the pH that produced the lowest C.I. was selected. For samples with pH less than 3 and having field pH and laboratory pH that both yielded C.I.s greater than 5 percent, pH from the free H+ calculated from the acidity titration was selected if the C.I. (using acidity pH) was less than 5 percent. For samples with a pH less than 3 and having field, laboratory, and acidity pHs that produced C.I.s greater than 5 percent, the pH that yielded the lowest C.I. or an average of two or more of the pH values was selected.
Laboratory pH was selected for samples 01WA102, 01WA112, 01WA113, 01WA118, 01WA120, 01WA123, 01WA125, 01WA129, 01WA132, 01WA133, and 02WA125. Acidity pH was selected for sample 01WA130. The average of field pH and acidity pH was used for sample 02WA148. Field pH was selected for the remaining 104 samples. Values of pH listed in table 3 as “selected” are the values found in the tables of chemical data (tables 5-10) along with the C.I. using the selected pH.
15

Yes Select field pH
field pH>5
C.I.<5% using field pH
Select field pH
Yes
No
C.I.<5% using laboratory pH
No
pH>3
Yes Select laboratory pH
Select pH (field or laboratory) that gives lowest C.I.
C.I.<5% using acidity pH
Select acidity pH
Yes
Yes
No
Select pH (field, laboratory, or acidity)
that gives lowest C.I. or average selected pH values
No
No
Figure 3. Flow-chart showing the sample pH selection process.
[C.I., charge imbalance]
16

Table 3. Sample pH measured in the field and laboratory and calculated from acidity titration and speciated charge imbalance, for samples with a pH less than 5
[Selected, selected pH value after evaluation of four methods to determine pH; ---, not measured]
---------------------------------pH, in standard units--------------------------------
Sample Measured in
the field Measured in the
laboratory Calculated from acidity titration
Calculated from charge imbalance Selected
01WA102 3.72 3.65 3.54 3.18 3.65
01WA103 2.93 2.87 2.86 2.89 2.93
01WA104 2.99 2.88 2.86 2.94 2.99
01WA105 4.32 3.89 3.26 7.75 4.32
01WA106 3.73 3.54 3.42 5.73 3.73
01WA107 3.46 3.37 3.28 3.06 3.46
01WA108 2.76 2.69 2.72 2.73 2.76
01WA109 2.39 2.34 2.35 2.38 2.39
01WA112 3.47 3.37 2.92 2.48 3.37
01WA113 3.72 3.49 3.10 2.53 3.49
01WA118 3.71 3.35 3.35 3.16 3.35
01WA120 2.89 2.81 2.83 2.77 2.81
01WA121 2.83 2.83 2.89 2.78 2.83
01WA122 2.88 2.84 2.91 2.81 2.88
01WA123 2.93 2.81 2.85 2.80 2.81
01WA125 4.01 3.90 3.71 3.36 3.90
01WA126 4.24 4.03 3.57 3.36 4.24
01WA127 3.35 3.16 3.63 2.97 3.35
01WA129 3.30 3.14 3.16 2.88 3.14
01WA130 3.00 2.99 2.97 2.74 2.97
01WA131 2.87 2.81 2.85 2.82 2.87
01WA132 3.13 2.98 3.04 2.80 2.98
01WA133 3.15 3.07 3.13 2.84 3.07
01WA134 2.66 2.61 2.69 2.60 2.66
01WA136 2.81 2.74 2.88 2.80 2.81
01WA139 4.89 5.34 4.19 3.33 4.89
01WA140 3.67 3.60 3.48 3.66 3.67
01WA141 4.36 4.15 4.60 3.51 4.36
01WA147 2.06 2.08 2.04 2.03 2.06
01WA148 2.72 2.84 2.68 2.78 2.72
01WA149 1.72 1.75 1.73 1.72 1.72
01WA150 2.10 2.07 2.09 2.07 2.10
01WA171 2.58 2.64 2.63 2.54 2.58
02WA125 4.76 3.34 --- 3.54 3.34
02WA126 3.32 3.29 3.06 3.51 3.32
17
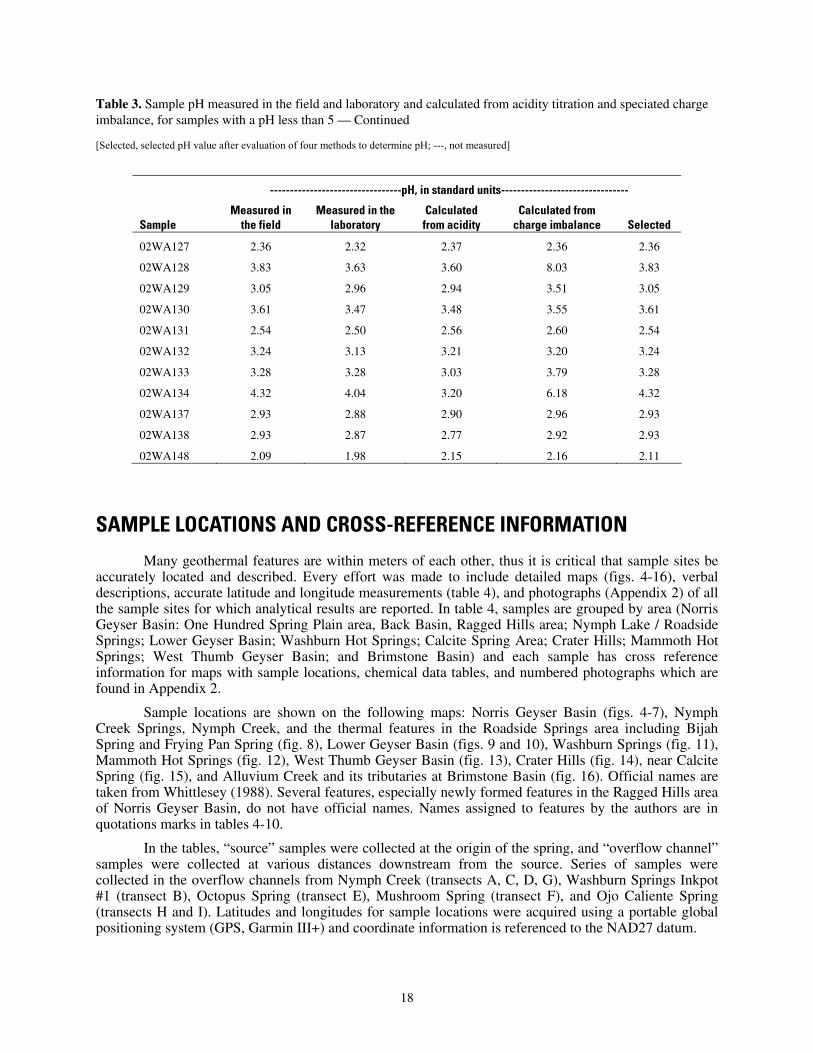
Table 3. Sample pH measured in the field and laboratory and calculated from acidity titration and speciated charge imbalance, for samples with a pH less than 5 — Continued
[Selected, selected pH value after evaluation of four methods to determine pH; ---, not measured]
---------------------------------pH, in standard units--------------------------------
Sample Measured in
the field Measured in the
laboratory Calculated from acidity
Calculated from charge imbalance Selected
02WA127 2.36 2.32 2.37 2.36 2.36
02WA128 3.83 3.63 3.60 8.03 3.83
02WA129 3.05 2.96 2.94 3.51 3.05
02WA130 3.61 3.47 3.48 3.55 3.61
02WA131 2.54 2.50 2.56 2.60 2.54
02WA132 3.24 3.13 3.21 3.20 3.24
02WA133 3.28 3.28 3.03 3.79 3.28
02WA134 4.32 4.04 3.20 6.18 4.32
02WA137 2.93 2.88 2.90 2.96 2.93
02WA138 2.93 2.87 2.77 2.92 2.93
02WA148 2.09 1.98 2.15 2.16 2.11
SAMPLE LOCATIONS AND CROSS-REFERENCE INFORMATION
Many geothermal features are within meters of each other, thus it is critical that sample sites be accurately located and described. Every effort was made to include detailed maps (figs. 4-16), verbal descriptions, accurate latitude and longitude measurements (table 4), and photographs (Appendix 2) of all the sample sites for which analytical results are reported. In table 4, samples are grouped by area (Norris Geyser Basin: One Hundred Spring Plain area, Back Basin, Ragged Hills area; Nymph Lake / Roadside Springs; Lower Geyser Basin; Washburn Hot Springs; Calcite Spring Area; Crater Hills; Mammoth Hot Springs; West Thumb Geyser Basin; and Brimstone Basin) and each sample has cross reference information for maps with sample locations, chemical data tables, and numbered photographs which are found in Appendix 2.
Sample locations are shown on the following maps: Norris Geyser Basin (figs. 4-7), Nymph Creek Springs, Nymph Creek, and the thermal features in the Roadside Springs area including Bijah Spring and Frying Pan Spring (fig. 8), Lower Geyser Basin (figs. 9 and 10), Washburn Springs (fig. 11), Mammoth Hot Springs (fig. 12), West Thumb Geyser Basin (fig. 13), Crater Hills (fig. 14), near Calcite Spring (fig. 15), and Alluvium Creek and its tributaries at Brimstone Basin (fig. 16). Official names are taken from Whittlesey (1988). Several features, especially newly formed features in the Ragged Hills area of Norris Geyser Basin, do not have official names. Names assigned to features by the authors are in quotations marks in tables 4-10.
In the tables, “source” samples were collected at the origin of the spring, and “overflow channel” samples were collected at various distances downstream from the source. Series of samples were collected in the overflow channels from Nymph Creek (transects A, C, D, G), Washburn Springs Inkpot #1 (transect B), Octopus Spring (transect E), Mushroom Spring (transect F), and Ojo Caliente Spring (transects H and I). Latitudes and longitudes for sample locations were acquired using a portable global positioning system (GPS, Garmin III+) and coordinate information is referenced to the NAD27 datum.
18
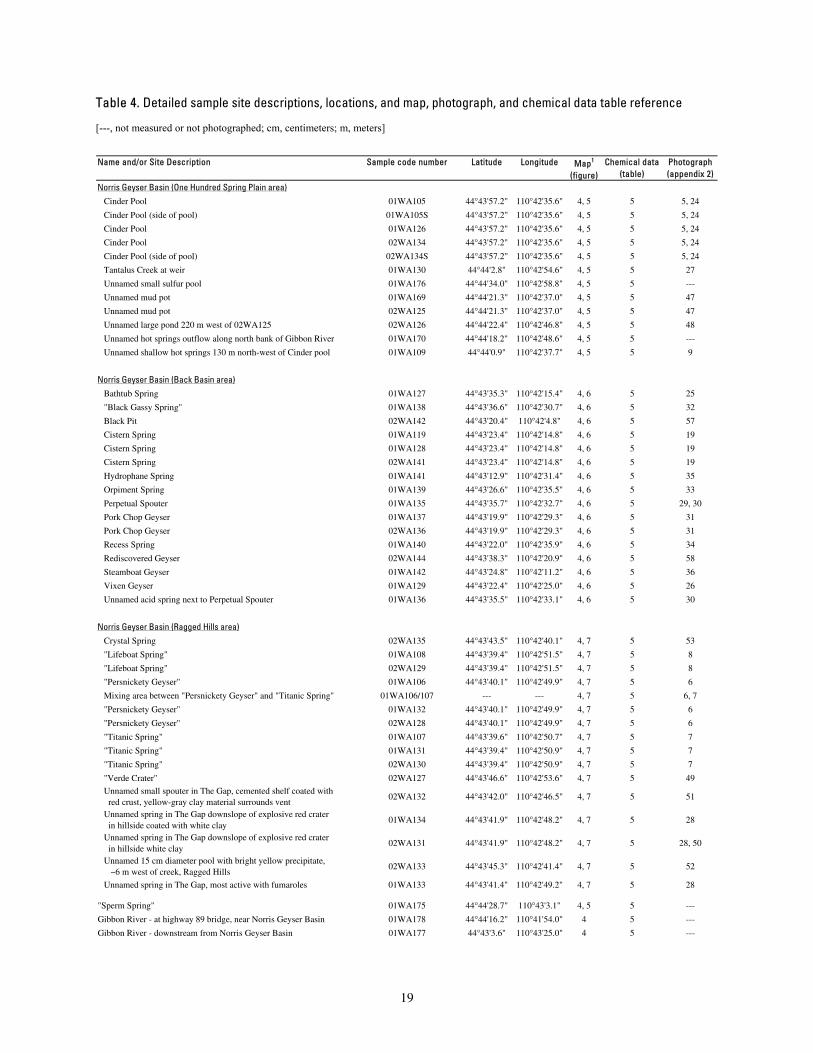
Table 4. Detailed sample site descriptions, locations, and map, photograph, and chemical data table reference
[---, not measured or not photographed; cm, centimeters; m, meters]
Name and/or Site Description Sample code number Latitude Longitude Map1
(figure)Chemical data
(table)Photograph(appendix 2)
Norris Geyser Basin (One Hundred Spring Plain area)Cinder Pool 01WA105 44°43'57.2" 110°42'35.6" 4, 5 5 5, 24
Cinder Pool (side of pool) 01WA105S 44°43'57.2" 110°42'35.6" 4, 5 5 5, 24
Cinder Pool 01WA126 44°43'57.2" 110°42'35.6" 4, 5 5 5, 24
Cinder Pool 02WA134 44°43'57.2" 110°42'35.6" 4, 5 5 5, 24
Cinder Pool (side of pool) 02WA134S 44°43'57.2" 110°42'35.6" 4, 5 5 5, 24
Tantalus Creek at weir 01WA130 44°44'2.8" 110°42'54.6" 4, 5 5 27
Unnamed small sulfur pool 01WA176 44°44'34.0" 110°42'58.8" 4, 5 5 ---
Unnamed mud pot 01WA169 44°44'21.3" 110°42'37.0" 4, 5 5 47
Unnamed mud pot 02WA125 44°44'21.3" 110°42'37.0" 4, 5 5 47
Unnamed large pond 220 m west of 02WA125 02WA126 44°44'22.4" 110°42'46.8" 4, 5 5 48
Unnamed hot springs outflow along north bank of Gibbon River 01WA170 44°44'18.2" 110°42'48.6" 4, 5 5 ---
Unnamed shallow hot springs 130 m north-west of Cinder pool 01WA109 44°44'0.9" 110°42'37.7" 4, 5 5 9
Norris Geyser Basin (Back Basin area)Bathtub Spring 01WA127 44°43'35.3" 110°42'15.4" 4, 6 5 25
"Black Gassy Spring" 01WA138 44°43'36.6" 110°42'30.7" 4, 6 5 32
Black Pit 02WA142 44°43'20.4" 110°42'4.8" 4, 6 5 57
Cistern Spring 01WA119 44°43'23.4" 110°42'14.8" 4, 6 5 19
Cistern Spring 01WA128 44°43'23.4" 110°42'14.8" 4, 6 5 19
Cistern Spring 02WA141 44°43'23.4" 110°42'14.8" 4, 6 5 19
Hydrophane Spring 01WA141 44°43'12.9" 110°42'31.4" 4, 6 5 35
Orpiment Spring 01WA139 44°43'26.6" 110°42'35.5" 4, 6 5 33
Perpetual Spouter 01WA135 44°43'35.7" 110°42'32.7" 4, 6 5 29, 30
Pork Chop Geyser 01WA137 44°43'19.9" 110°42'29.3" 4, 6 5 31
Pork Chop Geyser 02WA136 44°43'19.9" 110°42'29.3" 4, 6 5 31
Recess Spring 01WA140 44°43'22.0" 110°42'35.9" 4, 6 5 34
Rediscovered Geyser 02WA144 44°43'38.3" 110°42'20.9" 4, 6 5 58
Steamboat Geyser 01WA142 44°43'24.8" 110°42'11.2" 4, 6 5 36
Vixen Geyser 01WA129 44°43'22.4" 110°42'25.0" 4, 6 5 26
Unnamed acid spring next to Perpetual Spouter 01WA136 44°43'35.5" 110°42'33.1" 4, 6 5 30
Norris Geyser Basin (Ragged Hills area)Crystal Spring 02WA135 44°43'43.5" 110°42'40.1" 4, 7 5 53
"Lifeboat Spring" 01WA108 44°43'39.4" 110°42'51.5" 4, 7 5 8
"Lifeboat Spring" 02WA129 44°43'39.4" 110°42'51.5" 4, 7 5 8
"Persnickety Geyser" 01WA106 44°43'40.1" 110°42'49.9" 4, 7 5 6
Mixing area between "Persnickety Geyser" and "Titanic Spring" 01WA106/107 --- --- 4, 7 5 6, 7
"Persnickety Geyser" 01WA132 44°43'40.1" 110°42'49.9" 4, 7 5 6
"Persnickety Geyser" 02WA128 44°43'40.1" 110°42'49.9" 4, 7 5 6
"Titanic Spring" 01WA107 44°43'39.6" 110°42'50.7" 4, 7 5 7
"Titanic Spring" 01WA131 44°43'39.4" 110°42'50.9" 4, 7 5 7
"Titanic Spring" 02WA130 44°43'39.4" 110°42'50.9" 4, 7 5 7
"Verde Crater" 02WA127 44°43'46.6" 110°42'53.6" 4, 7 5 49
Unnamed small spouter in The Gap, cemented shelf coated with red crust, yellow-gray clay material surrounds vent
02WA132 44°43'42.0" 110°42'46.5" 4, 7 5 51
Unnamed spring in The Gap downslope of explosive red crater in hillside coated with white clay
01WA134 44°43'41.9" 110°42'48.2" 4, 7 5 28
Unnamed spring in The Gap downslope of explosive red crater in hillside white clay
02WA131 44°43'41.9" 110°42'48.2" 4, 7 5 28, 50
Unnamed 15 cm diameter pool with bright yellow precipitate, ~6 m west of creek, Ragged Hills
02WA133 44°43'45.3" 110°42'41.4" 4, 7 5 52
Unnamed spring in The Gap, most active with fumaroles 01WA133 44°43'41.4" 110°42'49.2" 4, 7 5 28
"Sperm Spring" 01WA175 44°44'28.7" 110°43'3.1" 4, 5 5 ---
Gibbon River - at highway 89 bridge, near Norris Geyser Basin 01WA178 44°44'16.2" 110°41'54.0" 4 5 ---
Gibbon River - downstream from Norris Geyser Basin 01WA177 44°43'3.6" 110°43'25.0" 4 5 ---
19
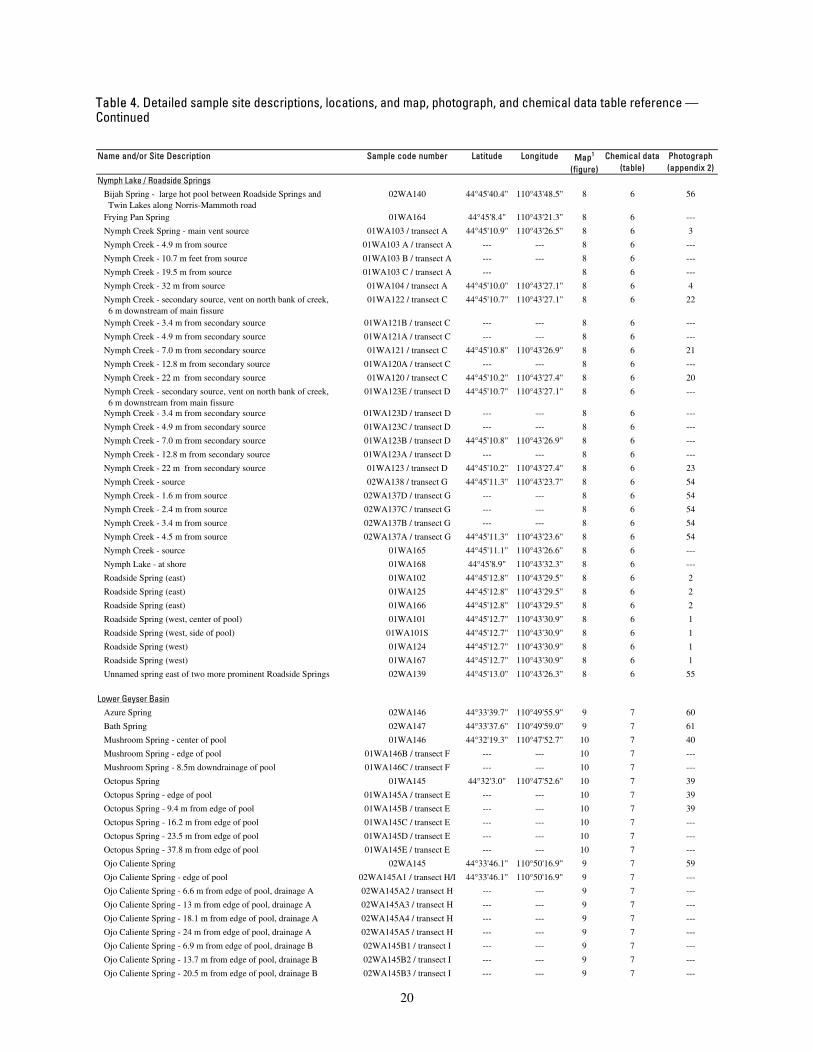
Table 4. Detailed sample site descriptions, locations, and map, photograph, and chemical data table reference — Continued
Name and/or Site Description Sample code number Latitude Longitude Map1
(figure)Chemical data
(table)Photograph(appendix 2)
Nymph Lake / Roadside SpringsBijah Spring - large hot pool between Roadside Springs and Twin Lakes along Norris-Mammoth road
02WA140 44°45'40.4" 110°43'48.5" 8 6 56
Frying Pan Spring 01WA164 44°45'8.4" 110°43'21.3" 8 6 ---
Nymph Creek Spring - main vent source 01WA103 / transect A 44°45'10.9" 110°43'26.5" 8 6 3
Nymph Creek - 4.9 m from source 01WA103 A / transect A --- --- 8 6 ---
Nymph Creek - 10.7 m feet from source 01WA103 B / transect A --- --- 8 6 ---
Nymph Creek - 19.5 m from source 01WA103 C / transect A --- 8 6 ---
Nymph Creek - 32 m from source 01WA104 / transect A 44°45'10.0" 110°43'27.1" 8 6 4
Nymph Creek - secondary source, vent on north bank of creek, 6 m downstream of main fissure
01WA122 / transect C 44°45'10.7" 110°43'27.1" 8 6 22
Nymph Creek - 3.4 m from secondary source 01WA121B / transect C --- --- 8 6 ---
Nymph Creek - 4.9 m from secondary source 01WA121A / transect C --- --- 8 6 ---
Nymph Creek - 7.0 m from secondary source 01WA121 / transect C 44°45'10.8" 110°43'26.9" 8 6 21
Nymph Creek - 12.8 m from secondary source 01WA120A / transect C --- --- 8 6 ---
Nymph Creek - 22 m from secondary source 01WA120 / transect C 44°45'10.2" 110°43'27.4" 8 6 20
Nymph Creek - secondary source, vent on north bank of creek, 6 m downstream from main fissure
01WA123E / transect D 44°45'10.7" 110°43'27.1" 8 6 ---
Nymph Creek - 3.4 m from secondary source 01WA123D / transect D --- --- 8 6 ---
Nymph Creek - 4.9 m from secondary source 01WA123C / transect D --- --- 8 6 ---
Nymph Creek - 7.0 m from secondary source 01WA123B / transect D 44°45'10.8" 110°43'26.9" 8 6 ---
Nymph Creek - 12.8 m from secondary source 01WA123A / transect D --- --- 8 6 ---
Nymph Creek - 22 m from secondary source 01WA123 / transect D 44°45'10.2" 110°43'27.4" 8 6 23
Nymph Creek - source 02WA138 / transect G 44°45'11.3" 110°43'23.7" 8 6 54
Nymph Creek - 1.6 m from source 02WA137D / transect G --- --- 8 6 54
Nymph Creek - 2.4 m from source 02WA137C / transect G --- --- 8 6 54
Nymph Creek - 3.4 m from source 02WA137B / transect G --- --- 8 6 54
Nymph Creek - 4.5 m from source 02WA137A / transect G 44°45'11.3" 110°43'23.6" 8 6 54
Nymph Creek - source 01WA165 44°45'11.1" 110°43'26.6" 8 6 ---
Nymph Lake - at shore 01WA168 44°45'8.9" 110°43'32.3" 8 6 ---
Roadside Spring (east) 01WA102 44°45'12.8" 110°43'29.5" 8 6 2
Roadside Spring (east) 01WA125 44°45'12.8" 110°43'29.5" 8 6 2
Roadside Spring (east) 01WA166 44°45'12.8" 110°43'29.5" 8 6 2
Roadside Spring (west, center of pool) 01WA101 44°45'12.7" 110°43'30.9" 8 6 1
Roadside Spring (west, side of pool) 01WA101S 44°45'12.7" 110°43'30.9" 8 6 1
Roadside Spring (west) 01WA124 44°45'12.7" 110°43'30.9" 8 6 1
Roadside Spring (west) 01WA167 44°45'12.7" 110°43'30.9" 8 6 1
Unnamed spring east of two more prominent Roadside Springs 02WA139 44°45'13.0" 110°43'26.3" 8 6 55
Lower Geyser BasinAzure Spring 02WA146 44°33'39.7" 110°49'55.9" 9 7 60
Bath Spring 02WA147 44°33'37.6" 110°49'59.0" 9 7 61
Mushroom Spring - center of pool 01WA146 44°32'19.3" 110°47'52.7" 10 7 40
Mushroom Spring - edge of pool 01WA146B / transect F --- --- 10 7 ---
Mushroom Spring - 8.5m downdrainage of pool 01WA146C / transect F --- --- 10 7 ---
Octopus Spring 01WA145 44°32'3.0" 110°47'52.6" 10 7 39
Octopus Spring - edge of pool 01WA145A / transect E --- --- 10 7 39
Octopus Spring - 9.4 m from edge of pool 01WA145B / transect E --- --- 10 7 39
Octopus Spring - 16.2 m from edge of pool 01WA145C / transect E --- --- 10 7 ---
Octopus Spring - 23.5 m from edge of pool 01WA145D / transect E --- --- 10 7 ---
Octopus Spring - 37.8 m from edge of pool 01WA145E / transect E --- --- 10 7 ---
Ojo Caliente Spring 02WA145 44°33'46.1" 110°50'16.9" 9 7 59
Ojo Caliente Spring - edge of pool 02WA145A1 / transect H/I 44°33'46.1" 110°50'16.9" 9 7 ---
Ojo Caliente Spring - 6.6 m from edge of pool, drainage A 02WA145A2 / transect H --- --- 9 7 ---
Ojo Caliente Spring - 13 m from edge of pool, drainage A 02WA145A3 / transect H --- --- 9 7 ---
Ojo Caliente Spring - 18.1 m from edge of pool, drainage A 02WA145A4 / transect H --- --- 9 7 ---
Ojo Caliente Spring - 24 m from edge of pool, drainage A 02WA145A5 / transect H --- --- 9 7 ---
Ojo Caliente Spring - 6.9 m from edge of pool, drainage B 02WA145B1 / transect I --- --- 9 7 ---
Ojo Caliente Spring - 13.7 m from edge of pool, drainage B 02WA145B2 / transect I --- --- 9 7 ---
Ojo Caliente Spring - 20.5 m from edge of pool, drainage B 02WA145B3 / transect I --- --- 9 7 ---
20

Table 4. Detailed sample site descriptions, locations, and map, photograph, and chemical data table reference – Continued
Name and/or Site Description Sample code number Latitude Longitude Map1
(figure)Chemical data
(table)Photograph(appendix 2)
Washburn Hot SpringsWashburn Hot Springs - Inkpot #1, lower most large pool, first one encountered on trail from Canyou Village area
01WA110 / transect B 44°45'52.8" 110°25'48.9" 11 8 10, 11, 18
Washburn Hot Springs - Inkpot #1 Drainage (high), 5m from Inkpot #1
01WA117 / transect B 44°45'52.5" 110°25'48.8" 11 8 17, 18
Washburn Hot Springs - Inkpot #1 Drainage (middle), 20m from Inkpot #1
01WA116 / transect B 44°45'52.2" 110°25'48.8" 11 8 16
Washburn Hot Springs - Inkpot #1 Drainage (low), 2m upstream from Sulfur Creek
01WA115 / transect B 44°45'49.2" 110°25'51.5" 11 8 15
Sulphur Creek below confluence with drainage from Washburn Springs Inkpot #1
01WA114 44°45'48.6" 110°25'51.3" 11 8 14
Washburn Hot Springs - Inkpot #2, blacker than #1 almost a mud pot
01WA111 44°45'52.9" 110°25'48.7" 11 8 11, 18
Washburn Hot Springs - Inkpot #3, immediately downslope of several fumaroles and vigorously surging small pools and vents
01WA118 44°45'53.2" 110°25'48.1" 11 8 11, 18
Calcite Spring AreaUnnamed spring, downstream from Calcite Spring, Grand Canyon of the Yellowstone near Tower Junction
02WA148 44°54'23.3" 110°23'38.4" 15 9 62, 63
Crater HillsUnnamed light green flowing pool south of Sulphur Spring 01WA112 44°39'16.7" 110°28'54.8" 14 9 12
Sulphur Spring 01WA113 44°39'16.7" 110°28'54.8" 14 9 13
Mammoth Hot SpringsCanary Spring 01WA143 44°58'1.1" 110°42'20.3" 12 9 37
Canary Springs - near base of travertine terrace above wetland area
01WA144 44°58'1.9" 110°42'14.1" 12 9 38
West Thumb Geyser BasinLakeshore Geyser 01WA173 44°25'0.5" 110°34'11.7" 13 9 45
Unnamed pool 01WA174 44°25'0.0" 110°34'18.4" 13 9 46
Seismograph Pool 01WA172 44°24'57.0" 110°34'15.6" 13 9 44
Brimstone BasinAlluvium Creek - below main confluence of north branch above lower sulfur mounds confluence
01WA147 44°23'10.7" 110°13'0.6" 16 10 41
Alluvium Creek - right branch above main confluence of north branch above lower sulfur mounds confluence
01WA148 44°23'10.3" 110°13'0.3" 16 10 41
Alluvium Creek, acid high-conductance left branch above main confluence of north branch above lower sulfur mounds confluence
01WA149 44°23'10.3" 110°13'0.3" 16 10 41
Alluvium Creek - about 500m below big bend just above where surface flow disappears
01WA150 44°23'25.2" 110°13'51.1" 16 10 42
Alluvium Creek - downstream from Thorofare Trail just below where surface flow reappears
01WA171 44°23'9.9" 110°14'8.4" 16 10 43
1Not all samples codes are shown on maps Explanation of coordinate data: North American Datum 27-Continental United States (NAD27-CONUS), compatible with USGS topographic maps.
21
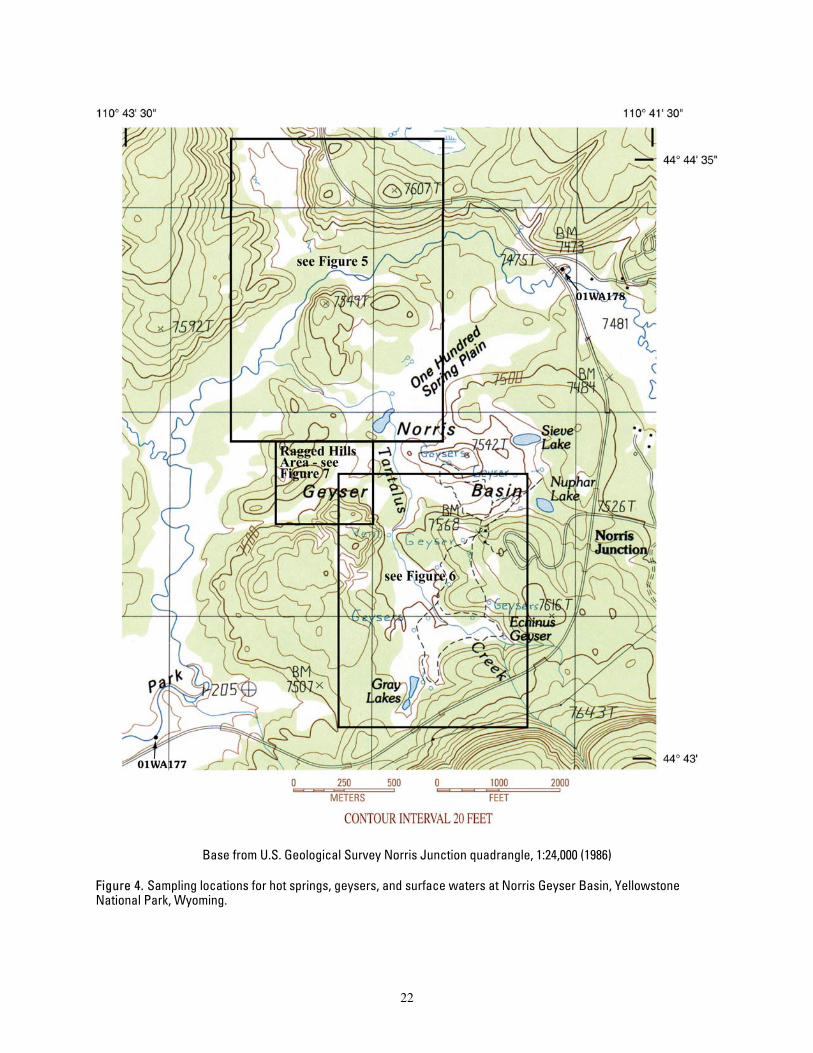
Base from U.S. Geological Survey Norris Junction quadrangle, 1:24,000 (1986)
Figure 4. Sampling locations for hot springs, geysers, and surface waters at Norris Geyser Basin, Yellowstone National Park, Wyoming.
22
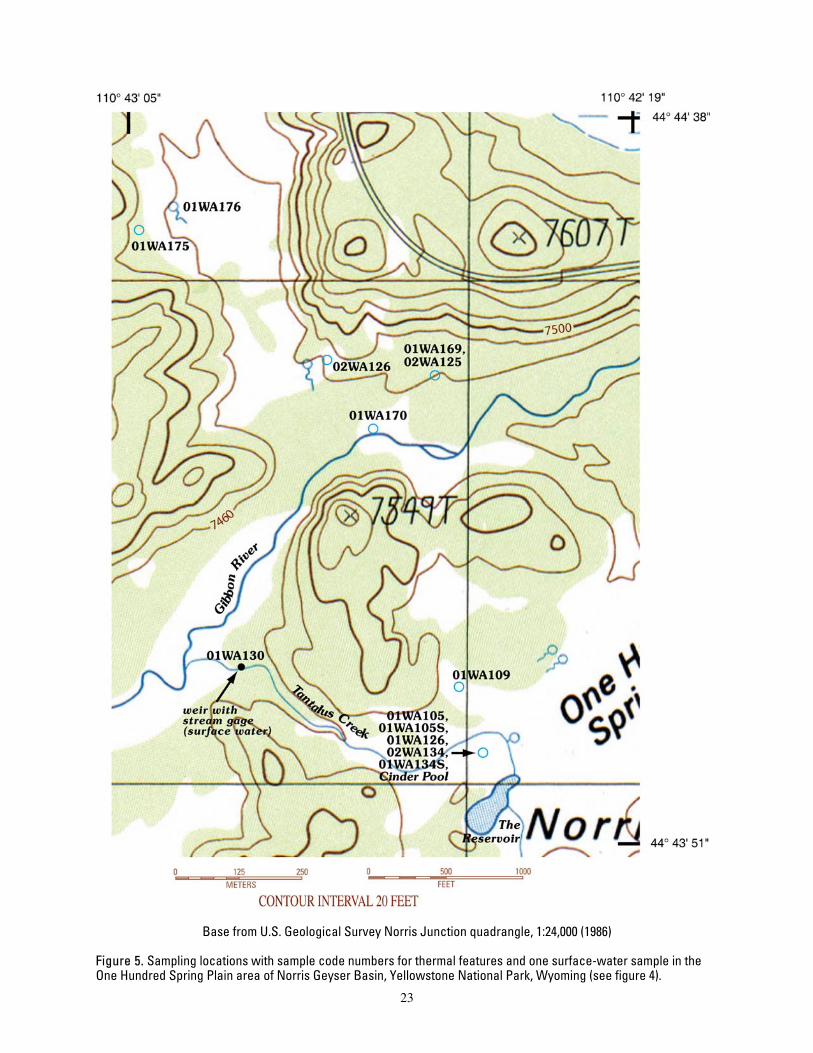
Base from U.S. Geological Survey Norris Junction quadrangle, 1:24,000 (1986)
Figure 5. Sampling locations with sample code numbers for thermal features and one surface-water sample in the One Hundred Spring Plain area of Norris Geyser Basin, Yellowstone National Park, Wyoming (see figure 4).
23

Base from U.S. Geological Survey Norris Junction quadrangle, 1:24,000 (1986)
Figure 6. Sampling locations with sample code numbers for hot springs and geysers in the Back Basin area of Norris Geyser Basin, Yellowstone National Park, Wyoming (see figure 4).
24
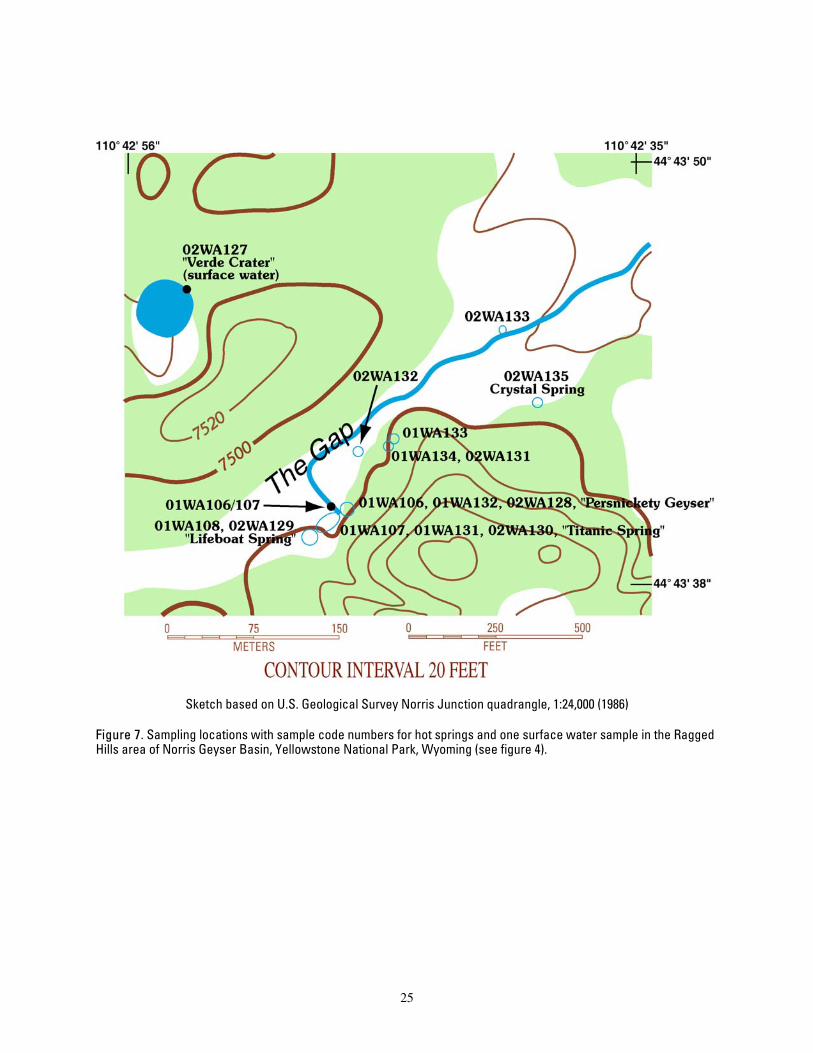
25
Sketch based on U.S. Geological Survey Norris Junction quadrangle, 1:24,000 (1986)
Figure 7. Sampling locations with sample code numbers for hot springs and one surface water sample in the Ragged Hills area of Norris Geyser Basin, Yellowstone National Park, Wyoming (see figure 4).
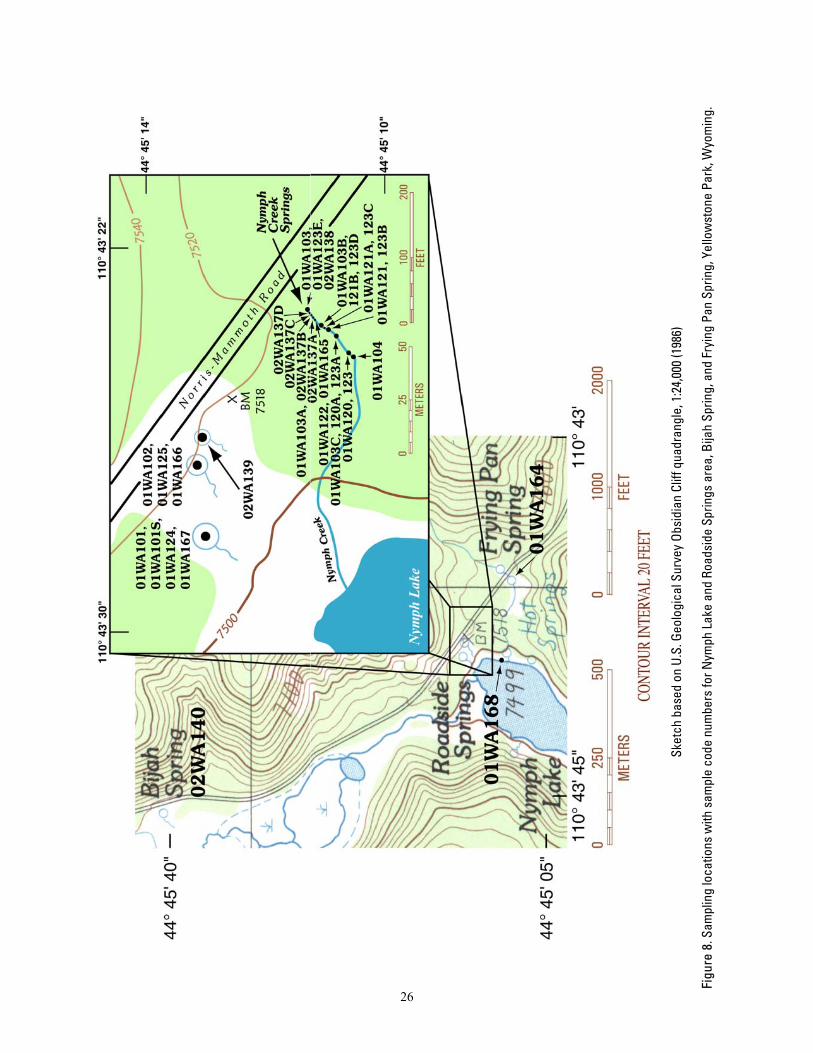
Sk
etch
bas
ed o
n U.
S. G
eolo
gica
l Sur
vey
Obsi
dian
Clif
f qua
dran
gle,
1:2
4,00
0 (1
986)
Fi
gure
8. S
ampl
ing
loca
tions
with
sam
ple
code
num
bers
for N
ymph
Lak
e an
d Ro
adsi
de S
prin
gs a
rea,
Bija
h Sp
ring,
and
Fry
ing
Pan
Sprin
g, Y
ello
wst
one
Park
, Wyo
min
g.
26

Ba
se fr
om U
.S. G
eolo
gica
l Sur
vey
Low
er G
eyse
r Bas
in Q
uadr
angl
e, 1
:24,
000
(198
6)
Fi
gure
9. S
ampl
ing
loca
tions
with
sam
ple
code
num
bers
for O
jo C
alie
nte
Sprin
g, A
zure
Spr
ing,
and
Bat
h Sp
ring,
Low
er G
eyse
r Bas
in, Y
ello
wst
one
Park
, Wyo
min
g.
27
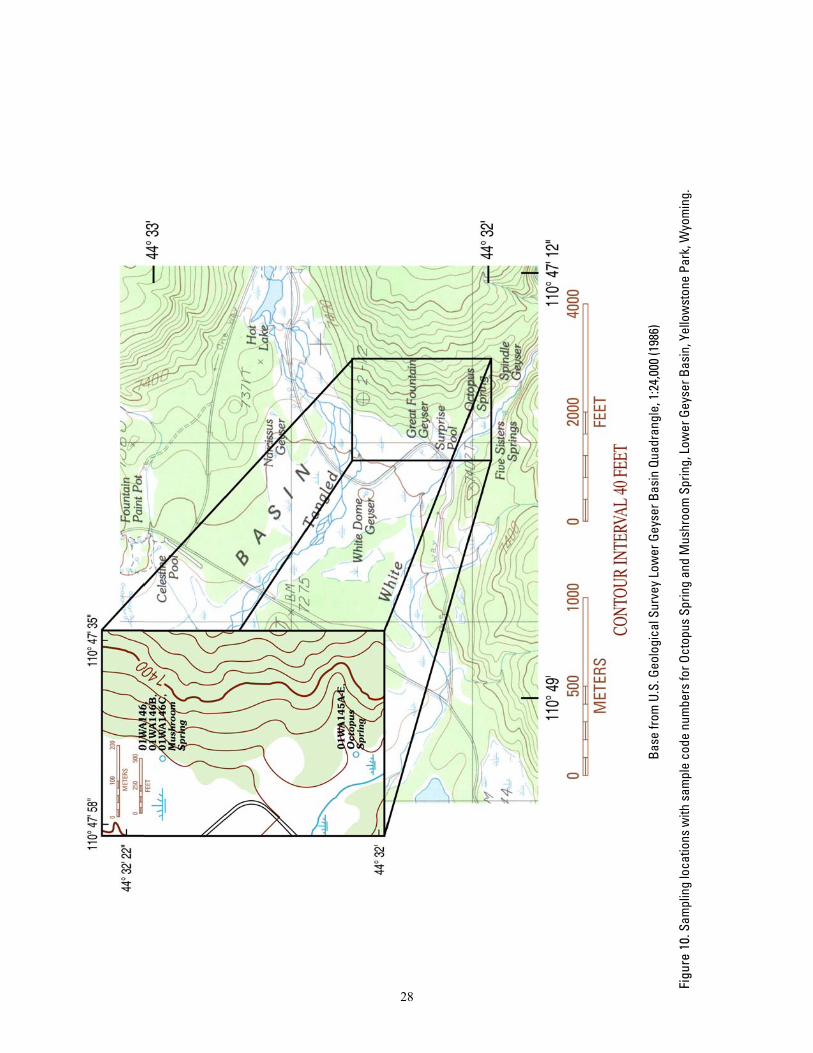
Ba
se fr
om U
.S. G
eolo
gica
l Sur
vey
Low
er G
eyse
r Bas
in Q
uadr
angl
e, 1
:24,
000
(198
6)
Figu
re 1
0. S
ampl
ing
loca
tions
with
sam
ple
code
num
bers
for O
ctop
us S
prin
g an
d M
ushr
oom
Spr
ing,
Low
er G
eyse
r Bas
in, Y
ello
wst
one
Park
, Wyo
min
g.
28
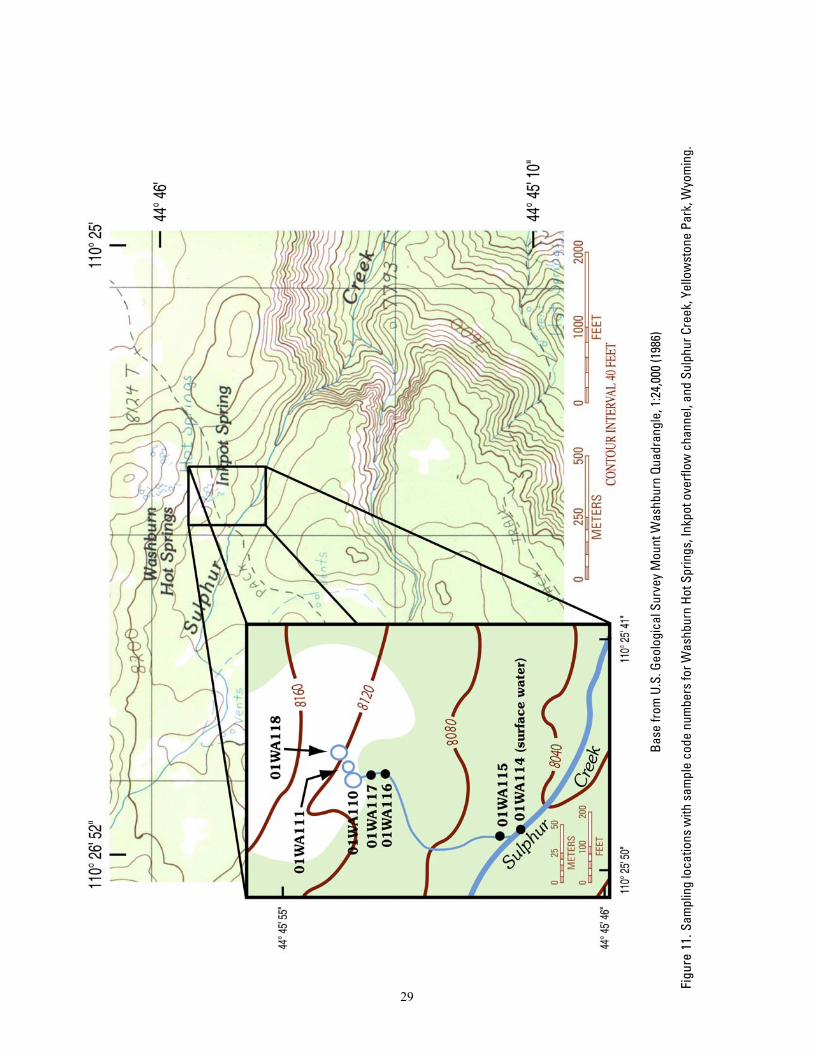
Ba
se fr
om U
.S. G
eolo
gica
l Sur
vey
Mou
nt W
ashb
urn
Quad
rang
le, 1
:24,
000
(198
6)
Figu
re 1
1. S
ampl
ing
loca
tions
with
sam
ple
code
num
bers
for W
ashb
urn
Hot S
prin
gs, I
nkpo
t ove
rflow
cha
nnel
, and
Sul
phur
Cre
ek, Y
ello
wst
one
Park
, Wyo
min
g.
29
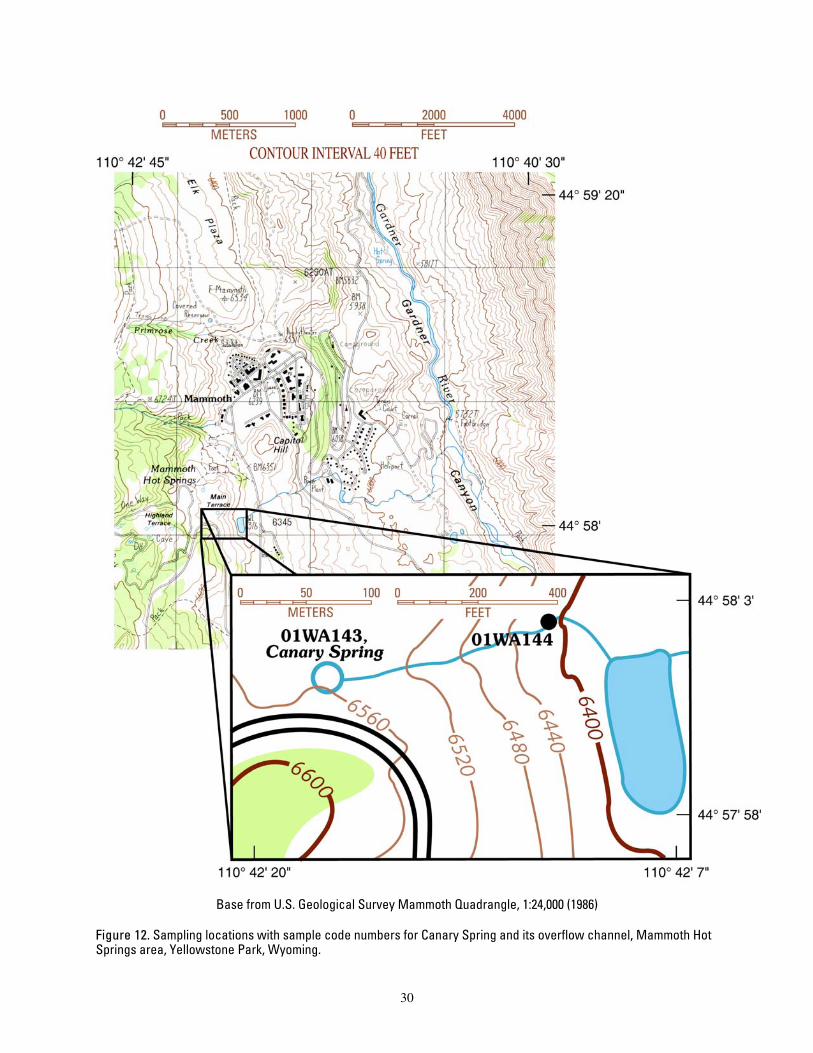
Base from U.S. Geological Survey Mammoth Quadrangle, 1:24,000 (1986)
Figure 12. Sampling locations with sample code numbers for Canary Spring and its overflow channel, Mammoth Hot Springs area, Yellowstone Park, Wyoming.
30

Base from U.S. Geological Survey West Thumb Quadrangle, 1:24,000 (1986)
Figure 13. Sampling locations with sample code numbers for thermal features at West Thumb Geyser Basin, Yellowstone Park, Wyoming.
31

Base from U.S. Geological Survey Canyon Village Quadrangle, 1:24,000 (1986)
Figure 14. Sampling locations with sample code numbers for thermal features in the Sulphur Springs area at Crater Hills, Yellowstone Park, Wyoming.
32

Base from U.S. Geological Survey Tower Junction Quadrangle, 1:24,000 (1986)
Figure 15. Sampling location with sample code numbers for an unnamed spring downstream from Calcite Spring, Yellowstone Park, Wyoming.
33

Base from U.S. Geological Survey Sylvan Lake quadrangle, 1:24,000 (1989)
Figure 16. Sampling locations with sample code numbers for Alluvium Creek and one of its tributaries, Brimstone Basin, Yellowstone National Park, Wyoming.
34

WATER-CHEMISTRY DATA
Site data and water analyses for YNP springs sampled in 2001 and 2002 are presented in tables 5-10. For each sample, table 4 has a reference to the table containing the chemical data and detailed descriptions of where samples were collected and references to maps and photographs. Photographs of most of the sample sites are in appendix 2 and are ordered by increasing sample code number. Samples are sorted first by spring, then by date of sample collection, and then by sampling site along the downstream overflow channel (if present). Chemical profiles from the overflow channel transects are presented in figures 17-21.
Nymph Creek transects. Samples were collected along Nymph Creek on four occasions to investigate changes in the concentrations of As and Fe redox species. The chemical trends were similar in all four transect studies. For two of these transect sampling events (transects C and D), pH, Eh, temperature, and concentrations of H2S, Fe(T), Fe(II), As(T), and As(III) are plotted as a function of distance from the discharge source for samples collected during the day and for samples collected from the same sample sites at night (fig. 17). There was little change in pH and As(T) and Fe(T) concentrations with distance. Specific conductance (not shown on fig. 17) and Eh increased with distance, whereas temperature and concentrations of H2S, As(III), and Fe(II) decreased rapidly with distance. Complete oxidation of H2S occurs within the first seven meters. Oxidation of As(III) and Fe(II) is rapid in the first seven meters and the rates are similar during the day and at night. However, the As(III) concentrations at downstream sites greater than five meters from the source were lower during the day than at night.
Washburn Springs transect. Figure 18 shows chemical profiles for the Inkpot #1 drainage at Washburn Springs (transect B). Sample pH, Eh, and NO2 concentrations increased with distance, while temperature, alkalinity, and concentrations of H2S decreased with distance. Concentrations of NH4 change very little with distance.
Mushroom Spring and Octopus Springs transects. Sample pH, temperature, and concentrations of As(T), As(III), and NO2 are plotted in relation to distance for samples collected along the Mushroom Spring drainage (transect F) and the Octopus Spring drainage (transect E) in figures 19 and 20, respectively. For both Octopus and Mushroom Springs, pH increased with distance, As(T) concentrations remained nearly constant with distance, and As(III) and NO2 concentrations decreased with distance.
Ojo Caliente transects. Figure 21 depicts profiles of pH, temperature and concentrations of As(T), As(III), NH4 and NO2 along the two drainages at Ojo Caliente (transects H and I). Along both drainages, pH increased, As(T) concentrations remained fairly constant, and temperature and NH4 concentrations decreased with distance. Arsenic remained in the reduced As(III) state along drainage A and oxidized along drainage B. Initially, NO2 concentrations decreased along both drainages. In drainage A, NO2 concentrations increased after about 12 meters from the source.
35

0 5 10 15 20 252.0
2.5
3.0
3.5
4.0
0 5 10 15 20 25
35
40
45
50
55
60
65
0 5 10 15 20 250.00
0.05
0.10
0.15
0.20
0 5 10 15 20 250.0
0.5
1.0
1.5
2.0
2.5
3.0
3.5
4.0
4.5
pH DAY NIGHT
pH, I
N S
TA
ND
AR
D U
NIT
S
DISTANCE FROM SOURCE, IN METERS
0.00
0.05
0.10
0.15
0.20
HY
DO
RG
EN
SU
LF
IDE
CO
NC
EN
TR
AT
ION
, IN
MIL
LL
IGR
AM
S P
ER
LIT
ER
H2S
DAY
TEMPERATURE DAY NIGHT
TE
MP
ER
AT
UR
E, I
N D
EG
RE
ES
CE
LS
IUS
DISTANCE FROM SOURCE, IN METERS
0.2
0.4
0.6
0.8
1.0
Eh,
IN
VO
LT
S
Eh DAY NIGHT
As(T) As(III) DAY DAY NIGHT NIGHT
AR
SE
NIC
CO
NC
EN
TR
AT
ION
, IN
MIL
LIG
RA
MS
PE
R L
ITE
R
DISTANCE FROM SOURCE, IN METERS
Fe(T) Fe(II) DAY DAY NIGHT NIGHT
IRO
N C
ON
CE
NT
RA
TIO
N, I
N M
ILL
IGR
AM
S P
ER
LIT
ER
DISTANCE FROM SOURCE, IN METERS
Figure 17. Sample pH, temperature, Eh, and concentrations of H2S, As(T), As(III), Fe(T), and Fe(II) as a function of drainage distance for Nymph Creek.
36
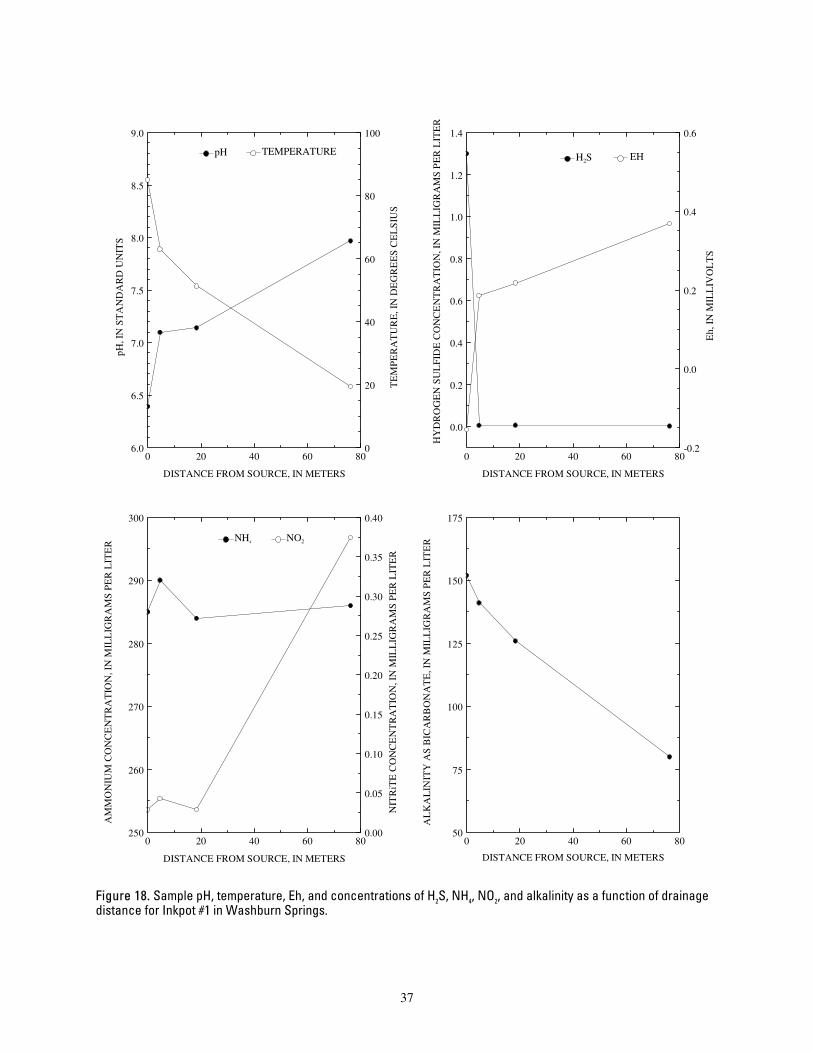
0 20 40 60 806.0
6.5
7.0
7.5
8.0
8.5
9.0
0 20 40 60 80
0.0
0.2
0.4
0.6
0.8
1.0
1.2
1.4
0 20 40 60 80250
260
270
280
290
300
0 20 40 60 8050
75
100
125
150
175
0.00
0.05
0.10
0.15
0.20
0.25
0.30
0.35
0.40
pH
pH, I
N S
TA
ND
AR
D U
NIT
S
DISTANCE FROM SOURCE, IN METERS
0
20
40
60
80
100
TE
MP
ER
AT
UR
E, I
N D
EG
RE
ES
CE
LS
IUS
TEMPERATURE
H2S
HY
DR
OG
EN
SU
LF
IDE
CO
NC
EN
TR
AT
ION
, IN
MIL
LIG
RA
MS
PE
R L
ITE
R
DISTANCE FROM SOURCE, IN METERS
-0.2
0.0
0.2
0.4
0.6
Eh,
IN
MIL
LIV
OL
TS
EH
NH4
AM
MO
NIU
M C
ON
CE
NT
RA
TIO
N, I
N M
ILL
IGR
AM
S P
ER
LIT
ER
DISTANCE FROM SOURCE, IN METERS
AL
KA
LIN
ITY
AS
BIC
AR
BO
NA
TE
, IN
MIL
LIG
RA
MS
PE
R L
ITE
R
DISTANCE FROM SOURCE, IN METERS
NO2
NIT
RiT
E C
ON
CE
NT
RA
TIO
N, I
N M
ILL
IGR
AM
S P
ER
LIT
ER
Figure 18. Sample pH, temperature, Eh, and concentrations of H2S, NH4, NO2, and alkalinity as a function of drainage distance for Inkpot #1 in Washburn Springs.
37

0 2 4 6 8 107.00
7.25
7.50
7.75
8.00
8.25
8.50
8.75
9.00
0 2 4 6 8 100.00
0.02
0.04
0.06
0.08
1.6
1.8
2.0
0 2 4 6 8 10
0.003
0.004
0.005
0.006
0.007
0.008
0.009
0.010
0.011 C.
B.
pH
pH, I
N S
TA
ND
AR
D U
NIT
S
DISTANCE FROM SOURCE, IN METERS
A.
50
60
70
80
90
100
TE
MP
ER
AT
UR
E, I
N D
EG
RE
ES
CE
LS
IUS
TEMPERATURE
As(T) As(III)
AR
SE
NIC
CO
NC
EN
TR
AT
ION
, IN
MIL
LIG
RA
MS
PE
R L
ITE
R
DISTANCE FROM SOURCE, IN METERS
NIT
RIT
E C
ON
CE
NT
RA
TIO
N, I
N M
ILL
IGR
AM
S P
ER
LIT
ER
DISTANCE FROM SOURCE, IN METERS
Figure 19. Sample pH, temperature, and concentrations of As(T), As(III), and NO2 as a function of drainage distance for Mushroom Spring.
38
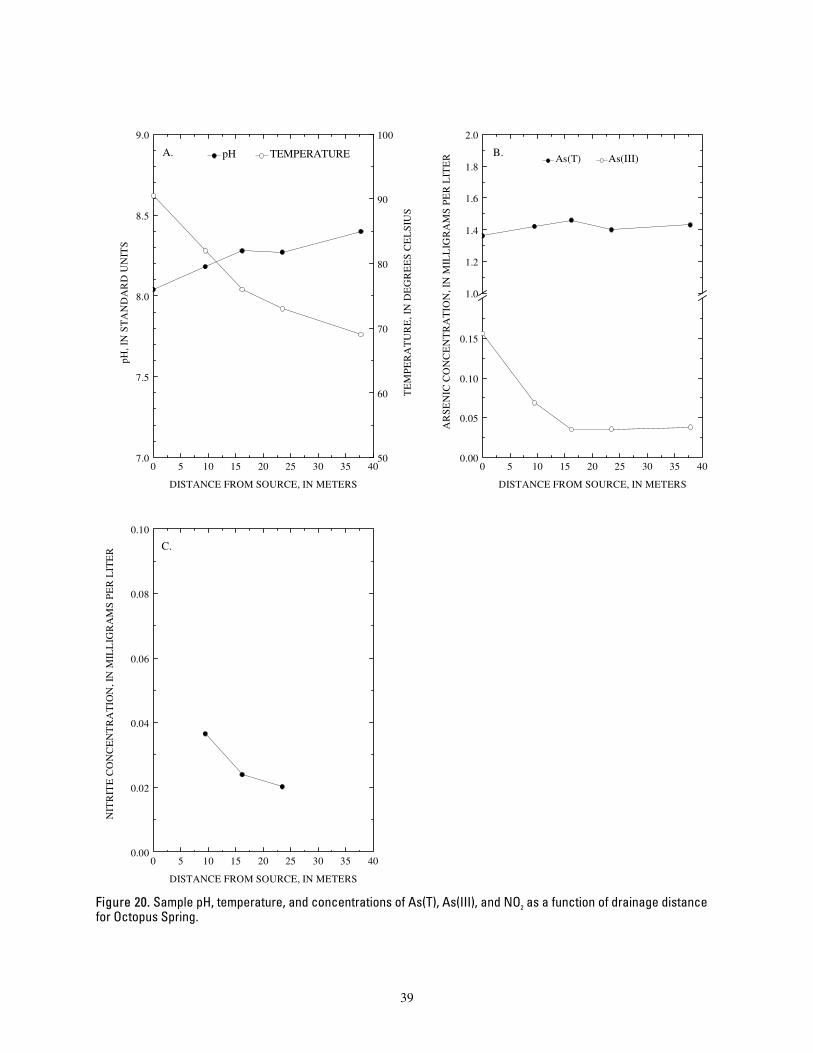
0 5 10 15 20 25 30 35 407.0
7.5
8.0
8.5
9.0
0 5 10 15 20 25 30 35 400.00
0.05
0.10
0.15
1.0
1.2
1.4
1.6
1.8
2.0
0 5 10 15 20 25 30 35 400.00
0.02
0.04
0.06
0.08
0.10
A.
pH
pH, I
N S
TA
ND
AR
D U
NIT
S
DISTANCE FROM SOURCE, IN METERS
50
60
70
80
90
100
TE
MP
ER
AT
UR
E, I
N D
EG
RE
ES
CE
LS
IUS
TEMPERATURE B.
As(T) As(III)
AR
SE
NIC
CO
NC
EN
TR
AT
ION
, IN
MIL
LIG
RA
MS
PE
R L
ITE
R
DISTANCE FROM SOURCE, IN METERS
C.
NIT
RIT
E C
ON
CE
NT
RA
TIO
N, I
N M
ILL
IGR
AM
S P
ER
LIT
ER
DISTANCE FROM SOURCE, IN METERS
Figure 20. Sample pH, temperature, and concentrations of As(T), As(III), and NO2 as a function of drainage distance for Octopus Spring.
39
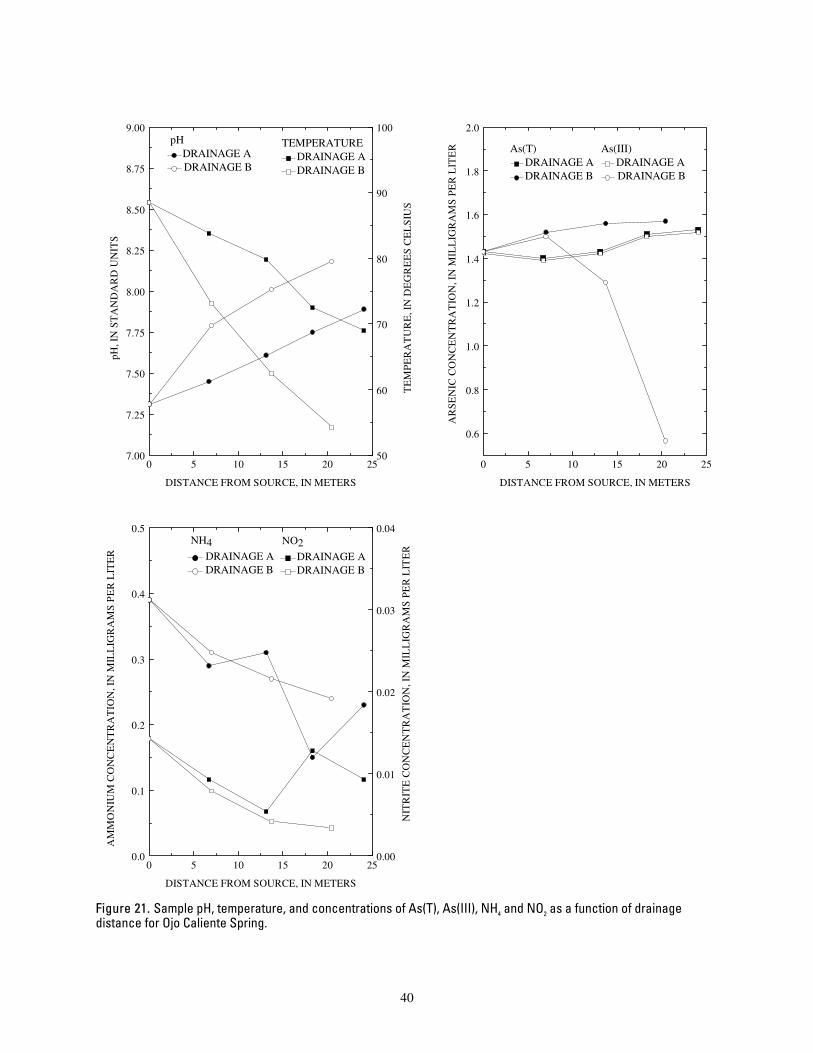
0 5 10 15 20 257.00
7.25
7.50
7.75
8.00
8.25
8.50
8.75
9.00
0 5 10 15 20 25
0.6
0.8
1.0
1.2
1.4
1.6
1.8
2.0
0 5 10 15 20 250.0
0.1
0.2
0.3
0.4
0.5
0.00
0.01
0.02
0.03
0.04
pH DRAINAGE A DRAINAGE B
pH
, IN
ST
AN
DA
RD
UN
ITS
DISTANCE FROM SOURCE, IN METERS
50
60
70
80
90
100
TE
MP
ER
AT
UR
E, I
N D
EG
RE
ES
CE
LS
IUS
TEMPERATURE DRAINAGE A DRAINAGE B
As(T) As(III) DRAINAGE A DRAINAGE A DRAINAGE B DRAINAGE B
AR
SE
NIC
CO
NC
EN
TR
AT
ION
, IN
MIL
LIG
RA
MS
PE
R L
ITE
R
DISTANCE FROM SOURCE, IN METERS
NH4 DRAINAGE A DRAINAGE B
AM
MO
NIU
M C
ON
CE
NT
RA
TIO
N, I
N M
ILL
IGR
AM
S P
ER
LIT
ER
DISTANCE FROM SOURCE, IN METERS
NO2 DRAINAGE A DRAINAGE B
NIT
RIT
E C
ON
CE
NT
RA
TIO
N, I
N M
ILL
IGR
AM
S P
ER
LIT
ER
Figure 21. Sample pH, temperature, and concentrations of As(T), As(III), NH4 and NO2 as a function of drainage distance for Ojo Caliente Spring.
40
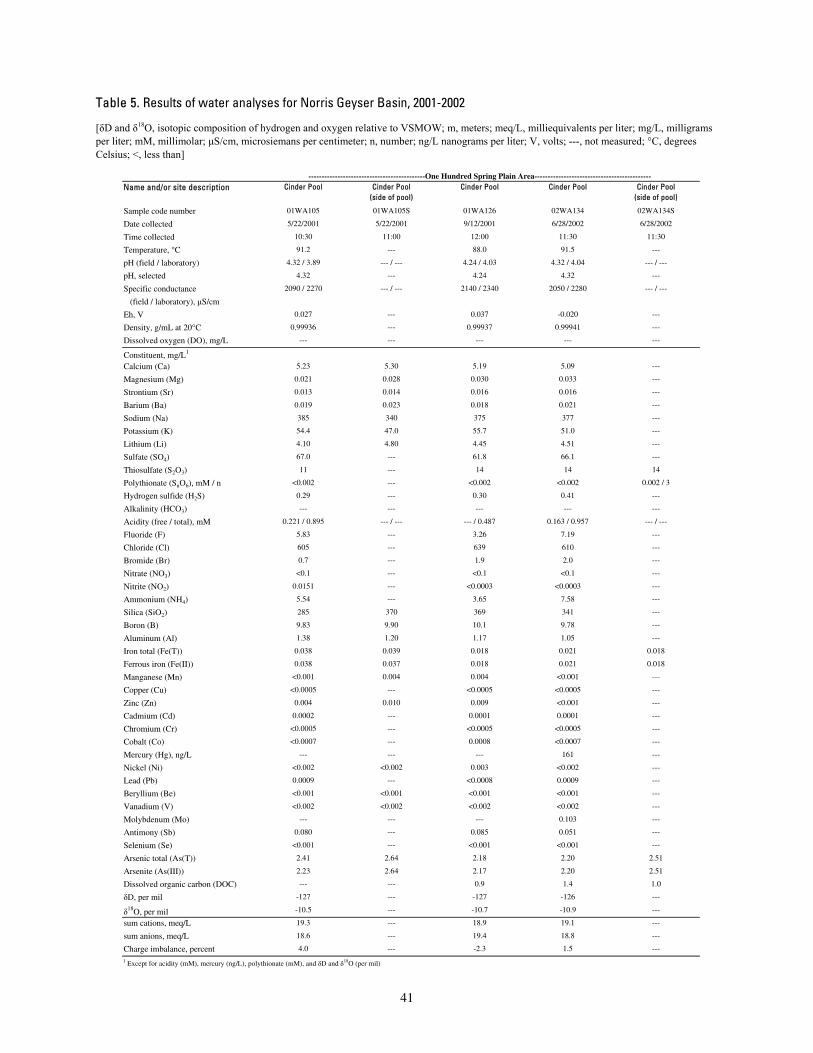
Table 5. Results of water analyses for Norris Geyser Basin, 2001-2002
[δD and δ18O, isotopic composition of hydrogen and oxygen relative to VSMOW; m, meters; meq/L, milliequivalents per liter; mg/L, milligrams per liter; mM, millimolar; μS/cm, microsiemans per centimeter; n, number; ng/L nanograms per liter; V, volts; ---, not measured; °C, degrees Celsius; <, less than]
Name and/or site description Cinder Pool Cinder Pool(side of pool)
Cinder Pool Cinder Pool Cinder Pool(side of pool)
Sample code number 01WA105 01WA105S 01WA126 02WA134 02WA134S
Date collected 5/22/2001 5/22/2001 9/12/2001 6/28/2002 6/28/2002
Time collected 10:30 11:00 12:00 11:30 11:30
Temperature, °C 91.2 --- 88.0 91.5 ---
pH (field / laboratory) 4.32 / 3.89 --- / --- 4.24 / 4.03 4.32 / 4.04 --- / ---
pH, selected 4.32 --- 4.24 4.32 ---
Specific conductance 2090 / 2270 --- / --- 2140 / 2340 2050 / 2280 --- / ---
(field / laboratory), μS/cm
Eh, V 0.027 --- 0.037 -0.020 ---
Density, g/mL at 20°C 0.99936 --- 0.99937 0.99941 ---
Dissolved oxygen (DO), mg/L --- --- --- --- ---
Constituent, mg/L1
Calcium (Ca) 5.23 5.30 5.19 5.09 ---
Magnesium (Mg) 0.021 0.028 0.030 0.033 ---
Strontium (Sr) 0.013 0.014 0.016 0.016 ---
Barium (Ba) 0.019 0.023 0.018 0.021 ---
Sodium (Na) 385 340 375 377 ---
Potassium (K) 54.4 47.0 55.7 51.0 ---
Lithium (Li) 4.10 4.80 4.45 4.51 ---
Sulfate (SO4) 67.0 --- 61.8 66.1 ---
Thiosulfate (S2O3) 11 --- 14 14 14
Polythionate (SnO6), mM / n <0.002 --- <0.002 <0.002 0.002 / 3
Hydrogen sulfide (H2S) 0.29 --- 0.30 0.41 ---
Alkalinity (HCO3) --- --- --- --- ---
Acidity (free / total), mM 0.221 / 0.895 --- / --- --- / 0.487 0.163 / 0.957 --- / ---
Fluoride (F) 5.83 --- 3.26 7.19 ---
Chloride (Cl) 605 --- 639 610 ---
Bromide (Br) 0.7 --- 1.9 2.0 ---
Nitrate (NO3) <0.1 --- <0.1 <0.1 ---
Nitrite (NO2) 0.0151 --- <0.0003 <0.0003 ---
Ammonium (NH4) 5.54 --- 3.65 7.58 ---
Silica (SiO2) 285 370 369 341 ---
Boron (B) 9.83 9.90 10.1 9.78 ---
Aluminum (Al) 1.38 1.20 1.17 1.05 ---
Iron total (Fe(T)) 0.038 0.039 0.018 0.021 0.018
Ferrous iron (Fe(II)) 0.038 0.037 0.018 0.021 0.018
Manganese (Mn) <0.001 0.004 0.004 <0.001 ---
Copper (Cu) <0.0005 --- <0.0005 <0.0005 ---
Zinc (Zn) 0.004 0.010 0.009 <0.001 ---
Cadmium (Cd) 0.0002 --- 0.0001 0.0001 ---
Chromium (Cr) <0.0005 --- <0.0005 <0.0005 ---
Cobalt (Co) <0.0007 --- 0.0008 <0.0007 ---
Mercury (Hg), ng/L --- --- --- 161 ---
Nickel (Ni) <0.002 <0.002 0.003 <0.002 ---
Lead (Pb) 0.0009 --- <0.0008 0.0009 ---
Beryllium (Be) <0.001 <0.001 <0.001 <0.001 ---
Vanadium (V) <0.002 <0.002 <0.002 <0.002 ---
Molybdenum (Mo) --- --- --- 0.103 ---
Antimony (Sb) 0.080 --- 0.085 0.051 ---
Selenium (Se) <0.001 --- <0.001 <0.001 ---
Arsenic total (As(T)) 2.41 2.64 2.18 2.20 2.51
Arsenite (As(III)) 2.23 2.64 2.17 2.20 2.51
Dissolved organic carbon (DOC) --- --- 0.9 1.4 1.0
δD, per mil -127 --- -127 -126 ---
δ18O, per mil -10.5 --- -10.7 -10.9 ---
sum cations, meq/L 19.3 --- 18.9 19.1 ---
sum anions, meq/L 18.6 --- 19.4 18.8 ---
Charge imbalance, percent 4.0 --- -2.3 1.5 ---
1 Except for acidity (mM), mercury (ng/L), polythionate (mM), and δD and δ18O (per mil)
--------------------------------------------One Hundred Spring Plain Area--------------------------------------------
41

Table 5. Results of water analyses for Norris Geyser Basin, 2001-2002 – Continued
[δD and δ18O, isotopic composition of hydrogen and oxygen relative to VSMOW; m, meters; meq/L, milliequivalents per liter; mg/L, milligrams per liter; mM, millimolar; μS/cm, microsiemans per centimeter; n, number; ng/L nanograms per liter; V, volts; ---, not measured; °C, degrees Celsius; <, less than]
Name and/or site description Tantalus Creek at weir Unnamed small sulfur pool
Unnamed mud pot Unnamed mud pot Unnamed large pond 220m west of 02WA125
Sample code number 01WA130 01WA176 01WA169 02WA125 02WA126
Date collected 9/13/2001 10/23/2001 10/22/2001 6/26/2002 6/26/2002
Time collected 10:18 12:37 15:15 11:00 13:45
Temperature, °C 28.2 13.7 16.5 92.8 31.2
pH (field / laboratory) 3.00 / 2.99 2.15 / --- 2.59 / --- 4.76 / 3.34 3.32 / 3.29
pH, selected 2.97 --- --- 3.34 3.32
Specific conductance 2250 / 2300 3370 / --- 2100 / --- 420 / 788 984 / 1021
(field / laboratory), μS/cm
Eh, V 0.659 --- --- -0.047 0.146
Density, g/mL at 20°C 0.99933 --- --- 0.99867 ---
Dissolved oxygen (DO), mg/L --- --- --- --- ---
Constituent, mg/L1
Calcium (Ca) 4.14 --- --- 3.17 8.40
Magnesium (Mg) 0.258 --- --- 0.796 1.51
Strontium (Sr) 0.015 --- --- 0.046 0.073
Barium (Ba) 0.090 --- --- 0.075 0.054
Sodium (Na) 303 --- --- 4.96 121
Potassium (K) 58.9 --- --- 17.2 29.5
Lithium (Li) 3.71 --- --- 0.010 0.882
Sulfate (SO4) 163 --- --- 194 208
Thiosulfate (S2O3) --- --- --- <0.1 <0.1
Polythionate (SnO6), mM / n --- --- --- <0.002 <0.002
Hydrogen sulfide (H2S) --- --- --- 0.17 <0.002
Alkalinity (HCO3) --- --- --- --- ---
Acidity (free / total), mM 1.12 / 1.65 --- / --- --- / --- --- / --- 0.582 / 1.53
Fluoride (F) 2.72 --- --- 0.10 2.29
Chloride (Cl) 510 --- --- 19.6 109
Bromide (Br) 1.5 --- --- <0.03 0.6
Nitrate (NO3) <0.1 --- --- <0.1 <0.1
Nitrite (NO2) --- --- --- 0.0016 0.0033
Ammonium (NH4) --- --- --- 56.7 0.77
Silica (SiO2) 352 --- --- 106 144
Boron (B) 7.55 --- --- 0.12 2.05
Aluminum (Al) 2.39 --- --- 0.13 2.78
Iron total (Fe(T)) 1.53 --- --- 0.137 2.35
Ferrous iron (Fe(II)) 0.564 --- --- 0.133 1.92
Manganese (Mn) 0.080 --- --- 0.062 0.128
Copper (Cu) <0.0005 --- --- 0.0107 <0.0005
Zinc (Zn) 0.017 --- --- 0.661 0.025
Cadmium (Cd) 0.0001 --- --- 0.0138 0.0001
Chromium (Cr) 0.0038 --- --- 0.0118 0.0056
Cobalt (Co) <0.0007 --- --- 0.0007 0.0009
Mercury (Hg), ng/L --- 733 1520 520 61
Nickel (Ni) 0.003 --- --- 0.003 <0.002
Lead (Pb) 0.0017 --- --- 0.0095 0.0009
Beryllium (Be) 0.002 --- --- <0.001 0.001
Vanadium (V) <0.002 --- --- <0.002 <0.002
Molybdenum (Mo) --- --- --- <0.007 <0.007
Antimony (Sb) 0.089 --- --- 0.007 0.006
Selenium (Se) 0.002 --- --- <0.001 <0.001
Arsenic total (As(T)) 1.79 --- --- 0.0527 0.182
Arsenite (As(III)) 0.0626 --- --- 0.0527 0.0422
Dissolved organic carbon (DOC) --- --- --- --- 2.3
δD, per mil --- --- --- -125
δ18O, per mil --- --- --- --- -14.1
sum cations, meq/L 16.8 --- --- 4.44 7.40
sum anions, meq/L 17.6 --- --- 4.16 7.18
Charge imbalance, percent -5.0 --- --- 6.7 3.0
1 Except for acidity (mM), mercury (ng/L), polythionate (mM), and δD and δ18O (per mil)
--------------------------------------------One Hundred Spring Plain Area--------------------------------------------
42
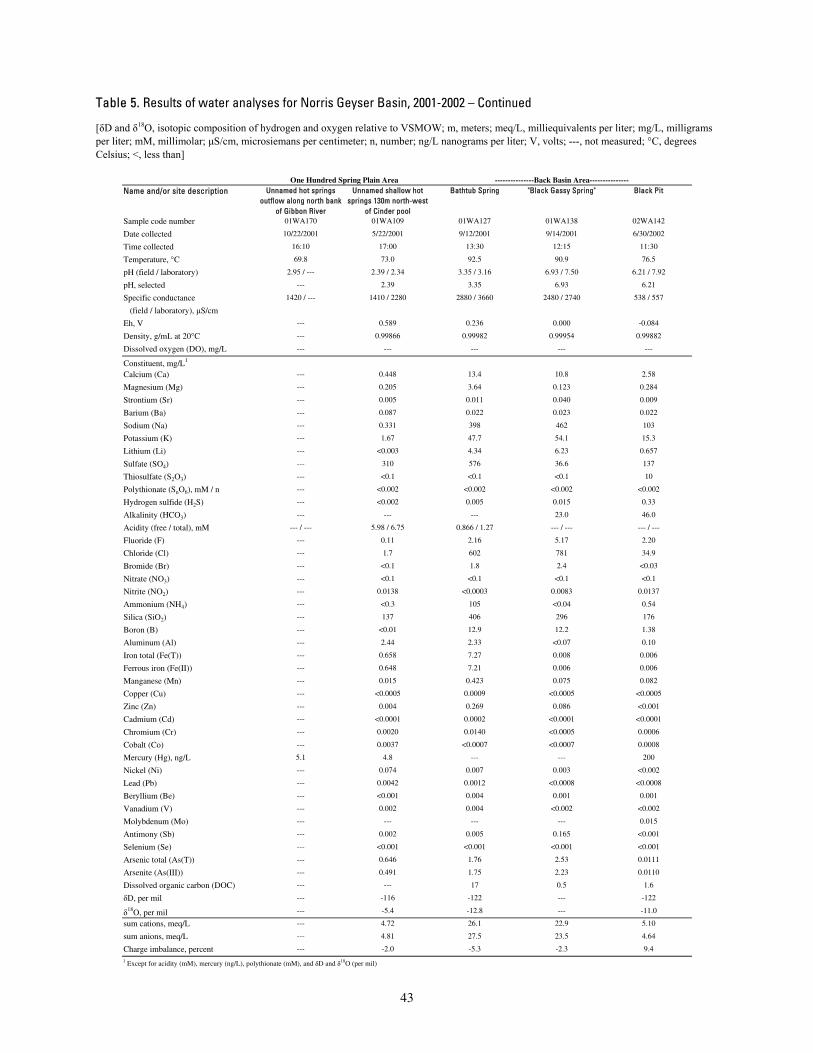
Table 5. Results of water analyses for Norris Geyser Basin, 2001-2002 – Continued
[δD and δ18O, isotopic composition of hydrogen and oxygen relative to VSMOW; m, meters; meq/L, milliequivalents per liter; mg/L, milligrams per liter; mM, millimolar; μS/cm, microsiemans per centimeter; n, number; ng/L nanograms per liter; V, volts; ---, not measured; °C, degrees Celsius; <, less than]
Name and/or site description Unnamed hot springs outflow along north bank
of Gibbon River
Unnamed shallow hot springs 130m north-west
of Cinder pool
Bathtub Spring "Black Gassy Spring" Black Pit
Sample code number 01WA170 01WA109 01WA127 01WA138 02WA142
Date collected 10/22/2001 5/22/2001 9/12/2001 9/14/2001 6/30/2002
Time collected 16:10 17:00 13:30 12:15 11:30
Temperature, °C 69.8 73.0 92.5 90.9 76.5
pH (field / laboratory) 2.95 / --- 2.39 / 2.34 3.35 / 3.16 6.93 / 7.50 6.21 / 7.92
pH, selected --- 2.39 3.35 6.93 6.21
Specific conductance 1420 / --- 1410 / 2280 2880 / 3660 2480 / 2740 538 / 557
(field / laboratory), μS/cm
Eh, V --- 0.589 0.236 0.000 -0.084
Density, g/mL at 20°C --- 0.99866 0.99982 0.99954 0.99882
Dissolved oxygen (DO), mg/L --- --- --- --- ---
Constituent, mg/L1
Calcium (Ca) --- 0.448 13.4 10.8 2.58
Magnesium (Mg) --- 0.205 3.64 0.123 0.284
Strontium (Sr) --- 0.005 0.011 0.040 0.009
Barium (Ba) --- 0.087 0.022 0.023 0.022
Sodium (Na) --- 0.331 398 462 103
Potassium (K) --- 1.67 47.7 54.1 15.3
Lithium (Li) --- <0.003 4.34 6.23 0.657
Sulfate (SO4) --- 310 576 36.6 137
Thiosulfate (S2O3) --- <0.1 <0.1 <0.1 10
Polythionate (SnO6), mM / n --- <0.002 <0.002 <0.002 <0.002
Hydrogen sulfide (H2S) --- <0.002 0.005 0.015 0.33
Alkalinity (HCO3) --- --- --- 23.0 46.0
Acidity (free / total), mM --- / --- 5.98 / 6.75 0.866 / 1.27 --- / --- --- / ---
Fluoride (F) --- 0.11 2.16 5.17 2.20
Chloride (Cl) --- 1.7 602 781 34.9
Bromide (Br) --- <0.1 1.8 2.4 <0.03
Nitrate (NO3) --- <0.1 <0.1 <0.1 <0.1
Nitrite (NO2) --- 0.0138 <0.0003 0.0083 0.0137
Ammonium (NH4) --- <0.3 105 <0.04 0.54
Silica (SiO2) --- 137 406 296 176
Boron (B) --- <0.01 12.9 12.2 1.38
Aluminum (Al) --- 2.44 2.33 <0.07 0.10
Iron total (Fe(T)) --- 0.658 7.27 0.008 0.006
Ferrous iron (Fe(II)) --- 0.648 7.21 0.006 0.006
Manganese (Mn) --- 0.015 0.423 0.075 0.082
Copper (Cu) --- <0.0005 0.0009 <0.0005 <0.0005
Zinc (Zn) --- 0.004 0.269 0.086 <0.001
Cadmium (Cd) --- <0.0001 0.0002 <0.0001 <0.0001
Chromium (Cr) --- 0.0020 0.0140 <0.0005 0.0006
Cobalt (Co) --- 0.0037 <0.0007 <0.0007 0.0008
Mercury (Hg), ng/L 5.1 4.8 --- --- 200
Nickel (Ni) --- 0.074 0.007 0.003 <0.002
Lead (Pb) --- 0.0042 0.0012 <0.0008 <0.0008
Beryllium (Be) --- <0.001 0.004 0.001 0.001
Vanadium (V) --- 0.002 0.004 <0.002 <0.002
Molybdenum (Mo) --- --- --- --- 0.015
Antimony (Sb) --- 0.002 0.005 0.165 <0.001
Selenium (Se) --- <0.001 <0.001 <0.001 <0.001
Arsenic total (As(T)) --- 0.646 1.76 2.53 0.0111
Arsenite (As(III)) --- 0.491 1.75 2.23 0.0110
Dissolved organic carbon (DOC) --- --- 17 0.5 1.6
δD, per mil --- -116 -122 --- -122
δ18O, per mil --- -5.4 -12.8 --- -11.0
sum cations, meq/L --- 4.72 26.1 22.9 5.10
sum anions, meq/L --- 4.81 27.5 23.5 4.64
Charge imbalance, percent --- -2.0 -5.3 -2.3 9.4
1 Except for acidity (mM), mercury (ng/L), polythionate (mM), and δD and δ18O (per mil)
One Hundred Spring Plain Area ---------------Back Basin Area---------------
43
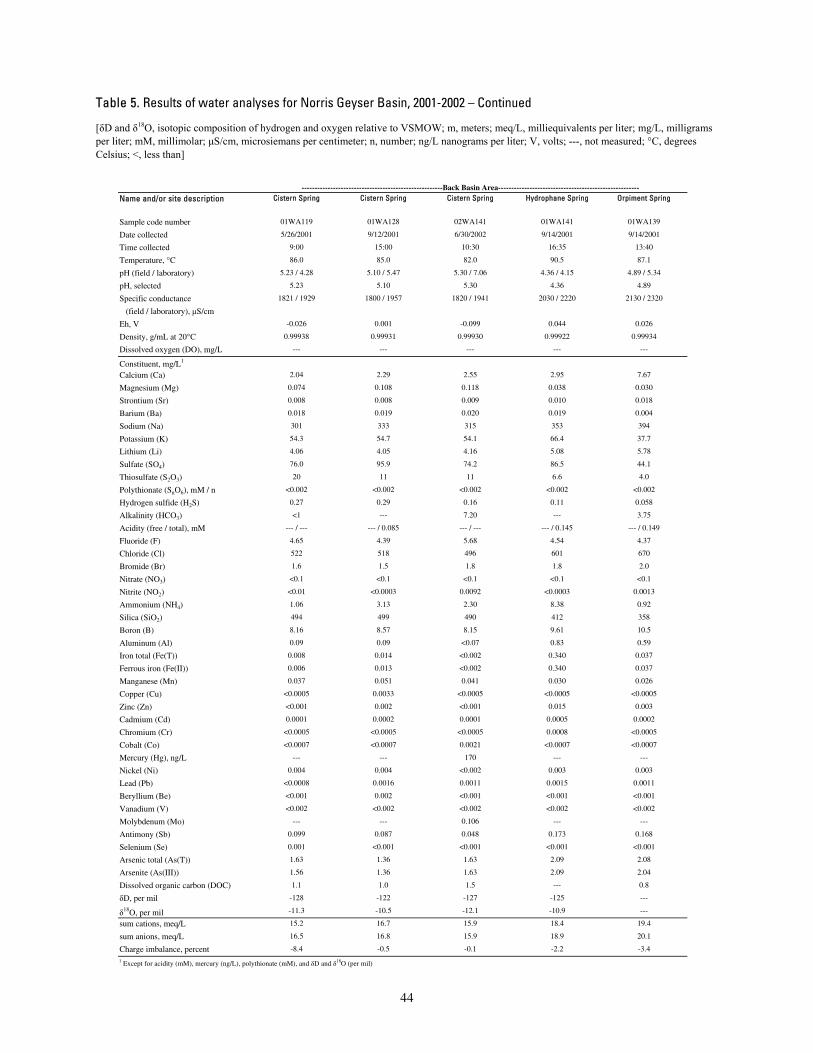
Table 5. Results of water analyses for Norris Geyser Basin, 2001-2002 – Continued
[δD and δ18O, isotopic composition of hydrogen and oxygen relative to VSMOW; m, meters; meq/L, milliequivalents per liter; mg/L, milligrams per liter; mM, millimolar; μS/cm, microsiemans per centimeter; n, number; ng/L nanograms per liter; V, volts; ---, not measured; °C, degrees Celsius; <, less than]
Name and/or site description Cistern Spring Cistern Spring Cistern Spring Hydrophane Spring Orpiment Spring
Sample code number 01WA119 01WA128 02WA141 01WA141 01WA139
Date collected 5/26/2001 9/12/2001 6/30/2002 9/14/2001 9/14/2001
Time collected 9:00 15:00 10:30 16:35 13:40
Temperature, °C 86.0 85.0 82.0 90.5 87.1
pH (field / laboratory) 5.23 / 4.28 5.10 / 5.47 5.30 / 7.06 4.36 / 4.15 4.89 / 5.34
pH, selected 5.23 5.10 5.30 4.36 4.89
Specific conductance 1821 / 1929 1800 / 1957 1820 / 1941 2030 / 2220 2130 / 2320
(field / laboratory), μS/cm
Eh, V -0.026 0.001 -0.099 0.044 0.026
Density, g/mL at 20°C 0.99938 0.99931 0.99930 0.99922 0.99934
Dissolved oxygen (DO), mg/L --- --- --- --- ---
Constituent, mg/L1
Calcium (Ca) 2.04 2.29 2.55 2.95 7.67
Magnesium (Mg) 0.074 0.108 0.118 0.038 0.030
Strontium (Sr) 0.008 0.008 0.009 0.010 0.018
Barium (Ba) 0.018 0.019 0.020 0.019 0.004
Sodium (Na) 301 333 315 353 394
Potassium (K) 54.3 54.7 54.1 66.4 37.7
Lithium (Li) 4.06 4.05 4.16 5.08 5.78
Sulfate (SO4) 76.0 95.9 74.2 86.5 44.1
Thiosulfate (S2O3) 20 11 11 6.6 4.0
Polythionate (SnO6), mM / n <0.002 <0.002 <0.002 <0.002 <0.002
Hydrogen sulfide (H2S) 0.27 0.29 0.16 0.11 0.058
Alkalinity (HCO3) <1 --- 7.20 --- 3.75
Acidity (free / total), mM --- / --- --- / 0.085 --- / --- --- / 0.145 --- / 0.149
Fluoride (F) 4.65 4.39 5.68 4.54 4.37
Chloride (Cl) 522 518 496 601 670
Bromide (Br) 1.6 1.5 1.8 1.8 2.0
Nitrate (NO3) <0.1 <0.1 <0.1 <0.1 <0.1
Nitrite (NO2) <0.01 <0.0003 0.0092 <0.0003 0.0013
Ammonium (NH4) 1.06 3.13 2.30 8.38 0.92
Silica (SiO2) 494 499 490 412 358
Boron (B) 8.16 8.57 8.15 9.61 10.5
Aluminum (Al) 0.09 0.09 <0.07 0.83 0.59
Iron total (Fe(T)) 0.008 0.014 <0.002 0.340 0.037
Ferrous iron (Fe(II)) 0.006 0.013 <0.002 0.340 0.037
Manganese (Mn) 0.037 0.051 0.041 0.030 0.026
Copper (Cu) <0.0005 0.0033 <0.0005 <0.0005 <0.0005
Zinc (Zn) <0.001 0.002 <0.001 0.015 0.003
Cadmium (Cd) 0.0001 0.0002 0.0001 0.0005 0.0002
Chromium (Cr) <0.0005 <0.0005 <0.0005 0.0008 <0.0005
Cobalt (Co) <0.0007 <0.0007 0.0021 <0.0007 <0.0007
Mercury (Hg), ng/L --- --- 170 --- ---
Nickel (Ni) 0.004 0.004 <0.002 0.003 0.003
Lead (Pb) <0.0008 0.0016 0.0011 0.0015 0.0011
Beryllium (Be) <0.001 0.002 <0.001 <0.001 <0.001
Vanadium (V) <0.002 <0.002 <0.002 <0.002 <0.002
Molybdenum (Mo) --- --- 0.106 --- ---
Antimony (Sb) 0.099 0.087 0.048 0.173 0.168
Selenium (Se) 0.001 <0.001 <0.001 <0.001 <0.001
Arsenic total (As(T)) 1.63 1.36 1.63 2.09 2.08
Arsenite (As(III)) 1.56 1.36 1.63 2.09 2.04
Dissolved organic carbon (DOC) 1.1 1.0 1.5 --- 0.8
δD, per mil -128 -122 -127 -125 ---
δ18O, per mil -11.3 -10.5 -12.1 -10.9 ---
sum cations, meq/L 15.2 16.7 15.9 18.4 19.4
sum anions, meq/L 16.5 16.8 15.9 18.9 20.1
Charge imbalance, percent -8.4 -0.5 -0.1 -2.2 -3.4
1 Except for acidity (mM), mercury (ng/L), polythionate (mM), and δD and δ18O (per mil)
------------------------------------------------------Back Basin Area------------------------------------------------------
44
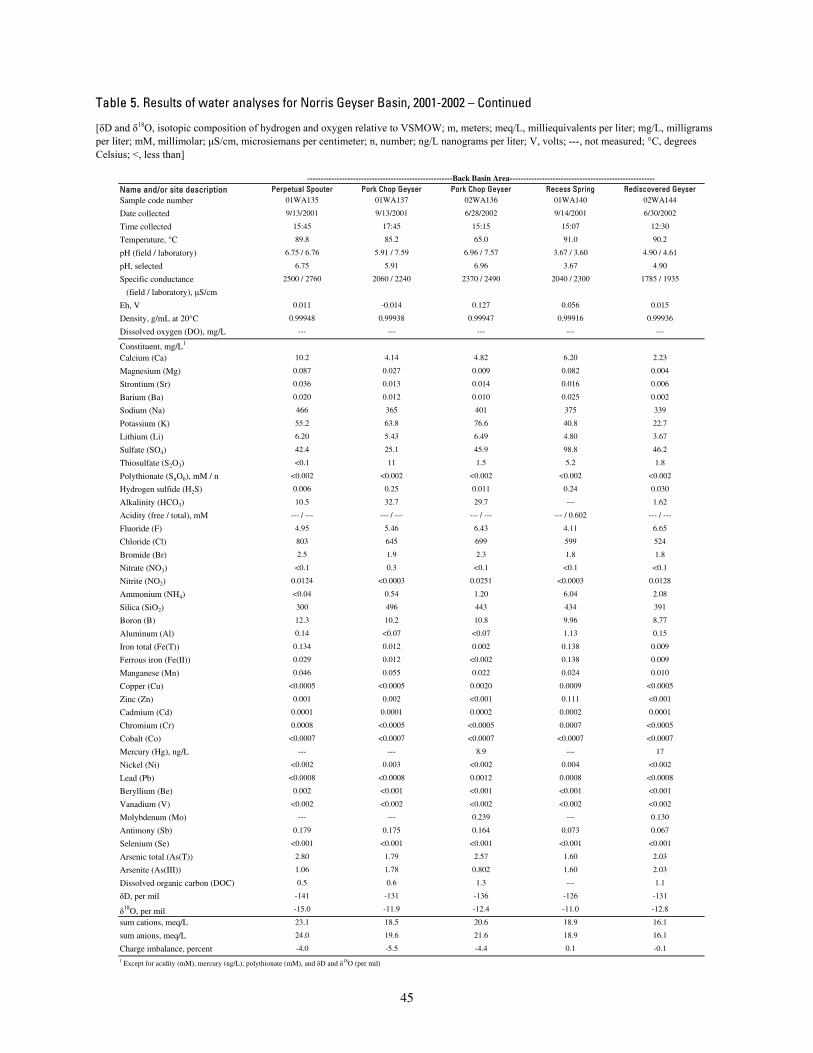
Table 5. Results of water analyses for Norris Geyser Basin, 2001-2002 – Continued
[δD and δ18O, isotopic composition of hydrogen and oxygen relative to VSMOW; m, meters; meq/L, milliequivalents per liter; mg/L, milligrams per liter; mM, millimolar; μS/cm, microsiemans per centimeter; n, number; ng/L nanograms per liter; V, volts; ---, not measured; °C, degrees Celsius; <, less than]
Name and/or site description Perpetual Spouter Pork Chop Geyser Pork Chop Geyser Recess Spring Rediscovered GeyserSample code number 01WA135 01WA137 02WA136 01WA140 02WA144
Date collected 9/13/2001 9/13/2001 6/28/2002 9/14/2001 6/30/2002
Time collected 15:45 17:45 15:15 15:07 12:30
Temperature, °C 89.8 85.2 65.0 91.0 90.2
pH (field / laboratory) 6.75 / 6.76 5.91 / 7.59 6.96 / 7.57 3.67 / 3.60 4.90 / 4.61
pH, selected 6.75 5.91 6.96 3.67 4.90
Specific conductance 2500 / 2760 2060 / 2240 2370 / 2490 2040 / 2300 1785 / 1935
(field / laboratory), μS/cm
Eh, V 0.011 -0.014 0.127 0.056 0.015
Density, g/mL at 20°C 0.99948 0.99938 0.99947 0.99916 0.99936
Dissolved oxygen (DO), mg/L --- --- --- --- ---
Constituent, mg/L1
Calcium (Ca) 10.2 4.14 4.82 6.20 2.23
Magnesium (Mg) 0.087 0.027 0.009 0.082 0.004
Strontium (Sr) 0.036 0.013 0.014 0.016 0.006
Barium (Ba) 0.020 0.012 0.010 0.025 0.002
Sodium (Na) 466 365 401 375 339
Potassium (K) 55.2 63.8 76.6 40.8 22.7
Lithium (Li) 6.20 5.43 6.49 4.80 3.67
Sulfate (SO4) 42.4 25.1 45.9 98.8 46.2
Thiosulfate (S2O3) <0.1 11 1.5 5.2 1.8
Polythionate (SnO6), mM / n <0.002 <0.002 <0.002 <0.002 <0.002
Hydrogen sulfide (H2S) 0.006 0.25 0.011 0.24 0.030
Alkalinity (HCO3) 10.5 32.7 29.7 --- 1.62
Acidity (free / total), mM --- / --- --- / --- --- / --- --- / 0.602 --- / ---
Fluoride (F) 4.95 5.46 6.43 4.11 6.65
Chloride (Cl) 803 645 699 599 524
Bromide (Br) 2.5 1.9 2.3 1.8 1.8
Nitrate (NO3) <0.1 0.3 <0.1 <0.1 <0.1
Nitrite (NO2) 0.0124 <0.0003 0.0251 <0.0003 0.0128
Ammonium (NH4) <0.04 0.54 1.20 6.04 2.08
Silica (SiO2) 300 496 443 434 391
Boron (B) 12.3 10.2 10.8 9.96 8.77
Aluminum (Al) 0.14 <0.07 <0.07 1.13 0.15
Iron total (Fe(T)) 0.134 0.012 0.002 0.138 0.009
Ferrous iron (Fe(II)) 0.029 0.012 <0.002 0.138 0.009
Manganese (Mn) 0.046 0.055 0.022 0.024 0.010
Copper (Cu) <0.0005 <0.0005 0.0020 0.0009 <0.0005
Zinc (Zn) 0.001 0.002 <0.001 0.111 <0.001
Cadmium (Cd) 0.0001 0.0001 0.0002 0.0002 0.0001
Chromium (Cr) 0.0008 <0.0005 <0.0005 0.0007 <0.0005
Cobalt (Co) <0.0007 <0.0007 <0.0007 <0.0007 <0.0007
Mercury (Hg), ng/L --- --- 8.9 --- 17
Nickel (Ni) <0.002 0.003 <0.002 0.004 <0.002
Lead (Pb) <0.0008 <0.0008 0.0012 0.0008 <0.0008
Beryllium (Be) 0.002 <0.001 <0.001 <0.001 <0.001
Vanadium (V) <0.002 <0.002 <0.002 <0.002 <0.002
Molybdenum (Mo) --- --- 0.239 --- 0.130
Antimony (Sb) 0.179 0.175 0.164 0.073 0.067
Selenium (Se) <0.001 <0.001 <0.001 <0.001 <0.001
Arsenic total (As(T)) 2.80 1.79 2.57 1.60 2.03
Arsenite (As(III)) 1.06 1.78 0.802 1.60 2.03
Dissolved organic carbon (DOC) 0.5 0.6 1.3 --- 1.1
δD, per mil -141 -131 -136 -126 -131
δ18O, per mil -15.0 -11.9 -12.4 -11.0 -12.8
sum cations, meq/L 23.1 18.5 20.6 18.9 16.1
sum anions, meq/L 24.0 19.6 21.6 18.9 16.1
Charge imbalance, percent -4.0 -5.5 -4.4 0.1 -0.1
1 Except for acidity (mM), mercury (ng/L), polythionate (mM), and δD and δ18O (per mil)
------------------------------------------------------Back Basin Area------------------------------------------------------
45

Table 5. Results of water analyses for Norris Geyser Basin, 2001-2002 – Continued
[δD and δ18O, isotopic composition of hydrogen and oxygen relative to VSMOW; m, meters; meq/L, milliequivalents per liter; mg/L, milligrams per liter; mM, millimolar; μS/cm, microsiemans per centimeter; n, number; ng/L nanograms per liter; V, volts; ---, not measured; °C, degrees Celsius; <, less than]
Name and/or site description Steamboat Geyser Vixen Geyser Unnamed acid spring next to Perpetual Spouter
Crystal Spring "Lifeboat Spring"
Sample code number 01WA142 01WA129 01WA136 02WA135 01WA108
Date collected 9/14/2001 9/12/2001 9/13/2001 6/28/2002 5/22/2001
Time collected 18:01 17:00 16:40 13:20 15:00
Temperature, °C 77.0 87.0 92.5 83.7 78.4
pH (field / laboratory) 6.55 / 7.52 3.30 / 3.14 2.81 / 2.74 6.00 / 7.13 2.76 / 2.69
pH, selected 6.55 3.14 2.81 6.00 2.76
Specific conductance 1825 / 1799 1750 / 2035 1385 / 1953 2230 / 2400 2180 / 2640
(field / laboratory), μS/cm
Eh, V 0.405 0.181 0.495 -0.035 0.681
Density, g/mL at 20°C 0.99909 0.99920 0.99908 0.99949 0.99931
Dissolved oxygen (DO), mg/L --- --- --- --- ---
Constituent, mg/L1
Calcium (Ca) 2.41 3.35 2.49 6.22 4.17
Magnesium (Mg) 0.151 0.183 0.275 0.009 0.317
Strontium (Sr) 0.009 0.013 0.013 0.013 0.012
Barium (Ba) 0.023 0.107 0.111 0.007 0.093
Sodium (Na) 301 276 168 426 269
Potassium (K) 57.7 56.1 58.2 33.9 45.9
Lithium (Li) 3.39 3.52 1.28 5.56 3.84
Sulfate (SO4) 97.7 109 236 35.8 200
Thiosulfate (S2O3) <0.1 <0.1 <0.1 3.0 <0.1
Polythionate (SnO6), mM / n <0.002 <0.002 <0.002 <0.002 <0.002
Hydrogen sulfide (H2S) 0.052 0.11 --- 0.10 <0.002
Alkalinity (HCO3) 32.1 --- --- 14.4 ---
Acidity (free / total), mM --- / --- 0.761 / 1.28 2.11 / 2.51 --- / --- 2.52 / 3.05
Fluoride (F) 4.30 2.84 0.70 5.83 0.63
Chloride (Cl) 463 492 253 690 440
Bromide (Br) 1.4 1.4 0.8 2.3 0.5
Nitrate (NO3) 0.6 <0.1 <0.1 <0.1 <0.1
Nitrite (NO2) 0.0015 <0.0003 <0.0003 0.0092 <0.01
Ammonium (NH4) 0.42 1.72 1.68 1.35 0.73
Silica (SiO2) 486 350 421 430 386
Boron (B) 7.61 7.10 3.99 10.9 7.57
Aluminum (Al) 0.12 2.11 0.73 0.20 2.31
Iron total (Fe(T)) 0.007 1.74 4.05 0.035 0.727
Ferrous iron (Fe(II)) 0.006 1.70 3.76 0.033 0.727
Manganese (Mn) 0.046 0.066 0.076 0.002 0.060
Copper (Cu) <0.0005 <0.0005 <0.0005 <0.0005 0.0008
Zinc (Zn) 0.003 0.020 0.047 <0.001 0.021
Cadmium (Cd) 0.0002 0.0001 0.0002 <0.0001 0.0002
Chromium (Cr) 0.0014 0.0036 0.0098 <0.0005 0.0058
Cobalt (Co) <0.0007 <0.0007 <0.0007 <0.0007 <0.0007
Mercury (Hg), ng/L --- --- --- 52 ---
Nickel (Ni) 0.006 0.004 0.003 <0.002 0.004
Lead (Pb) 0.0008 <0.0008 0.0011 0.0009 0.0012
Beryllium (Be) 0.001 0.002 0.003 <0.001 0.002
Vanadium (V) <0.002 <0.002 <0.002 <0.002 <0.002
Molybdenum (Mo) --- --- --- 0.219 ---
Antimony (Sb) 0.059 0.057 0.031 0.149 0.100
Selenium (Se) <0.001 <0.001 <0.001 <0.001 <0.001
Arsenic total (As(T)) 1.17 1.69 0.855 2.90 0.902
Arsenite (As(III)) 1.17 1.42 0.444 2.88 0.0446
Dissolved organic carbon (DOC) --- 0.8 0.6 --- 0.8
δD, per mil -126 -139 -138 -139 -137
δ18O, per mil -13.5 -15.0 -15.9 -14.1 -12.6
sum cations, meq/L 15.2 15.2 11.0 20.6 15.8
sum anions, meq/L 15.8 15.9 11.1 20.8 15.9
Charge imbalance, percent -4.2 -5.0 -0.1 -0.9 -0.5
1 Except for acidity (mM), mercury (ng/L), polythionate (mM), and δD and δ18O (per mil)
----Ragged Hills Area---------------------------Back Basin Area-----------------------
46
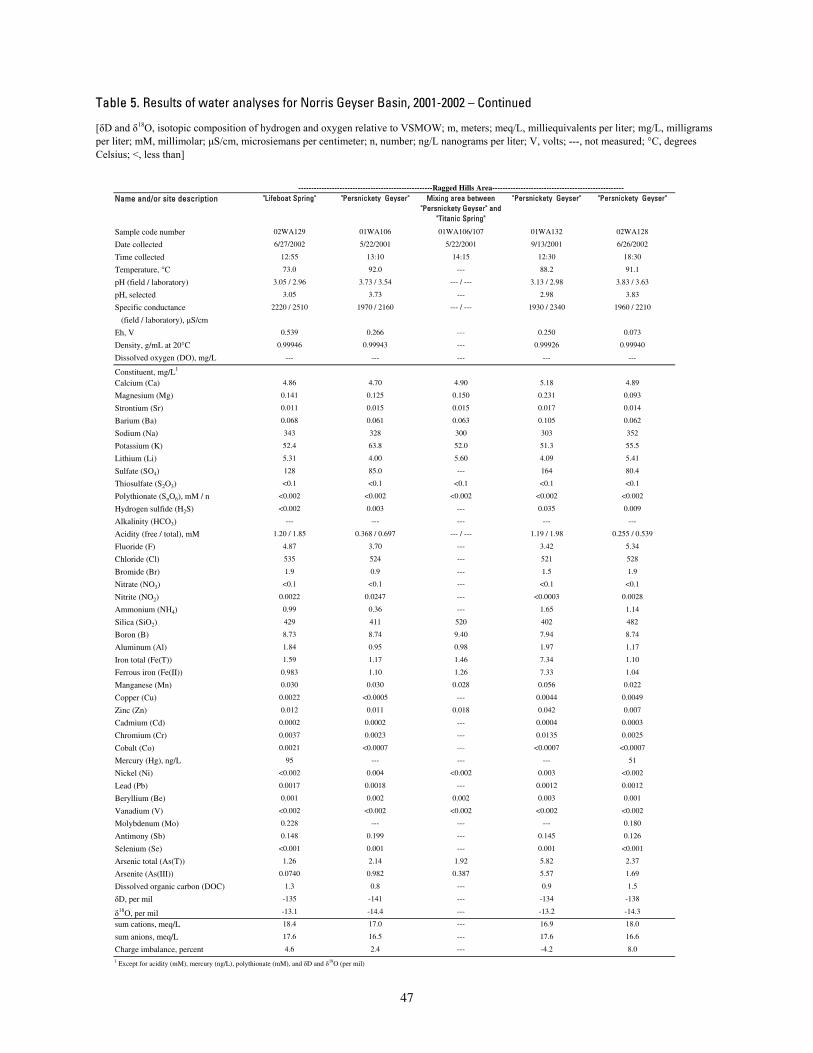
Table 5. Results of water analyses for Norris Geyser Basin, 2001-2002 – Continued
[δD and δ18O, isotopic composition of hydrogen and oxygen relative to VSMOW; m, meters; meq/L, milliequivalents per liter; mg/L, milligrams per liter; mM, millimolar; μS/cm, microsiemans per centimeter; n, number; ng/L nanograms per liter; V, volts; ---, not measured; °C, degrees Celsius; <, less than]
Name and/or site description "Lifeboat Spring" "Persnickety Geyser" Mixing area between "Persnickety Geyser" and
"Titanic Spring"
"Persnickety Geyser" "Persnickety Geyser"
Sample code number 02WA129 01WA106 01WA106/107 01WA132 02WA128
Date collected 6/27/2002 5/22/2001 5/22/2001 9/13/2001 6/26/2002
Time collected 12:55 13:10 14:15 12:30 18:30
Temperature, °C 73.0 92.0 --- 88.2 91.1
pH (field / laboratory) 3.05 / 2.96 3.73 / 3.54 --- / --- 3.13 / 2.98 3.83 / 3.63
pH, selected 3.05 3.73 --- 2.98 3.83
Specific conductance 2220 / 2510 1970 / 2160 --- / --- 1930 / 2340 1960 / 2210
(field / laboratory), μS/cm
Eh, V 0.539 0.266 --- 0.250 0.073
Density, g/mL at 20°C 0.99946 0.99943 --- 0.99926 0.99940
Dissolved oxygen (DO), mg/L --- --- --- --- ---
Constituent, mg/L1
Calcium (Ca) 4.86 4.70 4.90 5.18 4.89
Magnesium (Mg) 0.141 0.125 0.150 0.231 0.093
Strontium (Sr) 0.011 0.015 0.015 0.017 0.014
Barium (Ba) 0.068 0.061 0.063 0.105 0.062
Sodium (Na) 343 328 300 303 352
Potassium (K) 52.4 63.8 52.0 51.3 55.5
Lithium (Li) 5.31 4.00 5.60 4.09 5.41
Sulfate (SO4) 128 85.0 --- 164 80.4
Thiosulfate (S2O3) <0.1 <0.1 <0.1 <0.1 <0.1
Polythionate (SnO6), mM / n <0.002 <0.002 <0.002 <0.002 <0.002
Hydrogen sulfide (H2S) <0.002 0.003 --- 0.035 0.009
Alkalinity (HCO3) --- --- --- --- ---
Acidity (free / total), mM 1.20 / 1.85 0.368 / 0.697 --- / --- 1.19 / 1.98 0.255 / 0.539
Fluoride (F) 4.87 3.70 --- 3.42 5.34
Chloride (Cl) 535 524 --- 521 528
Bromide (Br) 1.9 0.9 --- 1.5 1.9
Nitrate (NO3) <0.1 <0.1 --- <0.1 <0.1
Nitrite (NO2) 0.0022 0.0247 --- <0.0003 0.0028
Ammonium (NH4) 0.99 0.36 --- 1.65 1.14
Silica (SiO2) 429 411 520 402 482
Boron (B) 8.73 8.74 9.40 7.94 8.74
Aluminum (Al) 1.84 0.95 0.98 1.97 1.17
Iron total (Fe(T)) 1.59 1.17 1.46 7.34 1.10
Ferrous iron (Fe(II)) 0.983 1.10 1.26 7.33 1.04
Manganese (Mn) 0.030 0.030 0.028 0.056 0.022
Copper (Cu) 0.0022 <0.0005 --- 0.0044 0.0049
Zinc (Zn) 0.012 0.011 0.018 0.042 0.007
Cadmium (Cd) 0.0002 0.0002 --- 0.0004 0.0003
Chromium (Cr) 0.0037 0.0023 --- 0.0135 0.0025
Cobalt (Co) 0.0021 <0.0007 --- <0.0007 <0.0007
Mercury (Hg), ng/L 95 --- --- --- 51
Nickel (Ni) <0.002 0.004 <0.002 0.003 <0.002
Lead (Pb) 0.0017 0.0018 --- 0.0012 0.0012
Beryllium (Be) 0.001 0.002 0.002 0.003 0.001
Vanadium (V) <0.002 <0.002 <0.002 <0.002 <0.002
Molybdenum (Mo) 0.228 --- --- --- 0.180
Antimony (Sb) 0.148 0.199 --- 0.145 0.126
Selenium (Se) <0.001 0.001 --- 0.001 <0.001
Arsenic total (As(T)) 1.26 2.14 1.92 5.82 2.37
Arsenite (As(III)) 0.0740 0.982 0.387 5.57 1.69
Dissolved organic carbon (DOC) 1.3 0.8 --- 0.9 1.5
δD, per mil -135 -141 --- -134 -138
δ18O, per mil -13.1 -14.4 --- -13.2 -14.3
sum cations, meq/L 18.4 17.0 --- 16.9 18.0
sum anions, meq/L 17.6 16.5 --- 17.6 16.6
Charge imbalance, percent 4.6 2.4 --- -4.2 8.0
1 Except for acidity (mM), mercury (ng/L), polythionate (mM), and δD and δ18O (per mil)
----------------------------------------------------Ragged Hills Area---------------------------------------------------
47
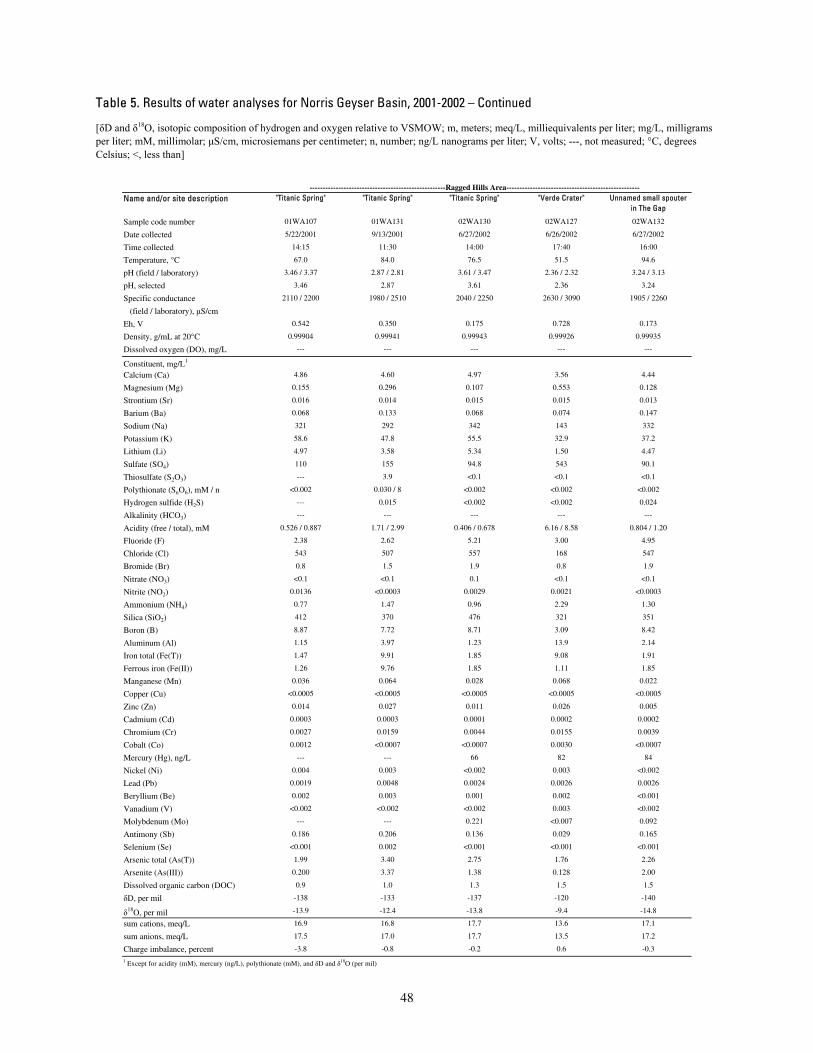
Table 5. Results of water analyses for Norris Geyser Basin, 2001-2002 – Continued
[δD and δ18O, isotopic composition of hydrogen and oxygen relative to VSMOW; m, meters; meq/L, milliequivalents per liter; mg/L, milligrams per liter; mM, millimolar; μS/cm, microsiemans per centimeter; n, number; ng/L nanograms per liter; V, volts; ---, not measured; °C, degrees Celsius; <, less than]
Name and/or site description "Titanic Spring" "Titanic Spring" "Titanic Spring" "Verde Crater" Unnamed small spouter in The Gap
Sample code number 01WA107 01WA131 02WA130 02WA127 02WA132
Date collected 5/22/2001 9/13/2001 6/27/2002 6/26/2002 6/27/2002
Time collected 14:15 11:30 14:00 17:40 16:00
Temperature, °C 67.0 84.0 76.5 51.5 94.6
pH (field / laboratory) 3.46 / 3.37 2.87 / 2.81 3.61 / 3.47 2.36 / 2.32 3.24 / 3.13
pH, selected 3.46 2.87 3.61 2.36 3.24
Specific conductance 2110 / 2200 1980 / 2510 2040 / 2250 2630 / 3090 1905 / 2260
(field / laboratory), μS/cm
Eh, V 0.542 0.350 0.175 0.728 0.173
Density, g/mL at 20°C 0.99904 0.99941 0.99943 0.99926 0.99935
Dissolved oxygen (DO), mg/L --- --- --- --- ---
Constituent, mg/L1
Calcium (Ca) 4.86 4.60 4.97 3.56 4.44
Magnesium (Mg) 0.155 0.296 0.107 0.553 0.128
Strontium (Sr) 0.016 0.014 0.015 0.015 0.013
Barium (Ba) 0.068 0.133 0.068 0.074 0.147
Sodium (Na) 321 292 342 143 332
Potassium (K) 58.6 47.8 55.5 32.9 37.2
Lithium (Li) 4.97 3.58 5.34 1.50 4.47
Sulfate (SO4) 110 155 94.8 543 90.1
Thiosulfate (S2O3) --- 3.9 <0.1 <0.1 <0.1
Polythionate (SnO6), mM / n <0.002 0.030 / 8 <0.002 <0.002 <0.002
Hydrogen sulfide (H2S) --- 0.015 <0.002 <0.002 0.024
Alkalinity (HCO3) --- --- --- --- ---
Acidity (free / total), mM 0.526 / 0.887 1.71 / 2.99 0.406 / 0.678 6.16 / 8.58 0.804 / 1.20
Fluoride (F) 2.38 2.62 5.21 3.00 4.95
Chloride (Cl) 543 507 557 168 547
Bromide (Br) 0.8 1.5 1.9 0.8 1.9
Nitrate (NO3) <0.1 <0.1 0.1 <0.1 <0.1
Nitrite (NO2) 0.0136 <0.0003 0.0029 0.0021 <0.0003
Ammonium (NH4) 0.77 1.47 0.96 2.29 1.30
Silica (SiO2) 412 370 476 321 351
Boron (B) 8.87 7.72 8.71 3.09 8.42
Aluminum (Al) 1.15 3.97 1.23 13.9 2.14
Iron total (Fe(T)) 1.47 9.91 1.85 9.08 1.91
Ferrous iron (Fe(II)) 1.26 9.76 1.85 1.11 1.85
Manganese (Mn) 0.036 0.064 0.028 0.068 0.022
Copper (Cu) <0.0005 <0.0005 <0.0005 <0.0005 <0.0005
Zinc (Zn) 0.014 0.027 0.011 0.026 0.005
Cadmium (Cd) 0.0003 0.0003 0.0001 0.0002 0.0002
Chromium (Cr) 0.0027 0.0159 0.0044 0.0155 0.0039
Cobalt (Co) 0.0012 <0.0007 <0.0007 0.0030 <0.0007
Mercury (Hg), ng/L --- --- 66 82 84
Nickel (Ni) 0.004 0.003 <0.002 0.003 <0.002
Lead (Pb) 0.0019 0.0048 0.0024 0.0026 0.0026
Beryllium (Be) 0.002 0.003 0.001 0.002 <0.001
Vanadium (V) <0.002 <0.002 <0.002 0.003 <0.002
Molybdenum (Mo) --- --- 0.221 <0.007 0.092
Antimony (Sb) 0.186 0.206 0.136 0.029 0.165
Selenium (Se) <0.001 0.002 <0.001 <0.001 <0.001
Arsenic total (As(T)) 1.99 3.40 2.75 1.76 2.26
Arsenite (As(III)) 0.200 3.37 1.38 0.128 2.00
Dissolved organic carbon (DOC) 0.9 1.0 1.3 1.5 1.5
δD, per mil -138 -133 -137 -120 -140
δ18O, per mil -13.9 -12.4 -13.8 -9.4 -14.8
sum cations, meq/L 16.9 16.8 17.7 13.6 17.1
sum anions, meq/L 17.5 17.0 17.7 13.5 17.2
Charge imbalance, percent -3.8 -0.8 -0.2 0.6 -0.3
1 Except for acidity (mM), mercury (ng/L), polythionate (mM), and δD and δ18O (per mil)
----------------------------------------------------Ragged Hills Area---------------------------------------------------
48
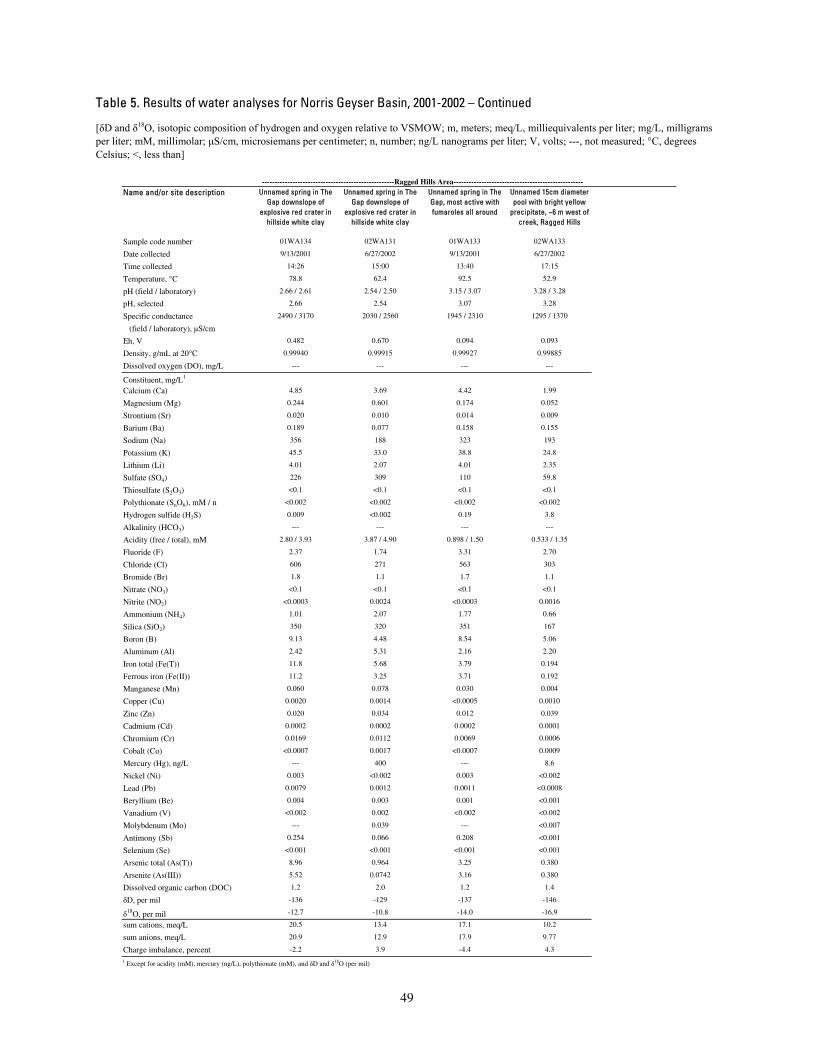
Table 5. Results of water analyses for Norris Geyser Basin, 2001-2002 – Continued
[δD and δ18O, isotopic composition of hydrogen and oxygen relative to VSMOW; m, meters; meq/L, milliequivalents per liter; mg/L, milligrams per liter; mM, millimolar; μS/cm, microsiemans per centimeter; n, number; ng/L nanograms per liter; V, volts; ---, not measured; °C, degrees Celsius; <, less than]
Name and/or site description Unnamed spring in The Gap downslope of
explosive red crater in hillside white clay
Unnamed spring in The Gap downslope of
explosive red crater in hillside white clay
Unnamed spring in The Gap, most active with fumaroles all around
Unnamed 15cm diameter pool with bright yellow
precipitate, ~6 m west of creek, Ragged Hills
Sample code number 01WA134 02WA131 01WA133 02WA133
Date collected 9/13/2001 6/27/2002 9/13/2001 6/27/2002
Time collected 14:26 15:00 13:40 17:15
Temperature, °C 78.8 62.4 92.5 52.9
pH (field / laboratory) 2.66 / 2.61 2.54 / 2.50 3.15 / 3.07 3.28 / 3.28
pH, selected 2.66 2.54 3.07 3.28
Specific conductance 2490 / 3170 2030 / 2560 1945 / 2310 1295 / 1370
(field / laboratory), μS/cm
Eh, V 0.482 0.670 0.094 0.093
Density, g/mL at 20°C 0.99940 0.99915 0.99927 0.99885
Dissolved oxygen (DO), mg/L --- --- --- ---
Constituent, mg/L1
Calcium (Ca) 4.85 3.69 4.42 1.99
Magnesium (Mg) 0.244 0.601 0.174 0.052
Strontium (Sr) 0.020 0.010 0.014 0.009
Barium (Ba) 0.189 0.077 0.158 0.155
Sodium (Na) 356 188 323 193
Potassium (K) 45.5 33.0 38.8 24.8
Lithium (Li) 4.01 2.07 4.01 2.35
Sulfate (SO4) 226 309 110 59.8
Thiosulfate (S2O3) <0.1 <0.1 <0.1 <0.1
Polythionate (SnO6), mM / n <0.002 <0.002 <0.002 <0.002
Hydrogen sulfide (H2S) 0.009 <0.002 0.19 3.8
Alkalinity (HCO3) --- --- --- ---
Acidity (free / total), mM 2.80 / 3.93 3.87 / 4.90 0.898 / 1.50 0.533 / 1.35
Fluoride (F) 2.37 1.74 3.31 2.70
Chloride (Cl) 606 271 563 303
Bromide (Br) 1.8 1.1 1.7 1.1
Nitrate (NO3) <0.1 <0.1 <0.1 <0.1
Nitrite (NO2) <0.0003 0.0024 <0.0003 0.0016
Ammonium (NH4) 1.01 2.07 1.77 0.66
Silica (SiO2) 350 320 351 167
Boron (B) 9.13 4.48 8.54 5.06
Aluminum (Al) 2.42 5.31 2.16 2.20
Iron total (Fe(T)) 11.8 5.68 3.79 0.194
Ferrous iron (Fe(II)) 11.2 3.25 3.71 0.192
Manganese (Mn) 0.060 0.078 0.030 0.004
Copper (Cu) 0.0020 0.0014 <0.0005 0.0010
Zinc (Zn) 0.020 0.034 0.012 0.039
Cadmium (Cd) 0.0002 0.0002 0.0002 0.0001
Chromium (Cr) 0.0169 0.0112 0.0069 0.0006
Cobalt (Co) <0.0007 0.0017 <0.0007 0.0009
Mercury (Hg), ng/L --- 400 --- 8.6
Nickel (Ni) 0.003 <0.002 0.003 <0.002
Lead (Pb) 0.0079 0.0012 0.0011 <0.0008
Beryllium (Be) 0.004 0.003 0.001 <0.001
Vanadium (V) <0.002 0.002 <0.002 <0.002
Molybdenum (Mo) --- 0.039 --- <0.007
Antimony (Sb) 0.254 0.066 0.208 <0.001
Selenium (Se) <0.001 <0.001 <0.001 <0.001
Arsenic total (As(T)) 8.96 0.964 3.25 0.380
Arsenite (As(III)) 5.52 0.0742 3.16 0.380
Dissolved organic carbon (DOC) 1.2 2.0 1.2 1.4
δD, per mil -136 -129 -137 -146
δ18O, per mil -12.7 -10.8 -14.0 -16.9
sum cations, meq/L 20.5 13.4 17.1 10.2
sum anions, meq/L 20.9 12.9 17.9 9.77
Charge imbalance, percent -2.2 3.9 -4.4 4.3
1 Except for acidity (mM), mercury (ng/L), polythionate (mM), and δD and δ18O (per mil)
----------------------------------------------------Ragged Hills Area---------------------------------------------------
49

Table 5. Results of water analyses for Norris Geyser Basin, 2001-2002 – Continued
[δD and δ18O, isotopic composition of hydrogen and oxygen relative to VSMOW; m, meters; meq/L, milliequivalents per liter; mg/L, milligrams per liter; mM, millimolar; μS/cm, microsiemans per centimeter; n, number; ng/L nanograms per liter; V, volts; ---, not measured; °C, degrees Celsius; <, less than]
Name and/or site description "Sperm Spring" Gibbon River - at highway 89 bridge
Gibbon River - downstream of Norris
Geyser BasinSample code number 01WA175 01WA178 01WA177
Date collected 10/23/2001 10/23/2001 10/23/2001
Time collected 12:04 13:55 13:19
Temperature, °C 88.0 5.8 9.2
pH (field / laboratory) 7.65 / --- 7.01 / --- 6.72 / ---
pH, selected --- --- ---
Specific conductance 1375 / --- 142 / --- 535 / ---
(field / laboratory), μS/cm
Eh, V --- --- ---
Density, g/mL at 20°C --- --- ---
Dissolved oxygen (DO), mg/L --- --- ---
Constituent, mg/L1
Calcium (Ca) --- --- ---
Magnesium (Mg) --- --- ---
Strontium (Sr) --- --- ---
Barium (Ba) --- --- ---
Sodium (Na) --- --- ---
Potassium (K) --- --- ---
Lithium (Li) --- --- ---
Sulfate (SO4) --- --- ---
Thiosulfate (S2O3) --- --- ---
Polythionate (SnO6), mM / n --- --- ---
Hydrogen sulfide (H2S) --- --- ---
Alkalinity (HCO3) --- --- ---
Acidity (free / total), mM --- / --- --- / --- --- / ---
Fluoride (F) --- --- ---
Chloride (Cl) --- --- ---
Bromide (Br) --- --- ---
Nitrate (NO3) --- --- ---
Nitrite (NO2) --- --- ---
Ammonium (NH4) --- --- ---
Silica (SiO2) --- --- ---
Boron (B) --- --- ---
Aluminum (Al) --- --- ---
Iron total (Fe(T)) --- --- ---
Ferrous iron (Fe(II)) --- --- ---
Manganese (Mn) --- --- ---
Copper (Cu) --- --- ---
Zinc (Zn) --- --- ---
Cadmium (Cd) --- --- ---
Chromium (Cr) --- --- ---
Cobalt (Co) --- --- ---
Mercury (Hg), ng/L 14.3 3.4 14.4
Nickel (Ni) --- --- ---
Lead (Pb) --- --- ---
Beryllium (Be) --- --- ---
Vanadium (V) --- --- ---
Molybdenum (Mo) --- --- ---
Antimony (Sb) --- --- ---
Selenium (Se) --- --- ---
Arsenic total (As(T)) --- --- ---
Arsenite (As(III)) --- --- ---
Dissolved organic carbon (DOC) --- --- ---
δD, per mil --- --- ---
δ18O, per mil --- --- ---
sum cations, meq/L --- --- ---
sum anions, meq/L --- --- ---
Charge imbalance, percent --- --- ---
1 Except for acidity (mM), mercury (ng/L), polythionate (mM), and δD and δ18O (per mil)
50
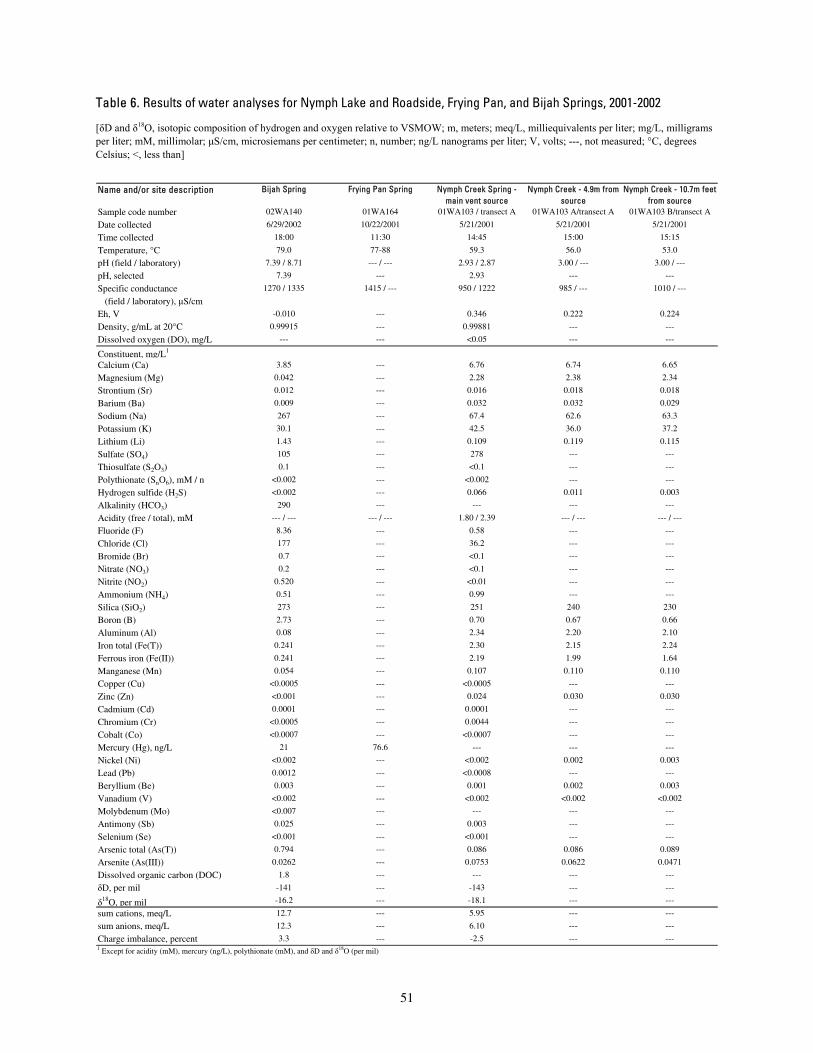
Table 6. Results of water analyses for Nymph Lake and Roadside, Frying Pan, and Bijah Springs, 2001-2002
[δD and δ18O, isotopic composition of hydrogen and oxygen relative to VSMOW; m, meters; meq/L, milliequivalents per liter; mg/L, milligrams per liter; mM, millimolar; μS/cm, microsiemans per centimeter; n, number; ng/L nanograms per liter; V, volts; ---, not measured; °C, degrees Celsius; <, less than]
Name and/or site description Bijah Spring Frying Pan Spring Nymph Creek Spring - main vent source
Nymph Creek - 4.9m from source
Nymph Creek - 10.7m feet from source
Sample code number 02WA140 01WA164 01WA103 / transect A 01WA103 A/transect A 01WA103 B/transect A
Date collected 6/29/2002 10/22/2001 5/21/2001 5/21/2001 5/21/2001
Time collected 18:00 11:30 14:45 15:00 15:15
Temperature, °C 79.0 77-88 59.3 56.0 53.0
pH (field / laboratory) 7.39 / 8.71 --- / --- 2.93 / 2.87 3.00 / --- 3.00 / ---
pH, selected 7.39 --- 2.93 --- ---
Specific conductance 1270 / 1335 1415 / --- 950 / 1222 985 / --- 1010 / ---
(field / laboratory), μS/cm Eh, V -0.010 --- 0.346 0.222 0.224
Density, g/mL at 20°C 0.99915 --- 0.99881 --- ---
Dissolved oxygen (DO), mg/L --- --- <0.05 --- ---
Constituent, mg/L1
Calcium (Ca) 3.85 --- 6.76 6.74 6.65
Magnesium (Mg) 0.042 --- 2.28 2.38 2.34
Strontium (Sr) 0.012 --- 0.016 0.018 0.018
Barium (Ba) 0.009 --- 0.032 0.032 0.029
Sodium (Na) 267 --- 67.4 62.6 63.3
Potassium (K) 30.1 --- 42.5 36.0 37.2
Lithium (Li) 1.43 --- 0.109 0.119 0.115
Sulfate (SO4) 105 --- 278 --- ---
Thiosulfate (S2O3) 0.1 --- <0.1 --- ---
Polythionate (SnO6), mM / n <0.002 --- <0.002 --- ---
Hydrogen sulfide (H2S) <0.002 --- 0.066 0.011 0.003
Alkalinity (HCO3) 290 --- --- --- ---
Acidity (free / total), mM --- / --- --- / --- 1.80 / 2.39 --- / --- --- / ---
Fluoride (F) 8.36 --- 0.58 --- ---
Chloride (Cl) 177 --- 36.2 --- ---
Bromide (Br) 0.7 --- <0.1 --- ---
Nitrate (NO3) 0.2 --- <0.1 --- ---
Nitrite (NO2) 0.520 --- <0.01 --- ---
Ammonium (NH4) 0.51 --- 0.99 --- ---
Silica (SiO2) 273 --- 251 240 230
Boron (B) 2.73 --- 0.70 0.67 0.66
Aluminum (Al) 0.08 --- 2.34 2.20 2.10
Iron total (Fe(T)) 0.241 --- 2.30 2.15 2.24
Ferrous iron (Fe(II)) 0.241 --- 2.19 1.99 1.64
Manganese (Mn) 0.054 --- 0.107 0.110 0.110
Copper (Cu) <0.0005 --- <0.0005 --- ---
Zinc (Zn) <0.001 --- 0.024 0.030 0.030
Cadmium (Cd) 0.0001 --- 0.0001 --- ---
Chromium (Cr) <0.0005 --- 0.0044 --- ---
Cobalt (Co) <0.0007 --- <0.0007 --- ---
Mercury (Hg), ng/L 21 76.6 --- --- ---
Nickel (Ni) <0.002 --- <0.002 0.002 0.003
Lead (Pb) 0.0012 --- <0.0008 --- ---
Beryllium (Be) 0.003 --- 0.001 0.002 0.003
Vanadium (V) <0.002 --- <0.002 <0.002 <0.002
Molybdenum (Mo) <0.007 --- --- --- ---
Antimony (Sb) 0.025 --- 0.003 --- ---
Selenium (Se) <0.001 --- <0.001 --- ---
Arsenic total (As(T)) 0.794 --- 0.086 0.086 0.089
Arsenite (As(III)) 0.0262 --- 0.0753 0.0622 0.0471
Dissolved organic carbon (DOC) 1.8 --- --- --- ---
δD, per mil -141 --- -143 --- ---
δ18O, per mil -16.2 --- -18.1 --- ---
sum cations, meq/L 12.7 --- 5.95 --- ---
sum anions, meq/L 12.3 --- 6.10 --- ---
Charge imbalance, percent 3.3 --- -2.5 --- ---1 Except for acidity (mM), mercury (ng/L), polythionate (mM), and δD and δ18O (per mil)
51

Table 6. Results of water analyses for Nymph Lake and Roadside, Frying Pan, and Bijah Springs, 2001-2002 – Continued
[δD and δ18O, isotopic composition of hydrogen and oxygen relative to VSMOW; m, meters; meq/L, milliequivalents per liter; mg/L, milligrams per liter; mM, millimolar; μS/cm, microsiemans per centimeter; n, number; ng/L nanograms per liter; V, volts; ---, not measured; °C, degrees Celsius; <, less than]
Name and/or site description Nymph Creek - 19.5m from source
Nymph Creek - 32m from source
Nymph Creek - secondary source
Nymph Creek - 3.4m from secondary source
Nymph Creek - 4.9m from secondary source
Sample code number 01WA103 C/transect A 01WA104 / transect A 01WA122 / transect C 01WA121B / transect C 01WA121A / transect C
Date collected 5/21/2001 5/21/2001 9/10/2001 9/10/2001 9/10/2001
Time collected 15:30 16:00 16:30 15:00 15:00
Temperature, °C 50.0 47.0 61.6 55.5 54.7
pH (field / laboratory) 2.99 / --- 2.99 / 2.88 2.88 / 2.84 2.87 / --- 2.81 / ---
pH, selected --- 2.99 2.88 --- ---
Specific conductance 1030 / --- 1060 / 1216 968 / 1257 1005 / --- --- / ---
(field / laboratory), μS/cm Eh, V 0.227 0.229 0.322 0.592 0.643
Density, g/mL at 20°C --- 0.99871 0.99862 --- ---
Dissolved oxygen (DO), mg/L --- <4.1 --- --- ---
Constituent, mg/L1
Calcium (Ca) 6.87 7.01 6.45 --- ---
Magnesium (Mg) 2.25 2.34 2.37 --- ---
Strontium (Sr) 0.015 0.016 0.017 --- ---
Barium (Ba) 0.030 0.031 0.033 --- ---
Sodium (Na) 62.2 71.2 71.2 --- ---
Potassium (K) 39.3 45.9 45.4 --- ---
Lithium (Li) 0.112 0.130 0.128 --- ---
Sulfate (SO4) --- 280 301 --- ---
Thiosulfate (S2O3) --- <0.1 --- --- ---
Polythionate (SnO6), mM / n --- <0.002 <0.002 --- ---
Hydrogen sulfide (H2S) 0.003 <0.002 0.17 0.021 0.008
Alkalinity (HCO3) --- --- --- --- ---
Acidity (free / total), mM --- / --- 1.76 / 2.24 1.79 / 2.26 --- / --- --- / ---
Fluoride (F) --- 0.59 0.72 --- ---
Chloride (Cl) --- 33.9 42.1 --- ---
Bromide (Br) --- <0.03 0.2 --- ---
Nitrate (NO3) --- <0.1 <0.1 --- ---
Nitrite (NO2) --- <0.01 <0.0003 <0.0003 0.0004
Ammonium (NH4) --- 0.91 1.21 --- ---
Silica (SiO2) 240 231 243 --- ---
Boron (B) 0.67 0.69 0.85 --- ---
Aluminum (Al) 2.30 2.42 2.21 --- ---
Iron total (Fe(T)) 2.19 2.09 3.26 3.25 3.22
Ferrous iron (Fe(II)) 0.950 0.746 3.26 2.80 1.79
Manganese (Mn) 0.110 0.111 0.113 --- ---
Copper (Cu) --- <0.0005 <0.0005 --- ---
Zinc (Zn) 0.032 0.025 0.023 --- ---
Cadmium (Cd) --- 0.0001 <0.0001 --- ---
Chromium (Cr) --- 0.0042 0.0074 --- ---
Cobalt (Co) --- <0.0007 <0.0007 --- ---
Mercury (Hg), ng/L --- --- --- --- ---
Nickel (Ni) <0.002 <0.002 0.002 --- ---
Lead (Pb) --- <0.0008 <0.0008 --- ---
Beryllium (Be) 0.002 0.002 0.002 --- ---
Vanadium (V) <0.002 <0.002 <0.002 --- ---
Molybdenum (Mo) --- --- --- --- ---
Antimony (Sb) --- 0.002 0.004 --- ---
Selenium (Se) --- <0.001 <0.001 --- ---
Arsenic total (As(T)) 0.0830 0.0811 0.138 0.139 0.141
Arsenite (As(III)) 0.0169 0.0101 0.134 0.0927 0.0525
Dissolved organic carbon (DOC) --- --- 0.9 --- ---
δD, per mil --- -141 -142 --- ---
δ18O, per mil --- -17.7 -17.9 --- ---
sum cations, meq/L --- 6.03 6.37 --- ---
sum anions, meq/L --- 6.19 6.63 --- ---
Charge imbalance, percent --- -2.6 -4.0 --- ---1 Except for acidity (mM), mercury (ng/L), polythionate (mM), and δD and δ18O (per mil)
52

Table 6. Results of water analyses for Nymph Lake and Roadside, Frying Pan, and Bijah Springs, 2001-2002 – Continued
[δD and δ18O, isotopic composition of hydrogen and oxygen relative to VSMOW; m, meters; meq/L, milliequivalents per liter; mg/L, milligrams per liter; mM, millimolar; μS/cm, microsiemans per centimeter; n, number; ng/L nanograms per liter; V, volts; ---, not measured; °C, degrees Celsius; <, less than]
Name and/or site description Nymph Creek - 7.0m from secondary source
Nymph Creek - 12.8m from secondary source
Nymph Creek - 22m from secondary source
Nymph Creek - secondary source
Nymph Creek - 3.4m from secondary source
Sample code number 01WA121 / transect C 01WA120A / transect C 01WA120 / transect C 01WA123E / transect D 01WA123D / transect D
Date collected 9/10/2001 9/10/2001 9/10/2001 9/10/2001 9/10/2001
Time collected 15:00 13:30 13:00 22:30 22:30
Temperature, °C 51.1 45.0 38.0 61.5 53.8
pH (field / laboratory) 2.83 / 2.83 2.83 / --- 2.89 / 2.81 2.95 / --- 2.91 / ---
pH, selected 2.83 --- 2.81 --- ---
Specific conductance 1230 / 1283 1124 / --- 1230 / 1308 973 / --- 1045 / ---
(field / laboratory), μS/cm Eh, V 0.701 0.716 0.734 0.356 0.694
Density, g/mL at 20°C 0.99850 --- 0.99878 --- ---
Dissolved oxygen (DO), mg/L --- --- --- --- ---
Constituent, mg/L1
Calcium (Ca) 6.59 --- 6.74 --- ---
Magnesium (Mg) 2.43 --- 2.47 --- ---
Strontium (Sr) 0.017 --- 0.018 --- ---
Barium (Ba) 0.034 --- 0.032 --- ---
Sodium (Na) 70.9 --- 72.6 --- ---
Potassium (K) 45.0 --- 43.9 --- ---
Lithium (Li) 0.127 --- 0.131 --- ---
Sulfate (SO4) 302 --- 301 --- ---
Thiosulfate (S2O3) --- --- --- --- ---
Polythionate (SnO6), mM / n <0.002 --- --- --- ---
Hydrogen sulfide (H2S) <0.002 <0.002 <0.002 --- ---
Alkalinity (HCO3) --- --- --- --- ---
Acidity (free / total), mM 1.82 / 2.26 --- / --- 1.89 / 2.39 --- / --- --- / ---
Fluoride (F) 0.63 --- 4.05 --- ---
Chloride (Cl) 42.6 --- 43.8 --- ---
Bromide (Br) 0.2 --- 0.2 --- ---
Nitrate (NO3) <0.1 --- <0.1 --- ---
Nitrite (NO2) 0.0006 0.0007 0.0013 <0.0003 <0.0003
Ammonium (NH4) 1.14 --- 1.12 --- ---
Silica (SiO2) 252 --- 254 --- ---
Boron (B) 0.88 --- 0.88 --- ---
Aluminum (Al) 2.29 --- 2.30 --- ---
Iron total (Fe(T)) 3.23 3.20 3.12 3.31 3.37
Ferrous iron (Fe(II)) 1.06 0.737 0.437 3.27 2.24
Manganese (Mn) 0.117 --- 0.121 --- ---
Copper (Cu) 0.0019 --- <0.0005 --- ---
Zinc (Zn) 0.024 --- 0.024 --- ---
Cadmium (Cd) 0.0002 --- 0.0001 --- ---
Chromium (Cr) 0.0070 --- 0.0065 --- ---
Cobalt (Co) <0.0007 --- <0.0007 --- ---
Mercury (Hg), ng/L --- --- --- --- ---
Nickel (Ni) 0.003 --- 0.003 --- ---
Lead (Pb) <0.0008 --- <0.0008 --- ---
Beryllium (Be) 0.003 --- 0.002 --- ---
Vanadium (V) <0.002 --- <0.002 --- ---
Molybdenum (Mo) --- --- --- --- ---
Antimony (Sb) 0.003 --- 0.004 --- ---
Selenium (Se) <0.001 --- <0.001 --- ---
Arsenic total (As(T)) 0.138 0.134 0.132 0.142 0.148
Arsenite (As(III)) 0.0262 0.0121 0.0071 0.139 0.0721
Dissolved organic carbon (DOC) 0.8 --- 1.2 --- ---
δD, per mil -142 --- -140 --- ---
δ18O, per mil -17.6 --- -17.3 --- ---
sum cations, meq/L 6.54 --- 6.62 --- ---
sum anions, meq/L 6.72 --- 6.92 --- ---
Charge imbalance, percent -2.7 --- -4.4 --- ---1 Except for acidity (mM), mercury (ng/L), polythionate (mM), and δD and δ18O (per mil)
53

Table 6. Results of water analyses for Nymph Lake and Roadside, Frying Pan, and Bijah Springs, 2001-2002 – Continued
[δD and δ18O, isotopic composition of hydrogen and oxygen relative to VSMOW; m, meters; meq/L, milliequivalents per liter; mg/L, milligrams per liter; mM, millimolar; μS/cm, microsiemans per centimeter; n, number; ng/L nanograms per liter; V, volts; ---, not measured; °C, degrees Celsius; <, less than]
Name and/or site description Nymph Creek - 4.9m from secondary source
Nymph Creek - 7.0m from secondary source
Nymph Creek - 12.8m from secondary source
Nymph Creek - 22m from secondary source
Nymph Creek - source
Sample code number 01WA123C / transect D 01WA123B / transect D 01WA123A / transect D 01WA123 / transect D 02WA138 / transect G
Date collected 9/10/2001 9/10/2001 9/10/2001 9/10/2001 6/29/2002
Time collected 22:30 22:30 22:30 22:30 13:30
Temperature, °C 52.0 50.0 43.1 35.5 ---
pH (field / laboratory) 2.91 / --- 2.91 / --- 2.92 / --- 2.93 / 2.81 2.93 / 2.87
pH, selected --- --- --- 2.81 2.93
Specific conductance 1047 / --- 1073 / --- 1126 / --- 1183 / 1310 --- / 1256
(field / laboratory), μS/cm Eh, V 0.682 0.729 0.745 0.738 ---
Density, g/mL at 20°C --- --- --- 0.99875 0.99886
Dissolved oxygen (DO), mg/L --- --- --- --- ---
Constituent, mg/L1
Calcium (Ca) --- --- --- 6.63 6.26
Magnesium (Mg) --- --- --- 2.47 2.15
Strontium (Sr) --- --- --- 0.016 0.017
Barium (Ba) --- --- --- 0.031 0.030
Sodium (Na) --- --- --- 73.6 71.0
Potassium (K) --- --- --- 47.5 42.6
Lithium (Li) --- --- --- 0.130 0.123
Sulfate (SO4) --- --- --- 301 271
Thiosulfate (S2O3) --- --- --- --- <0.1
Polythionate (SnO6), mM / n --- --- --- --- <0.002
Hydrogen sulfide (H2S) --- --- --- <0.002 0.12
Alkalinity (HCO3) --- --- --- --- ---
Acidity (free / total), mM --- / --- --- / --- --- / --- 1.85 / 2.31 1.56 / 2.67
Fluoride (F) --- --- --- 0.66 1.40
Chloride (Cl) --- --- --- 42.8 34.5
Bromide (Br) --- --- --- 0.2 0.3
Nitrate (NO3) --- --- --- 0.4 <0.1
Nitrite (NO2) <0.0003 <0.0003 <0.0003 <0.0003 0.0031
Ammonium (NH4) --- --- --- 1.24 0.50
Silica (SiO2) --- --- --- 251 226
Boron (B) --- --- --- 0.85 0.82
Aluminum (Al) --- --- --- 2.29 2.00
Iron total (Fe(T)) 3.33 3.48 3.37 3.38 2.33
Ferrous iron (Fe(II)) 1.60 1.44 0.877 0.483 2.32
Manganese (Mn) --- --- --- 0.117 0.106
Copper (Cu) --- --- --- <0.0005 <0.0005
Zinc (Zn) --- --- --- 0.024 0.018
Cadmium (Cd) --- --- --- <0.0001 <0.0001
Chromium (Cr) --- --- --- 0.0078 0.0050
Cobalt (Co) --- --- --- <0.0007 <0.0007
Mercury (Hg), ng/L --- --- --- --- ---
Nickel (Ni) --- --- --- 0.003 <0.002
Lead (Pb) --- --- --- <0.0008 <0.0008
Beryllium (Be) --- --- --- 0.002 0.002
Vanadium (V) --- --- --- <0.002 <0.002
Molybdenum (Mo) --- --- --- --- <0.007
Antimony (Sb) --- --- --- 0.004 0.002
Selenium (Se) --- --- --- 0.001 <0.001
Arsenic total (As(T)) 0.141 0.151 0.136 0.136 0.102
Arsenite (As(III)) 0.0566 0.0423 0.0285 0.0171 0.0851
Dissolved organic carbon (DOC) --- --- --- 1.0 1.5
δD, per mil --- --- --- --- -144
δ18O, per mil --- --- --- --- -18.0
sum cations, meq/L --- --- --- 6.83 6.04
sum anions, meq/L --- --- --- 6.83 6.06
Charge imbalance, percent --- --- --- 0.0 -0.31 Except for acidity (mM), mercury (ng/L), polythionate (mM), and δD and δ18O (per mil)
54

Table 6. Results of water analyses for Nymph Lake and Roadside, Frying Pan, and Bijah Springs, 2001-2002 – Continued
[δD and δ18O, isotopic composition of hydrogen and oxygen relative to VSMOW; m, meters; meq/L, milliequivalents per liter; mg/L, milligrams per liter; mM, millimolar; μS/cm, microsiemans per centimeter; n, number; ng/L nanograms per liter; V, volts; ---, not measured; °C, degrees Celsius; <, less than]
Name and/or site description Nymph Creek - 1.6m from source
Nymph Creek - 2.4m from source
Nymph Creek - 3.4m from source
Nymph Creek - 4.5m from source
Nymph Creek - source
Sample code number 02WA137D / transect G 02WA137C / transect G 02WA137B / transect G 02WA137A / transect G 01WA165
Date collected 6/29/2002 6/29/2002 6/29/2002 6/29/2002 10/22/2001
Time collected 13:00 12:45 12:30 12:15 12:50
Temperature, °C --- --- --- 52.3 61.0
pH (field / laboratory) 2.93 / --- 2.93 / --- 2.93 / --- 2.93 / 2.88 2.86 / ---
pH, selected --- --- --- 2.93 ---
Specific conductance 960 / --- 954 / --- 970 / --- 985 / 1158 977 / ---
(field / laboratory), μS/cm Eh, V --- --- --- 0.130 ---
Density, g/mL at 20°C --- --- --- 0.99878 ---
Dissolved oxygen (DO), mg/L --- --- --- --- ---
Constituent, mg/L1
Calcium (Ca) --- --- --- 6.29 ---
Magnesium (Mg) --- --- --- 2.17 ---
Strontium (Sr) --- --- --- 0.017 ---
Barium (Ba) --- --- --- 0.030 ---
Sodium (Na) --- --- --- 75.5 ---
Potassium (K) --- --- --- 45.3 ---
Lithium (Li) --- --- --- 0.118 ---
Sulfate (SO4) --- --- --- 280 ---
Thiosulfate (S2O3) <0.1 <0.1 <0.1 <0.1 ---
Polythionate (SnO6), mM / n <0.002 <0.002 <0.002 <0.002 ---
Hydrogen sulfide (H2S) --- --- --- <0.002 ---
Alkalinity (HCO3) --- --- --- --- ---
Acidity (free / total), mM --- / --- --- / --- --- / --- 1.61 / 2.13 --- / ---
Fluoride (F) --- --- --- 0.77 ---
Chloride (Cl) --- --- --- 35.3 ---
Bromide (Br) --- --- --- 0.3 ---
Nitrate (NO3) --- --- --- <0.1 ---
Nitrite (NO2) 0.0029 0.0020 0.0027 0.0028 ---
Ammonium (NH4) 1.28 1.26 1.31 1.23 ---
Silica (SiO2) --- --- --- 231 ---
Boron (B) --- --- --- 0.97 ---
Aluminum (Al) --- --- --- 2.04 ---
Iron total (Fe(T)) 2.32 2.30 2.26 2.38 ---
Ferrous iron (Fe(II)) 2.17 1.73 1.33 1.12 ---
Manganese (Mn) --- --- --- 0.106 ---
Copper (Cu) --- --- --- 0.0128 ---
Zinc (Zn) --- --- --- 0.024 ---
Cadmium (Cd) --- --- --- 0.0005 ---
Chromium (Cr) --- --- --- 0.0048 ---
Cobalt (Co) --- --- --- 0.0009 ---
Mercury (Hg), ng/L --- --- --- --- 10.9
Nickel (Ni) --- --- --- <0.002 ---
Lead (Pb) --- --- --- <0.0008 ---
Beryllium (Be) --- --- --- 0.002 ---
Vanadium (V) --- --- --- <0.002 ---
Molybdenum (Mo) --- --- --- <0.007 ---
Antimony (Sb) --- --- --- 0.002 ---
Selenium (Se) --- --- --- <0.001 ---
Arsenic total (As(T)) 0.107 0.107 0.105 0.105 ---
Arsenite (As(III)) 0.0628 0.0534 0.0304 0.0265 ---
Dissolved organic carbon (DOC) --- --- --- 1.4 ---
δD, per mil --- --- --- -142 ---
δ18O, per mil --- --- --- -17.8 ---
sum cations, meq/L --- --- --- 6.35 ---
sum anions, meq/L --- --- --- 6.21 ---
Charge imbalance, percent --- --- --- 2.3 ---1 Except for acidity (mM), mercury (ng/L), polythionate (mM), and δD and δ18O (per mil)
55
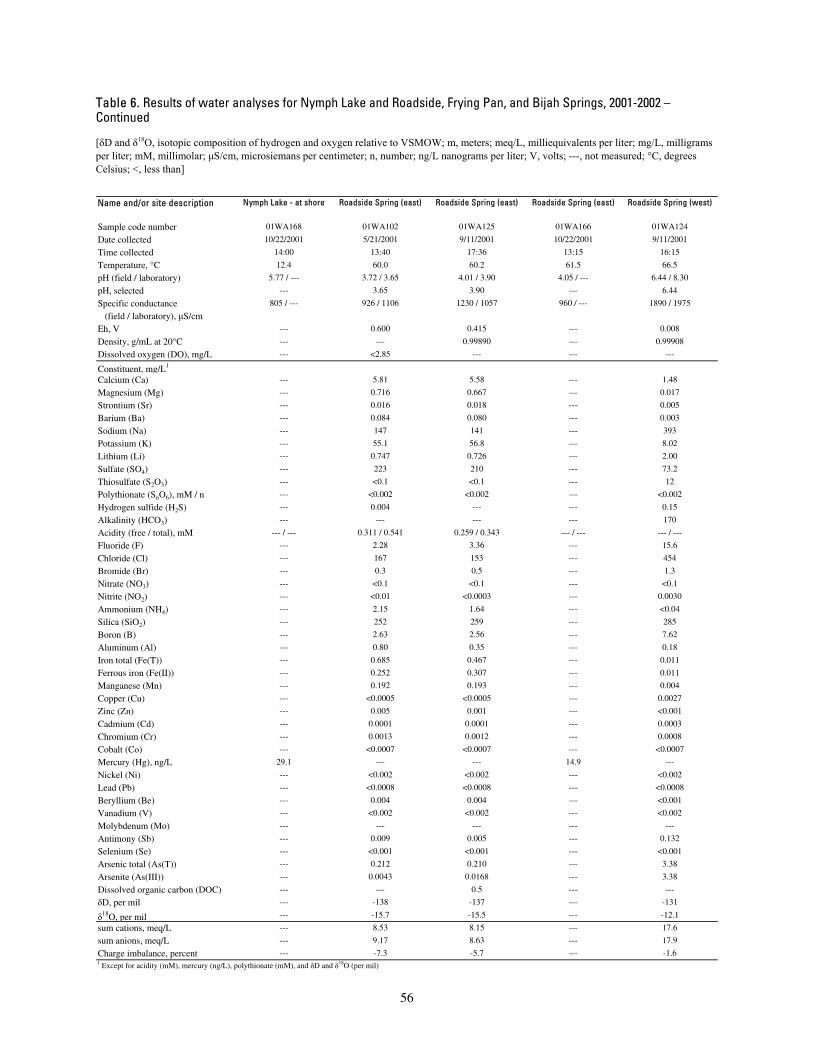
Table 6. Results of water analyses for Nymph Lake and Roadside, Frying Pan, and Bijah Springs, 2001-2002 – Continued
[δD and δ18O, isotopic composition of hydrogen and oxygen relative to VSMOW; m, meters; meq/L, milliequivalents per liter; mg/L, milligrams per liter; mM, millimolar; μS/cm, microsiemans per centimeter; n, number; ng/L nanograms per liter; V, volts; ---, not measured; °C, degrees Celsius; <, less than]
Name and/or site description Nymph Lake - at shore Roadside Spring (east) Roadside Spring (east) Roadside Spring (east) Roadside Spring (west)
Sample code number 01WA168 01WA102 01WA125 01WA166 01WA124
Date collected 10/22/2001 5/21/2001 9/11/2001 10/22/2001 9/11/2001
Time collected 14:00 13:40 17:36 13:15 16:15
Temperature, °C 12.4 60.0 60.2 61.5 66.5
pH (field / laboratory) 5.77 / --- 3.72 / 3.65 4.01 / 3.90 4.05 / --- 6.44 / 8.30
pH, selected --- 3.65 3.90 --- 6.44
Specific conductance 805 / --- 926 / 1106 1230 / 1057 960 / --- 1890 / 1975
(field / laboratory), μS/cm Eh, V --- 0.600 0.415 --- 0.008
Density, g/mL at 20°C --- --- 0.99890 --- 0.99908
Dissolved oxygen (DO), mg/L --- <2.85 --- --- ---
Constituent, mg/L1
Calcium (Ca) --- 5.81 5.58 --- 1.48
Magnesium (Mg) --- 0.716 0.667 --- 0.017
Strontium (Sr) --- 0.016 0.018 --- 0.005
Barium (Ba) --- 0.084 0.080 --- 0.003
Sodium (Na) --- 147 141 --- 393
Potassium (K) --- 55.1 56.8 --- 8.02
Lithium (Li) --- 0.747 0.726 --- 2.00
Sulfate (SO4) --- 223 210 --- 73.2
Thiosulfate (S2O3) --- <0.1 <0.1 --- 12
Polythionate (SnO6), mM / n --- <0.002 <0.002 --- <0.002
Hydrogen sulfide (H2S) --- 0.004 --- --- 0.15
Alkalinity (HCO3) --- --- --- --- 170
Acidity (free / total), mM --- / --- 0.311 / 0.541 0.259 / 0.343 --- / --- --- / ---
Fluoride (F) --- 2.28 3.36 --- 15.6
Chloride (Cl) --- 167 153 --- 454
Bromide (Br) --- 0.3 0.5 --- 1.3
Nitrate (NO3) --- <0.1 <0.1 --- <0.1
Nitrite (NO2) --- <0.01 <0.0003 --- 0.0030
Ammonium (NH4) --- 2.15 1.64 --- <0.04
Silica (SiO2) --- 252 259 --- 285
Boron (B) --- 2.63 2.56 --- 7.62
Aluminum (Al) --- 0.80 0.35 --- 0.18
Iron total (Fe(T)) --- 0.685 0.467 --- 0.011
Ferrous iron (Fe(II)) --- 0.252 0.307 --- 0.011
Manganese (Mn) --- 0.192 0.193 --- 0.004
Copper (Cu) --- <0.0005 <0.0005 --- 0.0027
Zinc (Zn) --- 0.005 0.001 --- <0.001
Cadmium (Cd) --- 0.0001 0.0001 --- 0.0003
Chromium (Cr) --- 0.0013 0.0012 --- 0.0008
Cobalt (Co) --- <0.0007 <0.0007 --- <0.0007
Mercury (Hg), ng/L 29.1 --- --- 14.9 ---
Nickel (Ni) --- <0.002 <0.002 --- <0.002
Lead (Pb) --- <0.0008 <0.0008 --- <0.0008
Beryllium (Be) --- 0.004 0.004 --- <0.001
Vanadium (V) --- <0.002 <0.002 --- <0.002
Molybdenum (Mo) --- --- --- --- ---
Antimony (Sb) --- 0.009 0.005 --- 0.132
Selenium (Se) --- <0.001 <0.001 --- <0.001
Arsenic total (As(T)) --- 0.212 0.210 --- 3.38
Arsenite (As(III)) --- 0.0043 0.0168 --- 3.38
Dissolved organic carbon (DOC) --- --- 0.5 --- ---
δD, per mil --- -138 -137 --- -131
δ18O, per mil --- -15.7 -15.5 --- -12.1
sum cations, meq/L --- 8.53 8.15 --- 17.6
sum anions, meq/L --- 9.17 8.63 --- 17.9
Charge imbalance, percent --- -7.3 -5.7 --- -1.61 Except for acidity (mM), mercury (ng/L), polythionate (mM), and δD and δ18O (per mil)
56
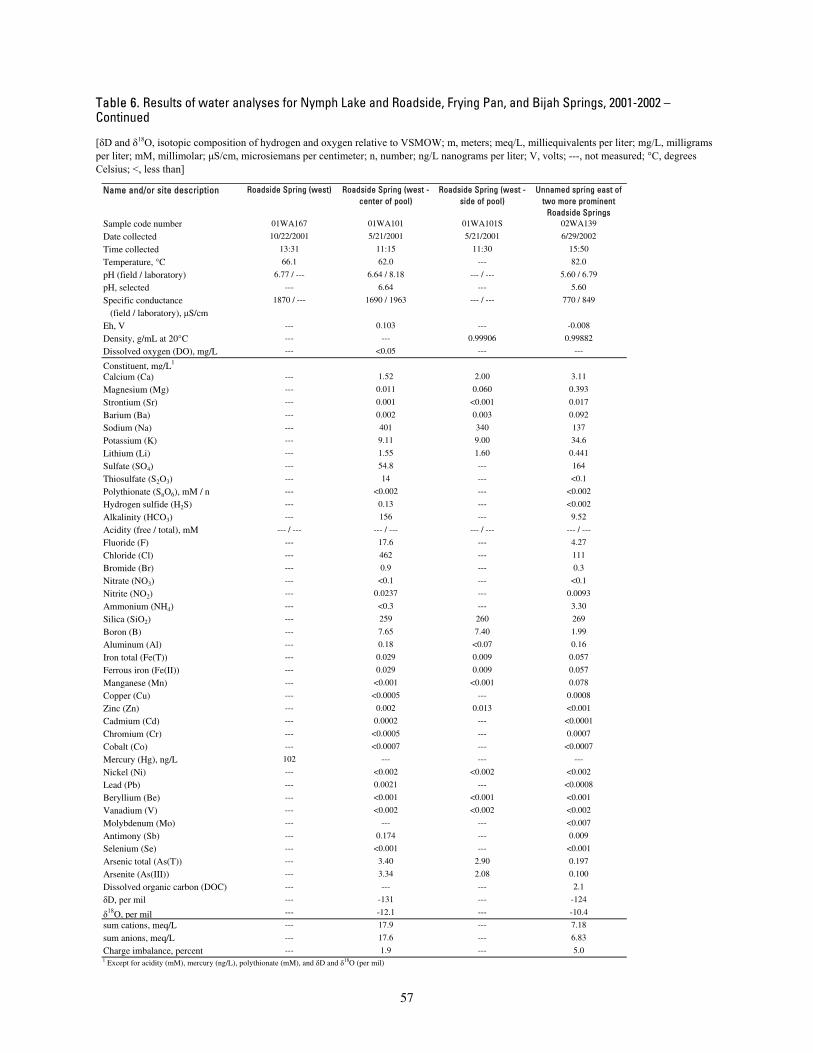
Table 6. Results of water analyses for Nymph Lake and Roadside, Frying Pan, and Bijah Springs, 2001-2002 – Continued
[δD and δ18O, isotopic composition of hydrogen and oxygen relative to VSMOW; m, meters; meq/L, milliequivalents per liter; mg/L, milligrams per liter; mM, millimolar; μS/cm, microsiemans per centimeter; n, number; ng/L nanograms per liter; V, volts; ---, not measured; °C, degrees Celsius; <, less than]
Name and/or site description Roadside Spring (west) Roadside Spring (west - center of pool)
Roadside Spring (west - side of pool)
Unnamed spring east of two more prominent
Roadside Springs Sample code number 01WA167 01WA101 01WA101S 02WA139
Date collected 10/22/2001 5/21/2001 5/21/2001 6/29/2002
Time collected 13:31 11:15 11:30 15:50
Temperature, °C 66.1 62.0 --- 82.0
pH (field / laboratory) 6.77 / --- 6.64 / 8.18 --- / --- 5.60 / 6.79
pH, selected --- 6.64 --- 5.60
Specific conductance 1870 / --- 1690 / 1963 --- / --- 770 / 849
(field / laboratory), μS/cm Eh, V --- 0.103 --- -0.008
Density, g/mL at 20°C --- --- 0.99906 0.99882
Dissolved oxygen (DO), mg/L --- <0.05 --- ---
Constituent, mg/L1
Calcium (Ca) --- 1.52 2.00 3.11
Magnesium (Mg) --- 0.011 0.060 0.393
Strontium (Sr) --- 0.001 <0.001 0.017
Barium (Ba) --- 0.002 0.003 0.092
Sodium (Na) --- 401 340 137
Potassium (K) --- 9.11 9.00 34.6
Lithium (Li) --- 1.55 1.60 0.441
Sulfate (SO4) --- 54.8 --- 164
Thiosulfate (S2O3) --- 14 --- <0.1
Polythionate (SnO6), mM / n --- <0.002 --- <0.002
Hydrogen sulfide (H2S) --- 0.13 --- <0.002
Alkalinity (HCO3) --- 156 --- 9.52
Acidity (free / total), mM --- / --- --- / --- --- / --- --- / ---
Fluoride (F) --- 17.6 --- 4.27
Chloride (Cl) --- 462 --- 111
Bromide (Br) --- 0.9 --- 0.3
Nitrate (NO3) --- <0.1 --- <0.1
Nitrite (NO2) --- 0.0237 --- 0.0093
Ammonium (NH4) --- <0.3 --- 3.30
Silica (SiO2) --- 259 260 269
Boron (B) --- 7.65 7.40 1.99
Aluminum (Al) --- 0.18 <0.07 0.16
Iron total (Fe(T)) --- 0.029 0.009 0.057
Ferrous iron (Fe(II)) --- 0.029 0.009 0.057
Manganese (Mn) --- <0.001 <0.001 0.078
Copper (Cu) --- <0.0005 --- 0.0008
Zinc (Zn) --- 0.002 0.013 <0.001
Cadmium (Cd) --- 0.0002 --- <0.0001
Chromium (Cr) --- <0.0005 --- 0.0007
Cobalt (Co) --- <0.0007 --- <0.0007
Mercury (Hg), ng/L 102 --- --- ---
Nickel (Ni) --- <0.002 <0.002 <0.002
Lead (Pb) --- 0.0021 --- <0.0008
Beryllium (Be) --- <0.001 <0.001 <0.001
Vanadium (V) --- <0.002 <0.002 <0.002
Molybdenum (Mo) --- --- --- <0.007
Antimony (Sb) --- 0.174 --- 0.009
Selenium (Se) --- <0.001 --- <0.001
Arsenic total (As(T)) --- 3.40 2.90 0.197
Arsenite (As(III)) --- 3.34 2.08 0.100
Dissolved organic carbon (DOC) --- --- --- 2.1
δD, per mil --- -131 --- -124
δ18O, per mil --- -12.1 --- -10.4
sum cations, meq/L --- 17.9 --- 7.18
sum anions, meq/L --- 17.6 --- 6.83
Charge imbalance, percent --- 1.9 --- 5.01 Except for acidity (mM), mercury (ng/L), polythionate (mM), and δD and δ18O (per mil)
57
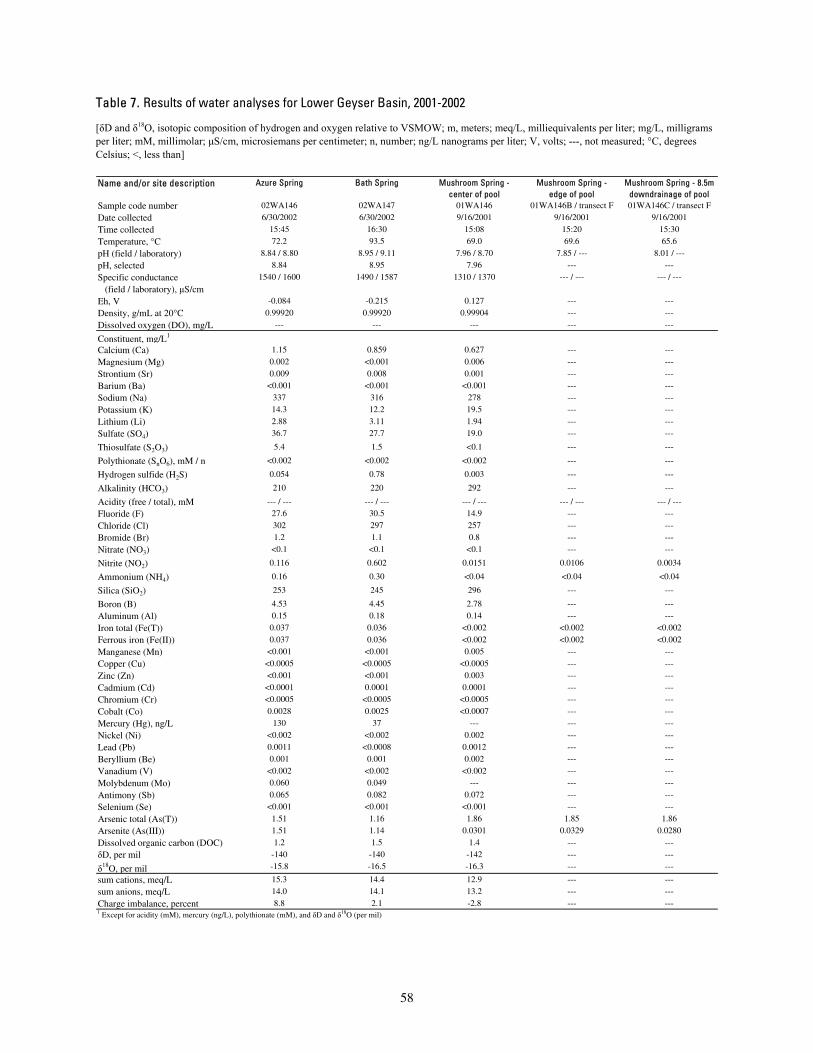
Table 7. Results of water analyses for Lower Geyser Basin, 2001-2002
[δD and δ18O, isotopic composition of hydrogen and oxygen relative to VSMOW; m, meters; meq/L, milliequivalents per liter; mg/L, milligrams per liter; mM, millimolar; μS/cm, microsiemans per centimeter; n, number; ng/L nanograms per liter; V, volts; ---, not measured; °C, degrees Celsius; <, less than]
Name and/or site description Azure Spring Bath Spring Mushroom Spring - center of pool
Mushroom Spring - edge of pool
Mushroom Spring - 8.5m downdrainage of pool
Sample code number 02WA146 02WA147 01WA146 01WA146B / transect F 01WA146C / transect F
Date collected 6/30/2002 6/30/2002 9/16/2001 9/16/2001 9/16/2001
Time collected 15:45 16:30 15:08 15:20 15:30
Temperature, °C 72.2 93.5 69.0 69.6 65.6
pH (field / laboratory) 8.84 / 8.80 8.95 / 9.11 7.96 / 8.70 7.85 / --- 8.01 / ---
pH, selected 8.84 8.95 7.96 --- ---
Specific conductance 1540 / 1600 1490 / 1587 1310 / 1370 --- / --- --- / ---
(field / laboratory), μS/cm Eh, V -0.084 -0.215 0.127 --- ---
Density, g/mL at 20°C 0.99920 0.99920 0.99904 --- ---
Dissolved oxygen (DO), mg/L --- --- --- --- ---
Constituent, mg/L1
Calcium (Ca) 1.15 0.859 0.627 --- ---
Magnesium (Mg) 0.002 <0.001 0.006 --- ---
Strontium (Sr) 0.009 0.008 0.001 --- ---
Barium (Ba) <0.001 <0.001 <0.001 --- ---
Sodium (Na) 337 316 278 --- ---
Potassium (K) 14.3 12.2 19.5 --- ---
Lithium (Li) 2.88 3.11 1.94 --- ---
Sulfate (SO4) 36.7 27.7 19.0 --- ---
Thiosulfate (S2O3) 5.4 1.5 <0.1 --- ---
Polythionate (SnO6), mM / n <0.002 <0.002 <0.002 --- ---
Hydrogen sulfide (H2S) 0.054 0.78 0.003 --- ---
Alkalinity (HCO3) 210 220 292 --- ---
Acidity (free / total), mM --- / --- --- / --- --- / --- --- / --- --- / ---
Fluoride (F) 27.6 30.5 14.9 --- ---
Chloride (Cl) 302 297 257 --- ---
Bromide (Br) 1.2 1.1 0.8 --- ---
Nitrate (NO3) <0.1 <0.1 <0.1 --- ---
Nitrite (NO2) 0.116 0.602 0.0151 0.0106 0.0034
Ammonium (NH4) 0.16 0.30 <0.04 <0.04 <0.04
Silica (SiO2) 253 245 296 --- ---
Boron (B) 4.53 4.45 2.78 --- ---
Aluminum (Al) 0.15 0.18 0.14 --- ---
Iron total (Fe(T)) 0.037 0.036 <0.002 <0.002 <0.002
Ferrous iron (Fe(II)) 0.037 0.036 <0.002 <0.002 <0.002
Manganese (Mn) <0.001 <0.001 0.005 --- ---
Copper (Cu) <0.0005 <0.0005 <0.0005 --- ---
Zinc (Zn) <0.001 <0.001 0.003 --- ---
Cadmium (Cd) <0.0001 0.0001 0.0001 --- ---
Chromium (Cr) <0.0005 <0.0005 <0.0005 --- ---
Cobalt (Co) 0.0028 0.0025 <0.0007 --- ---
Mercury (Hg), ng/L 130 37 --- --- ---
Nickel (Ni) <0.002 <0.002 0.002 --- ---
Lead (Pb) 0.0011 <0.0008 0.0012 --- ---
Beryllium (Be) 0.001 0.001 0.002 --- ---
Vanadium (V) <0.002 <0.002 <0.002 --- ---
Molybdenum (Mo) 0.060 0.049 --- --- ---
Antimony (Sb) 0.065 0.082 0.072 --- ---
Selenium (Se) <0.001 <0.001 <0.001 --- ---
Arsenic total (As(T)) 1.51 1.16 1.86 1.85 1.86
Arsenite (As(III)) 1.51 1.14 0.0301 0.0329 0.0280
Dissolved organic carbon (DOC) 1.2 1.5 1.4 --- ---
δD, per mil -140 -140 -142 --- ---
δ18O, per mil -15.8 -16.5 -16.3 --- ---
sum cations, meq/L 15.3 14.4 12.9 --- ---
sum anions, meq/L 14.0 14.1 13.2 --- ---
Charge imbalance, percent 8.8 2.1 -2.8 --- ---1 Except for acidity (mM), mercury (ng/L), polythionate (mM), and δD and δ18O (per mil)
58

Table 7. Results of water analyses for Lower Geyser Basin, 2001-2002 – Continued
[δD and δ18O, isotopic composition of hydrogen and oxygen relative to VSMOW; m, meters; meq/L, milliequivalents per liter; mg/L, milligrams per liter; mM, millimolar; μS/cm, microsiemans per centimeter; n, number; ng/L nanograms per liter; V, volts; ---, not measured; °C, degrees Celsius; <, less than]
Name and/or site description Octopus Spring Octopus Spring - edge of pool
Octopus Spring - 9.4m from edge of pool
Octopus Spring - 16.2m from edge of pool
Octopus Spring - 23.5m from edge of pool
Sample code number 01WA145 01WA145A / transect E 01WA145B / transect E 01WA145C / transect E 01WA145D / transect E
Date collected 9/16/2001 9/16/2001 9/16/2001 9/16/2001 9/16/2001
Time collected 12:20 12:20 12:40 13:00 13:20
Temperature, °C 90.5 90.5 82.0 76.0 73.0
pH (field / laboratory) 8.04 / 8.78 8.04 / --- 8.18 / --- 8.28 / --- 8.27 / ---
pH, selected 8.04 --- --- --- ---
Specific conductance 1338 / 1446 1338 / --- --- / --- --- / --- --- / ---
(field / laboratory), μS/cm Eh, V -0.078 -0.007 --- --- ---
Density, g/mL at 20°C 0.99911 --- --- --- ---
Dissolved oxygen (DO), mg/L --- --- --- --- ---
Constituent, mg/L1
Calcium (Ca) 0.765 --- --- --- ---
Magnesium (Mg) 0.011 --- --- --- ---
Strontium (Sr) 0.001 --- --- --- ---
Barium (Ba) <0.001 --- --- --- ---
Sodium (Na) 297 --- --- --- ---
Potassium (K) 15.4 --- --- --- ---
Lithium (Li) 3.25 --- --- --- ---
Sulfate (SO4) 17.6 --- --- --- ---
Thiosulfate (S2O3) <0.1 --- --- --- ---
Polythionate (SnO6), mM / n <0.002 --- --- --- ---
Hydrogen sulfide (H2S) 0.024 0.027 0.009 <0.002 ---
Alkalinity (HCO3) 343 --- --- --- ---
Acidity (free / total), mM --- / --- --- / --- --- / --- --- / --- --- / ---
Fluoride (F) 21.2 --- --- --- ---
Chloride (Cl) 246 --- --- --- ---
Bromide (Br) 0.8 --- --- --- ---
Nitrate (NO3) <0.1 --- --- --- ---
Nitrite (NO2) 0.0630 --- 0.0366 0.0240 0.0202
Ammonium (NH4) <0.04 --- <0.04 <0.04 <0.04
Silica (SiO2) 288 --- --- --- ---
Boron (B) 2.74 --- --- --- ---
Aluminum (Al) 0.24 --- --- --- ---
Iron total (Fe(T)) <0.002 --- <0.002 <0.002 <0.002
Ferrous iron (Fe(II)) <0.002 --- <0.002 <0.002 <0.002
Manganese (Mn) 0.003 --- --- --- ---
Copper (Cu) 0.0010 --- --- --- ---
Zinc (Zn) 0.002 --- --- --- ---
Cadmium (Cd) 0.0001 --- --- --- ---
Chromium (Cr) <0.0005 --- --- --- ---
Cobalt (Co) 0.0027 --- --- --- ---
Mercury (Hg), ng/L --- --- --- --- ---
Nickel (Ni) <0.002 --- --- --- ---
Lead (Pb) 0.0010 --- --- --- ---
Beryllium (Be) 0.002 --- --- --- ---
Vanadium (V) <0.002 --- --- --- ---
Molybdenum (Mo) --- --- --- --- ---
Antimony (Sb) 0.085 --- --- --- ---
Selenium (Se) <0.001 --- --- --- ---
Arsenic total (As(T)) 1.37 1.36 1.42 1.46 1.40
Arsenite (As(III)) 0.148 0.156 0.0689 0.0354 0.0357
Dissolved organic carbon (DOC) 1.4 --- --- --- ---
δD, per mil -144 --- --- --- ---
δ18O, per mil -16.9 --- --- --- ---
sum cations, meq/L 13.7 --- --- --- ---
sum anions, meq/L 14.0 --- --- --- ---
Charge imbalance, percent -2.0 --- --- --- ---1 Except for acidity (mM), mercury (ng/L), polythionate (mM), and δD and δ18O (per mil)
59

Table 7. Results of water analyses for Lower Geyser Basin, 2001-2002 – Continued
[δD and δ18O, isotopic composition of hydrogen and oxygen relative to VSMOW; m, meters; meq/L, milliequivalents per liter; mg/L, milligrams per liter; mM, millimolar; μS/cm, microsiemans per centimeter; n, number; ng/L nanograms per liter; V, volts; ---, not measured; °C, degrees Celsius; <, less than]
Name and/or site description Octopus Spring - 37.8m from edge of pool
Ojo Caliente Spring Ojo Caliente - edge of pool
Ojo Caliente - 6.6m from edge of pool, drainage A
Ojo Caliente - 13m from edge of pool, drainage A
Sample code number 01WA145E / transect E 02WA145 02WA145A1 / transect H/I 02WA145A2 / transect H 02WA145A3 / transect H
Date collected 9/16/2001 6/30/2002 7/1/2002 7/1/2002 7/1/2002
Time collected 13:40 14:30 15:00 15:00 15:00
Temperature, °C 69.0 93.0 88.5 83.8 79.8
pH (field / laboratory) 8.40 / --- 7.36 / 8.60 7.31 / --- 7.45 / --- 7.61 / ---
pH, selected --- 7.36 --- --- ---
Specific conductance --- / --- 1500 / 1616 --- / --- --- / --- --- / ---
(field / laboratory), μS/cm Eh, V --- -0.153 --- --- ---
Density, g/mL at 20°C --- 0.99916 --- --- ---
Dissolved oxygen (DO), mg/L --- --- --- --- ---
Constituent, mg/L1
Calcium (Ca) --- 0.857 --- --- ---
Magnesium (Mg) --- <0.001 --- --- ---
Strontium (Sr) --- 0.006 --- --- ---
Barium (Ba) --- <0.001 --- --- ---
Sodium (Na) --- 328 --- --- ---
Potassium (K) --- 10.5 --- --- ---
Lithium (Li) --- 4.17 --- --- ---
Sulfate (SO4) --- 25.4 --- --- ---
Thiosulfate (S2O3) --- 0.6 --- --- ---
Polythionate (SnO6), mM / n --- <0.002 --- --- ---
Hydrogen sulfide (H2S) --- 0.37 --- --- ---
Alkalinity (HCO3) --- 240 --- --- ---
Acidity (free / total), mM --- / --- --- / --- --- / --- --- / --- --- / ---
Fluoride (F) --- 28.9 --- --- ---
Chloride (Cl) --- 298 --- --- ---
Bromide (Br) --- 1.2 --- --- ---
Nitrate (NO3) --- <0.1 --- --- ---
Nitrite (NO2) --- 0.184 0.0143 0.0093 0.0054
Ammonium (NH4) --- 0.46 0.39 0.29 0.31
Silica (SiO2) --- 229 --- --- ---
Boron (B) --- 4.34 --- --- ---
Aluminum (Al) --- 0.27 --- --- ---
Iron total (Fe(T)) <0.002 <0.002 --- --- ---
Ferrous iron (Fe(II)) <0.002 <0.002 --- --- ---
Manganese (Mn) --- <0.001 --- --- ---
Copper (Cu) --- 0.0023 --- --- ---
Zinc (Zn) --- <0.001 --- --- ---
Cadmium (Cd) --- 0.0001 --- --- ---
Chromium (Cr) --- <0.0005 --- --- ---
Cobalt (Co) --- 0.0020 --- --- ---
Mercury (Hg), ng/L --- 490 --- --- ---
Nickel (Ni) --- <0.002 --- --- ---
Lead (Pb) --- 0.0011 --- --- ---
Beryllium (Be) --- 0.001 --- --- ---
Vanadium (V) --- <0.002 --- --- ---
Molybdenum (Mo) --- 0.039 --- --- ---
Antimony (Sb) --- 0.051 --- --- ---
Selenium (Se) --- <0.001 --- --- ---
Arsenic total (As(T)) 1.43 1.36 1.43 1.40 1.43
Arsenite (As(III)) 0.0382 1.36 1.43 1.40 1.43
Dissolved organic carbon (DOC) --- 1.6 --- --- ---
δD, per mil --- -140 --- --- ---
δ18O, per mil --- -16.5 --- --- ---
sum cations, meq/L --- 15.2 --- --- ---
sum anions, meq/L --- 14.4 --- --- ---
Charge imbalance, percent --- 5.2 --- --- ---1 Except for acidity (mM), mercury (ng/L), polythionate (mM), and δD and δ18O (per mil)
60
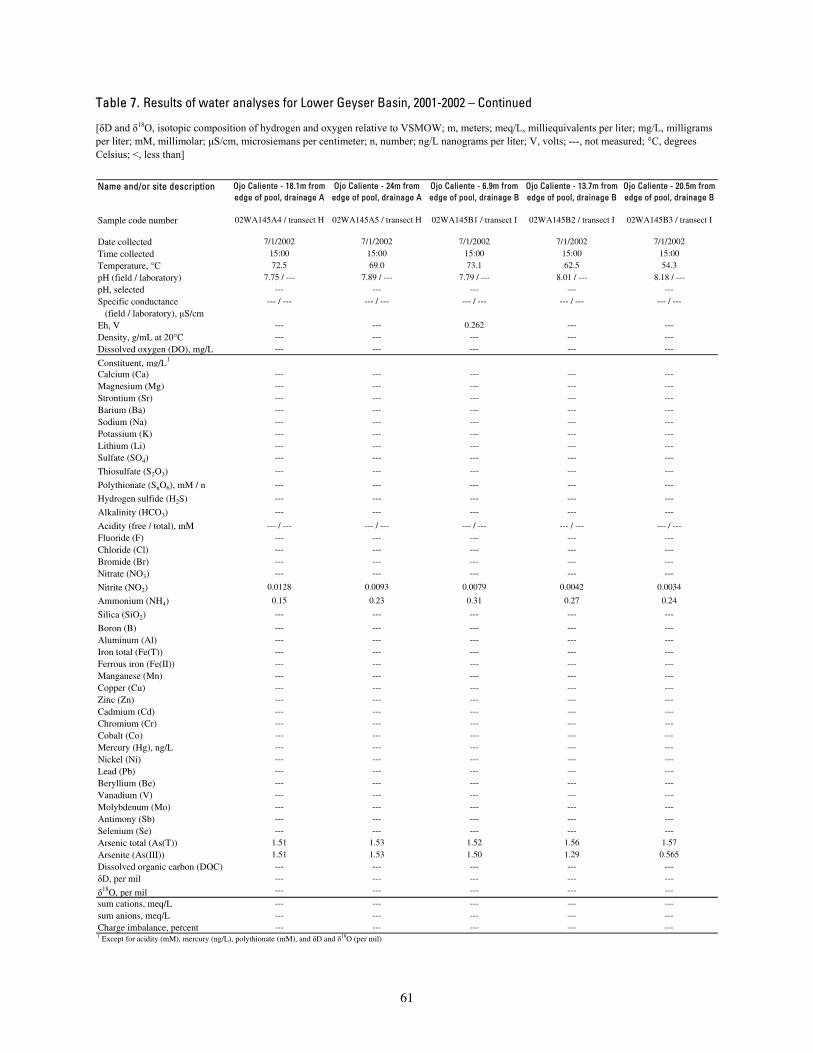
Table 7. Results of water analyses for Lower Geyser Basin, 2001-2002 – Continued
[δD and δ18O, isotopic composition of hydrogen and oxygen relative to VSMOW; m, meters; meq/L, milliequivalents per liter; mg/L, milligrams per liter; mM, millimolar; μS/cm, microsiemans per centimeter; n, number; ng/L nanograms per liter; V, volts; ---, not measured; °C, degrees Celsius; <, less than]
Name and/or site description Ojo Caliente - 18.1m from edge of pool, drainage A
Ojo Caliente - 24m from edge of pool, drainage A
Ojo Caliente - 6.9m from edge of pool, drainage B
Ojo Caliente - 13.7m from edge of pool, drainage B
Ojo Caliente - 20.5m from edge of pool, drainage B
Sample code number 02WA145A4 / transect H 02WA145A5 / transect H 02WA145B1 / transect I 02WA145B2 / transect I 02WA145B3 / transect I
Date collected 7/1/2002 7/1/2002 7/1/2002 7/1/2002 7/1/2002
Time collected 15:00 15:00 15:00 15:00 15:00
Temperature, °C 72.5 69.0 73.1 62.5 54.3
pH (field / laboratory) 7.75 / --- 7.89 / --- 7.79 / --- 8.01 / --- 8.18 / ---
pH, selected --- --- --- --- ---
Specific conductance --- / --- --- / --- --- / --- --- / --- --- / ---
(field / laboratory), μS/cm Eh, V --- --- 0.262 --- ---
Density, g/mL at 20°C --- --- --- --- ---
Dissolved oxygen (DO), mg/L --- --- --- --- ---
Constituent, mg/L1
Calcium (Ca) --- --- --- --- ---
Magnesium (Mg) --- --- --- --- ---
Strontium (Sr) --- --- --- --- ---
Barium (Ba) --- --- --- --- ---
Sodium (Na) --- --- --- --- ---
Potassium (K) --- --- --- --- ---
Lithium (Li) --- --- --- --- ---
Sulfate (SO4) --- --- --- --- ---
Thiosulfate (S2O3) --- --- --- --- ---
Polythionate (SnO6), mM / n --- --- --- --- ---
Hydrogen sulfide (H2S) --- --- --- --- ---
Alkalinity (HCO3) --- --- --- --- ---
Acidity (free / total), mM --- / --- --- / --- --- / --- --- / --- --- / ---
Fluoride (F) --- --- --- --- ---
Chloride (Cl) --- --- --- --- ---
Bromide (Br) --- --- --- --- ---
Nitrate (NO3) --- --- --- --- ---
Nitrite (NO2) 0.0128 0.0093 0.0079 0.0042 0.0034
Ammonium (NH4) 0.15 0.23 0.31 0.27 0.24
Silica (SiO2) --- --- --- --- ---
Boron (B) --- --- --- --- ---
Aluminum (Al) --- --- --- --- ---
Iron total (Fe(T)) --- --- --- --- ---
Ferrous iron (Fe(II)) --- --- --- --- ---
Manganese (Mn) --- --- --- --- ---
Copper (Cu) --- --- --- --- ---
Zinc (Zn) --- --- --- --- ---
Cadmium (Cd) --- --- --- --- ---
Chromium (Cr) --- --- --- --- ---
Cobalt (Co) --- --- --- --- ---
Mercury (Hg), ng/L --- --- --- --- ---
Nickel (Ni) --- --- --- --- ---
Lead (Pb) --- --- --- --- ---
Beryllium (Be) --- --- --- --- ---
Vanadium (V) --- --- --- --- ---
Molybdenum (Mo) --- --- --- --- ---
Antimony (Sb) --- --- --- --- ---
Selenium (Se) --- --- --- --- ---
Arsenic total (As(T)) 1.51 1.53 1.52 1.56 1.57
Arsenite (As(III)) 1.51 1.53 1.50 1.29 0.565
Dissolved organic carbon (DOC) --- --- --- --- ---
δD, per mil --- --- --- --- ---
δ18O, per mil --- --- --- --- ---
sum cations, meq/L --- --- --- --- ---
sum anions, meq/L --- --- --- --- ---
Charge imbalance, percent --- --- --- --- ---1 Except for acidity (mM), mercury (ng/L), polythionate (mM), and δD and δ18O (per mil)
61
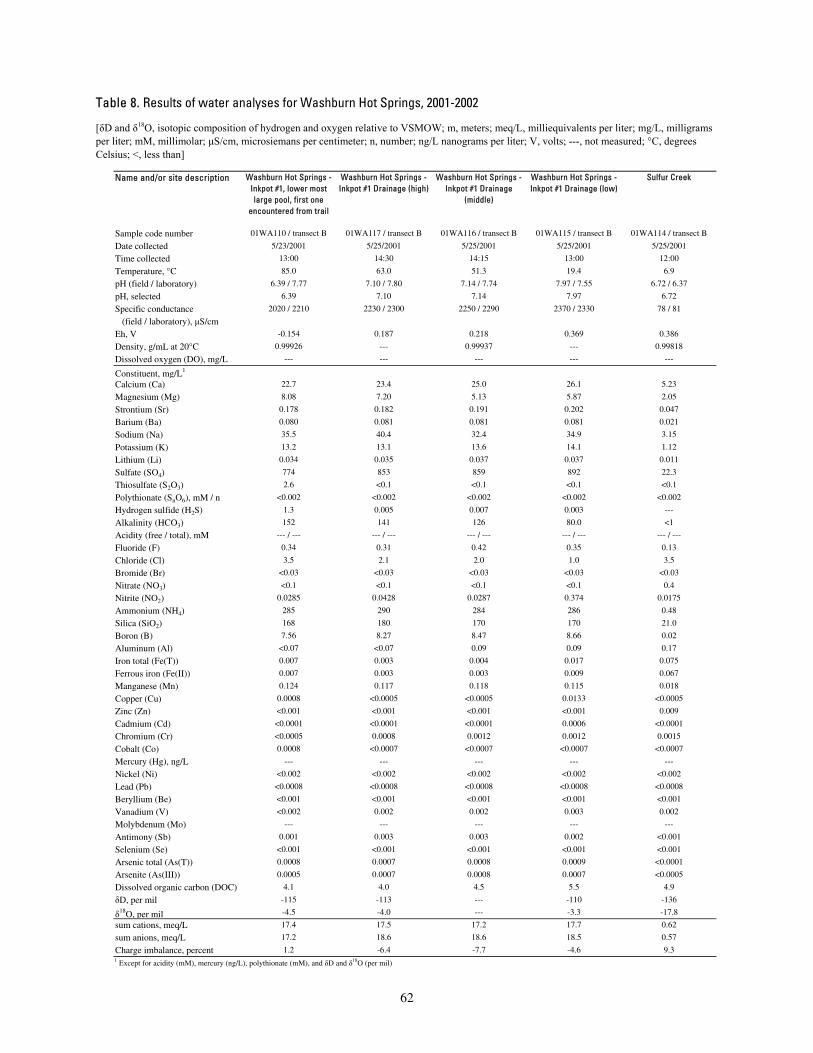
Table 8. Results of water analyses for Washburn Hot Springs, 2001-2002
[δD and δ18O, isotopic composition of hydrogen and oxygen relative to VSMOW; m, meters; meq/L, milliequivalents per liter; mg/L, milligrams per liter; mM, millimolar; μS/cm, microsiemans per centimeter; n, number; ng/L nanograms per liter; V, volts; ---, not measured; °C, degrees Celsius; <, less than]
Name and/or site description Washburn Hot Springs - Inkpot #1, lower most large pool, first one
encountered from trail
Washburn Hot Springs - Inkpot #1 Drainage (high)
Washburn Hot Springs - Inkpot #1 Drainage
(middle)
Washburn Hot Springs - Inkpot #1 Drainage (low)
Sulfur Creek
Sample code number 01WA110 / transect B 01WA117 / transect B 01WA116 / transect B 01WA115 / transect B 01WA114 / transect B
Date collected 5/23/2001 5/25/2001 5/25/2001 5/25/2001 5/25/2001
Time collected 13:00 14:30 14:15 13:00 12:00
Temperature, °C 85.0 63.0 51.3 19.4 6.9
pH (field / laboratory) 6.39 / 7.77 7.10 / 7.80 7.14 / 7.74 7.97 / 7.55 6.72 / 6.37
pH, selected 6.39 7.10 7.14 7.97 6.72
Specific conductance 2020 / 2210 2230 / 2300 2250 / 2290 2370 / 2330 78 / 81
(field / laboratory), μS/cm Eh, V -0.154 0.187 0.218 0.369 0.386
Density, g/mL at 20°C 0.99926 --- 0.99937 --- 0.99818
Dissolved oxygen (DO), mg/L --- --- --- --- ---
Constituent, mg/L1
Calcium (Ca) 22.7 23.4 25.0 26.1 5.23
Magnesium (Mg) 8.08 7.20 5.13 5.87 2.05
Strontium (Sr) 0.178 0.182 0.191 0.202 0.047
Barium (Ba) 0.080 0.081 0.081 0.081 0.021
Sodium (Na) 35.5 40.4 32.4 34.9 3.15
Potassium (K) 13.2 13.1 13.6 14.1 1.12
Lithium (Li) 0.034 0.035 0.037 0.037 0.011
Sulfate (SO4) 774 853 859 892 22.3
Thiosulfate (S2O3) 2.6 <0.1 <0.1 <0.1 <0.1
Polythionate (SnO6), mM / n <0.002 <0.002 <0.002 <0.002 <0.002
Hydrogen sulfide (H2S) 1.3 0.005 0.007 0.003 ---
Alkalinity (HCO3) 152 141 126 80.0 <1
Acidity (free / total), mM --- / --- --- / --- --- / --- --- / --- --- / ---
Fluoride (F) 0.34 0.31 0.42 0.35 0.13
Chloride (Cl) 3.5 2.1 2.0 1.0 3.5
Bromide (Br) <0.03 <0.03 <0.03 <0.03 <0.03
Nitrate (NO3) <0.1 <0.1 <0.1 <0.1 0.4
Nitrite (NO2) 0.0285 0.0428 0.0287 0.374 0.0175
Ammonium (NH4) 285 290 284 286 0.48
Silica (SiO2) 168 180 170 170 21.0
Boron (B) 7.56 8.27 8.47 8.66 0.02
Aluminum (Al) <0.07 <0.07 0.09 0.09 0.17
Iron total (Fe(T)) 0.007 0.003 0.004 0.017 0.075
Ferrous iron (Fe(II)) 0.007 0.003 0.003 0.009 0.067
Manganese (Mn) 0.124 0.117 0.118 0.115 0.018
Copper (Cu) 0.0008 <0.0005 <0.0005 0.0133 <0.0005
Zinc (Zn) <0.001 <0.001 <0.001 <0.001 0.009
Cadmium (Cd) <0.0001 <0.0001 <0.0001 0.0006 <0.0001
Chromium (Cr) <0.0005 0.0008 0.0012 0.0012 0.0015
Cobalt (Co) 0.0008 <0.0007 <0.0007 <0.0007 <0.0007
Mercury (Hg), ng/L --- --- --- --- ---
Nickel (Ni) <0.002 <0.002 <0.002 <0.002 <0.002
Lead (Pb) <0.0008 <0.0008 <0.0008 <0.0008 <0.0008
Beryllium (Be) <0.001 <0.001 <0.001 <0.001 <0.001
Vanadium (V) <0.002 0.002 0.002 0.003 0.002
Molybdenum (Mo) --- --- --- --- ---
Antimony (Sb) 0.001 0.003 0.003 0.002 <0.001
Selenium (Se) <0.001 <0.001 <0.001 <0.001 <0.001
Arsenic total (As(T)) 0.0008 0.0007 0.0008 0.0009 <0.0001
Arsenite (As(III)) 0.0005 0.0007 0.0008 0.0007 <0.0005
Dissolved organic carbon (DOC) 4.1 4.0 4.5 5.5 4.9
δD, per mil -115 -113 --- -110 -136
δ18O, per mil -4.5 -4.0 --- -3.3 -17.8
sum cations, meq/L 17.4 17.5 17.2 17.7 0.62
sum anions, meq/L 17.2 18.6 18.6 18.5 0.57
Charge imbalance, percent 1.2 -6.4 -7.7 -4.6 9.31 Except for acidity (mM), mercury (ng/L), polythionate (mM), and δD and δ18O (per mil)
62
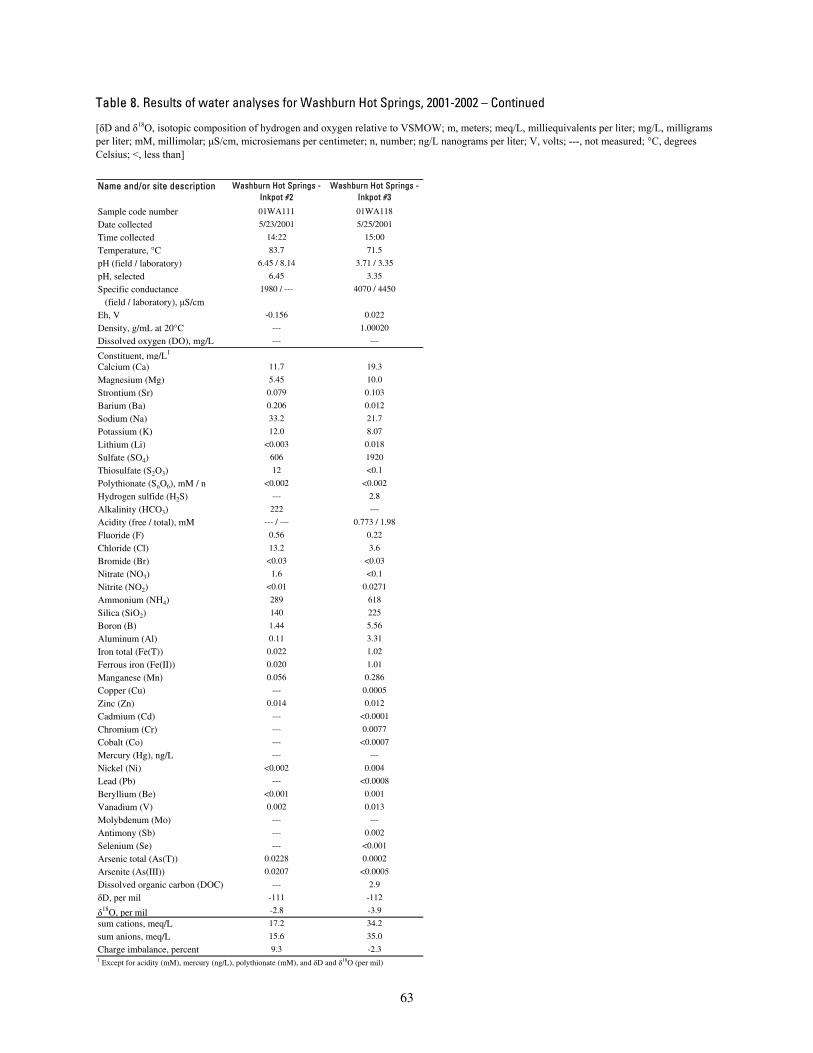
Table 8. Results of water analyses for Washburn Hot Springs, 2001-2002 – Continued
[δD and δ18O, isotopic composition of hydrogen and oxygen relative to VSMOW; m, meters; meq/L, milliequivalents per liter; mg/L, milligrams per liter; mM, millimolar; μS/cm, microsiemans per centimeter; n, number; ng/L nanograms per liter; V, volts; ---, not measured; °C, degrees Celsius; <, less than]
Name and/or site description Washburn Hot Springs - Inkpot #2
Washburn Hot Springs - Inkpot #3
Sample code number 01WA111 01WA118
Date collected 5/23/2001 5/25/2001
Time collected 14:22 15:00
Temperature, °C 83.7 71.5
pH (field / laboratory) 6.45 / 8.14 3.71 / 3.35
pH, selected 6.45 3.35
Specific conductance 1980 / --- 4070 / 4450
(field / laboratory), μS/cm Eh, V -0.156 0.022
Density, g/mL at 20°C --- 1.00020
Dissolved oxygen (DO), mg/L --- ---
Constituent, mg/L1
Calcium (Ca) 11.7 19.3
Magnesium (Mg) 5.45 10.0
Strontium (Sr) 0.079 0.103
Barium (Ba) 0.206 0.012
Sodium (Na) 33.2 21.7
Potassium (K) 12.0 8.07
Lithium (Li) <0.003 0.018
Sulfate (SO4) 606 1920
Thiosulfate (S2O3) 12 <0.1
Polythionate (SnO6), mM / n <0.002 <0.002
Hydrogen sulfide (H2S) --- 2.8
Alkalinity (HCO3) 222 ---
Acidity (free / total), mM --- / --- 0.773 / 1.98
Fluoride (F) 0.56 0.22
Chloride (Cl) 13.2 3.6
Bromide (Br) <0.03 <0.03
Nitrate (NO3) 1.6 <0.1
Nitrite (NO2) <0.01 0.0271
Ammonium (NH4) 289 618
Silica (SiO2) 140 225
Boron (B) 1.44 5.56
Aluminum (Al) 0.11 3.31
Iron total (Fe(T)) 0.022 1.02
Ferrous iron (Fe(II)) 0.020 1.01
Manganese (Mn) 0.056 0.286
Copper (Cu) --- 0.0005
Zinc (Zn) 0.014 0.012
Cadmium (Cd) --- <0.0001
Chromium (Cr) --- 0.0077
Cobalt (Co) --- <0.0007
Mercury (Hg), ng/L --- ---
Nickel (Ni) <0.002 0.004
Lead (Pb) --- <0.0008
Beryllium (Be) <0.001 0.001
Vanadium (V) 0.002 0.013
Molybdenum (Mo) --- ---
Antimony (Sb) --- 0.002
Selenium (Se) --- <0.001
Arsenic total (As(T)) 0.0228 0.0002
Arsenite (As(III)) 0.0207 <0.0005
Dissolved organic carbon (DOC) --- 2.9
δD, per mil -111 -112
δ18O, per mil -2.8 -3.9
sum cations, meq/L 17.2 34.2
sum anions, meq/L 15.6 35.0
Charge imbalance, percent 9.3 -2.31 Except for acidity (mM), mercury (ng/L), polythionate (mM), and δD and δ18O (per mil)
63

Table 9. Results of water analyses for Calcite Springs, Crater Hills, Mammoth Hot Springs, and West Thumb Geyser Basin, 2001-2002
[δD and δ18O, isotopic composition of hydrogen and oxygen relative to VSMOW; m, meters; meq/L, milliequivalents per liter; mg/L, milligrams per liter; mM, millimolar; μS/cm, microsiemans per centimeter; n, number; ng/L nanograms per liter; V, volts; ---, not measured; °C, degrees Celsius; <, less than]
Area Calcite Spring Area Crater Hills Crater Hills Mammoth Hot Springs Mammoth Hot SpringsName and/or site description Unnamed spring,
downstream from Calcite Spring
Unnamed light green flowing pool south of
Sulphur Spring
Sulphur Spring Canary Spring Canary Springs - base of travertine terrace above
wetland areaSample code number 02WA148 01WA112 01WA113 01WA143 01WA144
Date collected 7/1/2002 5/24/2001 5/24/2001 9/15/2001 9/15/2001
Time collected 12:00 13:15 15:00 10:40 12:45
Temperature, °C 68.2 41.0 90.0 73.0 38.5
pH (field / laboratoryoratory) 2.09 / 1.98 3.47 / 3.37 3.72 / 3.49 6.50 / 7.95 8.13 / 8.03
pH, selected 2.11 3.37 3.49 6.50 8.13
Specific conductance 4460 / 7170 4230 / 4340 3540 / 3890 2310 / 1808 2030 / 1839
(field / laboratory), μS/cm Eh, V 0.193 0.421 0.196 -0.123 0.096
Density, g/mL at 20°C 1.00101 1.00056 1.00063 0.99924 0.99926
Dissolved oxygen (DO), mg/L --- --- --- --- ---
Constituent, mg/L1
Calcium (Ca) 165 7.48 6.71 342 206
Magnesium (Mg) 21.3 0.629 0.567 75.8 82.3
Strontium (Sr) 1.50 0.135 0.122 1.89 0.970
Barium (Ba) 0.044 0.083 0.078 0.038 0.026
Sodium (Na) 193 638 546 130 137
Potassium (K) 79.5 183 158 51.4 53.8
Lithium (Li) 1.76 7.78 6.97 1.53 1.67
Sulfate (SO4) 2060 526 436 528 565
Thiosulfate (S2O3) <0.1 <0.1 1.1 <0.1 <0.1
Polythionate (SnO6), mM / n <0.002 <0.002 <0.002 <0.002 <0.002
Hydrogen sulfide (H2S) <0.002 0.19 0.24 1.3 <0.002
Alkalinity (HCO3) --- --- --- 846 362
Acidity (free / total), mM 16.5 / 25.5 1.10 / 2.67 0.865 / 2.42 --- / --- --- / ---
Fluoride (F) 4.48 36.1 33.8 1.42 0.77
Chloride (Cl) 192 990 910 166 177
Bromide (Br) 0.9 0.9 1.5 0.6 0.6
Nitrate (NO3) <0.1 <0.1 <0.1 <0.1 0.2
Nitrite (NO2) 0.0011 <0.01 --- 0.0031 0.0031
Ammonium (NH4) 44.9 3.05 2.42 0.99 <0.3
Silica (SiO2) 259 731 718 52.3 55.9
Boron (B) 27.8 28.5 28.2 3.89 4.16
Aluminum (Al) 56.3 7.11 6.62 <0.07 <0.07
Iron total (Fe(T)) 46.2 0.235 0.219 0.024 <0.002
Ferrous iron (Fe(II)) 46.2 0.190 0.218 0.023 <0.002
Manganese (Mn) 0.582 0.295 0.268 0.017 0.014
Copper (Cu) <0.0005 <0.0005 <0.0005 0.0012 <0.0005
Zinc (Zn) 0.066 0.011 0.007 0.002 0.002
Cadmium (Cd) 0.0001 0.0002 0.0002 <0.0001 <0.0001
Chromium (Cr) 0.108 0.0015 0.0015 <0.0005 <0.0005
Cobalt (Co) 0.0064 <0.0007 <0.0007 <0.0007 <0.0007
Mercury (Hg), ng/L 60 --- --- --- ---
Nickel (Ni) 0.021 0.005 0.005 <0.002 <0.002
Lead (Pb) <0.0008 0.0028 0.0026 <0.0008 <0.0008
Beryllium (Be) 0.001 0.015 0.014 0.002 <0.001
Vanadium (V) 0.081 <0.002 <0.002 <0.002 <0.002
Molybdenum (Mo) <0.007 --- --- --- ---
Antimony (Sb) 0.012 0.118 0.277 0.003 0.003
Selenium (Se) 0.003 <0.001 <0.001 0.003 0.001
Arsenic total (As(T)) 1.73 6.45 6.01 0.466 0.539
Arsenite (As(III)) 1.27 3.79 5.89 0.466 0.375
Dissolved organic carbon (DOC) 3.4 --- --- 2.1 1.1
δD, per mil -144 -122 -125 -148 -145
δ18O, per mil -14.0 -10.8 -12.2 -18.2 -17.4
sum cations, meq/L 32.5 34.2 29.3 24.9 20.3
sum anions, meq/L 31.1 39.0 34.4 23.9 18.4
Charge imbalance, percent 4.4 -13 -16 3.9 9.91 Except for acidity (mM), mercury (ng/L), polythionate (mM), and δD and δ18O (per mil)
64

Table 9. Results of water analyses for Calcite Springs, Crater Hills, Mammoth Hot Springs, and West Thumb Geyser Basin, 2001-2002 – Continued
[δD and δ18O, isotopic composition of hydrogen and oxygen relative to VSMOW; m, meters; meq/L, milliequivalents per liter; mg/L, milligrams per liter; mM, millimolar; μS/cm, microsiemans per centimeter; n, number; ng/L nanograms per liter; V, volts; ---, not measured; °C, degrees Celsius; <, less than]
Area West Thumb Geyser Basin
West Thumb Geyser Basin
West Thumb Geyser Basin
Name and/or site description Lakeshore Geyser Unnamed pool Seismograph PoolSample code number 01WA173 01WA174 01WA172
Date collected 9/18/2001 9/18/2001 9/18/2001
Time collected 12:50 14:10 11:50
Temperature, °C 91.8 --- 75.9
pH (field / laboratory) 7.31 / 8.63 7.50 / 8.64 7.87 / 8.78
pH, selected 7.31 7.50 7.87
Specific conductance 1770 / 1905 --- / 2150 1920 / 1999
(field / laboratory), μS/cm Eh, V -0.055 --- 0.128
Density, g/mL at 20°C 0.99931 0.99937 0.99949
Dissolved oxygen (DO), mg/L --- --- ---
Constituent, mg/L1
Calcium (Ca) 1.47 1.45 0.514
Magnesium (Mg) 0.280 0.170 0.017
Strontium (Sr) 0.011 0.005 0.005
Barium (Ba) 0.003 0.004 0.003
Sodium (Na) 417 454 443
Potassium (K) 18.9 19.3 19.2
Lithium (Li) 2.94 3.94 3.26
Sulfate (SO4) 44.2 99.5 45.3
Thiosulfate (S2O3) <0.1 <0.1 <0.1
Polythionate (SnO6), mM / n <0.002 <0.002 <0.002
Hydrogen sulfide (H2S) 0.042 --- 0.005
Alkalinity (HCO3) 532 559 554
Acidity (free / total), mM --- / --- --- / --- --- / ---
Fluoride (F) 25.6 28.0 28.7
Chloride (Cl) 285 314 307
Bromide (Br) 0.9 1.0 1.0
Nitrate (NO3) <0.1 <0.1 0.2
Nitrite (NO2) 0.0211 0.0455 0.0362
Ammonium (NH4) <0.04 <0.04 <0.04
Silica (SiO2) 232 427 256
Boron (B) 3.59 3.90 3.75
Aluminum (Al) 0.09 <0.07 0.16
Iron total (Fe(T)) 0.002 0.012 0.004
Ferrous iron (Fe(II)) <0.002 <0.002 <0.002
Manganese (Mn) 0.012 0.048 0.001
Copper (Cu) <0.0005 0.105 <0.0005
Zinc (Zn) <0.001 0.036 0.005
Cadmium (Cd) 0.0001 0.0002 0.0001
Chromium (Cr) <0.0005 <0.0005 0.0007
Cobalt (Co) <0.0007 <0.0007 <0.0007
Mercury (Hg), ng/L --- --- ---
Nickel (Ni) <0.002 0.006 <0.002
Lead (Pb) 0.0013 0.0018 0.0011
Beryllium (Be) 0.002 0.002 0.002
Vanadium (V) <0.002 <0.002 <0.002
Molybdenum (Mo) --- --- ---
Antimony (Sb) 0.146 0.153 0.148
Selenium (Se) <0.001 <0.001 <0.001
Arsenic total (As(T)) 1.76 2.09 1.80
Arsenite (As(III)) 1.76 0.0335 0.0354
Dissolved organic carbon (DOC) 2.0 1.7 1.7
δD, per mil -138 -116 -137
δ18O, per mil -14.5 -7.6 -14.1
sum cations, meq/L 19.0 20.8 20.1
sum anions, meq/L 18.9 21.5 20.1
Charge imbalance, percent 0.5 -3.4 0.01 Except for acidity (mM), mercury (ng/L), polythionate (mM), and δD and δ18O (per mil)
65

Table 10. Results of water analyses for Brimstone Basin, 2001-2002
[δD and δ18O, isotopic composition of hydrogen and oxygen relative to VSMOW; m, meters; meq/L, milliequivalents per liter; mg/L, milligrams per liter; mM, millimolar; μS/cm, microsiemans per centimeter; n, number; ng/L nanograms per liter; V, volts; ---, not measured; °C, degrees Celsius; <, less than]
Name and/or site description Alluvium Creek Alluvium Creek Tributary To Alluvium Creek
Alluvium Creek Alluvium Creek - downstream of Thorofare
Trail Sample code number 01WA147 01WA148 01WA149 01WA150 01WA171
Date collected 9/17/2001 9/17/2001 9/17/2001 9/17/2001 9/17/2001
Time collected 11:30 12:00 12:40 14:05 15:00
Temperature, °C 13.2 16.3 13.3 21.6 9.5
pH (field / laboratoryoratory) 2.06 / 2.08 2.72 / 2.84 1.72 / 1.75 2.10 / 2.07 2.58 / 2.64
pH, selected 2.06 2.72 1.72 2.10 2.58
Specific conductance 5520 / 5250 2430 / 2490 9640 / 9200 5480 / 5650 2460 / 2430
(field / laboratoryoratory), μS/cm
Eh, V 0.560 0.672 0.520 0.733 0.740
Density, g/mL at 20°C 0.99983 0.99998 1.00002 1.00071 0.99970
Dissolved oxygen (DO), mg/L --- --- --- --- ---
Constituent, mg/L1
Calcium (Ca) 93.9 118 42.9 110 73.0
Magnesium (Mg) 120 170 52.0 130 63.0
Strontium (Sr) 0.760 0.970 0.450 1.30 1.10
Barium (Ba) 0.011 0.013 0.008 0.011 0.011
Sodium (Na) 22.6 29.3 18.1 42.5 35.3
Potassium (K) 17.0 17.9 16.7 31.1 16.6
Lithium (Li) 0.044 0.058 0.022 0.048 0.027
Sulfate (SO4) 1710 1400 2120 2220 1360
Thiosulfate (S2O3) --- --- --- --- ---
Polythionate (SnO6), mM / n --- --- --- --- ---
Hydrogen sulfide (H2S) --- --- --- --- ---
Alkalinity (HCO3) --- --- --- --- ---
Acidity (free / total), mM 13.7 / 19.3 2.42 / 8.37 30.3 / 35.9 14.6 / 26.6 3.56 / 16.7
Fluoride (F) 0.24 0.24 0.14 0.22 0.18
Chloride (Cl) 3.1 3.3 3.9 3.6 2.6
Bromide (Br) <0.03 <0.03 <0.03 <0.03 <0.03
Nitrate (NO3) <0.1 <0.1 0.1 <0.1 0.4
Nitrite (NO2) <0.0003 <0.0003 <0.0003 <0.0003 <0.0003
Ammonium (NH4) <0.04 <0.04 <0.04 <0.04 <0.04
Silica (SiO2) 80.8 80.4 81.9 97.8 120
Boron (B) 0.03 0.03 0.01 0.02 0.01
Aluminum (Al) 38.7 39.6 44.2 102 113
Iron total (Fe(T)) 8.51 11.1 5.20 19.8 12.0
Ferrous iron (Fe(II)) 6.22 7.16 5.01 1.90 0.156
Manganese (Mn) 2.20 3.00 1.07 2.11 1.43
Copper (Cu) 0.0032 0.0065 <0.0005 <0.0005 0.0095
Zinc (Zn) 0.048 0.035 0.039 0.063 0.076
Cadmium (Cd) 0.0002 0.0003 0.0002 0.0002 0.0002
Chromium (Cr) 0.174 0.257 0.105 0.376 0.393
Cobalt (Co) 0.0037 0.0059 0.0009 0.0061 0.0157
Mercury (Hg), ng/L --- --- --- --- ---
Nickel (Ni) 0.015 0.022 0.005 0.024 0.048
Lead (Pb) <0.0008 <0.0008 <0.0008 0.0009 <0.0008
Beryllium (Be) 0.002 0.003 0.001 0.003 0.002
Vanadium (V) 0.046 0.049 0.036 0.094 0.031
Molybdenum (Mo) --- --- --- --- ---
Antimony (Sb) 0.004 0.004 0.002 0.004 0.003
Selenium (Se) 0.003 0.003 0.002 0.004 0.005
Arsenic total (As(T)) 0.0006 0.0002 0.0001 0.0003 <0.0001
Arsenite (As(III)) 0.0006 <0.0005 <0.0005 <0.0005 <0.0005
Dissolved organic carbon (DOC) 3.3 2.8 3.8 3.7 1.4
δD, per mil -140 -139 -140 -134 -139
δ18O, per mil -23.9 -23.8 -23.8 -21.3 -20.2
sum cations, meq/L 24.2 20.5 30.7 28.8 18.9
sum anions, meq/L 25.1 20.0 31.0 29.6 19.3
Charge imbalance, percent -3.4 2.2 -0.9 -2.9 -1.61 Except for acidity (mM), mercury (ng/L), polythionate (mM), and δD and δ18O (per mil)
66

REFERENCES CITED
Aiken, G.R., 1992, Chloride interference in the analysis of dissolved organic carbon by the wet oxidation method: Environmental Science and Technology, v. 26, p. 2435-2439.
American Public Health Association (APHA), 1985, Method 428C. Methylene blue method for sulfide, in Standard methods for the examination of water and wastewater (14th ed.): American Public Health Association, p. 403-405.
American Public Health Association (APHA), 1971, Method 218B. Dissolve oxygen – azide modification, in Standard methods for the examination of water and wastewater (13th ed.): American Public Health Association, p. 477-482.
Antweiler, R.C., Patton, C.P., and Taylor, H.E., 1996, Automated colorimetric methods for determination of nitrate plus nitrite, ammonium, and orthophosphate ions in natural water samples: U.S. Geological Survey Open-File Report 93-638, 123 p.
Ball, J.W., McCleskey, R.B., Nordstrom, D.K., Holloway, J.M., and Verplanck, P.L., 2002, Water-chemistry data for selected springs, geysers, and streams in Yellowstone National Park, Wyoming, 1999-2000: U.S. Geological Survey Open-File Report 02-382, 108 p.
Ball, J.W., Nordstrom, D.K., McCleskey, R.B., Schoonen, M.A.A., and Xu, Y., 2001, Water-chemistry and onsite sulfur-speciation data for selected springs in Yellowstone National Park, Wyoming, 1996-1998: U.S. Geological Survey Open-File Report 01-49, 42 p.
Ball, J.W., Nordstrom, D.K., Cunningham, K.M., Schoonen, M.A.A., Xu, Y., and DeMonge, J.M., 1998a, Water-chemistry and onsite sulfur-speciation data for selected springs in Yellowstone National Park, Wyoming, 1994-1995: U.S. Geological Survey Open-File Report 98-574, 35 p.
Ball, J.W., Nordstrom, D.K., Jenne, E.A., and Vivit, D.V., 1998b, Chemical analyses of hot springs, pools, geysers, and surface waters from Yellowstone National Park, Wyoming, and vicinity, 1974-1975: U.S. Geological Survey Open-File Report 98-182, 45 p.
Ball, J.W., and Nordstrom, D.K., 1991, User's manual for WATEQ4F, with revised thermodynamic data base and test cases for calculating speciation of major, trace, and redox elements in natural waters: U.S. Geological Survey Open-File Report 91-183, 189 p.
Barnard, W.R., and Nordstrom, D.K., 1980, Fluoride in precipitation-I. Methodology with the fluoride-selective electrode: Atmospheric Environment, v. 16, p. 99-103.
Barringer, J.L., and Johnsson, P.A., 1989, Theoretical considerations and a simple method for measuring alkalinity and acidity in low-pH waters by Gran titration: U.S. Geological Survey Water-Resources Investigations Report 89-4029, 35 p.
Brinton, T.I., Antweiler, R.C., and Taylor, H.E., 1995, Method for the determination of dissolved chloride, nitrate, and sulfate in natural water using ion chromatography: U.S. Geological Survey Open-File Report 95-426A, 16 p.
Charlton, S.R., Macklin, C.L., and Parkhurst, D.L., 1997, PHREEQCI--A graphical user interface for the geochemical computer program PHREEQC: U.S. Geological Survey Water-Resources Investigations Report 97-4222, 9 p.
Connor, B.F., Currier, J.P., and Woodworth, M.T., 2001, Results of the U.S. Geological Survey’s analytical evaluation program for standard reference samples distributed in October 2000: U.S. Geological Survey Open-File Report 01-137, 116 p.
Coplen, T. B., 1994, Reporting of stable hydrogen, carbon, and oxygen isotopic abundances: Pure and Applied Chemistry, v. 66, p. 273-276.
Coplen, T.B., Wildman, J.D., and Chen, J., 1991, Improvements in the gaseous hydrogen-water equilibrium technique for hydrogen isotope ratio analysis: Analytical Chemistry, v. 63, p. 910-912.
Epstein, S. and Mayeda, T., 1953, Variation of 18O content of water from natural sources: Geochimica et Cosmochimica Acta, v. 4, p. 213-224.
Farrar, J.W., 2000, Results of the U.S. Geological Survey’s analytical evaluation program for standard reference samples distributed in October 1999: U.S. Geological Survey Open-File Report 00-227, 143 p.
Fishman, M.J., and Friedman, L.C., eds., 1989, Methods for determination of inorganic substances in water and fluvial sediments: Techniques of Water-Resources Investigations of the U.S. Geological Survey, book 5, chapter A1, p. 55-56.
Kennedy, V.C., Jenne, E.A., and Burchard, J.M., 1976, Back-flushing filters for field processing of water samples prior to trace-element analyses: U.S. Geological Survey Open-File Report 76-126, 12 p.
McCleskey, R.B., Nordstrom, D.K., and Ball, J.W., 2003, Metal interferences and their removal prior to the determination of As(T) and As(III) in acid mine waters by hydride generation atomic absorption spectrometry: U.S. Geological Survey Water-Resources Investigations Report 03-4117, 14 p.
Moses, C.O., Nordstrom, D.K., and Mills, A.L., 1984, Sampling and analysing mixtures of sulphate sulphite, thiosulphate and polythionate: Talanta, v. 31, p. 331-339.
Nordstrom, D.K., 1977, Thermochemical redox equilibria of ZoBell's solution: Geochimica et Cosmochimica Acta, v. 41, p. 1835-41. Parkhurst, D.L., and Appelo, C.A.J., 1999, User’s guide to PHREEQC (version 2)—a computer program for speciation, batch-
reaction, one-dimensional transport, and inverse geochemical calculations: U.S. Geological Survey Water-Resources Investigations Report 99-4259, 312 p.
67
Revesz, K. and Coplen, T.B. 2003a, Hydrogen isotope ratio analysis of water by gaseous hydrogen-water equilibration: Standard Operating Procedure (SOP) #1574, Techniques of the U.S. Geological Survey.
Revesz, K. and Coplen, T.B. 2003b, Oxygen isotope ratio analysis of water by gaseous carbon dioxide-water equilibration: Standard Operating Procedure (SOP) #489, Techniques of the U. S. Geological Survey.
Roth, D.A., Taylor, H.E., Domagalski, J., Dileanis, P., Peart, D.B., Antweiler, R.C., and Alpers, C.N., 2001, Distribution of inorganic mercury in Sacramento River water and sediments: Archives of Environmental Contamination and Toxicology, v. 40, p. 161-172.
Solorzano, L., 1969, Determination of ammonia in natural waters by the phenolhypochlorite method: Limnology and Oceanography, v. 5, p. 799-801.
Stookey, L.L., 1970, Ferrozine - a new spectrophotometric reagent for iron: Analytical Chemistry, v. 42, p. 779-781. Taylor, H.E., Berghoff, K., Andrews, E.D., Antweiler, R.C., Brinton, T.I., Miller, C., Peart, D.B., and Roth, D.A., 1997, Water Quality of
Springs and Seeps in Glen Canyon National Recreation Area: National Park Service Technical Report NPS/NRWRD/NRTR-97/128, 26 p.
To, T.B., Nordstrom, D.K., Cunningham, K.M., Ball, J.W., and McCleskey, R.B., 1999, New method for the direct determination of dissolved Fe(III) concentration in acid mine waters: Environmental Science and Technology, v. 33, no. 5, p. 807-813.
Venkataraman, S., Martin, S.M., Schafer, F.Q., and Buettner, G., 2000, Detailed methods for the quantification of nitric oxide in aqueous solutions using either an oxygen monitor or EPR: Free Radical Biology and Medicine, v. 29, p. 580-585.
Whittlesey, L.H., 1988, Wonderland nomenclature: a history of the place names of Yellowstone National Park: Montana Historical Society Press, 867 p.
Xu, Y., and Schoonen, M.A.A., 1995, The stability of thiosulfate in the presence of pyrite in low-temperature aqueous solutions: Geochimica et Cosmochimica Acta, v. 59, p. 4605-4622.
Xu, Y., Schoonen, M.A.A., and Strongin, D.R., 1996, Thiosulfate oxidation: catalysis of synthetic sphalerite doped with transition metals: Geochimica et Cosmochimica Acta, v. 60, p. 4701-4710.
Xu, Y., Schoonen, M.A.A., Nordstrom, D.K., Cunningham, K.M., and Ball, J.W., 1998, Sulfur geochemistry of hydrothermal waters in Yellowstone National Park: I. The origin of thiosulfate in hot spring waters: Geochimica et Cosmochimica Acta, v. 62, p. 3729-3743.
Xu, Y., Schoonen, M.A.A., Nordstrom, D.K., Cunningham, K.M., and Ball, J.W., 2000, Sulfur geochemistry of hydrothermal waters in Yellowstone National Park: II. Formation and decomposition of thiosulfate and polythionate in Cinder Pool: Journal of Volcanology and Geothermal Research, v. 97, p. 407-423.
ZoBell, C.E., 1946, Studies on redox potential of marine sediments: 8. Other methods: Bulletin of the American Association of Petroleum Geologists, v. 30, p. 477-509.
68
APPENDIX 1. QUALITY ASSURANCE AND QUALITY CONTROL
69

QUALITY ASSURANCE AND QUALITY CONTROL
Several techniques were used to assure the quality of the analytical data. These techniques include use of C.I., USGS standard reference water samples (SRWS), replicate analyses, a field blank, spike recoveries, and determination by alternative analytical methods.
Seventy-seven samples were analyzed for major cations and anions and the data were checked for C.I. using the geochemical code WATEQ4F (Ball and Nordstrom, 1991). WATEQ4F uses equation 4 to calculate C.I.:
(4)
anions)/2 sumcations (sum
anions) sumcations (sum100).(.
+−×
=percentIC where sum cations and sum anions are in milliequivalents per liter.
The C.I. is calculated on the speciated results, not the raw analytical data, because C.I. is dependent on speciation especially for acidic solutions. The C.I., sum cations (meq/L), and sum anions (meq/L) are reported in tables 5-10 for samples having major cation and anion determinations. A frequency plot of C.I. for all samples with complete analyses is shown in figure 22. The Gaussian fit C.I. mean is –1.1 percent with a standard deviation of 3.7 percent. Analyses having a C.I. less than ±10 percent are considered to be reliable for speciation calculations. One sample analysis, out of 77, had a C.I. (-12 percent) greater than 10 percent.
-20 -10 0 10 200
5
10
15
20
Charge Imbalance
Fre
quen
cy
mean = -0.5%meadian = -0.8%
Figure 22. Frequency of charge imbalance for samples having major cation and anion determinations.
70
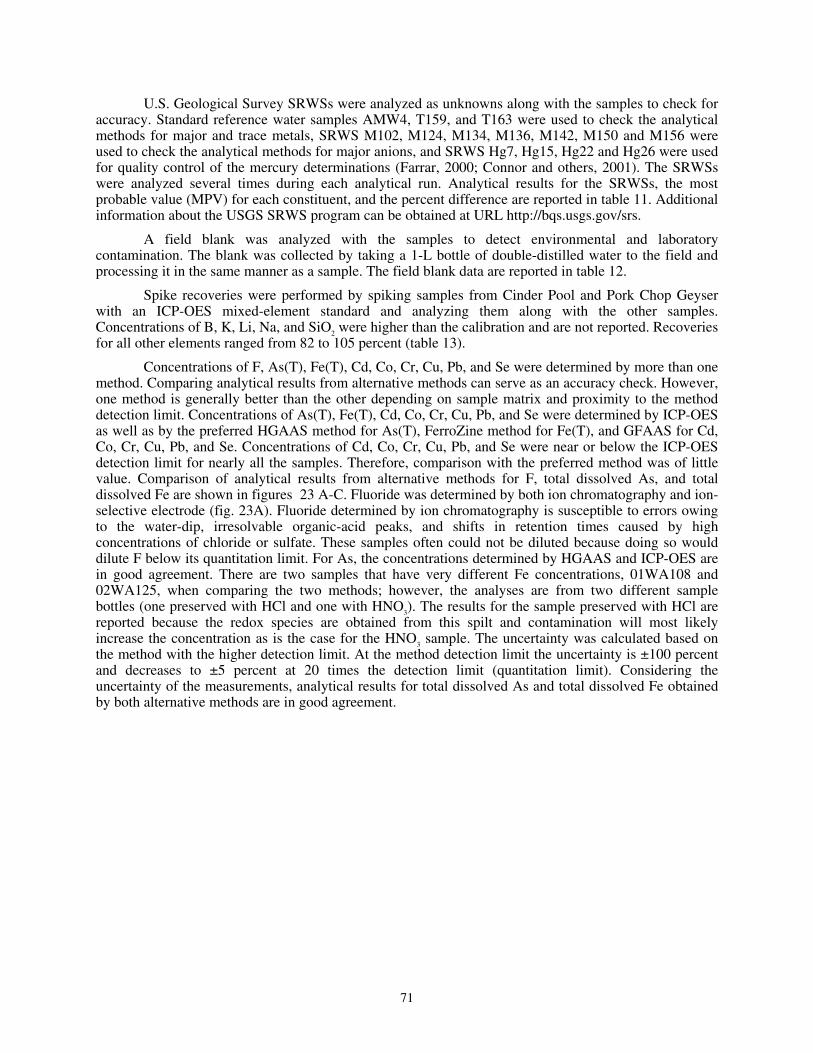
U.S. Geological Survey SRWSs were analyzed as unknowns along with the samples to check for accuracy. Standard reference water samples AMW4, T159, and T163 were used to check the analytical methods for major and trace metals, SRWS M102, M124, M134, M136, M142, M150 and M156 were used to check the analytical methods for major anions, and SRWS Hg7, Hg15, Hg22 and Hg26 were used for quality control of the mercury determinations (Farrar, 2000; Connor and others, 2001). The SRWSs were analyzed several times during each analytical run. Analytical results for the SRWSs, the most probable value (MPV) for each constituent, and the percent difference are reported in table 11. Additional information about the USGS SRWS program can be obtained at URL http://bqs.usgs.gov/srs.
A field blank was analyzed with the samples to detect environmental and laboratory contamination. The blank was collected by taking a 1-L bottle of double-distilled water to the field and processing it in the same manner as a sample. The field blank data are reported in table 12.
Spike recoveries were performed by spiking samples from Cinder Pool and Pork Chop Geyser with an ICP-OES mixed-element standard and analyzing them along with the other samples. Concentrations of B, K, Li, Na, and SiO2 were higher than the calibration and are not reported. Recoveries for all other elements ranged from 82 to 105 percent (table 13).
Concentrations of F, As(T), Fe(T), Cd, Co, Cr, Cu, Pb, and Se were determined by more than one method. Comparing analytical results from alternative methods can serve as an accuracy check. However, one method is generally better than the other depending on sample matrix and proximity to the method detection limit. Concentrations of As(T), Fe(T), Cd, Co, Cr, Cu, Pb, and Se were determined by ICP-OES as well as by the preferred HGAAS method for As(T), FerroZine method for Fe(T), and GFAAS for Cd, Co, Cr, Cu, Pb, and Se. Concentrations of Cd, Co, Cr, Cu, Pb, and Se were near or below the ICP-OES detection limit for nearly all the samples. Therefore, comparison with the preferred method was of little value. Comparison of analytical results from alternative methods for F, total dissolved As, and total dissolved Fe are shown in figures 23 A-C. Fluoride was determined by both ion chromatography and ion-selective electrode (fig. 23A). Fluoride determined by ion chromatography is susceptible to errors owing to the water-dip, irresolvable organic-acid peaks, and shifts in retention times caused by high concentrations of chloride or sulfate. These samples often could not be diluted because doing so would dilute F below its quantitation limit. For As, the concentrations determined by HGAAS and ICP-OES are in good agreement. There are two samples that have very different Fe concentrations, 01WA108 and 02WA125, when comparing the two methods; however, the analyses are from two different sample bottles (one preserved with HCl and one with HNO
3). The results for the sample preserved with HCl are reported because the redox species are obtained from this spilt and contamination will most likely increase the concentration as is the case for the HNO3 sample. The uncertainty was calculated based on the method with the higher detection limit. At the method detection limit the uncertainty is ±100 percent and decreases to ±5 percent at 20 times the detection limit (quantitation limit). Considering the uncertainty of the measurements, analytical results for total dissolved As and total dissolved Fe obtained by both alternative methods are in good agreement.
71

Table 11. Measurement of standard reference water samples
[GFAAS, graphite furnace atomic absorption spectrometry; HGAAS, hydride generation atomic absorption spectrometry; ICP-OES, inductively coupled plasma-optical emission spectrometry; ISE, ion selective electrode; mg/L, milligrams per liter; n, number of analyses; ng/L, nanograms per liter; s, standard deviation; SRWS, standard reference water sample; USGS, U.S. Geological Survey; %RSD, percent relative standard deviation; <, less than; ---, no data]
Analytical USGS Mean, Most Probable Percent Analyte Method SRWS n mg/L1 s %RSD Value, mg/L Difference Calcium (Ca) ICP-OES T159 14 25.6 0.259 1 25.5 0.3
Calcium (Ca) ICP-OES T163 14 6.45 0.081 1 6.3 2.4
Calcium (Ca) ICP-OES M156 14 31.3 1.930 6 30.2 3.6
Magnesium (Mg) ICP-OES T159 14 5.41 0.10 2 5.6 -3.3
Magnesium (Mg) ICP-OES T163 14 1.29 0.03 2 1.23 4.5
Magnesium (Mg) ICP-OES M156 14 6.98 0.61 9 6.92 0.8
Strontium (Sr) ICP-OES T159 14 0.191 0.004 2 0.19 0.8
Strontium (Sr) ICP-OES T163 14 0.036 0.001 3 0.0355 2.3
Strontium (Sr) ICP-OES M156 14 0.251 0.009 4 0.239 5.1
Barium (Ba) ICP-OES T159 14 0.0381 0.0010 3 0.0381 0.0
Barium (Ba) ICP-OES T163 14 0.0075 0.0006 8 0.0074 1.6
Sodium (Na) ICP-OES T159 14 98.2 4.3 4 100 -1.8
Sodium (Na) ICP-OES T163 14 38.2 0.8 2 39.6 -3.4
Sodium (Na) ICP-OES M156 14 44.8 1.4 3 44.6 0.5
Potassium (K) ICP-OES T159 14 1.80 0.07 4 1.52 18.7
Potassium (K) ICP-OES T163 14 1.06 0.04 4 1.02 3.7
Potassium (K) ICP-OES M156 14 2.35 0.13 5 2.13 10.5
Lithium (Li) ICP-OES T159 14 0.0101 0.0007 7 0.00857 17.8
Lithium (Li) ICP-OES T163 14 <0.003 --- --- 0.0016 ---
Sulfate (SO4) IC M124 3 601 11 2 621 -3.2
Sulfate (SO4) IC M136 2 147 5 3 150 -1.8
Sulfate (SO4) IC M142 3 233 4 2 231 0.9
Sulfate (SO4) IC M150 2 4.6 0.3 7 5.5 -16.5
Sulfate (SO4) IC M156 16 42.1 2 4 43 -2.1
Alkalinity (HCO3) Titration M102 1 231 --- --- 214.6 7.5
Alkalinity (HCO3) Titration M134 3 76.3 0.2 0 76.7 -0.5
Alkalinity (HCO3) Titration M156 1 76.9 --- --- 75.4 2.0
Fluoride (F) IC M150 2 0.923 0.18 19 1 -7.7
Fluoride (F) IC M156 8 0.592 0.12 20 0.523 13.1
Fluoride (F) ISE M150 1 1.12 --- --- 1 12.0
72

Table 11. Measurement of standard reference water samples – Continued
[GFAAS, graphite furnace atomic absorption spectrometry; HGAAS, hydride generation atomic absorption spectrometry; ICP-OES, inductively coupled plasma-optical emission spectrometry; ISE, ion selective electrode; mg/L, milligrams per liter; n, number of analyses; ng/L, nanograms per liter; s, standard deviation; SRWS, standard reference water sample; USGS, U.S. Geological Survey; %RSD, percent relative standard deviation; <, less than; ---, no data]
Analytical USGS Mean, Most Probable Percent Analyte Method SRWS n mg/L1 s %RSD Value, mg/L Difference Chloride (Cl) IC M124 3 83.3 0.6 1 82.8 0.6
Chloride (Cl) IC M142 3 136 3.3 2 132 2.9
Chloride (Cl) IC M150 2 19.8 1.8 9 17 16.5
Chloride (Cl) IC M156 9 65.6 1.1 2 64.7 1.4
Silica (SiO2) ICP-OES T159 14 11.8 0.3 3 11.5 2.8
Silica (SiO2) ICP-OES T163 14 4.69 0.15 3 4.56 2.8
Silica (SiO2) ICP-OES M156 14 5.40 0.32 6 4.73 14.1
Boron (B) ICP-OES T159 14 0.0275 0.0045 17 0.0264 4.0
Boron (B) ICP-OES T163 13 <0.01 --- --- 0.0106 ---
Boron (B) ICP-OES M156 14 0.0854 0.0057 7 0.0786 8.6
Aluminum (Al) ICP-OES T159 14 <0.07 --- --- 0.0319 ---
Aluminum (Al) ICP-OES T163 14 <0.07 --- --- 0.0168 ---
Iron total (Fe(T)) ICP-OES T159 14 0.0494 0.0027 5 0.0489 1.0
Iron total (Fe(T)) ICP-OES T163 14 0.0611 0.0022 4 0.06 1.9
Iron total (Fe(T)) FerroZine AMW4 3 193 0.6 0 188 2.4
Iron total (Fe(T)) FerroZine T163 2 0.0605 0.0003 0 0.060 0.8
Manganese (Mn) ICP-OES T159 14 0.0227 0.0008 4 0.022 3.2
Manganese (Mn) ICP-OES T163 14 0.0163 0.0007 4 0.0158 2.9
Copper (Cu) GFAAS T159 6 0.0342 0.0012 3 0.0334 2.4
Copper (Cu) ICP-OES T159 14 0.0340 0.0011 3 0.0334 1.7
Copper (Cu) ICP-OES T163 14 0.0369 0.0023 6 0.0358 3.1
Zinc (Zn) ICP-OES T159 14 0.0204 0.0013 6 0.0192 6.2
Zinc (Zn) ICP-OES T163 14 0.0203 0.0012 6 0.0185 9.7
Cadmium (Cd) GFAAS T163 8 0.0066 0.0002 2 0.00659 0.3 Cadmium (Cd) ICP-OES T159 14 0.0252 0.0008 3 0.024 5.1 Cadmium (Cd) ICP-OES T163 14 0.0070 0.0004 5 0.00659 6.5 Chromium (Cr) GFAAS T163 7 0.0400 0.0007 2 0.0401 -0.3 Chromium (Cr) ICP-OES T159 14 0.0268 0.0012 5 0.0268 0.1 Chromium (Cr) ICP-OES T163 14 0.0417 0.0019 5 0.0401 4.0 Cobalt (Co) GFAAS T159 6 0.0136 0.0005 3 0.0133 2.3 Cobalt (Co) ICP-OES T159 14 0.0138 0.0026 19 0.0133 4.0 Cobalt (Co) ICP-OES T163 11 0.0121 0.0012 10 0.012 0.7
73

Table 11. Measurement of standard reference water samples – Continued
[GFAAS, graphite furnace atomic absorption spectrometry; HGAAS, hydride generation atomic absorption spectrometry; ICP-OES, inductively coupled plasma-optical emission spectrometry; ISE, ion selective electrode; mg/L, milligrams per liter; n, number of analyses; ng/L, nanograms per liter; s, standard deviation; SRWS, standard reference water sample; USGS, U.S. Geological Survey; %RSD, percent relative standard deviation; <, less than; ---, no data]
Analytical USGS Mean, Most Probable Percent Analyte Method SRWS n mg/L1 s %RSD Value, mg/L Difference Mercury (Hg), ng/L CVAFS Hg7 12 2661 29 11 2201 20.9
Mercury (Hg), ng/L CVAFS Hg22 12 11801 53 4 12401 -4.8
Mercury (Hg), ng/L CVAFS Hg26 12 7101 74 10 7001 1.4
Mercury (Hg), ng/L CVAFS Hg15 12 3801 29 8 4101 -7.3
Nickel (Ni) ICP-OES T159 14 0.0224 0.0023 10 0.0222 0.9
Nickel (Ni) ICP-OES T163 14 0.0163 0.0020 13 0.0154 5.6
Lead (Pb) GFAAS T159 7 0.0160 0.0015 9 0.0166 -3.6
Lead (Pb) ICP-OES T159 14 0.0166 0.0023 14 0.0166 -0.3
Lead (Pb) ICP-OES T163 14 0.0325 0.0020 6 0.032 1.7
Beryllium (Be) ICP-OES T159 14 0.0110 0.0007 7 0.0108 2.1
Beryllium (Be) ICP-OES T163 14 0.0234 0.0008 4 0.022 6.3
Vanadium (V) ICP-OES T159 14 0.0136 0.0007 5 0.0144 -5.6
Vanadium (V) ICP-OES T163 14 0.0350 0.0008 2 0.035 -0.1
Vanadium (V) ICP-OES M156 14 0.0090 0.0009 10 0.00953 -5.3
Molybdenum (Mo) ICP-OES T159 3 0.0383 0.0012 3 0.0414 -7.5
Molybdenum (Mo) ICP-OES T163 5 0.0108 0.0014 13 0.0126 -14.0
Antimony (Sb) GFAAS T159 8 0.0135 0.0008 6 0.0139 -3.2
Antimony (Sb) GFAAS T163 8 0.0324 0.0038 12 0.0325 -0.3
Selenium (Se) GFAAS T159 23 0.0053 0.0005 10 0.00549 -3.8
Selenium (Se) GFAAS T163 16 0.0090 0.0011 12 0.00888 1.2
Arsenic total (As(T)) ICP-OES T159 14 0.0281 0.0141 50 0.0284 -0.9
Arsenic total (As(T)) ICP-OES T163 14 0.0270 0.0111 41 0.0253 6.8
Arsenic total (As(T)) HGAAS AMW4 28 0.170 0.003 2 0.168 1.1
Arsenic total (As(T)) HGAAS T159 27 0.0260 0.0011 4 0.0284 -8.6
1 Except for Mercury (ng/L)
74
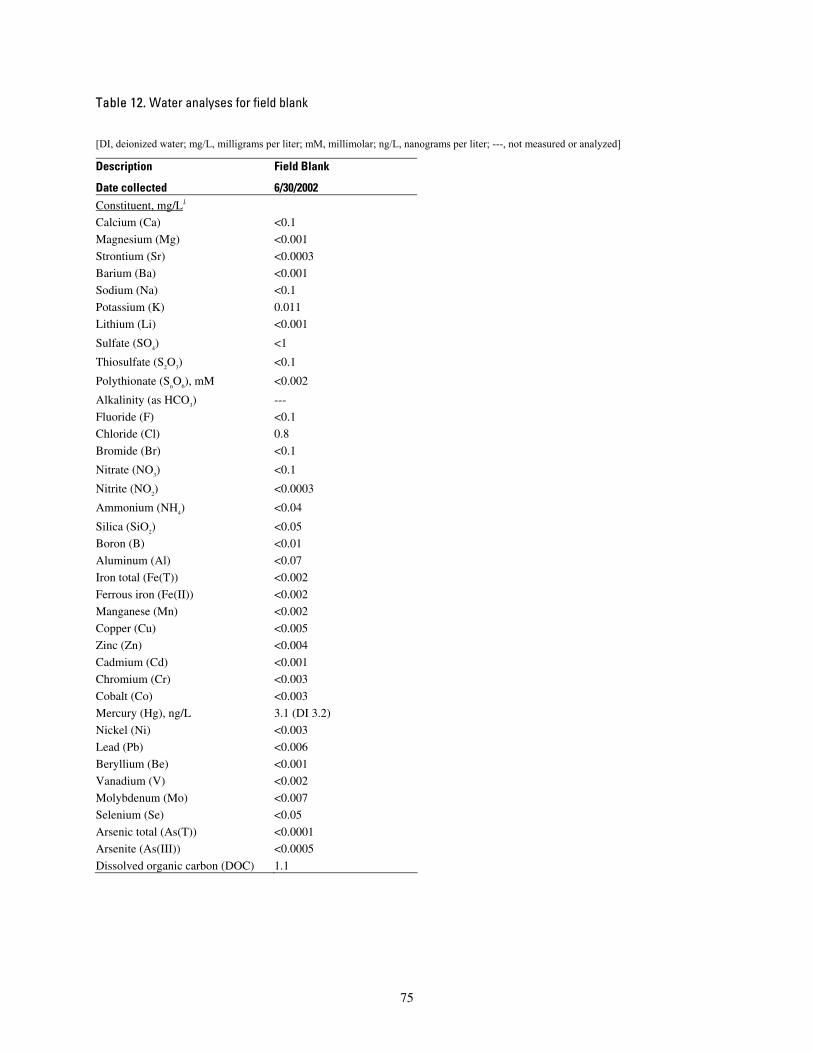
Table 12. Water analyses for field blank
[DI, deionized water; mg/L, milligrams per liter; mM, millimolar; ng/L, nanograms per liter; ---, not measured or analyzed]
Description Field Blank
Date collected 6/30/2002 Constituent, mg/L1
Calcium (Ca) <0.1
Magnesium (Mg) <0.001
Strontium (Sr) <0.0003
Barium (Ba) <0.001
Sodium (Na) <0.1
Potassium (K) 0.011
Lithium (Li) <0.001
Sulfate (SO4) <1
Thiosulfate (S2O
3) <0.1
Polythionate (SnO
6), mM <0.002
Alkalinity (as HCO3) ---
Fluoride (F) <0.1
Chloride (Cl) 0.8
Bromide (Br) <0.1
Nitrate (NO3) <0.1
Nitrite (NO2) <0.0003
Ammonium (NH4) <0.04
Silica (SiO2) <0.05
Boron (B) <0.01
Aluminum (Al) <0.07
Iron total (Fe(T)) <0.002
Ferrous iron (Fe(II)) <0.002
Manganese (Mn) <0.002
Copper (Cu) <0.005
Zinc (Zn) <0.004
Cadmium (Cd) <0.001
Chromium (Cr) <0.003
Cobalt (Co) <0.003
Mercury (Hg), ng/L 3.1 (DI 3.2)
Nickel (Ni) <0.003
Lead (Pb) <0.006
Beryllium (Be) <0.001
Vanadium (V) <0.002
Molybdenum (Mo) <0.007
Selenium (Se) <0.05
Arsenic total (As(T)) <0.0001
Arsenite (As(III)) <0.0005
Dissolved organic carbon (DOC) 1.1
75

Table 13. Spike recovery results
Pork Chop Geyser Cinder Pool
Analyte ---------------Percent Recovery----------- Aluminum (Al) 89 95
Barium (Ba) 97 97
Beryllium (Be) 90 82
Cadmium (Cd) 91 86
Calcium (Ca) 93 92
Chromium (Cr) 94 80
Cobalt (Co) 84 85
Copper (Cu) 87 91
Iron total (Fe(T)) 88 87
Lead (Pb) 88 82
Magnesium (Mg) 82 85
Molybdenum (Mo) 94 85
Manganese (Mn) 95 84
Nickel (Ni) 92 83
Strontium (Sr) 89 88
Vanadium (V) 82 82
Zinc (Zn) 105 87
76
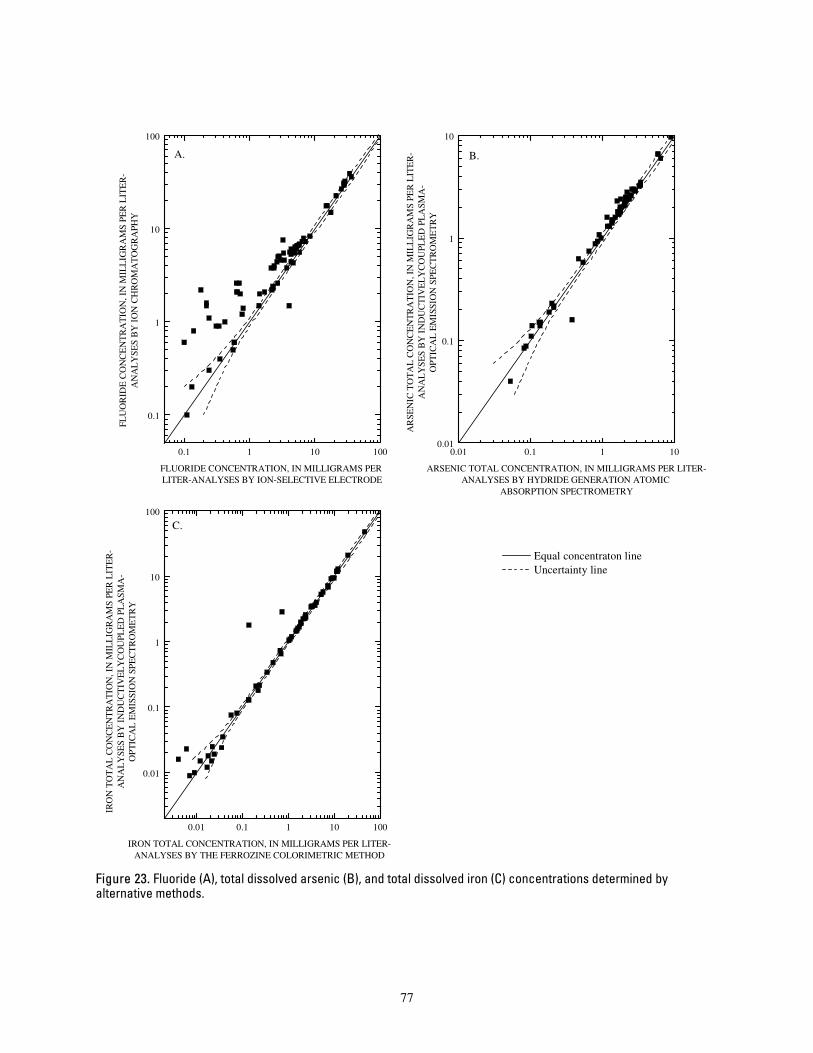
0.1 1 10 100
0.1
1
10
100
0.01 0.1 1 100.01
0.1
1
10
0.01 0.1 1 10 100
0.01
0.1
1
10
100
FL
UO
RID
E C
ON
CE
NT
RA
TIO
N, I
N M
ILL
IGR
AM
S PE
R L
ITE
R-
AN
AL
YSE
S B
Y I
ON
CH
RO
MA
TO
GR
APH
Y
FLUORIDE CONCENTRATION, IN MILLIGRAMS PER LITER-ANALYSES BY ION-SELECTIVE ELECTRODE
A.
AR
SEN
IC T
OT
AL
CO
NC
EN
TR
AT
ION
, IN
MIL
LIG
RA
MS
PER
LIT
ER
-A
NA
LY
SES
BY
IN
DU
CT
IVE
LY
CO
UPL
ED
PL
ASM
A-
OPT
ICA
L E
MIS
SIO
N S
PEC
TR
OM
ET
RY
ARSENIC TOTAL CONCENTRATION, IN MILLIGRAMS PER LITER-ANALYSES BY HYDRIDE GENERATION ATOMIC
ABSORPTION SPECTROMETRY
B.
Equal concentraton line Uncertainty line
IRO
N T
OT
AL
CO
NC
EN
TR
AT
ION
, IN
MIL
LIG
RA
MS
PER
LIT
ER
-A
NA
LY
SES
BY
IN
DU
CT
IVE
LY
CO
UPL
ED
PL
ASM
A-
OPT
ICA
L E
MIS
SIO
N S
PEC
TR
OM
ET
RY
IRON TOTAL CONCENTRATION, IN MILLIGRAMS PER LITER-ANALYSES BY THE FERROZINE COLORIMETRIC METHOD
C.
Figure 23. Fluoride (A), total dissolved arsenic (B), and total dissolved iron (C) concentrations determined by alternative methods.
77
APPENDIX 2. SAMPLE SITE PHOTOGRAPHS
78
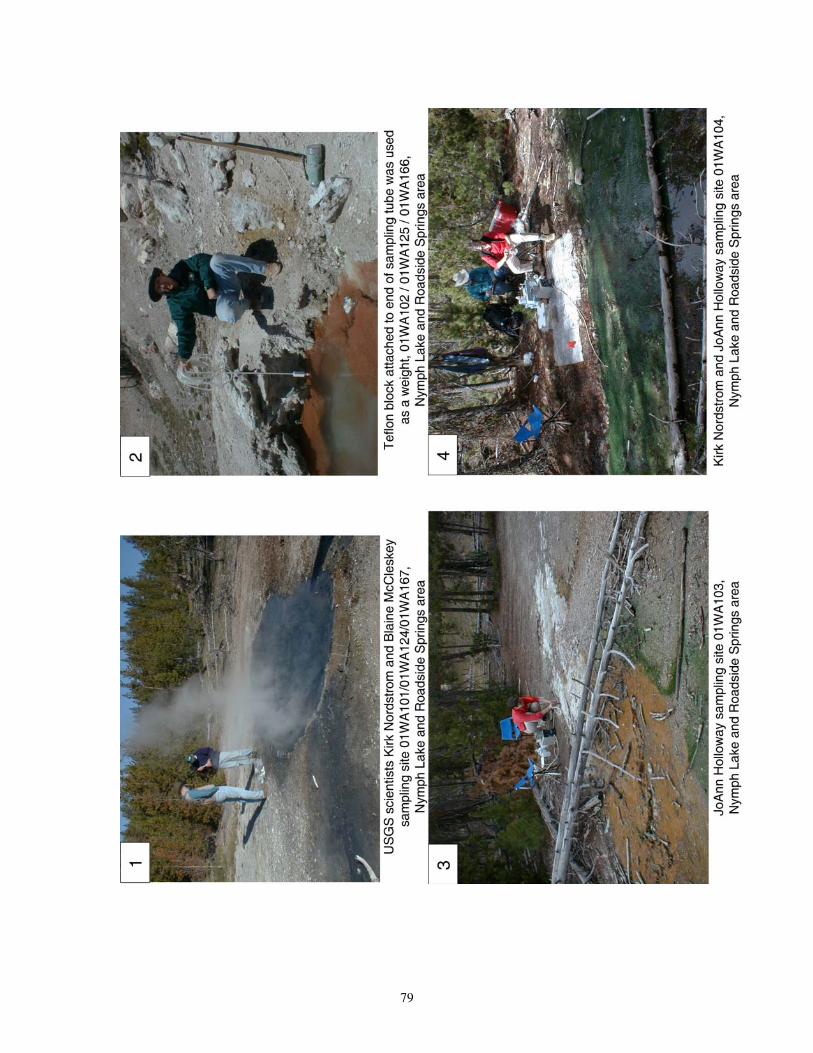
79
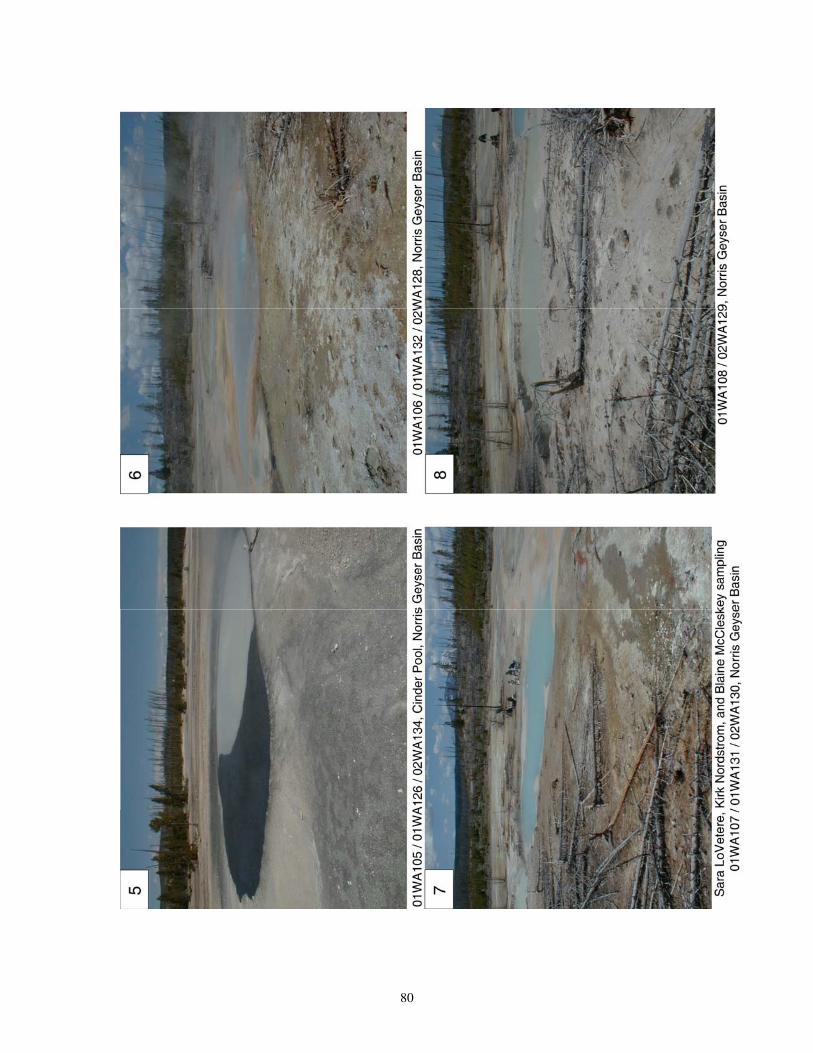
80
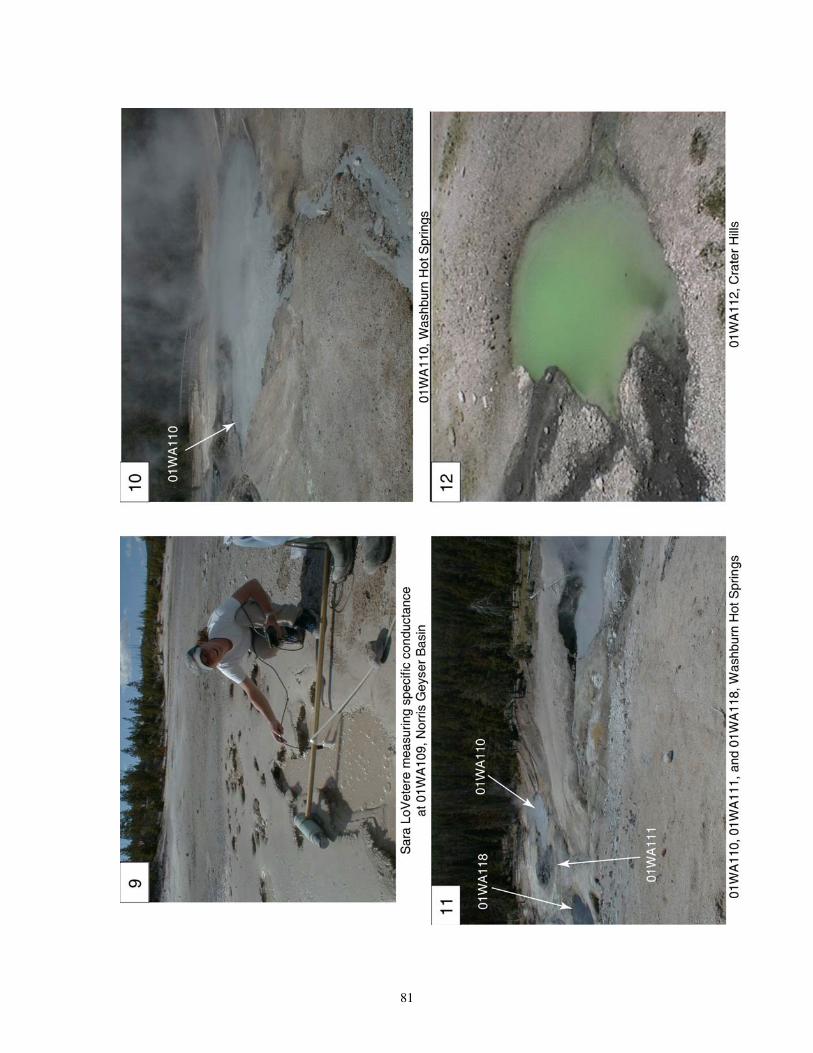
81
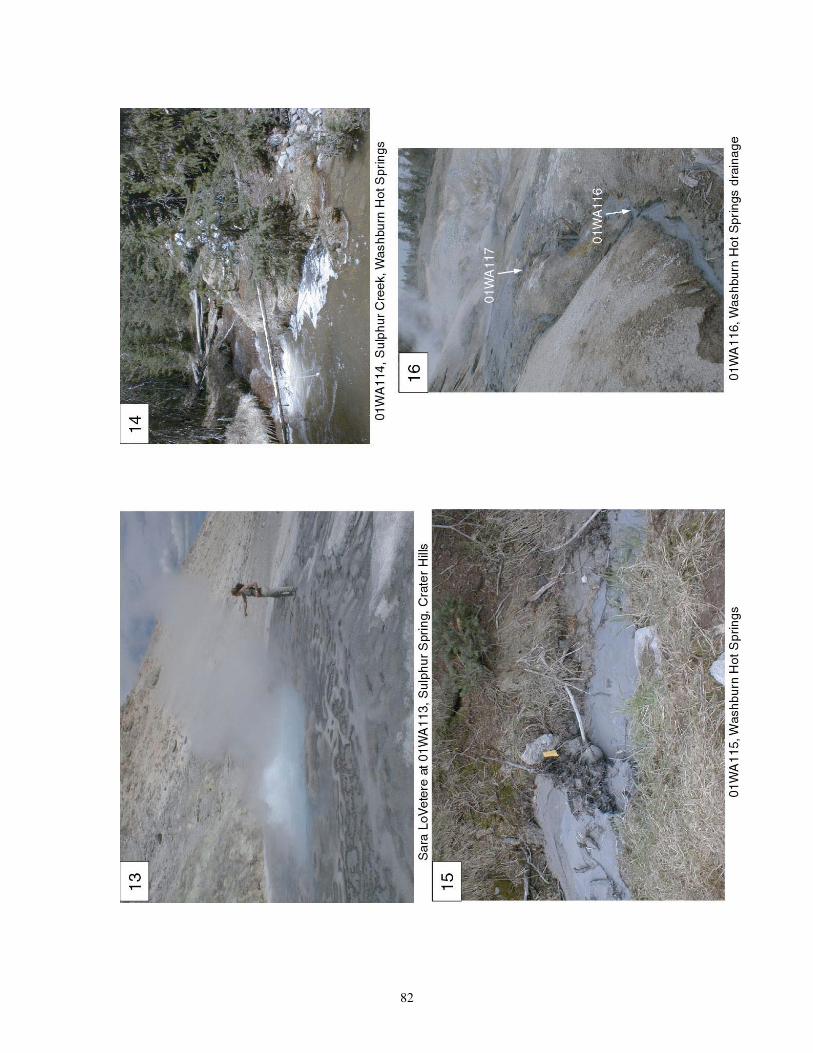
82

83

84 84
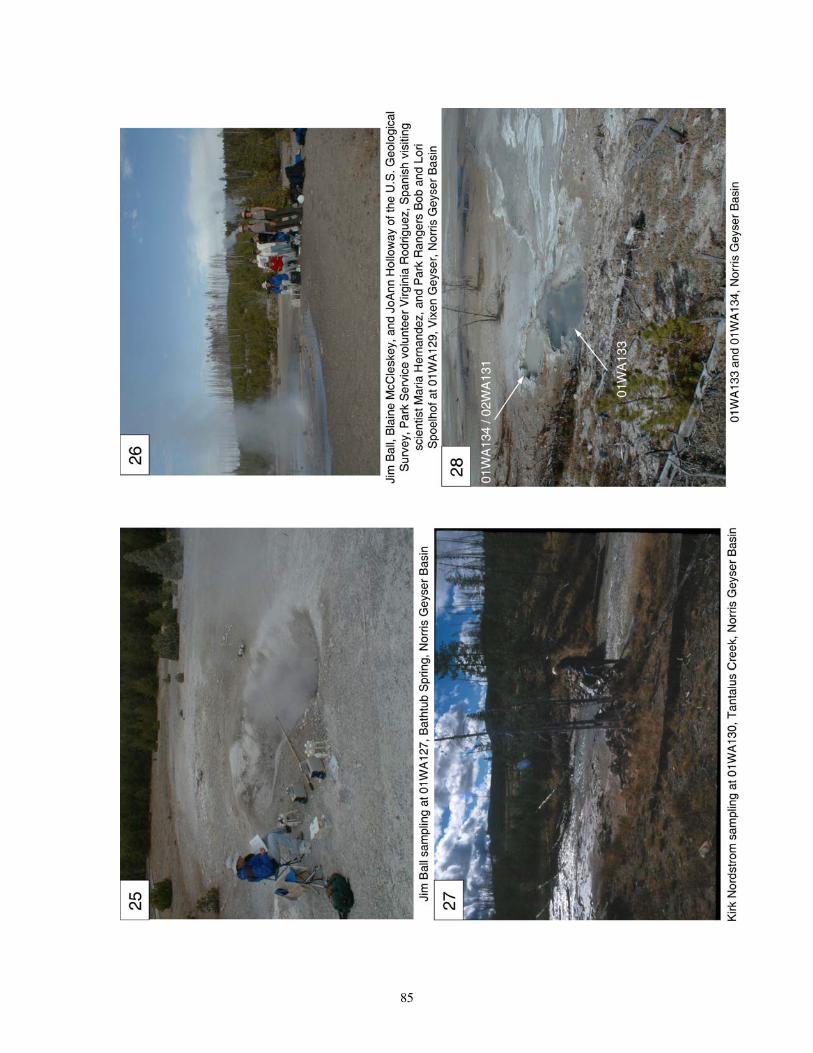
85
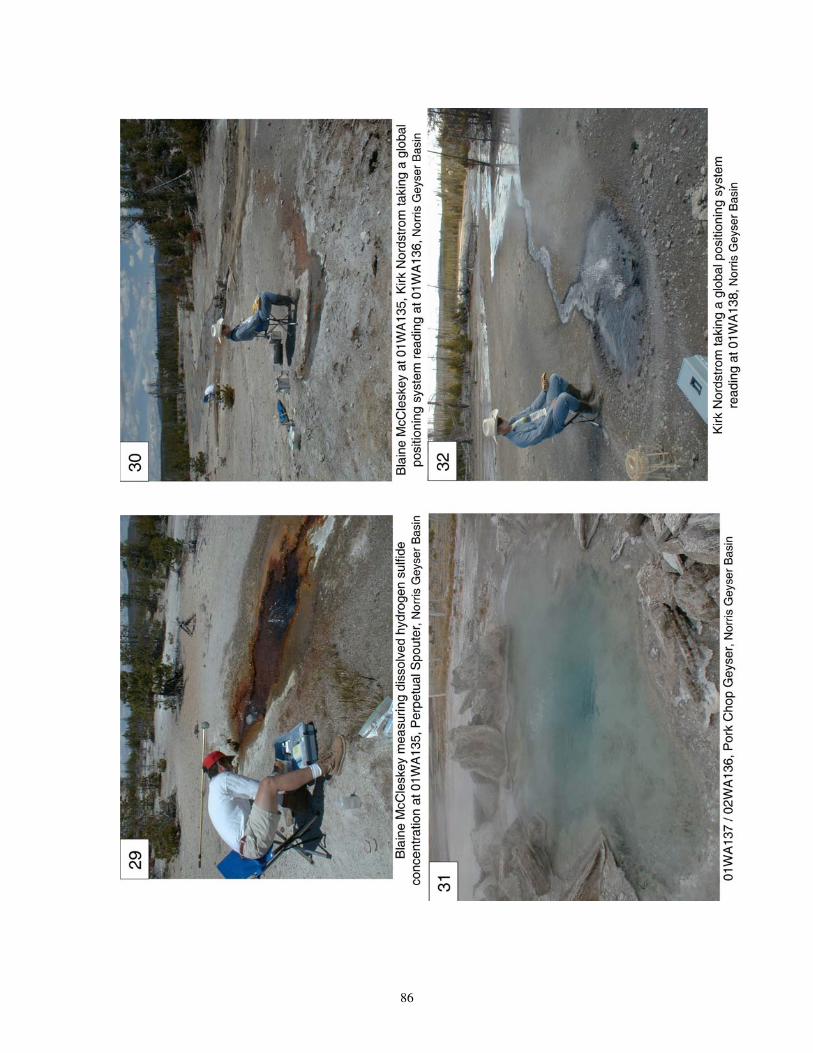
86

87

88

89
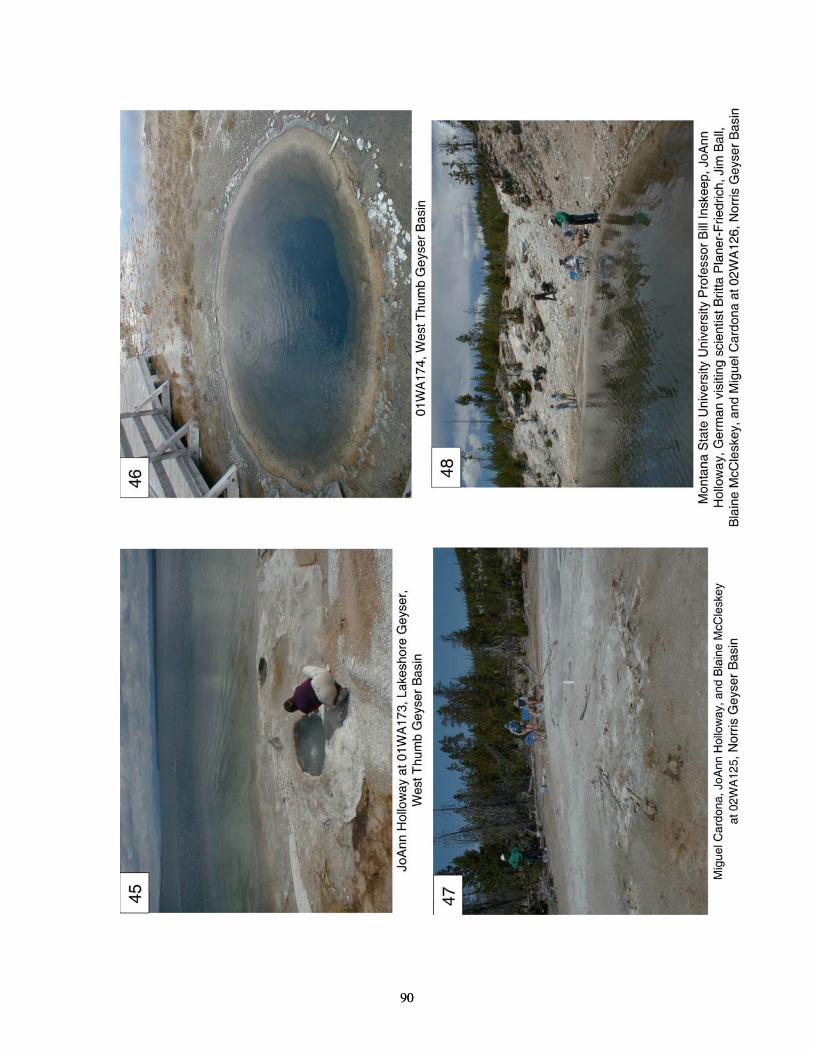
90 90
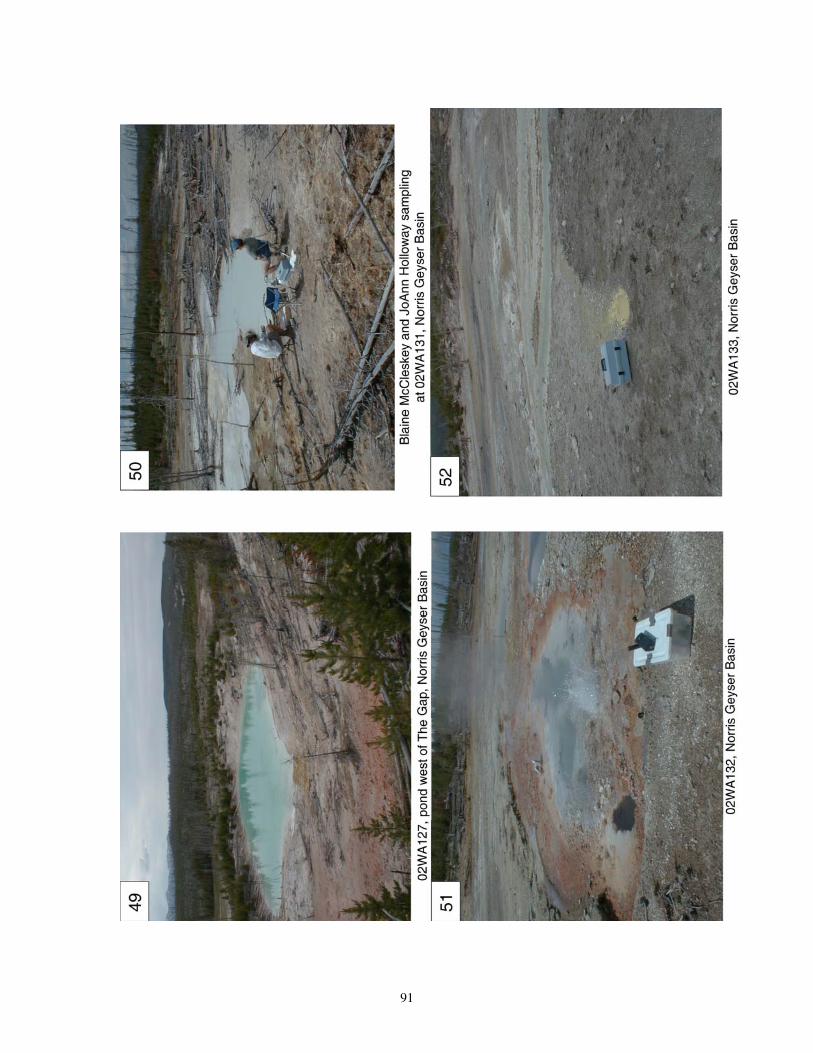
91
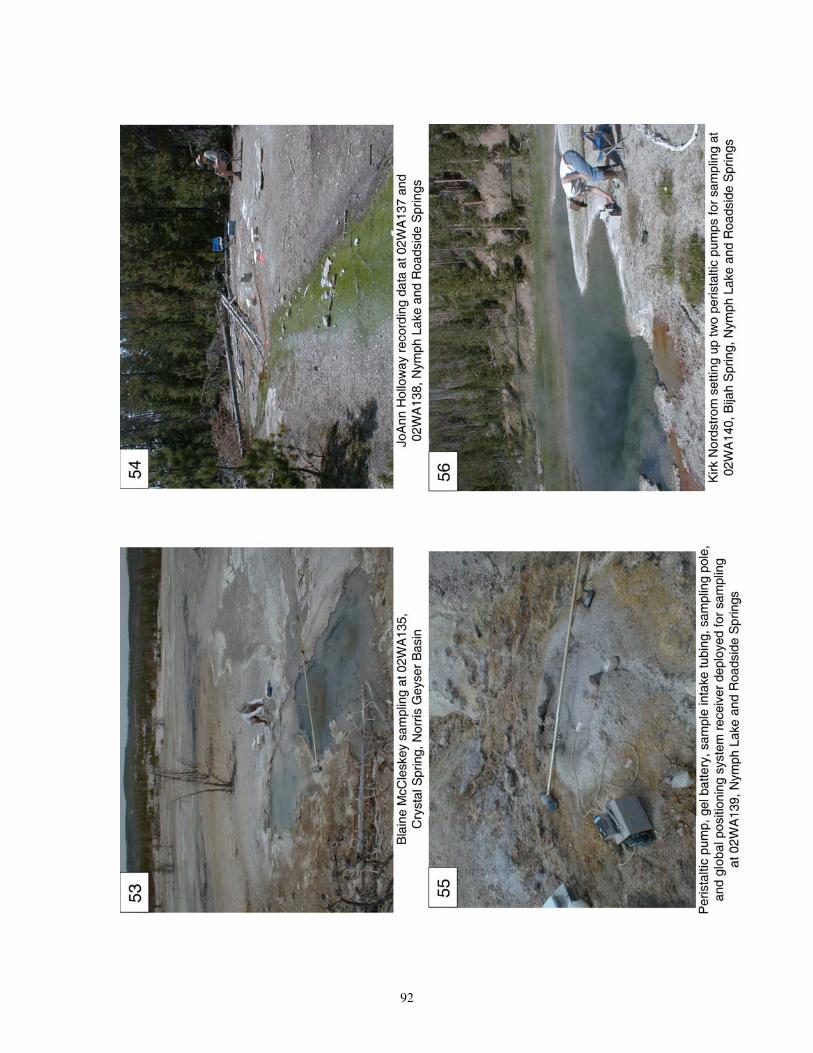
92
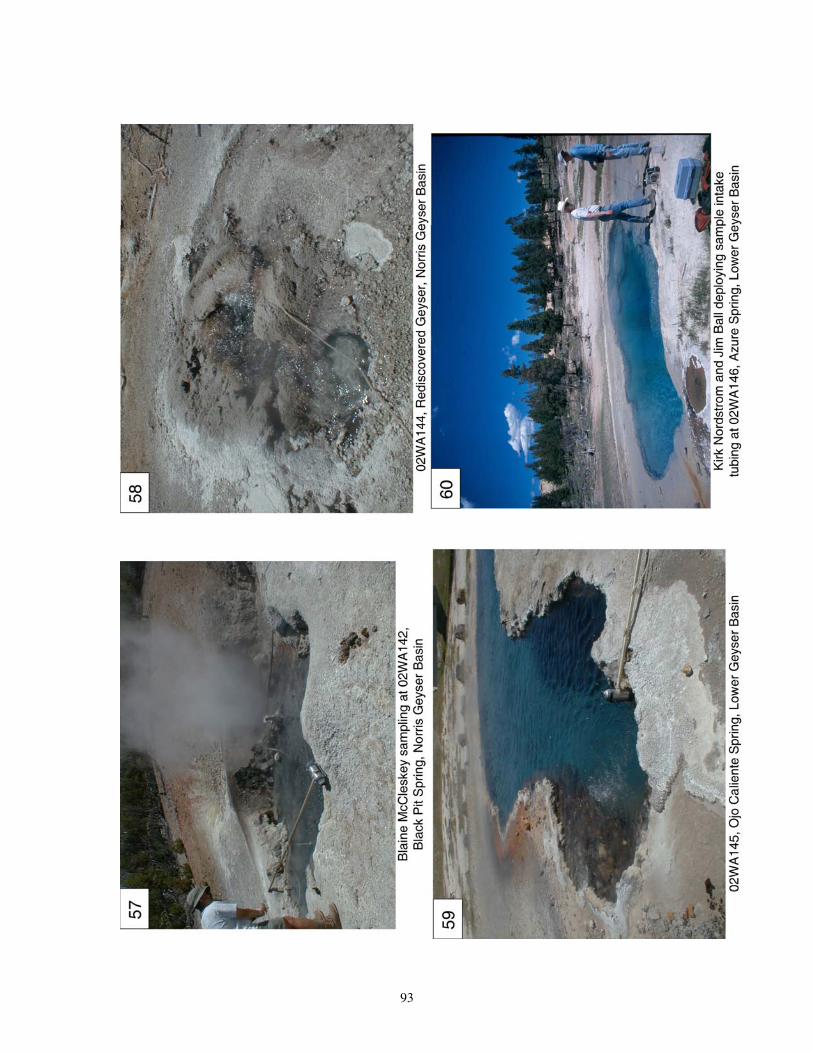
93

94