water balance assessment in unguja island, zanzibar,...
TRANSCRIPT

Water Balance Assessment in Unguja Island, Zanzibar, Tanzania
Haji Shaaban Haji March, 2010

Water Balance Assessment in Unguja Island, Zanzibar, Tanzania
by
Haji Shaaban Haji
Thesis submitted to the International Institute for Geo-information Science and Earth Observation in partial fulfilment of the requirements for the degree of Master of Science in Geo-information Science and Earth Observation, Specialisation: (Groundwater Assessment and Modelling) Thesis Assessment Board Prof. Dr. Ing. Wouter Verhoef (Chairman, ITC) Dr. M. S. Krol (External examiner, U T) Drs. Robert Becht (First Supervisor, ITC) Dr. Zoltan Zekerdy (Second Supervisor, ITC)
INTERNATIONAL INSTITUTE FOR GEO-INFORMATION SCIENCE AND EARTH OBSERVATION
ENSCHEDE, THE NETHERLANDS

Disclaimer This document describes work undertaken as part of a programme of study at the International Institute for Geo-information Science and Earth Observation. All views and opinions expressed therein remain the sole responsibility of the author, and do not necessarily represent those of the institute.

i
Abstract
For sustainable development of water resource management, there is much need of conducting frequent studies; this is due to the fast growing socio-economic activities, which has impact to this precious resource. However, this is not the case in Zanzibar whereby the last extensive water resource assessment studies was done in 1994. Water balance serves to be important tool for any further hydrological study. The aim of this study is estimate the water balance components of Unguja island, Zanzibar. In fulfilling this target SWAT model was used for the first time in the island in water resource study. The 30-m resolution topography data set from ASTER GDEM was used as a basis for the construction of the model application. The DEM, soil map, land cover map and weather data were supplied to Map Window GIS interface for analytical standard technique of watershed delineation. As a result of this, 30 sub watersheds were defined. Calibrated model simulated fairly well daily stream flow s in one of these sub watersheds for six years of simulation. The daily Nash- Sutcliffe coefficients were 0.60. The results of model show fairly good fit between SWAT and previous study done by Halcrow. Model predicts surface runoff of 31.76%, 44% evapotranspiration and 24% total groundwater recharge for study area of 941 km². Although model show satisfactory results, much effort are needed in collecting monitoring data, especially for discharge data for streams.

ii
Acknowledgements
I wish to thank all organization and individuals who made it possible for me to complete studies in ITC. I am very grateful to my sponsor, Netherland Fellowship Programme for giving me the chance to shine up my knowledge in Netherlands. I am very grateful to Zanzibar Water Authority management in Zanzibar, Tanzania (ZAWA), to have released me to come and further my knowledge here in Netherlands. My special thanks go to the Director General of ZAWA, Mr. Hemed S. Hemed for his frequent encouragement in academic issues. I am deeply indebted to my first supervisor Dr. Robert Becht for his supervision, advices and guidance that provided to me throughout my research period. He was always eager and willing to give his opinions to challenges. May God bless you. I would also like to thank my second supervisor Dr. Zoltan Vekerdy for his encouragement throughout the entire period of my research work. Since the first module of my study he was very kind, polite and much approachable. His knowledge has helped me so much. My acknowledgment will not be complete without mention Water Resource and Management Department team in ITC (WREM) for their support during my study. My field work campaign for data collection would not be successful without contribution from many individual like Mr. Uledi M. Uledi, retired soil scientist, Mr Juma A. Foum a technician from Irrigation Department for great effort that they extended to me. I would also like to express my gratitude to all my fellow staff for their help during my field work. My classmates and friends in Netherlands have been part of my family during my study period. They played big role in completion of my studies. I thank you all. Finally, I would like to send sincere gratitude to my family for their patience during the long absence. Your encouragement and motivation to me are well thanked. May God bless you all.

iii
Table of contents
1. Introduction .................................................................................................................................1
1.1. Background .........................................................................................................................1
1.2. Research Problems and Justification ....................................................................................2
1.3. Research objective ...............................................................................................................2
1.4. Research question ...............................................................................................................2
1.5. Outline of Thesis ..................................................................................................................3
2. Literature Review ........................................................................................................................4
2.1. Hydrology and water balance of small islands ......................................................................4
2.2. Impact of Land Cover and Land Use on hydrological cycle components ................................4
2.3. Application of SWAT model in water resource study ............................................................4
3. Previous Studies ..........................................................................................................................6
3.1. Some Selected studies .........................................................................................................6
4. Description of the study area and data analysis .............................................................................8
4.1. Location ...............................................................................................................................8
4.2. Population ...........................................................................................................................9
4.3. Climate ................................................................................................................................9
4.4. Geology ............................................................................................................................. 15
4.5. Drainage System. ............................................................................................................... 16
4.6. Hydrogeology .................................................................................................................... 16
4.7. Geomorphology ................................................................................................................. 16
4.8. Soil Resources .................................................................................................................... 17
4.9. Topography ....................................................................................................................... 18
4.10. Vegetation Cover and Land use ...................................................................................... 19
4.11. Water Resource in Unguja Island ................................................................................... 20
4.11.1. Surface Water Resource ............................................................................................. 20
4.12. Groundwater Resource in Unguja .................................................................................. 20
4.13. Water Balance in Unguja ................................................................................................ 21
5. Methods and Procudure ............................................................................................................. 23
5.1. Flow Chart. ........................................................................................................................ 23
5.2. Data Set Used .................................................................................................................... 24
5.2.1. Meteorological and hydrological data sets. .................................................................. 24
5.3. Model Set Up ..................................................................................................................... 25
5.3.1. Land use and Soil type. ............................................................................................... 26

iv
5.4. Model Execution................................................................................................................ 29
5.5. Sensitivities Analysis and Calibration ................................................................................. 29
6. Results and Analysis.................................................................................................................. 31
7. Conclusion ................................................................................................................................ 37
Reference .......................................................................................................................................... 38
Appendices ....................................................................................................................................... 41
Appendix A: Location of the rivers in the study area ...................................................................... 41
Appendix B-1 Min Temp (degree Centigrade) ................................................................................ 42
Appendix B-2 Max Temp (degree centigrade)................................................................................ 43
Appendix B-3 Solar Radiation (MJM⁻²) .......................................................................................... 45
Appendix B-4 Wind speed (m/s) ................................................................................................... 47
Appendix B-5 Relative Humidity (%) .............................................................................................. 48
Appendix B-6 Rainfall (mm) .......................................................................................................... 50
Appendix C-1 Flow discharge (m3/s) ............................................................................................. 52

v
List of figures
Figure 4-1 Location of the study area .................................................................................................8
Figure 4-2 Average Monthly Rainfall in Unguja Island ..................................................................... 10
Figure 4-3 Graph showing spatial and temporal distribution of rainfall in Unguja Island. ................... 11
Figure 4-4 Maps showing two different approaches of rainfall interpolation. ...................................... 11
Figure 4-5 Average Monthly Max and Min Temperature in Unguja Island ........................................ 12
Figure 4-6 Average Monthly Relative Humidity % ........................................................................... 13
Figure 4-7 Average Solar Radiation (MJM⁻²) ................................................................................... 13
Figure 4-8 Average Monthly Wind Speed [m/s]................................................................................. 14
Figure 4-9 Average Monthly evaporation [mm] ................................................................................. 15
Figure 4-10 Schematic water balance of Unguja Island..................................................................... 22
Figure 5-1 Location of Catchments in the study area .......................................................................... 26
Figure 5-2 Landcover/use for the study area ....................................................................................... 27
Figure 5-3 Soil map of the study area................................................................................................. 28
Figure 5-4 Scenerio one showing the sensitivity of the parameter ........................................................ 30
Figure 5-5 Scenerio two showing the sensitivity of the parameter ........................................................ 30
Figure 6-1 Relationship between rainfall and surface runoff .............................................................. 31
Figure 6-2 Catchment showing groundwater recharge........................................................................ 35
Figure 6-3 Relation between Surface runoff and Recharge ................................................................. 36
Figure 6-4 Relation between ET and Recharge in the catchments ....................................................... 36
vi
List of tables
Table 4-1 Average Monthly Rainfall in Unguja Island 1991 -2008 ...................................................... 9
Table 4-2 Spatial distribution of rainfall in Unguja island. ................................................................ 10
Table 4-3 Average Monthly Max and Min Temp in Unguja Island .................................................... 12
Table 4-4 Average Monthly Relative Humidity (%) ............................................................... 12
Table 4-5 Average Solar Radiation (MJM⁻²) .................................................................................... 13
Table 4-6 Average Monthly Wind Speed [m/s] .................................................................................. 14
Table 4-7 Average Monthly Evaporation [mm] .................................................................................. 14
Table 4-8 Different types of soil in Unguja Island ............................................................................. 18
Table 4-9 Estimation of river discharge in Unguja Island. ................................................................. 20
Table 4-10 Recharge for water resource zone in Unguja. ................................................................... 21
Table 5-1 Parameter required for weather generator file .................................................................... 25
Table 5-2 Unguja land use classes matched with SWAT land use and Code....................................... 27
Table 5-3 Sensitivities analysis results .............................................................................................. 29
Table 6-1 Annually simulation of the SWAT model for the study area................................................ 31
Table 6-2 Model simulation before calibration ................................................................................... 32
Table 6-3 Model Simulation after calibration ..................................................................................... 32
Table 6-4 Model performance values before and after calibration ...................................................... 33
Table 6-5 Average annually Catchment Water balance value ............................................................ 33
Table 6-6 Comparison of SWAT model and Halcrow, 1994 .............................................................. 34

WATER BALANCE ASSESSMENT IN UNGUJA ISLAND, ZANZIBAR, TANZANIA
1
1. Introduction
1.1. Background
Water is always a scarce resource that needs to be harnessed so as to meet the growing basic demand for development activities. It is critical to social and economic development and often directly affects the behaviours of the society. Its scarcity affects almost all social and economic developments and threatens the sustainability of human development activities and the whole ecosystem around him. Addressing the water problem needs joint effort from various sector and multidisciplinary approach to manage this vital resource. For this reason water agenda has become a sensitive in many parts of the world.(Appelgren and Klohn, 1999) In the last few decades, water issue has taken new vision not only from the experts and engineers only but also all stakeholders who articulate the claims, values and their common interests around water management issues. (Molle, 2009) This is because high level of water problems increases the frequency of claims between various stakeholders and endangers their security and even the threat on military conflict between the neighbouring countries (Hensel et al., 2006)
The fact that Zanzibar Island (Tanzania) is surrounded by sea without any neighbouring fresh water body except its groundwater reserve makes the issue more complex and sensitive. Like other small islands, this reserve in Zanzibar is nourished only by rainfall at current researched information available and therefore sustainability of these resources depends upon the nature. The availability of fresh water on small islands is frequently critical because it is dependent upon the temporal and spatial distribution of precipitation and on the storage potential above and below the ground. Thus water resources must be thoroughly investigated and their development carefully managed (Halcrow, 1994a). However, in recent year, industrial development, urbanization, and increase in agricultural production, has led to scientific approach to water resource planning, development and management. Number of high level organizations like UN have taken initiatives to address the water issues and progressively carrying out activities on the quantity and quality of global/regional water resources, trans-boundary water resources management, mitigation of water related hazards, and water education and research in various aspect (Jayakumar et al., 2009) Among these approach and initiatives is conducting the research on the assessment of water balance to increase our understanding on the process and behavior of hydrologic cycles for better sustainable management of water resources (Merka, 2000). Water balance assessment study enables evaluation of water resource and their change under the influence of anthropogenic activities but also it assists the forecasting of the consequences of artificial changes in the water body like lake, stream and groundwater basins. The necessity for clear understanding of hydrologic system becomes very essential because it forms the gateway for providing information for water resource managements (Ncube and Taigbenu, 2006).

WATER BALANCE ASSESSMENT IN UNGUJA ISLAND, ZANZIBAT, TANZANIA
2
1.2. Research Problems and Justification
For sustainable development of water resource management, there is much need of conducting frequent studies; this is due to the fast growing socio-economic activities, which has impact to this precious resource. However, this is not the case in Zanzibar whereby the last extensive water resource assessment studies was done in 1994. Some of the conceptual groundwater model made before by these studies seems to be not correct because large amount of information has become available for the last ten years from production borehole drilling (Halcrow, 1994). These justify the need of updating the previous studied by applying water balance assessment study which in turn serve as the starting point for any water resource study in the island (ZAWA-AfDB-UNHABITAT, 2008). Tourism industry, land use changes, agriculture practice, and deforestation in Zanzibar have been expanding rapidly for the last decade and expected to further increase in the near future. This issue poses a crucial problem for the water resource and their impact need to be assessed. In this context, water balance assessment study will help at least to fill the gap of water resource information and forming basic planning tool for sustainable development of water resources in Zanzibar (Gossling, 2001).
.
1.3. Research objective
The main objective of this study is to estimate water balance components on daily basis by using modeling technique and remote sensing data in Unguja Island. The main objective is achieved by fulfilling the following specific objectives: To estimate various water balance components in Unguja Island ( runoff, evapotranspiration and recharge) by using SWAT Model. To assess applicability of SWAT model in Unguja island. To develop different scenarios showing the impact of hydrologic components in the study area To calibrate the model using stream discharge measurements
1.4. Research question
In achieving the above objectives, the following research questions need to be answered: What are the dominant components of hydrological cycle that control the water resources in Unguja
Island? Is SWAT model possible to be used in Small Island for prediction of water balance components? How accurate the model simulations are.

WATER BALANCE ASSESSMENT IN UNGUJA ISLAND, ZANZIBAR, TANZANIA
3
1.5. Outline of Thesis Chapter two describe the literature review including hydrology of the small island like Zanzibar, impact of land use/cover to hydrologic cycle component and application of SWAT model in water resource study. Chapter three describes previous study in the study area concerning water resources including surface water, groundwater water balance. Chapter four describes the overview of the description of the study area including location of study area, population, climates, drainage, geology, geomorphology. Chapter five describes about the detail of the method and procedure used in this study. Chapter six describes the result and analysis of this research work Chapter seven describes about the conclusion and recommendation

WATER BALANCE ASSESSMENT IN UNGUJA ISLAND, ZANZIBAT, TANZANIA
4
2. Literature Review
2.1. Hydrology and water balance of small islands
Particular physical feature of small islands always results in specific problems in water resources. This is due to the space limitation and scarcity of large fresh water bodies and relatively high population density. This implies economic and social problems that necessitate urgent approach in assessment of water resource so as to sustain life of people and their daily activities. In this sense, the water governance reforms and the provision of knowledge to communities are very important to minimize the potential threat for these areas (White et al., 2007) Availability of fresh water in small islands is dependent upon the abundance and time distribution of rainfall and also upon storage potential above and below ground. Storage capacity depends on the presence of specific geologic and topographic features, but very limited by the impossibility to flood the small productive valley of small islands. The presence of perennial rivers is the result of exceptionally favorable quantities of precipitation and geological formation and topographic conditions. Due to the limited storage possibility, the relationship between rainfall and water resources availability is much closer in smalls islands than in large islands.(Arenes and Huertas, 1986)
2.2. Impact of Land Cover and Land Use on hydrological cycle components
Availability of water resources in many parts of the world is highly variable both in time and space. This always poses to concerned regions the risk in its use. The impact is further escalated by anthropogenic activities that in turn have big influence on the quantity and quality of water resource. With the increasing demands on water resources, comprehensive knowledge of hydrological system and the factor that influence it becomes very essential. This is because it is the starting point for providing reliable information for its management. The understanding includes among others, land and water linkages because land uses decision are water use decisions. Understanding this anthropogenic activities especial land cover and land use by using modern modeling techniques like SWAT help to provide good management approach to land and water resources (Ncube and Taigbenu, 2006)
2.3. Application of SWAT model in water resource study SWAT is a basin scale; continuous-time model that operates on the daily time step and it predicts the impact of management of water, sediment and agricultural chemicals in un-gauged watersheds. The model has been tested and proved to be efficient tool for assessing water resources and many other aspects in many part of the world (Gassman et al., 2007).

WATER BALANCE ASSESSMENT IN UNGUJA ISLAND, ZANZIBAR, TANZANIA
5
In water balance assessment study the major inputs in the model are climate data that includes daily precipitation, maximum and minimum temperature, solar radiation data, relative humidity and wind speed. Another essential input data are land use and soil properties. Almost all hydrologic balance components are simulated in SWAT including, evapotraspiration, canopy interception of precipitation, partitioning of precipitation, snowmelt water and irrigation water between surface runoff and infiltration, redistribution of water within soil profile and return flow from shallow aquifers. In SWAT model, simulation of hydrologic components of watershed is partitioned into two main partitions. The first partition is land phase of the hydrologic cycle that controls the amount of water entering the main channel in each sub-basin. The second partition is the routing phase of the hydrologic cycle that defines the movement of water sediments etc. through the channel network of the watershed to the outlet. The watershed in SWAT model are subdivided in sub-watershed and this increase the efficient of the model because it enables the model to reflect differences in evapotraspiration for different crops and soil in these sub-watersheds (Neitcsh et al., 2005). Based on combination of land use and soil, the sub-watersheds are further detailed into hydrological responses units (HRU). This is the fundamental unit in SWAT model by which calculation is based on (Immerzeel and Droogers, 2008). The ambiguity and many complexes in the catchments hydrology can be solved with the use of SWAT Model by applying it to the region of interest, for instance (Ndomba et al., 2008b) recommended to customize the SWAT model in the engaged catchment in Tanzania to improve the watershed management practice in the area. Although application of SWAT model is well popular especially in European countries, little have been published on the applicability of SWAT model in the tropical catchments particularly in East Africa and Nile basin. In Tanzanian catchments, for example, there are few research studies using SWAT model (Ndomba et al., 2008a). This study aimed at validation of SWAT model in data scarce environment in complex tropical catchments in Northeast of Tanzania. The model performed satisfactorily in this data poor areas but the authors have recommended a further validation effort to be done before the model is adopted for operational purpose.

WATER BALANCE ASSESSMENT IN UNGUJA ISLAND, ZANZIBAT, TANZANIA
6
3. Previous Studies
3.1. Some Selected studies
Considerable numbers of water resources have been done in Zanzibar. Most of these studies have much directed with the specific proposed project in certain areas of economy and no attempts have been made to quantify the overall water resources in the islands. In early 1980’s (Johnson, 1983) made extensive groundwater resources of Unguja island, this being part of a feasibility study for large-scale rice irrigation scheme. Following this report, hydrogeological map of Unguja and Pemba were published. Most of the later studies were very much based on Johnson’s works. Overviews of some of the reports are as follows: In 1950’s and 1960’s Shell and BP jointly studied the surface and subsurface geology of coastal Tanzania including Unguja island. The purposes of the study were mainly petroleum search. (Kent et al., 1971) produce summarized presentation of the report with respect to surface geology and deep borehole data. Johnson (1983) emphasized the available information of that time on hydrogeology focusing much on the feasibility on irrigation development scheme in Unguja. The published hydrogeological map of Zanzibar (Johnson, 1987) provides informative summary of this report. (Halcrow, 1994b) conducted the study on Zanzibar Water Resources Development by which he provided additional information to Johnson’s as well as hydrological studies of Zanzibar. He compiled and collected historical data from different sources and conducting monitoring programs to estimate the available water resources of the islands and the demand upon them. Among the important points in the studies are: Estimation of acceptable yields for each groundwater zones. Assessment of demands and forecast demands up to the year 2015 for different sector of
economy. Spatial distribution of the demands in relation to the water available in each groundwater zone
and identification of the areas prone to over-exploitation. More ever, Halcrow study focuses also on the feasibility of using surface water resource, extension of the area already available for irrigated rice production, as well as some options to meet future demand from economic sector like tourism. The study also shade light on the management measures to be taken for preservation of available water resources.

WATER BALANCE ASSESSMENT IN UNGUJA ISLAND, ZANZIBAR, TANZANIA
7
Finnida (1991) conducted the studies on Zanzibar Urban Water Supply Development Plan 1991-2015. The studies provide detailed information on the development plan for the rehabilitation and extension of the then existing Urban water supply systems for Zanzibar town and three towns of Pemba island, namely Wete, Chake Chake and Mkoani. Much of the information related to hydrogeology in this report is extracted from hydrogeological Map of Zanzibar (Johnson, 1987). In addition to that some information regarding to surface water, groundwater resource and quality, environmental aspect, water resource management and meteorology were also discussed. (Howard, 1994) made a review of water resource studies focusing on the groundwater resources in certain rural areas in Unguja and Pemba. The project which is named Zanzibar Rural Water Supply Project outlines the available water resources within the ZRWSP areas. The important activities done in this study are: Collection and review of relevant reports. Most of the information was taken from Halcrow
report (Halcrow, 1994) and from personal communication from the author. Reconnaissance field investigation. This involved identification of all the existing water
resource, determination of well depths, static water table, EC measurements and related hydrological aspects.
Evaluation of available geophysical data. This includes some resistivity profiles done in previous studies which gave some clues about structural geology of the study areas.
Selection of site for detailed geophysical study. This involved evaluation of preliminary data including aerial photographs, static water levels and EC which then led to selection of appropriate site for detailed geophysical investigation.

WATER BALANCE ASSESSMENT IN UNGUJA ISLAND, ZANZIBAT, TANZANIA
8
4. Description of the study area and data analysis
4.1. Location Zanzibar is a part of United Republic of Tanzania. It is located between 5⁰40’ and 6⁰30’ S, about 40km east, off mainland Tanzania. Unguja and Pemba are the two major islands that make up Zanzibar. Unguja island (where the study is focused) also referred to as Zanzibar and has a surface area of 1660 km2. It emerged from the sea during the drift faulting of the coastal areas (Johnson, 1983). It is separated from the Tanzania mainland by a shallow ocean channel. Bathymetrical study shows that the channel of Unguja is characterized by rapid increase of water depths from 30-40m increasing to 700-900m toward north and south of the channel. This may suggest a transition from a continental to an oceanic regime (Shaghude and Wannas, 1998) Location map of the study area
Figure 4-1 Location of the study area

WATER BALANCE ASSESSMENT IN UNGUJA ISLAND, ZANZIBAR, TANZANIA
9
. 4.2. Population According to the national census that was conducted on 2002, the population of Zanzibar Island is around 981,754 with an average annual growth rate of 3.1 percent. The current population is about 1,000,000. Women constitute about 51% of the total population. The average population density is 400 people per square kilometer. Rural population represents about 69% while urban constitute more than 30%. This situation has made Zanzibar one of the densest populated countries in Africa, South of Sahara (Tanzania Central Census Office, 2003). 4.3. Climate In general the climate of Zanzibar Island can be categorized as tropical lowland with moderately high temperature and high relative humidity. The weather is basically determined by the position of the Inter-tropical Convergence Zone (ITCZ), which is the low pressure belt (Tierney and Russell, 2007) by which the monsoons from the northern and southern hemisphere meet. The northeast monsoon is characterized by lower wind speeds, cooler water temperatures, calmer seas and a reduced velocity (1-2 knots) of East African Coastal Current. The southeast monsoon brings high winds, warm water temperatures and rough seas with velocity of East African Coastal Current increasing to speed of 4 knots. (UNEP, 1999). This zone follows the position of the sun and in this case it passes twice a year over Zanzibar islands and consequently resulting in two major rain periods. These are: Masika: Long rains from the south - from March to May, and Vuli or short rains from the north - from October to December. The average annual rainfall for the Zanzibar Island is approximately 1,600 mm, spread throughout the year and despite the distinct season they are fairly well distributed throughout hydrological year as shown in table 4.1 and figure 4.1 below. Based on the this records, it can be seen that long rain (Masika) contributes about 50% of the total rainfall while short rain (Vuli) contribute about 24% of the total rainfall in the island. This indicates that most recharge occurs during Masika rain. Table 4-1 Average Monthly Rainfall in Unguja Island 1991 -2008
Jan Feb Mar Apr May Jun Jul Aug Sep Oct Nov DecRainfall[mm] 73 46 184 377 260 81 53 51 45 95 146 133

WATER BALANCE ASSESSMENT IN UNGUJA ISLAND, ZANZIBAT, TANZANIA
10
Figure 4-2 Average Monthly Rainfall in Unguja Island Source: Data from Zanzibar Meteorological Station Northwest parts of the island gets relatively higher rainfall compared to others while the southern part gets relatively lower. In general, spatial variability is not so high and distribution is more or less the same. This can be illustrated by two maps in Fig.4-4, and Table 4-2 below using two different approaches of interpolation. Thiessen polygons and Inverse Distance approaches which were processed by using ILWIS software to show variability of rainfall in the island. Station Easting Northing RainfallKinyasini 537350 9326716 1623Mwera 529159 9318695 1642Selem 515493 9334583 1646Mkwajuni 533255 9347905 1847Kizimbani 517694 9292575 1847Kisauni 514383 9322423 1592Chwaka 527618 9237298 1667Muungoni 546966 9307841 1567Makunduchi 557115 9318347 1453Victoria 522037 9318347 1460Tunguu 537707 9318525 1265Mkokotoni 532720 9354137 1863
Table 4-2 Spatial distribution of rainfall in Unguja island.

WATER BALANCE ASSESSMENT IN UNGUJA ISLAND, ZANZIBAR, TANZANIA
11
0200400600800
100012001400160018002000
Long term Spatial distribution of Rainfall (mm) in Unguja
Rainfall
Figure 4-3 Graph showing spatial and temporal distribution of rainfall in Unguja Island. Below are two maps showing spatial distribution of rainfall and rainfall stations in Unguja island.
Figure 4-4 Maps showing two different approaches of rainfall interpolation.

WATER BALANCE ASSESSMENT IN UNGUJA ISLAND, ZANZIBAT, TANZANIA
12
The mean annual maximum and minimum temperature are about 30.1⁰C and 22⁰C respectively. December, January and February are the hottest months and June, July and August are the coolest ones. The table and figure below show the monthly average maximum and minimum temperature. Table 4-3 Average Monthly Max and Min Temp in Unguja Island
Jan Feb Mar Apr May Jun Jul Aug Sep Oct Nov DecMax Temp 31.53 32.14 31.65 30.11 29.38 28.44 28.12 28.47 29.04 29.86 30.96 31.09Min Temp 23.73 24.08 23.39 23.15 21.25 21.71 20.26 19.54 19.43 20.32 21.94 23.21
0
5
10
15
20
25
30
35
Jan Feb Mar Apr May Jun Jul Aug Sep Oct Nov Dec
Average Monthly Max and Min Temp. (⁰C) in Unguja
Max Temp
Min Temp
Figure 4-5 Average Monthly Max and Min Temperature in Unguja Island Source: Data from Zanzibar Meteorological Station Relative humidity records show the Unguja island has the mean monthly value of 68% with minimum monthly of 64% and reaches maximum of 76%. It can be seen in the figure below that in wet season the value of relative humidity is higher than the dry season. Table 4-4 Average Monthly Relative Humidity (%)
Jan Feb Mar Apr May Jun Jul Aug Sep Oct Nov DecMean RH% 67 64 70 76 72 66 65 64 65 67 70 69

WATER BALANCE ASSESSMENT IN UNGUJA ISLAND, ZANZIBAR, TANZANIA
13
Figure 4-6 Average Monthly Relative Humidity % Solar Radiation is the component that governs the rate of evaporation. In Unguja Island the radiation increase during the period of dry season of February and August and September with monthly values of about 20MJM⁻² while minimum value is around 16MJM⁻² in wet seasons of March – May and Nov-December. Table 4-5 Average Solar Radiation (MJM⁻²)
Jan Feb Mar Apr May Jun Jul Aug Sep Oct Nov DecAv. Mon Rad.[MJM⁻²] 18.97 19.9 18.4 16.01 15.83 16.26 17.01 17.31 19.25 19.3 16.73 17.43
Figure 4-7 Average Solar Radiation (MJM⁻²)

WATER BALANCE ASSESSMENT IN UNGUJA ISLAND, ZANZIBAT, TANZANIA
14
Wind speed is fairly constant throughout the year in Unguja Island with monthly average of about 4m/s. The maximum speeds occur from June to September while the minimum wind speed occur during the wet season of March – May and November to December Table 4-6 Average Monthly Wind Speed [m/s]
Jan Feb Mar Apr May Jun Jul Aug Sep Oct Nov DecAv. Mon W/Speed [m/s] 3.38 3.15 2.43 2.83 3.18 3.4 4.01 3.65 3.6 3.11 2.11 2.69
Figure 4-8 Average Monthly Wind Speed [m/s] Meteorological data from 1991 to 2009 were used to calculate monthly evaporation as shown in the table and figure below. The table below shows variation of monthly evaporation throughout the year. Table 4-7 Average Monthly Evaporation [mm]
Jan Feb Mar Apr May Jun Jul Aug Sep Oct Nov Dec Evap. [mm] 166 157 136 99 112 122 133 135 154 154 115 119

WATER BALANCE ASSESSMENT IN UNGUJA ISLAND, ZANZIBAR, TANZANIA
15
Figure 4-9 Average Monthly evaporation [mm] It can be seen from the figures 4.7, 4.8 and 4.9 that there is somehow similar trends for solar radiation, wind speed and evaporation, which imply their relationship. All these meteorological data were analyzed by using excel spread sheet software. 4.4. Geology Geologically, Unguja and Pemba islands were once attached to the mainland Tanzania as part of the Rufiji River delta. Tectonic movement activities isolated these islands from the mainland. Unguja became an island a few million years ago during the Quaternary period, and is separated by shallow sea less than 100m deep. Stratigraphy of Unguja island coincides with the one of eastern African coast with sediment layers with different compositions and increasing thickness of Cainozoic, Mesozoic and Palaeozoic eras.(Stockley, 1942) The coastal plateau is shaped by thick sedimentary rocks, with a predominating north-south fault direction. The late tectonic development has also affected the present morphology both on land and in the sea (Shaghude and Wannas, 1995) Its geomorphology suggests periods of higher sea level, marine erosion with wave cut cliffs and platforms, reworked marine and fluviatile sediments plus tilting rocking with a raised abandoned sea cliffs and beaches, raised and submerged coastal reefs (UNDTCD, 1987) On the surface of the Island, it can be found only Quaternary and Tertiary (Miocene) sediments. They are mainly sand, cemented sandstone and several forms of limestone like the weathered coral rock, which are mainly outcrops on most of the eastern part of the island. Thickness of the quaternary layer does not exceed 35m, but Miocene layers may go up to around 2500m. Thin quaternary deposits cover most of the Miocene soils.

WATER BALANCE ASSESSMENT IN UNGUJA ISLAND, ZANZIBAT, TANZANIA
16
Composition of these soils differs all over the island, sometime even when they date from the same geological era. This has led to several complexes of Miocene and quaternary layers with different hydrological properties (DIWI, 1990) 4.5. Drainage System. Due to the topographic feature of Unguja island, the drainage are mainly westerly but also predominantly subsurface except in the area with heavy sticky clay soil formation. Due to presence of Karstic formation, sinkhole and caverns characteristic some of the major streams disappear into these porous formations. This behavior of soil tends to cause infiltration being very rapid and rapid rise of water table after heavy rainfall in the areas where underlying formations are of clayey type. In some elevated areas like Donge in Northern part of the island where dissection of ridge are common, the underlying rather slowly permeable heavy clay soils caused the lateral subsurface flows which lead to sliding of top sandy layers resulting in dissected landscape and a dendrite drainage pattern (FAO, 1989) 4.6. Hydrogeology The geology and hydrogeology of many small islands like Unguja greatly influences the type and distribution of water resources. This can be illustrated through the spatial distribution of rock and soils with varying permeability and porosity. In Unguja, most of geological formations posses some properties, which exhibit potentials for aquifer. Most of these aquifers are unconfined although, locally can be confined. Perched aquifers are very common and often give misleading water table readings and variation in many areas. 4.7. Geomorphology In Unguja island, geomorphology especially of coastal areas is typical related to regional style. It is resemble the one of Tanzania coast. The shore of Unguja island is characterized mainly by intertidal fringing platforms which extends to few kilometers seaward from the seashore. It should be noted that this fringing platform apart from its role in shaping the coastal area of the island, it has significant socioeconomic importance as large number of people devoted to economic activities like coconut fiber production, seaweed farming, shell fish gathering and fishing. They are also of great ecological importance as well supporting corals, turtles and wading birds and in this way they serve as prime assets for eco-tourism as well (Arthurton et al., 1999) On the western part of Unguja flank is rather smooth and gentle. The only geomophological exceptions are the patch reefs that disturb the smoothness shape. The geomorphological difference between the eastern and western coast of the island are suggested to be partly caused by differences in the tectonic development of the two areas. To the large extent, terrigenous input of sediments from the mainland through river Ruvu and Wami controls the sediment distribution patterns on the sea bottom in the

WATER BALANCE ASSESSMENT IN UNGUJA ISLAND, ZANZIBAR, TANZANIA
17
western part of the island. This is illustrated by the distribution of carbonate as well as the grain size parameters. The absence of any major rivers in the island means that no major transport mechanism is available for terrigenous material in the east (Shaghude and Wannas, 1998) 4.8. Soil Resources Among the major factor determining the soil types are climate, physiographic relief, parent materials and past history (T, 1937). Soil resources in Unguja can be grouped in three main groups. These groups are then further subdivided in other subgroups, depending on their physical and their mode of formation. According to (Hattige, 1990), these soil groups locally named as:
(1) Kichanga Group (Sandy Group) (2) Kinongo Group (Loamy Group) (3) Kinamo Group (Clayey Group)
The groups can be summarized in the table below as follow:

WATER BALANCE ASSESSMENT IN UNGUJA ISLAND, ZANZIBAT, TANZANIA
18
Polygon No Local name FAO_Classif_Name Lithological Description Infiltration Rate FAO Texture Assigned Hydrologic Group1 Shallow Kinongo Haplic and Humic Ferralsol Crystalline, Reef and Detrital Limestone Medium to High Loam B2 Shallow Kinongo Haplic and Humic Ferralsol Crystalline, Reef and Detrital Limestone Medium to High Loam B3 Shallow Kinongo Haplic and Humic Ferralsol Crystalline, Reef and Detrital Limestone Medium to High Loam B4 Shallow Kinongo Haplic and Humic Ferralsol Crystalline, Reef and Detrital Limestone Medium to High Loam B5 Shallow Kinongo Haplic and Humic Ferralsol Crystalline, Reef and Detrital Limestone Medium to High Loam B6 Shallow Kinongo Haplic and Humic Ferralsol Crystalline, Reef and Detrital Limestone Medium to High Loam B7 Shallow Kinongo Haplic and Humic Ferralsol Crystalline, Reef and Detrital Limestone Medium to low Loam C8 Maweni Rhodic Ferralsol Crystalline, Reef and Detrital Limestone Medium to low Loam Clay C9 Deep Kinongo Rhodic Ferralsol Crystalline, Reef and Detrital Limestone Medium to low Loam Clay C
10 Deep Kinongo Rhodic Ferralsol Crystalline, Reef and Detrital Limestone Medium to low Loam Clay C11 Deep Kinongo Rhodic Ferralsol Crystalline, Reef and Detrital Limestone Medium to high Loam Clay C12 Deep Kinongo Rhodic Ferralsol Crystalline, Reef and Detrital Limestone Medium to low Loam Clay C13 Deep Kinongo Rhodic Ferralsol Crystalline, Reef and Detrital Limestone Medium to high Loam Clay C14 Kinamo Eutric and Calcic Vertisol, cambisol Marls, Sandy Clays and cleyey sands Low Clay Loam C15 Kinamo Eutric and Calcic Vertisol, cambisol Marls, Sandy Clays and cleyey sands Low Clay Loam C16 Uwanda Mollic and Rendzic Leptosol Coralline and reef limestone high Sandy Loam A17 Uwanda Mollic and Rendzic Leptosol Coralline and reef limestone high Sandy Loam A18 Uwanda Mollic and Rendzic Leptosol Coralline and reef limestone high Sandy Loam A19 Uwanda Mollic and Rendzic Leptosol Coralline and reef limestone high Sandy Loam A20 Uwanda Mollic and Rendzic Leptosol Coralline and reef limestone high Sandy Loam A21 Reddish Mchanga Rhodic Nitisoils and Haplic Acrisols Marls, Sandy Clays and cleyey sands Medium to high Sandy Clay Loam A22 Gleyish Mchanga Ferric and Gleyic Acrisol Crystalline limestone, Marls, sandy and clay Medium to high Sandy Silt Loam B23 Gleyish Mchanga Ferric and Gleyic Acrisol Crystalline limestone, Marls, sandy and clay Medium to high Sandy Silt Loam B24 Gleyish Mchanga Ferric and Gleyic Acrisol Crystalline limestone, Marls, sandy and clay Medium to high Sandy Silt Loam B25 Sandy Mchanga Dystric Cambisols and Cambic ArenosolsMarls, sandy clays and sandstone Medium to low Loamy Sands B26 Sandy Mchanga Dystric Cambisols and Cambic ArenosolsMarls, sandy clays and sandstone Medium to low Loamy Sands B27 Maweni Rendzic Leptosol Sands and sandstone, marls, sand clay High Sandy Loam A28 Maweni Rendzic Leptosol Sands and sandstone, marls, sand clay High Sandy Loam A29 Shallow Kinongo Haplic and Humic Ferralsol Crystalline ,reef and detrital limstone Medium to high Clay Loam B30 Shallow Kinongo Haplic and Humic Ferralsol Crystalline ,reef and detrital limstone Medium to high Clay Loam B31 Kinamo Eutric and Calcic Vertisol, cambisol Marls, Sandy Clays and cleyey sands Low Clay Loam C
Table 4-8 Different types of soil in Unguja Island
4.9. Topography
Tectonic activities which led to the formation of deltaic feature in the coastal of Tanzania largely related to shape the surface geology of the island which then controlled much of the topography of Unguja island. Wide valley corridors, fault structures and residual hills reaching about 120m in the central region of the island characterize it. The drainage of the island is not well defined and no major rivers contribute to the overall system. But drainage channels have developed with time along the slops of

WATER BALANCE ASSESSMENT IN UNGUJA ISLAND, ZANZIBAR, TANZANIA
19
Miocene limestone ridges, draining directly to the sea and some minor rivers drain within the corridor valleys (FINNIDA, 1991). In generals three topographic landforms can be concluded in the island, these are:
1) The undulating and elevated Miocene country in the central and North- western area. 2) The corridor or channel country 3) The flat coastal periphery and coral rag country.
Undulating Miocene is heavily cultivated with spices; by contrast, the country corridor with its shallow waterlogged soils remains as open grassland with local areas given oven over rice production and local irrigated rice farms. On the coral rag country, which constitute over half of the island, there is virtual no soil and is dominated by sharp jagged and rocky surface which hold thickets and scraggy grasses The prominent feature which can be found in the eastern part of the island and east coast coral rag is the multitude of elevated sea cliffs, raised strand lines and beaches, which along with the raised offshore reefs establish the nature of island movement and in particular its tilting to the west phase (Johnson, 1983)
4.10. Vegetation Cover and Land use
According to (Hettige, 1990), anthropogenic activities have greatly influenced the landscape of Unguja island in such a way that mosaic of forest re-growth, secondary forest resulting from bush fallow cultivation practices, now cover the Maweni (Coral rag) zones within the coastal and coralline areas. Over time the landscape of Unguja has modified into a predominantly agricultural landscape. Currently cropland cover over 50000 hectares (Klein, 2008) Due to the development of tidal and freshwater inundations, swamp specific vegetations have developed in the coastal and inland swamp areas. Most extensive swamp forests are located around central east of the island. Some of the taller species of trees attain height up to 20m and thus become suitable for timber production. Natural forests and woodlands are also occurs in forest reserves, coral rag forests and mangrove and cover a total area of about 11000 hectares. Mangrove forests occur in the shallow water in coastal areas (ZILEM, 1995) Apart from natural forest and woodland areas, there are also coral rag bush areas covered with natural vegetation especially during fallow periods. Due to growing population in these areas, deforestation tendency has become common and more shifting cultivation with shorter fallow periods. The practice of shifting cultivation involves clearing vegetation by slashing and burning it during dry season and cultivating it during wet season (Kombo and Kitwana, 1997)

WATER BALANCE ASSESSMENT IN UNGUJA ISLAND, ZANZIBAT, TANZANIA
20
4.11. Water Resource in Unguja Island
In most oceanic island like Unguja, freshwater is always limited resource. Fortunately for Unguja Island, due to high amount of annual rainfall. For the purpose of this study, water resources can be mainly categorized into two types. These are surface and groundwater resource.
4.11.1. Surface Water Resource
Topography has very important significance on the availability of surface water. On Unguja, due to its flatness feature there are few rivers. These rivers are divided into those that reach the sea or rather called coastal rivers and those that do not reach the sea, or inland rivers. Coastal rivers are located at the northwest of the island, these are smaller rivers which do not represent significant resources. Inland rivers are mainly situated central part of the island, these rivers disappear on the coral rag limestone into the sink holes. These include River Pangeni, Mwera and Kinyasini. They are considered to have some resource value due to the contribution of their flow to the groundwater recharge. Appendix ( A ) show the location of the river. Apart from these rivers, Unguja island has considerable number of springs. Among the very important ones are Bububu and Mtoni springs by which Zanzibar Town had its first supply from them. According to (DIWI, 1990) another two springs also worth mentioned, these are Kiwani bay in the North West and Kombeni in the south of the island. It is considered that the Kombeni spring is the emergence of Mwera River, but further studies are needed to justify this. One important thing to note here is that despite the presence of springs in the southern areas, saline water intrusion was reported inland far away from this spring. This may suggests that the spring flow may be fracture controlled within the limestone formation, which operates independently, as a separate discharge mechanism. Some of the rivers and their flow discharges are shown in the table below. River Record Length Av. Daily Flow Estimated Yield Period Rainfall Runoff PotentialBububu 29 Apr to 8 June 0.2 m³/s 700Ml 571mm 30 t0 40%ZingweZingwe 31 Mar to 9 Jun 1.6m³/s 9800Ml 933mm 30 to 50%Kitope 30 Mar to 9 Jun 0.4m³/s 2600Ml 938mm 40 to 55%Mchanga 30 Mar to 8 Jun 0.4m³/s 2300Ml 938mm 30 to 40%Mwanakombo 24 Apr to 8 Jun 1.7m³/s 6700Ml 670mm 40 to 55%Kinyasini 30 Mar to 12 Jun 0.7m³/s 5400Ml 880mm 45 to 60%Mwera 25 Apr to 7 Jun 5.7m³/s 20300Ml 736mm 40 to 50%Kipange 22 Apr to 12 May 1.6m³/s 3000Ml 448mm 40 to 50% Table 4-9 Estimation of river discharge in Unguja Island. Source: Halcrow, 1994.
4.12. Groundwater Resource in Unguja
In many small islands like Unguja, groundwater is the primary source of water. Assessment and evaluation of this resource needs the understanding of its aquifers potential. Unguja, being oceanic

WATER BALANCE ASSESSMENT IN UNGUJA ISLAND, ZANZIBAR, TANZANIA
21
island posses its groundwater resources in terms of lens, which float above deeper saline aquifer. It is very crucial to maintain the balance of fresh and saline water in order to prevent rising of seawater inland. In his study on water resource in Unguja island, (Halcrow, 1994) examined the hydrological processes and estimates groundwater recharge and subsurface flows to the sea. He delineated nine water resource zones based on their storativities. The table below shows the water resources recharge zone in Unguja.
Resource Zone Recharge Mm³/yr1 23.992 68.533 72.44 59.645 19.136 35.277 1308 36.759 143
Total 564.73 Table 4-10 Recharge for water resource zone in Unguja.
4.13. Water Balance in Unguja
The water balance is an accounting of the inputs and outputs of water. It essentially relates the flows of water into the environment to the flow of water out of this environment. The water balance of such an environment whether it is an agricultural field, watershed, or continent, can be determined by calculating the input, output and storage changes of water. In most cases the major input of water is from precipitation and output is evapotranspiration.(Ritter, 2006) Mathematically, water balance can be represented as: I (t) – O (t) = dS/dt ..................................................... 4.1 Where I is inflow in m³/day, O is Outflow in m³/day and dS/dt is rate of change in storage over a finite time step in m³/day. Unguja island being oceanic island the water balance expression can be expressed as: P = E + T +Qf + Qs + dS ............................................... 4.2 Where : P is Precipitation, E is evaporation, T is the transpiration, Qf is the groundwater flow to the sea, Qs is the surface runoff to the sea and dS is the change in storage. The above equation could be expressed in the case of Unguja island as that precipitation is the inflow to the system, while outflows are evaporation, transpiration through vegetations, surface flow to the sea

WATER BALANCE ASSESSMENT IN UNGUJA ISLAND, ZANZIBAT, TANZANIA
22
and human abstraction. During the course of long time duration, the change of groundwater storage may be neglected. Following the previous study by (Halcrow, 1994), the water balance of Unguja can be represented by the below schematic diagram.
Figure 4-10 Schematic water balance of Unguja Island
Source: (Halcrow, 1994)

WATER BALANCE ASSESSMENT IN UNGUJA ISLAND, ZANZIBAR, TANZANIA
23
5. Methods and Procudure
5.1. Flow Chart.

WATER BALANCE ASSESSMENT IN UNGUJA ISLAND, ZANZIBAT, TANZANIA
24
5.2. Data Set Used
The 30-m resolution topography data set from ASTER GDEM was used as a basis for the construction of the model application. The GIS layer representing landuse/cover in the basin was based on the an interpretation of aerial photographs from 2004-2005, this was combined with information taken from Department of Land in Zanzibar and extensive field survey done during the field work. Soil map was aquired from the department of agriculture in the hardcopy and then digitized and re-classified according to SWAT model requirements. The reclassification of soil data was achieved by comparing the soil polygons with the surveyed soil/ hydrogeological map of Zanzibar to give geological description and hydrological group of the soil. This hydrological soil group in conjuction with land use/cover type were used as the basis for estimation of CN number, which is very essential to determine the amount of water that will infiltrate the soil. This may suggest that for the hydrological modelling using CN, this parameter could the most sensitive one to the model which then evaluate the fit to river flows.
5.2.1. Meteorological and hydrological data sets.
The data sets for weather were obtained from Zanzibar Airport Meteorological Station( Kisauni) and Kizimbani Agromet Station (see fig. 4-4 ). For Kizimbani Station, the data consist of an 19-year series (1991 -2009) of daily precipitation, temperature, Pan evaporation, wind speed, relative humidity, dew point temperature and 3-year series (2006-2008) from Zanzibar Airport Meteorological Station. (See Appendexes) These data were originally collected in hard copy and then preprocessed in Excel spreadsheet in daily basis according to SWAT format for the input of the SWAT model which needs weather data in daily or subdaily. The missing weather data were filled by using weather generator in-build mechanism in Map Window GIS interface software. 12 years of climatic data were used for calculation of parameters required for weather generator file as illustrated in the table below.

WATER BALANCE ASSESSMENT IN UNGUJA ISLAND, ZANZIBAR, TANZANIA
25
Table 5-1 Parameter required for weather generator file
Jan Feb Mar Apr May Jun Jul Aug Sep Oct Nov DecMaxtemp (⁰C) 31.53 32.14 31.65 30.11 29.38 28.44 28.12 28.47 29.04 29.86 30.96 31.09Min temp (⁰C) 23.73 24.08 23.39 23.15 21.25 21.71 20.26 19.54 19.43 20.32 21.94 23.21Temp Stdev.max(⁰C) 0.65 0.60 0.62 1.01 0.56 0.40 0.36 0.57 0.56 0.55 2.36 0.47Temp Stdev.min(⁰C) 0.64 1.86 0.80 0.73 0.40 1.82 0.66 0.75 0.73 1.11 0.59 0.58Av.Mon precipitation (mm) 99.62 56.21 202.81 414.16 324.05 92.51 73.66 61.29 59.92 115.66 175.94 179.92StdDaily rain (mm) 9.59 7.42 13.19 22.03 26.95 10.26 7.04 6.10 4.91 12.56 11.78 13.22SkewDaily rain 4.31 4.68 2.94 3.09 10.63 5.90 5.44 6.66 5.95 7.26 2.73 3.51PWD 0.17 0.16 0.53 0.95 0.44 0.24 0.37 0.38 0.43 0.37 0.44 0.29PWW 0.41 0.24 0.49 0.65 0.69 0.38 0.32 0.34 0.36 0.36 0.45 0.49dwet,i 7.17 4.92 15.75 21.75 18.17 8.25 10.83 11.17 11.92 11.33 13.25 11.330.5hrs max (mm) 84.80 54.30 84.40 167.20 428.00 96.00 66.50 70.20 59.50 140.60 72.00 112.50Av.daily sol.rad (MJM⁻²) 18.97 19.90 18.40 16.01 15.83 16.26 17.01 17.31 19.25 19.30 16.73 17.43Av.daily dewpt (⁰C) 22.96 22.95 24.78 24.24 22.72 21.21 20.01 20.16 20.98 21.68 23.47 23.73Av.daily wind speed (m/s) 1.97 1.85 1.26 1.30 1.35 1.52 1.51 1.31 1.21 1.14 1.08 1.50 They were then impoted in Map Window GIS interface database for simulation of watershed hydrologic parameters. Additionally, daily flow data of year 2000 -2005 from gauging station were obtained from Zanzibar Water Authority. These data were used for calibrating the model.
5.3. Model Set Up
One of the first steps in the set-up of a SWAT model application for new study area consists of identification and limitation of hydrological responce units (HRUs). For this purpose, subbasin stream net work was extracted from the digital elevation data (DEM) using geo-hydroprocessing procedure in ILWIS software. This was then applied in MapWindow GIS interface for analytical standard technique of automatic watershed delineation. 10km² was used as threashold value for defining watershed minimum value. Soil, land cover maps and weather data were accessed through MWindow GIS interface with soil parameters attribute tables linked. Intermediate point for catchment slope of 10% were assigned to divide HRUs into those with average slopes for 0-10% and those with average slopes in the range 10% to the top limit. As a result 30 subwatersheds were defined, and by taking account for differences in soils, land use, and slope, the model gave rise to 30 HRUs after assigning dominance percentage approach for land use, soil type and slope. These catchments make the total area of 941km². The figure below shows the study area with number of catchments.

WATER BALANCE ASSESSMENT IN UNGUJA ISLAND, ZANZIBAT, TANZANIA
26
Figure 5-1 Location of Catchments in the study area
5.3.1. Land use and Soil type.
Due to the absence of locally established values for SWAT model parameter such as ( CN, LAI etc.) that describe the hydrological characteristics of different land use type, some of the locally observed land use was associated with a land use type contained in the SWAT model database, see (table 5-2 and figure 5-2 ). As first approximation, the original parameter values corresponding to the SWAT database were used in the model. The most important type of land use/cover in the subbasin corresponds to the Shrub covering a 49.1 % followed by mixed vegetation covering about 19 %.

WATER BALANCE ASSESSMENT IN UNGUJA ISLAND, ZANZIBAR, TANZANIA
27
As for soil, it was classified acccording to FAO classification with large parcentage being sandy loams, fig. 5-3. Table 5-2 Unguja land use classes matched with SWAT land use and Code
Land Use Class SWAT Land Use Class SWATCODE % WatershedAgriculture Agricultural Land-Generic AGRL 12.0Coastal Sand Urban Low Resident URLD 0.1Forest Forest-Mixed FRST 0.7Recreation Park Grassland GRAS 0.0Paved Road Transportation UTRN 6.2Mixed Vegetation Mixed Grassland MIGS 18.9Settlement Urban URBN 5.9Mixed Shrub Shrub SHRB 49.1Mangrove Wetland-Mixed WETL 2.8Water body Water Body WATB 0.1Plantation Cropland/Woodland CRWO 2.1Quarry Commercial UCOM 0.0Stream Water WATR 1.2Unpaved Road Baren or Sparsly Vegetated BSVG 0.8
Figure 5-2 Landcover/use for the study area

WATER BALANCE ASSESSMENT IN UNGUJA ISLAND, ZANZIBAT, TANZANIA
28
Figure 5-3 Soil map of the study area

WATER BALANCE ASSESSMENT IN UNGUJA ISLAND, ZANZIBAR, TANZANIA
29
5.4. Model Execution
After setting up step, the model was run for five year 2000-2005. In correspondence to the available input data the SCS CN approach and The Penman-Montheith method were used for calculation of runoff and potential evapo-transpiration respectively. As for rainfall, skewed normal distribution method was used. Missing weather data were filled by using the built-in weather generator.
5.5. Sensitivities Analysis and Calibration
Before calibration process, a sensitivity analysis, which is the technique to identify the response of the parameter by ranking the most sensitive parameter to the model, was done by means of LH-OAT analysis (Latin Hypercube Sampling – One at A Time, incorporated in SWAT Editor. Based on these results, a manual calibration was done, which was followed by automated calibration analysis procedure implemented in SWAT called PARASOL (Parameter Solution Method), this was applied for the most six sensitive model parameters, using the sum of the squares of the residuals (SSQ) to obtain the optimum solution. The analysis shows ranks of parameters starting with the most sensitive to least sensitive as illustrated in the table 5-3 below. The hierarchy of sensitive parameters was then used for the auto calibration. The parameters taken in autocalibration were: were CN2, Surlag, Sol_K, Sol_Z, Sol_AWC and ESCO Table 5-3 Sensitivities analysis results Rank 1 2 3 4 5 6 7 8 9Parameter CN2 Surlag Sol_K Sol_Z Sol_AWC ESCO Carmx Blai Ch_K2
Rank 10 11 13 14 15 27 27 27 27Parameter Slope Alpha_Bf SlsubbasinEpco Sol_Alb CH_N2 GW_delayGW_RevapRevapmn The rank shows the order of decreasing sensitivities of the parameters and the parameters in rank 12 and ranks 16 – 26 were omitted in the above table since they pertain to water quality and tillage in agricultural activities. In ranking sensitivities of the parameter, bounding limit for the parameter to vary has an influence, as a matter of making these scenarios, four parameters were tested in different bounding limits and the results are illustrated below.

WATER BALANCE ASSESSMENT IN UNGUJA ISLAND, ZANZIBAT, TANZANIA
30
Figure 5-4 Scenerio one showing the sensitivity of the parameter
Parameter Lower bound Higher boundCN -25.0% 25%Alpha_Base flow 0 1Sok_K -25% 25%Sol_Z -25% 25%
Result of sensitivitiesParameter RankAlpha_Base flow 1Sol_Z 2CN 3Sol_K 4
Figure 5-5 Scenerio two showing the sensitivity of the parameter
Parameter Lower bound Higher boundCN 0 25%Alpha_Base flow 0 25%Sok_K 0 25%Sol_Z 0.5 1%
Result of SensitivitiesParameter RankSol_ 1CN 2Sol_ 3Alpha_Base Flow 4
WATER BALANCE ASSESSMENT IN UNGUJA ISLAND, ZANZIBAR, TANZANIA
31
6. Results and Analysis
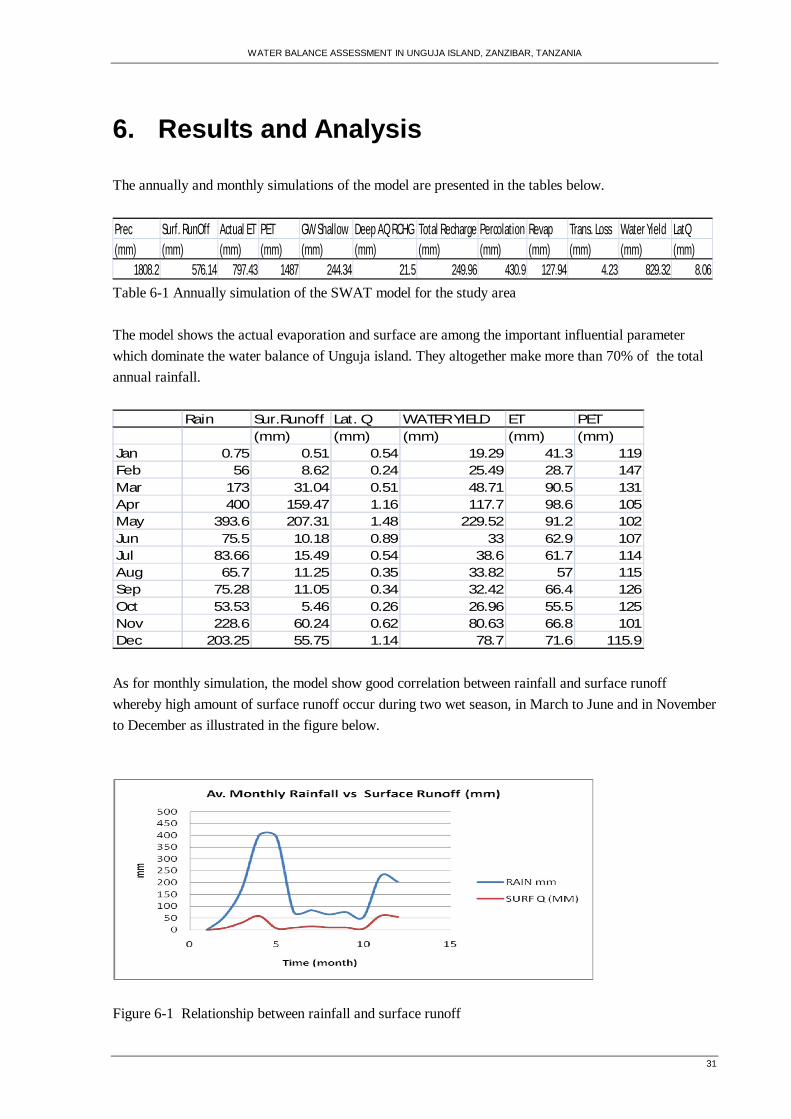
The annually and monthly simulations of the model are presented in the tables below. Prec Surf. RunOff Actual ET PET GW Shallow Deep AQ RCHG Total Recharge Percolation Revap Trans. Loss Water Yield LatQ(mm) (mm) (mm) (mm) (mm) (mm) (mm) (mm) (mm) (mm) (mm) (mm)
1808.2 576.14 797.43 1487 244.34 21.5 249.96 430.9 127.94 4.23 829.32 8.06 Table 6-1 Annually simulation of the SWAT model for the study area The model shows the actual evaporation and surface are among the important influential parameter which dominate the water balance of Unguja island. They altogether make more than 70% of the total annual rainfall.
Rain Sur.Runoff Lat. Q WATER YIELD ET PET(mm) (mm) (mm) (mm) (mm)
Jan 0.75 0.51 0.54 19.29 41.3 119Feb 56 8.62 0.24 25.49 28.7 147Mar 173 31.04 0.51 48.71 90.5 131Apr 400 159.47 1.16 117.7 98.6 105May 393.6 207.31 1.48 229.52 91.2 102Jun 75.5 10.18 0.89 33 62.9 107Jul 83.66 15.49 0.54 38.6 61.7 114Aug 65.7 11.25 0.35 33.82 57 115Sep 75.28 11.05 0.34 32.42 66.4 126Oct 53.53 5.46 0.26 26.96 55.5 125Nov 228.6 60.24 0.62 80.63 66.8 101Dec 203.25 55.75 1.14 78.7 71.6 115.9 As for monthly simulation, the model show good correlation between rainfall and surface runoff whereby high amount of surface runoff occur during two wet season, in March to June and in November to December as illustrated in the figure below.
Figure 6-1 Relationship between rainfall and surface runoff

WATER BALANCE ASSESSMENT IN UNGUJA ISLAND, ZANZIBAT, TANZANIA
32
Before calibration, the model showed bad correlation and Model Evaluation Coefficient Nash-Sutcliffe and correlation coefficient were: -0.4 and 0.5 respectively this result indicate bad performance of the model simulation. In most case, the model gave overestimation results as can be seen in the fig. 6-2
Table 6-2 Model simulation before calibration After calibration, the model simulation was improved in such a way that Nash-Sutcliffe Coefficient was 0.602 and correlation coefficient were 0.75 respectively which is satisfactorily good and acceptable. The model still showed some overestimation for peak flow in first year of simulation but tends to slightly underestimate in the following years as shown in the figure 6-3 below.
Table 6-3 Model Simulation after calibration

WATER BALANCE ASSESSMENT IN UNGUJA ISLAND, ZANZIBAR, TANZANIA
33
Nash-Sutclife Coefficient Correlation CoeffcientBefore Calibration -0.4 0.5After Calibration 0.6 0.75
Table 6-4 Model performance values before and after calibration The main water balance components were estimated by the model for each individual catchment as shown in the table 6-4 below. The model simulation with respect to Surface Runoff, Actual evapotransipation and Groundwater recharge shows good fit with the previous study of water balance in Unguja by ( Halcow, 1994).
Subbasin PRECmm SURQmm ETmm GW_RCHGmm 1 1808.2 744.86 711.76 346.1842 1808.2 751.76 708.24 333.9693 1808.2 319.87 891.18 576.5994 1808.2 190.08 892.64 710.6845 1808.2 581.45 857.9 365.9166 1808.2 322.52 903.85 560.4977 1808.2 767.32 815.19 216.1848 1808.2 548.31 776.43 467.0829 1808.2 317.36 854 618.729
10 1808.2 759.72 775.87 267.47611 1808.2 306.33 819.52 673.24612 1808.2 320.33 840.49 634.5213 1808.2 734.14 711.02 351.03114 1808.2 749.18 762.94 289.19315 1808.2 763.48 817.06 226.54916 1808.2 735.01 712.29 356.24817 1808.2 734.85 712 355.89618 1808.2 764.03 816.92 221.31319 1808.2 764.12 817.29 222.35220 1808.2 760.4 710.17 328.09321 1808.2 760.66 710.14 327.31422 1808.2 734.99 710.5 342.80323 1808.2 193.48 893.49 709.82424 1808.2 193.28 893.34 703.04925 1808.2 691.67 712.98 391.68726 1808.2 698.08 807.95 296.80727 1808.2 327.65 920.08 548.85228 1808.2 745.19 712.26 346.63629 1808.2 756.97 761.81 285.12630 1808.2 193.46 893.49 717.593
Average 1808.2 574.35 797.43 426.382 Table 6-5 Average annually Catchment Water balance value

WATER BALANCE ASSESSMENT IN UNGUJA ISLAND, ZANZIBAT, TANZANIA
34
The overall average annual values for surface runoff, actual evapotranspiration and groundwater recharge are: 574.35mm, 797.43, and 426.38mm respectively which represents 23.6% for recharge, 32% for Surface runoff and 44% for evapotranspiration. This good correlation with the previous study may suggest good model prediction for hydrological components in the study area. The table below shows the comparison between SWAT prediction and Halcrow,1994 estimation for water balance components.
ET(mm) SURQ(mm) GWRCHG(mm)SWAT model 44.10% 31.76% 23.60%Halcrow 40% 36% 24%
Table 6-6 Comparison of SWAT model and Halcrow, 1994

WATER BALANCE ASSESSMENT IN UNGUJA ISLAND, ZANZIBAR, TANZANIA
35
Figure 6-2 Catchment showing groundwater recharge The model predicts well, the relation between surface runoff and recharge, whereby the catchments with high amount of surface runoff has low recharge value as illustrated in the Fig. 6-3 below. This is the function of CNs which determine amount that will infiltrate and the amount of surface runoff. Not only CNs has the consequence in determining the amount of infiltration and surface runoff but also soil depth and rooting depth.

WATER BALANCE ASSESSMENT IN UNGUJA ISLAND, ZANZIBAT, TANZANIA
36
Figure 6-3 Relation between Surface runoff and Recharge Additionally, the model predicted well relationship between evapotranspiration and recharge; it shows direct proportion relationship between these two components, see fig.6-4. This may suggest that the aquifers are shallow and ‘revap’ has big contribution to supply water from shallow aquifer zone to root zone or by direct uptake from the trees.
Figure 6-4 Relation between ET and Recharge in the catchments

WATER BALANCE ASSESSMENT IN UNGUJA ISLAND, ZANZIBAR, TANZANIA
37
7. Conclusion
Swat model has been applied for the first time in Unguja island to estimate the main water balance components for the island. It shows satisfactory good performance in prediction. The prediction of SWAT for this study is more or less close to the same done by previous studies, although there were some differences in area size of study. It predicted 44.1% of the rainfall evaporate to the atmosphere as evapotraspiration, 31.76% of rainfall lost as surface runoff and 23.6% infiltrate and make the total groundwater recharge. Despite of these results, more are to be done to improve the performance of the model. As SWAT needs many input parameters for soil, groundwater, surface water, land cover data much effort must be done to collect the appropriate data for the model. Special emphasis should be on the flow data which are used for calibration As this study is the first in hydrology, it is hoped that it will serve as the starting point for any further water resources modelling study in the study area.

WATER BALANCE ASSESSMENT IN UNGUJA ISLAND, ZANZIBAT, TANZANIA
38
Reference
Appelgren, B. and Klohn, W., 1999. Management of water scarcity: A focus on social capacities and
options. Physics and Chemistry of the Earth Part B-Hydrology Oceans and Atmosphere, 24(4): 361-373.
Arenes, A.D. and Huertas, J.F., 1986. Hydrology and Water Balance of Small Islands. A review of existing knowledge. UNESCO/IHP.
Arthurton, R.S., Brampton, A.H., Kaaya, C.Z. and Mohamed, S.K., 1999. Late quaternary coastal stratigraphy on a platform-fringed tropical coast - a case study from Zanzibar, Tanzania. Journal of Coastal Research, 15(3): 635-644.
DIWI, 1990. Engineering and Management Studies, Zanzibar and Pemba Rural Water Supply. Volume 1. United Republic of Tanzania, Zanzibar.
FAO, 1989. Evaluation of land resources in Zanzibar, Phase I and II, Tanzania. pt. 1: Land evaluation and land suitability classification: Unguja and Pemba Islands.- pt. 2: Annex 1: Proposals for follow-up project; Annex 2: Record of data and technical specifications.
FINNIDA, 1991. Zanzibar Urban Water Supply Development Plan. ZB/REP/4. Gassman, P.L., Reyes, M.R., Green, C.H. and Arnold, J.G., 2007. The Soil and Water Assessment
Tool: Historical Development, Applications, and Future Research Directions,. American Society of Agricultural and Biological Engineers, 50(4):1211-1250.
Gossling, S., 2001. The consequences of tourism for sustainable water use on a tropical island: Zanzibar, Tanzania. Journal of Environmental Management, 61(2): 179-191.
Halcrow, 1994a. The development of water resource in Zanzibar. Report. Halcrow, W., 1994b. Development of Water Resources in Zanzibar, His Highness Dr Sheikh Sultan bin
Mohammad Al Qasimi, Ruler of Sharjah & GOZ, Zanzibar. Hensel, P.R., Mitchell, S.M. and Sowers, T.E., 2006. Conflict management of riparian disputes.
Political Geography, 25(4): 383-411. Hettige, M.L., 1990. Land Evaluation and land sustainability classification: Unguja and Pemba Island.
Food and Agriculture Organization of the United Nation. Howard, H., 1994. Review of Studies on Groundwater Resources in the Project Area - Zanzibar and
Pemba Rural Water Supply, Government of Zanzibar, Tanzania. Immerzeel, W.W. and Droogers, P., 2008. Calibration of a distributed hydrological model based on
satellite evapotranspiration. Journal of Hydrology, 349(3-4): 411-424. Jayakumar, R., Duan, X.L., Kim, E. and Liu, K., 2009. The role of United Nations Educational,
Scientific and Cultural Organization-International Hydrological Programme in sustainable water resources management in East Asian countries. Journal of Geographical Sciences, 19(3): 259-272.
Johnson, J., 1983. Groundwater Review, Zanzibar Island. FAO, Rome, Italy. Johnson, J., 1987. Hydrological Map of Zanzibar. Kent, P.E., Hunt, J.A. and Johnstone, D.W., 1971. The geology and geophysics of coastal Tanzania.
Goephysical Paper, 6(6).

WATER BALANCE ASSESSMENT IN UNGUJA ISLAND, ZANZIBAR, TANZANIA
39
Klein, R., 2008. The Edaphic Landscape of Unguja Island, Zanzibar. An exploratory study on the relation between soil variability and the landscape. Turku University, Department of Geography, Publications B Nr 11.
Kombo, Y.H. and Kitwana, M.M., 1997. Coral rag soil fertility improvement. Farmers' indigenous knowledge and practices. Commission of Natural Resources. Forestry Technical Paper No. 72. Zanzibar.
Merka, J., 2000. Remote Sensing and GIS Application to Water Resource Assessment Management, A Case Study in the Upper River Catchment, Zimbabwe, Department of Water Resource. Enschede, ITC. MSc.
Molle, F., 2009. WATER AND SOCIETY: NEW PROBLEMS FACED, NEW SKILLS NEEDED. Irrigation and Drainage, 58: S205-S211.
Ncube, M. and Taigbenu, A.E., 2006. The impact of land cover and land use on the hydrologic responce in the Olifants Catchment. MSc Research Report, University of the Witwatersrand, Johannesburg.
Ndomba, P., Mtalo, F. and Killingtveit, A., 2008a. SWAT model application in a data scarce tropical complex catchment in Tanzania. Physics and Chemistry of the Earth, 33(8-13): 626-632.
Ndomba, P., Mtalo, F. and Killingtveit, A., 2008b. SWAT model application in a data scarce tropical complex catchment in Tanzania. Physics and Chemistry of the Earth, Parts A/B/C, 33(8-13): 626-632.
Neitcsh, S.L., Arnold, J.G., Kiniry, J.R. and Williams, J.R., 2005. Soil and Water Assessment Tool Theoretical Documentation. USDA-ARS Grassland, Soil and Water Research Laboratory.
Ritter, M.E., 2006. The Physical Environment: An Introduction to Physical Geography. http://www.uwsp.edu/geo/faculty/ritter/geog101/textbook/title_page.html.
Shaghude, Y.W. and Wannas, K.O., 1995. Sediment distribution and transport in the Zanzibar channel. Ambio, 24(7-8): 519-522.
Shaghude, Y.W. and Wannas, K.O., 1998. Morphology and sediment distribution of the Zanzibar Channel. Ambio, 27(8): 729-733.
Stockley, G.M., 1942. The geology of the Zanzibar protectorate and its relation to the east African mainland. Geological Magazine, 79(4): 233-240.
T, A.G., 1937. Review: East African Soils. Journal of Ecology, 25(1): 267-268. Tierney, J.E. and Russell, J.M., 2007. Abrupt climate change in southeast tropical Africa influenced by
Indian monsoon variability and ITCZ migration. Geophysical Research Letters, 34(15). UNDTCD, 1987. Hydrogeological Map of Zanzibar Map NO. 3344, United Nations. UNEP, 1999. Overview of Land-based Sources and Activities Affecting the Marine, Coastal and
Associated Freshwater Environment in the Eastern Africa Region. UNEP Regional Seas Reports and Studies No. 167. UNEP 1999.
White, I. et al., 2007. Challenges in freshwater management in low coral atolls. Journal of Cleaner Production, 15(16): 1522-1528.
ZAWA-AfDB-UNHABITAT, 2008. WRM strategy for Zanzibar. Draft Repot. ZILEM, 1995. National Land Use Plan.


WATER BALANCE ASSESSMENT IN UNGUJA ISLAND, ZANZIBAR, TANZANIA
41
Appendices
Appendix A: Location of the rivers in the study area

42
Appendix B-1 Min Temp (degree Centigrade)
YEAR JAN FEB MAR APR MAY JUN JUL AUG SEP OCT NOV DEC
20081 25.4 25 22.8 24.5 24.2 21.7 22.5 23.2 19.2 21.3 23.7 24.32 25.9 24 23.1 24.6 24.4 21.3 22.7 21.2 22.3 22.5 22.6 243 23.3 22.9 24.9 23.3 24.6 21.9 23.4 22.7 22.3 22.3 22.2 24.84 23.8 24.8 23.8 23.4 24.3 23.6 19.7 22 21.3 22.4 22.5 23.95 25 23.8 24.5 24.1 23.8 21.6 20.1 23.1 18.8 22.1 22.5 22.86 24.3 24.8 25.6 23.9 24 23.2 20.3 20.9 19.6 24.1 22.5 23.67 24.4 25.5 24.3 24.7 21.9 23.3 19.9 23.1 19.3 23.8 23.4 22.58 24.4 25.9 23.8 24.9 22.8 22 17.5 21 19.6 23 22 23.59 25.2 25.3 23.9 23.4 22.5 23.3 22.8 22 19.2 22.1 21.1 23.4
10 23.9 25.3 23.5 23.6 22.8 23.3 21 22.3 19 22.1 23.1 23.811 23.4 24.8 23 23.9 22.8 23.2 19.2 24.1 18.6 22.5 23.1 23.812 24.6 24.4 22.8 25.1 23 23 22.3 23 21.8 24.1 24 23.513 23 22.5 23.4 23.8 21.9 21.7 22.3 22.7 22.7 21.1 23.2 23.914 23.6 22.5 25.3 24.9 23.1 22.3 23.2 19.9 23.4 21.4 23.4 2415 23.9 24 24 25.3 24.4 23 22.3 21.1 22.8 24 23.5 23.216 22.6 24.1 24.3 23.1 24.4 22.8 23.8 20.4 21.3 22.6 23 23.917 23.3 23.8 23.6 24.1 22.2 21 21.7 20 19.8 22.1 23.2 25.118 24.6 24.1 24.8 24 21.4 21.7 22 21 20.3 21.7 23.9 24.819 25.6 25.8 25.9 24 23.9 22.4 22.2 20.5 19.9 21.4 24.4 24.920 23.8 25.6 26.1 23.2 24.7 22.4 23 23.7 19.7 21.1 24.4 2521 22.9 24.6 25.8 24.2 23.6 20.5 24.3 21.6 22 20.9 23.5 24.522 24 24.2 25.8 23.5 23.4 19.6 23.3 22.3 23.9 20.8 23.7 23.423 23.9 24.4 25.9 24.1 24.3 22.3 21.3 23.1 20.9 21 23.4 23.924 25.6 24.1 25.8 24.7 23.6 21.8 22.7 23.3 20.7 21.5 23.4 25.225 24.2 22.3 24.9 24.6 22.4 20.8 22 21.2 19.9 24.5 23.8 24.426 26 21.9 25.2 23.4 23.1 23.1 22.2 19.4 19.9 24.3 24.2 24.327 23 21.3 25.1 22.4 23.8 23.1 22.5 19.9 21.8 24 24.5 23.528 26.2 20.4 24.2 23.6 22 20.9 21.6 19.4 20.1 22.1 24.6 23.629 23.3 21.6 23.5 23.2 22.3 19.8 22 20.9 20.3 23 22.9 23.830 23.8 25.8 23.8 23.8 22.6 23.3 19.2 24 22.3 24.5 23.931 24.1 24.4 22.4 23.6 19.3 23.4 23.5
JAN FEB MAR APR MAY JUN JUL AUG SEP OCT NOV DEC
20071 24.1 24 26 23.1 23.8 23.5 23 23 20.8 21.2 20.9 23.12 23.5 25.2 26.1 23.3 23.7 24.5 23.6 23.6 22.7 23.3 19.7 22.83 23.9 25.8 24.4 23.3 23.8 22.9 23.3 23.3 19.9 21.4 19.6 22.84 26 24.4 24.1 24.5 23.3 23.4 19.9 19.9 20.5 21.3 20 21.85 25.4 23.9 25.3 25.2 24.6 22.4 20.4 20.4 21.3 20.7 20.6 22.86 24.8 24.2 24.5 24.3 25.1 23.9 23.5 23.5 22.9 21 22 22.97 24.9 23.3 25.4 23.9 24.6 22.4 22.6 22.6 21.3 20.8 22.6 23.88 25.2 23.8 24.2 23.6 25.1 21.4 22.9 22.9 21.4 20.1 22.3 23.89 25.6 25.3 24.5 23.7 24.4 21.7 22.5 22.5 21.1 21.9 21.9 24.4
10 25.4 25.8 25.7 24.8 24.7 22 23.2 23.2 19.6 21.2 22.9 24.211 24.7 25.6 25.7 24.2 25.5 23.9 21.9 21.9 21.1 20.6 22.5 24.612 25.1 26.1 24.6 24.4 25.2 23.1 20.8 20.8 19.9 20.8 22.7 24.313 24.6 15.4 25.4 24.4 24 23.4 21 21 20.9 21 23.4 24.114 24.1 25.9 25.7 25.6 25.2 22 20.4 20.4 23.2 21 24.1 23.415 23.2 24.5 26 25.6 24.8 24.6 19.2 19.2 21.2 21.1 22.6 23.416 23.9 25 25.3 23.5 22.5 24.6 19.6 19.6 22.7 20.6 22 23.517 25.3 24 25.5 23.8 23.4 23.6 21.2 21.2 24.7 22.6 21.9 25.618 25.7 23.2 25.1 24.9 22.9 23.3 23.7 23.7 23 25.2 22 25.419 24.2 21.8 22.2 23.7 22.4 22.7 22.2 22.2 22.4 22.8 22.5 25.420 26.3 22.2 24.5 23.3 22 23.1 22 22 23.5 22 22.6 2521 26.8 21.5 24.5 23.1 22.5 23.4 22.5 22.5 21.3 22.9 23.6 23.522 25.5 24.7 24.8 23.8 22.6 22.8 22.9 22.9 20.2 21 22.6 25.623 23.4 26.1 23.3 23.6 23 22.5 22.2 22.2 19.6 21 23.3 24.424 24.8 27.4 23.8 23.9 24.1 22.7 19.4 19.4 20.7 22.7 23.6 23.925 23.6 24.6 23.4 23.3 25.3 21.4 23.3 23.3 19.9 22.6 23.4 23.426 26.4 27.1 23.9 23.6 24.6 20.3 22.6 22.6 20.8 22.9 23.8 25.827 26.5 26.1 24.3 24.1 24.6 22.5 20.6 20.6 22.4 24.6 23.2 26.728 26.5 23.7 25.2 25 25 21.1 21.1 21.1 23.4 24.3 24.3 24.229 25.3 24.2 23.8 24.2 20.8 19.5 19.5 22.6 22.3 25.2 23.530 26.4 23.6 23.1 23.4 23 21.4 21.4 22.6 24.9 23.9 22.831 26.2 24.1 23.1 21.7 21.7 21.3 24.8

WATER BALANCE ASSESSMENT IN UNGUJA ISLAND, ZANZIBAR, TANZANIA
43
2006 JAN FEB MAR APR MAY JUN JUL AUG SEP OCT NOV DEC
1 24.5 25.1 26.6 25.9 24 24 23.3 20.5 23.6 20.8 23.9 24.52 23.6 26.8 25.2 25.9 24 24.5 22.6 19.3 23.3 22.3 24 233 24.7 26.4 25.7 23.9 24 23.8 21 19.7 22.5 23.8 24 23.74 23.4 25.1 25.8 25.7 24.5 24 20.4 19.6 23.2 23.2 24.7 23.95 26.2 23.4 25.7 23.2 25.1 24.3 22.7 20.1 23.9 20.8 24.4 23.76 26.3 23.3 25.3 24.4 25.8 23.7 22.5 20.5 21.7 20.3 24.2 23.47 25.2 26.4 24.3 22.6 25.5 24.3 22.2 22.1 22.4 23.2 22.8 238 23.5 23.4 25.6 23.8 24.8 24.3 20 22.8 20.9 20.8 23 23.69 22.8 22.5 24.3 24.2 23.2 21.9 23.2 22.3 22.4 20.6 25.3 23.8
10 23.3 22.6 24.4 24.8 23.4 23.4 23 21.3 22.3 21.4 24.9 24.311 24.3 23.3 23.4 24.6 23.3 21.5 23.1 22.4 20.2 21 23.6 24.412 24.4 24.4 24.6 24.2 23 21.8 22.3 20.7 22.3 21.5 22.6 23.413 23.4 25.2 24 23.7 24.1 21.8 21.3 20.5 20.1 20.8 22.6 23.414 24.6 25.4 23.5 23.3 24 21.3 22.6 22 21.1 23.6 23 23.515 23.2 25.6 24.5 26.4 21.1 19.6 22.7 22.1 20.4 22.8 23.3 23.716 25.2 24.3 23.6 25.3 23.5 22.8 23.3 23.9 21 23.5 23 24.617 24.2 24.4 25.5 25.5 21.9 23.8 22.8 21.3 19.8 21.5 22.5 25.518 23.5 24.4 25.9 26 20.8 22.3 21.9 21.4 23.4 23.2 22.7 2419 24.2 25.2 25.1 25.2 20.7 23.2 20.8 21.7 23.4 21.7 23.5 25.820 23.6 23.4 24.9 25.1 20.3 22 20.1 19.1 20.9 23.9 23.6 24.721 24 23.9 24.5 24.6 20.4 23.3 21.9 20.9 23.3 24.8 24.4 23.822 25.8 22.4 24.5 25.2 23.9 22.7 20.5 20.7 22.1 21.3 23.7 24.723 26.6 22.7 24.8 23.1 24 21.5 19.7 20.3 22.8 23.2 23.3 22.924 26.5 23.6 24.5 24.6 22.9 23.8 19.9 20.1 21.9 21.5 24.7 23.525 25.9 26.1 24.5 25 23.7 24 19.9 19.5 19.9 22 23.4 23.726 23.8 25 24.4 24.5 24.1 23.3 22.6 21.3 20.4 23.6 22.6 23.727 24.6 24.7 25.3 25 24.4 20 22.5 19.6 20.2 23.8 24.9 26.428 23.6 25.5 23.5 25 24.4 23 19.9 24.3 23.4 24.1 25.5 24.629 24.4 23.4 23.4 25.3 22.5 21.8 21.6 23.2 23.7 24.9 25.230 24.2 24.8 24.2 23.8 22.6 21.7 19.8 22.2 24.3 24.1 25.131 24.1 24.7 23.8 22.4 20.3 24.2 25.6
Appendix B-2 Max Temp (degree centigrade) 2008 JAN FEB MAR APR MAY JUN JUL AUG SEP OCT NOV DEC
1 32.3 32.8 29.1 31.5 28.2 28.8 27.8 28.4 28.5 29.7 29.6 29.82 33.2 32.4 34.6 31.6 30.8 28 28.8 28.9 27.7 29.2 28.4 30.93 33.4 32.6 33.7 31.6 31 29.9 28.2 28.4 29.7 28.3 28.4 31.54 32.6 32.5 30.3 31.4 30.8 29.9 28.6 28.3 30.4 29.6 29.9 31.65 32 33.3 32.7 30.4 31.1 28.9 28.6 28.4 29.8 30.3 27.7 31.16 32.8 33.5 26.6 29.8 30.4 28 28.4 29.2 29.8 30.9 29.6 31.47 32.4 31.4 32.5 27.2 29.1 29.1 28.6 27.6 30.2 31.1 30.9 30.68 31.9 32.5 33.2 30.5 29.8 27.2 28.9 27.7 29.8 31.4 30.8 31.19 32.4 32.7 33 30.7 24.9 27.4 28.3 28.4 29.6 29.8 28.9 31.3
10 32.6 32.8 32.6 29.4 27.6 27.8 28.2 27.2 29.7 31 30.6 31.811 33.8 33.1 31.8 30.6 28.3 27.4 28.1 27.1 30.8 30.3 30.6 31.812 33.7 33.2 30.5 32.1 27 -99 27.9 28.5 31.2 30 31.1 30.113 33 33.3 30.5 31.2 29.2 -99 28 28.8 31.1 31.1 30.5 30.214 34.4 34.3 31.4 31.5 29.6 -99 28.8 28.6 30.6 30.4 31.4 31.615 34.4 34.7 29.3 31.9 29.6 -99 29 29.2 29.6 28.3 30.6 32.116 32.6 33.9 30.6 31.2 30.2 -99 27.8 29.3 30.3 30.1 28.8 31.717 31.6 32.6 31.5 31.6 30.2 -99 29.3 28.4 30.1 30.7 30 32.318 32.1 33.9 31.4 31.1 29.6 -99 29 29.6 28.8 31.1 30.3 32.419 31.9 34.3 31.2 31.5 29.6 27.4 28.8 29.3 30.1 30.8 30.1 34.320 32.2 32.3 32.4 31.7 30.7 27.1 29 29.5 30.4 28.9 31.3 32.121 32.6 33.8 32 31.4 30 28.5 28.9 29.4 30.3 30.3 29.1 32.622 32.7 32.5 32.7 28.7 30.2 27.7 28.6 29.5 30.1 31.7 29.1 28.623 32.5 33.6 31.8 31 29.6 28.9 28.6 31.1 29.4 31.4 30.5 29.824 32.7 35 34 31 29.2 28.8 29 30.6 30.1 30 31.6 28.525 32.4 38.2 27.9 31 29.7 28.7 29.2 29.2 30 32.4 30.6 2926 32.4 33.7 32.4 27.8 28.6 28.1 29 30.4 30.9 32.4 30.7 31.827 33.1 34.7 30.5 28.3 28.2 28.3 28.3 30.5 29.4 30.8 31.3 32.828 32.9 33.5 31.1 25.8 29.5 28 28.8 29.7 29.4 31.1 30.6 32.629 33.8 32 29.6 29.7 28.4 29.3 29 30 31.1 29.3 27.630 33.3 31.9 30.6 29.1 29 27.3 29.8 31 29.4 32.631 32.6 31.3 29.6 28.5 30.5 29.1 29.6

44
Appendix B-2 continue 2008 JAN FEB MAR APR MAY JUN JUL AUG SEP OCT NOV DEC
1 19.2 16.2 4.2 19.4 7.8 15.3 13.7 12.6 14.1 19.1 10.2 9.62 20.3 14.5 20 17.9 19.1 15.2 19.3 17.1 16.7 15.5 8 16.53 17.3 18.3 15.2 21.9 19.5 16.6 16.4 15.9 20.2 10.2 8.4 17.34 15.9 16.8 7.9 20.4 19 15.9 17.9 16.7 19.9 13.7 10.2 16.35 16.9 21.6 14.9 22.1 19.4 17.4 15.6 14.1 18.3 22 5.1 146 16.3 18.9 6.5 11.3 14.4 10.9 17.4 15.3 19.4 21 10.2 14.17 16.9 16.7 16.7 7.3 9.5 16.1 16.3 11 19.4 18.6 15 12.48 12.4 16.8 17.8 17.6 16.1 9.5 17.6 16.3 21.2 20.3 18.9 12.99 18.8 20.1 16.4 18.6 6.3 8.6 15.9 12.3 16.9 11.8 13 14.5
10 20.4 22.5 14.9 8.9 9.7 11 14.1 12.4 15 19.1 16.7 1711 18.8 23.7 14.3 14.9 9.9 9.2 15.6 11.8 20.9 18.9 16.2 14.112 21.3 23.7 10.1 20.7 10.1 6 12.1 18.2 20.5 17.4 18.4 12.113 20.3 16.7 14.5 15.9 14.5 16.7 15.5 18.1 18.3 22 15.3 11.614 23.8 21.5 19.3 16.3 15.2 16.8 19 17.7 6.6 17.4 19.5 1815 22 23.5 6.1 16.3 18.8 17.5 15.6 17.4 16.1 7.8 15.2 19.416 10.9 22.1 15.3 20 18 16.4 12.7 16.5 18.9 20.7 9.8 13.917 12.7 14.7 20.2 21.8 18.2 4.4 19.1 16.9 20.1 16.7 16.1 19.218 17.5 18.3 17 18.7 17 10.9 16.5 20.5 12.3 18.1 11.8 21.619 18.7 22 16.8 20.4 15.7 10.6 16.9 19.9 14.3 16.4 11.8 22.620 19.6 20.6 19.5 22.2 17.9 9.2 16.1 18.9 19.6 12 21.1 16.121 16.1 18.6 16 20.2 17.7 15.5 16.5 19.2 18.1 17.4 11.3 17.822 20.8 25.7 21.9 6.5 12.2 9.5 13 16.4 20.2 20.9 11.9 7.223 18.6 26.1 19.3 15.5 16.3 17.5 16.5 18.9 18.6 17.5 13.7 724 18.2 25.4 22.8 14.7 10.4 16.3 18 18.1 21.3 19.1 20.6 725 17.3 25.1 6.7 17.8 8.7 17.1 17.1 15.5 18.6 20.8 14.4 10.126 20 11.6 20.6 4.8 9.8 17.7 18.6 20.3 19.4 20.7 18.1 15.827 18.9 17.3 8.5 9.2 10.4 17.8 15.2 18.2 20.2 13.4 17.4 20.128 19 16.3 17.4 3.1 17.7 17.7 16.8 13.9 11.5 21.3 19.6 20.229 23.9 17.3 12.5 17.5 20.1 16.6 13.8 13.9 21.3 9.5 5.530 24.7 21.4 12.9 17 14.1 10.9 16.4 20.2 14.8 10.2 2031 18.6 15 18.9 14.7 16.9 10.1 13.4
2007 JAN FEB MAR APR MAY JUN JUL AUG SEP OCT NOV DEC
1 19.1 21.3 22.7 6.7 13.7 13.1 16.9 13.9 20.2 23.1 22.6 21.82 12.5 15.8 13.7 22.1 6.1 12.4 13.3 11.3 23.1 19 24 17.83 21.6 14.3 20.4 25.9 26.1 10.2 17.8 14.2 21.3 23 18.8 11.84 17.8 16.5 19.6 26.1 22.5 12.9 15.6 20 23.7 15.3 20.8 28.15 19.5 20.1 21.7 22.7 22 17.3 21.3 20.5 22.8 23 22.2 17.46 20.9 16.3 21.1 21 21.2 20.5 17.4 18.6 19.4 24 21.5 16.87 20.7 17.6 17.7 21.4 14.8 18.5 19.2 19.9 22.2 17.9 24.5 16.38 21.1 17 17.1 21.6 20.4 19.6 17.6 17.1 20.7 23.2 21 20.99 20.2 20.4 21.1 22.7 21 20.1 20.4 20.4 23.8 6.9 24.3 13.3
10 21 20.9 25.2 21.2 18.1 20.7 21.1 16.4 20.5 24.3 19.6 17.311 22.8 19.9 24.5 13.2 12.9 20.1 22.5 20.4 20.3 22.4 23.4 19.912 19.1 16.8 19.9 21.9 14.5 19.1 19.5 18.8 24.5 23.1 13.1 12.513 20.8 16.1 19.6 18.9 15.3 13.4 20.1 23.1 20.1 20.1 5.7 14.214 17.9 22.6 18.7 21.2 14.1 21.4 20 19.9 19.6 21.9 30.9 14.815 21.5 21.7 11.3 15.5 14.5 19.1 20.1 18 19.7 20.2 12.5 17.616 20.7 21.9 16.4 12.1 6.7 21.2 15.8 18 22.4 20 23.3 25.917 15.6 20.5 15.6 7.6 6.3 19.2 14.2 15.3 19.2 23.1 16.5 22.418 15 24.3 5.4 8 19.5 20.5 13.1 19.6 23.7 21.5 24.5 21.719 16 23.2 23 9.9 20.5 22 21.1 20.3 23.2 23.4 18.8 21.820 20 23.7 17.9 22.2 20.6 20.3 18.7 19 21.3 16.5 20.1 17.321 18 24.5 17.8 23.4 12.5 19.3 18.6 13.9 23.2 24.2 18.9 1822 19.5 21.4 14.2 17.3 11.1 17.3 20.7 11.9 22 25.4 19.1 13.923 23.5 23.4 16.2 14.2 18 19.7 21.1 22.6 22.5 24.1 18 16.324 23 21.4 16.7 9.5 18.9 19.1 20.4 21.5 23.3 17.1 15.3 22.125 19.5 23 23 18.2 23.6 14.8 20.6 14 23.7 14.8 18.4 22.926 19.4 22.1 22.4 11.6 11.8 19.1 18.4 20.5 21.5 23.5 16.8 27.627 17.3 21.9 14.9 20.3 21.1 20.9 18.7 19.9 16.8 25 17.3 23.628 23.8 14.5 17.1 21.7 14.9 16.5 18.1 21.1 20.5 26.4 20.9 17.429 20.5 16.2 21.7 11.2 19.9 20.1 19.1 18 21.4 19.7 23.430 18.6 21.4 15.2 4.5 18.4 21.9 20.8 21 11.9 24.2 19.631 20.4 17.9 7.2 19.5 18 24.8 22

WATER BALANCE ASSESSMENT IN UNGUJA ISLAND, ZANZIBAR, TANZANIA
45
2006 JAN FEB MAR APR MAY JUN JUL AUG SEP OCT NOV DEC1 20.9 19.2 22 19.6 16.5 18.1 18.9 15 20.6 25.7 20.3 23.62 21.8 18.1 21.3 14.4 21.2 20.2 16.7 9.3 15.3 13.2 12.1 19.63 22.9 16.8 18.1 7.9 21.7 19.6 13.3 16.7 16.5 23.1 17.4 9.54 24.3 23 24.8 7.9 21 18.9 12.1 18.3 11.8 19.7 19.9 15.25 23.7 15.2 22.5 9.7 21.3 4.9 16 19.2 22.3 22.7 5 18.16 23.3 16.1 18.3 21.5 19.7 16.8 20.6 19.4 21.5 20.7 11.1 22.37 24.4 14.1 16.3 16.4 20.3 16.4 20.9 17.1 21.2 19.4 13.8 19.98 21.1 20.8 17.7 11.9 21.7 19.9 19 19.4 16.6 13.9 22 11.99 18.9 20.6 20.5 19.1 11.5 18.7 14.5 17.3 19.9 21.5 18.1 19
10 25.3 14.5 16.7 8.1 13.5 16.8 20.8 17.9 18.1 12.6 17.4 19.611 18.6 16.7 16.3 19.9 18.7 19.9 18.2 15.2 19.2 16.7 14.3 16.512 12 13.1 17.4 11.8 15.8 18.1 20.4 14.2 20.8 21.4 16.8 19.413 19.9 21.1 21 21.2 20.3 17.7 19.6 12.4 21.8 13.2 18.1 18.514 17.3 22.4 23.6 22.6 18.1 15.5 11 20.4 18.1 22.2 14.2 20.615 8 20.6 20.2 17.3 18.6 13.5 14 20.9 19.9 14.2 16.3 18.216 10.3 21.5 24 16.5 11.9 13.8 13.3 21.1 16.5 19.4 14.7 17.317 18.6 22.6 22.6 5.7 10.1 8.8 11.3 17.9 15.2 18 13.9 19.718 19.9 21.3 25.4 11.9 10.6 14.9 16.5 14.1 19.6 20.9 18.4 19.619 14.3 20.4 24.5 7.8 18.5 15.2 18 18 21.3 23.8 19.9 20.520 14.2 18 25 9.9 14.7 15.9 15.8 14.7 18.1 25.4 19.9 1921 17.3 18.8 24.5 15.7 19.6 10.7 13.1 17.1 19.6 21.3 20 16.922 15.8 18.1 27.1 22.7 19.9 13.4 8.3 21.4 18 20.3 21.5 17.723 23.2 18.7 25.6 18.1 20.3 18.6 12.2 21.5 19.7 22.9 19.9 19.624 19.4 19.1 20.2 20.7 12.9 18.1 20.9 16.2 17.3 24.8 22.8 19.625 22 24 25.9 18.3 18.6 21 14.8 7.1 16.7 22.6 19.6 18.426 18.9 20.7 24.2 9.8 19.2 18.4 15.9 12.9 19.4 17.9 17 11.427 11.3 25.4 16.5 17.8 19.2 16.1 15.9 22.2 13.9 13 19 16.828 19 26.6 15.5 6.2 10.2 19.7 18.2 22.2 19.6 17.9 7.2 18.929 21.9 25.7 21.6 7.3 15.5 20.4 18.1 17.5 18 19.4 9.6 19.630 17 22 18.6 15.5 19 15.6 19.3 21.1 22.8 11.6 21.531 14.9 24.8 17.3 17.1 18.9 17.8 19.1
Appendix B-3 Solar Radiation (MJM⁻²)
2008 JAN FEB MAR APR MAY JUN JUL AUG SEP OCT NOV DEC
1 19.2 16.2 4.2 19.4 7.8 15.3 13.7 12.6 14.1 19.1 10.2 9.62 20.3 14.5 20 17.9 19.1 15.2 19.3 17.1 16.7 15.5 8 16.53 17.3 18.3 15.2 21.9 19.5 16.6 16.4 15.9 20.2 10.2 8.4 17.34 15.9 16.8 7.9 20.4 19 15.9 17.9 16.7 19.9 13.7 10.2 16.35 16.9 21.6 14.9 22.1 19.4 17.4 15.6 14.1 18.3 22 5.1 146 16.3 18.9 6.5 11.3 14.4 10.9 17.4 15.3 19.4 21 10.2 14.17 16.9 16.7 16.7 7.3 9.5 16.1 16.3 11 19.4 18.6 15 12.48 12.4 16.8 17.8 17.6 16.1 9.5 17.6 16.3 21.2 20.3 18.9 12.99 18.8 20.1 16.4 18.6 6.3 8.6 15.9 12.3 16.9 11.8 13 14.5
10 20.4 22.5 14.9 8.9 9.7 11 14.1 12.4 15 19.1 16.7 1711 18.8 23.7 14.3 14.9 9.9 9.2 15.6 11.8 20.9 18.9 16.2 14.112 21.3 23.7 10.1 20.7 10.1 6 12.1 18.2 20.5 17.4 18.4 12.113 20.3 16.7 14.5 15.9 14.5 16.7 15.5 18.1 18.3 22 15.3 11.614 23.8 21.5 19.3 16.3 15.2 16.8 19 17.7 6.6 17.4 19.5 1815 22 23.5 6.1 16.3 18.8 17.5 15.6 17.4 16.1 7.8 15.2 19.416 10.9 22.1 15.3 20 18 16.4 12.7 16.5 18.9 20.7 9.8 13.917 12.7 14.7 20.2 21.8 18.2 4.4 19.1 16.9 20.1 16.7 16.1 19.218 17.5 18.3 17 18.7 17 10.9 16.5 20.5 12.3 18.1 11.8 21.619 18.7 22 16.8 20.4 15.7 10.6 16.9 19.9 14.3 16.4 11.8 22.620 19.6 20.6 19.5 22.2 17.9 9.2 16.1 18.9 19.6 12 21.1 16.121 16.1 18.6 16 20.2 17.7 15.5 16.5 19.2 18.1 17.4 11.3 17.822 20.8 25.7 21.9 6.5 12.2 9.5 13 16.4 20.2 20.9 11.9 7.223 18.6 26.1 19.3 15.5 16.3 17.5 16.5 18.9 18.6 17.5 13.7 724 18.2 25.4 22.8 14.7 10.4 16.3 18 18.1 21.3 19.1 20.6 725 17.3 25.1 6.7 17.8 8.7 17.1 17.1 15.5 18.6 20.8 14.4 10.126 20 11.6 20.6 4.8 9.8 17.7 18.6 20.3 19.4 20.7 18.1 15.827 18.9 17.3 8.5 9.2 10.4 17.8 15.2 18.2 20.2 13.4 17.4 20.128 19 16.3 17.4 3.1 17.7 17.7 16.8 13.9 11.5 21.3 19.6 20.229 23.9 17.3 12.5 17.5 20.1 16.6 13.8 13.9 21.3 9.5 5.530 24.7 21.4 12.9 17 14.1 10.9 16.4 20.2 14.8 10.2 2031 18.6 15 18.9 14.7 16.9 10.1 13.4

46
2007 JAN FEB MAR APR MAY JUN JUL AUG SEP OCT NOV DEC
1 19.1 21.3 22.7 6.7 13.7 13.1 16.9 13.9 20.2 23.1 22.6 21.82 12.5 15.8 13.7 22.1 6.1 12.4 13.3 11.3 23.1 19 24 17.83 21.6 14.3 20.4 25.9 26.1 10.2 17.8 14.2 21.3 23 18.8 11.84 17.8 16.5 19.6 26.1 22.5 12.9 15.6 20 23.7 15.3 20.8 28.15 19.5 20.1 21.7 22.7 22 17.3 21.3 20.5 22.8 23 22.2 17.46 20.9 16.3 21.1 21 21.2 20.5 17.4 18.6 19.4 24 21.5 16.87 20.7 17.6 17.7 21.4 14.8 18.5 19.2 19.9 22.2 17.9 24.5 16.38 21.1 17 17.1 21.6 20.4 19.6 17.6 17.1 20.7 23.2 21 20.99 20.2 20.4 21.1 22.7 21 20.1 20.4 20.4 23.8 6.9 24.3 13.3
10 21 20.9 25.2 21.2 18.1 20.7 21.1 16.4 20.5 24.3 19.6 17.311 22.8 19.9 24.5 13.2 12.9 20.1 22.5 20.4 20.3 22.4 23.4 19.912 19.1 16.8 19.9 21.9 14.5 19.1 19.5 18.8 24.5 23.1 13.1 12.513 20.8 16.1 19.6 18.9 15.3 13.4 20.1 23.1 20.1 20.1 5.7 14.214 17.9 22.6 18.7 21.2 14.1 21.4 20 19.9 19.6 21.9 30.9 14.815 21.5 21.7 11.3 15.5 14.5 19.1 20.1 18 19.7 20.2 12.5 17.616 20.7 21.9 16.4 12.1 6.7 21.2 15.8 18 22.4 20 23.3 25.917 15.6 20.5 15.6 7.6 6.3 19.2 14.2 15.3 19.2 23.1 16.5 22.418 15 24.3 5.4 8 19.5 20.5 13.1 19.6 23.7 21.5 24.5 21.719 16 23.2 23 9.9 20.5 22 21.1 20.3 23.2 23.4 18.8 21.820 20 23.7 17.9 22.2 20.6 20.3 18.7 19 21.3 16.5 20.1 17.321 18 24.5 17.8 23.4 12.5 19.3 18.6 13.9 23.2 24.2 18.9 1822 19.5 21.4 14.2 17.3 11.1 17.3 20.7 11.9 22 25.4 19.1 13.923 23.5 23.4 16.2 14.2 18 19.7 21.1 22.6 22.5 24.1 18 16.324 23 21.4 16.7 9.5 18.9 19.1 20.4 21.5 23.3 17.1 15.3 22.125 19.5 23 23 18.2 23.6 14.8 20.6 14 23.7 14.8 18.4 22.926 19.4 22.1 22.4 11.6 11.8 19.1 18.4 20.5 21.5 23.5 16.8 27.627 17.3 21.9 14.9 20.3 21.1 20.9 18.7 19.9 16.8 25 17.3 23.628 23.8 14.5 17.1 21.7 14.9 16.5 18.1 21.1 20.5 26.4 20.9 17.429 20.5 16.2 21.7 11.2 19.9 20.1 19.1 18 21.4 19.7 23.430 18.6 21.4 15.2 4.5 18.4 21.9 20.8 21 11.9 24.2 19.631 20.4 17.9 7.2 19.5 18 24.8 22
2006 JAN FEB MAR APR MAY JUN JUL AUG SEP OCT NOV DEC
1 20.9 19.2 22 19.6 16.5 18.1 18.9 15 20.6 25.7 20.3 23.62 21.8 18.1 21.3 14.4 21.2 20.2 16.7 9.3 15.3 13.2 12.1 19.63 22.9 16.8 18.1 7.9 21.7 19.6 13.3 16.7 16.5 23.1 17.4 9.54 24.3 23 24.8 7.9 21 18.9 12.1 18.3 11.8 19.7 19.9 15.25 23.7 15.2 22.5 9.7 21.3 4.9 16 19.2 22.3 22.7 5 18.16 23.3 16.1 18.3 21.5 19.7 16.8 20.6 19.4 21.5 20.7 11.1 22.37 24.4 14.1 16.3 16.4 20.3 16.4 20.9 17.1 21.2 19.4 13.8 19.98 21.1 20.8 17.7 11.9 21.7 19.9 19 19.4 16.6 13.9 22 11.99 18.9 20.6 20.5 19.1 11.5 18.7 14.5 17.3 19.9 21.5 18.1 19
10 25.3 14.5 16.7 8.1 13.5 16.8 20.8 17.9 18.1 12.6 17.4 19.611 18.6 16.7 16.3 19.9 18.7 19.9 18.2 15.2 19.2 16.7 14.3 16.512 12 13.1 17.4 11.8 15.8 18.1 20.4 14.2 20.8 21.4 16.8 19.413 19.9 21.1 21 21.2 20.3 17.7 19.6 12.4 21.8 13.2 18.1 18.514 17.3 22.4 23.6 22.6 18.1 15.5 11 20.4 18.1 22.2 14.2 20.615 8 20.6 20.2 17.3 18.6 13.5 14 20.9 19.9 14.2 16.3 18.216 10.3 21.5 24 16.5 11.9 13.8 13.3 21.1 16.5 19.4 14.7 17.317 18.6 22.6 22.6 5.7 10.1 8.8 11.3 17.9 15.2 18 13.9 19.718 19.9 21.3 25.4 11.9 10.6 14.9 16.5 14.1 19.6 20.9 18.4 19.619 14.3 20.4 24.5 7.8 18.5 15.2 18 18 21.3 23.8 19.9 20.520 14.2 18 25 9.9 14.7 15.9 15.8 14.7 18.1 25.4 19.9 1921 17.3 18.8 24.5 15.7 19.6 10.7 13.1 17.1 19.6 21.3 20 16.922 15.8 18.1 27.1 22.7 19.9 13.4 8.3 21.4 18 20.3 21.5 17.723 23.2 18.7 25.6 18.1 20.3 18.6 12.2 21.5 19.7 22.9 19.9 19.624 19.4 19.1 20.2 20.7 12.9 18.1 20.9 16.2 17.3 24.8 22.8 19.625 22 24 25.9 18.3 18.6 21 14.8 7.1 16.7 22.6 19.6 18.426 18.9 20.7 24.2 9.8 19.2 18.4 15.9 12.9 19.4 17.9 17 11.427 11.3 25.4 16.5 17.8 19.2 16.1 15.9 22.2 13.9 13 19 16.828 19 26.6 15.5 6.2 10.2 19.7 18.2 22.2 19.6 17.9 7.2 18.929 21.9 25.7 21.6 7.3 15.5 20.4 18.1 17.5 18 19.4 9.6 19.630 17 22 18.6 15.5 19 15.6 19.3 21.1 22.8 11.6 21.531 14.9 24.8 17.3 17.1 18.9 17.8 19.1

WATER BALANCE ASSESSMENT IN UNGUJA ISLAND, ZANZIBAR, TANZANIA
47
Appendix B-4 Wind speed (m/s) 2008 JAN FEB MAR APR MAY JUN JUL AUG SEP OCT NOV DEC
1 8.3 11.8 4.3 6.4 7 10.6 8.7 4.3 15.4 5.5 4.7 4.42 7.6 13 7.5 7.2 7.3 8.4 6 2.8 12.5 5 1.8 5.73 8.1 12.9 4.9 8.3 7.1 6.8 5.7 2.3 10.3 3.5 1.9 4.14 7.9 8.4 4.2 7 7.5 9.5 5.8 2.3 12.6 5.1 3.7 4.55 8.8 6.3 5.4 6.1 9.6 11.1 8.4 2.7 12.1 6.1 5.7 2.96 7.5 5.2 2 5.6 7.5 9.7 7.1 2.5 8.2 8.5 6.6 3.67 7.7 3.3 3.3 3.5 7.4 8.9 5.3 9.3 9 7.6 5.5 3.78 4.9 4.4 5.7 5 9.9 8.6 6.5 10.2 8.1 2.9 6.2 5.69 5.6 5 6.7 3.8 8.7 4.4 10.3 5.5 8.2 1.6 9.5 7
10 3.6 3.5 3.1 3.3 8.2 5.5 9.8 7.7 5.4 6.7 6.3 7.311 4.3 5 3.7 2.3 9.2 2.1 9.7 4.5 8.1 5.9 4.3 512 7.4 3.4 3.5 3.4 6.9 6.9 6.2 6.2 4.1 8 3.6 3.213 4.7 3.9 2.6 2.9 7.1 7.2 7.9 7.9 4.6 6.6 2.1 0.414 5.8 4.3 5.3 4.2 5.2 4.5 9.2 8.5 5.3 10.3 2.7 2.515 3.5 5.4 2 6.9 5.2 4 8.8 10.4 4.1 11.9 2.5 3.316 2.3 4.1 5.6 7.5 3.5 7.3 7.8 6.9 5.5 12 2.4 4.317 1.8 3.4 7.2 8.5 3.7 6.3 5.7 7.9 5.6 7 2.5 6.818 3 4.9 7.6 9.9 2.7 8.3 4.4 11.6 5.9 8.8 2.5 6.419 4 5.5 6 9.1 2.9 10.2 5.8 7 8.6 8.7 2.3 4.520 3.5 4.2 3.4 8.5 2.2 8.1 4.1 7.3 9.3 10.3 6.7 6.321 8.7 5.9 3.7 7.4 2.9 7.5 5 5.2 7.5 5.8 1.6 2.622 9.4 4 2.4 2.5 5.2 6.2 4.4 4.1 12.5 5.5 2.4 0.223 12.3 4.9 2.7 3.4 6.8 6.4 4 4.5 11.1 4 2.6 3.324 11.1 4.1 2.9 4.7 7.3 10.3 6.2 4.6 7.9 1.5 4.4 3.325 8.6 4.1 3.1 6.4 4.5 11.9 6.4 3.5 2.7 3.7 2.6 2.326 6.5 4.6 2.6 4 5.7 8.9 7.8 3.9 3.5 5.6 3.6 7.627 5.6 6.8 2.9 8.3 7.9 10.3 10.5 7.1 5.8 8.3 6.6 8.228 6 7.8 3.3 10.8 8.2 9 7.8 8.6 8.7 9 2.7 6.329 6 3.7 7.5 10 8 8.9 4.1 9.1 8.9 2.5 1.730 5.9 7.5 5.7 10.6 10.8 6.1 3.6 5.8 8.8 3.6 4.531 8.4 6.6 9.8 5.5 10.1 2.8 6.6
2007 JAN FEB MAR APR MAY JUN JUL AUG SEP OCT NOV DEC
1 9.1 6 6.2 3.8 7.9 5.7 7.2 11.5 6.4 9.1 7.7 5.72 7.5 7.3 4.2 3.7 6 8.6 10.8 7.6 6.8 7.2 8.1 3.53 12.8 5.2 6.1 4.2 5.2 7.4 11.6 8.9 5.8 8 4 3.64 10.5 6 5.4 4.3 7.6 5.5 10.8 6.9 6.8 6.5 3.7 45 9.6 5.9 6.8 4.3 8.3 7.9 8.4 9 9 6.2 5 3.26 9.7 5.8 8 3.9 6.8 4.4 8.6 11.1 6.1 7 5.4 3.47 6.7 6.2 5.5 2.7 3.8 4.6 7.9 10.9 6.1 5.9 4.5 5.38 8.7 7.4 2.6 2.9 7.9 3.4 7.3 9 6.2 5.1 5.2 6.29 6.3 6 5.5 3.3 9.4 4.4 10.6 11.5 6.5 5 4 3.7
10 10.9 6.7 6.9 5.1 7.9 4.6 9.6 10.1 6 7.3 3.9 3.311 6.4 10.7 3.4 3.5 8.3 5.8 10.5 8.1 5.1 4.9 4.4 4.612 8 8.7 4.8 8.5 8.3 8.2 6 6.7 5.8 5.6 5.2 4.713 6.6 6.8 4.3 7.1 10.7 7.9 9.6 5.9 7.3 5.6 4.2 4.314 5.1 7.7 3.9 8.9 7.6 9.2 10.9 4.3 5.3 5.7 2.9 4.915 3.9 5.2 2.5 9.1 8.1 9.5 11.6 3.8 7.3 4.1 3.9 6.216 4.9 5.1 3 6.6 7.3 12.9 9.8 3.9 9.9 4.9 5.5 6.417 4.5 5.2 4.4 6.1 7.3 10.9 9.3 7.3 9.1 7.2 3.3 8.418 6.8 6.5 2.7 5.2 4.7 11.7 10.1 10.7 8.3 9.3 3.6 9.319 7.2 4.6 4.3 4.2 5.2 10.1 9.4 14.1 9.4 7 4.4 7.820 8.7 7.3 3.2 4.2 4 12.2 8 8.6 9.6 6.3 4.2 4.621 8.7 7.5 2.1 4.4 1.4 9.3 8 8.3 9.3 7.2 3.8 5.722 7.5 7.8 2.6 4.9 1.5 10.5 8.3 8.1 7.7 4.6 3.8 4.323 6.3 8.2 2.2 3.9 4.2 11 10.2 7.7 6.7 4.7 4.1 5.624 6.5 5 2.7 2.8 7.3 8.9 9.8 7.7 5.9 4 3.8 6.225 7.5 6.5 4 2 10.8 5.8 7.2 6.9 7.1 4.5 5.9 7.326 6.6 8 3.3 2.3 13.6 7.4 5.7 8.5 6.9 7.2 4.3 12.827 6.9 5.3 4.1 3 11.6 6 5.4 5.6 7.8 9.3 5.9 12.128 6.9 4.3 7.9 4.3 10.1 4 4.8 5.5 9 8.4 6.3 729 6.9 2.1 4.7 10 6.2 3.7 6.6 7.9 7.2 5.1 7.430 6.6 6.4 3.4 7.9 7.5 4.5 7.4 9.3 7.1 5.8 831 8.4 5.8 6.2 12.3 4.9 5.8 10.6
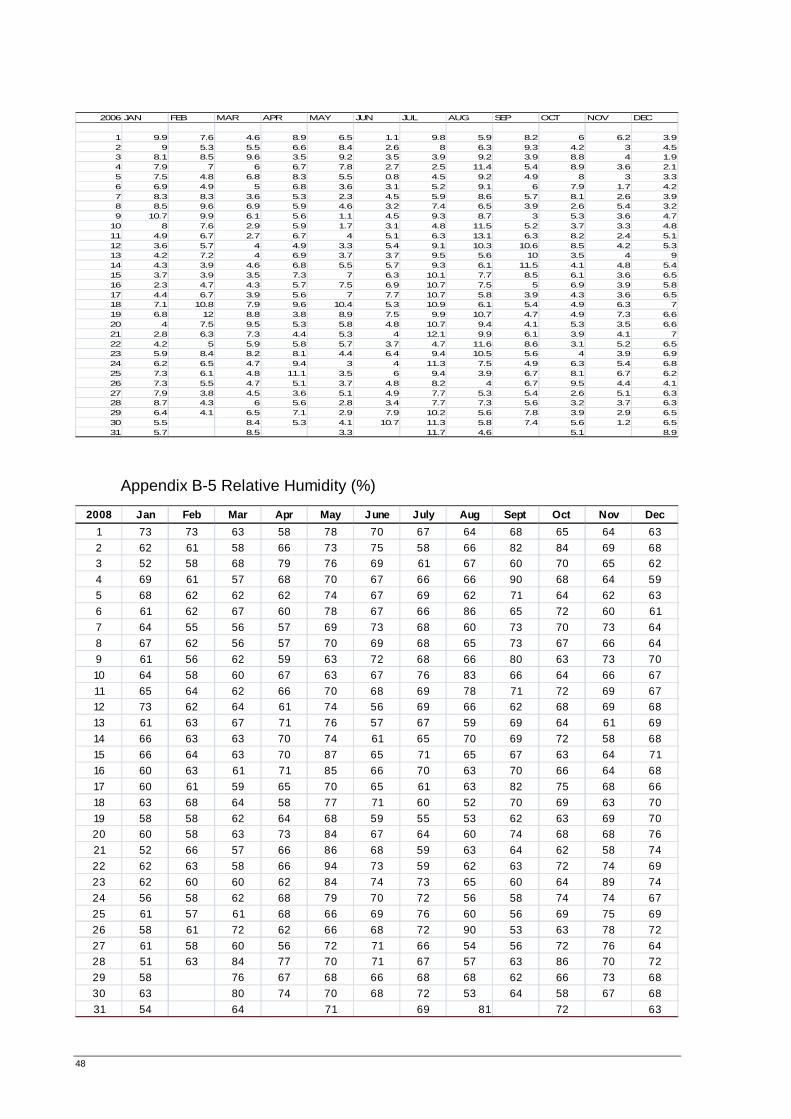
48
2006 JAN FEB MAR APR MAY JUN JUL AUG SEP OCT NOV DEC
1 9.9 7.6 4.6 8.9 6.5 1.1 9.8 5.9 8.2 6 6.2 3.92 9 5.3 5.5 6.6 8.4 2.6 8 6.3 9.3 4.2 3 4.53 8.1 8.5 9.6 3.5 9.2 3.5 3.9 9.2 3.9 8.8 4 1.94 7.9 7 6 6.7 7.8 2.7 2.5 11.4 5.4 8.9 3.6 2.15 7.5 4.8 6.8 8.3 5.5 0.8 4.5 9.2 4.9 8 3 3.36 6.9 4.9 5 6.8 3.6 3.1 5.2 9.1 6 7.9 1.7 4.27 8.3 8.3 3.6 5.3 2.3 4.5 5.9 8.6 5.7 8.1 2.6 3.98 8.5 9.6 6.9 5.9 4.6 3.2 7.4 6.5 3.9 2.6 5.4 3.29 10.7 9.9 6.1 5.6 1.1 4.5 9.3 8.7 3 5.3 3.6 4.7
10 8 7.6 2.9 5.9 1.7 3.1 4.8 11.5 5.2 3.7 3.3 4.811 4.9 6.7 2.7 6.7 4 5.1 6.3 13.1 6.3 8.2 2.4 5.112 3.6 5.7 4 4.9 3.3 5.4 9.1 10.3 10.6 8.5 4.2 5.313 4.2 7.2 4 6.9 3.7 3.7 9.5 5.6 10 3.5 4 914 4.3 3.9 4.6 6.8 5.5 5.7 9.3 6.1 11.5 4.1 4.8 5.415 3.7 3.9 3.5 7.3 7 6.3 10.1 7.7 8.5 6.1 3.6 6.516 2.3 4.7 4.3 5.7 7.5 6.9 10.7 7.5 5 6.9 3.9 5.817 4.4 6.7 3.9 5.6 7 7.7 10.7 5.8 3.9 4.3 3.6 6.518 7.1 10.8 7.9 9.6 10.4 5.3 10.9 6.1 5.4 4.9 6.3 719 6.8 12 8.8 3.8 8.9 7.5 9.9 10.7 4.7 4.9 7.3 6.620 4 7.5 9.5 5.3 5.8 4.8 10.7 9.4 4.1 5.3 3.5 6.621 2.8 6.3 7.3 4.4 5.3 4 12.1 9.9 6.1 3.9 4.1 722 4.2 5 5.9 5.8 5.7 3.7 4.7 11.6 8.6 3.1 5.2 6.523 5.9 8.4 8.2 8.1 4.4 6.4 9.4 10.5 5.6 4 3.9 6.924 6.2 6.5 4.7 9.4 3 4 11.3 7.5 4.9 6.3 5.4 6.825 7.3 6.1 4.8 11.1 3.5 6 9.4 3.9 6.7 8.1 6.7 6.226 7.3 5.5 4.7 5.1 3.7 4.8 8.2 4 6.7 9.5 4.4 4.127 7.9 3.8 4.5 3.6 5.1 4.9 7.7 5.3 5.4 2.6 5.1 6.328 8.7 4.3 6 5.6 2.8 3.4 7.7 7.3 5.6 3.2 3.7 6.329 6.4 4.1 6.5 7.1 2.9 7.9 10.2 5.6 7.8 3.9 2.9 6.530 5.5 8.4 5.3 4.1 10.7 11.3 5.8 7.4 5.6 1.2 6.531 5.7 8.5 3.3 11.7 4.6 5.1 8.9
Appendix B-5 Relative Humidity (%)
2008 Jan Feb Mar Apr May June July Aug Sept Oct Nov Dec1 73 73 63 58 78 70 67 64 68 65 64 632 62 61 58 66 73 75 58 66 82 84 69 683 52 58 68 79 76 69 61 67 60 70 65 624 69 61 57 68 70 67 66 66 90 68 64 595 68 62 62 62 74 67 69 62 71 64 62 636 61 62 67 60 78 67 66 86 65 72 60 617 64 55 56 57 69 73 68 60 73 70 73 648 67 62 56 57 70 69 68 65 73 67 66 649 61 56 62 59 63 72 68 66 80 63 73 7010 64 58 60 67 63 67 76 83 66 64 66 6711 65 64 62 66 70 68 69 78 71 72 69 6712 73 62 64 61 74 56 69 66 62 68 69 6813 61 63 67 71 76 57 67 59 69 64 61 6914 66 63 63 70 74 61 65 70 69 72 58 6815 66 64 63 70 87 65 71 65 67 63 64 7116 60 63 61 71 85 66 70 63 70 66 64 6817 60 61 59 65 70 65 61 63 82 75 68 6618 63 68 64 58 77 71 60 52 70 69 63 7019 58 58 62 64 68 59 55 53 62 63 69 7020 60 58 63 73 84 67 64 60 74 68 68 7621 52 66 57 66 86 68 59 63 64 62 58 7422 62 63 58 66 94 73 59 62 63 72 74 6923 62 60 60 62 84 74 73 65 60 64 89 7424 56 58 62 68 79 70 72 56 58 74 74 6725 61 57 61 68 66 69 76 60 56 69 75 6926 58 61 72 62 66 68 72 90 53 63 78 7227 61 58 60 56 72 71 66 54 56 72 76 6428 51 63 84 77 70 71 67 57 63 86 70 7229 58 76 67 68 66 68 68 62 66 73 6830 63 80 74 70 68 72 53 64 58 67 6831 54 64 71 69 81 72 63

WATER BALANCE ASSESSMENT IN UNGUJA ISLAND, ZANZIBAR, TANZANIA
49
2007 Jan Feb Mar Apr May June July Aug Sept Oct Nov Dec1 68 58 72 77 82 69 63 67 58 80 77 872 67 62 63 69 76 54 60 60 65 75 65 713 64 66 61 69 80 66 62 73 64 73 77 704 64 67 72 73 92 72 63 63 60 67 72 745 72 70 63 68 74 64 46 73 76 70 71 576 68 71 63 71 76 69 56 64 82 71 66 677 64 66 62 81 90 72 84 42 67 82 66 648 71 58 69 75 89 57 65 54 86 68 62 669 71 71 70 72 81 62 63 52 65 70 94 7210 64 79 56 72 78 68 69 54 65 72 92 6911 65 65 61 87 90 69 61 79 63 65 71 6312 64 68 60 81 76 63 63 63 79 78 75 7213 70 69 65 87 7 69 65 59 83 74 76 6814 70 68 67 80 74 63 66 64 78 96 69 7815 75 73 64 93 60 68 93 79 55 82 71 8416 67 68 68 84 58 62 84 75 89 77 73 7217 68 69 92 95 77 67 67 87 76 69 83 9618 63 71 82 91 90 62 63 70 75 71 74 7219 58 72 91 75 83 60 64 46 87 70 78 6720 67 60 76 89 81 63 62 82 85 88 74 6421 64 71 71 91 92 61 60 56 64 70 70 8122 70 73 90 80 99 57 69 71 80 79 71 8223 68 76 69 84 78 62 64 80 76 58 66 8624 70 60 73 88 87 63 65 66 80 67 57 8525 69 58 64 82 74 58 53 89 81 74 72 6526 67 60 70 82 77 70 77 55 70 87 73 6727 67 57 66 72 72 54 59 51 73 72 66 6428 72 61 71 81 89 61 63 46 69 69 70 6729 72 67 69 75 79 55 62 59 66 73 70 7130 85 72 83 80 54 60 45 84 69 69 6131 73 53 69 68 59 78 74
2006 Jan Feb Mar Apr May June July Aug Sept Oct Nov Dec
1 69 66 71 68 72 62 55 60 59 74 55 702 69 68 68 63 72 64 62 67 8 59 57 963 70 57 70 72 82 64 68 65 52 70 70 634 66 68 69 66 81 61 82 74 55 62 76 625 69 69 65 68 80 67 58 65 50 56 70 546 70 68 73 66 63 69 57 60 53 62 55 847 92 69 70 86 64 50 64 57 45 68 60 788 92 67 52 96 73 51 63 60 90 54 63 659 74 67 50 79 66 68 63 90 70 54 68 6010 69 66 55 79 69 52 57 65 66 53 70 5211 69 64 48 80 82 60 72 52 58 55 66 5512 64 67 63 81 64 47 57 58 49 64 61 5713 64 67 61 81 76 76 75 55 54 74 63 7114 68 67 60 85 71 64 66 55 63 59 67 5315 70 63 61 92 67 59 65 50 50 65 62 5316 62 69 88 89 66 65 62 54 49 55 58 8117 67 64 86 89 67 59 60 48 53 56 57 7418 66 69 82 72 53 60 59 68 61 61 57 6219 67 68 91 90 64 66 65 57 56 74 56 5720 75 69 63 75 75 69 65 62 51 72 56 5621 82 68 69 82 92 56 62 64 67 73 59 6922 76 67 65 79 69 70 61 55 63 63 57 6823 69 67 72 77 72 71 58 53 63 58 61 5424 61 70 63 77 83 53 63 57 57 58 61 6725 67 65 74 75 88 62 65 94 56 62 55 5826 62 69 67 72 84 61 49 84 60 81 62 6027 84 69 67 66 70 82 49 90 59 71 56 5728 71 65 63 70 63 79 47 59 62 98 55 5529 74 66 87 75 75 63 69 59 91 64 5130 64 88 71 75 67 56 50 83 51 53 6331 67 67 68 59 58 54 70

50
Appendix B-6 Rainfall (mm)
2008 Jan Feb Mar Apr May Jun Jul Aug Sep Oct Nov Dec
0 0 4.1 9.9 0 0 0 2 0 0 0 561 0 0 30.2 34 0 0 0 39 16.4 0 7 3.62 0 0 5.3 9.3 0 4 0 21.2 7.3 0 19.2 03 0 0 0 91.5 0.3 0 0 4 5.3 0.2 0 3.54 0 0 11.3 12.7 0 0 1.7 0 1.2 0 57.7 05 0 0 0.6 22.8 0 0 0 0 5.8 1.6 29.1 06 0 0 0 0 0 0.5 0 0 0 30.8 9.2 647 0 0 0 12 0 0 1.4 0 2.5 6.6 2 7.48 44.6 0 0 15.3 0 0 18.7 0 0 3.1 0.8 27.59 32.1 0 2.2 49.2 0 0.4 0.4 0 0.7 0 0 0
10 0 0 2.6 32.2 0 0 0.2 4.5 0 0 0 011 15.8 0 0 61.1 0 0 0 4.2 0 0 7.2 012 5.2 0 0 6.2 0 0 52.3 3 0 0.8 14.113 11 0.2 0 3.1 0 0 0 2 13.2 3.9 0 014 0.5 0 1.4 14.4 0 0 0 0 1.4 0 7.8 015 0 3.3 0 0 0 0 3.6 0 59.5 20.6 34.2 016 0 0 0 7.7 14.9 1.1 20.7 0.6 15.3 0 1.8 017 0 0 1.4 66.8 28.4 0 1.1 0 3.5 0 1 018 0 0 4.2 7.8 31.9 0 0 0 0 0 30.4 34.519 0 0 17.2 59.3 0 0 0 1.4 0 0 11.620 0 0.4 8.9 37.4 19.6 0 0 0 0 0 0 13.321 0 0 0.2 9.5 0.8 0 0 0 1.2 9.2 0 0.222 0 0.6 28 0.3 0 0.4 0 1 0 6.5 0 25.323 0 0.8 1.9 1 0 1.1 0.8 10.5 0 0 0 024 21.6 0 5 1.4 1.5 0 0 5.6 0 3 0 21.525 30.6 54.3 2.3 0.3 1.9 0 1.8 0 0 9 9.9 026 0 15.3 0 30 6.8 0 13.2 1 0.6 0 0 027 0 3 0.7 4.1 0.5 0 1.7 0 2.7 33.3 10.3 028 0 58 10.6 0 21.6 4 7.1 6.1 12 0 0.729 0 19.8 5 0 14.9 0.9 15.3 0 23.6 030 0 84.4 0 3.4 1.6 19.4 031 0 0 0 1.6 0 0 0.6 0 4.9 37.4 0

WATER BALANCE ASSESSMENT IN UNGUJA ISLAND, ZANZIBAR, TANZANIA
51
2007 1 0 0 0 1.6 0 0 0.6 0 4.9 37.4 02 0 0 0 0.7 0 0 2.3 0 0 0.9 7.4 03 0 0 0 0 0 0 1 0 1.4 0 0 04 0 0 12.6 0 2 0 0 8.3 0 0 05 1.1 0 0 30.6 1.3 0 0 2.9 0 5.4 06 2.9 0 1.5 0 8.5 0 1.5 0 0 0 07 1 0 0 0 5.3 0 0 0 0 0 0 08 0 0 0 4.4 24.9 11.3 1.2 0 0 0 13.2 09 3.8 0 0 3.3 2.8 0 0 0 0 19.8 0 0
10 0 0 0 31.2 5.3 0 0 0 7.8 0 011 0 1.8 5 11.3 45 0 0 0 2.5 11.2 412 21.6 0 24.9 12.6 51.4 0 0 0 0.3 0 0 013 0 0 2.6 5.1 0 0 0 0 0 0 3.714 0 0 0 0.7 4.3 0 0 0 0 0 3.7 1.915 0 0 6.2 12.3 0 0 0.2 0 0 0 12.2 016 0 0 11.3 10.5 0 0 0 0 2.7 0 8.3 017 0 6.3 7.6 11.8 0 18.2 0 0 0.1 0 0 018 0 3.5 6.4 3.8 5.6 15.6 3.8 4 0 0 0 2.919 0 15.8 0 5.7 9.3 6.8 0 0 0.4 0 0 30.520 0 12.4 0 24.5 59.8 0 0 5.5 1.7 2.5 0 6.421 0 1.1 0 0 36.3 3.3 0 0 0 0.5 0 022 1.1 37.8 7.3 0.4 0.4 0 0 0 0 4.4 0 023 0 11.3 0 5.6 4.3 5.9 3.4 0 0 0 0 0.924 0.2 0.7 0 4.8 0 9.7 0.3 0 0 0 0 025 84.8 1.1 6.5 12.5 1 2.9 5.5 1.7 0 0 0 026 2.1 0 0.6 19.8 2.9 0 0 4.4 1.7 0 3.2 027 0 0.3 6.8 33.2 5.3 0 0 0 0 0 0 028 0 0 1.9 0.6 0 0 0 0 0 0 0 0.929 0 37.8 9.3 0 0 0 4.5 0 0 0.5 030 0 6 0.3 0 0 0 0 0 0 0 0.331 0 0 1.5 0 0 1.7 0
2006 Jan Feb Mar Apr May Jun Jul Aug Sep Oct Nov Dec0 0 12.8 0 30 0 0 0.4 0 0 2.5 0
1 0 0 0 0 3.4 17.8 0 0 2.8 0 0 11.52 0 0 0 0 0 80.4 0 10.3 0.8 0 0 112.53 0 0 33.5 0 20.6 34.9 0 6.8 0 0 0 204 0 0 0 0 8 2.2 0 16.6 1.4 4.4 0 27.45 0 0 0 37.7 0.2 5.4 0 0.2 0 0 0 28.96 0 0 0.1 7.5 0.5 30 0 0 0 0 0 07 0 0.7 0 13.1 6.7 0.5 0 0 0 0 9.7 08 0 0 0 11.6 2.3 1.2 0 0 0 0 17.8 09 0 0 0 6.5 0 0 0 0 0 0 0 0
10 0 0 0 8.4 6 0 0 0 1.4 0 0 0.211 0 0 0 2.8 8.2 0 0 0.3 1.8 0 0 4.312 0 0 0 66.3 0 3.1 0 7.8 4.8 0 2.2 43.813 0 0 5 14.5 0 2 0 0 0 1.4 0.4 30.514 0 0 0.3 2.1 0 0 0 20.4 0 0 0 31.515 0 0 0 0 7.8 11.2 0 2.2 0 0 0 30.816 0 0 0.3 0 0 68.6 0 0.4 0.7 0.5 1.6 017 0 0 40.5 0 0 21.1 0.5 0 0 0 0 6.918 0 0 0.7 0 0 0.5 0 2.7 1.3 0 0 10.519 0 0 0.7 12.8 0 0 0.6 0 0 0 8.9 0.220 0 0 0 59.3 0 8 0 0 0 0 0.4 15.721 0 0 0 0.8 0 3.4 1.4 0 0 0 0 4.622 1 0 8.2 7 0 8.8 8.4 0.4 0 0 1.9 24.323 0 0 0 11.6 0 0 6.5 0 0 0 0 024 0 0 21.9 9 0 2 0 1.3 1 0 0 3625 0 0 2.8 14 0 0 0 1.9 0.8 1 0 026 0 0 33.3 5.8 0 0 0 0 1.5 0 4.2 0.327 0 0 7.6 8.7 0 0 4.6 3.5 0.8 0 1.2 6.828 0 0 0 37.9 0 0 4.7 0 0 0 30.1 029 0 0 5.4 0 0 66.5 10.2 0 0 46.8 030 0 0.1 0 35.6 0 0 031 0 0 0 0.9 6.6 12.1 1.5 1.9 2.4 0 0.07 3.1

52
Appendix C-1 Flow discharge (m3/s)
Month discharge m3/s Month discharge m3/s Month discharge m3/sMonth discharge m3/sMonth discharge m3/s Month discharge m3/sJan-00 0.052 Jan-01 0.049 Jan-02 0.035 Jan-03 0.093 Jan-04 0.046 Jan-05 0.059Feb-00 0.045 Feb-01 0.043 Feb-02 0.037 Feb-03 0.102 Feb-04 0.056 Feb-05 0.052Mar-00 0.044 Mar-01 0.039 Mar-02 0.036 Mar-03 0.076 Mar-04 0.086 Mar-05 0.049Apr-00 0.052 Apr-01 0.045 Apr-02 0.074 Apr-03 0.082 Apr-04 0.093 Apr-05 0.076
May-00 0.07 May-01 0.084 May-02 0.078 May-03 1.213 May-04 0.096 May-05 0.078Jun-00 0.074 Jun-01 0.082 Jun-02 0.081 Jun-03 0.102 Jun-04 0.080 Jun-05 0.091Jul-00 0.065 Jul-01 0.061 Jul-02 0.07 Jul-03 0.076 Jul-04 0.080 Jul-05 0.072
Aug-00 0.055 Aug-01 0.054 Aug-02 0.068 Aug-03 0.066 Aug-04 0.063 Aug-05 0.074Sep-00 0.043 Sep-01 0.047 Sep-02 0.062 Sep-03 0.076 Sep-04 0.054 Sep-05 0.061Oct-00 0.044 Oct-01 0.036 Oct-02 0.059 Oct-03 0.056 Oct-04 0.036 Oct-05 0.052
Nov-00 0.044 Nov-01 0.0347 Nov-02 0.078 Nov-03 0.066 Nov-04 0.044 Nov-05 0.051Dec-00 0.052 Dec-01 0.035 Dec-02 0.07 Dec-03 0.082 Dec-04 0.062 Dec-05 0.051