water accounting in a multi-catchment district...
TRANSCRIPT
Water Accounting in a Multi-Catchment District (WAMCD) Executive Summary
Water Accounting in a Multi-Catchment District (WAMCD)
EXECUTIVE SUMMARY
March 2015

Water Accounting in a Multi-Catchment District (WAMCD) Executive Summary
Index
1. INTRODUCTION ............................................................................................................................. 1
2. SCOPE AND OBJECTIVES ................................................................................................................. 1
3. METHODOLOGICAL DEVELOPMENTS .............................................................................................. 3
3.1. Inception ............................................................................................................................... 3
3.2. Methodologies for building the SEEAW tables ......................................................................... 4
3.3. Interim report and meetings ................................................................................................... 7
3.4. Tool for data acquisition ......................................................................................................... 7
3.5. Building of the SEEAW Tables ................................................................................................. 8
3.5.1. SEEAW Tables for 2015 and 2021 ................................................................................................ 8
3.5.2. Indicators ...................................................................................................................................... 9
3.6. Proposal of measures ........................................................................................................... 10
4. OUTPUTS OF THE PROJECT ........................................................................................................... 12
5. CONCLUSIONS AND LESSON LEARNED .......................................................................................... 13
5.1. Regarding technical difficulties ............................................................................................. 13
5.2. Regarding the potential use of the SEEAW ............................................................................ 14
5.3. Regarding the limitations of the SEEAW ................................................................................ 14


Water Accounting in a Multi-Catchment District (WAMCD) Executive Summary
1
1. Introduction
The Water Accounting in a Multi-Catchment District Project (WAMCD Project) has been developed under the
Grant Agreement No. 07.0329/2013/671291/SUB/ENV.C1, following the Open call for proposals Desertifica-
tion 2012 – 2013 in the framework of the Preparatory Action on development of prevention activities to halt
desertification in Europe (Halting Desertification in Europe). The beneficiaries of the Grant Agreement are:
INTECSA-INARSA, S.A. (ES). Coordinator
Universidad de Málaga (ES)
Universidad Politécnica de Valencia (ES)
Oficina de Planificación de la Dirección General de Planificación y Gestión del Dominio Público Hidráulico.
Junta de Andalucía (ES)
InterSus – Sustainability Services (DE)
2. Scope and objectives
The main goal of the project was the development of water accounts for the Mediterranean Basins of Anda-
lucia River Basin District (MBA RBD), consistent with the UN standard "System of Economic and Environmental
Accounts for Water" (SEEAW), as well as its integration into the River Basin Management Plan 2015 (RBMP-
15). This RBD encompasses up to 16 subsystems with a wide range of natural conditions and a high level of
pressure on water ecosystems. Subsystems (or exploitation systems) may include one or more independent
river basins.
Fig. 1. Systems and sub-systems in the MBA

Executive Summary Water Accounting in a Multi-Catchment District (WAMCD)
2
For geographical and administrative reasons, the subsystems are grouped into major units, called "systems" I
to V (see table below).
I.- SERRANIA DE RONDA III.- SIERRA NEVADA
I-1 Guadarranque and Palmones river basins III-1 Watersheds between De la Miel and Guadalfeo rivers
I-2 Guadiaro river basin III-2 Guadalfeo river basin
I-3 Watersheds between Guadiaro & Guadalhorce rivers III-3 Watersheds between Guadalfeo and Adra rivers
I-4 Guadalhorce y Guadalmedina river basins III-4 Adra river basin and "Campo de Dalías" aquifer
I-5 "Fuente de Piedra" endorheic basin IV.- SIERRA DE GADOR-FILABRES
II.- SIERRA TEJEDA-ALMIJARA IV-1 Andarax river basin
II-1 Vélez river basin IV-2 "Campo de Níjar" natural region
II-2 Zafarraya Polje V.- SIERRA DE FILABRES-ESTANCIAS
II-3 Watersheds between Vélez & De la Miel rivers, including the latest V-1 Carboneras and Aguas river basins
V-2 Almanzora river basin
Whenever possible, the WAMCD project produced results at the subsystem level, so reflecting the wide range
of climatic conditions and significant management differences among them. This way, the project intends to
provide a benchmark for the application of water accounts to heterogeneous environments and climates, but
with similar datasets and criteria.
The hydro-climatic conditions range from average annual rainfall of less than 250 mm in Campo de Níjar (ss
IV-2) to more than 1.000 mm in the Guadiaro basin (ss I-2), leading to varied hydrological regimes from pluvial
or snow-melting driven permanent water courses to intermittent ones that remain dry most of the year, the
so-called “ramblas”. Some subsystems have significant storage infrastructure while others are mainly depend-
ent of flowing surface waters or, more commonly, of groundwater with some relevant examples of overex-
ploitation. Finally, this RBD hosts two environmentally valuable endorheic basins1: Fuente de Piedra (ss I-5)
and Zafarraya (ss II-2).
1 Closed drainage basin that allows no outflow to other external bodies of water.
Water Accounting in a Multi-Catchment District (WAMCD) Executive Summary
3
3. Methodological developments
The WAMCD Project has attempted to cover as many aspects of SEEAW as possible, even if no data from
statistical sources or RBMP estimates were available. This approach involved the development of new, com-
plex methodologies for data processing and calculations under the following scheme:
Activity 1 Inception Activity 3 Interim Report & meeting
Task 1.1 Compilation and analysis of data sources. Identi-fication of gaps
Task 3.1 2nd Team Coordination meeting
Task 1.2 1st Team Coordination meeting Task 3.2 Drafting of Interim Report & Interim meeting
Task 1.3 Detailed Work Plan and Inception Meeting Activity 4 Development of a tool for data acquisition from DSS to SEEAW Sheets
Activity 2 Methodological adjustments for Physical Tables and implementation
Activity 5 Building of SEEAW Tables
Task 2.1 Methodology for Water Resources Assessments at Subsystem level
Task 5.1 Physical supply and use tables for water 2015
Task 2.2 Methodology for GWB' balances at monthly ba-sis
Task 5.2 Hybrid and economic accounts for activities and products related to water 2015
Task 2.3 Test of EVALHID applicability Task 5.3 Physical supply and use tables for water 2021
Task 2.4 Test of CAUDECO applicability Task 5.4 Hybrid and economic accounts for activities and products related to water 2021
Task 2.5 Implementation of Water Resources Assessment both at GBW and Subsystem level
Activity 6 Proposal of management, technological and economic measures (incentives) for PoM
Task 2.6 Global methodological approach for Physical Ta-bles
Activity 7 Drafting of the Final Report
Task 2.7 Development of methodology for hybrid ac-counting (monetary inputs)
A summary of the activities covered by the WAMCD Project is presented in the next sections.
3.1. Inception
The First Coordination Meeting of the WAMCD Project Team was held in Madrid on 27th January 2014. The
joint Inception Meeting with the attendance of representatives of all the Working Teams under of the above-
mentioned Preparatory Action was held in Brussels on 5th February 2014.
The objective at this inception stage was the collection of relevant datasets and the detection of main infor-
mation gaps in order to, consequently, establish a detailed Work Plan. The main potential data sources iden-
tified were:
River Basin planning documents, namely Mediterranean Basins of Andalusia River Basin Management Plan
2009 (RBMP-09) and the Draft Proposal of Mediterranean Basins of Andalusia River Basin Management
Plan 2015 (dRBMP-15).
Hydrological data series (particularly SIMPA2 ) and relevant geographical covers.
Statistical series of social and economic data provided by the Institute of Statistics and Cartography of
Andalusia and the Spanish Statistical Office.
2 Sistema Integrado de Modelización Precipitación-Aportación: Integrated System for Rainfall-Runoff Modelling.
Executive Summary Water Accounting in a Multi-Catchment District (WAMCD)
4
The information collected was put into relation with the data included in the RBMP-09 (available at that mo-
ment) and with the grouping of ISIC activities3 required by the SEEAW tables. Some gaps of information re-
garding the hydrological cycle were identified, such as snowpack datasets (very scarce) and gauging stations
series (frequently not completed or unreliable). Other problems derived the quality of the data on economic
activities, since they are provided at regional scale and grouped in such a way that some relevant distinctions
could not easily been made (e.g. hydropower from other energy production sources; wastewater treatment
discharge from solid waste disposal). Finally, information on pollutants discharge was partial and not available
for some activities.
After analysing the SEEAW requirements and the information gaps, needs for methodological adjustments to
be developed under Activity 2 were identified.
3.2. Methodologies for building the SEEAW tables
The WAMCD Project has attempted to cover as much aspects of SEEAW as possible even if no data from sta-
tistical sources or RBMP estimates were available. This approach involved the development of new, complex
methodologies for data processing and calculations.
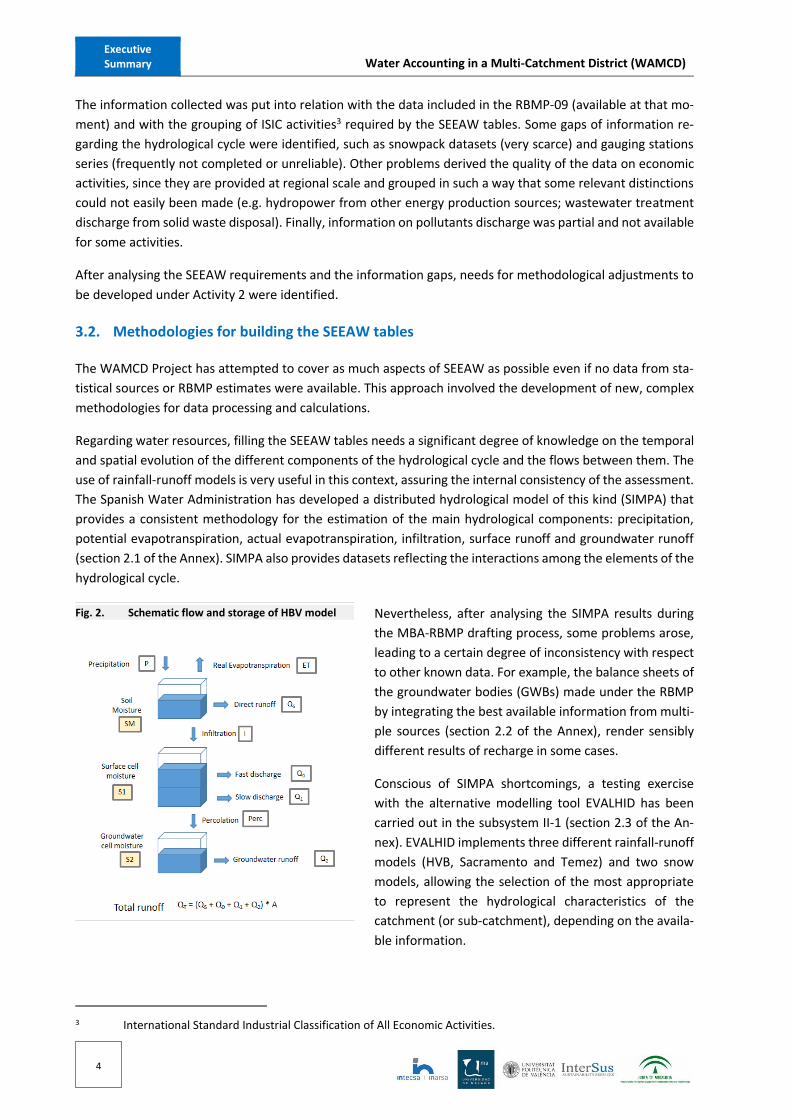
Regarding water resources, filling the SEEAW tables needs a significant degree of knowledge on the temporal
and spatial evolution of the different components of the hydrological cycle and the flows between them. The
use of rainfall-runoff models is very useful in this context, assuring the internal consistency of the assessment.
The Spanish Water Administration has developed a distributed hydrological model of this kind (SIMPA) that
provides a consistent methodology for the estimation of the main hydrological components: precipitation,
potential evapotranspiration, actual evapotranspiration, infiltration, surface runoff and groundwater runoff
(section 2.1 of the Annex). SIMPA also provides datasets reflecting the interactions among the elements of the
hydrological cycle.
Nevertheless, after analysing the SIMPA results during
the MBA-RBMP drafting process, some problems arose,
leading to a certain degree of inconsistency with respect
to other known data. For example, the balance sheets of
the groundwater bodies (GWBs) made under the RBMP
by integrating the best available information from multi-
ple sources (section 2.2 of the Annex), render sensibly
different results of recharge in some cases.
Conscious of SIMPA shortcomings, a testing exercise
with the alternative modelling tool EVALHID has been
carried out in the subsystem II-1 (section 2.3 of the An-
nex). EVALHID implements three different rainfall-runoff
models (HVB, Sacramento and Temez) and two snow
models, allowing the selection of the most appropriate
to represent the hydrological characteristics of the
catchment (or sub-catchment), depending on the availa-
ble information.
3 International Standard Industrial Classification of All Economic Activities.
Fig. 2. Schematic flow and storage of HBV model

Water Accounting in a Multi-Catchment District (WAMCD) Executive Summary
5
Moreover, EVALHID is a new development of the Decision Support System (DSS) AQUATOOL, whose water
management simulation module SIMGES has been used for building the balances for the MBA RBMP. Both
modules may be combined , improving the possibilities of calibration with actual streamflow and reservoir
storage datasets when the hydrological regime is substantially altered.
CAUDECO, another module of the AQUATOOL DSS, has also been tested to assess its potential for measuring
environmental allocation of water, proving to be useful when the required information and associated tools
(APU-flow curves, SIMGES model) are available (section 2.4 of the Annex). Since environmental water is not
an explicit content of SEEAW, an external assessment of this kind is advisable.
The initial test confirmed that
EVALHID might offer a signifi-
cant improvement in terms of
adjustment to observed data
compared with SIMPA. Two ad-
ditional subsystem were se-
lected based on data availabil-
ity and overall interest for plan-
ning objectives. Eventually, the
calibration and modelling with
EVALHID was completed in
three subsystems (I-2. Gua-
diaro river basin; II-1. Vélez
river basin and III-2. Guadalfeo
river basin) as well as the GWB Sierra de Líbar (code 060.044), shared with the neighbour Guadalete-Barbate
RBD. These catchments represent 346,236 hectares of land, 19.5% of the RBD surface and 40% of average
water resources.
EVALHID has proven to
offer better adjustments
to measured data (sec-
tion 2.5 of the Annex).
The results for the subsys-
tem III-2 are particularly
promising regarding the
possibility of reproducing
the evolution in time of
the snowpack even in ab-
sence of direct measure-
ment, but a more accu-
rate assessment of water
withdrawals and returns from the complex irrigation system in the upper basin is needed to improve the re-
naturalization of the flow regime.
Due to the complexity of the calibration works, it has not been possible to consolidate the results of the water
resources assessments implemented with EVALHID in time for its full integration in the RBMP-15. It must be
noted that in both RBMP-09 and RBMP-15, water assets combine direct SIMPA data with specific flow estima-
tions in the case of regulated systems simulated with the AQUATOOL DSS, as well as annual GWB resulting
Fig. 3. Location of simulated spatial units
Fig. 4. Comparison of Sacramento (EVALHID) and SIMPA results in Cueva del Gato Spring (GWB Sierra de Líbar)
SR Surface runoff GF Groundwater flow

Executive Summary Water Accounting in a Multi-Catchment District (WAMCD)
6
from the combination of various sources. Therefore, the path initiated in this WAMCD Project is bound to be
further explored in the 3rd RBMP cycle to improve the robustness of water balances.
Eventually, RBMP-09 estimates have been used for fine-tuning the methodological approach in its application
to the 2009 reference scenario. Thus, a first pack of tables has been produced combining water assets data
with information on water demand and use from the RBMP-09. A detailed explanation of each component of
the different tables is included in section 2.6 of the Annex.
Finally, consistent hybrid accounting has been completed at RBD level, using economic data mainly from re-
gional sources (Andalusian Input/Output- tables and other macro-economic statistics). In addition, the criteria
and intermediate results of the Cost Recovery Analysis (CRA) of the RBMP-15, under drafting at that moment,
were taken into account to assure consistency and comparability (section 2.7 of the Annex).
Many decisions have been taken to define and complete the tables, overcoming technical difficulties. The
main assumptions and criteria adopted in this process are summarized below:
Data mix. The combination of different sources causes certain problems for closing water assets balances.
Ideally, the use of rainfall-runoff models integrated with management simulation models should end up in
completely coherent water assets. This approach has been explored in the WAMCD Project and should be
implemented in the framework of the next RBMP cycle. In the meantime, the component Other changes
in volume of Table V-1 that has been calculated as a residual, gives a relative magnitude of the maladjust-
ments caused by mixing different sources. This way, it is a relevant piece of information to concentrate
future efforts in those subsystem were major problems have been detected.
Spatial scale. All the methodological work has been made at subsystem scale, except the hybrid accounting
since economic data are provided at regional scale and their spatial breakdown into subsystems would
have been contrived. Moreover, most of the results that are presented in the Annex are limited to RBD
scale to avoid an excessive data burden.
Time scale. Monthly basis has been used for water assets (Chapter VI). The monthly scale could also be
available for water supply and use table (Chapter III), but they do not provide substantial new information
since monthly abstraction and returns are part of the water assets tables.
Reference period. There are two basic options when calculating water balances: using one specific refer-
ence year (e.g. 2005/06) or using some statistical value to represent a series of years. According to the
Fig. 5. Table V.3. Hybrid account for supply and use of water for the baseline scenario (2009)
Total
(of which)
Hydro
1. Total output and supply (millions c.u.) 3.384,2 38.032,1 1.954,1 105,6 268,8 155,7 54.994,4 98.789,1 25.938,6 4.867,2 129.595,0
of which:
1.a. Natural water (CPC 1800) 168,7 16,1 0,0 0,0 209,8 1,4 7,6 403,7 9,2 11,1 423,9
1.b. Sewerage services (CPC 941) 0,0 18,4 0,0 0,0 3,0 145,7 0,0 167,1 0,0 11,0 178,1
2. Total intermediate consumption and use (millions c.u.) 1.328,9 27.343,2 1.338,6 72,3 161,5 26,7 22.364,7 52.563,6 17.572,8 39.021,5 4.876,6 15.560,5 129.595,0
of which:
2.a. Natural water (CPC 1800) 170,3 24,2 2,4 0,0 26,0 0,2 57,5 280,7 0,0 137,1 6,1 423,9
2.b. Sewerage services (CPC 941) 0,2 25,0 0,1 0,0 2,6 2,1 38,2 68,1 0,9 91,0 18,1 178,1
3. Total value added (gross) (= 1 - 2) (millions c.u.) 2.055,2 10.688,8 615,5 33,3 107,3 129,0 32.629,7 46.225,6 8.365,8 54.591,4
4. Gross fixed capital formation (millions c.u.) 554,9 3.862,5 1.286,4 69,5 158,0 14,8 9.752,7 15.629,2 15.629,2
of which:
4.a. For water supply 48,7 1,9 0,0 0,0 22,8 0,0 2,3 75,7 75,7
4.b. For water sanitation 0,0 9,5 0,0 0,0 0,0 21,1 0,0 30,6 30,6
5. Closing stocks of fixed assets for water supply (millions c.u.) 936,8 37,5 0,0 0,0 437,6 0,0 43,7 1.455,7 1.455,7
6. Closing stocks of fixed assets for sanitation (millions c.u.) 0,0 183,5 0,0 0,0 0,0 405,0 0,0 588,5 588,5
7. Total use of water (millions of cubic metres) 5.059,3 40,4 2.846,2 789,7 428,3 414,7 80,9 8.869,9 56,3 375,9 9.302,1
7.a. Total abstraction 4.999,7 3,6 2.839,4 789,7 410,4 216,1 19,4 8.488,6 191,3 8.679,9
of which:
7. a.1. Abstraction for own use 4.999,7 3,6 2.839,4 789,7 10,8 216,1 19,4 8.089,0 6,7 8.095,7
7.b. Use of water received from other economic units 59,7 36,8 6,9 0,0 17,9 198,6 61,5 381,3 56,3 184,6 622,2
8. Total supply of water (millions of cubic metres) 232,5 30,9 2.596,0 947,1 400,8 367,9 47,7 3.675,9 42,7 147,8 3.866,4
8.a. Supply of water to other economic units 0,0 14,4 0,0 0,0 339,8 26,1 38,4 418,8 42,7 147,8 609,2
of which:
8.a.1. Wastewater to sewerage 0,0 14,4 0,0 0,0 8,2 0,0 38,4 61,0 0,0 147,8 208,7
8.b. Total returns 232,5 16,6 2.596,0 947,1 61,0 341,8 9,2 3.257,1 0,0 0,0 3.257,1
9. Total (gross) emissions of COD (thousands of tons) 27,4
Total1-3 5-33, 41-43
35
36 37 38, 39, 45-99 Total industry Households Government
Industries (by ISIC category)
Rest of the
world
Taxes less
subsidies on
products,
trade and
Actual final consumption
Capital
formation
Water Accounting in a Multi-Catchment District (WAMCD) Executive Summary
7
Spanish Technical Regulation, balance between resources and demands must be representative of normal
supply conditions. This criterion has been reproduced by using the percentile 50 of the different monthly
components of the water assets.
Disaggregation of economic data. Some distinctions required by SEEAW cannot easily been made since
original information is unique. Specifically, energy production (ISIC 35) does not differentiate hydropower
and other production sources. Furthermore, in Input/Output-tables and other relevant statistical sources,
ISIC 37 (sewerage) is not differentiated from ISIC 38 (waste collection, treatment and disposal) and ISIC 39
(remediation). Different proxies have been used for distribution between ISIC sectors (section 2.7.1 of the
Annex).
3.3. Interim report and meetings
This activity was included in the Technical Proposal of the WAMCD Project to provide an interim overview of
the work done so far, once a detailed methodology for building the tables had been developed, and for the
eventual establishment of complementary guidelines for the following stages. The Interim Report (Second
Quarterly Report) was drafted and delivered to the European Commission.
The Second Team Coordination Meeting
took place in Madrid at INTECA-INARSA’s
premises on 18th September 2014. A
summary of the discussions held during
the meeting can be found in the section
3 of the Annex. On the other hand,
though the WAMCD Proposal foresaw
an Interim Meeting in Brussels, it has not
been held. Nevertheless, a certain level
of sharing of problems and intermediate
results between the Commission and the
seven working teams was achieved in
the First National Meeting on SEEAW
that was held in Madrid on 7th June 2014.
3.4. Tool for data acquisition
The purpose of this tool is to connect the inputs and results of the AQUATOOL DSS with a database, in order
to reorganize them and facilitate the filling of the SEEAW tables, in particular the water asset accounts (section
4 of the Annex). More specifically, the acquisition tool consists of a database linked to the SIMGES and the
EVALHID models. Currently, both modules work with a database in which the results can be downloaded,
linked to its corresponding element and type (demand node, channel, reservoir ...). It must be noted that each
item may be associated with multiple results, for example, in the case of a reservoir: storage, evaporation,
leaks...
In order to obtain results in the format required for the SEEAW tables, it has been necessary to build several
database queries. The exact wording of the queries, which are linked to spreadsheets where the asset ac-
counts are finally built, can be found in the Annex.
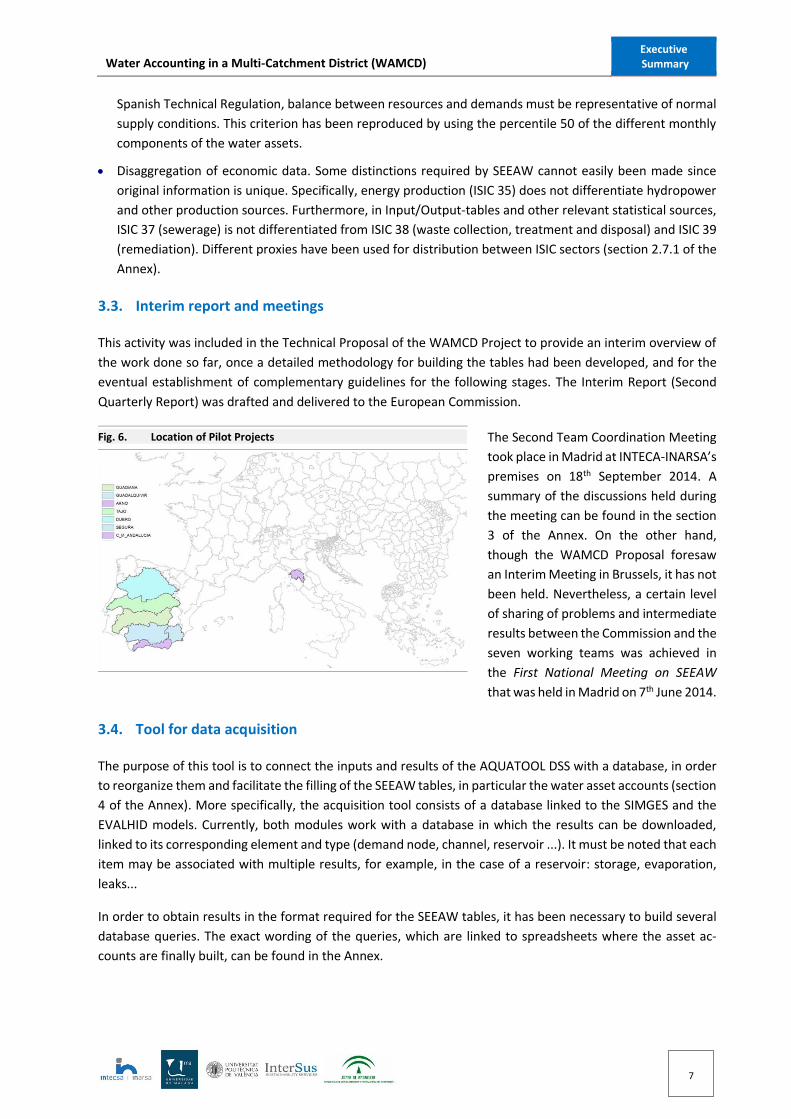
Fig. 6. Location of Pilot Projects
Executive Summary Water Accounting in a Multi-Catchment District (WAMCD)
8
Nevertheless, it must be noted
that the SIMGES models built so
far, though including the main
elements for the operation of
the water resources system, do
not represent the river basin as
a whole. In fact, its use in the
MBA RBD is limited to subsys-
tems where the provision of wa-
ter to the main demands de-
pends on reservoirs. Usually, the
abstraction of flowing water or
from aquifers that are not di-
rectly connected to major supply
systems is not explicitly taken into account. The SIMGES models should evolve to be more inclusive, facilitating
a direct extraction of complete datasets to fill SEEAW tables as well as a better interpretation of the whole
water cycle.
3.5. Building of the SEEAW Tables
3.5.1. SEEAW Tables for 2015 and 2021
The aim of this activity is the application of the methodological approach from Activity 2 to the water accounts
for the scenarios of the RBMP-15 (2015 and 2021). The same criteria have been applied regarding time and
spatial scale and reference period to assure the comparability of the results and to establish an "evolution
line" that facilitates the identification and characterization of trends.
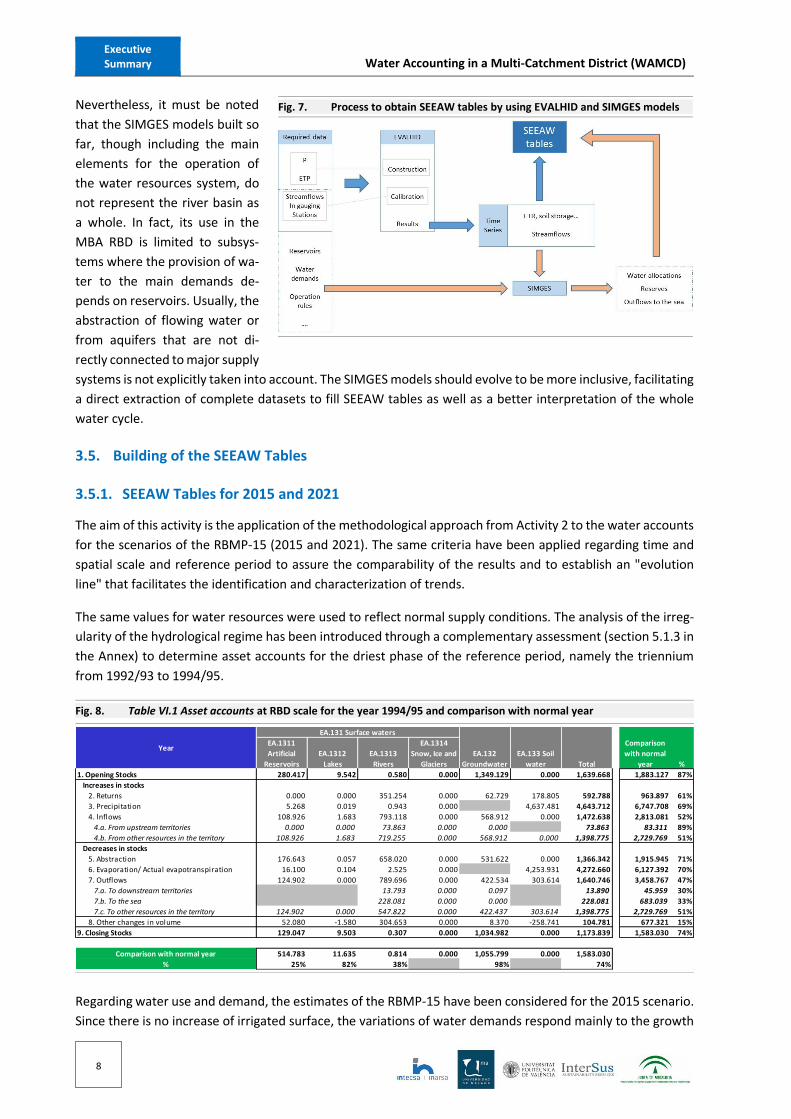
The same values for water resources were used to reflect normal supply conditions. The analysis of the irreg-
ularity of the hydrological regime has been introduced through a complementary assessment (section 5.1.3 in
the Annex) to determine asset accounts for the driest phase of the reference period, namely the triennium
from 1992/93 to 1994/95.
Fig. 8. Table VI.1 Asset accounts at RBD scale for the year 1994/95 and comparison with normal year
Regarding water use and demand, the estimates of the RBMP-15 have been considered for the 2015 scenario.
Since there is no increase of irrigated surface, the variations of water demands respond mainly to the growth
EA.1311
Artificial
Reservoirs
EA.1312
Lakes
EA.1313
Rivers
EA.1314
Snow, Ice and
Glaciers
Comparison
with normal
year %
1. Opening Stocks 280.417 9.542 0.580 0.000 1,349.129 0.000 1,639.668 1,883.127 87%
Increases in stocks
2. Returns 0.000 0.000 351.254 0.000 62.729 178.805 592.788 963.897 61%
3. Precipitation 5.268 0.019 0.943 0.000 4,637.481 4,643.712 6,747.708 69%
4. lnflows 108.926 1.683 793.118 0.000 568.912 0.000 1,472.638 2,813.081 52%
4.a. From upstream territories 0.000 0.000 73.863 0.000 0.000 73.863 83.311 89%
4.b. From other resources in the territory 108.926 1.683 719.255 0.000 568.912 0.000 1,398.775 2,729.769 51%
Decreases in stocks
5. Abstraction 176.643 0.057 658.020 0.000 531.622 0.000 1,366.342 1,915.945 71%
6. Evaporation/ Actual evapotranspiration 16.100 0.104 2.525 0.000 4,253.931 4,272.660 6,127.392 70%
7. Outflows 124.902 0.000 789.696 0.000 422.534 303.614 1,640.746 3,458.767 47%
7.a. To downstrearn territories 13.793 0.000 0.097 13.890 45.959 30%
7.b. To the sea 228.081 0.000 0.000 228.081 683.039 33%
7.c. To other resources in the territory 124.902 0.000 547.822 0.000 422.437 303.614 1,398.775 2,729.769 51%
8. Other changes in volume 52.080 -1.580 304.653 0.000 8.370 -258.741 104.781 677.321 15%
9. Closing Stocks 129.047 9.503 0.307 0.000 1,034.982 0.000 1,173.839 1,583.030 74%
Comparison with normal year 514.783 11.635 0.814 0.000 1,055.799 0.000 1,583.030
% 25% 82% 38% 98% 74%
Year
EA.131 Surface waters
EA.132
Groundwater
EA.133 Soil
water Total
Fig. 7. Process to obtain SEEAW tables by using EVALHID and SIMGES models

Water Accounting in a Multi-Catchment District (WAMCD) Executive Summary
9
of the population and, occasionally, to new industrial and energy production facilities. In addition, some im-
provements in water efficiency have taken place but at a slower pace than projected in the RBMP-09. There-
fore, no major adjustments were necessary. The recent evolution of economic issues is based on AMECO (An-
nual macro-economic database) of the European Commission and Andalusian GDP data (section 5.1.2.3.1 in
the Annex).
For the 2021 scenario, the application of the Programme of Measures should lead to are more substantial
changes. Several developments - improved irrigation efficiency, new desalination plants, enhanced reuse of
urban wastewater and transfers from neighbouring systems - will facilitate a reduction of the exploitation of
groundwater. The effect of the new or improved UWWTPs on emissions accounts has also been assessed.
Finally, the recent prospective of public investment in water related services elaborated for the Water Direc-
torate of the Ministry of Agriculture, Food and Environment (MAGRAMA) and other prospective based as-
sumptions have been considered (section 5.2.2.3.1 in the Annex).
Starting from the methodological developments of Activity 2, no major difficulties have been encountered,
except for the uncertainties of the economic projections. Eventually, two packs of tables (one for 2015 and
another for 2021) have been produced in addition to the one reflecting the baseline scenario (2009) completed
in the framework of Activity 2.
3.5.2. Indicators
The vast amount of information presented in SEEAW makes it difficult to easily draw useful conclusions for
water resources planning and managing. To overcome this problem, a new activity has been created aiming
at selecting and calculating a pack of relevant indicators (section 5.3 in the Annex). Occasionally, the support
of intermediate/auxiliary tables has been necessary.
The following indicators have been calculated for 2009, 2015 and 2021 scenarios under normal supply condi-
tions:
A) Water resource availability D) Water cost, pricing and incentives for conservation
A1. Renewable resources D1: Average water costs
A2. Per capita renewable resources D1-a. Agriculture
A3: Consumption index D1-b. Industry
A4: Exploitation Index D1-c. Households
A5: Use of renewable vs. non-renewable water resources D2: Average water productivity
B) Water use for human activities D2-a. Agriculture
B1-a: Water use per unit produced. ISIC I-3 D2-b. Industry
B1-b: Water use per unit produced. Rest of human activity D3: Stocks of water supply fixed assets per m3
B2-a: Water Productivity Ratio. ISIC I-3 D3-a. Agriculture
B2-b: Water Productivity Ratio. Rest of human activity D3-b. Water supply (ISIC 36)
B3: Water pollution per person. ISIC-37 D3-c. Rest of industry
B5: Decontamination ratio. ISIC-37 D4: Subsidies per m3
C) Opportunities to increase effective water supply D4-a. Agriculture
C1-a: Quantity of return flows to continental surface waters D4-b. Industry
C1-b: Quantity of return flows to ground water D4-c. Households
C1-c: Quantity of return flows to soil water E) Supplementary indicators (from WWDR 2006)
C1-d: Quantity of return flows to seawater E1: Share of urban and rural population
C2: Reuse of water as a share of total water use E2: Relative weight of agriculture in the economy
C3: Losses in distribution E3: Relative weight of agricultural abstraction in water balance
C3-a. Irrigated Agriculture E4: Irrigated land as a percentage of cultivated land
C3-b. ISIC 36 E5: Rate of cost recovery Wastewater management
E5: Rate of cost recovery Water supply

Executive Summary Water Accounting in a Multi-Catchment District (WAMCD)
10
Additionally, WEI+ estimates have been made for the 2015 scenario at subsystem level, under the formula:
WEI+ = Abstraction – Returns / Outflows + Abstraction – Returns + Δ Artificial Storage
Differences are not significant at RBD scale. Nevertheless, other indicators, e.g. A5: Use of renewable vs. non-
renewable water resources shows some positive trends even though a substantial increase of pressures is
noticeable (e.g. A2. Per capita renewable resources).
3.6. Proposal of measures
This activity was focused on the identification and assessment of the feasibility of implementing innovative
measures, from the revision of the MBA RBMP and the integration of other experiences acquired in the WFD
implementation process across Europe. It must be noted that the MBA RBMP-15 includes a comprehensive
DPSIR analysis to support the identification of main drivers as well as to propose best lines of action. All the
measures considered in the analysis - even if not specifically included in the Programme of Measures - and
others suggested by the Project Team have been structured and classified as follows:
Increase of water availability from public works and facilities
Artificial recharge of aquifers Opening of new boreholes or wells
Construction of new reservoirs Enhancement, dredging or rehabilitation of existing reser-voirs
Desalination of brackish water and/or distribution to users Saline discharge amendment
Desalination of sea-water and/or distribution to users Water transfers (intra-RBD)
Facilities for reusing urban waste-water Water transfers (to/from the rest of the world)
Change(s) in water sources
Infrastructure for water conveyance, internal regulation and distribution to users
Joint exploitation of water resources compatible with envi-ronmental objectives
Reduction of water abstraction from public works and facilities
Improvement and modernization of irrigation schemes Improvement and modernization of urban networks
Fig. 9. WEI+: seasonality and evolution from 2009 to 2021
0%
20%
40%
60%
80%
100%
0
50
100
150
200
250
oct nov dec jan feb mar apr may jun jul aug sep
hm3
Water Resources WEI+
WEI + 2009
MBA RBD
WEI + 2015
MBA RBD
WEI + 2021
MBA RBD
oct 54,75% 54,36% 54,79%
nov 22,30% 22,74% 22,26%
dec 28,81% 29,28% 27,77%
jan 26,28% 26,85% 26,27%
feb 25,76% 27,16% 27,12%
mar 42,76% 45,50% 43,41%
apr 57,63% 58,18% 58,56%
may 81,25% 81,59% 82,60%
jun 88,46% 88,45% 89,42%
jul 91,40% 90,01% 90,67%
aug 91,82% 90,63% 90,97%
sep 91,47% 90,32% 90,28%
Year 56,70% 56,63% 57,18%

Water Accounting in a Multi-Catchment District (WAMCD) Executive Summary
11
Reduction of water abstraction linked to better management
Awareness raising campaigns to promote water savings and educational programs
Promotion of saving through rain water management
Control, sanctioning and elimination of irregular/illegal uses
Promotion of the shift to less water-consuming crops in ag-riculture
Enforcement of e-flows regime Readjustment of irrigation demand on areas with signifi-cant water sustainability problems
Enforcement of overall water abstraction limits to reach good status
Reinforcement of the consumption control system
Prevention of reservoir silting processes by afforestation and hydrological restoration
Reduction of water abstraction through economic tools
Exchange of water rights and between users Stronger enforcement of cost-recovery principle and pric-ing policies to promote efficient water use
Public Water Banks
Reduction of emissions from public works and facilities
Construction or upgrading of WWTPs Treatment and management of specific pollutants
Improvements in sanitation networks
Reduction of emissions linked to better management
Application of codes of good practice for agriculture and livestock to reduce non-point emissions
Regulation, control and sanctioning of contaminated dis-charges to urban networks or to the environment
Prevention and remediation measures for adequate man-agement of contaminated soils and landfills
Training programs to disseminate better farming practice
Promotion of integrated production and ecological farming
The abovementioned responses (measures) have been characterized in terms of their main incidence in phys-
ical accounts, economic and hybrid accounts, other incidences (if any), as well as their eventual inclusions in
the MBA PoM. For each entry, other basic data are also identified: supplier, user, metering and assessment
methodology. An example is shown below:
Group of Measures Construction of new reservoirs
Response to Insufficient availability of natural water resources
Main incidence in physical accounts
Increase in the use of surface water (Table IIIA, ↑1.i.1 Surface water). May imply reduction in other sources (mainly GW). It also affects water assets (tables VI-1 and VI-2), modifying all the balance components of EA.1311 Artificial Reservoirs and its interchanges with other resources.
Main incidences in economic and hy-brid accounts
Tables V-1, V-2 and V-3. ↑ Water production. Capital and operational costs derived from the new infrastructures and exploitation (↑gross fixed capital formation, ↑stocks of fixed assets for water supply, ↑intermediate con-sumption, etc.) Tables V-5, V-6 and V-7. Changes arising from the financial structure of pro-jects, depending on involvement of public subsidies (↑governmental collec-tive expenditures); ↑National expenditures
Supplier ISIC 36 and/or Government
User Any
Metering Increment in the availability of water resources (hm3)
Assessment Data according to projected exploitation (water released for supply to users) or from simulation models.
Programme of Measures
3 measures in the PoM: 1 new dam (Gibralmedina) to be operative after 2027) and 2 other kind of regulation / impoundment infrastructure. Total budget: €66.0m (probably not properly updated).
Additional infor-mation
If it involves new modifications to the physical characteristics of SWB or al-terations to the level of GWB, conditions stated in article 4.7 of WFD (and ar-ticle 20 of RD-RBMP) should be met.

Executive Summary Water Accounting in a Multi-Catchment District (WAMCD)
12
A similar characterization has been made for the main drivers: increase in water demand from households
and other urban activities, new irrigated land, increases in industrial, energy and recreational water demand.
4. Outputs of the Project
Along with the methodological developments, the main outputs of the Project are:
a) Complete Water Resources Assessment has been made with the EVALHID tool for:
GWB 060.044 Sierra de Líbar (subsystem I-2) (section 2.5.2 of the Annex)
Guadiaro River Basin (subsystem I-2) (section 2.5.3.2 of the Annex)
Vélez River Basin (subsystem II-1) (section 2.5.3.1 of the Annex)
Guadalfeo River Basin (subsystem III-2) (section 2.5.3.3 of the Annex)
b) The conceptual design of a tool for data acquisition/transfer from the AQUATOOL DSS to SEEAW sheets
(section 4). Moreover, an instrumental tool for extracting information from SIMPA covers has been de-
veloped (section 2.5.2 of the Annex)
c) Three collections of SEEAW tables have been completed for the following scenarios:
2009 (base line), reflecting the reference situation of the RBMP-09 (sections 2.6 and 2.7 of the Annex).
2015, corresponding to the current situation of the RBMP-15 (section 5.1 of the Annex). A specific
analysis of the effect of drought in water assets has also been made for this scenario.
2021, corresponding to the 2021 scenario of the RBMP-15 (section 5.2 of the Annex).
Table Time scale Spatial scale Scenario(s) Time reference
Table III.1. Standard physical supply and use tables for water
Year RBD 2009 / 2015 / 2021 Normal supply conditions
Table III.2. Matrix of flows of water within the economy
Year RBD 2009 / 2015 / 2021 Normal supply conditions
Table III.3. Detailed physical water supply and use tables
Year RBD 2009 / 2015 / 2021 Normal supply conditions
Table IV.2. Emission accounts Year RBD 2015 / 2021 Normal supply conditions
Table V.1. Hybrid supply table Year RBD 2009 / 2015 / 2021 Normal supply conditions
Table V.2. Hybrid use table Year RBD 2009 / 2015 / 2021 Normal supply conditions
Table V.3. Hybrid account for supply and use of water
Year RBD 2009 / 2015 / 2021 Normal supply conditions
Table V.4. Hybrid account for water supply and sewerage for own use
Year RBD 2009 / 2015 / 2021 Normal supply conditions
Table V.5. Government accounts for water-related collective consumption services
Year RBD 2009 / 2015 / 2021 Normal supply conditions
Table V.6. National expenditure accounts for wastewater management
Year RBD 2009 / 2015 / 2021 Normal supply conditions
Table V.7. Financing accounts for wastewater management
Year RBD 2009 / 2015 / 2021 Normal supply conditions
Table VI.1. Asset accounts
Year / Month RBD 2009 / 2015 / 2021 Normal supply conditions
Year / Month Subsystem 2015 Normal supply conditions
Year RBD 2015 1994/95 (driest year)
Table VI.2. Matrix of flows between water re-sources
Year / Month RBD 2009 / 2015 / 2021 Normal supply conditions
d) A collection of thirty-five indicators relevant for water planning and management (section 5.3.2.2.1 of
the Annex).

Water Accounting in a Multi-Catchment District (WAMCD) Executive Summary
13
e) The calculation of WEI+ for the different scenarios (section 5.3.2.2.1 of the Annex).
f) The characterization of the effects of main pressures and proposed responses in the water accounts. Four
pressures and thirty-four lines of actions are included in this analysis (section 6.2 of the Annex).
5. Conclusions and lesson learned
5.1. Regarding technical difficulties
Difficulties Proposed solutions
Lack of direct datasets from some water cycle components (snowpack, actual evapotranspiration, soil water, ground-water reserve)
Increase of monitoring data: stream flows, snowpack, wa-ter abstraction.
Use of rainfall-runoff model properly calibrated (natural or re-naturalized regime) with available measured dataset to estimate the hidden components of the water cycle.
Lack of data on volume, quality and destination of water returns to the environment after use
Available information from the RBMP has been used (par-ticularly, efficiency in irrigated areas). If absent, general criteria from expert judgement have been applied to de-termine the fraction of water evapo-transpired and the destiny of effluents from UWWTP and irrigation returns (surface water, groundwater, soil or the sea).
Emissions accounts are not exhaustive, limited to available information.
Complex calculation of physical tables when mixing data from different information sources, deriving in lack of in-ternal consistency of water assets.
Integration of rainfall-runoff models and water manage-ment simulation (EVALHID + SIMGES or similar tools). If possible, models must integrate all the demand units and their supply sources. Validation of estimated data with measured data is a key issue.
Significant potential improvement of water resources knowledge is foreseen from the integration of EVALHID during the coming RBMP cycle.
The component other changes in volume calculated as a residual, quantifies maladjustments, helping to prioritize further work.
Different alternatives with regard to calculation period for water assets.
The selected option (percentile 50 of the series) intends to translate the “normal supply conditions” of the Spanish Regulation.
Consideration of hydrological irregularity. Water assets have been calculated also for the last hydro-logical year of driest historic period.
Environmental water allocation not properly considered in SEEAW.
Additional assessment is necessary. CAUDECO or similar tools may be useful once e-flows regimes and water needs of lakes and wetlands are determined.
WEI+ provides a first approach of human pressure on wa-ter systems.
SEEAW provides a great load of data, difficult to handle and to extract conclusions
Selection and calculation of relevant indicators from the SEEAW tables.
Economic information scale corresponds to administrative basis.
Use of proxies for territorial distribution of regional data. Hybrid accounts not artificially broken down in smaller hy-drographic units.
Aggregation of ISIC activity sectors, relevant for SEEAW in Input/Output Tables and other macroeconomic datasets.
Criteria for distribution have been used.
Original (statistical) broken down of ISIC 35 (differentiating Hydropower) and the group ISIC 37-39 in its constituents would be beneficial for better SEEAW application.

Executive Summary Water Accounting in a Multi-Catchment District (WAMCD)
14
5.2. Regarding the potential use of the SEEAW
The SEEAW provides a useful standard for the building of water balances and a conceptual framework to
integrate economic data, describing the interaction of water resources and water use. If sustained over
time, the SEEAW can be a useful tool for monitoring the evolution and impacts of policies related to water.
The SEEAW is compatible (and may be complementary) with the traditional water balances, as those es-
tablished in the Spanish RBMPs for the allocation of water resources among users and the environment (e-
flows regime and good quantitative status of GWBs) and for establishing reserve for future use. The
WAMCD Project has assured throughout the process the consistency of water quantity data between
SEEAW tables and RBMP water balances.
The gathering and integrating the data needed for building water balance is enhanced by the use of ade-
quate modelling tools. The combination of rainfall-runoff and water management simulation models (as
EVALHID and SIMGES) enables a better integration of all available data measured, estimated and mod-
elled to obtain consistent water balances.
Moreover, the extraction of complete datasets to fill the SEEAW tables can be facilitated by specific data
acquisition applications as the one designed in the framework of the WAMCD Project. To make this fully
possible, the SIMGES models developed so far in the MBA RBD should evolve to be more inclusive, by
incorporating all water abstractions, even flowing and underground, facilitating a better interpretation of
the whole water cycle.
The coordinated use of these tools provides a huge potential for evaluating strategies (responses) of adap-
tation to changes in the drivers and pressures, by assessing their effects on water allocation and the econ-
omy. Particularly, rainfall-runoff models may be very useful to better assess the effect of climate change
on water resources: different rainfall reduction scenarios, or land use changes can be modelled, improving
the prognosis of their consequences in terms of water availability at different points of the catchment
(SWBs or GWBs).
Though water efficiency and re-use targets, as well as environmental water allocation, were already con-
sidered when drafting the RBMP, the SEEAW additionally contributes by introducing economic issues with
detailed distinctions between economic activities and sectors. The tables have also been useful to obtain
indicators to evaluate the global performance of the RBMP and also for the calculation of the cost recovery
rate as required by Water Framework Directive, that may be enhanced with the support of the SEEAW,
since interchanges among activities related to the provision and use of water are further clarified.
Summarising, the SEEAW particularly if combined with some water modelling applications can be a good
tool to support the analysis of the effect of strategic options affecting water cycle and water use.
5.3. Regarding the limitations of the SEEAW
The combination of information from different sources, which is the common case (direct data, model
results and/or other kind of estimates), causes certain problems for closing water assets balances and to
assure the internal consistency of water accounts. In addition, direct measurement (or detailed assess-
ments) of some of the components of the water cycle namely stocks of groundwater and soil water , is
not feasible for relatively large watersheds or territories because of a variety of reasons, such as technical
difficulty and high costs in relation to practical benefits. The comprehensive knowledge of water uses and
associated water returns and their distribution in time and space as required by SEEAW is not easily avail-
able even if well designed control networks are operational.

Water Accounting in a Multi-Catchment District (WAMCD) Executive Summary
15
Thus, modelling for filling information gaps is difficult to avoid, resulting in a mix of not fully consistent
sources. As previously discussed, this problem could be solved by the joint use of models properly cali-
brated with available measured data and inclusive of water resources and demands in the entire RBD or
territory. Ideally, this (demanding) technical approach should end up in completely coherent water assets.
Although the WAMCD Project can be a first step, a long way is still ahead to improve the information and
technical tools.
The SEEAW complete structure of tables is very exigent in terms of information requirements and fre-
quently, no direct data are available to fill many of the boxes. In Spain, this is particularly true in the case
of economic statistics, forcing the user to adopt additional criteria and proxies. The lack of information
hinders practical applicability of the SEEAW and questions the uniformity and comparability of the results,
eroding, to some extent, its positive role as standard.
Though SEEAW provides useful information about the pressure exerted by human activities on water eco-
systems, environmental water allocation is not integrated into SEEAW and additional analyses have to be
developed and / or specific indicators must be calculated. Water management simulation models and spe-
cific tools as CAUDECO are useful by the consideration of e-flows regimes and water needs of wetlands in
their allocation scheme and the assessment of compliance.
Moreover, the SEEAW cannot substitute DSS tools (AQUATOOL or similar) to build significant water bal-
ances, if water scarcity and hydrological irregularity are a major issues. Proper evaluation of the impacts
on water supply and ecosystems must be introduced. For instance, in the Spanish legislation this is made
by the concept of «garantía» (level of service) meaning the maximum acceptable deficit in determined
periods throughout a series of years.
Similarly, the SEEAW is not the appropriate tool to analyse specific investment options where environmen-
tal and socio-economic impacts and benefits must be carefully assessed.