watauga manor - constant...
TRANSCRIPT

WATAUGA MANOR5052-A Watauga Road, Fayetteville, NC
OFFERING MEMORANDUM

N O N - E N D O R S E M E N T A N D D I S C L A I M E R N O T I C E
Confidentiality and DisclaimerThe information contained in the following Marketing Brochure is proprietary and strictly confidential. It is intended to
be reviewed only by the party receiving it from Marcus & Millichap and should not be made available to any other
person or entity without the written consent of Marcus & Millichap. This Marketing Brochure has been prepared to
provide summary, unverified information to prospective purchasers, and to establish only a preliminary level of
interest in the subject property. The information contained herein is not a substitute for a thorough due diligence
investigation. Marcus & Millichap has not made any investigation, and makes no warranty or representation, with
respect to the income or expenses for the subject property, the future projected financial performance of the
property, the size and square footage of the property and improvements, the presence or absence of contaminating
substances, PCB's or asbestos, the compliance with State and Federal regulations, the physical condition of the
improvements thereon, or the financial condition or business prospects of any tenant, or any tenant's plans or
intentions to continue its occupancy of the subject property. The information contained in this Marketing Brochure
has been obtained from sources we believe to be reliable; however, Marcus & Millichap has not verified, and will not
verify, any of the information contained herein, nor has Marcus & Millichap conducted any investigation regarding
these matters and makes no warranty or representation whatsoever regarding the accuracy or completeness of the
information provided. All potential buyers must take appropriate measures to verify all of the information set forth
herein. Marcus & Millichap is a service mark of Marcus & Millichap Real Estate Investment Services, Inc. © 2016
Marcus & Millichap. All rights reserved.
Non-Endorsement NoticeMarcus & Millichap is not affiliated with, sponsored by, or endorsed by any commercial tenant or lessee identified in
this marketing package. The presence of any corporation's logo or name is not intended to indicate or imply
affiliation with, or sponsorship or endorsement by, said corporation of Marcus & Millichap, its affiliates or
subsidiaries, or any agent, product, service, or commercial listing of Marcus & Millichap, and is solely included for
the purpose of providing tenant lessee information about this listing to prospective customers.
ALL PROPERTY SHOWINGS ARE BY APPOINTMENT ONLY.
PLEASE CONSULT YOUR MARCUS & MILLICHAP AGENT FOR MORE DETAILS.
WATAUGA MANOR
Fayetteville, NC
ACT ID Y0520010

TABLE OF CONTENTS
SECTION
INVESTMENT OVERVIEW 01Offering Summary
Regional Map
Local Map
Aerial Photo
FINANCIAL ANALYSIS 02Rent Roll Summary
Rent Roll Detail
Operating Statement
Notes
Pricing Detail
Acquisition Financing
MARKET COMPARABLES 03Comparables
Rent Comparables
MARKET OVERVIEW 04
Demographic Analysis
WATAUGA MANOR
WATAUGA MANOR
4
INVESTMENT
OVERVIEW

WATAUGA MANOR
#
EXECUTIVE SUMMARY
OFFERING SUMMARY
MAJOR EMPLOYERS
EMPLOYER # OF EMPLOYEES
Cape Fear Valley Health System 2,711
Cape Fear Valley Medical Ctr 2,711
County of Cumberland 1,320
Cracker Barrel 1,291
Saic 1,165
US Post Office 1,133
United Services Auto Assn 1,082
Fayetteville State University 1,007
Facet Purolator 800
Walmart 775
Easter Seals Ucp NC & VA 727
McDonalds 643
DEMOGRAPHICS
1-Miles 3-Miles 5-Miles
2015 Estimate Pop 8,856 74,024 161,179
2010 Census Pop 9,157 74,429 160,162
2015 Estimate HH 3,730 31,122 65,479
2010 Census HH 3,845 31,280 64,932
Median HH Income $35,883 $43,362 $43,528
Per Capita Income $19,593 $25,245 $23,878
Average HH Income $46,439 $59,894 $58,387
UNIT MIX
NUMBEROF UNITS
UNIT TYPEAPPROX.SQUARE FEET
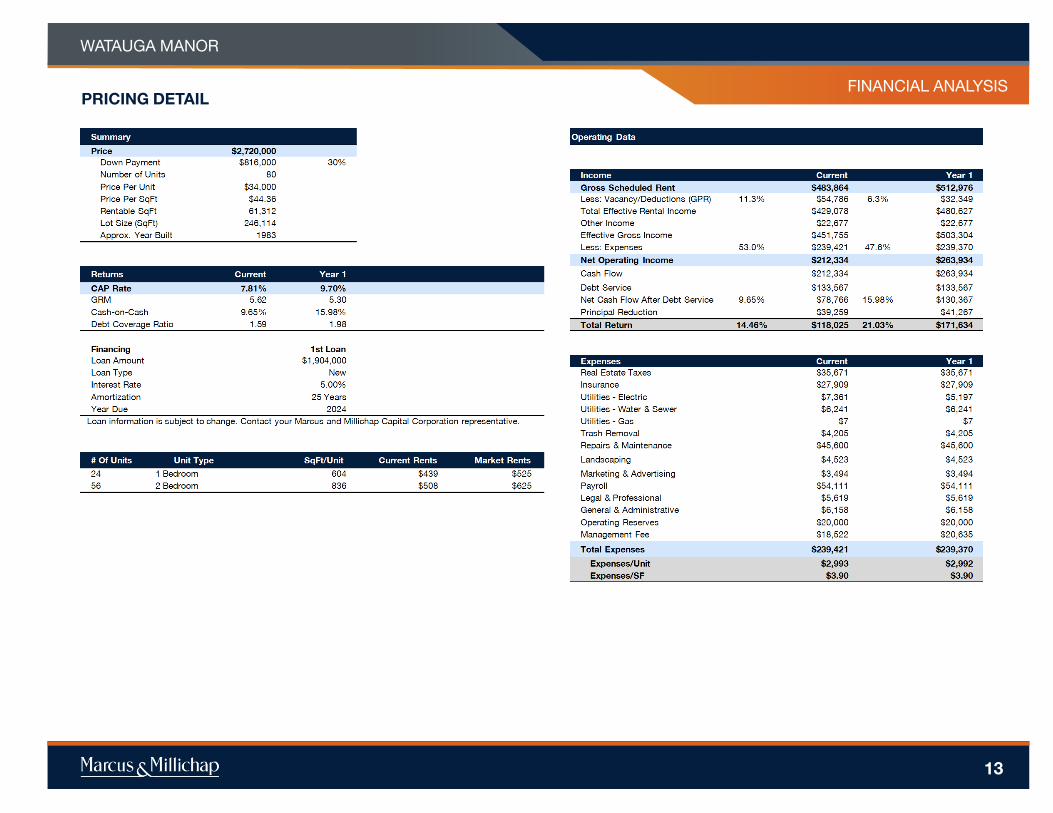
24 1 Bedroom 604
56 2 Bedroom 836
80 Total 61,312
5
VITAL DATA
Price $2,720,000 CURRENT YEAR 1
Down Payment 30% / $816,000 CAP Rate 7.81% 9.70%
Loan Amount $1,904,000 GRM 5.62 5.30
Loan Type Proposed NewNet Operating Income
$212,334 $263,934
Interest Rate / Amortization 5.00% / 25 YearsNet Cash Flow After Debt Service
9.65% / $78,766 15.98% / $130,367
Price/Unit $34,000 Total Return 14.46% / $118,025 21.03% / $171,634
Price/SF $44.36
Number of Units 80
Rentable Square Feet 61,312
Year Built 1983
Lot Size 5.65 acre(s)
WATAUGA MANOR
#
OFFERING SUMMARY
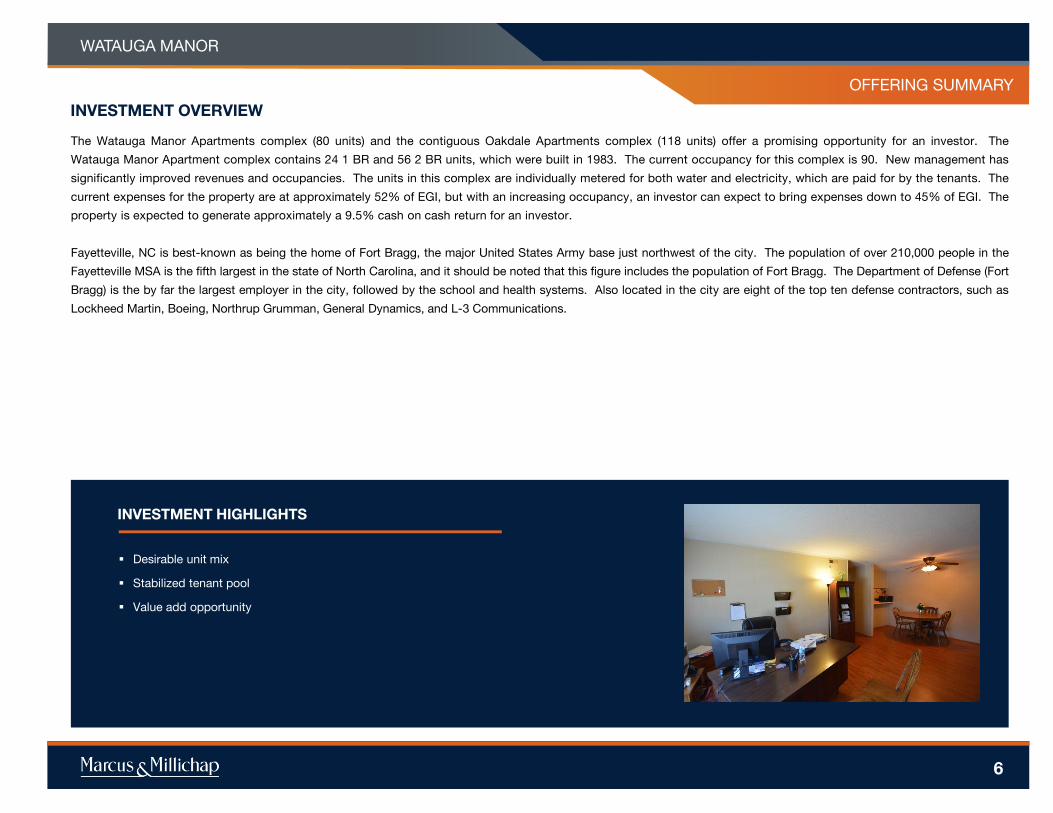
Desirable unit mix
Stabilized tenant pool
Value add opportunity
INVESTMENT HIGHLIGHTS
The Watauga Manor Apartments complex (80 units) and the contiguous Oakdale Apartments complex (118 units) offer a promising opportunity for an investor. The
Watauga Manor Apartment complex contains 24 1 BR and 56 2 BR units, which were built in 1983. The current occupancy for this complex is 90. New management has
significantly improved revenues and occupancies. The units in this complex are individually metered for both water and electricity, which are paid for by the tenants. The
current expenses for the property are at approximately 52% of EGI, but with an increasing occupancy, an investor can expect to bring expenses down to 45% of EGI. The
property is expected to generate approximately a 9.5% cash on cash return for an investor.
Fayetteville, NC is best-known as being the home of Fort Bragg, the major United States Army base just northwest of the city. The population of over 210,000 people in the
Fayetteville MSA is the fifth largest in the state of North Carolina, and it should be noted that this figure includes the population of Fort Bragg. The Department of Defense (Fort
Bragg) is the by far the largest employer in the city, followed by the school and health systems. Also located in the city are eight of the top ten defense contractors, such as
Lockheed Martin, Boeing, Northrup Grumman, General Dynamics, and L-3 Communications.
INVESTMENT OVERVIEW
6

REGIONAL MAP
WATAUGA MANOR
7

LOCAL MAP
WATAUGA MANOR
8

AERIAL PHOTO
WATAUGA MANOR
9
WATAUGA MANOR
10
FINANCIAL
ANALYSIS

FINANCIAL ANALYSIS
WATAUGA MANOR
RENT ROLL SUMMARY
11
FINANCIAL ANALYSIS
WATAUGA MANOR
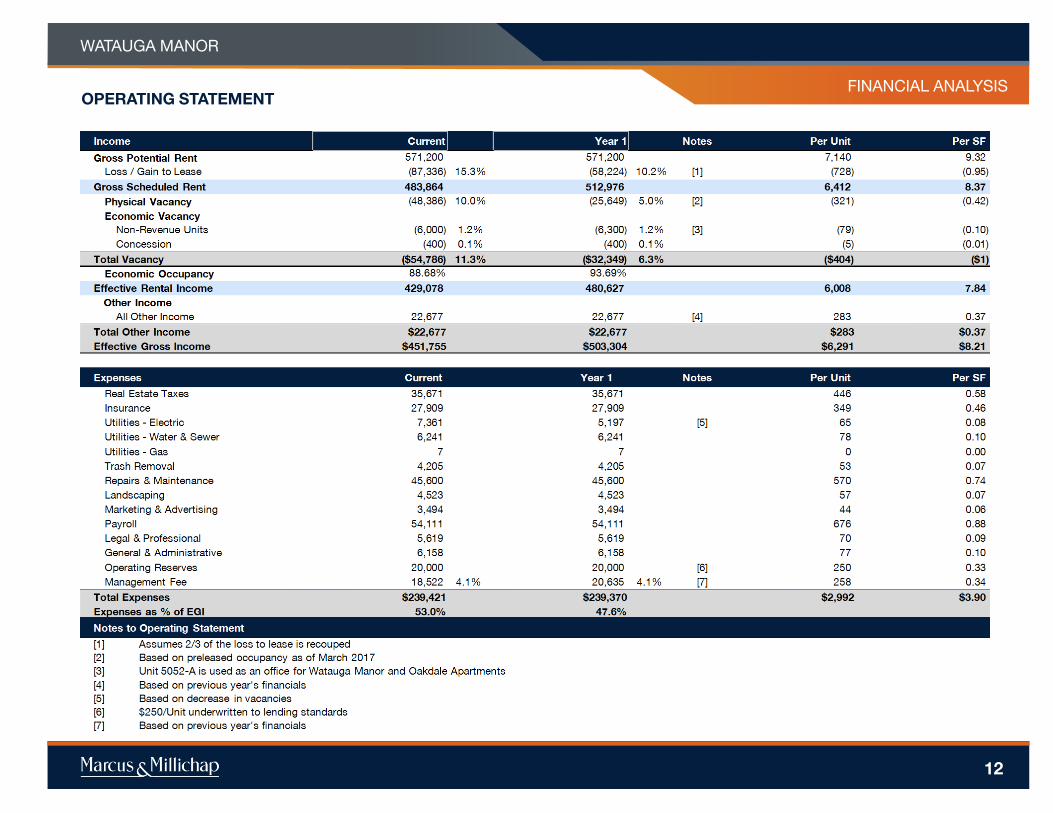
OPERATING STATEMENT
12
FINANCIAL ANALYSIS
WATAUGA MANOR
PRICING DETAIL
13

MARCUS & MILLICHAP CAPITAL CORPORATION
CAPABILITIES
MMCC—our fully integrated, dedicated financing arm—is committed to
providing superior capital market expertise, precisely managed execution, and
unparalleled access to capital sources providing the most competitive rates and
terms.
We leverage our prominent capital market relationships with commercial banks,
life insurance companies, CMBS, private and public debt/equity funds, Fannie
Mae, Freddie Mac and HUD to provide our clients with the greatest range of
financing options.
Our dedicated, knowledgeable experts understand the challenges of financing
and work tirelessly to resolve all potential issues to the benefit of our clients.
National platform
operating
within the firm’s
brokerage
offices
$4.9 billion
total national
volume in 2015
Access to
more capital
sources than
any other firm
in the industry
Optimum financing solutions
to enhance value
Our ability to enhance
buyer pool by expanding
finance options
Our ability to enhance
seller control
• Through buyer
qualification support
• Our ability to manage buyers
finance expectations
• Ability to monitor and
manage buyer/lender
progress, insuring timely,
predictable closings
• By relying on a world class
set of debt/equity sources
and presenting a tightly
underwritten credit file
WHY MMCC?
Closed 1,601
debt and equity
financings
in 2015
ACQUISITION FINANCING
WATAUGA MANOR
14

WATAUGA MANOR
15
MARKET
COMPARABLES

8
WATAUGA MANOR
SALES COMPARABLES MAP
16
1
2
3
WATAUGA MANOR
(SUBJECT)
Woodstream
Angel's Court
Kensington Court
Apartments
SALES COMPARABLES

17
PROPERTY NAMEWATAUGA MANOR
COMPARABLESSALES COMPARABLES SALES COMPS AVG
Avg. 8.67%
0
1
2
3
4
6
7
8
9
10
11
Watauga
Manor
Woodstream Angel's
Court
Kensington
Court
Apartments
Average Cap Rate

18
PROPERTY NAMEWATAUGA MANOR
COMPARABLESSALES COMPARABLES SALES COMPS AVG
Avg. $32
$0
$5
$9
$14
$18
$23
$28
$32
$37
$41
$46
Watauga
Manor
Woodstream Angel's
Court
Kensington
Court
Apartments
Average Price Per Square Foot
Avg. $31,550
$0
$4,000
$8,000
$12,000
$16,000
$20,000
$24,000
$28,000
$32,000
$36,000
$40,000
Watauga
Manor
Woodstream Angel's
Court
Kensington
Court
Apartments
Average Price Per Unit

PROPERTY NAME
MARKETING TEAM
WATAUGA MANOR
COMPARABLES
rentpropertyname1
rentpropertyaddress1
rentpropertyname1
rentpropertyaddress1
rentpropertyname1
rentpropertyaddress1
19
SALES COMPARABLES
rentpropertyaddress1
673 VISTA ISLE DRIVE
673 VISTA ISLE DRIVE, SUNRISE, FL, 33325
WATAUGA MANOR
5000 WATAUGA RD, FAYETTEVILLE, NC, 28304
Units Unit Type
Offering Price: $2,720,000 24 1 Bdr
Price/Unit: $34,000 56 2 Bdr
Price/SF: $44.36
CAP Rate: 7.81%
GRM: 5.62
Total No. of Units: 80
Year Built: 1983
Underwriting Criteria
Income $451,755 Expenses $239,421
NOI $212,334 Vacancy ($54,786)
425 WOODSTREAM TRAIL, FAYETTEVILLE, NC, 28314
WOODSTREAM
1
Units Unit Type
Close Of Escrow: 4/1/2016 64 1 Bdr 1 Bath
Sales Price: $5,800,000 138 2 Bdr 2 Bath
Price/Unit: $28,713
Price/SF: $33.00
CAP Rate: 8.00%
Total No. of Units: 202
Year Built: 1974
Underwriting Criteria
NOI $464,000 Expenses $1,020,000
817 RIDGE RD, FAYETTEVILLE, NC, 28311
ANGEL'S COURT
Units Unit Type
Close Of Escrow: 3/1/2016 32 2 Bdr 0 Bath
Sales Price: $1,150,000
Price/Unit: $35,938
Price/SF: $31.00
CAP Rate: 10.0%
Total No. of Units: 32
Year Built: 1974
Underwriting Criteria
NOI $115,000
2

PROPERTY NAME
MARKETING TEAM
WATAUGA MANOR
COMPARABLES
rentpropertyname1
rentpropertyaddress1
rentpropertyname1
rentpropertyaddress1
rentpropertyname1
rentpropertyaddress1
20
SALES COMPARABLES
Units Unit Type
Close Of Escrow: 7/14/2016 30 2 Bdr 0 Bath
Sales Price: $900,000
Price/Unit: $30,000
Price/SF: $32.00
CAP Rate: 8.00%
Total No. of Units: 30
Year Built: 1968
Underwriting Criteria
NOI $70,800
KENSINGTON COURT APARTMENTS
3
6467 YADKIN RD, FAYETTEVILLE, NC, 28303
8
WATAUGA MANOR
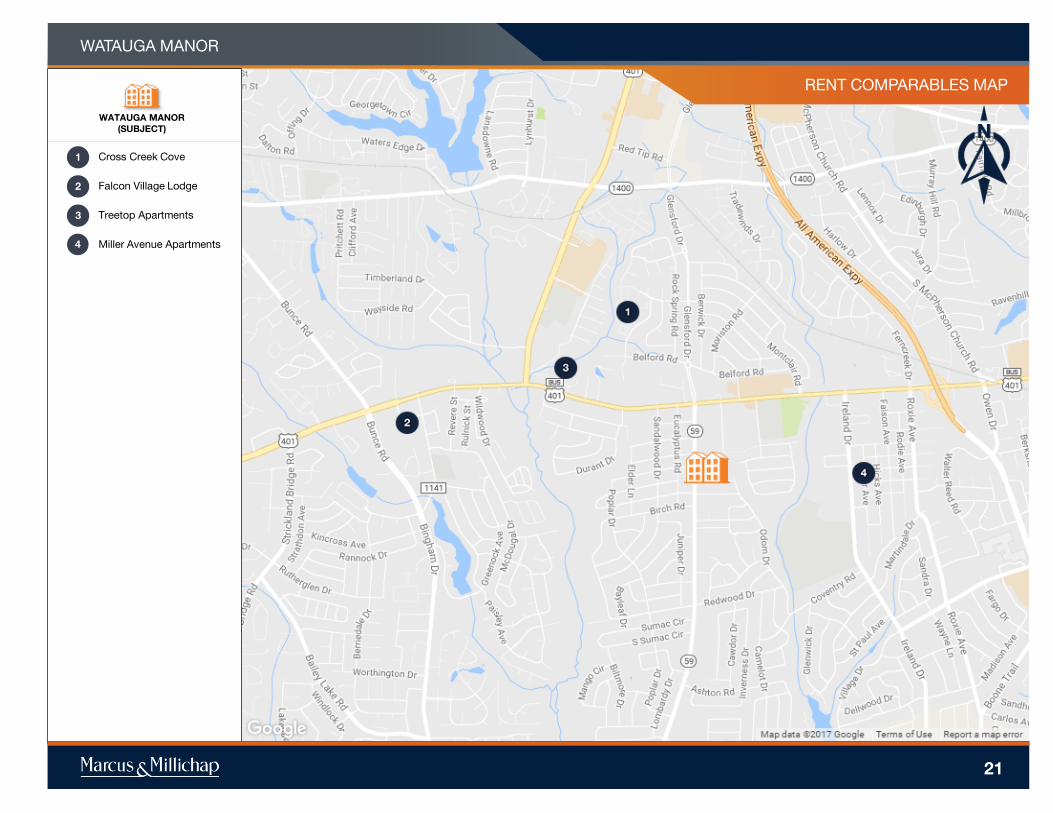
RENT COMPARABLES MAP
WATAUGA MANOR
(SUBJECT)
Cross Creek Cove
Falcon Village Lodge
Treetop Apartments
Miller Avenue Apartments4
7
8
9
11
20
12
14
15
16
17
13
18
10
4
1
2
3
21

PROPERTY NAMEWATAUGA MANOR
COMPARABLES
22
AVERAGE OCCUPANCY
Avg. 95.20%
0
10
20
30
40
50
60
70
80
90
100
Watauga
Manor
Cross
Creek Cove
Falcon
Village
Lodge
Treetop
Apartments
Miller
Avenue
Apartments
PROPERTY NAMEWATAUGA MANOR
COMPARABLES
23
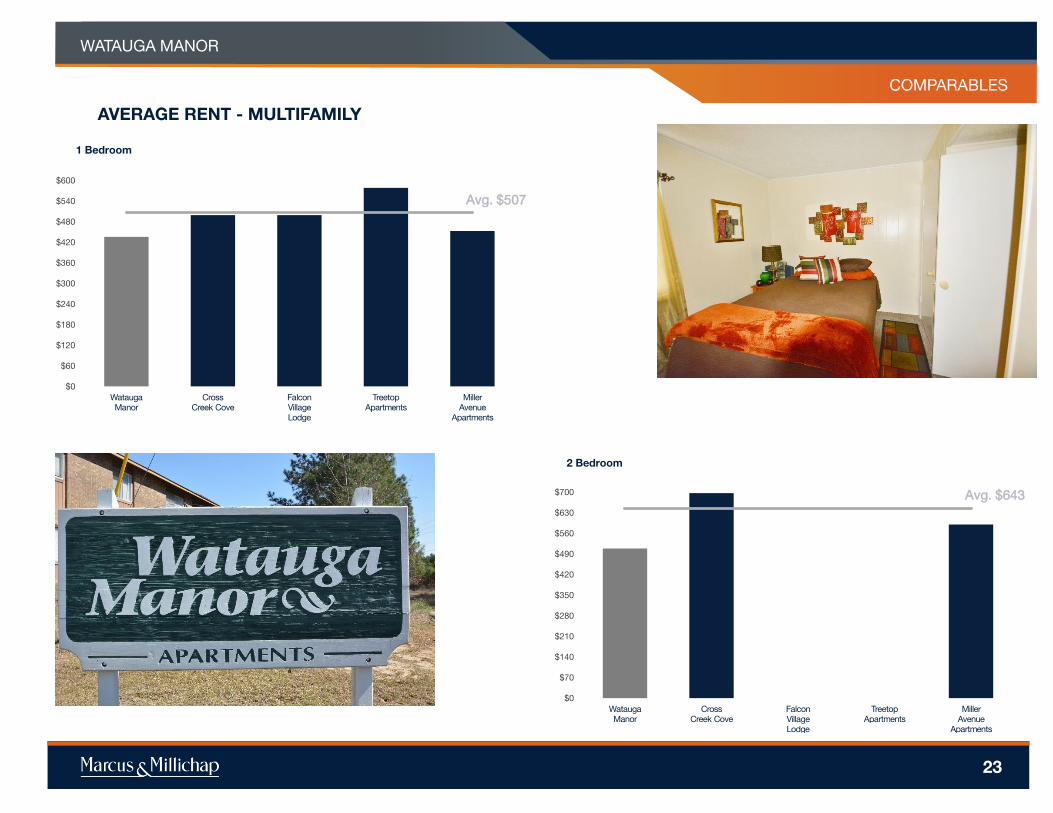
AVERAGE RENT - MULTIFAMILY
Avg. $507
$0
$60
$120
$180
$240
$300
$360
$420
$480
$540
$600
Watauga
Manor
Cross
Creek Cove
Falcon
Village
Lodge
Treetop
Apartments
Miller
Avenue
Apartments
1 Bedroom
Avg. $643
$0
$70
$140
$210
$280
$350
$420
$490
$560
$630
$700
Watauga
Manor
Cross
Creek Cove
Falcon
Village
Lodge
Treetop
Apartments
Miller
Avenue
Apartments
2 Bedroom

PROPERTY NAME
MARKETING TEAM
WATAUGA MANOR
RENT COMPARABLES
WATAUGA MANOR
5052 WATAUGA RD, FAYETTEVILLE, NC, 28304
WATAUGA MANOR
5052 WATAUGA RD, FAYETTEVILLE, NC, 28304
WATAUGA MANOR
5052 WATAUGA RD, FAYETTEVILLE, NC, 28304
24
YEAR BUILT: 1983
WATAUGA MANOR
5052 WATAUGA RD, FAYETTEVILLE, NC, 28304
Unit Type Units SF Rent Rent/SF
1 Bdr 24 604 $436.19 $0.72
2 Bdr 56 836 $508.42 $0.61
Total/Avg. 80 766
CROSS CREEK COVE855 KING ARTHUR DR, FAYETTEVILLE, NC, 28314
OCCUPANCY: 95% | YEAR BUILT: 1984
1
Unit Type Units SF Rent Rent/SF
1 Bdr 1 Bath 15 660-660 $499-$499 $0.76
2 Bdr 1 Bath 12 880-880 $645-$645 $0.74
2 Bdr 1.5 Bath 96 980-980 $660-$660 $0.68
2 Bdr 2 Bath 142 1,000-1,000 $725-$725 $0.73
Total/Avg. 265 968 $685 $0.71
FALCON VILLAGE LODGE6319 RAEFORD RD, FAYETTEVILLE, NC, 28304
2
Unit Type Units SF Rent Rent/SF
1 Bdr 1 Bath 108 700-700 $499-$499 $0.72
Total/Avg. 108 700 $499 $0.71
OCCUPANCY: 98% | YEAR BUILT: 1990
PROPERTY NAME
MARKETING TEAM
WATAUGA MANOR
RENT COMPARABLES
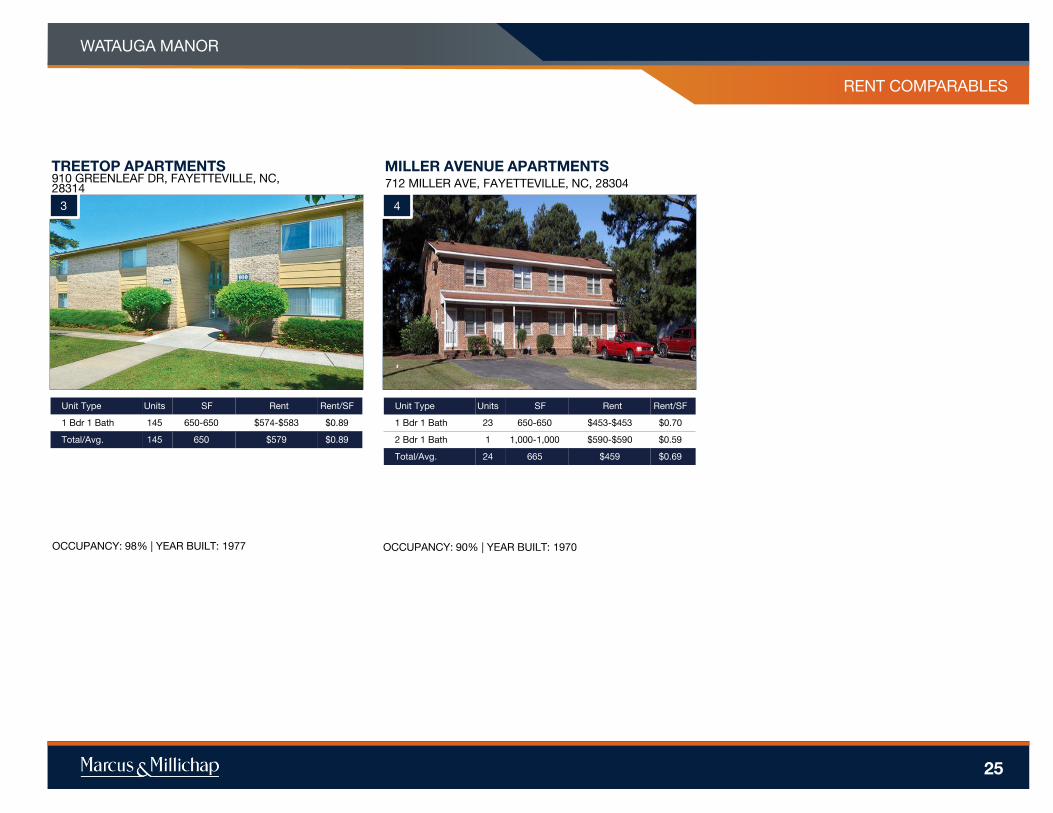
TREETOP APARTMENTS
910 GREENLEAF DR, FAYETTEVILLE, NC, 28314
TREETOP APARTMENTS
910 GREENLEAF DR, FAYETTEVILLE, NC, 28314
TREETOP APARTMENTS
910 GREENLEAF DR, FAYETTEVILLE, NC, 28314
25
TREETOP APARTMENTS910 GREENLEAF DR, FAYETTEVILLE, NC, 28314
OCCUPANCY: 98% | YEAR BUILT: 1977
3
Unit Type Units SF Rent Rent/SF
1 Bdr 1 Bath 145 650-650 $574-$583 $0.89
Total/Avg. 145 650 $579 $0.89
MILLER AVENUE APARTMENTS712 MILLER AVE, FAYETTEVILLE, NC, 28304
OCCUPANCY: 90% | YEAR BUILT: 1970
4
Unit Type Units SF Rent Rent/SF
1 Bdr 1 Bath 23 650-650 $453-$453 $0.70
2 Bdr 1 Bath 1 1,000-1,000 $590-$590 $0.59
Total/Avg. 24 665 $459 $0.69
WATAUGA MANOR
26
MARKET
OVERVIEW
PROPERTY NAME
MARKETING TEAM
WATAUGA MANOR
DEMOGRAPHICS
Source: © 2016 Experian
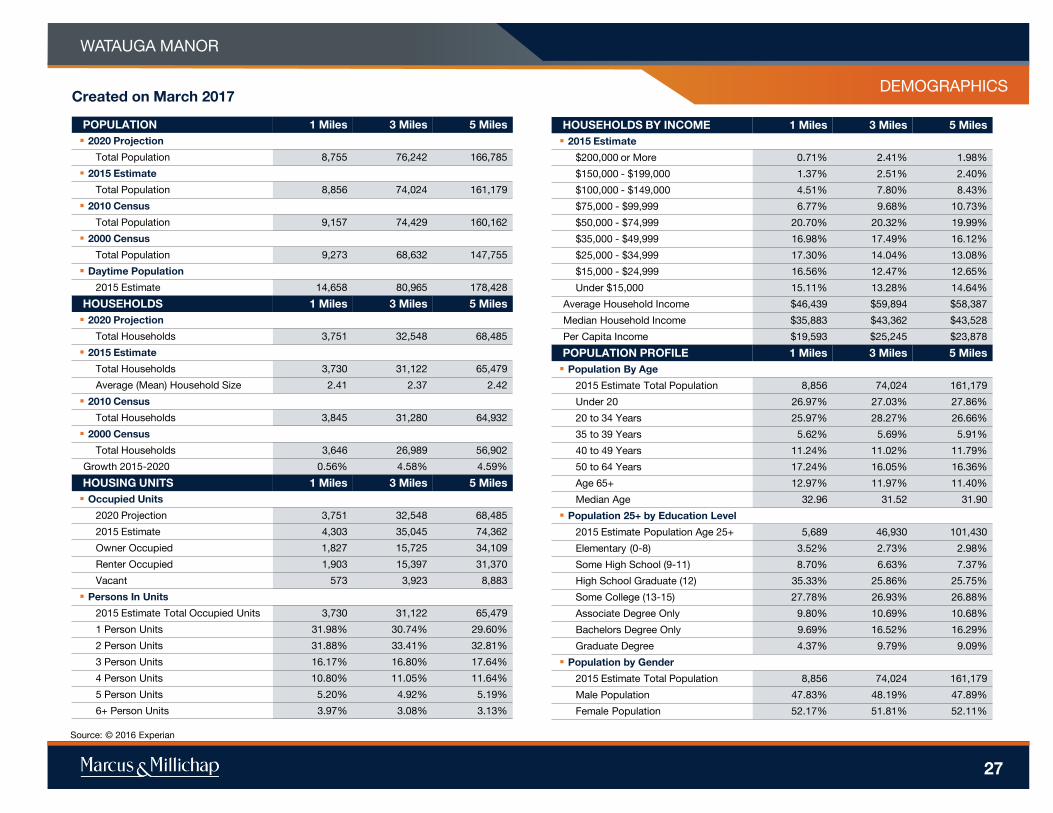
Created on March 2017
POPULATION 1 Miles 3 Miles 5 Miles
2020 Projection
Total Population 8,755 76,242 166,785
2015 Estimate
Total Population 8,856 74,024 161,179
2010 Census
Total Population 9,157 74,429 160,162
2000 Census
Total Population 9,273 68,632 147,755
Daytime Population
2015 Estimate 14,658 80,965 178,428
HOUSEHOLDS 1 Miles 3 Miles 5 Miles
2020 Projection
Total Households 3,751 32,548 68,485
2015 Estimate
Total Households 3,730 31,122 65,479
Average (Mean) Household Size 2.41 2.37 2.42
2010 Census
Total Households 3,845 31,280 64,932
2000 Census
Total Households 3,646 26,989 56,902
Growth 2015-2020 0.56% 4.58% 4.59%
HOUSING UNITS 1 Miles 3 Miles 5 Miles
Occupied Units
2020 Projection 3,751 32,548 68,485
2015 Estimate 4,303 35,045 74,362
Owner Occupied 1,827 15,725 34,109
Renter Occupied 1,903 15,397 31,370
Vacant 573 3,923 8,883
Persons In Units
2015 Estimate Total Occupied Units 3,730 31,122 65,479
1 Person Units 31.98% 30.74% 29.60%
2 Person Units 31.88% 33.41% 32.81%
3 Person Units 16.17% 16.80% 17.64%
4 Person Units 10.80% 11.05% 11.64%
5 Person Units 5.20% 4.92% 5.19%
6+ Person Units 3.97% 3.08% 3.13%
HOUSEHOLDS BY INCOME 1 Miles 3 Miles 5 Miles
2015 Estimate
$200,000 or More 0.71% 2.41% 1.98%
$150,000 - $199,000 1.37% 2.51% 2.40%
$100,000 - $149,000 4.51% 7.80% 8.43%
$75,000 - $99,999 6.77% 9.68% 10.73%
$50,000 - $74,999 20.70% 20.32% 19.99%
$35,000 - $49,999 16.98% 17.49% 16.12%
$25,000 - $34,999 17.30% 14.04% 13.08%
$15,000 - $24,999 16.56% 12.47% 12.65%
Under $15,000 15.11% 13.28% 14.64%
Average Household Income $46,439 $59,894 $58,387
Median Household Income $35,883 $43,362 $43,528
Per Capita Income $19,593 $25,245 $23,878
POPULATION PROFILE 1 Miles 3 Miles 5 Miles
Population By Age
2015 Estimate Total Population 8,856 74,024 161,179
Under 20 26.97% 27.03% 27.86%
20 to 34 Years 25.97% 28.27% 26.66%
35 to 39 Years 5.62% 5.69% 5.91%
40 to 49 Years 11.24% 11.02% 11.79%
50 to 64 Years 17.24% 16.05% 16.36%
Age 65+ 12.97% 11.97% 11.40%
Median Age 32.96 31.52 31.90
Population 25+ by Education Level
2015 Estimate Population Age 25+ 5,689 46,930 101,430
Elementary (0-8) 3.52% 2.73% 2.98%
Some High School (9-11) 8.70% 6.63% 7.37%
High School Graduate (12) 35.33% 25.86% 25.75%
Some College (13-15) 27.78% 26.93% 26.88%
Associate Degree Only 9.80% 10.69% 10.68%
Bachelors Degree Only 9.69% 16.52% 16.29%
Graduate Degree 4.37% 9.79% 9.09%
Population by Gender
2015 Estimate Total Population 8,856 74,024 161,179
Male Population 47.83% 48.19% 47.89%
Female Population 52.17% 51.81% 52.11%
27

Income
In 2016, the median household income for your selected geography is
$35,883, compare this to the US average which is currently $54,148.
The median household income for your area has changed by -0.50%
since 2000. It is estimated that the median household income in your
area will be $41,495 five years from now, which represents a change
of 15.64% from the current year.
The current year per capita income in your area is $19,593, compare
this to the US average, which is $29,638. The current year average
household income in your area is $46,439, compare this to the US
average which is $77,468.
Population
In 2016, the population in your selected geography is 8,856. The
population has changed by -4.50% since 2000. It is estimated that
the population in your area will be 8,755.00 five years from now,
which represents a change of -1.14% from the current year. The
current population is 47.83% male and 52.17% female. The median
age of the population in your area is 32.96, compare this to the US
average which is 37.55. The population density in your area is
2,818.04 people per square mile.
Households
There are currently 3,730 households in your selected geography. The
number of households has changed by 2.30% since 2000. It is
estimated that the number of households in your area will be 3,751
five years from now, which represents a change of 0.56% from the
current year. The average household size in your area is 2.41 persons.
Employment
In 2016, there are 3,432 employees in your selected area, this is also
known as the daytime population. The 2000 Census revealed that
50.72% of employees are employed in white-collar occupations in
this geography, and 48.84% are employed in blue-collar occupations.
In 2016, unemployment in this area is 5.85%. In 2000, the average
time traveled to work was 21.00 minutes.
Race and Ethnicity
The current year racial makeup of your selected area is as follows:
47.33% White, 36.36% Black, 0.40% Native American and 2.09%
Asian/Pacific Islander. Compare these to US averages which are:
70.98% White, 12.77% Black, 0.19% Native American and 5.25%
Asian/Pacific Islander. People of Hispanic origin are counted
independently of race.
People of Hispanic origin make up 14.38% of the current year
population in your selected area. Compare this to the US average of
17.53%.
PROPERTY NAME
MARKETING TEAM
WATAUGA MANOR
Housing
The median housing value in your area was $94,804 in 2016, compare
this to the US average of $185,104. In 2000, there were 2,181 owner
occupied housing units in your area and there were 1,465 renter
occupied housing units in your area. The median rent at the time was
$475.
Source: © 2016 Experian
DEMOGRAPHICS
28