wastewater cost of service charge study...wastewater cost of service charge study black & veatch...
TRANSCRIPT

WASTEWATER COST OF SERVICE CHARGE STUDY BLACK & VEATCH PROJECT NO. 192415.2000
PREPARED FOR
San Diego County Sanitation District County of San Diego │ Department of Public Works
NOVEMBER 23, 2016
©Black & Veatch Holding Company 2011. All rights reserved.

WASTEWATER COST OF SERVICE CHARGE STUDY | San Diego County Sanitation District
ii | FEBRUARY 22, 2017
Table of Contents 1 Executive Summary ................................................................................................................................... 1 1.1 Findings ............................................................................................................................................................................ 1 1.2 Recommendations ........................................................................................................................................................ 2 2 Introduction ................................................................................................................................................. 6 2.1 Background ..................................................................................................................................................................... 6 2.2 Scope of Work ................................................................................................................................................................ 6 2.3 Disclaimer ........................................................................................................................................................................ 7 3 Wastewater Rate Study ............................................................................................................................ 8 3.1 Revenue Requirements .............................................................................................................................................. 8 3.2 Customer Projections .................................................................................................................................................. 9
3.2.1 Customer Flows ........................................................................................................................................ 11 3.2.2 Customer Strengths ................................................................................................................................ 12
3.3 Revenue Under Existing Rates ............................................................................................................................. 14 3.4 Other Miscellaneous Revenue .............................................................................................................................. 16 3.5 Operation and Maintenance Projections ......................................................................................................... 17 3.6 Capital Improvement Program ............................................................................................................................ 17
3.6.1 Capital Fund Financing .......................................................................................................................... 18 3.6.2 Operating Results ..................................................................................................................................... 18
3.7 Financial Reserves ..................................................................................................................................................... 21 3.7.1 Benefits of Reserve Policies ................................................................................................................. 22 3.7.2 Operating Reserve ................................................................................................................................... 22 3.7.3 Capital Repair and Replacement Reserve ...................................................................................... 22
4 Cost of Service Allocation ....................................................................................................................... 24 4.1 Functional Components of Wastewater System ........................................................................................... 25 4.2 Allocation to Cost Components ............................................................................................................................ 25
4.2.1 Allocation of Operating and Maintenance Expense ................................................................... 26 4.2.2 Allocation of Capital Investments ..................................................................................................... 26
4.3 Units of Service ........................................................................................................................................................... 27 4.4 Cost of Service Allocations ..................................................................................................................................... 27
4.4.1 Customer Class Strength Factors....................................................................................................... 27 4.4.2 Distribution of Costs of Service to Customer Classes................................................................ 29
4.5 Adequacy of Existing Rates to Meet Costs of Service .................................................................................. 32 5 Proposed Rate Adjustments ................................................................................................................. 33 5.1 Existing Rates .............................................................................................................................................................. 33
5.1.1 Methodology used in the Determination of Charges ................................................................. 34 5.2 Proposed Rates ........................................................................................................................................................... 35

San Diego County Sanitation District | WASTEWATER COST OF SERVICE CHARGE STUDY
BLACK & VEATCH CORPORATION | Table of Contents iii
5.3 Revenue Recovery Under Proposed Rates ...................................................................................................... 36 6 Wastewater Service Charge Survey.................................................................................................... 38
WASTEWATER COST OF SERVICE CHARGE STUDY | San Diego County Sanitation District
iv | FEBRUARY 22, 2017
List of Tables Table 1-1 Recommended Sewer Charge Revenue Adjustments ............................... 3 Table 1-2 Proposed Wastewater Rates for FY 2018 & Current Rates .................... 4 Table 1-3 Summary of Recommended Reserve Targets .............................................. 4 Table 3-1 Projection of Ordinance EDUs .......................................................................... 10 Table 3-2 Projection of Flow EDUs ..................................................................................... 11 Table 3-3 Projection of Contributed Flow in Million Gallons ................................... 12 Table 3-4 Projection of Pollutant Loadings in Pounds ................................................ 13 Table 3-5 Existing Wastewater Rates for FY 2017 ....................................................... 15 Table 3-6 Summary of Service Charge Revenues (Existing Charges) ................... 16 Table 3-7 Summary of O&M Expenses ............................................................................... 17 Table 3-8 Summary of Capital Improvement Projects ................................................ 17 Table 3-9 Capital Fund Financing ........................................................................................ 18 Table 3-10 Recommended Rate Revenue Adjustments ............................................. 19 Table 3-11 Operating Cash Flow .......................................................................................... 20 Table 3-12 Summary of Recommended Reserve Targets.......................................... 23 Table 4-1 Wastewater Utility Cost of Service to be Recovered from Rates ........ 24 Table 4-2 Allocation of Operation and Maintenance Expense to Functional Cost Components
.................................................................................................................................... 26 Table 4-3 Allocation of Plant Investment to Functional Cost Components ........ 27 Table 4-4 Estimated Wastewater Utility Units of Service .......................................... 27 Table 4-5 Customer Class Strength Factors..................................................................... 28 Table 4-6 Distribution of Costs of Service to Customer Classes .............................. 30 Table 4-7 Comparison of Allocated Cost of Service with Revenues under Existing Rates
.................................................................................................................................... 32 Table 5-1 Existing Wastewater Service Charges ........................................................... 33 Table 5-2 Proposed Wastewater Service Charges for FY 2018 ............................... 35 Table 5-3 Proposed Wastewater Service Charges for FY 2019 through FY 202236 Table 5-4 Comparison of Allocated Cost of Service with Revenue under Proposed COS Sewer
Charges .................................................................................................................... 37
List of Figures Figure 1-1 Projected Operating Cash Flow (Status Quo) ............................................. 2 Figure 1-2 Projected Operating Cash Flow with Proposed Revenue Adjustments 3 Figure 3-1 Projected Operating Cash Flow (Status Quo) ........................................... 19 Figure 3-2 Projected Operating Cash Flow with Recommended Sewer Charge Adjustments
.................................................................................................................................... 21
San Diego County Sanitation District | WASTEWATER COST OF SERVICE CHARGE STUDY
BLACK & VEATCH CORPORATION | Table of Contents v
Figure 6-1 San Diego County Wastewater Rate Survey – Single Family Residential Customers (as of early 2016) ......................................................................... 39

WASTEWATER COST OF SERVICE CHARGE STUDY | San Diego County Sanitation District
vi | FEBRUARY 22, 2017
Glossary Annexation Fee – A one-time fee charged to new property being brought into the Sanitation District service area. Fee is established to help pay for past investment in District wastewater collection system where capacity is available and is applied on a per EDU basis. Fee would not be applied to new connections to the District wastewater system if connection resides on a parcel already established within District service area.
Base Costs – Costs that tend to vary with the total quantity of wastewater flow and sewer system operations under normal load conditions.
BOD - Biological Oxygen Demand – A rate at which organisms use oxygen in water and wastewater.
Capacity – A wastewater utility’s ability to have a certain quantity or level of resources available to meet the wastewater service needs of its customers.
Capacity Charge – Related to setting annual customer sewer service charges, the capacity charge is the charge for District costs related to wastewater collection (conveyance from customer connection to treatment plant. This charge is uniform for all customer classes and does not incorporate unique flow and strength factors associated with each customer class.
Capacity Fee - A one-time fee charged to new wastewater connections to the Sanitation District, or to existing connections with a change in use requiring additional flow capacity to the District wastewater system. Fee is established to help pay for past investment in wastewater treatment facilities where capacity is available and is applied on a per EDU basis. Capacity fees would be applied to all new connections to the District whether inside or outside the District service area.
COS (Cost of Service) – The process of determining the cost of providing wastewater service to each of the defined customer classifications. This includes the functionalization and allocation of wastewater system revenue requirements followed by the distribution of costs by customer classification based on the annual flow, demands and customer-related costs for which each class of service is responsible.
Effluent - "Cleaned" or “treated” wastewater which flows out of a treatment plant.
EDU (Equivalent Dwelling Unit) – A unit of measure that standardizes all land use categories (housing, retail, office, food service, etc.) to the level of demand created by one single-family dwelling unit. EDUs are commonly utilized by utilities to calculate service charges for users connected to a utility system. EDUs are computed in accordance with the probable demand that a user places on the utility system by assignment of an equivalency factor. For example, the probable flow rate demand that a customer places on a wastewater treatment system is correlated to the demand expected by a single-family dwelling by the use of equivalency factors.
Flow EDU – A Flow EDU is derived from actual meter and/or water use data.
Functional Cost Component - Costs related to a particular operational function of a utility for which annual operations and maintenance expenses and utility plant investment records are

San Diego County Sanitation District | WASTEWATER COST OF SERVICE CHARGE STUDY
BLACK & VEATCH CORPORATION | Table of Contents vii
maintained. Functional cost components include those activities related to treatment, disposal, collection, customer accounts and services, billing, and general and administrative activities.
I/I (Infiltration and Inflow) - Infiltration is water (typically groundwater) entering the sewer underground through cracks or openings in joints. Inflow is water (typically storm water or surface runoff) that enters the sewer from grates or unsealed manholes exposed to the surface.
LAFCO - Established by State Law in 1963, the San Diego Local Agency Formation Commission (LAFCO) is a regulatory agency with quasi-legislative authority. While having county-wide jurisdiction, LAFCO is independent of county government. LAFCOs were designed to provide assistance to local agencies in overseeing jurisdictional boundary changes. LAFCOs are governed by the Cortese/Knox/Hertzberg Local Government Reorganization Act of 2000 (Government Code Section 56000, et seq.). LAFCO is responsible for coordinating, directing, and overseeing logical and timely changes to local governmental boundaries, including annexation and detachment of territory, incorporation of cities, formation of special districts, and consolidation, merger, and dissolution of districts. In addition, LAFCO is charged with reviewing ways to reorganize, simplify, and streamline governmental structure. A primary objective of LAFCO is to initiate studies and furnish information that contributes to the logical and reasonable development of public agencies. In 1994, LAFCOs were given the authority to initiate proposals involving district consolidation, dissolution, subsidiary district establishment, merger, and reorganization (combinations of the above jurisdictional changes).
MGD – Represents 1 million gallons per day.
Ordinance EDU - Ordinance based EDUs are assigned by the County at the time of sewer connection and are based on the type of sewer use and/or the square footage of the building.
Revenue Requirements – The total annual operation and maintenance expense and capital-related costs incurred in meeting various aspects of providing wastewater utility service.
Test Year – The annualized period for which costs are to be analyzed and rates established.
Treatment Charge – Related to setting annual customer sewer service charges, the treatment charge is designed for the costs associated with treatment and disposal of wastewater. This charge varies between each customer class flow and strength factors.
TSS (Total Suspended Solids) - Solids in water that can be trapped by a filter. TSS can include a wide variety of material, such as silt, decaying plant and animal matter, industrial wastes, and sewage.
USO (Uniform Sewer Ordinance) – A County of San Diego governing document that provides for maximum public benefit by regulating sewer use and wastewater discharges, provides for equitable distribution of costs, and contains procedures to comply with requirements of other regulatory agencies throughout unincorporated San Diego County.
Units of Services – An element of service for which a cost can be ascertained, such as thousand gallons, hundred cubic feet, million gallons per day, and number of billing units.


San Diego County Sanitation District | WASTEWATER COST OF SERVICE CHARGE STUDY
BLACK & VEATCH CORPORATION | Executive Summary 1
1 Executive Summary This report was prepared for the County of San Diego Department of Public Works (County)
to document the development of a wastewater multi-year financial plan, cost of service analysis, and rate design for the San Diego County Sanitation District (District). The specific goals of the study were to:
Review and evaluate existing policies and procedures affecting wastewater service charges;
Evaluate the adequacy of projected revenues under existing sewer service charges to meet projected revenue requirements;
Develop a wastewater cost of service and rate model for the District covering a five-year study (Fiscal Year 2017-18 through Fiscal Year 2021-22) period for both ongoing operations and planned capital improvements;
Allocate projected Fiscal Year (FY) 2017-18 (FY 2018) revenue requirements to the various customer classes in accordance with the respective service requirements;
Develop suitable five-year sewer service charge schedules that produce revenues adequate to meet financial needs of the District while recognizing customer costs of service and local and state legal and policy considerations such as California Constitution Articles XIII C and D (Proposition 218), and Proposition 26; and
Recommend appropriate reserve levels for operations and capital needs.
1.1 FINDINGS The following lists the findings of this analysis:
1. Wastewater service charge revenues at current levels will not be sufficient over the next five years to meet the increasing cost of District operating and capital expenses without negatively affecting fund balance levels1. In the absence of charge adjustments (the status quo scenario), projections show that the District would deplete the Net Fund Balance during FY 2021. Figure 1-1 on the next page illustrates the projected financial picture without recommended sewer service charge adjustments and shows that the District Fund Balance falls below recommended operating target levels by FY 2019 and falls into a negative cash position by FY 2021.
1 Strictly speaking, the term “fund balance” refers to the remaining amounts available after short-term liabilities (monies owed) are paid off with the agency’s available cash and other financial resources (such as receivables). The fund balance includes reserved and unreserved components. For the purposes of this Study, this term refers to “available cash excluding reserved monies” and the term “fund” refers to either the Operating or Capital account in which these monies reside.

WASTEWATER COST OF SERVICE CHARGE STUDY | San Diego County Sanitation District
2 | FEBRUARY 22, 2017
Figure 1-1 Projected Operating Cash Flow (Status Quo)
2. The County’s Policy I-99 document lacks a defined capital reserve policy target.
3. Articles 5.2 through 5.4 of the County’s Uniform Sewer Ordinance presents a sewer charge formula that in principle reflects proper elements of a cost of service-based rate structure, however is difficult to utilize when calculating annual customer sewer service charges.
4. The District does not have a mechanism to pass through wholesale treatment costs to customers should those costs rise beyond projections in the cost of service model or beyond future year projections.
1.2 RECOMMENDATIONS The following lists Black & Veatch’s recommendations to address the findings listed above:
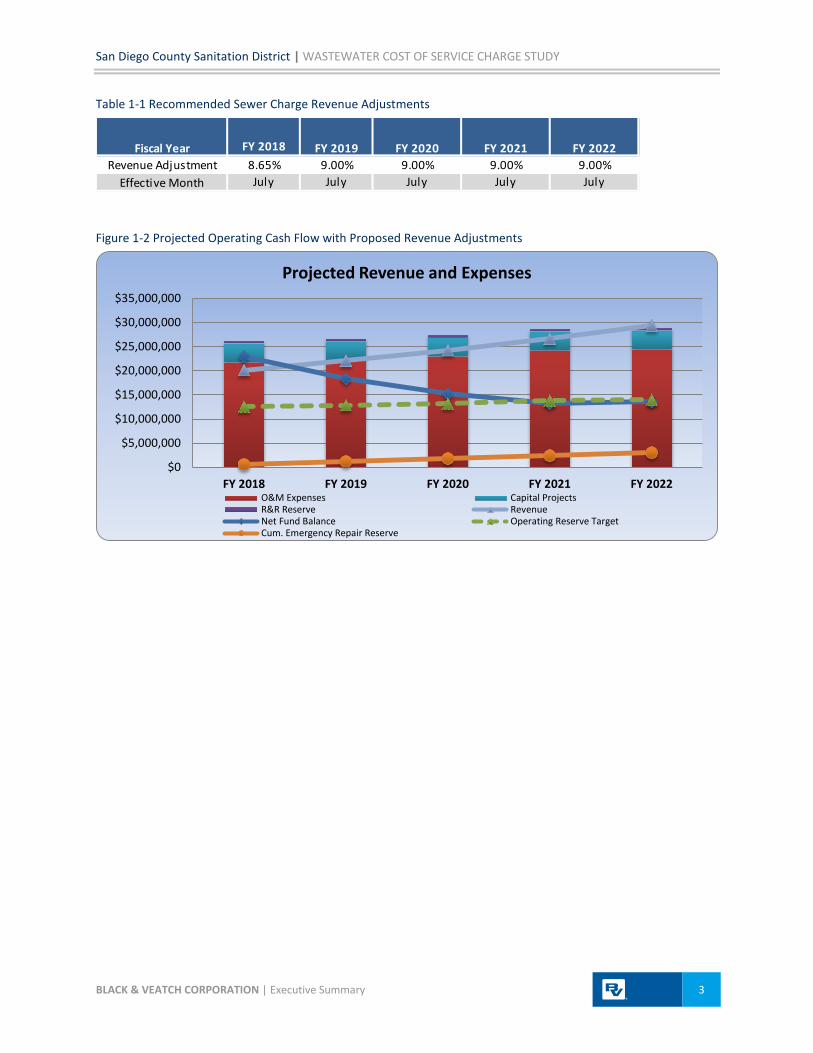
1. Per the cost-of-service analysis contained within this report, Black & Veatch recommends District wastewater service charges be adjusted to reflect current costs of providing sewer service to customers within the District. This recommendation includes adjusting total revenue from rates by 8.65 percent in FY 2018 and 9.0 percent beginning in FY 2019 and ending in FY 2022 as shown in Table 1-1 on the next page. Based on the cost of service analysis, revenue adjustments per customer class will vary, however, in total, the District requires 8.65 to 9.0 percent more revenue from customer rates each year. Should the County approve these rate adjustments, the projected financial picture of the District should stabilize by FY 2021 as demonstrated in Figure 1-2. Based on the cost-of-service analysis and these revenue adjustments, Table 1-2 shows the proposed sewer charges for FY 2018 and compares them to existing charges. The proposed customer sewer charges for FY 2019 through FY 2022 are shown later in this report.
-$20,000,000
-$10,000,000
$0
$10,000,000
$20,000,000
$30,000,000
$40,000,000
FY 2018 FY 2019 FY 2020 FY 2021 FY 2022
Projected Revenue and Expenses
O&M Expenses Capital ProjectsR&R Reserve RevenueNet Fund Balance Operating Reserve TargetCum. Emergency Repair Reserve
San Diego County Sanitation District | WASTEWATER COST OF SERVICE CHARGE STUDY
BLACK & VEATCH CORPORATION | Executive Summary 3
Table 1-1 Recommended Sewer Charge Revenue Adjustments
Figure 1-2 Projected Operating Cash Flow with Proposed Revenue Adjustments
FY 2018Revenue Adjustment 8.65% 9.00% 9.00% 9.00% 9.00%
Effective Month July July July July July
FY 2021 FY 2022Fiscal Year FY 2019 FY 2020
$0
$5,000,000
$10,000,000
$15,000,000
$20,000,000
$25,000,000
$30,000,000
$35,000,000
FY 2018 FY 2019 FY 2020 FY 2021 FY 2022
Projected Revenue and Expenses
O&M Expenses Capital ProjectsR&R Reserve RevenueNet Fund Balance Operating Reserve TargetCum. Emergency Repair Reserve

WASTEWATER COST OF SERVICE CHARGE STUDY | San Diego County Sanitation District
4 | FEBRUARY 22, 2017
Table 1-2 Proposed Wastewater Rates for FY 2018 & Current Rates
2. Black & Veatch recommends that the County modify Background, Section 3 of the County’s I-99
Policy document “Expenditure and Use of Revenue for Replacement and Improvement of Sanitation District Facilities” to include definitive language for recommended reserve target policies. These policies and resulting fund balance names are listed in Table 1-3.
Table 1-3 Summary of Recommended Reserve Targets
RESERVE DESCRIPTION
Operating Reserves
The operating reserve provides working capital for day-to-day operations and helps absorb fluctuations in cash balances due to routine difference in revenue and expense cycles. The reserve is set at 50% of the District’s annual operating budget.
Capital Repair and Replacement Reserves
The repair and replacement reserve provides funding for replacement, repair, or rehabilitation of wastewater infrastructure due to routine capital project planning or in the event of catastrophic failure of a major
Capacity Treatment Proposed CurrentCustomer Class Charge Charge FY 18 Charge Charge
($/EDU/year) ($/EDU/year) ($/EDU/year) ($/EDU/year)Customer ClassSingle-family Residential $182.18 $184.03 $366.22 $336.00Multi-family Residential $182.18 $184.03 $366.22 $336.00Car Wash $182.18 $128.12 $310.30 $287.14Barber & Beauty Salons $182.18 $176.91 $359.10 $337.13Department Stores, Retail Stores, General Commercial $182.18 $154.07 $336.25 $314.12Warehouse $182.18 $154.07 $336.25 $314.12Hospitals & Convalescent Homes $182.18 $162.62 $344.80 $323.37Laundromats $182.18 $144.94 $327.12 $304.92Nurseries $182.18 $230.47 $412.65 $375.16Hotels/Motels w/o Dining $182.18 $179.16 $361.34 $340.43Auto Repair/Sales Shops & Service Stations $182.18 $189.75 $371.93 $350.25Shopping Centers $182.18 $204.50 $386.68 $365.73Bar w/o Dining $182.18 $211.44 $393.62 $372.86Commercial Laundry $182.18 $234.50 $416.68 $397.09Movie Theater $182.18 $204.64 $386.83 $365.96Lumber Yards $182.18 $268.00 $450.18 $430.42Convenience & Liquor Stores w/Deli $182.18 $258.20 $440.39 $421.27Industrial Laundry $182.18 $413.88 $596.06 $543.97Hotel w/ Restaurant $182.18 $326.67 $508.85 $490.28Auto Steam Cleaning $182.18 $389.66 $571.84 $521.67Bakery or Bakery/Deli $182.18 $426.56 $608.74 $594.06Restaurant & Bar w/Food $182.18 $426.56 $608.74 $594.06Food Stores $182.18 $432.29 $614.47 $598.56Mortuary $182.18 $432.29 $614.47 $598.56Churches $182.18 $138.66 $320.84 $298.47Schools $182.18 $138.66 $320.84 $298.47Membership Organizations $182.18 $138.66 $320.84 $298.47Restaurants w/ Waste Separation $182.18 $280.57 $462.75 $421.27Mobile Homes $182.18 $184.03 $366.22 $336.00
San Diego County Sanitation District | WASTEWATER COST OF SERVICE CHARGE STUDY
BLACK & VEATCH CORPORATION | 5
system asset. The maximum reserve target level is set at the next 3 years of budgeted cumulative capital project costs but should not exceed $9 million in any given year. The minimum floor is set at $3 million; a figure that represents a major system asset replacement cost.
3. Black & Veatch recommends that Articles 5.2 through 5.4 of the County’s Uniform Sewer Ordinance (USO) be updated to show the recommended wastewater rates per customer class in tabular format. The current formula in Article 5.2 includes the same principles and factors utilized in this cost of service analysis. All of the factors used in the formula, including EDUs per class, are utilized in the wastewater rate model and many of those factors are notated in this report. However, the formula currently listed in the USO is difficult to implement on an annual basis when calculating customer rates to place on the County tax roll. The inclusion of the tabular format of rates by customer class will allow County staff an efficient mechanism to apply rates each year.
4. Black & Veatch recommends that the County provide a provision in the wastewater sewer charge ordinance to give the District the ability to pass through wholesale treatment costs to customers should those costs rise beyond projections in the cost of service model or beyond what the County notices to customers at time of rate implementation. This action would obviate the need for the County to conduct another Proposition 218 mailed 45-day notice and public hearing requirement before the Board-approved rate adjustment period has expired. The authority to provide this provision is located in California Government Code Section 53756. Specifically, the Government Code reads as follows:
An agency providing water, wastewater, sewer, or refuse collection service may adopt a schedule of fees or charges authorizing automatic adjustments that pass through increases in wholesale charges for water, sewage treatment, or wastewater treatment or adjustments for inflation, if it complies with all of the following:
(a) It adopts the schedule of fees or charges for a property-related service for a period not to exceed five years pursuant to Section 53755.
(b) The schedule of fees or charges may include a schedule of adjustments, including a clearly defined formula for adjusting for inflation. Any inflation adjustment to a fee or charge for a property-related service shall not exceed the cost of providing that service.
(c) The schedule of fees or charges for an agency that purchases wholesale water, sewage treatment, or wastewater treatment from a public agency may provide for automatic adjustments that pass through the adopted increases or decreases in the wholesale charges for water, sewage treatment, or wastewater treatment established by the other agency.
WASTEWATER COST OF SERVICE CHARGE STUDY | San Diego County Sanitation District
6 | FEBRUARY 22, 2017
2 Introduction This study (Study) takes a long-range planning approach to establishing wastewater service
charges and fees. A detailed discussion of the long-range plan and recommended sewer charge and fee adjustments are included in the following sections of this report. The analyses contained herein include operation and maintenance (O&M) costs, City of San Diego Metropolitan Wastewater Department (Metro) treatment costs, local treatment costs, reserve levels, and identified and prioritized capital improvement projects (CIP). To that end, the study examines the revenues generated by the District and makes recommendations for revenue adjustments, as needed.
2.1 BACKGROUND The District provides wastewater service to approximately 35,000 customers within the
unincorporated area of San Diego County. It owns and operates approximately 432 miles of pipeline, 8,200 manholes, 10 lift stations/pressurized mains, and 3 wastewater treatment plants. The collection, treatment, and disposal of wastewater in an environmentally safe and efficient manner promote healthy communities and increase the quality of life for local residents.
Prior to FY 2011, the District consisted of nine (9) individual sanitation or maintenance districts. Each district was a separate entity with its own budget, sewerage infrastructure, operational permits, and environmental compliance criteria created to provide wastewater service. As of FY 2012, the County combined the individual districts into one, consolidated Sanitation District. The consolidated District now combines the budget, operational and infrastructure elements for ease and efficiency of administration. The former districts are now called “service areas” and the naming designation of each service area remains the same as in the past.
The District is responsible for collecting and conveying wastewater flows originating within the communities (service areas) of Alpine, East Otay Mesa, Lakeside, Spring Valley, and Winter Gardens to the City of San Diego’s Point Loma Treatment Plant for treatment and disposal. These service areas are dependent on the City of San Diego’s Metropolitan Wastewater System (Metro) for treatment of their wastewater effluent. Local, District-owned wastewater facilities handle the treatment and disposal of wastewater flows collected within the service areas of Campo, Julian and Pine Valley.
The County’s primary goals are operating the sewerage system safely and efficiently while meeting the needs of the District’s customers. To meet these goals, the District undertakes routine cleaning, inspections, and repairs and rehabilitates its facilities as needed. The wastewater system operates in an area subject to strict regulatory oversight by Federal and State agencies such as the U.S. Environmental Protection Agency (US EPA) and the California State Water Resources Control Board (SWRCB). The District must comply with a multitude of laws including, but not limited to, State Wastewater Discharge Requirements (WDRs). Complying with these regulations and resulting mandates contributes to a large share of the cost burden on the District system.
2.2 SCOPE OF WORK The County retained Black & Veatch in 2016 to update a wastewater cost of service study and
capacity fee analysis previously developed by Black & Veatch in 2014. Presented herein are the results of a study of the District’s projected revenues, revenue requirements, cost of service, and rates for service.
San Diego County Sanitation District | WASTEWATER COST OF SERVICE CHARGE STUDY
BLACK & VEATCH CORPORATION | Introduction 7
For purposes of this report, the study period is the fiscal years beginning July 1, 2016 and ending June 30, 2022. Unless otherwise noted, references in this report to a specific year are for the District’s year ending June 30. To avoid confusion between calendar and fiscal years, the term FY refers to the year beginning July 1 and ending June 30.
The long-term financial plan for the District uses study period revenue and expense projections based on a review of historical factors and the District’s operating and capital budgets and financial policies. The study of revenue requirements recognizes projected operation and maintenance expenses, establishment and maintenance of proposed reserve funds, and capital financing requirements. Capital financing requirements include capital improvement expenditures met from annual revenues and available reserve funds.
The District’s costs of service were allocated to customer classes utilizing a cost causative approach endorsed by the Water Environment Federation (WEF) rate setting manual Financing and Charges for Wastewater Systems (MOP 27). The allocation methodology produced cost of service allocations recognizing the projected customer service requirements for the District. The design of proposed rates is in accordance with allocated cost of service and local policy considerations, such as reserve funding levels. Additionally, this study evaluates the extent to which the existing rate structure recovers revenues from customer classes in accordance with cost of service allocations.
2.3 DISCLAIMER In conducting the Study, Black & Veatch reviewed the books, records, agreements, capital
improvement programs, customer sales and financial projections of the District, as we deemed necessary to express our opinion of the operating results and projections. While Black & Veatch considers such books, records, documents, and projections to be reliable, Black & Veatch has not verified the accuracy of these documents.
The projections set forth in this report are intended as “forward-looking statements”. In formulating these projections, Black & Veatch has made certain assumptions with respect to conditions, events, and circumstances that may occur in the future. The methodology utilized in performing the analyses follows generally accepted practices for such projections. Such assumptions and methodologies are reasonable and appropriate for the purpose for which they are used. While Black & Veatch believes the assumptions are reasonable and the projection methodology valid, actual results may differ materially from those projected, as influenced by the conditions, events, and circumstances that actually occur. Such factors that may affect the District’s ability to manage the system and meet regulatory or environmental requirements include the following: the County’s ability to execute the capital improvement program as scheduled and within budget; and adverse legislative, regulatory or legal decisions (including environmental laws and regulations).

WASTEWATER COST OF SERVICE CHARGE STUDY | San Diego County Sanitation District
8 | FEBRUARY 22, 2017
Revenues +
•Wastewater Charges
•Contract Sales•Miscellaneous
Charges• Interest
Income•Capacity Fees
Expenses =
•Operations & Maintenance•Capital
Expenditures•Debt Service (if
any)•Transfers
Financial Plan
•Revenue Adjustments
•Debt Service Coverage (if debt exists)•Cash Fund
Balance•Reserves
3 Wastewater Rate Study The rate study/cost of service process followed by Black & Veatch in this Study consists of three
parts, with each part answering a specific question:
Revenue Requirements – This section develops the District’s Financial Plan and answers the question “How much money is needed to operate the utility and fund capital improvements?”
Cost of Service – This section allocates the different costs for providing wastewater service to customers. The question addressed in this part of the process is “From whom should the money be collected?”
Rate Design – This last part of the process examines different possible user fee structures to answer the question “How should the District’s services be priced?”
The subsequent sections of this Study present the three parts of the cost of service analysis conducted by Black & Veatch for the District.
3.1 REVENUE REQUIREMENTS The District provides wastewater collection and treatment services to its residential and non-
residential customer classes. As noted in the figure below, to meet the costs associated with providing wastewater services to its customers, the District derives revenue from a variety of sources including but not limited to wastewater sales (user charges), contract sales, miscellaneous charges, interest income, and capacity and annexation fees (one-time fees collected at time of system connection to use capacity in the existing treatment and collection facilities). The level of future revenue generated in the study is projected through a combination of an analysis of future system growth in terms of number of equivalent dwelling units (EDU) and sewage volume. An EDU is defined as a unit of measure that is based on the flow of characteristics of an average single-family residence in terms of sewage quantity.
With revenue derived from the various sources, the District funds the cash requirements of operation and maintenance (O&M); reserve levels set forth in the County’s Reserve Policy, Number I-99; and recurring annual capital expenditures for replacements, system betterments, and extensions. O&M expenses are those expenditures necessary to maintain the system in good working order. Capital expenditures consist of recurring routine annual replacements as well as major capital projects for larger infrastructure. Currently, the District cash finances all capital expenditures, meaning that no expenses are financed with debt or grant monies. As noted in the Executive Summary, current and projected system revenues at current rate and fee levels are not sufficient to meet District expenses over the study period.

San Diego County Sanitation District | WASTEWATER COST OF SERVICE CHARGE STUDY
BLACK & VEATCH CORPORATION | Wastewater Rate Study 9
3.2 CUSTOMER PROJECTIONS In order to bill its customers, the District uses residential and non-residential EDUs. An EDU
represents a typical single family residential household that discharges roughly 240 gallons per day (gpd) of wastewater flow. All single-family residential accounts are assigned one EDU, while all multi-family residential accounts are assigned 80 percent of an EDU, or 0.8 EDU. Residential accounts are assigned baseline EDUs because the effluent flow and concentration qualities for residential classes are fairly homogenous from one dwelling unit to another. For non-residential customers, EDUs are calculated based on measured water consumption provided to the District by the respective water purveyor or estimated based on industry standard water usage factors. Non-residential customers have a wider variety of effluent flow and concentration qualities than do residential and therefore consist of a wider range of EDU assignments.
The District uses EDUs based on Ordinance and flow data. An Ordinance EDU is an assigned EDU based on the total capacity that a customer can contribute to the wastewater system based on characteristics of the customer class. For example, a new single family residential customer is assigned one Ordinance EDU based on the premise that it will discharge sewage flow on average about 240 gpd. Non-residential customers are initially assigned Ordinance EDUs based on calculated sewer flow using type of business, square footage and number of fixtures. A Flow EDU uses measured contributed wastewater volume generated from water consumption data. Flow EDUs are assigned to non-residential customers as water purveyors provide the District with water usage data for these customers on a yearly basis. Refer to the County’s USO Articles 5.3 and 5.4.
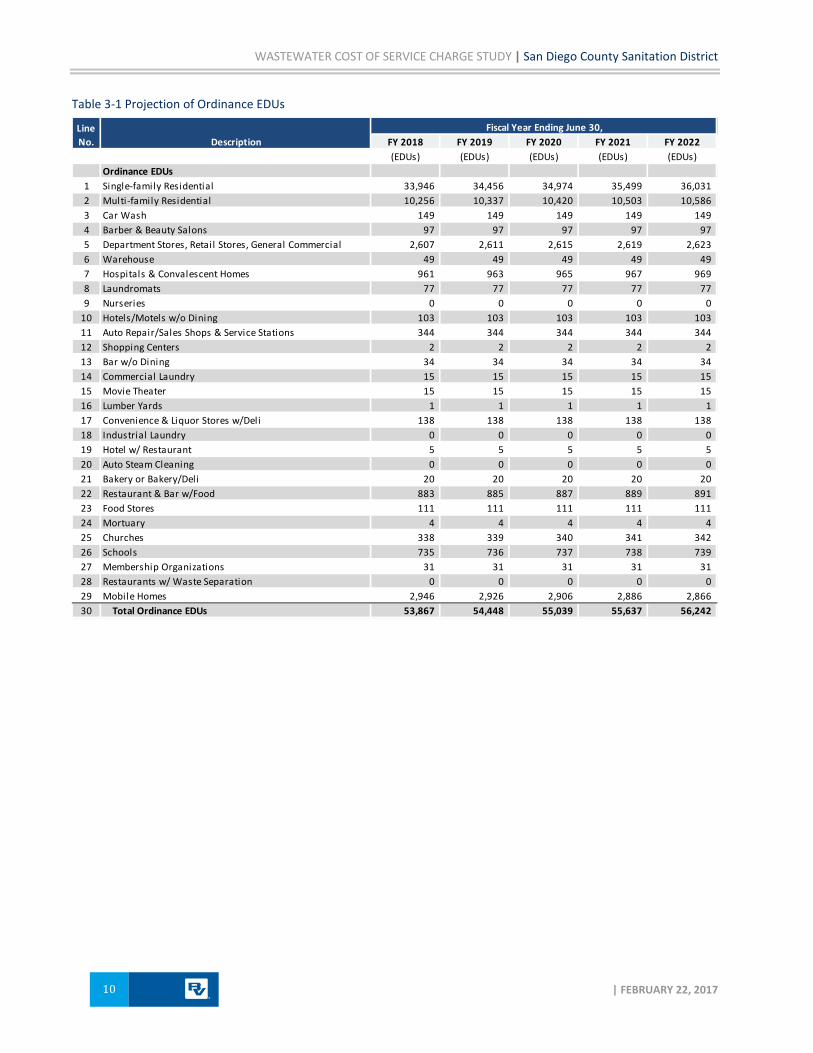
To forecast revenue, the number of Ordinance and Flow EDUs, as well as wastewater volume needs to be forecasted for the District’s service areas. Table 3-1 shows the projected Ordinance EDUs and Table 3-2 shows the projected Flow EDUs. Based on growth trends in San Diego County, as provided by SANDAG Series 13 Regional Growth Forecast, this analysis assumes that single-family customer connections will increase by 1.5 percent annually over the study period, while other customer classes will experience less than 1.0 percent annual growth during the same period.
Flow EDU: • Measured
contributed wastewater volume using water consumption data
Ordinance EDU: • Total capacity
contributed based on customer class characteristics
WASTEWATER COST OF SERVICE CHARGE STUDY | San Diego County Sanitation District
10 | FEBRUARY 22, 2017
Table 3-1 Projection of Ordinance EDUs
Fiscal Year Ending June 30,FY 2018 FY 2019 FY 2020 FY 2021 FY 2022(EDUs) (EDUs) (EDUs) (EDUs) (EDUs)
Ordinance EDUs1 Single-family Residential 33,946 34,456 34,974 35,499 36,031 2 Multi-family Residential 10,256 10,337 10,420 10,503 10,586 3 Car Wash 149 149 149 149 149 4 Barber & Beauty Salons 97 97 97 97 97 5 Department Stores, Retail Stores, General Commercial 2,607 2,611 2,615 2,619 2,623 6 Warehouse 49 49 49 49 49 7 Hospitals & Convalescent Homes 961 963 965 967 969 8 Laundromats 77 77 77 77 77 9 Nurseries 0 0 0 0 0
10 Hotels/Motels w/o Dining 103 103 103 103 103 11 Auto Repair/Sales Shops & Service Stations 344 344 344 344 344 12 Shopping Centers 2 2 2 2 2 13 Bar w/o Dining 34 34 34 34 34 14 Commercial Laundry 15 15 15 15 15 15 Movie Theater 15 15 15 15 15 16 Lumber Yards 1 1 1 1 1 17 Convenience & Liquor Stores w/Deli 138 138 138 138 138 18 Industrial Laundry 0 0 0 0 0 19 Hotel w/ Restaurant 5 5 5 5 5 20 Auto Steam Cleaning 0 0 0 0 0 21 Bakery or Bakery/Deli 20 20 20 20 20 22 Restaurant & Bar w/Food 883 885 887 889 891 23 Food Stores 111 111 111 111 111 24 Mortuary 4 4 4 4 4 25 Churches 338 339 340 341 342 26 Schools 735 736 737 738 739 27 Membership Organizations 31 31 31 31 31 28 Restaurants w/ Waste Separation 0 0 0 0 0 29 Mobile Homes 2,946 2,926 2,906 2,886 2,866 30 Total Ordinance EDUs 53,867 54,448 55,039 55,637 56,242
Line No. Description
San Diego County Sanitation District | WASTEWATER COST OF SERVICE CHARGE STUDY
BLACK & VEATCH CORPORATION | Wastewater Rate Study 11
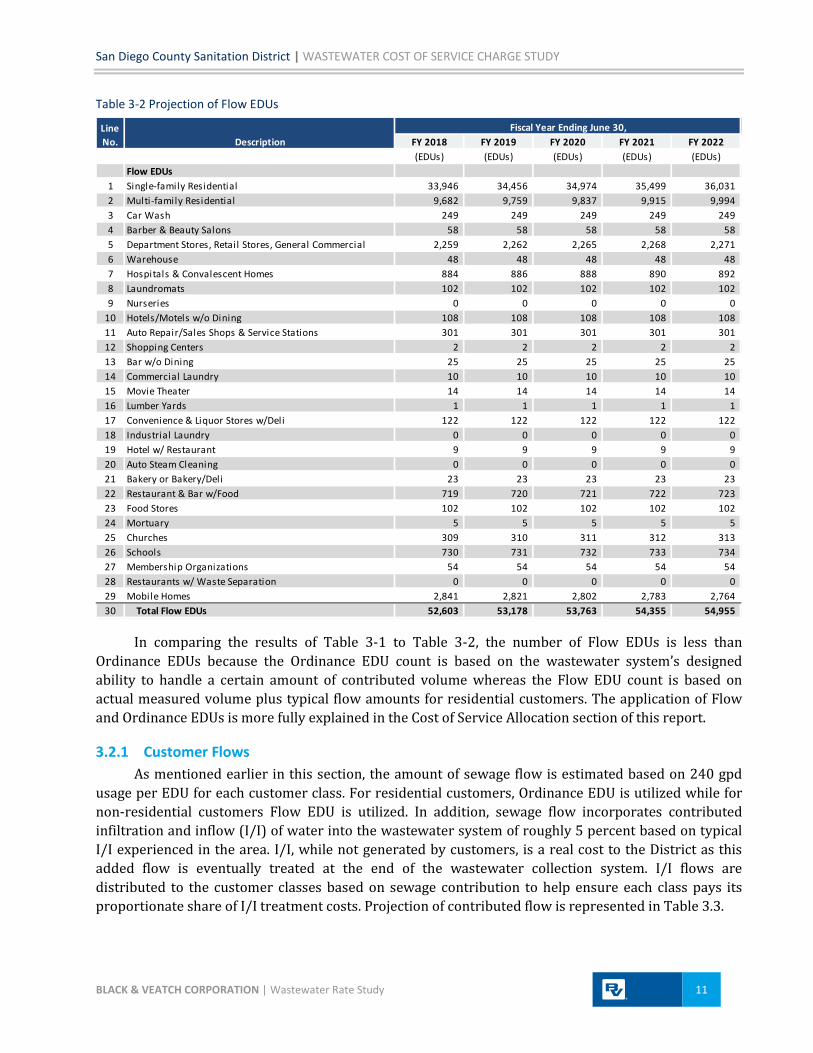
Table 3-2 Projection of Flow EDUs
In comparing the results of Table 3-1 to Table 3-2, the number of Flow EDUs is less than Ordinance EDUs because the Ordinance EDU count is based on the wastewater system’s designed ability to handle a certain amount of contributed volume whereas the Flow EDU count is based on actual measured volume plus typical flow amounts for residential customers. The application of Flow and Ordinance EDUs is more fully explained in the Cost of Service Allocation section of this report.
3.2.1 Customer Flows As mentioned earlier in this section, the amount of sewage flow is estimated based on 240 gpd
usage per EDU for each customer class. For residential customers, Ordinance EDU is utilized while for non-residential customers Flow EDU is utilized. In addition, sewage flow incorporates contributed infiltration and inflow (I/I) of water into the wastewater system of roughly 5 percent based on typical I/I experienced in the area. I/I, while not generated by customers, is a real cost to the District as this added flow is eventually treated at the end of the wastewater collection system. I/I flows are distributed to the customer classes based on sewage contribution to help ensure each class pays its proportionate share of I/I treatment costs. Projection of contributed flow is represented in Table 3.3.
Fiscal Year Ending June 30,FY 2018 FY 2019 FY 2020 FY 2021 FY 2022(EDUs) (EDUs) (EDUs) (EDUs) (EDUs)
Flow EDUs1 Single-family Residential 33,946 34,456 34,974 35,499 36,031 2 Multi-family Residential 9,682 9,759 9,837 9,915 9,994 3 Car Wash 249 249 249 249 249 4 Barber & Beauty Salons 58 58 58 58 58 5 Department Stores, Retail Stores, General Commercial 2,259 2,262 2,265 2,268 2,271 6 Warehouse 48 48 48 48 48 7 Hospitals & Convalescent Homes 884 886 888 890 892 8 Laundromats 102 102 102 102 102 9 Nurseries 0 0 0 0 0
10 Hotels/Motels w/o Dining 108 108 108 108 108 11 Auto Repair/Sales Shops & Service Stations 301 301 301 301 301 12 Shopping Centers 2 2 2 2 2 13 Bar w/o Dining 25 25 25 25 25 14 Commercial Laundry 10 10 10 10 10 15 Movie Theater 14 14 14 14 14 16 Lumber Yards 1 1 1 1 1 17 Convenience & Liquor Stores w/Deli 122 122 122 122 122 18 Industrial Laundry 0 0 0 0 0 19 Hotel w/ Restaurant 9 9 9 9 9 20 Auto Steam Cleaning 0 0 0 0 0 21 Bakery or Bakery/Deli 23 23 23 23 23 22 Restaurant & Bar w/Food 719 720 721 722 723 23 Food Stores 102 102 102 102 102 24 Mortuary 5 5 5 5 5 25 Churches 309 310 311 312 313 26 Schools 730 731 732 733 734 27 Membership Organizations 54 54 54 54 54 28 Restaurants w/ Waste Separation 0 0 0 0 0 29 Mobile Homes 2,841 2,821 2,802 2,783 2,764 30 Total Flow EDUs 52,603 53,178 53,763 54,355 54,955
Line No. Description
WASTEWATER COST OF SERVICE CHARGE STUDY | San Diego County Sanitation District
12 | FEBRUARY 22, 2017
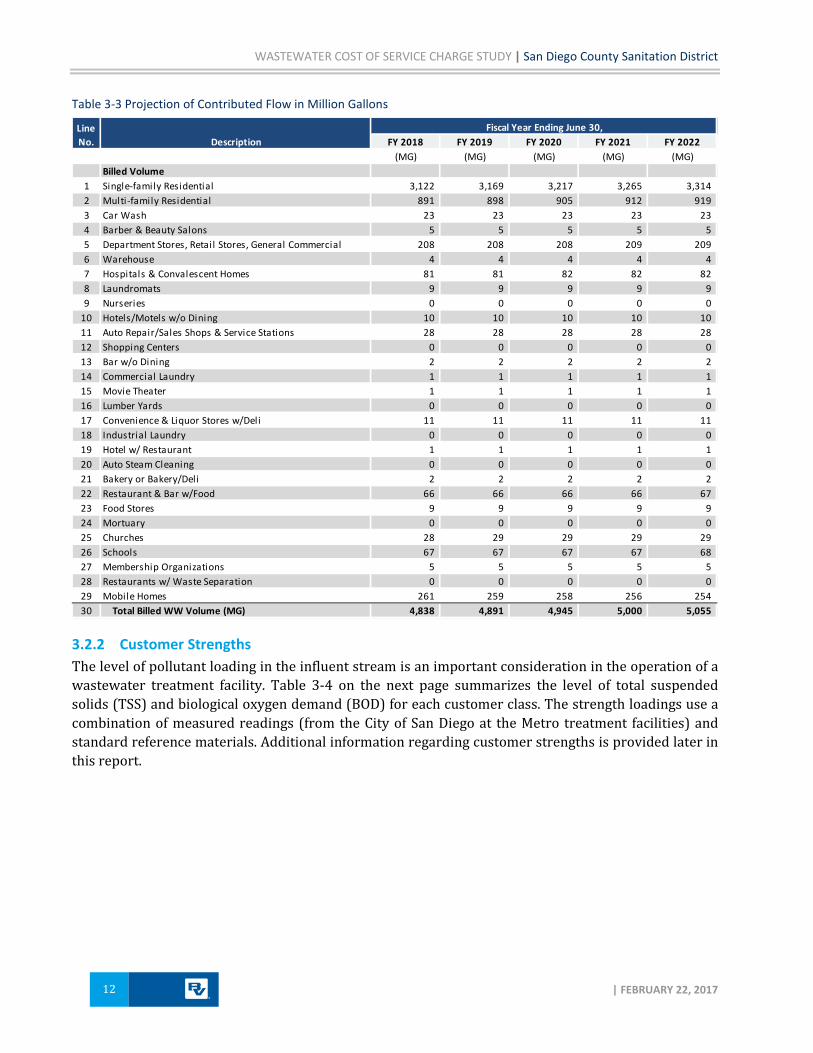
Table 3-3 Projection of Contributed Flow in Million Gallons
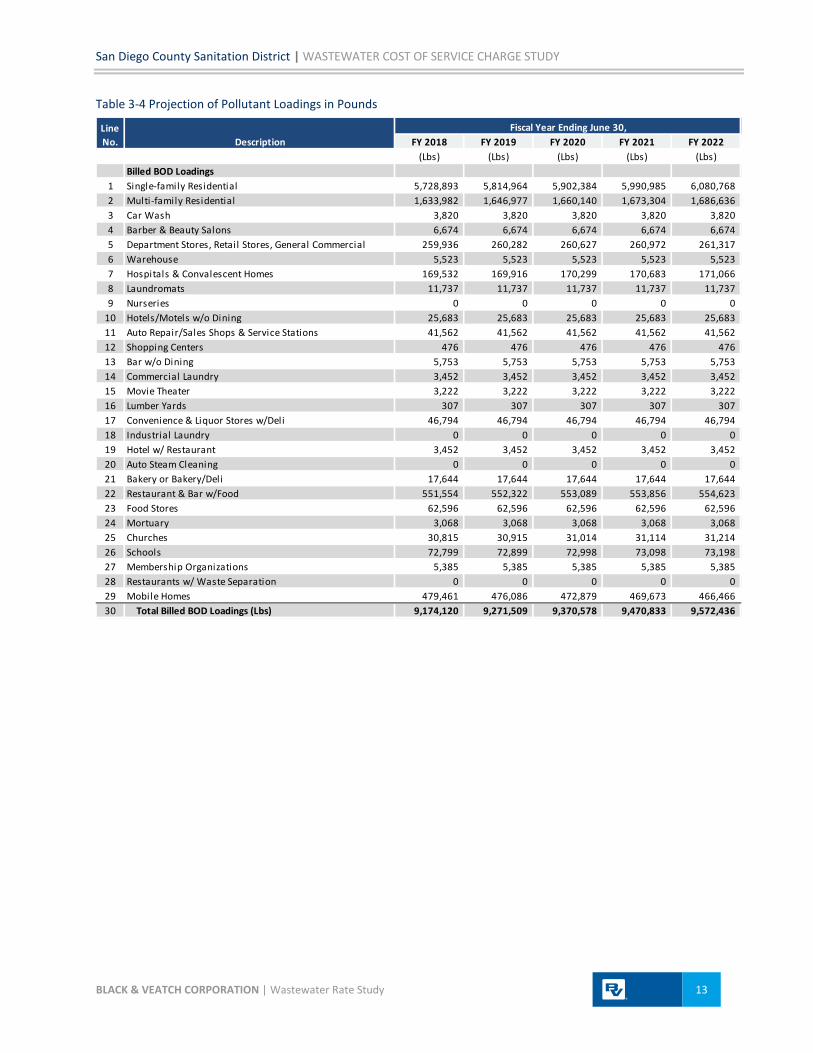
3.2.2 Customer Strengths The level of pollutant loading in the influent stream is an important consideration in the operation of a wastewater treatment facility. Table 3-4 on the next page summarizes the level of total suspended solids (TSS) and biological oxygen demand (BOD) for each customer class. The strength loadings use a combination of measured readings (from the City of San Diego at the Metro treatment facilities) and standard reference materials. Additional information regarding customer strengths is provided later in this report.
Fiscal Year Ending June 30,FY 2018 FY 2019 FY 2020 FY 2021 FY 2022
(MG) (MG) (MG) (MG) (MG)Billed Volume
1 Single-family Residential 3,122 3,169 3,217 3,265 3,314 2 Multi-family Residential 891 898 905 912 919 3 Car Wash 23 23 23 23 23 4 Barber & Beauty Salons 5 5 5 5 5 5 Department Stores, Retail Stores, General Commercial 208 208 208 209 209 6 Warehouse 4 4 4 4 4 7 Hospitals & Convalescent Homes 81 81 82 82 82 8 Laundromats 9 9 9 9 9 9 Nurseries 0 0 0 0 0
10 Hotels/Motels w/o Dining 10 10 10 10 10 11 Auto Repair/Sales Shops & Service Stations 28 28 28 28 28 12 Shopping Centers 0 0 0 0 0 13 Bar w/o Dining 2 2 2 2 2 14 Commercial Laundry 1 1 1 1 1 15 Movie Theater 1 1 1 1 1 16 Lumber Yards 0 0 0 0 0 17 Convenience & Liquor Stores w/Deli 11 11 11 11 11 18 Industrial Laundry 0 0 0 0 0 19 Hotel w/ Restaurant 1 1 1 1 1 20 Auto Steam Cleaning 0 0 0 0 0 21 Bakery or Bakery/Deli 2 2 2 2 2 22 Restaurant & Bar w/Food 66 66 66 66 67 23 Food Stores 9 9 9 9 9 24 Mortuary 0 0 0 0 0 25 Churches 28 29 29 29 29 26 Schools 67 67 67 67 68 27 Membership Organizations 5 5 5 5 5 28 Restaurants w/ Waste Separation 0 0 0 0 0 29 Mobile Homes 261 259 258 256 254 30 Total Billed WW Volume (MG) 4,838 4,891 4,945 5,000 5,055
Line No. Description
San Diego County Sanitation District | WASTEWATER COST OF SERVICE CHARGE STUDY
BLACK & VEATCH CORPORATION | Wastewater Rate Study 13
Table 3-4 Projection of Pollutant Loadings in Pounds
Fiscal Year Ending June 30,FY 2018 FY 2019 FY 2020 FY 2021 FY 2022
(Lbs) (Lbs) (Lbs) (Lbs) (Lbs)Billed BOD Loadings
1 Single-family Residential 5,728,893 5,814,964 5,902,384 5,990,985 6,080,768 2 Multi-family Residential 1,633,982 1,646,977 1,660,140 1,673,304 1,686,636 3 Car Wash 3,820 3,820 3,820 3,820 3,820 4 Barber & Beauty Salons 6,674 6,674 6,674 6,674 6,674 5 Department Stores, Retail Stores, General Commercial 259,936 260,282 260,627 260,972 261,317 6 Warehouse 5,523 5,523 5,523 5,523 5,523 7 Hospitals & Convalescent Homes 169,532 169,916 170,299 170,683 171,066 8 Laundromats 11,737 11,737 11,737 11,737 11,737 9 Nurseries 0 0 0 0 0
10 Hotels/Motels w/o Dining 25,683 25,683 25,683 25,683 25,683 11 Auto Repair/Sales Shops & Service Stations 41,562 41,562 41,562 41,562 41,562 12 Shopping Centers 476 476 476 476 476 13 Bar w/o Dining 5,753 5,753 5,753 5,753 5,753 14 Commercial Laundry 3,452 3,452 3,452 3,452 3,452 15 Movie Theater 3,222 3,222 3,222 3,222 3,222 16 Lumber Yards 307 307 307 307 307 17 Convenience & Liquor Stores w/Deli 46,794 46,794 46,794 46,794 46,794 18 Industrial Laundry 0 0 0 0 0 19 Hotel w/ Restaurant 3,452 3,452 3,452 3,452 3,452 20 Auto Steam Cleaning 0 0 0 0 0 21 Bakery or Bakery/Deli 17,644 17,644 17,644 17,644 17,644 22 Restaurant & Bar w/Food 551,554 552,322 553,089 553,856 554,623 23 Food Stores 62,596 62,596 62,596 62,596 62,596 24 Mortuary 3,068 3,068 3,068 3,068 3,068 25 Churches 30,815 30,915 31,014 31,114 31,214 26 Schools 72,799 72,899 72,998 73,098 73,198 27 Membership Organizations 5,385 5,385 5,385 5,385 5,385 28 Restaurants w/ Waste Separation 0 0 0 0 0 29 Mobile Homes 479,461 476,086 472,879 469,673 466,466 30 Total Billed BOD Loadings (Lbs) 9,174,120 9,271,509 9,370,578 9,470,833 9,572,436
Line No. Description
WASTEWATER COST OF SERVICE CHARGE STUDY | San Diego County Sanitation District
14 | FEBRUARY 22, 2017
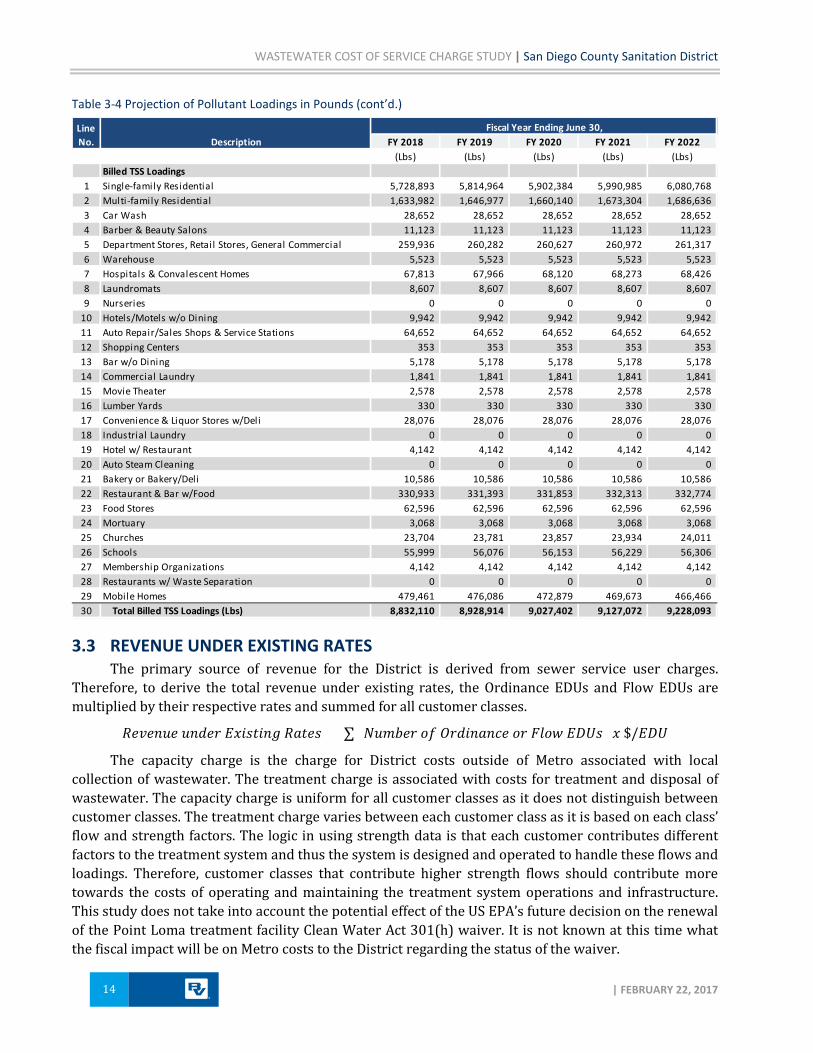
Table 3-4 Projection of Pollutant Loadings in Pounds (cont’d.)
3.3 REVENUE UNDER EXISTING RATES The primary source of revenue for the District is derived from sewer service user charges.
Therefore, to derive the total revenue under existing rates, the Ordinance EDUs and Flow EDUs are multiplied by their respective rates and summed for all customer classes.
𝑅𝑅𝑅𝑅𝑅𝑅𝑅 𝑅𝑅𝑢𝑅𝑢 𝐸𝐸𝑖𝑖𝑖𝑖𝑅𝑖 𝑅𝑅𝑖𝑅𝑖 = ∑ (𝑁𝑅𝑁𝑁𝑅𝑢 𝑜𝑜 𝑂𝑢𝑢𝑖𝑅𝑅𝑅𝑂𝑅 𝑜𝑢 𝐹𝐹𝑜𝐹 𝐸𝐸𝐸𝑖) 𝐸 $/𝐸𝐸𝐸
The capacity charge is the charge for District costs outside of Metro associated with local collection of wastewater. The treatment charge is associated with costs for treatment and disposal of wastewater. The capacity charge is uniform for all customer classes as it does not distinguish between customer classes. The treatment charge varies between each customer class as it is based on each class’ flow and strength factors. The logic in using strength data is that each customer contributes different factors to the treatment system and thus the system is designed and operated to handle these flows and loadings. Therefore, customer classes that contribute higher strength flows should contribute more towards the costs of operating and maintaining the treatment system operations and infrastructure. This study does not take into account the potential effect of the US EPA’s future decision on the renewal of the Point Loma treatment facility Clean Water Act 301(h) waiver. It is not known at this time what the fiscal impact will be on Metro costs to the District regarding the status of the waiver.
Fiscal Year Ending June 30,FY 2018 FY 2019 FY 2020 FY 2021 FY 2022
(Lbs) (Lbs) (Lbs) (Lbs) (Lbs)Billed TSS Loadings
1 Single-family Residential 5,728,893 5,814,964 5,902,384 5,990,985 6,080,768 2 Multi-family Residential 1,633,982 1,646,977 1,660,140 1,673,304 1,686,636 3 Car Wash 28,652 28,652 28,652 28,652 28,652 4 Barber & Beauty Salons 11,123 11,123 11,123 11,123 11,123 5 Department Stores, Retail Stores, General Commercial 259,936 260,282 260,627 260,972 261,317 6 Warehouse 5,523 5,523 5,523 5,523 5,523 7 Hospitals & Convalescent Homes 67,813 67,966 68,120 68,273 68,426 8 Laundromats 8,607 8,607 8,607 8,607 8,607 9 Nurseries 0 0 0 0 0
10 Hotels/Motels w/o Dining 9,942 9,942 9,942 9,942 9,942 11 Auto Repair/Sales Shops & Service Stations 64,652 64,652 64,652 64,652 64,652 12 Shopping Centers 353 353 353 353 353 13 Bar w/o Dining 5,178 5,178 5,178 5,178 5,178 14 Commercial Laundry 1,841 1,841 1,841 1,841 1,841 15 Movie Theater 2,578 2,578 2,578 2,578 2,578 16 Lumber Yards 330 330 330 330 330 17 Convenience & Liquor Stores w/Deli 28,076 28,076 28,076 28,076 28,076 18 Industrial Laundry 0 0 0 0 0 19 Hotel w/ Restaurant 4,142 4,142 4,142 4,142 4,142 20 Auto Steam Cleaning 0 0 0 0 0 21 Bakery or Bakery/Deli 10,586 10,586 10,586 10,586 10,586 22 Restaurant & Bar w/Food 330,933 331,393 331,853 332,313 332,774 23 Food Stores 62,596 62,596 62,596 62,596 62,596 24 Mortuary 3,068 3,068 3,068 3,068 3,068 25 Churches 23,704 23,781 23,857 23,934 24,011 26 Schools 55,999 56,076 56,153 56,229 56,306 27 Membership Organizations 4,142 4,142 4,142 4,142 4,142 28 Restaurants w/ Waste Separation 0 0 0 0 0 29 Mobile Homes 479,461 476,086 472,879 469,673 466,466 30 Total Billed TSS Loadings (Lbs) 8,832,110 8,928,914 9,027,402 9,127,072 9,228,093
Line No. Description
San Diego County Sanitation District | WASTEWATER COST OF SERVICE CHARGE STUDY
BLACK & VEATCH CORPORATION | Wastewater Rate Study 15
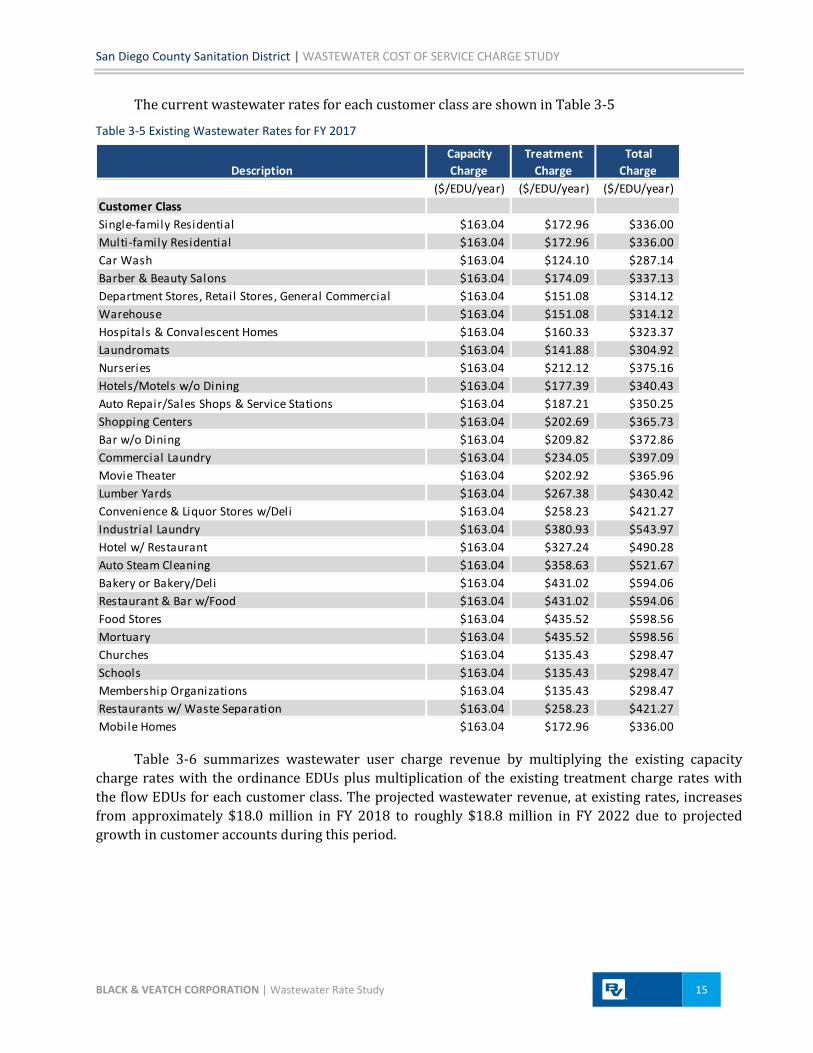
The current wastewater rates for each customer class are shown in Table 3-5
Table 3-5 Existing Wastewater Rates for FY 2017
Table 3-6 summarizes wastewater user charge revenue by multiplying the existing capacity charge rates with the ordinance EDUs plus multiplication of the existing treatment charge rates with the flow EDUs for each customer class. The projected wastewater revenue, at existing rates, increases from approximately $18.0 million in FY 2018 to roughly $18.8 million in FY 2022 due to projected growth in customer accounts during this period.
Capacity Treatment TotalDescription Charge Charge Charge
($/EDU/year) ($/EDU/year) ($/EDU/year)Customer ClassSingle-family Residential $163.04 $172.96 $336.00Multi-family Residential $163.04 $172.96 $336.00Car Wash $163.04 $124.10 $287.14Barber & Beauty Salons $163.04 $174.09 $337.13Department Stores, Retail Stores, General Commercial $163.04 $151.08 $314.12Warehouse $163.04 $151.08 $314.12Hospitals & Convalescent Homes $163.04 $160.33 $323.37Laundromats $163.04 $141.88 $304.92Nurseries $163.04 $212.12 $375.16Hotels/Motels w/o Dining $163.04 $177.39 $340.43Auto Repair/Sales Shops & Service Stations $163.04 $187.21 $350.25Shopping Centers $163.04 $202.69 $365.73Bar w/o Dining $163.04 $209.82 $372.86Commercial Laundry $163.04 $234.05 $397.09Movie Theater $163.04 $202.92 $365.96Lumber Yards $163.04 $267.38 $430.42Convenience & Liquor Stores w/Deli $163.04 $258.23 $421.27Industrial Laundry $163.04 $380.93 $543.97Hotel w/ Restaurant $163.04 $327.24 $490.28Auto Steam Cleaning $163.04 $358.63 $521.67Bakery or Bakery/Deli $163.04 $431.02 $594.06Restaurant & Bar w/Food $163.04 $431.02 $594.06Food Stores $163.04 $435.52 $598.56Mortuary $163.04 $435.52 $598.56Churches $163.04 $135.43 $298.47Schools $163.04 $135.43 $298.47Membership Organizations $163.04 $135.43 $298.47Restaurants w/ Waste Separation $163.04 $258.23 $421.27Mobile Homes $163.04 $172.96 $336.00

WASTEWATER COST OF SERVICE CHARGE STUDY | San Diego County Sanitation District
16 | FEBRUARY 22, 2017
Table 3-6 Summary of Service Charge Revenues (Existing Charges)
3.4 OTHER MISCELLANEOUS REVENUE In addition to revenue from user charges, the District obtains revenue from other operating
sources. Other revenue sources include rents and concessions, services to property owners, contributions from other government agencies, interest earned from the investment of available funds and minor miscellaneous revenues. In total, these revenues represent about 3.3 percent of total wastewater revenues. It is anticipated that these revenues will remain relatively constant for the duration of the study period.
Fiscal Year Ending June 30,FY 2018 FY 2019 FY 2020 FY 2021 FY 2022
($) ($) ($) ($) ($)Customer Class
1 Single-family Residential 11,405,856 11,577,216 11,751,264 11,927,664 12,106,416 2 Multi-family Residential 3,346,737 3,373,261 3,400,284 3,427,308 3,454,504 3 Car Wash 55,194 55,194 55,194 55,194 55,194 4 Barber & Beauty Salons 25,912 25,912 25,912 25,912 25,912 5 Department Stores, Retail Stores, General Commercial 766,338 767,443 768,549 769,654 770,760 6 Warehouse 15,241 15,241 15,241 15,241 15,241 7 Hospitals & Convalescent Homes 298,417 299,064 299,711 300,358 301,004 8 Laundromats 27,026 27,026 27,026 27,026 27,026 9 Nurseries 0 0 0 0 0
10 Hotels/Motels w/o Dining 35,951 35,951 35,951 35,951 35,951 11 Auto Repair/Sales Shops & Service Stations 112,437 112,437 112,437 112,437 112,437 12 Shopping Centers 731 731 731 731 731 13 Bar w/o Dining 10,789 10,789 10,789 10,789 10,789 14 Commercial Laundry 4,786 4,786 4,786 4,786 4,786 15 Movie Theater 5,286 5,286 5,286 5,286 5,286 16 Lumber Yards 430 430 430 430 430 17 Convenience & Liquor Stores w/Deli 54,004 54,004 54,004 54,004 54,004 18 Industrial Laundry 0 0 0 0 0 19 Hotel w/ Restaurant 3,760 3,760 3,760 3,760 3,760 20 Auto Steam Cleaning 0 0 0 0 0 21 Bakery or Bakery/Deli 13,174 13,174 13,174 13,174 13,174 22 Restaurant & Bar w/Food 453,867 454,624 455,381 456,138 456,895 23 Food Stores 62,520 62,520 62,520 62,520 62,520 24 Mortuary 2,830 2,830 2,830 2,830 2,830 25 Churches 96,955 97,253 97,552 97,850 98,149 26 Schools 218,697 218,996 219,294 219,593 219,891 27 Membership Organizations 12,367 12,367 12,367 12,367 12,367 28 Restaurants w/ Waste Separation 0 0 0 0 0 29 Mobile Homes 971,695 964,975 958,428 951,881 945,334 30 Total Revenue 18,001,000$ 18,195,270$ 18,392,901$ 18,592,884$ 18,795,391$
Line No. Description
San Diego County Sanitation District | WASTEWATER COST OF SERVICE CHARGE STUDY
BLACK & VEATCH CORPORATION | Wastewater Rate Study 17
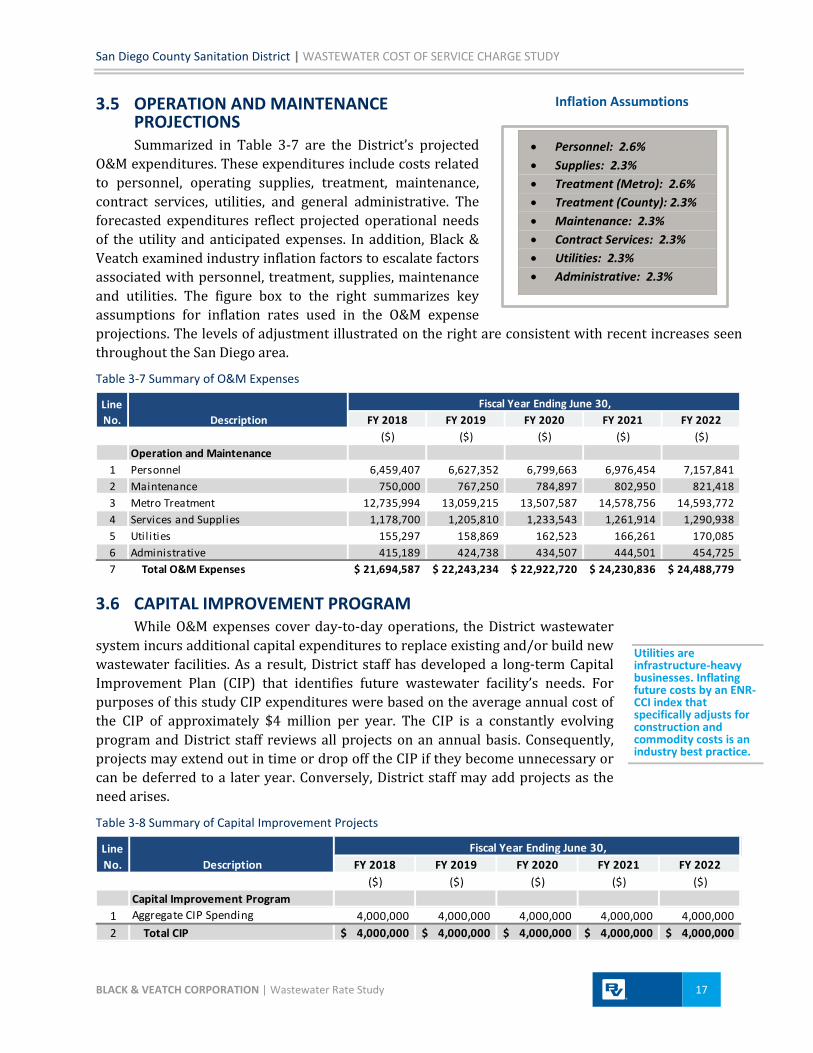
3.5 OPERATION AND MAINTENANCE PROJECTIONS Summarized in Table 3-7 are the District’s projected
O&M expenditures. These expenditures include costs related to personnel, operating supplies, treatment, maintenance, contract services, utilities, and general administrative. The forecasted expenditures reflect projected operational needs of the utility and anticipated expenses. In addition, Black & Veatch examined industry inflation factors to escalate factors associated with personnel, treatment, supplies, maintenance and utilities. The figure box to the right summarizes key assumptions for inflation rates used in the O&M expense projections. The levels of adjustment illustrated on the right are consistent with recent increases seen throughout the San Diego area.
Table 3-7 Summary of O&M Expenses
3.6 CAPITAL IMPROVEMENT PROGRAM While O&M expenses cover day-to-day operations, the District wastewater
system incurs additional capital expenditures to replace existing and/or build new wastewater facilities. As a result, District staff has developed a long-term Capital Improvement Plan (CIP) that identifies future wastewater facility’s needs. For purposes of this study CIP expenditures were based on the average annual cost of the CIP of approximately $4 million per year. The CIP is a constantly evolving program and District staff reviews all projects on an annual basis. Consequently, projects may extend out in time or drop off the CIP if they become unnecessary or can be deferred to a later year. Conversely, District staff may add projects as the need arises.
Table 3-8 Summary of Capital Improvement Projects
Fiscal Year Ending June 30,FY 2018 FY 2019 FY 2020 FY 2021 FY 2022
($) ($) ($) ($) ($)Operation and Maintenance
1 Personnel 6,459,407 6,627,352 6,799,663 6,976,454 7,157,841 2 Maintenance 750,000 767,250 784,897 802,950 821,418 3 Metro Treatment 12,735,994 13,059,215 13,507,587 14,578,756 14,593,772 4 Services and Supplies 1,178,700 1,205,810 1,233,543 1,261,914 1,290,938 5 Util ities 155,297 158,869 162,523 166,261 170,085 6 Administrative 415,189 424,738 434,507 444,501 454,725 7 Total O&M Expenses 21,694,587$ 22,243,234$ 22,922,720$ 24,230,836$ 24,488,779$
Line No. Description
Fiscal Year Ending June 30,FY 2018 FY 2019 FY 2020 FY 2021 FY 2022
($) ($) ($) ($) ($)Capital Improvement Program
1 Aggregate CIP Spending 4,000,000 4,000,000 4,000,000 4,000,000 4,000,000 2 Total CIP 4,000,000$ 4,000,000$ 4,000,000$ 4,000,000$ 4,000,000$
Line No. Description
• Personnel: 2.6% • Supplies: 2.3% • Treatment (Metro): 2.6% • Treatment (County): 2.3% • Maintenance: 2.3% • Contract Services: 2.3% • Utilities: 2.3% • Administrative: 2.3%
Utilities are infrastructure-heavy businesses. Inflating future costs by an ENR-CCI index that specifically adjusts for construction and commodity costs is an industry best practice.
Inflation Assumptions
WASTEWATER COST OF SERVICE CHARGE STUDY | San Diego County Sanitation District
18 | FEBRUARY 22, 2017
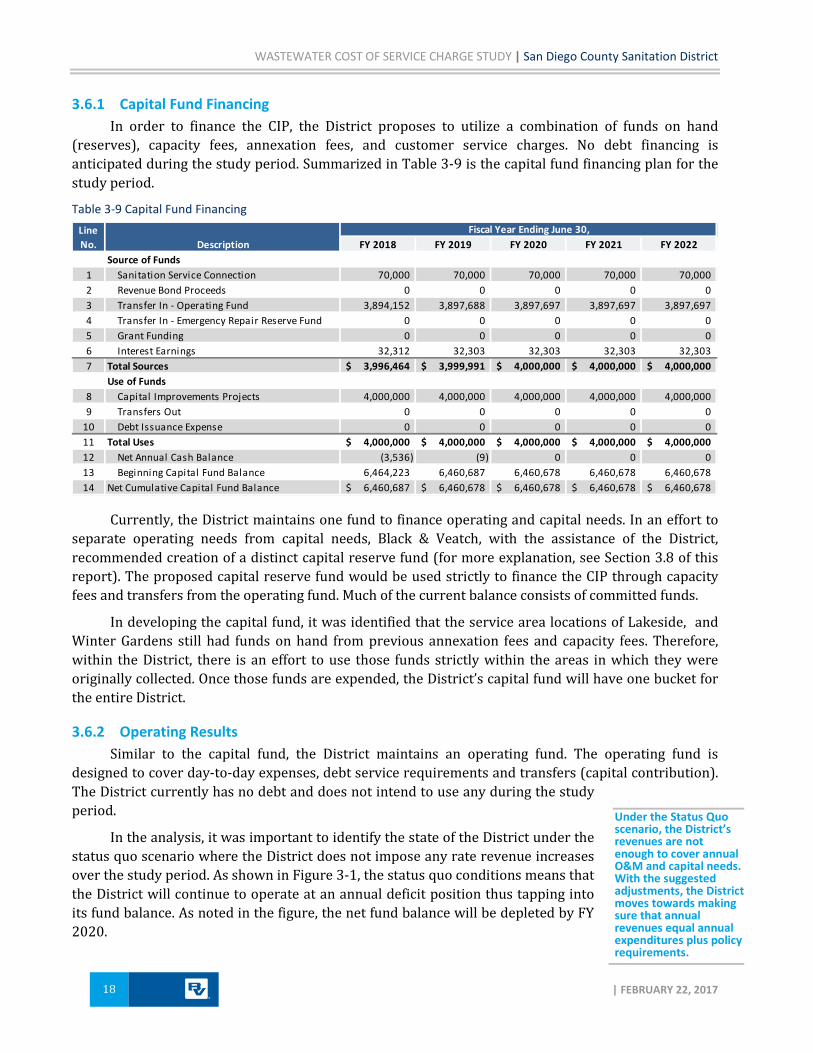
3.6.1 Capital Fund Financing In order to finance the CIP, the District proposes to utilize a combination of funds on hand
(reserves), capacity fees, annexation fees, and customer service charges. No debt financing is anticipated during the study period. Summarized in Table 3-9 is the capital fund financing plan for the study period.
Table 3-9 Capital Fund Financing
Currently, the District maintains one fund to finance operating and capital needs. In an effort to separate operating needs from capital needs, Black & Veatch, with the assistance of the District, recommended creation of a distinct capital reserve fund (for more explanation, see Section 3.8 of this report). The proposed capital reserve fund would be used strictly to finance the CIP through capacity fees and transfers from the operating fund. Much of the current balance consists of committed funds.
In developing the capital fund, it was identified that the service area locations of Lakeside, and Winter Gardens still had funds on hand from previous annexation fees and capacity fees. Therefore, within the District, there is an effort to use those funds strictly within the areas in which they were originally collected. Once those funds are expended, the District’s capital fund will have one bucket for the entire District.
3.6.2 Operating Results Similar to the capital fund, the District maintains an operating fund. The operating fund is
designed to cover day-to-day expenses, debt service requirements and transfers (capital contribution). The District currently has no debt and does not intend to use any during the study period.
In the analysis, it was important to identify the state of the District under the status quo scenario where the District does not impose any rate revenue increases over the study period. As shown in Figure 3-1, the status quo conditions means that the District will continue to operate at an annual deficit position thus tapping into its fund balance. As noted in the figure, the net fund balance will be depleted by FY 2020.
Fiscal Year Ending June 30,FY 2018 FY 2019 FY 2020 FY 2021 FY 2022
Source of Funds1 Sanitation Service Connection 70,000 70,000 70,000 70,000 70,000 2 Revenue Bond Proceeds 0 0 0 0 0 3 Transfer In - Operating Fund 3,894,152 3,897,688 3,897,697 3,897,697 3,897,697 4 Transfer In - Emergency Repair Reserve Fund 0 0 0 0 0 5 Grant Funding 0 0 0 0 0 6 Interest Earnings 32,312 32,303 32,303 32,303 32,303 7 Total Sources 3,996,464$ 3,999,991$ 4,000,000$ 4,000,000$ 4,000,000$
Use of Funds8 Capital Improvements Projects 4,000,000 4,000,000 4,000,000 4,000,000 4,000,000 9 Transfers Out 0 0 0 0 0
10 Debt Issuance Expense 0 0 0 0 0 11 Total Uses 4,000,000$ 4,000,000$ 4,000,000$ 4,000,000$ 4,000,000$ 12 Net Annual Cash Balance (3,536) (9) 0 0 0 13 Beginning Capital Fund Balance 6,464,223 6,460,687 6,460,678 6,460,678 6,460,678 14 Net Cumulative Capital Fund Balance 6,460,687$ 6,460,678$ 6,460,678$ 6,460,678$ 6,460,678$
Line No. Description
Under the Status Quo scenario, the District’s revenues are not enough to cover annual O&M and capital needs. With the suggested adjustments, the District moves towards making sure that annual revenues equal annual expenditures plus policy requirements.

San Diego County Sanitation District | WASTEWATER COST OF SERVICE CHARGE STUDY
BLACK & VEATCH CORPORATION | Wastewater Rate Study 19
Figure 3-1 Projected Operating Cash Flow (Status Quo)
In order to avoid the deficit position starting in FY 2021, the District determined that the appropriate scenario for rate revenue increases that would meet the revenue requirements and operating reserve requirements would be to implement the rate revenue increases shown in Table 3-10. The revenue increases represent the total revenue adjustment needed to meet revenue requirements. The revenue adjustment does not necessarily represent the specific adjustment to individual rates.
Table 3-10 Recommended Rate Revenue Adjustments
Table 3-11 reflects the proposed operating cash flow. The recommended adjustments
incorporate the required revenue increases to meet revenue requirements, capital contribution for capital projects, contributions to a capital reserve, and bring the District to a positive annual cash flow over the study period.
The operating fund is subdivided into revenue and revenue requirements. On line 1 is the revenue under existing rates while lines 2 to 7 are the additional revenue generated from the required annual revenue increases indicated in Table 3-11. Lines 9 to 11 represent other revenues, which include sewer charges from County facilities, miscellaneous fees and interest earned from the investment of available funds. Line 13 represents transfer from the capital fund. In line 15, the total revenues generated from existing sewer service charges, revenue from service charge increases and other operating revenue is summarized.
FY 2018Revenue Adjustment 8.65% 9.00% 9.00% 9.00% 9.00%
Effective Month July July July July July
FY 2021 FY 2022Fiscal Year FY 2019 FY 2020

WASTEWATER COST OF SERVICE CHARGE STUDY | San Diego County Sanitation District
20 | FEBRUARY 22, 2017
Table 3-11 Operating Cash Flow
The revenue requirements for O&M and transfers are shown on lines 16 through 22. These
expenses have been previously discussed. Line 23 represents the total revenue requirement that will need to be met through revenue. The net cumulative balance is indicated in line 26. By County policy, the District strives to maintain a minimum of 180 days of O&M expenses as an operating reserve balance. While the industry standard is typically 90 days of O&M expenses, the District maintains a larger minimum because the District receives revenues from payment of property taxes. Because the County does not begin to remit collected tax, assessment and fee revenues until December or January of the fiscal year, the District must maintain reserves equivalent to 6 months to cover day-to-day expenses. Figure 3-2 presents the operating cash flow projections with the proposed sewer service charge adjustments.
Fiscal Year Ending June 30,FY 2018 FY 2019 FY 2020 FY 2021 FY 2022
RevenueRate Revenue
1 Revenue from Existing Rates 18,001,000 18,195,270 18,392,901 18,592,884 18,795,391
YearMonths Effective Rate Adj
2 FY 2018 12 8.65% 1,557,087 1,573,891 1,590,986 1,608,284 1,625,801 3 FY 2019 12 9.00% 1,779,224 1,798,550 1,818,105 1,837,907 4 FY 2020 12 9.00% 1,960,419 1,981,735 2,003,319 5 FY 2021 12 9.00% 2,160,091 2,183,618 6 FY 2022 12 9.00% 2,380,143 7 Increased Revenue Due to Adjustments 1,557,087 3,353,115 5,349,955 7,568,215 10,030,788 8 Subtotal Rate Revenue $19,558,087 $21,548,385 $23,742,856 $26,161,099 $28,826,179
Other Operating Revenue9 Sewer Service Charges from County 83,769 91,308 99,526 108,483 118,246
10 Other Miscellaneous Revenue 473,800 473,800 473,800 473,800 473,800 11 Interest Earnings 130,001 103,415 84,098 71,265 67,185 12 Subtotal Other Operating Revenue $603,801 $577,215 $557,898 $545,065 $540,985
Transfers13 Transfer from Capital Fund 0 0 0 0 0 14 Subtotal Non-Operating Revenue $0 $0 $0 $0 $015 Total Revenue 20,161,888$ 22,125,600$ 24,300,754$ 26,706,164$ 29,367,164$
Revenue RequirementsOperating & Maintenance
16 O&M Expenses (Collection) 8,958,593 9,184,019 9,415,133 9,652,080 9,895,007 17 Treatment Costs 12,735,994 13,059,215 13,507,587 14,578,756 14,593,772 18 Subtotal O&M $21,694,587 $22,243,234 $22,922,720 $24,230,836 $24,488,779
Transfers19 Transfer to Capital Fund 3,894,152 3,897,688 3,897,697 3,897,697 3,897,697 20 Transfer to Committed Funds 0 0 0 0 0 21 Transfer to Emergency Repair Reserve 600,000 600,000 600,000 600,000 600,000 22 Total Transfers $4,494,152 $4,497,688 $4,497,697 $4,497,697 $4,497,69723 Total Revenue Requirements 26,188,739$ 26,740,922$ 27,420,417$ 28,728,533$ 28,986,476$ 24 Net Annual Cash Balance (6,026,851) (4,615,322) (3,119,663) (2,022,369) 380,688 25 Beginning Fund Balance 28,971,781 22,944,930 18,329,608 15,209,945 13,187,576 26 Net Cumulative Fund Balance 22,944,930$ 18,329,608$ 15,209,945$ 13,187,576$ 13,568,264$
Line No. Description
San Diego County Sanitation District | WASTEWATER COST OF SERVICE CHARGE STUDY
BLACK & VEATCH CORPORATION | Wastewater Rate Study 21
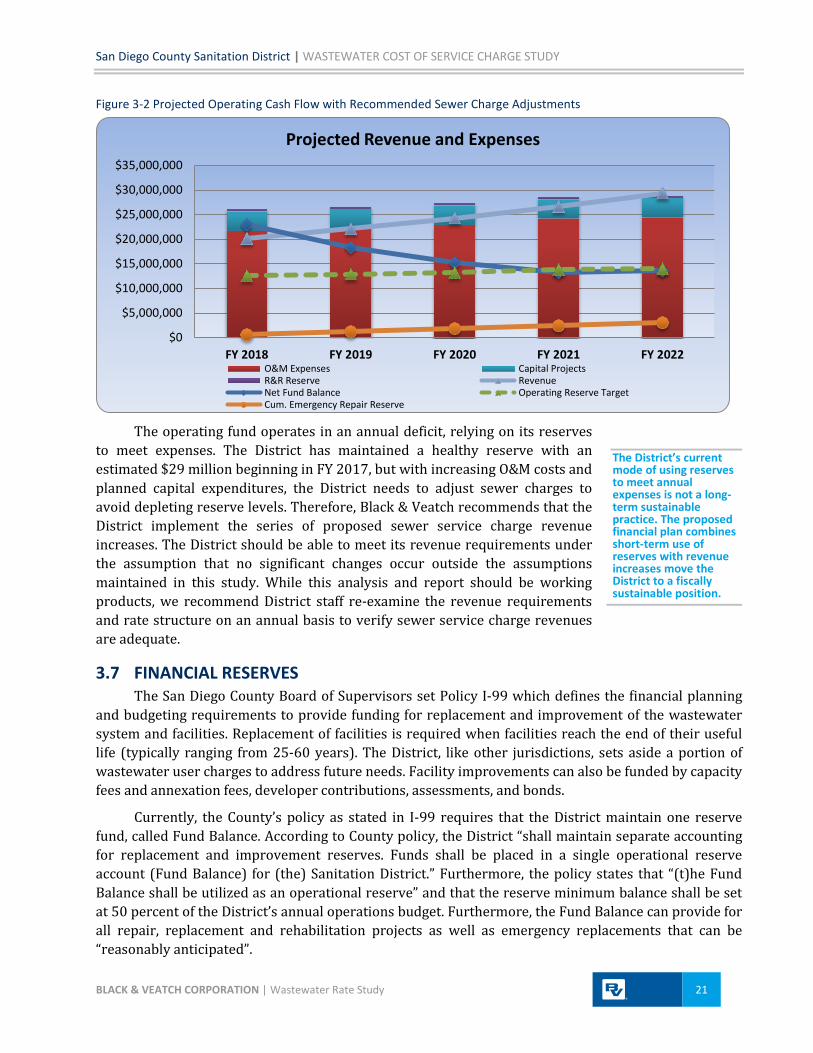
Figure 3-2 Projected Operating Cash Flow with Recommended Sewer Charge Adjustments
The operating fund operates in an annual deficit, relying on its reserves
to meet expenses. The District has maintained a healthy reserve with an estimated $29 million beginning in FY 2017, but with increasing O&M costs and planned capital expenditures, the District needs to adjust sewer charges to avoid depleting reserve levels. Therefore, Black & Veatch recommends that the District implement the series of proposed sewer service charge revenue increases. The District should be able to meet its revenue requirements under the assumption that no significant changes occur outside the assumptions maintained in this study. While this analysis and report should be working products, we recommend District staff re-examine the revenue requirements and rate structure on an annual basis to verify sewer service charge revenues are adequate.
3.7 FINANCIAL RESERVES The San Diego County Board of Supervisors set Policy I-99 which defines the financial planning
and budgeting requirements to provide funding for replacement and improvement of the wastewater system and facilities. Replacement of facilities is required when facilities reach the end of their useful life (typically ranging from 25-60 years). The District, like other jurisdictions, sets aside a portion of wastewater user charges to address future needs. Facility improvements can also be funded by capacity fees and annexation fees, developer contributions, assessments, and bonds.
Currently, the County’s policy as stated in I-99 requires that the District maintain one reserve fund, called Fund Balance. According to County policy, the District “shall maintain separate accounting for replacement and improvement reserves. Funds shall be placed in a single operational reserve account (Fund Balance) for (the) Sanitation District.” Furthermore, the policy states that “(t)he Fund Balance shall be utilized as an operational reserve” and that the reserve minimum balance shall be set at 50 percent of the District’s annual operations budget. Furthermore, the Fund Balance can provide for all repair, replacement and rehabilitation projects as well as emergency replacements that can be “reasonably anticipated”.
$0
$5,000,000
$10,000,000
$15,000,000
$20,000,000
$25,000,000
$30,000,000
$35,000,000
FY 2018 FY 2019 FY 2020 FY 2021 FY 2022
Projected Revenue and Expenses
O&M Expenses Capital ProjectsR&R Reserve RevenueNet Fund Balance Operating Reserve TargetCum. Emergency Repair Reserve
The District’s current mode of using reserves to meet annual expenses is not a long-term sustainable practice. The proposed financial plan combines short-term use of reserves with revenue increases move the District to a fiscally sustainable position.

WASTEWATER COST OF SERVICE CHARGE STUDY | San Diego County Sanitation District
22 | FEBRUARY 22, 2017
3.7.1 Benefits of Reserve Policies The premise of formal reserve policies assumes that the District has sufficient funds to cover
normal operating and capital costs and any other liabilities, such as debt service or post-retirement benefits, should these obligations exist. Having established and sound reserve policies has significant benefits to the District and County as whole. The following are a few benefits to having a reserve policy:
1. Increased ability to fund on-going capital needs;
2. Lower rate increases in the future;
3. Improved ability to address unforeseen cash flow disruptions;
4. Improved operational stability;
5. Lower costs of issuance and lower interest rates, if debt is issued.
In examining the District’s policies, the question on hand was “What type of reserves should the District have in place?” and “At what targets should the reserve levels be set?” The following section describes the recommended reserve accounts and policies for the District and should be included in the County’s I-99 policy document.
3.7.2 Operating Reserve The operating reserve is an unrestricted reserve set by District policy at a minimum of 50 percent
of the District’s operating budget or 180 days. The balance is intended to provide the operating fund an allowance to cover fluctuations in month-to-month expenses associated with receipt of revenues and expenses. For agencies that bill customers on a monthly or bi-monthly basis, it is industry standard to maintain a minimum reserve level anywhere from 45 to 90 days of O&M expenses2. However, given that the District collects service charges via the general property tax roll and annual invoices to non-taxable entities, the 180 days target is appropriate. Collections via the tax roll take place at specific points during the fiscal year; however, the District does not receive its first installment of wastewater receipts until late December or early January of the current fiscal year in which it operates. The District operates, and pays its bills, for approximately 6 months before receiving the first installment of revenues. In some cases, where County remittance of wastewater revenues is separated into percentage payments throughout the latter half of the fiscal year, a longer target level may be warranted. Therefore, we recommend continuing with the 180-day operating reserve target level and treating the net assets in this fund as unrestricted for accounting purposes.
3.7.3 Capital Repair and Replacement Reserve Capital repair and replacement (R&R) reserve funds are typically used to repair or replace
system assets that are worn out or not functioning as intended, or in the event of catastrophic failure.
2 Due to the financial and housing crisis starting in 2008, rating agencies now recommend agencies increase their working capital levels. Agencies with large debt obligations and higher revenue volatility should have higher working capital levels.

San Diego County Sanitation District | WASTEWATER COST OF SERVICE CHARGE STUDY
BLACK & VEATCH CORPORATION | Wastewater Rate Study 23
When detailed asset condition information in not available, many agencies use depreciation expense as a guiding factor in determining the appropriate R&R reserve level. In reality, each system’s assets are different in terms of use, age, condition and location. Common industry metrics used to gauge adequate levels include, but are not limited to, the following methods:
Multiple of annual depreciation expense.
Percentage of original cost of assets (based on the typical useful life data for each system component).
Long-term annual average of the agency’s capital improvement plan project costs (5 – 20 years).
Cumulative amount of annual CIP costs over a given period.
Table 3-12 presents a summary of reserve policy recommendations for the District. We recommend the District maintain a maximum capital reserve target equal to the next 3 years of budgeted cumulative capital project costs but should not exceed $12 million in any given year. This figure represents a typical 3-year CIP plan cost amount. However, the minimum amount that should be held in the R&R reserve fund should never fall below $3 million. This is a figure that represents the cost for repairing a significant system asset should a catastrophic failure occur requiring the District to immediately fund such a replacement.
From an accounting perspective, the monies in the R&R reserve would not be restricted. However, we recommend that the District regard them as such. These funds are being set aside to address current and future R&R needs. Use of the funds should be limited to these purposes and changes to such a policy would require Board approval. Sewer service charges, miscellaneous revenues, future bond proceeds, if any, capacity fees, annexation fees, and related fund balance interest income would be the primary funding sources of this R&R reserve fund.
Table 3-12 Summary of Recommended Reserve Targets
RESERVE DESCRIPTION
Operating Reserves
The operating reserve provides working capital for day-to-day operations and helps absorbs fluctuations in cash balances due to routine difference in revenue and expenses cycles. The reserve is set at 50% of annual operating budget.
Capital Repair and Replacement Reserves
The repair and replacement reserve provides funding for replacement of wastewater infrastructure due to routine capital project planning or in the event of catastrophic failure of a major system asset. The maximum reserve target level is set at the next 3 years of budgeted cumulative capital project costs but should not exceed $12 million in any given year. The minimum floor is set at $3 million; a figure that represents a major system asset replacement cost.

WASTEWATER COST OF SERVICE CHARGE STUDY | San Diego County Sanitation District
24 | FEBRUARY 22, 2017
4 Cost of Service Allocation The principle behind a Cost of Service (COS) study is to match the cost of providing service to
customer classes and to design rates that equitably recover these costs. The first step in the COS process is to allocate the costs of operating the utility to its customers. In accordance with WEF MOP 27, we use a five-step process to allocate the costs of operating the utility to customers:
1. Select a Test Year
2. Allocate costs to utility functions according to cost causative parameters
3. Estimate total customer class service requirements for each cost function
4. Divide costs by requirements for each function to get unit costs of service
5. Distribute costs to each customer class based on its share of total requirements for each cost function
The COS to be allocated to the various customer classes consists of the total revenue requirements for FY 2018, which is known as the test year, as summarized in Table 4-1. In determining costs of service to be met from sewer service charges only, other operating revenues (such as interest income and rents and concessions) are deducted from total revenue requirements. Other operating revenues are not subject to the revenue adjustments described earlier in this report.
Table 4-1 Wastewater Utility Cost of Service to be Recovered from Rates
Operating Capital Total Expense Cost Cost
($) ($) ($)Revenue Requirements
1 O&M Expense 8,958,593 0 8,958,593 2 Treatment Costs - Metro 11,719,055 0 11,719,055 3 Treatment Costs - County 1,016,939 1,016,939 4 Transfers 0 4,494,152 4,494,152 5 Subtotal $21,694,587 $4,494,152 $26,188,739
Less Revenue Requirements Met from Other Sources6 Other Operating Revenue 603,801 0 603,801 7 Transfers 0 0 0 8 Subtotal $603,801 $0 $603,801
Adjustments9 Adjustment for Annual Cash Balance 6,026,851 0 6,026,851
10 Adjustment to Annualize Rate Increase 0 0 0 11 Subtotal $6,026,851 $0 $6,026,85112 Cost of Service to be Recovered from Rates 15,063,935$ 4,494,152$ 19,558,087$
Line No. Description
Note: Line 5 represents total in Table 3-7 and Line 23 from Table 3-11. Line 8 represents Lines 12 and 13 from Table 3-11. Line 11 represents Line 24 from Table 3-11.
The purpose of using the revenue requirements for a specific year (Test Year) out of the Financial Plan is to illustrate how the annual revenues and costs are assigned to cost drivers and ultimately, to different customer classes.
San Diego County Sanitation District | WASTEWATER COST OF SERVICE CHARGE STUDY
BLACK & VEATCH CORPORATION | Cost of Service Allocation 25
The elements comprising the COS are assigned to the two cost categories of operating expense and capital costs. Operating expenses consist of O&M expense and other non-capital related costs such as Treatment. Operating expense is reduced by other operating revenue. Capital costs consist of capital improvements financed from annual rate revenues. Capital costs to be recovered by user charges are reduced by capacity fee transfers. As shown in Table 4-1, the total test year cost of service to be recovered from rates represents approximately $19.6 million.
4.1 FUNCTIONAL COMPONENTS OF WASTEWATER SYSTEM The principles outlined in WEF’s MOP 27 recognize that different parts of the wastewater system
are designed to address different needs. For example, if the influent flows contain low levels of pollutants, then the level of treatment needed at the plant may be minimal. Conversely, if the wastewater utility is located in a heavily industrialized area, the level of treatment may be extensive. As a basis for allocating costs of service among customer classes, costs may be separated into the following four basic functional cost components: (1) “Capacity”; (2) “Volume”; (3) “Strength”; and (4) “Customer”.
Capacity costs represent operating and capital costs primarily associated with collection. The collection costs vary directly with the number of EDUs connected to the system.
Volume, or flow, costs represent operating and capital costs primarily associated with treatment.
Strength costs represent those operating costs primarily associated with treatment. The treatment costs are specifically related to treatment of Biochemical Oxygen Demand (BOD) and Total Suspended Solids (TSS). BOD and TSS relate to the strength of the wastewater which directly affects the energy and cost of wastewater treatment.
Customer costs are defined as those that tend to vary in proportion to the number of customers connected to the system. These include billing, collecting and accounting. Since the District does not identify customer costs separately, any customer billing aspects have been incorporated into the capacity costs.
4.2 ALLOCATION TO COST COMPONENTS Each element of costs e.g. treatment, collection, pumping, billing, customer services, is allocated
to functional cost components (as defined above) on the basis of the parameter or parameters having the most significant influence on the magnitude of that element of cost. In other words, the volume of flow affects the costs to operate the collection (capacity) and treatment (volume) facilities, whereas wastewater strength affects only treatment facilities. Likewise, the analysis demonstrates a link between number of customer accounts and billing and customer service activities, and the costs of those activities.
O&M expense items are allocated directly to appropriate cost components, while the allocation of capital and replacement costs is based upon a detailed allocation of related capital investment. The separation of costs into functional components provides a means for distributing such costs to the various classes of customers on the basis of their respective responsibilities for each particular type of service. The principle guidelines used in the functional cost allocations were:
Line 12 of Table 4-1 illustrates how much revenue the District must collect from user charges to meet FY 2018 needs. The total cost shown on Line 5 of Table 4-1 matches the O&M expenses for FY 2018 found in Table 3-7.

WASTEWATER COST OF SERVICE CHARGE STUDY | San Diego County Sanitation District
26 | FEBRUARY 22, 2017
Costs related to collection were allocated 100% to flow (expressed as EDUs) based on industry standards.
Costs related to treatment were allocated to volume (flow), BOD and TSS based on industry standards. Costs specifically related to treatment provided by the Metro system were allocated 48.2% to flow, 24.4% to BOD, and 27.4% to TSS based on City allocations. Costs specifically related to treatment provided by the County system were allocated 50% to flow, 25% to BOD, and 25% to TSS based on industry standards.
Indirect costs and reserve funding were allocated as “administrative” expenses. Because these administrative expenses are difficult to link to a functional cost component, such as collection or treatment, the percentage allocations for indirect costs are based on the allocation percentages of other O&M expenses.
4.2.1 Allocation of Operating and Maintenance Expense The allocation of O&M expenses is performed by allocating them directly to the appropriate cost
components to the extent possible. Where such an allocation is not possible, discussions with staff and a review of allocations used by other similarly sized utilities helped to formulate the allocation percentages shown in Table 4-2. Table 4-2 represents the allocation of O&M expenses to the functional cost components. Since the District does not have the ability to identify costs by functional cost centers, the major costs components such as personnel, supplies and services, maintenance, contract services, utilities, and administrative were used.
Table 4-2 Allocation of Operation and Maintenance Expense to Functional Cost Components
4.2.2 Allocation of Capital Investments The District’s existing fixed assets are examined and classified to cost components based on their
function. This analysis is conducted to determine the percentage of asset costs to allocate between the amounts of wastewater flow, BOD and TSS produced by the system and by customer class. Since the majority of the sewage flow is treated by the City of San Diego, the District maintains minimal treatment fixed assets. Using the existing fixed allocations as a guideline, future capital investments are
Line Total Collection TreatmentNo. Description Cost Flow Flow BOD TSS
($) ($) ($) ($) ($)O&M Expenses
1 Personnel 6,459,407 5,185,443 637,032 318,516 318,516 2 Maintenance 750,000 750,000 0 0 0 3 Treatment 12,735,994 0 6,157,055 3,113,684 3,465,256 4 Services and Supplies 1,178,700 1,178,700 0 0 0 5 Util ities 155,297 155,297 0 0 0 6 Admin 415,189 415,189 0 0 0 7 Total O&M Expenses 21,694,587 7,684,629 6,794,087 3,432,200 3,783,772
Less Other Revenue8 Miscellaneous Revenues 603,801 206,267 192,782 97,388 107,364 9 Other Adjustments 6,026,851 2,058,856 1,924,253 972,084 1,071,658
10 Net Operating Expenses 15,063,935$ 5,419,506$ 4,677,052$ 2,362,728$ 2,604,750$ 11 Percent Allocation 36.0% 31.0% 15.7% 17.3%
Note: Line 10 represents the operating expense in Table 4-1, Line 12.
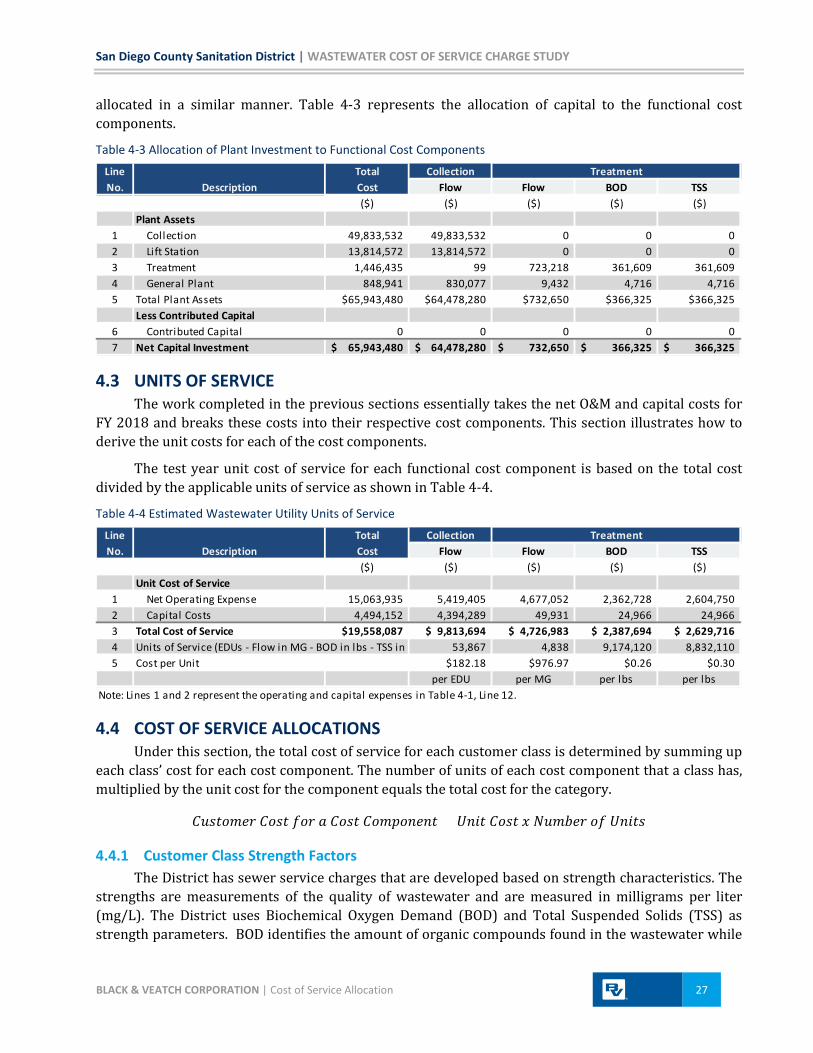
San Diego County Sanitation District | WASTEWATER COST OF SERVICE CHARGE STUDY
BLACK & VEATCH CORPORATION | Cost of Service Allocation 27
allocated in a similar manner. Table 4-3 represents the allocation of capital to the functional cost components.
Table 4-3 Allocation of Plant Investment to Functional Cost Components
4.3 UNITS OF SERVICE The work completed in the previous sections essentially takes the net O&M and capital costs for
FY 2018 and breaks these costs into their respective cost components. This section illustrates how to derive the unit costs for each of the cost components.
The test year unit cost of service for each functional cost component is based on the total cost divided by the applicable units of service as shown in Table 4-4.
Table 4-4 Estimated Wastewater Utility Units of Service
4.4 COST OF SERVICE ALLOCATIONS Under this section, the total cost of service for each customer class is determined by summing up
each class’ cost for each cost component. The number of units of each cost component that a class has, multiplied by the unit cost for the component equals the total cost for the category.
𝐶𝑅𝑖𝑖𝑜𝑁𝑅𝑢 𝐶𝑜𝑖𝑖 𝑜𝑜𝑢 𝑅 𝐶𝑜𝑖𝑖 𝐶𝑜𝑁𝐶𝑜𝑅𝑅𝑅𝑖 = 𝐸𝑅𝑖𝑖 𝐶𝑜𝑖𝑖 𝐸 𝑁𝑅𝑁𝑁𝑅𝑢 𝑜𝑜 𝐸𝑅𝑖𝑖𝑖
4.4.1 Customer Class Strength Factors The District has sewer service charges that are developed based on strength characteristics. The
strengths are measurements of the quality of wastewater and are measured in milligrams per liter (mg/L). The District uses Biochemical Oxygen Demand (BOD) and Total Suspended Solids (TSS) as strength parameters. BOD identifies the amount of organic compounds found in the wastewater while
Line Total Collection TreatmentNo. Description Cost Flow Flow BOD TSS
($) ($) ($) ($) ($)Plant Assets
1 Collection 49,833,532 49,833,532 0 0 0 2 Lift Station 13,814,572 13,814,572 0 0 0 3 Treatment 1,446,435 99 723,218 361,609 361,609 4 General Plant 848,941 830,077 9,432 4,716 4,716 5 Total Plant Assets $65,943,480 $64,478,280 $732,650 $366,325 $366,325
Less Contributed Capital6 Contributed Capital 0 0 0 0 0 7 Net Capital Investment 65,943,480$ 64,478,280$ 732,650$ 366,325$ 366,325$
Line Total Collection TreatmentNo. Description Cost Flow Flow BOD TSS
($) ($) ($) ($) ($)Unit Cost of Service
1 Net Operating Expense 15,063,935 5,419,405 4,677,052 2,362,728 2,604,750 2 Capital Costs 4,494,152 4,394,289 49,931 24,966 24,966 3 Total Cost of Service 19,558,087$ 9,813,694$ 4,726,983$ 2,387,694$ 2,629,716$ 4 Units of Service (EDUs - Flow in MG - BOD in lbs - TSS in l 53,867 4,838 9,174,120 8,832,110 5 Cost per Unit $182.18 $976.97 $0.26 $0.30
per EDU per MG per lbs per lbsNote: Lines 1 and 2 represent the operating and capital expenses in Table 4-1, Line 12.
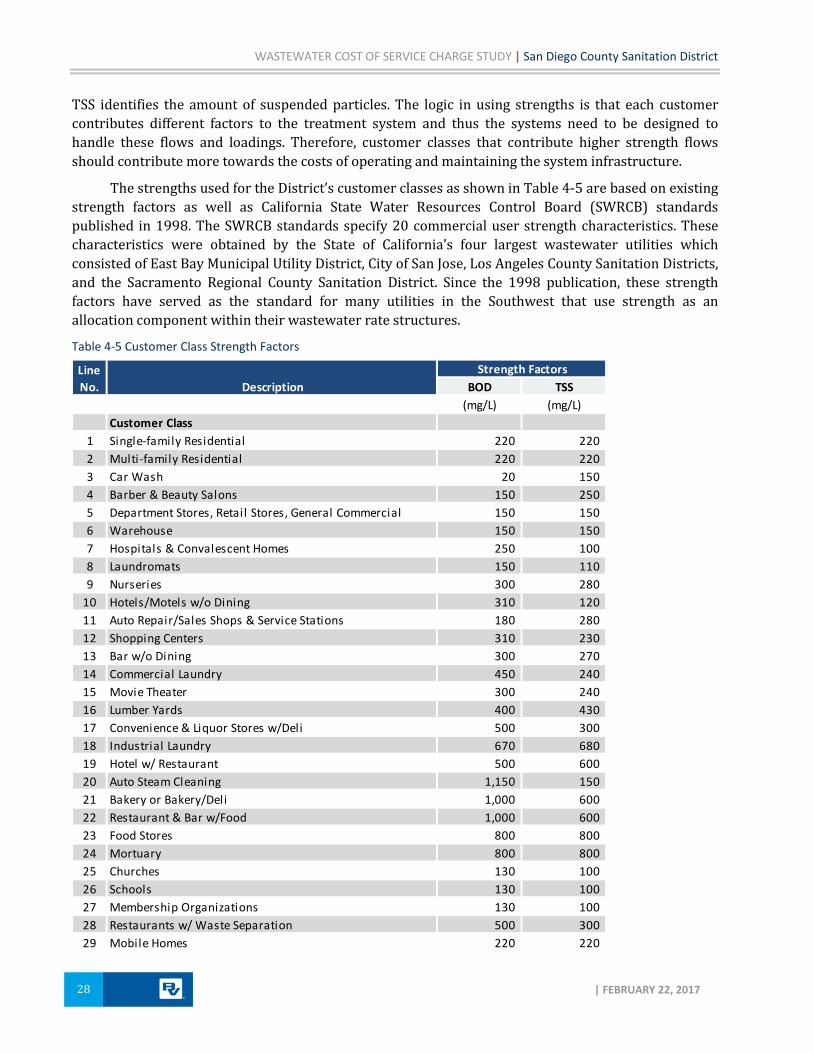
WASTEWATER COST OF SERVICE CHARGE STUDY | San Diego County Sanitation District
28 | FEBRUARY 22, 2017
TSS identifies the amount of suspended particles. The logic in using strengths is that each customer contributes different factors to the treatment system and thus the systems need to be designed to handle these flows and loadings. Therefore, customer classes that contribute higher strength flows should contribute more towards the costs of operating and maintaining the system infrastructure.
The strengths used for the District’s customer classes as shown in Table 4-5 are based on existing strength factors as well as California State Water Resources Control Board (SWRCB) standards published in 1998. The SWRCB standards specify 20 commercial user strength characteristics. These characteristics were obtained by the State of California’s four largest wastewater utilities which consisted of East Bay Municipal Utility District, City of San Jose, Los Angeles County Sanitation Districts, and the Sacramento Regional County Sanitation District. Since the 1998 publication, these strength factors have served as the standard for many utilities in the Southwest that use strength as an allocation component within their wastewater rate structures.
Table 4-5 Customer Class Strength Factors
Strength FactorsBOD TSS
(mg/L) (mg/L)Customer Class
1 Single-family Residential 220 220 2 Multi-family Residential 220 220 3 Car Wash 20 150 4 Barber & Beauty Salons 150 250 5 Department Stores, Retail Stores, General Commercial 150 150 6 Warehouse 150 150 7 Hospitals & Convalescent Homes 250 100 8 Laundromats 150 110 9 Nurseries 300 280
10 Hotels/Motels w/o Dining 310 120 11 Auto Repair/Sales Shops & Service Stations 180 280 12 Shopping Centers 310 230 13 Bar w/o Dining 300 270 14 Commercial Laundry 450 240 15 Movie Theater 300 240 16 Lumber Yards 400 430 17 Convenience & Liquor Stores w/Deli 500 300 18 Industrial Laundry 670 680 19 Hotel w/ Restaurant 500 600 20 Auto Steam Cleaning 1,150 150 21 Bakery or Bakery/Deli 1,000 600 22 Restaurant & Bar w/Food 1,000 600 23 Food Stores 800 800 24 Mortuary 800 800 25 Churches 130 100 26 Schools 130 100 27 Membership Organizations 130 100 28 Restaurants w/ Waste Separation 500 300 29 Mobile Homes 220 220
Line No. Description

San Diego County Sanitation District | WASTEWATER COST OF SERVICE CHARGE STUDY
BLACK & VEATCH CORPORATION | Cost of Service Allocation 29
4.4.2 Distribution of Costs of Service to Customer Classes The customer class responsibility for service is obtained by applying the unit costs of service
derived in Table 4-4 to the number of units for which the customer class is responsible. To determine the individual units for each customer class, the following methodology was used for each component.
𝐶𝑅𝐶𝑅𝑂𝑖𝑖𝐶 = 𝑇𝑜𝑖𝑅𝐹 𝑂𝑢𝑢𝑖𝑅𝑅𝑅𝑂𝑅 𝐸𝐸𝐸
𝑉𝑜𝐹𝑅𝑁𝑅 = 𝐹𝐹𝑜𝐹 𝐸𝐸𝐸 𝐸 240(10−6)𝑀𝑀 𝑢𝑅𝐶⁄ 𝐸 365 𝑢𝑅𝐶𝑖 𝐸 𝐼𝑅𝑜𝐹𝑜𝐹 𝐼𝑅𝑜𝑖𝐹𝑖𝑢𝑅𝑖𝑖𝑜𝑅⁄ %
𝑆𝑖𝑢𝑅𝑅𝑖𝑖ℎ 𝐵𝑂𝐸 = 𝑆𝑖𝑢𝑅𝑅𝑖𝑖ℎ 𝑖𝑅𝑁𝑖 𝐿⁄ 𝐸 8.34 𝐿𝑁𝑖 𝑀𝑀⁄ x Volume in MG
𝑆𝑖𝑢𝑅𝑅𝑖𝑖ℎ 𝑇𝑆𝑆 = 𝑆𝑖𝑢𝑅𝑅𝑖𝑖ℎ 𝑖𝑅𝑁𝑖 𝐿⁄ 𝐸 8.34𝐿𝑁𝑖 𝑀𝑀 𝐸 𝑉𝑜𝐹𝑅𝑁𝑅 𝑖𝑅 𝑀𝑀⁄
The sewer flows (volume) for each customer class are derived earlier in Table 3-3. To assist the reader in calculating sewer rates per this analysis, the following section demonstrates a sample calculation for the residential customer class using the formulas noted above.
𝐶𝑅𝐶𝑅𝑂𝑖𝑖𝐶 = 33,946 𝑅𝑅𝑖 𝑂𝑢𝑢𝑖𝑅𝑅𝑅𝑂𝑅 𝐸𝐸𝐸𝑖
𝑉𝑜𝐹𝑅𝑁𝑅 = 33,946 𝑅𝑅𝑖 𝐹𝐹𝑜𝐹 𝐸𝐸𝐸𝑖 𝐸 240(10−6)𝑀𝑀 𝑢𝑅𝐶⁄ 𝐸 365 𝑢𝑅𝐶𝑖 𝐸 1.05% = 2,974 𝑀𝑀
𝑆𝑖𝑢𝑅𝑅𝑖𝑖ℎ 𝐵𝑂𝐸 = 220𝑁𝑖 𝐿⁄ 𝐸 8.34𝐿𝑁𝑖 𝑀𝑀⁄ 𝐸 2,974 𝑀𝑀 = 5,728,893 𝑅𝑅𝑖 𝐿𝑁𝑖
𝑆𝑖𝑢𝑅𝑅𝑖𝑖ℎ 𝑇𝑆𝑆 = 220𝑁𝑖 𝐿⁄ 𝐸 8.34𝐿𝑁𝑖 𝑀𝑀⁄ 𝐸 2,485 𝑀𝑀 = 5,728,893 𝑅𝑅𝑖 𝐿𝑁𝑖
The results of determining the units and then applying the unit costs of Table 4-4 are illustrated in Table 4-6.

WASTEWATER COST OF SERVICE CHARGE STUDY | San Diego County Sanitation District
30 | FEBRUARY 22, 2017
Table 4-6 Distribution of Costs of Service to Customer Classes
Line Total Collection TreatmentNo. Description Cost Flow Flow BOD TSS
per EDU per MG per lbs per lbs1 Cost per Unit 182.18$ 976.97$ 0.26$ 0.30$
Single-family Residential2 Units 33,946 3,122 5,728,893 5,728,893 3 Allocation of COS 12,431,624 6,184,412 3,050,436 1,491,027 1,705,749
Multi-family Residential4 Units 10,256 891 1,633,982 1,633,982 5 Allocation of COS 3,650,293 1,868,477 870,039 425,267 486,510
Car Wash6 Units 149 23 3,820 28,652 7 Allocation of COS 59,046 27,145 22,376 994 8,531
Barber & Beauty Salons8 Units 97 5 6,674 11,123 9 Allocation of COS 27,933 17,672 5,212 1,737 3,312
Department Stores, Retail Stores, General Commercial10 Units 2,607 208 259,936 259,936 11 Allocation of COS 822,997 474,953 202,997 67,652 77,395
Warehouse12 Units 49 4 5,523 5,523 13 Allocation of COS 16,321 8,927 4,313 1,437 1,644
Hospitals & Convalescent Homes14 Units 961 81 169,532 67,813 15 Allocation of COS 318,831 175,079 79,438 44,123 20,191
Laundromats16 Units 77 9 11,737 8,607 17 Allocation of COS 28,812 14,028 9,166 3,055 2,563
Nurseries18 Units 0 0 0 0 19 Allocation of COS 0 0 0 0 0
Hotels/Motels w/o Dining20 Units 103 10 25,683 9,942 21 Allocation of COS 38,114 18,765 9,705 6,684 2,960
Auto Repair/Sales Shops & Service Stations22 Units 344 28 41,562 64,652 23 Allocation of COS 119,786 62,671 27,048 10,817 19,250
Shopping Centers24 Units 2 0 476 353 25 Allocation of COS 773 364 180 124 105
Bar w/o Dining26 Units 34 2 5,753 5,178 27 Allocation of COS 11,480 6,194 2,247 1,497 1,542

San Diego County Sanitation District | WASTEWATER COST OF SERVICE CHARGE STUDY
BLACK & VEATCH CORPORATION | Cost of Service Allocation 31
Line Total Collection TreatmentNo. Description Cost Flow Flow BOD TSS
per EDU per MG per lbs per lbs1 Cost per Unit 182.18$ 976.97$ 0.26$ 0.30$
28 Units 15 1 3,452 1,841 29 Allocation of COS 5,078 2,733 899 898 548
Movie Theater30 Units 15 1 3,222 2,578 31 Allocation of COS 5,598 2,733 1,258 839 768
Lumber Yards32 Units 1 0 307 330 33 Allocation of COS 450 182 90 80 98
Convenience & Liquor Stores w/Deli34 Units 138 11 46,794 28,076 35 Allocation of COS 56,642 25,141 10,963 12,179 8,359
Industrial Laundry36 Units 0 0 0 0 37 Allocation of COS 0 0 0 0 0
Hotel w/ Restaurant38 Units 5 1 3,452 4,142 39 Allocation of COS 3,851 911 809 898 1,233
Auto Steam Cleaning40 Units 0 0 0 0 41 Allocation of COS 0 0 0 0 0
Bakery or Bakery/Deli42 Units 20 2 17,644 10,586 43 Allocation of COS 13,455 3,644 2,067 4,592 3,152
Restaurant & Bar w/Food44 Units 883 66 551,554 330,933 45 Allocation of COS 467,562 160,868 64,610 143,550 98,534
Food Stores46 Units 111 9 62,596 62,596 47 Allocation of COS 64,317 20,222 9,166 16,291 18,638
Mortuary48 Units 4 0 3,068 3,068 49 Allocation of COS 2,889 729 449 798 913
Churches50 Units 338 28 30,815 23,704 51 Allocation of COS 104,423 61,578 27,767 8,020 7,058
Schools52 Units 735 67 72,799 55,999 53 Allocation of COS 235,124 133,905 65,599 18,947 16,673
Membership Organizations54 Units 31 5 5,385 4,142 55 Allocation of COS 13,136 5,648 4,853 1,402 1,233
Restaurants w/ Waste Separation56 Units 0 0 0 0 57 Allocation of COS 0 0 0 0 0
Mobile Homes58 Units 2,946 261 479,461 479,461 59 Allocation of COS 1,059,552 536,713 255,296 124,786 142,757 60 TOTAL COSTS OF SERVICE 19,558,087$ 9,813,694$ 4,726,983$ 2,387,694$ 2,629,716$
Note: Line 1 represents Table 4-4, Line 5.
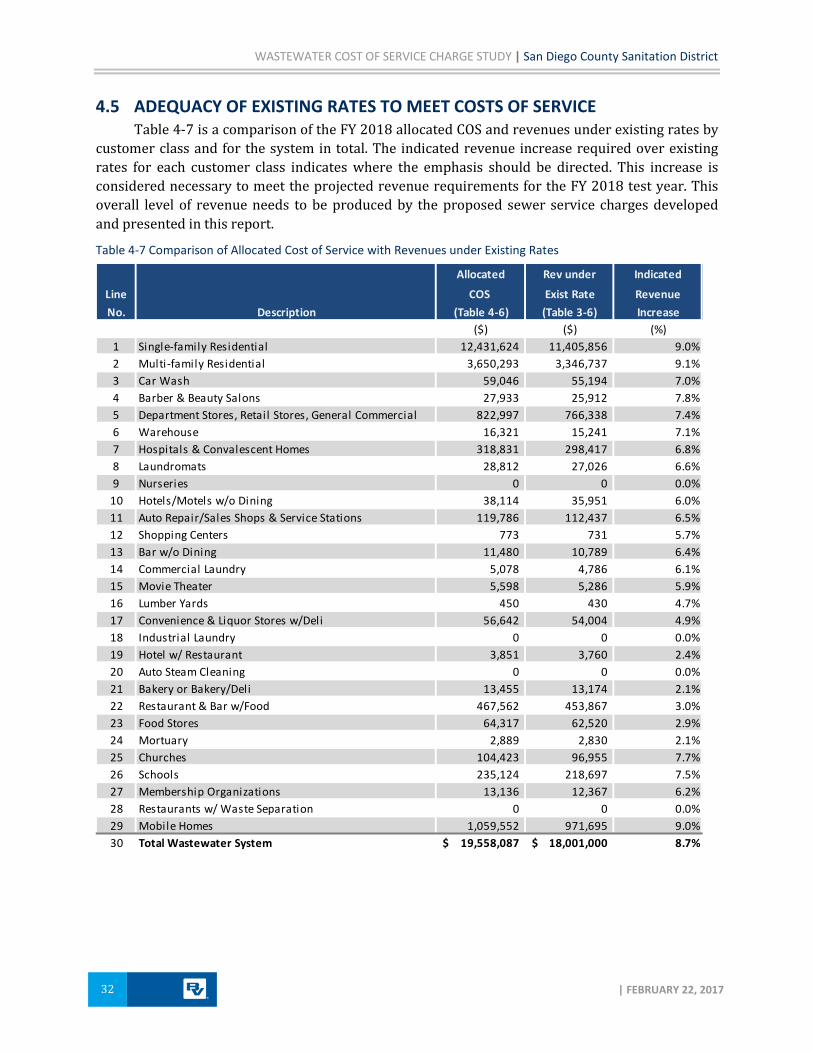
WASTEWATER COST OF SERVICE CHARGE STUDY | San Diego County Sanitation District
32 | FEBRUARY 22, 2017
4.5 ADEQUACY OF EXISTING RATES TO MEET COSTS OF SERVICE Table 4-7 is a comparison of the FY 2018 allocated COS and revenues under existing rates by
customer class and for the system in total. The indicated revenue increase required over existing rates for each customer class indicates where the emphasis should be directed. This increase is considered necessary to meet the projected revenue requirements for the FY 2018 test year. This overall level of revenue needs to be produced by the proposed sewer service charges developed and presented in this report.
Table 4-7 Comparison of Allocated Cost of Service with Revenues under Existing Rates
Allocated Rev under Indicated
Line COS Exist Rate RevenueNo. Description (Table 4-6) (Table 3-6) Increase
($) ($) (%)1 Single-family Residential 12,431,624 11,405,856 9.0%2 Multi-family Residential 3,650,293 3,346,737 9.1%3 Car Wash 59,046 55,194 7.0%4 Barber & Beauty Salons 27,933 25,912 7.8%5 Department Stores, Retail Stores, General Commercial 822,997 766,338 7.4%6 Warehouse 16,321 15,241 7.1%7 Hospitals & Convalescent Homes 318,831 298,417 6.8%8 Laundromats 28,812 27,026 6.6%9 Nurseries 0 0 0.0%
10 Hotels/Motels w/o Dining 38,114 35,951 6.0%11 Auto Repair/Sales Shops & Service Stations 119,786 112,437 6.5%12 Shopping Centers 773 731 5.7%13 Bar w/o Dining 11,480 10,789 6.4%14 Commercial Laundry 5,078 4,786 6.1%15 Movie Theater 5,598 5,286 5.9%16 Lumber Yards 450 430 4.7%17 Convenience & Liquor Stores w/Deli 56,642 54,004 4.9%18 Industrial Laundry 0 0 0.0%19 Hotel w/ Restaurant 3,851 3,760 2.4%20 Auto Steam Cleaning 0 0 0.0%21 Bakery or Bakery/Deli 13,455 13,174 2.1%22 Restaurant & Bar w/Food 467,562 453,867 3.0%23 Food Stores 64,317 62,520 2.9%24 Mortuary 2,889 2,830 2.1%25 Churches 104,423 96,955 7.7%26 Schools 235,124 218,697 7.5%27 Membership Organizations 13,136 12,367 6.2%28 Restaurants w/ Waste Separation 0 0 0.0%29 Mobile Homes 1,059,552 971,695 9.0%30 Total Wastewater System 19,558,087$ 18,001,000$ 8.7%
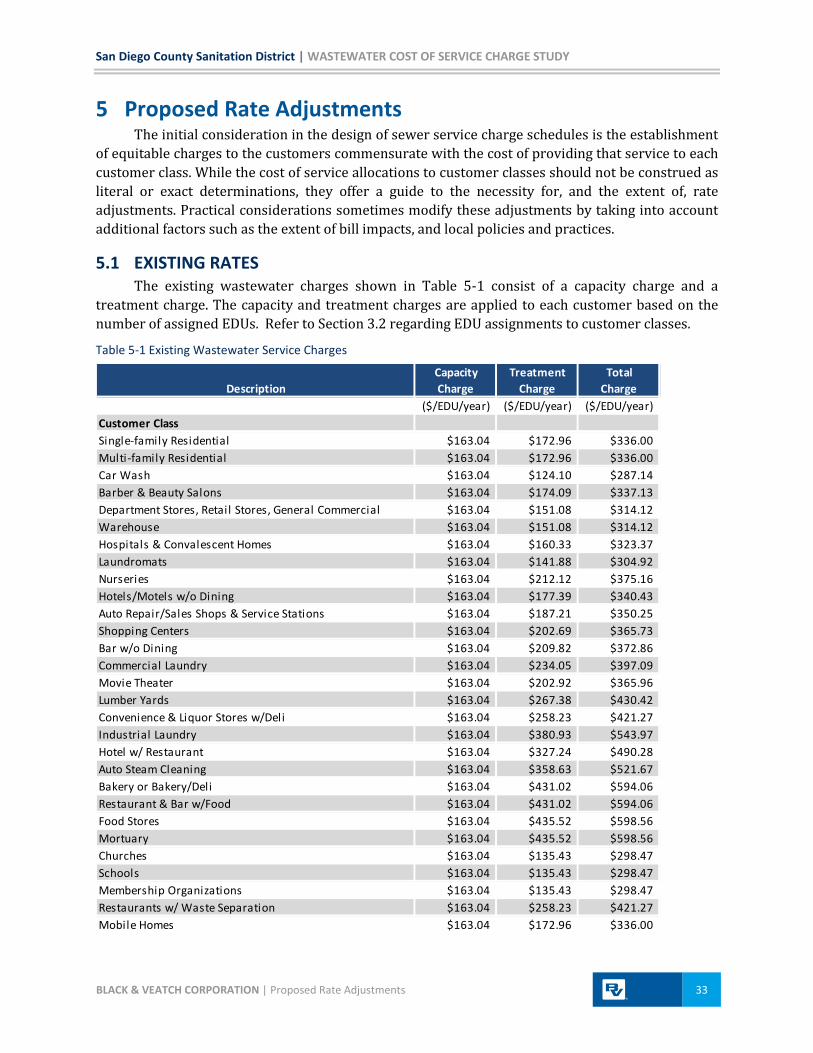
San Diego County Sanitation District | WASTEWATER COST OF SERVICE CHARGE STUDY
BLACK & VEATCH CORPORATION | Proposed Rate Adjustments 33
5 Proposed Rate Adjustments The initial consideration in the design of sewer service charge schedules is the establishment
of equitable charges to the customers commensurate with the cost of providing that service to each customer class. While the cost of service allocations to customer classes should not be construed as literal or exact determinations, they offer a guide to the necessity for, and the extent of, rate adjustments. Practical considerations sometimes modify these adjustments by taking into account additional factors such as the extent of bill impacts, and local policies and practices.
5.1 EXISTING RATES The existing wastewater charges shown in Table 5-1 consist of a capacity charge and a
treatment charge. The capacity and treatment charges are applied to each customer based on the number of assigned EDUs. Refer to Section 3.2 regarding EDU assignments to customer classes.
Table 5-1 Existing Wastewater Service Charges
Capacity Treatment TotalDescription Charge Charge Charge
($/EDU/year) ($/EDU/year) ($/EDU/year)Customer ClassSingle-family Residential $163.04 $172.96 $336.00Multi-family Residential $163.04 $172.96 $336.00Car Wash $163.04 $124.10 $287.14Barber & Beauty Salons $163.04 $174.09 $337.13Department Stores, Retail Stores, General Commercial $163.04 $151.08 $314.12Warehouse $163.04 $151.08 $314.12Hospitals & Convalescent Homes $163.04 $160.33 $323.37Laundromats $163.04 $141.88 $304.92Nurseries $163.04 $212.12 $375.16Hotels/Motels w/o Dining $163.04 $177.39 $340.43Auto Repair/Sales Shops & Service Stations $163.04 $187.21 $350.25Shopping Centers $163.04 $202.69 $365.73Bar w/o Dining $163.04 $209.82 $372.86Commercial Laundry $163.04 $234.05 $397.09Movie Theater $163.04 $202.92 $365.96Lumber Yards $163.04 $267.38 $430.42Convenience & Liquor Stores w/Deli $163.04 $258.23 $421.27Industrial Laundry $163.04 $380.93 $543.97Hotel w/ Restaurant $163.04 $327.24 $490.28Auto Steam Cleaning $163.04 $358.63 $521.67Bakery or Bakery/Deli $163.04 $431.02 $594.06Restaurant & Bar w/Food $163.04 $431.02 $594.06Food Stores $163.04 $435.52 $598.56Mortuary $163.04 $435.52 $598.56Churches $163.04 $135.43 $298.47Schools $163.04 $135.43 $298.47Membership Organizations $163.04 $135.43 $298.47Restaurants w/ Waste Separation $163.04 $258.23 $421.27Mobile Homes $163.04 $172.96 $336.00

WASTEWATER COST OF SERVICE CHARGE STUDY | San Diego County Sanitation District
34 | FEBRUARY 22, 2017
5.1.1 Methodology used in the Determination of Charges The District currently determines the wastewater charges based on a formula established in
Article 5 of the County’s USO. The formula states that there are two primary variables associated with the sewer service charges: Collection (and related transport) and Treatment (and related disposal). The capacity charge is the charge for District costs related to wastewater collection. The treatment charge is designed for the costs associated with treatment and disposal of wastewater.
The formula stated in the USO is as follows:
𝑆𝑆𝐶 =𝑅𝑁𝐸𝐸 +
𝑜𝐹𝐸𝑀𝐹 +
𝑁𝐵𝐸𝑀𝐵 +
𝑖𝑆𝐸𝑀𝑆
Where:
SSC = Sewer Service Charge.
n = Number of EDUs for a specific customer class.
f = Flow in million gallons per year for a specific customer class.
b = BOD in pounds per year for a specific customer class.
s = TSS in pounds per year for a specific customer class.
N = Total number of EDUs for the entire District.
F = Total flow in million gallons per year for the entire District.
B = Total BOD in pounds per year for the entire District.
S = Total TSS in pounds per year for the entire District.
D = The District’s budgeted costs for collecting, treating, and disposal of wastewater.
M = The District’s budgeted costs associated with Metro for treating and disposal of wastewater. Metro costs are separated into three components: MF = Flow, MB = BOD, and MS = TSS.
The COS and resulting sewer service charge structure recommendation utilizes the same principles as the current sewer service charge formula documented in Article 5 of the USO. Following the same principles, the proposed methodology is based on the following formula.
𝑆𝑆𝐶 =𝐴𝑅
+ 𝐵𝑁
Where:
SSC = Sewer Service Charge per EDU.
a = Number of ordinance EDUs for a specific customer class.
b = Number of flow EDUs for a specific customer class.
A = The allocated costs for collection for a specific customer class.
B = The allocated costs for treatment for a specific customer class.
The following is a sample calculation for the residential customer class using the formula noted above.
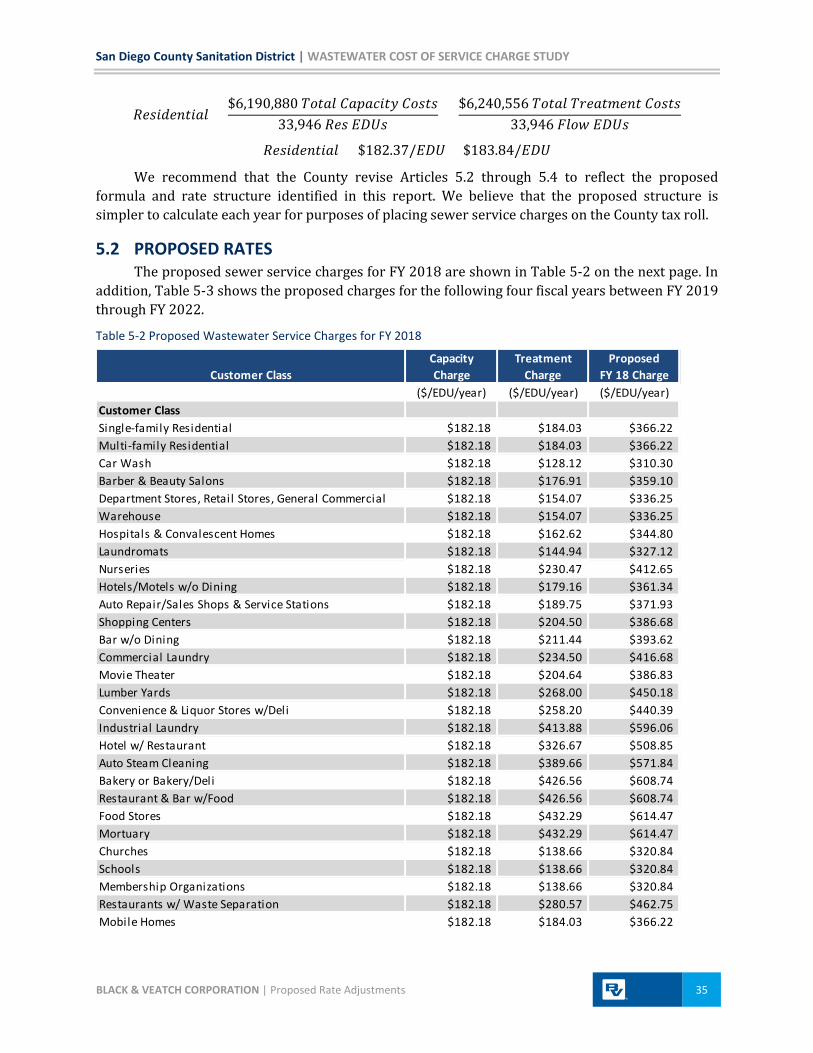
San Diego County Sanitation District | WASTEWATER COST OF SERVICE CHARGE STUDY
BLACK & VEATCH CORPORATION | Proposed Rate Adjustments 35
𝑅𝑅𝑖𝑖𝑢𝑅𝑅𝑖𝑖𝑅𝐹 =$6,190,880 𝑇𝑜𝑖𝑅𝐹 𝐶𝑅𝐶𝑅𝑂𝑖𝑖𝐶 𝐶𝑜𝑖𝑖𝑖
33,946 𝑅𝑅𝑖 𝐸𝐸𝐸𝑖+
$6,240,556 𝑇𝑜𝑖𝑅𝐹 𝑇𝑢𝑅𝑅𝑖𝑁𝑅𝑅𝑖 𝐶𝑜𝑖𝑖𝑖33,946 𝐹𝐹𝑜𝐹 𝐸𝐸𝐸𝑖
𝑅𝑅𝑖𝑖𝑢𝑅𝑅𝑖𝑖𝑅𝐹 = $182.37/𝐸𝐸𝐸 + $183.84/𝐸𝐸𝐸
We recommend that the County revise Articles 5.2 through 5.4 to reflect the proposed formula and rate structure identified in this report. We believe that the proposed structure is simpler to calculate each year for purposes of placing sewer service charges on the County tax roll.
5.2 PROPOSED RATES The proposed sewer service charges for FY 2018 are shown in Table 5-2 on the next page. In
addition, Table 5-3 shows the proposed charges for the following four fiscal years between FY 2019 through FY 2022.
Table 5-2 Proposed Wastewater Service Charges for FY 2018
Capacity Treatment ProposedCustomer Class Charge Charge FY 18 Charge
($/EDU/year) ($/EDU/year) ($/EDU/year)Customer ClassSingle-family Residential $182.18 $184.03 $366.22Multi-family Residential $182.18 $184.03 $366.22Car Wash $182.18 $128.12 $310.30Barber & Beauty Salons $182.18 $176.91 $359.10Department Stores, Retail Stores, General Commercial $182.18 $154.07 $336.25Warehouse $182.18 $154.07 $336.25Hospitals & Convalescent Homes $182.18 $162.62 $344.80Laundromats $182.18 $144.94 $327.12Nurseries $182.18 $230.47 $412.65Hotels/Motels w/o Dining $182.18 $179.16 $361.34Auto Repair/Sales Shops & Service Stations $182.18 $189.75 $371.93Shopping Centers $182.18 $204.50 $386.68Bar w/o Dining $182.18 $211.44 $393.62Commercial Laundry $182.18 $234.50 $416.68Movie Theater $182.18 $204.64 $386.83Lumber Yards $182.18 $268.00 $450.18Convenience & Liquor Stores w/Deli $182.18 $258.20 $440.39Industrial Laundry $182.18 $413.88 $596.06Hotel w/ Restaurant $182.18 $326.67 $508.85Auto Steam Cleaning $182.18 $389.66 $571.84Bakery or Bakery/Deli $182.18 $426.56 $608.74Restaurant & Bar w/Food $182.18 $426.56 $608.74Food Stores $182.18 $432.29 $614.47Mortuary $182.18 $432.29 $614.47Churches $182.18 $138.66 $320.84Schools $182.18 $138.66 $320.84Membership Organizations $182.18 $138.66 $320.84Restaurants w/ Waste Separation $182.18 $280.57 $462.75Mobile Homes $182.18 $184.03 $366.22
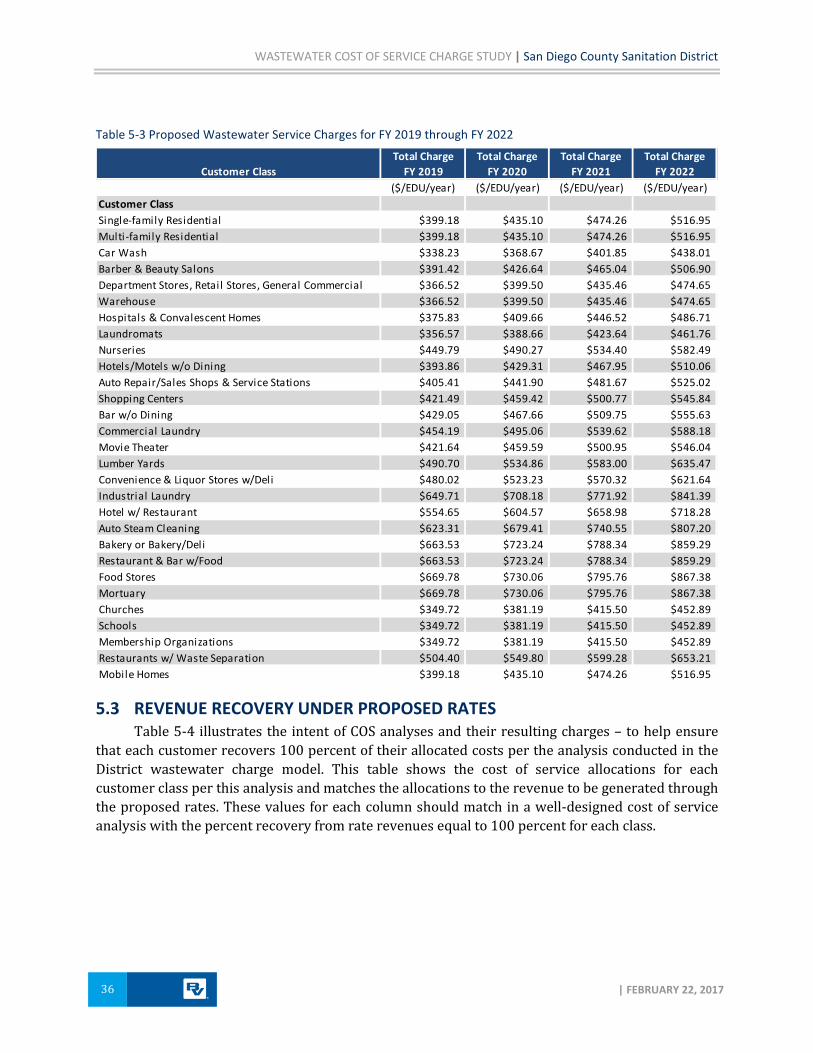
WASTEWATER COST OF SERVICE CHARGE STUDY | San Diego County Sanitation District
36 | FEBRUARY 22, 2017
Table 5-3 Proposed Wastewater Service Charges for FY 2019 through FY 2022
5.3 REVENUE RECOVERY UNDER PROPOSED RATES Table 5-4 illustrates the intent of COS analyses and their resulting charges – to help ensure
that each customer recovers 100 percent of their allocated costs per the analysis conducted in the District wastewater charge model. This table shows the cost of service allocations for each customer class per this analysis and matches the allocations to the revenue to be generated through the proposed rates. These values for each column should match in a well-designed cost of service analysis with the percent recovery from rate revenues equal to 100 percent for each class.
Total Charge Total Charge Total Charge Total ChargeCustomer Class FY 2019 FY 2020 FY 2021 FY 2022
($/EDU/year) ($/EDU/year) ($/EDU/year) ($/EDU/year)Customer ClassSingle-family Residential $399.18 $435.10 $474.26 $516.95Multi-family Residential $399.18 $435.10 $474.26 $516.95Car Wash $338.23 $368.67 $401.85 $438.01Barber & Beauty Salons $391.42 $426.64 $465.04 $506.90Department Stores, Retail Stores, General Commercial $366.52 $399.50 $435.46 $474.65Warehouse $366.52 $399.50 $435.46 $474.65Hospitals & Convalescent Homes $375.83 $409.66 $446.52 $486.71Laundromats $356.57 $388.66 $423.64 $461.76Nurseries $449.79 $490.27 $534.40 $582.49Hotels/Motels w/o Dining $393.86 $429.31 $467.95 $510.06Auto Repair/Sales Shops & Service Stations $405.41 $441.90 $481.67 $525.02Shopping Centers $421.49 $459.42 $500.77 $545.84Bar w/o Dining $429.05 $467.66 $509.75 $555.63Commercial Laundry $454.19 $495.06 $539.62 $588.18Movie Theater $421.64 $459.59 $500.95 $546.04Lumber Yards $490.70 $534.86 $583.00 $635.47Convenience & Liquor Stores w/Deli $480.02 $523.23 $570.32 $621.64Industrial Laundry $649.71 $708.18 $771.92 $841.39Hotel w/ Restaurant $554.65 $604.57 $658.98 $718.28Auto Steam Cleaning $623.31 $679.41 $740.55 $807.20Bakery or Bakery/Deli $663.53 $723.24 $788.34 $859.29Restaurant & Bar w/Food $663.53 $723.24 $788.34 $859.29Food Stores $669.78 $730.06 $795.76 $867.38Mortuary $669.78 $730.06 $795.76 $867.38Churches $349.72 $381.19 $415.50 $452.89Schools $349.72 $381.19 $415.50 $452.89Membership Organizations $349.72 $381.19 $415.50 $452.89Restaurants w/ Waste Separation $504.40 $549.80 $599.28 $653.21Mobile Homes $399.18 $435.10 $474.26 $516.95
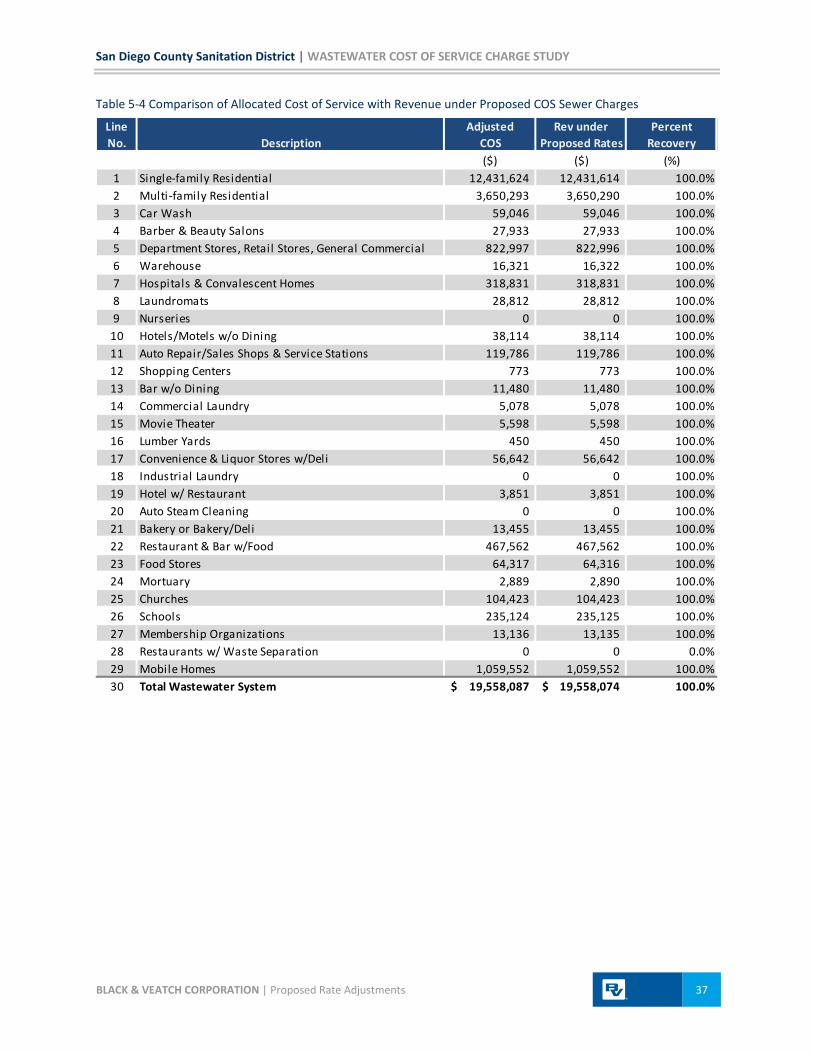
San Diego County Sanitation District | WASTEWATER COST OF SERVICE CHARGE STUDY
BLACK & VEATCH CORPORATION | Proposed Rate Adjustments 37
Table 5-4 Comparison of Allocated Cost of Service with Revenue under Proposed COS Sewer Charges
Line Adjusted Rev under PercentNo. Description COS Proposed Rates Recovery
($) ($) (%)1 Single-family Residential 12,431,624 12,431,614 100.0%2 Multi-family Residential 3,650,293 3,650,290 100.0%3 Car Wash 59,046 59,046 100.0%4 Barber & Beauty Salons 27,933 27,933 100.0%5 Department Stores, Retail Stores, General Commercial 822,997 822,996 100.0%6 Warehouse 16,321 16,322 100.0%7 Hospitals & Convalescent Homes 318,831 318,831 100.0%8 Laundromats 28,812 28,812 100.0%9 Nurseries 0 0 100.0%
10 Hotels/Motels w/o Dining 38,114 38,114 100.0%11 Auto Repair/Sales Shops & Service Stations 119,786 119,786 100.0%12 Shopping Centers 773 773 100.0%13 Bar w/o Dining 11,480 11,480 100.0%14 Commercial Laundry 5,078 5,078 100.0%15 Movie Theater 5,598 5,598 100.0%16 Lumber Yards 450 450 100.0%17 Convenience & Liquor Stores w/Deli 56,642 56,642 100.0%18 Industrial Laundry 0 0 100.0%19 Hotel w/ Restaurant 3,851 3,851 100.0%20 Auto Steam Cleaning 0 0 100.0%21 Bakery or Bakery/Deli 13,455 13,455 100.0%22 Restaurant & Bar w/Food 467,562 467,562 100.0%23 Food Stores 64,317 64,316 100.0%24 Mortuary 2,889 2,890 100.0%25 Churches 104,423 104,423 100.0%26 Schools 235,124 235,125 100.0%27 Membership Organizations 13,136 13,135 100.0%28 Restaurants w/ Waste Separation 0 0 0.0%29 Mobile Homes 1,059,552 1,059,552 100.0%30 Total Wastewater System 19,558,087$ 19,558,074$ 100.0%

WASTEWATER COST OF SERVICE CHARGE STUDY | San Diego County Sanitation District
38 | FEBRUARY 22, 2017
6 Wastewater Service Charge Survey The chart (Figure 6-1) on the following page shows a comparison of monthly single-family
residential wastewater service charges across San Diego County. The current and final year (FY 2022) of the proposed District charges, on a monthly basis, are included in this illustration. The survey data was obtained through agency web site searches and telephone and email solicitations to the agencies contained in this survey.
As the chart shows, the current and proposed District sewer service charges are well below most of the wastewater agencies within the County. Given that the proposed rate increase may not become effective until FY 2018, many of the other agency charges will likely increase their rates and charges beyond what is shown in this graph.
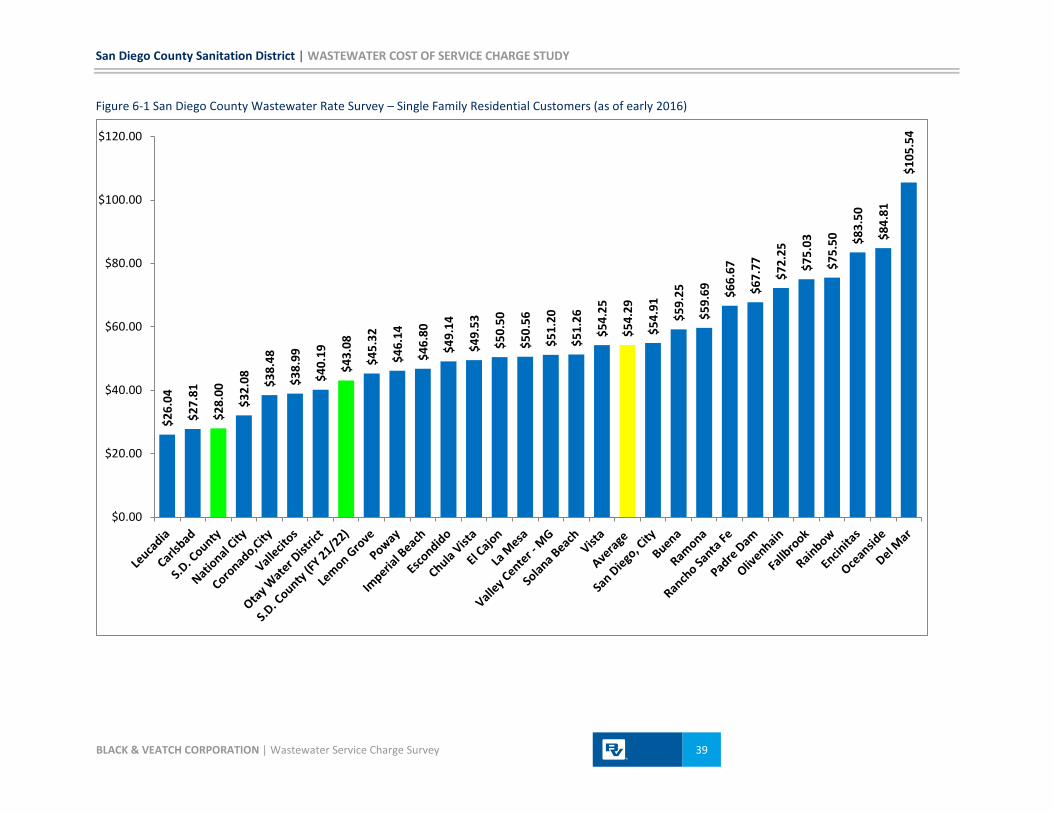
San Diego County Sanitation District | WASTEWATER COST OF SERVICE CHARGE STUDY
BLACK & VEATCH CORPORATION | Wastewater Service Charge Survey 39
Figure 6-1 San Diego County Wastewater Rate Survey – Single Family Residential Customers (as of early 2016)
$26.
04
$27.
81
$28.
00
$32.
08 $38.
48
$38.
99
$40.
19
$43.
08
$45.
32
$46.
14
$46.
80
$49.
14
$49.
53
$50.
50
$50.
56
$51.
20
$51.
26
$54.
25
$54.
29
$54.
91
$59.
25
$59.
69 $66.
67
$67.
77
$72.
25
$75.
03
$75.
50 $83.
50
$84.
81
$105
.54
$0.00
$20.00
$40.00
$60.00
$80.00
$100.00
$120.00