wasteq&c bahir dar - unep · 1 source: finance and economic bureau of amhara regional state and...
TRANSCRIPT

Waste Quantification and Characterization – Bahir Dar (2010)
___________________________________________________________________________ Extract from the “Solid Waste Characterization and Quantification of Bahir Dar City (2010)” report
1. Background
1.1. Setting the Boundaries
Bihar Dar city is the capital of the Amhara National Regional State in the Federal Democratic
Republic of Ethiopia. It is located at 11” 38’N, 37” 10’E on the southern side of Lake Tana (where
Blue Nile river starts). The altitude of the city is about 1801m above mean sea level. The city
covers an area of 16,000 hectares.
The boundaries set for data collection is in terms of geographical and/or administrative coverage
and in terms of different sectors and waste generators with respect to various waste streams. The
different points of concern in this regard for city Bahir Dar are discussed below.
1.1.1. Geo-Demographical & Administrative
Geographical Size of the Area and Zoning (Zoning and possible waste streams in each zone)
There are 9 “kebeles”/zones (the lowest administrative level) in Bahir Dar town each have sub-
zones. These kebeles and sub-zones and the identified possible waste sources/streams are
indicated in the table below (Table 1) and the geo-administrative map of the city is depicted on
Figure 1.
Kebele/Zone Sub-kebele/zone Possible waste streams Sefene selam A(04),B(05),C(06) R+C+ service/health care+Inst+C&D+street sweeping Gishabay A(01),B(02),C(12) R+ service/health care+ C+ C&D+ street
Fasilo A,B,C,D R+ service/health care+ C+ C&D+ street Belay Zeleke A,B,C,D,E R+ inst+ C+ C&D+ street
Hidar 11 A,B,C,D,E R+ inst+ C+ C&D+ Agri.+ Ind. Shimabo A(08),B(09),C(10) R+ inst+ C+ C&D+ Agri.+ Ind.+ street
Shimbit A,B,C,D R+ inst+ C+ C&D+ Ind.+ street+ health care Ginbot 20 A,B,C,D,E,F R+ inst+ C+ C&D+ Ind.
Waste Quantification and Characterization – Bahir Dar
(Ethiopia)

Waste Quantification and Characterization – Bahir Dar (2010)
___________________________________________________________________________
Extract from the “Solid Waste Characterization and Quantification of Bahir Dar City (2010)” report
Tana A,B,C,D R+ inst+ C+ C&D+ Ind.
R: Residential C: Commercial
Inst: Institutional Ind: Industrial
C&D: Construction and Demolition AGri: Agricultural
Table1: Possible waste streams in each kebele /zone
Figure 1.Administrative and Land use in Bihar Dar Cit

Waste Quantification and Characterization – Bahir Dar (2010)
___________________________________________________________________________
Extract from the “Solid Waste Characterization and Quantification of Bahir Dar City (2010)” report
1.1.2. Land Use
The core city has an estimated area of 16000 hectares. The city is divided into 9 administrative
kebeles. Each kebeles has been further divided into zones (A, B, C, D and F). Most of the
administrative kebeles comprise mixed land use i.e. residential; commercial, institutional etc. this
has difficulty to set clear the boundaries of different sectors and waste generators with respect to
various waste streams.
In Bahir Dar area significant numbers of the urban dwellers and about 26% of the rural residents
are engaged in agricultural activities. Water body of Bahir Dar accounts just over 31% of the total
land. Human settlement accounts to about 30% of the total land area of the city (including rural,
urban and informal settlements).
No. Land use Area (Ha) Percent 1 Agriculture 6,588.00 23.72 2 Formal urban settlement 4,214.00 15.17 3 Forest & Woodland 70.00 0.25 4 Marshy land 1,880.00 6.77 5 Vacant & Rocky 2,327.00 8.38 6 Water Body 8,718.00 31.39 7 Rural Settlement 2,982.00 10.74 8 Informal settlement 992.00 3.57 Total 27,771.00 100.00
Source: Bahir Dar Municipality Cadastre Studies Office, 2009
Table 2: Land cover of Bihar Dar city (including satellite kebeles or rural)
1.2. Demographic Details
According to the population and household census of 2007, the population of Bahir Dar is 220,344
/including rural kebeles/. When disaggregated by place of settlement, the rural population of Bahir
Dar constituted 40,250 while the urban population is 180,094. In terms of gender composition the
female population of Bahir Dar is slightly higher than the number of male population. Out of
180,094 urban populations 93,005 are female and 87,089 are male. Annual population growth of
the city is about 6.6%. From this 2.6% is the birth rate and 2.8% is migration rate. Average
household size was 4.4 in 20051.
1 source: finance and economic bureau of Amhara Regional State and Bahir Dar City Administration

Waste Quantification and Characterization – Bahir Dar (2010)
___________________________________________________________________________
Extract from the “Solid Waste Characterization and Quantification of Bahir Dar City (2010)” report
Table 3: Time series of population by administrative zones /kebeles 13 years projected data based on 2007 census data
Kebele 2007 2008 2009 2010 2011 2012 2013 2014 2015 2016 2017 2018 2020
Fasilo 19905 21219 22619 24112 25703 27400 29208 31136 33191 35382 37716.7 40206 45688
Sefene Selam
21250 22653 24148 25741 27440 29251 31182 3240 35434 37772 40265.3 42923 48776
Hidar 11 30000 31980 34091 36341 38739 41296 44021 46927 50024 53326 56845.1 60597 68860
Gishabay 17874 21186 22584 24074 25663 27357 29163 31087 33139 35326 37658 40143 45617
Shibit 14754 15728 16766 17872 19052 20309 21650 23079 24602 26226 27956.4 29802 33865
Ginbot 20 16796 17905 19086 20346 21689 23120 24646 26273 28007 29855 31825.7 33926 38552
Tana 13703 14610 15574 16602 17697 18865 20110 21438 22853 24361 25968.8 27683 31457
Belay Zeleke
20000 21320 22727 24227 25826 27531 29348 31285 33349 35550 37896.8 40398 45906
Shubabo 24484 26100 27823 29659 31616 33703 35927 38299 40826 43521 46393.2 49455 56199
Total 180768 192699 205417 218975 233427 248833 265256 287763 301425 321319 342526 365333 414921

Waste Quantification and Characterization – Bahir Dar (2010)
__________________________________________________________________________
_ Extract from the “Solid Waste Characterization and Quantification of Bahir Dar City (2010)” report
0
100000
200000
300000
400000
500000
600000
700000
800000
900000
2007
2008
2009
2010
2011
2012
2013
2014
2015
2016
2017
2018
2020
Total
Shubabo
B/zeleke
Tana
Ginbot 20
Shibit
Gishabay
Hidar 11
S/selam
Fasilo
Chat 1: Time series of population projection (2007-2020) by administrative zones /kebeles
1.3. Industries, Institutions, Healthcares and Commercial Undertakings
1.3.1. Industries There are 9 major industries in Bahir Dar city. These are 1 textile, 1 tannery, 2 leathers, 2 agro-industries, 1oil and 1 plastic, 1 abattoir. The Bahir Dar textile factory and the tannery are the most significant ones as compared to the others.
1.3.2. Institutions, Healthcares and Commercial Undertakings
The number and geographical distributions of different institutions, healthcare facilities and commercial undertakings in Bahir Dar city are listed in the table below.

Waste Quantification and Characterization – Bahir Dar (2010)
__________________________________________________________________________
_ Extract from the “Solid Waste Characterization and Quantification of Bahir Dar City (2010)” report
Institution
B\z
elek
e
Hid
ar 1
1
S/se
lam
Gis
haba
y
Tan
a
Shim
bt
Shum
abo
Gin
bot
20
Fas
ilo
Tot
al
Govt. and non-govt. bureaus insurance, bank
5 17 24 3 21 39 21 18 43 191
Schools, college, training centers
5 18 6 3 6 7 5 7 13 70
universities 1 - - - - - 1 - - 2
Commercial centers
Hotels, rest, lodges, juice centers
31 31 481 164 25 39 33 15 16 835
Garages, shops, market centers
407 3,890 818 290 429 173 125 73 6205
Fuel retailer centers
1 2 1 1 2 2 - 9
Healthcare and laboratory
Hospitals - - - - - 1 - - - 1
Clinic/health care centers/
1 5 7 7 2 5 1 1 3 32
Pharmacy /drug store/
- 1 15 10 6 - 1 33
Lab(soil, animal ) 1 - 1 2

Waste Quantification and Characterization – Bahir Dar (2010)
__________________________________________________________________________
_ Extract from the “Solid Waste Characterization and Quantification of Bahir Dar City (2010)” report
1.4. Primary data on solid waste generation
Following are also some data as per the Bahir Dar EPLAU (2005) survey.
Table 9: waste composition
Type of waste % by weight Food 86.6
Paper 3.3
Plastic, leather & plastic 2.2
Glass 0.6
Textile 2.2
Metals 0.3
Others 48
Waste generation rate in the city is 0.223kg/d/capita
Table 10: Distribution of waste production among the waste streams
From the total waste generated, only 51% was properly collected and disposed. 86% of the total
waste generated is degradable (easily decomposable).
Waste stream Amount kg/d % share
Residential 12610 55
Commercial 4202 19
Industrial 3930 17
Service provider 988 4
Municipal waste 1044 5
22774 100

Waste Quantification and Characterization – Bahir Dar (2010)
__________________________________________________________________________
_ Extract from the “Solid Waste Characterization and Quantification of Bahir Dar City (2010)” report
2. Waste streams
2.1. Waste generating sectors
According to Bahir Dar city arrangements, waste generating sectors are described as
follows,
1. Institutions: Institutions include Amhara National Regional State bureaus, agencies,
offices, schools (high schools), government’s colleges and universities and non-
government offices, private schools and colleges.
2. Health care: (Hospitals, Health centers, and clinics)
3. Industries: (Tanneries, Textiles, Plastics shoe factory, Edible oil, and agro processing
industries)
4. Residential: All households living in Bahir Dar city administration boundary
5. Street sweepings
6. Construction and Demolition structures
7. Agricultural sources
8. Commercial sectors
2.2. Define Municipal and Non-municipal wastes
A) Municipal Solid Waste (MSW) – for Bahir Dar city case municipal waste covers
residential and commercial non-hazardous waste. It is a waste type that
predominantly includes household waste (domestic waste). The C & D debris and
special wastes like hazardous wastes—usually not categorized under MSW. It is
sometimes also defined to mean all solid wastes that a city authority accepts
responsibility for managing in some way.
B) Residential Wastes
Residential waste generated by households living either in single-family houses or
multi-family buildings may contain organic waste (for example, from the kitchen
and gardens), recyclable waste (for example, plastics, paper, cans, etc.), non-
recyclable waste (that has no recycling value), and hazardous waste (batteries,
Waste Quantification and Characterization – Bahir Dar (2010)
__________________________________________________________________________
_ Extract from the “Solid Waste Characterization and Quantification of Bahir Dar City (2010)” report
some oils, etc). Usually, the municipality is responsible for collection and disposal
of such waste, thus it is treated as municipal waste.
C) Commercial waste (shops, hotels, garages, and agricultural wastes)
Food Non-hazardous commercial waste generated by the businesses sectors is
considered as municipal waste; however, waste generators through private sector
usually arrange in this category. Agricultural wastes like spoiled food waste, crop
residues, rubbish, and others.
D) Street Wastes:
This include wastes pick up from the streets and carried out as municipal waste to
the disposal site.
E) Institutional Wastes
Government and Non-Government Bureaus, Schools, Universities, Colleges,
Training Centers, Churches, Mosques…etc are categorized in institutional
waste sources.
F) Non- municipal wastes are wastes different from residential and commercial
wastes in Bahir Dar city case. Wastes like construction and demolishing waste,
industrial waste, health care wastes, laboratory wastes construction and
demolishing wastes-wastes from buildings and other structures are classified as
demolishing wastes. Wastes from construction, remodeling, and repairing of
individual residence, commercial building and other structures are classified as
construction wastes. These include dirt, stones, concrete, bricks, plaster, lumber,
shingles, and plumbing, heating, and electrical parts.
Health Care Centers- (Hospitals, Health Centers, Clinics and Medical Laboratories,
Pharmaceutical centers)
Industries (Tanneries, Textile, Plastic Shoe factory, Edible oil, Agro Processing
industries)

Waste Quantification and Characterization – Bahir Dar (2010)
__________________________________________________________________________
_ Extract from the “Solid Waste Characterization and Quantification of Bahir Dar City (2010)” report
2.3. Hazardous and non-hazardous waste
A) Hazardous waste (industrial, health care and laboratory wastes)
A waste that poses substantial or potential threats to public health or the environment
generally exhibiting one or more of these characteristics: ignitable, oxidizing, corrosive,
eco-toxic, radioactive, etc.
Hazardous waste is generated by different sectors including industries, healthcare
facilities, laboratories, construction and demolitions, sludge and urban agriculture. Some
hazardous waste is also generated by residential sector; however, the data on residential
hazardous waste is usually collected under municipal waste. For hazardous waste, the
data should be collected based on the classification of hazardous waste which is based on
the content of hazardous substances. Considering the nature and the complications is
testing the waste for the presence of the hazardous substances, the data for such wastes is
directly collected from the generator instead of going for the procedure of collection and
analysis of the waste samples.
Since Ethiopia ratified the Basel Convention, the following the Basel classification of hazardous
wastes can be applied.
Generally hazardous wastes of Bahir Dar City include
� Wastes from Hospitals and medical laboratories
� Chemicals: chemically contaminated containers and trimmings from agriculture,
pesticide retailer shops, university and school laboratories, tanneries, textiles, expired
drugs and different chemicals
� Biological wastes from Hospitals and biological research facilities
� Dry cell from each sources and car battery from garages
� Used condoms from Hotels, Pension
� Fluorescent lamps from each sources
Waste Quantification and Characterization – Bahir Dar (2010)
__________________________________________________________________________
_ Extract from the “Solid Waste Characterization and Quantification of Bahir Dar City (2010)” report
B) Non-hazardous wastes
Non-hazardous wastes are those wastes that do not posses hazard characteristics and
excluded in the Basel Convention Classification system. These wastes are generated from
the aforementioned sources of the waste for the City.
Non hazardous waste is routinely generated waste, including general facility
refuse such as pare, cardboard, glasses, wood, plastics, scraps, metals, dirt, and
rubber. In general non hazardous waste includes mixed or household waste,
packaging waste, compostable and inert wastes.

Waste Quantification and Characterization – Bahir Dar (2010)
__________________________________________________________________________
_ Extract from the “Solid Waste Characterization and Quantification of Bahir Dar City (2010)” report
3. Solid waste data collection, analysis and presentation procedure
Once the information on the demarcation of various waste sectors and waste streams is
available, the next step would be to set the procedures for data collection, analysis and
presentation. For date collection the first step would be the finalization of list of materials
available in solid waste generated by various sectors.
3.1 List of materials available in solid waste generated by various sectors
Below are the lists of material types, which are supposed to be available in various waste streams in Bahir Dar city.
1. Paper • Paper Bags • Newspaper
• Office paper • Magazines and catalogues
• Phone Books and directories • Other Miscellaneous paper not
mentioned 1. Glass
• Bottles and containers • Flat Glass • Ceramics
3. Metal • Ferrous metals • Non-ferrous metals
• Remainder/composite metal 4. Plastic
• Plastic bottles
• Festal • Miscellaneous plastic containers
• Remainder/composite plastic • Tires
5. Food 6. Landscape and agricultural
• Leaves and grass • Pruning’s and trimmings • Branches and stumps
• Agricultural crop Residues • Manure
7. Textiles 8. Construction & Demolition
• Concrete
• Asphalt paving • Asphalt roofing • Lumber
• Gypsum Board • Rock, soil and fines
• Remainder/composite cons 9. Hazardous waste
• Paint
• Vehicle and equipment fluids • Used oil
• Batteries • Remainder/composite household
hazardous
• Fluorescent lamps, cosmetics 10. Street sweeping
• Dead animals, sugarcane, dust, etc.

Waste Quantification and Characterization – Bahir Dar (2010)
___________________________________________________________________________
Extract from the “Solid Waste Characterization and Quantification of Bahir Dar City (2010)” report
3.2 Waste data Collection and Sampling
3.2.1 Sampling methods and Procedures
Determination of the required number of representative samples from each solid waste generator is
the next important activity.
• The method we followed for sampling is the random sampling method. In order to make
simple our sampling we indicate first the number of samples to be taken and how could we
take them in each kebele and sub-zone.
• The number of samples depends primarily on the cost versus its utility. Usually for solid waste
data, the confidence level (C.L) is set at 80% or 90% (CACADIA 2003). Consider here 80%
confidence level. Accordingly, the number of samples to be collected for each waste stream is
determined which is shown on the table below for Bahir Dar city case.
• Since the number of samples is influenced by level of variation of materials in the samples we
took a little bit higher number of sample for commercials than residential.
3.2.2 Waste streams and number of samples allocation
Each waste stream and numbers of sample are indicated in the following table
Table 12: waste stream and numbers of sample
A total of 108 samples are considered to be analyzed for possible waste streams in the city. All
these samples are distributed accordingly as shown in the table below.
No Waste stream No of samples
1 Residential 31*8=272hh
2 Institutional 16
3 Healthcare& Laboratory facility
5
4 Street sweeping 5
6 Industrial 5
7 Commercial 34*8=248cc
8 Agricultural 3
9 C & D 9
Total 108samples=563HH

Waste Quantification and Characterization – Bahir Dar (2010)
___________________________________________________________________________
Extract from the “Solid Waste Characterization and Quantification of Bahir Dar City (2010)” report
3.2.3Timing for Sample Collection
3.2.3.1 Zoning
The residential and commercial samples are made to be collected at household level and samples
from 8 households are considered to be brought together and mixed at arranged sites and constitute
one sample for sorting. Hence, a total of 175 households shall be selected for sampling for
residential waste stream making the number of samples in this stream to be 35, and 195
commercial establishments from commercial waste stream.
As explained earlier the waste generating sectors are located mixed in the city, particularly the
residential, commercial and institutional sectors. Therefore, it has been not possible to produce
specific waste zoning map for each of the possible waste generating sectors. The waste samples are
then to be taken based on the existing administration and existing solid waste management
practices in the city. The distribution of the residential and commercial waste samples is made to
be in line with the administrative zones in each kebele, also taking into account the degree of
variations in the waste composition. Detail breakdown of the residential and commercial waste
samples is indicated in the tables below.
3.2.3.2 Timing
To get a representative data, the timing of sample collection could be a vital factor. Based on the
economic viability and time constraints, the study is made by collecting one time data (one period
or season), which later will be adjusted to represent the entire period of waste collection. Existing
experience and local knowledge is used to be economical and effective for collecting the wastes,
particularly the commercial and residential wastes. Hence for residential waste 7 days waste from
selected households shall be collected for analysis. For commercial waste and others most
commonly a one day waste is taken for the selected sites.

Waste Quantification and Characterization – Bahir Dar (2010)
___________________________________________________________________________
Extract from the “Solid Waste Characterization and Quantification of Bahir Dar City (2010)” report
3.2.3.3 Income level
Effort was made to see possibilities for obtaining the residential waste sample as per the income
profile (high, middle and low income) of the society. This concept was discussed among the
concerned stakeholders as it was good. However, a number of limitations were identified to its
consideration. The major one was to find the income profile data of the city.
3.2.4 Selection of Sites and Method for Sample Analysis
For residential and commercial a sample is taken from 8 selected households or commercial
centers. The 8 HH waste is taken, mixed and reduced three times to get a sample with average
composition. For Street sweeping a sample is taken from 1/8 of 1km street waste. For the other
sector a sample is taken from one household. The samples of different waste streams are analyzed
by hand sorting. The quantification of wastes will be made by measuring the sorted waste for
different material types and this be recorded for the next data analysis.
3.2.5 Construction and demolition wastes(C&D) Sampling
Currently there are different types of construction activities taking place in almost all the administrative
kebeles. Most of the constructions are related to buildings, and the waste composition variation is expected
to be less. The particular sites for sampling are to be selected on random basis.
3.2.6 Industrial Waste Sampling
There are few (6) industries in the city at present. But a lot more are expected to be established. For this
particular task almost all the available industries at present shall be analyzed for their waste quantification
and characterization. Hence 6 industries will be surveyed.
3.3 Moisture content and calorific value determination
The moisture content and calorific value determination are supposed to be done at Bahir Dar
University laboratory. 14 lists of materials have been identified for the quantification and

Waste Quantification and Characterization – Bahir Dar (2010)
___________________________________________________________________________
Extract from the “Solid Waste Characterization and Quantification of Bahir Dar City (2010)” report
characterization of Bihar Dar city solid waste. It is understood that moisture content shall be
determined for most of these materials. Total of 120 samples are taken for moisture content
determination. Samples are collected immediately during analysis and properly sealed and
aggregated with the main data.
Since the calorific value measuring device was out of function, it was not possible to determine the
calorific values of the samples.

Waste Quantification and Characterization – Bahir Dar (2010)
___________________________________________________________________________
Extract from the “Solid Waste Characterization and Quantification of Bahir Dar City (2010)” report
4. Data analysis and presentation of Municipal waste in Bahir Dar
4.1. Waste composition in Bahir Dar city Raw weight, moisture content and Dry weight of collected sample Residential waste in Bahir Dar city
Component Raw weight (Kg)
Moisture content (%)
Dry weight (Kg)
Percentage
Food waste 80.35 45.97 % 43.41 12 % Paper 18.226 33.8 % 6.16 2.8 % Plastic 23.76 11.94 % 20.92 3.68 % Textile 12.67 9.44 % 11.474 1.6 % Rubber 5.455 < 1 % 5.43 0.84 % Leather 2.971 3 % 2.88 0.15 % Yard waste 107.105 30.3 % 74.65 17.9 % Wood& charcoal 19.045 13.11 % 16.55 2.95 % Glass 10.55 < 1% 10.52 1.6 % Metals 7.78 < 1 % 7.753 2 % Ash & soil 310.1 16.24 % 259.74 47 % Stone 45.565 < 1 % 45.38 7 % Hazardous 1.913 < 1 % 1.8996 0.29% E-waste 0.725 < 1 % 0.718 0.11 % Total 646.215 464.0746 100 %
Material Composition of residential waste sector in Bahir Dar city
Foo d
w aste, 12%
P ape r, 2.80 %
Plastic, 3.6 8%
Tex tile , 1.60 %
Rub be r, 0.8 4%
Le at her , 0.1 5%
Yar d
w aste, 1 7.90 %
W oo d& ch ar ch
o l, 2 .95%
G lass, 1.60 %M etals, 2%
Ash &soil, 47 %
Stone, 7 %
Hazard eous, 0.
29 %
E-w aste, 0 .11%
Foo d w aste
P ap er
P lastic
Tex tile
Rub be r
Leather
Yard w aste
W o od &ch ar
cholGlass
M etals
Ash &soil

Waste Quantification and Characterization – Bahir Dar (2010)
___________________________________________________________________________
Extract from the “Solid Waste Characterization and Quantification of Bahir Dar City (2010)” report
Raw weight, moisture content and Dry-weight of collected sample commercial waste in Bahir Dar city
Component Raw
weight(Kg) Moisture content (%)
Dry weight(Kg)
Percentage
Food waste 160.9 67.6 % 52.13 47.0% Paper 15.84 22.1 % 12.34 5.00% Plastic 11.82 21.8 % 9.26 3.00% Textile 5.43 23.36 % 4.16 2.0% Rubber 4.755 < 1 % 4.73 1.00% Leather 0.55 3 % 0.53 0.16% Yard waste 29.385 37.56 % 18.35 8.50% Wood & charcoal 5.625 28.46 % 4.024 1.64% Glass 8.665 < 1 % 8.6 2.50% Metals 5.505 < 1 % 5.486 1.60% Ash & soil 43.29 37.2 % 27.17 13.00% Stone 9.065 < 1 % 9.03 2.60% Animal remain 37.85 70 % 11.34 10.70% Hazardeous 1.78 < 1 % 1.767 0.52% E-waste 0.01 <1 % 0.0099 0.00% others 3.53 5 % 3.35 1.00%
Total 343.995 172.2769 100.00%
Waste Material Composition of commercial sector
Food
was te, 47.00%
Paper, 5.00%
Pla stic, 3.00%
Textile , 2.00%
Rubber, 1.00%
Leather, 0.16%
Yard
waste, 8.50%
Wood& charchol, 1.
64%
Glas s, 2.50%
Metals, 1.60%
Ash&soil, 13.00%
Stone, 2.60%
Animal
remain, 10.70%
Hazarde ous, 0.52%
E-waste, 0.00%
others , 1.00%
Food waste
Paper
Plastic
Texti le
Rubber
Leather
Yard waste
Wood&charchol
Gla ss
Me ta ls
A sh&soil
Stone
A nimal remain
Hazardeous
E-waste
others

Waste Quantification and Characterization – Bahir Dar (2010)
___________________________________________________________________________
Extract from the “Solid Waste Characterization and Quantification of Bahir Dar City (2010)” report
Raw weight, moisture content and Dry weight of collected sample Institutional waste in Bahir Dar city
Component Raw weight (Kg)
Moisture content (%)
Dry weight (Kg)
Percentage
Food waste 672.9 54.95% 303.14 63.52% Paper 161.66 5.55% 152.67 15.30% Plastic 31.885 8.5% 30.115 3% Textile 7.92 22.22% 6.16 0.75% Rubber 4.28 < 1 % 4.26 0.40% Leather 0 - 0 0% Yard waste 65.74 16.9% 54.63 6.20% Wood& charcoal 11.18 25.46 % 8.4 1.10% Glass 3.4 <1 % 3.36 0.32% Metals 12.685 < 1 % 12.8 1.20% Ash & soil 73 35.2 % 47.3 6.90% Stone 5.86 < 1 % 5.8 0.55% Hazardous 7.58 < 1 % 7.52 0.71% E-waste 1.2 < 1 % 1.17 0.11% Others 0.08 5 % 0.076 0 Total 1059.37 637.401 100%
Waste Material Composition of institutional sector
Food waste, 63.52%
Paper, 15.30%
Plastic, 3%
Textile
, 0.75%
Rubber, 0.40%
Leather, 0%
Yard
waste, 6 .20%
Wood&charchol, 1.10
%
Glass, 0.32%Metals, 1.20%
Ash&soil, 6 .90%
Stone, 0.55%
Hazardeous, 0.71%
E-waste, 0.11%
Others, 0
Food waste
Paper
Plastic
Textile
Rubber
Leather
Yard waste
Wood&charchol
Glass
Metals
Ash&soil
Stone
Hazardeous
E-waste
Others

Waste Quantification and Characterization – Bahir Dar (2010)
___________________________________________________________________________
Extract from the “Solid Waste Characterization and Quantification of Bahir Dar City (2010)” report
Raw weight, moisture content and dry weight of collected sample street sweeping waste in
Bahir Dar city
Component Raw weight Moisture content
Dry weight Percentage (raw)
Food waste 4.08 52.7% 1.93 6.40% Paper 2.8 9.615% 2.53 4.40% Plastic 1.81 9.05% 1.646 2.85% Textile 0.92 3% 0.89 1.45% Rubber 0.46 < 1% 0.43 0.72% Leather 0 0 0 0% Yard waste 13 13.4% 11.26 20% Wood & charcoal 0.5 25.46% 0.37 0.786% Glass 0.53 <1% 0.51 0.84% Metals 0.4 <1% 0.38 0.63% Ash & soil 24.92 7.18% 23.13 39.20% Stone 4.79 < 1% 4.76 7.50% Hazardous 0 0 0 0% E-waste 0 0 0 0% Total 63.63 47.836 100%
Waste Material Composition of street sweeping sector
Food waste, 6.40%
Paper, 4.40% Plastic, 2.85%
Textile
, 1.45%
Rubber, 0.72%
Leather, 0%
Yard waste, 20%
Wood&charchol, 0.7
9%Glass, 0.84%
Metals, 0.63%
Ash&soil, 39.20%
Stone, 7.50%
Hazardeous, 0%E-waste, 0%
Food waste
Paper
Plastic
Textile
Rubber
Leather
Yard waste
Wood&charchol
Glass
Metals
Ash&soil
Stone
Hazardeous
E-waste

Waste Quantification and Characterization – Bahir Dar (2010)
___________________________________________________________________________
Extract from the “Solid Waste Characterization and Quantification of Bahir Dar City (2010)” report
Total composition of MSW in Bihar Dar city
4.2 Quantification of MSW
4.2.1 Quantification of Residential Waste
For residential waste we took samples of 7 days waste from 8 households, mix it to get average
composition and reduce it 3 times using the UNEP guide lines. Hence the sample becomes a 7
day’s waste of a HH in average.
Total weight found from all the samples (34samples) = 646.215 kg
In Bahir Dar most of the houses are multifamily (56% of Bahir Dar residents live in a rented room
together with the owner of the house) in average 2.5 families live in a house (compound).
The average family size of Bahir Dar is 4.4.
Hence waste generation per capita per day of residential waste is:
Component Residential (kg) from
34 samples
Commercial (kg) from 31
samples
Institutions (kg) from 16
samples
Street sweeping (kg) from 5 samples
Total (kg)
Percentage
Food waste 80.35 160.9 672.9 4.08 918.23 43.45% Paper 18.226 15.85 161.66 2.8 198.536 9.4% Plastic 23.76 11.82 31.885 1.81 69.275 3.28% Textile 12.67 5.43 7.92 0.92 26.94 1.27% Rubber 5.455 4.755 4.28 0.46 14.95 0.7% Leather 2.971 0.55 0 0 3.521 0.2% Yard waste 107.105 29.385 65.74 13 215.23 11.9% Wood & Charcoal
19.045 5.625 11.18 0.5 36.35 1.7%
Glass 10.55 8.665 3.4 0.53 23.145 1.1% Metals 7.78 5.505 12.685 0.4 26.37 1.25% Ash & soil 310.1 43.29 73 24.92 451.31 24.36% Stone 45.565 9.065 5.86 4.79 65.28 3% Animal remain
0 37.85 0 0 37.85 1.8%
Hazardous 1.913 1.78 7.58 0 11.273 0.5% E-waste 0.725 0.01 1.2 0 1.935 0.09% Others 0 3.53 0.08 0 3.61 0.17% Total 646.215 343.995 1059.37 63.63 2113.21 100%

Waste Quantification and Characterization – Bahir Dar (2010)
___________________________________________________________________________
Extract from the “Solid Waste Characterization and Quantification of Bahir Dar City (2010)” report
646.215kg/(34hh)=646.215/(34samples*2.5 average families in a house hold*4.4 average family
size *7 days)= 0.24685 kg/cap/day
The total amount of waste generated daily is: 0.24685*218975(population of 2010)
=54050.775~54 tons/day.
4.2.2 Quantification of Commercial waste
4.2.2.1 Hotels
The total weight of the samples from hotels (10 hotels are taken as a sample) is 171.835kg.
To get the total tonnage of hotels waste
171.835*(835/10) =14,348 kg/day ~14 tons/day.
4.2.2.2 Other commercial sectors
344-172=172kg
Total tonnage =172*(8614/5*1/21)=14,110.55kg/day~14.1 ton/day.
Total commercial weight =28 tons/Day.
4.2.3 Quantification of institutional waste
There are 253 institutions in Bihar Dar. 16 institutional samples out of the total were considered in
this study.
Total weight of institutional samples =1059kg.
Total tonnage of institutional waste =1059*253/16=16745kg=16.745one/day~17tons/day
4.2.4 Quantification of street sweeping waste
There are a total of 35 km Asphalt roads in Bahir Dar where most of street waste is generated. We
took 5 samples from 5 different 1km streets. Then 1/8 of the total weight is taken for
characterization.
Total weight of samples (5 samples from 5km) =63.63*8=509.04
Total tonnage of street sweeping =509.04*35/5=3,563.3~3.56 tons/day

Waste Quantification and Characterization – Bahir Dar (2010)
___________________________________________________________________________
Extract from the “Solid Waste Characterization and Quantification of Bahir Dar City (2010)” report
4.3 MSW composition
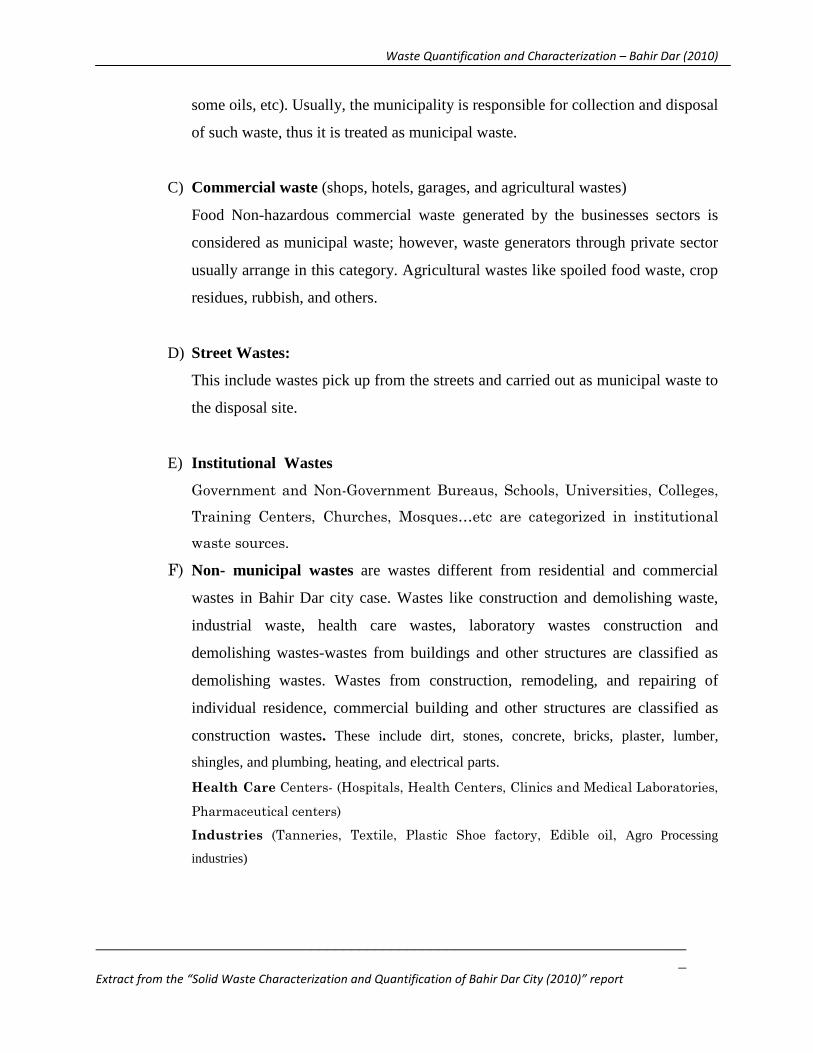
Table13: MS waste composition in Bahir Dar in tones
Sector daily total tonnage(tone)
Residential 54
Commercial 24.2
Institutional 17
street sweeping 3.56
Total 98.8
Waste Quantification and Characterization – Bahir Dar (2010)
___________________________________________________________________________
Extract from the “Solid Waste Characterization and Quantification of Bahir Dar City (2010)” report
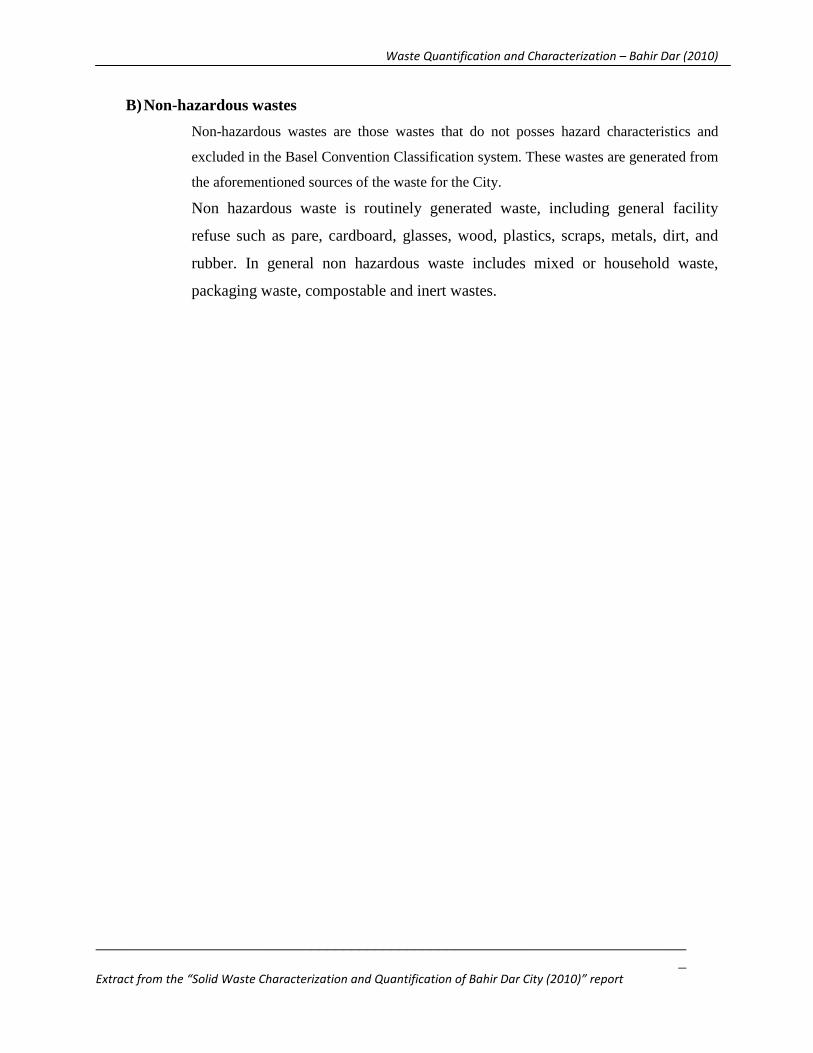
4.4 MSW Hazardous and non hazardous
►residential hazardous:
0.29%*54tone/day=156.6kg/day
►Commercial hazardous
0.52%*24tone/day=124.8kg/day
►Institutional hazardous waste
0.71%*17tone/day=120.7kg/day
►street sweeping hazardous waste
0.00%*4tone/day=0
Total =402.1kg/day.
402.1/99,000=0.4%
The remaining 99.6% of MSW is Non-hazardous
4.5 Organic and Inorganic MSW
From the materials found Yard waste, Food and soil wastes are organic
Residential organic=16.2tons/day

Waste Quantification and Characterization – Bahir Dar (2010)
___________________________________________________________________________
Extract from the “Solid Waste Characterization and Quantification of Bahir Dar City (2010)” report
Commercial organic
=13.32tons/day
Institutional organic
=11.8tons/day
Street sweeping organic
=1.1tons/day
Total =42.42tone/day
Ash& soil:
Residential=25.4 tons/day
Commercial =3.1tons/day
Institutional =1.2tons/day
Street sweeping=1.6tons/day
Total =31.3tone/day
Total organic =31.3+42.42=73.7tons/day=74.6 %( kitchen and yard waste).
4.6 The per capita of waste and Waste generation projections for future The per capita of waste is 0.25kg/day for residential and 0.45kg/day for all residential, commercial, institutional and street sweeping (MSW).
*Per capita waste is: 98800/218975=0.45kg/day/capita 4.7 MS Waste Projection
Year 2010 2011 2012 2013 2014 2015 2016 2017 2018 2019 2020 2021 2022
Pop
ulat
ion
218975 233427 248833 265256 287763 301425 321319 342526 365333 389232 414921 442306 471498
Was
te g
ener
atio
n
(ton
s)
98.5 105 112 119.4 129.5 135.6 144.6 154 164.4 175.2 186.7 199 212.2

Waste Quantification and Characterization – Bahir Dar (2010)
___________________________________________________________________________
Extract from the “Solid Waste Characterization and Quantification of Bahir Dar City (2010)” report
Table14. Waste projection for 2010-2022 years in tons *N.B the waste generation rate is almost doubling similar to the population growth; In 2021(when the population doubles) the waste generation will also double 5. Composition & Quantification of C&D waste in Bahir Dar city
Construction and demolition waste can be substantial in amount and may create a bigger challenge
for the generator as well as the authorities for its collection and disposal in the future. But the
current situation of C&D waste in the city indicates almost all the C&D waste generated is
reused/recycled.
There are two levels of survay for C&D waste data collection, which may help to quantify and
characterize the waste. First one would be the samples(vehicles) entering at waste disposal
facility(landfill) and the other one is getting the information at the C&D sites. The second one is
more crucial because a major proportion of C&D waste could be reused and recycled and may not
be transported to disposal site.
In our city case the second one is happening there is no C&D waste transported to the disposal site.
Most of the waste is reused there around the site. So we choose the second method for the data
collection.

Waste Quantification and Characterization – Bahir Dar (2010)
___________________________________________________________________________
Extract from the “Solid Waste Characterization and Quantification of Bahir Dar City (2010)” report
Types of materials, quantification and composition
Construction and demolition (C&D) waste is not a monolithic waste stream, but it is a family of
waste streams. Therefore, it is important to define the types of materials, which could be available
in C&D waste. The most common materials could be paper/cardboard, garden/vegetation,
wood/timber, carpets, other textiles, rubber, glass, plastics, metals, hazardous wastes, ceramics,
soil/rubble <150mm, cobbles/boulders, clean soil, concrete, plasterboard, bricks, asphalt/bitumen,
cement sheet, insulation and others.
Based on the local information and pilot surveys, a list of materials are prepared as We took 9
samples from 9 kebeles and there are 90 construction sites in the city. After we took the samples
and the number of days the construction needed to be finished we get the annual value of the waste
generated in the site. The average data for 9 samples is as follows.
No C&D waste Average waste /year (tons)
1 Soil/rubbles/cobbles/boulders 13.46667
2 Ceramics 0.10995
3 Paper/cardboard 0.07
4 Wood/timber 1.465
5 Plastic 0.266
6 Carpet/textile 0
7 Rubber 0
8 Leather 0
9 Garden/yard/vegetable 0.013
10 Wood 2.05
11 Glass 0.089993
12 Metals 9.926667
13 Concrete 16.933
14 Plaster board 0.0833
15 Bricks 5.025
16 Asphalt 0.2
17 Cement sheet 0.29
18 Others 2.333
Total 52.12158
Waste Quantification and Characterization – Bahir Dar (2010)
___________________________________________________________________________
Extract from the “Solid Waste Characterization and Quantification of Bahir Dar City (2010)” report
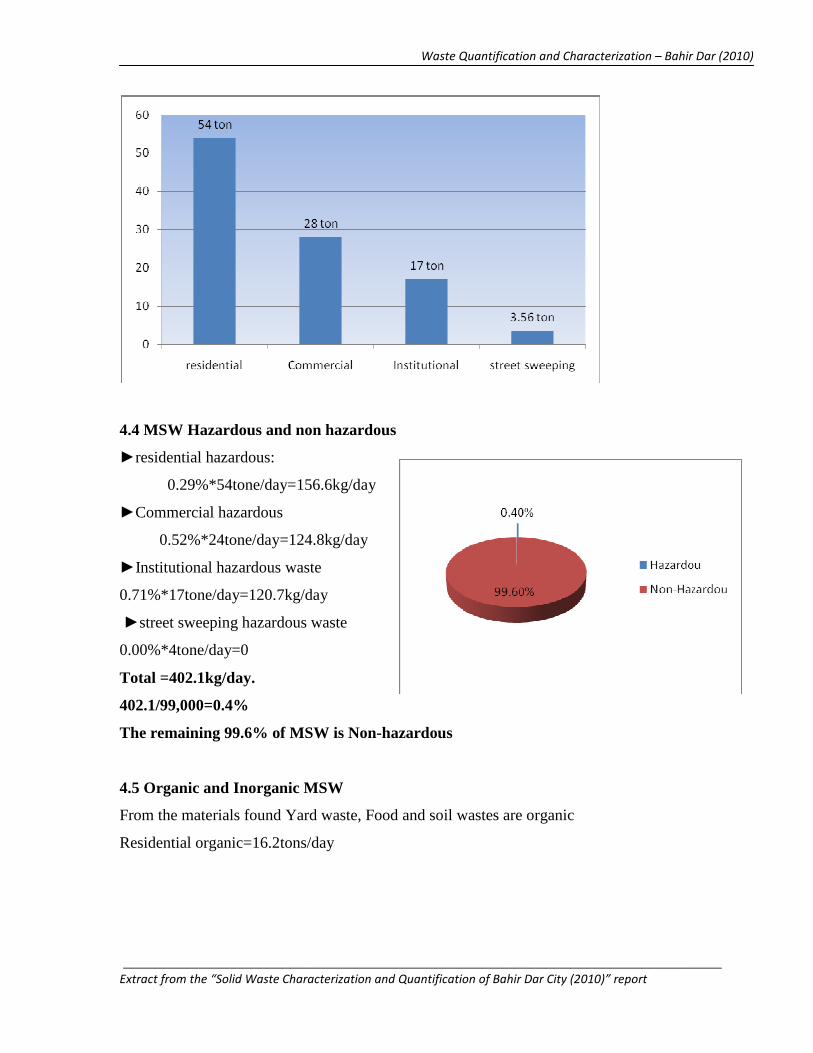
Table 16: C&D waste quantity and composition in Dahir Dar city
Soil/rubbles/cobbles/b
oulders, 25.90%
Ceramics, 0.20%
Paper/cardboard, 0.13
%
Wood/timber, 2.80%
Plastic, 0.50%
Carpet/textile, 0%
Rubber, 0%
Leather, 0%
Garden/yard/vegetable
, 0.03%
Wood, 3.94%
Glass, 0.17%
Metals, 19.10%
Concrete, 32.56%
Plaster
board, 0.16%
Bricks, 9.66%
Asphalt, 0%
Cement sheet , 0.56%
others, 4.49%Soil/rubbles/cobbles/boulders
Ceramics
Paper/cardboard
Wood/timber
Plastic
Carpet/textile
Rubber
Leather
Garden/yard/vegetable
Wood
Glass
Metals
Concrete
Plaster board
Bricks
Asphalt
Cement sheet
others
C&D waste quantity and composition in Dahir Dar city
Quantification:
90*52.12/=4691tons/year C&D waste is generated annually and almost of the wastes is reused in
the site and some are brought to sales such as cement sheet.