waste water recycling camus-sbttm · • removal efficiency of 60% is in bod and tss in the...
TRANSCRIPT

Waste Water RecyclingVisionEarthcare Pvt Ltd (VEC), SINE IIT Bombay
www.visionearthcare.com, [email protected]: +91-9987542130, LL: +91-22-27718444
CAMUS-SBTTMContinuous Advanced Multistage System using Soil Bio Technology

CAMUS-SBTTM Waste Water Recyclingwww.visionearthcare.com ,[email protected], whatsapp: 9769605447
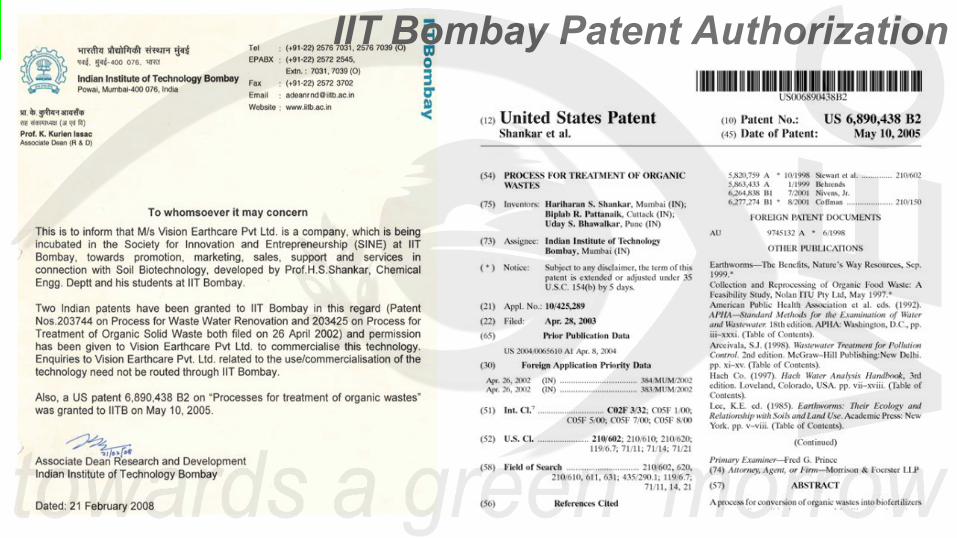
IIT Bombay Patent Authorization

VEC
:Tra
dem
arks
● VEC is authorized SBT / CAMUS-SBT Technology Provider
● Un-Authorized/Un-Approved implementations of SBT technology is a Criminal Violation of Indian and International Patent and Trademark Laws
● Unauthorized Implementing Agency and Beneficiaries will be liable for prosecution by Vision Earthcare including damages

Credentials and Qualifications
MOU with Maharashtra Govt as Technology Provider

Typical Water Test Results
Meets CPCB Norm● BOD < 10mg/L● TSS < 10mg/L● COD < 50mg/L

Our Clients

CAMUS-SBT vs ASP : Process FlowAeration Basin
Blowers/Diffusers: High Energy and Maintenance
Sludge Bed
Preliminary Screening
Wet
Wel
l
Primary Clarifier
Secondary Clarifier
Thickener
AC
F
Disinfectionsludge recycle
BOD: 300 TSS : 300
BO
D: 3
0
TSS
: 20
BOD: <10 TSS : <5
Typically CPCB E
Preliminary Screening
Wet
Wel
l
RSTSettler
Equilizer Bio Mound (BM1) Bio Mound (BM2)
(BM3)
BOD: 300 TSS : 300
BOD: 50 TSS : 30
BOD: ~5 TSS : ~1
AC
F
Disinfection
CPCB A
CPCB B/C/D
Continuous Aerobic Multi-Stage Soil Bio Technology (CAMUS-SBT)

Com
pone
nts
of S
BT
9

CultureBio Mounds (BM1/2)
Soil Liquid ProcessingPheretima Elongata
White Worms
Bio Mounds (BM3) Vermicomposting: Solids Processing
Eisenia FetidaRed Worms

Technology ComparisonAssessment of various wastewater parameters Technologies
Performance after Secondary Treatment (BOD<30) CSBT ASP MBBR SBR UASB+ASP MBR WSP
Effluent BOD (mg/L) <20 <20 <30 <10 <20 <5 <40
Effluent Suspended Solids (mg/L) <30 <30 <30 <10 <30 <5 <100
Fecal Coliforms (log unit) 6-7 2-3 2-3 3-4 2-3 5-6 2-3
T-NH3 removal efficiency (%) 70-80 10-20 10-20 70-80 10-20 70-80 10-20
Performance after tertiary treatment (BOD<10)
Effluent BOD (mg/L) <10 <10 <10 <10 <10 <10 <10
Effluent Suspended Solids (mg/L) <5 <5 <5 <5 <5 <5 <5
Effluent NH4N(mg/L) <1 <1 <1 <1 <1 <1 <1
Effluent TP(mg/L) <0.5 <0.5 <0.5 <0.5 <0.5 <0.5 <0.5
Effluent total coliform MPN/100 ml 10 10 10 10 10 10 10
Area requirement (m2/MLD)
Average area secondary treatment (BOD<30) 300 800 450 450 1000 450 6000
Average area secondary treatment (BOD<10) 600 900 550 550 1100 450 6100
Operation & Maintenance
Energy consumption in secondary treatment (kwhr/ML) 60 180 220 150 120 300 2
Energy consumption in tertiary treatment(kwhr/ML) 60 180 220 150 120 300 2
Energy consumption for sludge handling(kwhr/ML) 1 1 1 1 1 1 1
Total Energy consumption (kwhr/ML) 121 361 441 301 241 601 5
Chemical requirement
Polymer /coagulants Low High High High High High High
Disinfection Low High High High High High High
Other chemicals Low High High High High High High
Skilled Manpower No Yes Yes Yes Yes Yes NoSource : Adapted from IIT Kanpur STP comparison Ganga Action Plan : 003_GBP_IIT_EQP_S&R_Ver 1 Dec 2010

Process Flow X(KLD) = 5 to 50

Typical Small STP (50-500KLD)
● SC: Screen Chamber● RST: Raw Sewage Tank● CT: Collection tank● BR: Bio Reactor 1&2
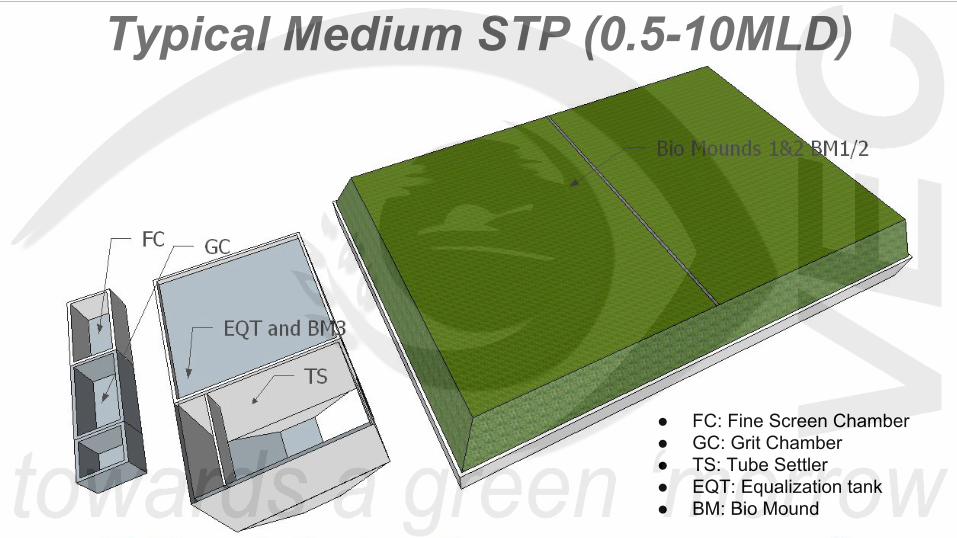
Typical Medium STP (0.5-10MLD)
● FC: Fine Screen Chamber● GC: Grit Chamber● TS: Tube Settler● EQT: Equalization tank● BM: Bio Mound

Typical Medium STP (0.5-10MLD)
● FC: Fine Screen Chamber● GC: Grit Chamber● TS: Tube Settler● EQT: Equalization tank● BM: Bio Mound

Typical Large STP >10MLD
● FC: Fine Screen Chamber● GC: Grit Chamber● CLF: Clarifiers● AD: Anaerobic Digestors● BM: Bio Mounds


MediaMedia
CAMUS-SBT Media Regeneration
Media
Organics Adsorb on Media Surface
Waste Water percolates on media
Clean water Drip down out of the media
Bacterial Colonies start growing by feeding on adsorbed organics for food,
Media
Earthworms (White) Feed on the bacterial Colonies
CO2 released
CO2 released
Media is now available for the next cycle
adsorption surface is regenerated by bacterial grazing
Grazing by earthworms creates new surface free of bacteria, converting the biomass to CO2
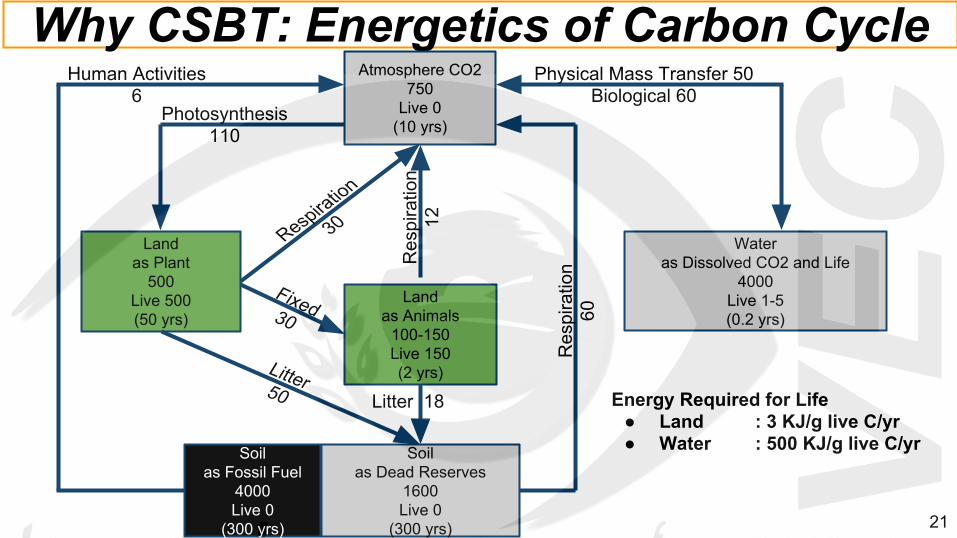
Why CSBT: Energetics of Carbon CycleAtmosphere CO2
750Live 0
(10 yrs)
Wateras Dissolved CO2 and Life
4000Live 1-5(0.2 yrs)
Soilas Dead Reserves
1600Live 0
(300 yrs)
Land as Animals
100-150Live 150(2 yrs)
Landas Plant
500Live 500(50 yrs)
Soilas Fossil Fuel
4000Live 0
(300 yrs)
Photosynthesis 110
Res
pira
tion
12
Physical Mass Transfer 50 Biological 60
Respiration
30
Fixed30
Litter50 Litter 18
Res
pira
tion
60
Human Activities6
Energy Required for Life● Land : 3 KJ/g live C/yr ● Water : 500 KJ/g live C/yr
21

Pro
cess
Che
mis
try

CSBT Reactor Configurations
Chandrashekar S, Shankar HS: Bio-Remediation of Waste Water Streams using SBT: AICHE 2009
CAMUS-SBT is designed with minimal mechanical equipment
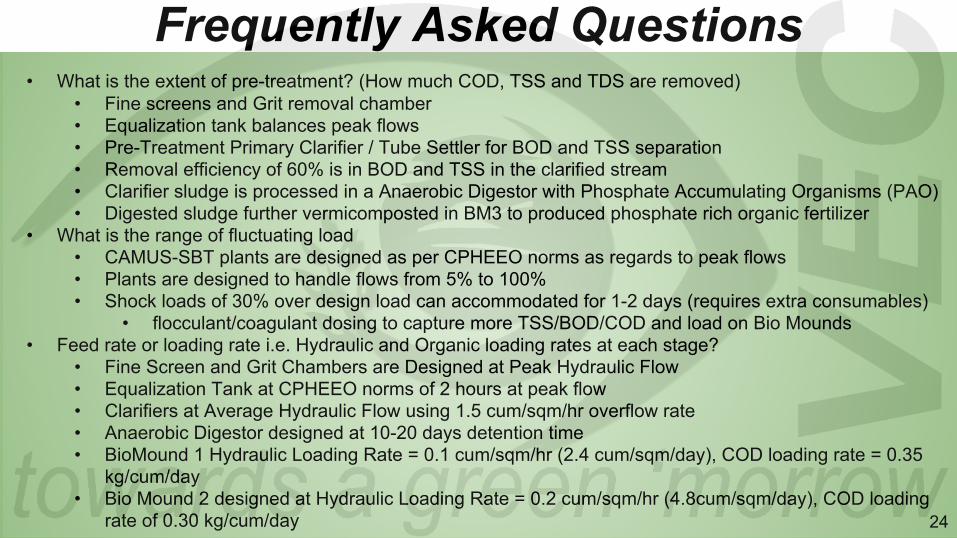
Frequently Asked Questions• What is the extent of pre-treatment? (How much COD, TSS and TDS are removed)
• Fine screens and Grit removal chamber• Equalization tank balances peak flows • Pre-Treatment Primary Clarifier / Tube Settler for BOD and TSS separation• Removal efficiency of 60% is in BOD and TSS in the clarified stream • Clarifier sludge is processed in a Anaerobic Digestor with Phosphate Accumulating Organisms (PAO)• Digested sludge further vermicomposted in BM3 to produced phosphate rich organic fertilizer
• What is the range of fluctuating load• CAMUS-SBT plants are designed as per CPHEEO norms as regards to peak flows• Plants are designed to handle flows from 5% to 100%• Shock loads of 30% over design load can accommodated for 1-2 days (requires extra consumables)
• flocculant/coagulant dosing to capture more TSS/BOD/COD and load on Bio Mounds • Feed rate or loading rate i.e. Hydraulic and Organic loading rates at each stage?
• Fine Screen and Grit Chambers are Designed at Peak Hydraulic Flow• Equalization Tank at CPHEEO norms of 2 hours at peak flow• Clarifiers at Average Hydraulic Flow using 1.5 cum/sqm/hr overflow rate• Anaerobic Digestor designed at 10-20 days detention time • BioMound 1 Hydraulic Loading Rate = 0.1 cum/sqm/hr (2.4 cum/sqm/day), COD loading rate = 0.35
kg/cum/day• Bio Mound 2 designed at Hydraulic Loading Rate = 0.2 cum/sqm/hr (4.8cum/sqm/day), COD loading
rate of 0.30 kg/cum/day 24

Frequently Asked Questions• What happens to the CAMUS- SBT plants in Monsoon?
• Rain water impinging on the Bio reactors will percolate down rapidly and captured in treated water.• Bio reactors are designed for hydraulic percolation rates of upto 5 cum/sqm/day • Heaviest 1 day rainfall ever recorded worldwide is 2.5 cum/sqm/day (Reunion Island)• Cherrapunji on average gets approximately 0.8 cum/sqm/day in monsoons• Overflow in Collection tanks ensure that the Bio Reactor/Bio Mounds is not flooded.
• What is the input and output of the CAMUS-SBT?• CAMUS-SBT plants are designed to meet CPHEEO/Client requirements for a given output.
• A comparative study of technology with respect to area and costs• upto 1 MLD,1-5MLD, 5-10 MLD, 10-50 MLD etc?
• Please see Technology Cost Slides• How are phosphates are removed in the CAMUS-SBT System?
• Phosphate removal takes place largely in Raw Sewage Tank / Clarifier / Anaerobic digestor by flocculation/coagulation/settling/bio accumulation via Phosphate accumulating organisms.
• Small amounts of Lime (pH management)+FeCl3 is added in the Raw water tank that precipitates the Phosphates as HydroxyApatite. pH of 6.5-7.5 is maintained
• In Larger plant the bottom phosphate rich sludge from Clarifier/Settlers is pumped as slurry to BM3 and is converted to vermi compost.
• In smaller plants the inorganic sludge at the bottom of Raw Sewage tank is periodically harvested (Once in 4 years)
• The biomounds themselves remove approximately 2mg/L 25

Our Partner Initiatives• Zerodor Waterless Urinals
• Ekam Eco Solutions, IIT Delhi• DrySan Waterless Toilet
• CTECH, IDC IIT Bombay • Air Quality (AQI) Monitoring System
• Indiaspend, IIT Bombay• Water Quality Monitoring System
• Logic Ladder • Intercepted / Small Bore Sewers
• Clearford