waste stream study & waste conversion technologies review
TRANSCRIPT
Waste Stream Study &
Waste Conversion Technologies Review
FINAL DRAFT
Presented to
Prepared by:
SloanVAZQUEZLLC Municipal Solid Waste & Recycling Advisors
18006 Skypark Circle, Suite 205 Irvine, CA 92614
Office: 866.241.4533 Fax: 714.276.0625
and
15230 Burbank Blvd, Suite 103
Sherman Oaks, CA 91411 Office: 818.267.511
January 2012


SloanVAZQUEZ,LLC
Prepared for the City of Fort Collins Waste Stream Analysis Study & January 2012 – Final Draft Waste Conversion Technologies Review i
TABLE OF CONTENTS 1.0 INTRODUCTION ................................................................................................................ 1
1.1 Background .............................................................................................................................. 1 1.2 Report Structure ....................................................................................................................... 1
2.0 Waste Stream Study ......................................................................................................... 2 2.1 Waste Composition Study Approach ......................................................................................... 2 2.2 Waste Stream Study Results ..................................................................................................... 3 2.3 Material Streams and Landfill Alternatives ................................................................................ 6 2.4 Market Value of Recyclable Materials that are Currently Landfilled ........................................... 7 2.5 Environmental and Economic Impacts of Landfill Disposal Reduction ......................................... 7
2.5.1 Material Recovery Facility (MRF) Process to Reduce Landfilled Waste ................................. 8 2.5.2 Green House Gas Reduction from Landfill Disposal Reduction ............................................. 9 2.5.3 Local Economic Impacts of Landfill Disposal Reduction ....................................................... 10 2.5.4 The Cost of Landfill Disposal Reduction ............................................................................... 11
3.0 WASTE Conversion Technologies Review ........................................................................ 12 3.1 Overview ................................................................................................................................ 12
3.1.1 What Are Conversion Technologies? ................................................................................... 12 3.1.2 Why Are Conversion Technologies of Interest Now?........................................................... 13 3.1.3 What is the Status of Conversion Technologies in the United States? ................................ 13 3.1.4 Identification and General Description of Conversion Technologies ................................... 17
3.2 Thermal (Gasification/Pyrolysis) ............................................................................................. 21 3.2.1 Technical Aspects ................................................................................................................. 21 3.2.2 Environmental Aspects ......................................................................................................... 22 3.2.3 Institutional Aspects ............................................................................................................. 23
3.3 Biological (Anaerobic Digestion) .............................................................................................. 24 3.3.1 Technical Aspects ................................................................................................................. 24 3.3.2 Environmental Aspects ......................................................................................................... 26 3.3.3 Institutional Aspects ............................................................................................................. 26
3.4 Conversion Technology Project Recommendations .................................................................. 28 3.4.1 Introduction .......................................................................................................................... 28 3.4.2 Project 1 – Demonstration-Scale Anaerobic Digestion Facility (~15 tpd) ............................ 30 3.4.3 Project 2 – Small-Scale Thermal Facility (~25-100 tpd) ........................................................ 32 3.4.4 Project 3 – Future Commercial-Scale Gasification or Anaerobic Digestion Facility
(~300 - 400 tpd) .................................................................................................................... 35 3.4.5 Project 4 – Food Waste Digestion at the Drake Water Reclamation Facility ....................... 37
4.0 CONCLUSIONS ................................................................................................................ 39
5.0 RECOMMENDATIONS ..................................................................................................... 41
SloanVAZQUEZ,LLC
Prepared for the City of Fort Collins Waste Stream Analysis Study & January 2012 – Final Draft Waste Conversion Technologies Review ii
6.0 APPENDICES ................................................................................................................. A-1 6.1 Appendix A – Fort Collins Waste Composition Methodology 6.2 Appendix B – Waste Composition Studies
6.2.1 Boulder County – 2010 Waste Composition Study 6.2.2 Larimer County – Two-Season Waste Composition Study
6.3 Appendix C – WARM GHG Emissions Analysis
TABLE OF TABLES
Table 1 – Fort Collins 2012 Waste Composition* ................................................................................................... 3 Table 2 –Recycling Facility Outputs ........................................................................................................................ 6 Table 3 – Landfilled Materials with Positive Market Value .................................................................................... 7 Table 4 – Annualized Estimate of Value for Positive Value Materials in Fort Collins’ Waste Stream .................... 7 Table 5 – Volume Allocation of Recycling Facility Outputs ..................................................................................... 8 Table 6 – % of Material Type Allocated to Landfill Alternative .............................................................................. 9 Table 7 – Contribution to Local Economy ............................................................................................................. 10 Table 8 – Conversion Technology Vendors (1) ....................................................................................................... 17
TABLE OF CHARTS Chart 1 – Fort Collins 2012 Waste Composition ..................................................................................................... 4 Chart 2 – Fort Collins Waste Tonnage by Material Category .................................................................................. 5
TABLE OF PICTURES
Picture 1 – Enerkem (Edmonton, Alberta, Canada) .............................................................................................. 14 Picture 2 – Plasco’s Demonstration Plant, Ottawa ............................................................................................... 14 Picture 3 – BIOFermTM Energy Systems (University of Wisconsin) ....................................................................... 15 Picture 4 – Zero Waste Energy (San Jose, California) ........................................................................................... 15 Picture 5 – Fulcrum BioEnergy (McCarran, Nevada) ............................................................................................ 16 Picture 6 – INEOS New Planet BioEnergy (Vero Beach, Florida) ........................................................................... 16 Picture 7 – SMARTFERM Dry Fermentation System Rendering & Photo ............................................................. 32 Picture 8 – International Environmental Systems ................................................................................................ 33 Picture 9 – SynTerra Energy .................................................................................................................................. 33 Picture 10 – Crystal Creek Energy ......................................................................................................................... 33
TABLE OF FIGURES
Figure 1 – Typical Gasification Flow Diagram ....................................................................................................... 19 Figure 2 – Typical Anaerobic Digestion Flow Diagram .......................................................................................... 20 Figure 3 – System Integration Possibilities ........................................................................................................... 29

SloanVAZQUEZ,LLC
Prepared for the City of Fort Collins Waste Stream Analysis Study & January 2012 – Final Draft Waste Conversion Technologies Review 1
1.0 INTRODUCTION
1.1 BACKGROUND The City of Fort Collins (City) engaged the services of Sloan Vazquez and Clements Environmental (Project Team) to conduct a Waste Stream Study and a Waste Conversion Technologies Review. The purpose of the Waste Stream Study was to determine how much more of the City’s waste that is now going to a landfill can be diverted towards materials markets or to potential energy conversion systems. The purpose of the Waste Conversion Technologies Review was to identify at least two of the most feasible types of systems or technologies in which the City may wish to invest for future waste stream management.
Accordingly, this Report provides the following:
• Identification of specific discards from the residential, commercial and Construction and Demolition (C&D) sectors that are still available for recovery and quantification of their commodity value and/or energy generation capability;
• An economic analysis of how to optimize the recovery of the landfill-disposed materials and professional recommendations for “highest and best” use in current or future recovery systems;
• Quantification of the total amount of discarded or under-utilized materials that is locally available, which may provide “feedstock” for a waste-to-energy processing facility.
• Examination of options for various technologies designed to capture more value from discards.
It is important to note that any references to specific products, systems, or companies in this report are for factual purposes only and are not intended to represent an endorsement by the City of Fort Collins.
1.2 REPORT STRUCTURE This Report is organized as follows:
1. Introduction 2. Waste Stream Study 3. Waste Conversion Technologies Review 4. Recommendations
Section 1 provides an introduction to the report with a brief background and purpose. Section 2 includes a waste stream study including an estimate of tonnage, a waste composition, and the value of materials currently discarded. Section 3 includes the identification of the most feasible waste conversion technologies. And finally, Section 4 provides a summary of the Project Team’s Recommendations.

SloanVAZQUEZ,LLC
Prepared for the City of Fort Collins Waste Stream Analysis Study & January 2012 – Final Draft Waste Conversion Technologies Review 2
2.0 WASTE STREAM STUDY In order to plan for the City’s future municipal solid waste (MSW) management needs, it is important that the City understand both the volume and the composition of MSW that is currently being disposed in landfills.
For solid waste planning to be effective, consideration must be given to the many factors that can, and do, cause wide fluctuations in the volume and composition of MSW. During the past five years, the economic recession and the collapse of the housing and construction industries has rendered a decrease in the volume of MSW and caused extraordinary demand and price fluctuations in the recycling markets. Concurrent with the economic decline, the U.S. has seen a rising “green” ethos that has spurred the success of municipal recycling programs, changed manufacturing practices, and reduced consumption. This combination of events has made the forecasting of MSW volume and composition a tricky, albeit achievable, task.
2.1 WASTE COMPOSITION STUDY APPROACH The Project Team developed a new, data-based waste composition (2012 Waste Composition) of the waste generated from the City that is currently landfilled. The 2012 Waste Composition is based primarily upon waste composition studies prepared for the Boulder County Resource Conservation Division and for Larimer County. In addition, the Project Team referred to tonnage data collected by the City, anecdotal information gathered from Larimer County Public Works/Solid Waste (including the observation of loads disposed at the Larimer County Landfill), local waste collection companies, and recyclers.
Our analysis and interpretation of the methods and results of the Boulder and Larimer County studies confirmed their validity as reasonable and reliable sources for the development of a new data-based waste composition for the City. In the Boulder and Larimer County studies, the Project Team determined that the sampling plans, sampling procedures, field data collection, and statistical analysis were developed and implemented to assure that the waste composition results were statistically representative of the total disposed waste stream and statistically valid.
The 2012 Waste Composition is primarily derived from the integration of the two heterogeneous data sources. The Larimer County study was completed pre-recession (in 2007) and is primarily based upon 2006 data. The Boulder County study was completed in 2010 and captures the effects of waste generation and composition wrought by changing economic and environmental conditions. Because the communities share many similar geographic, demographic, and economic characteristics, the methodical combination of results from the two studies projects a reasonable waste composition for City’s planning purposes. A detailed explanation of the methodology used to develop the City’s waste composition is provided in Appendix A. The Boulder and Larimer County studies are included as Appendix B.

SloanVAZQUEZ,LLC
Prepared for the City of Fort Collins Waste Stream Analysis Study & January 2012 – Final Draft Waste Conversion Technologies Review 3
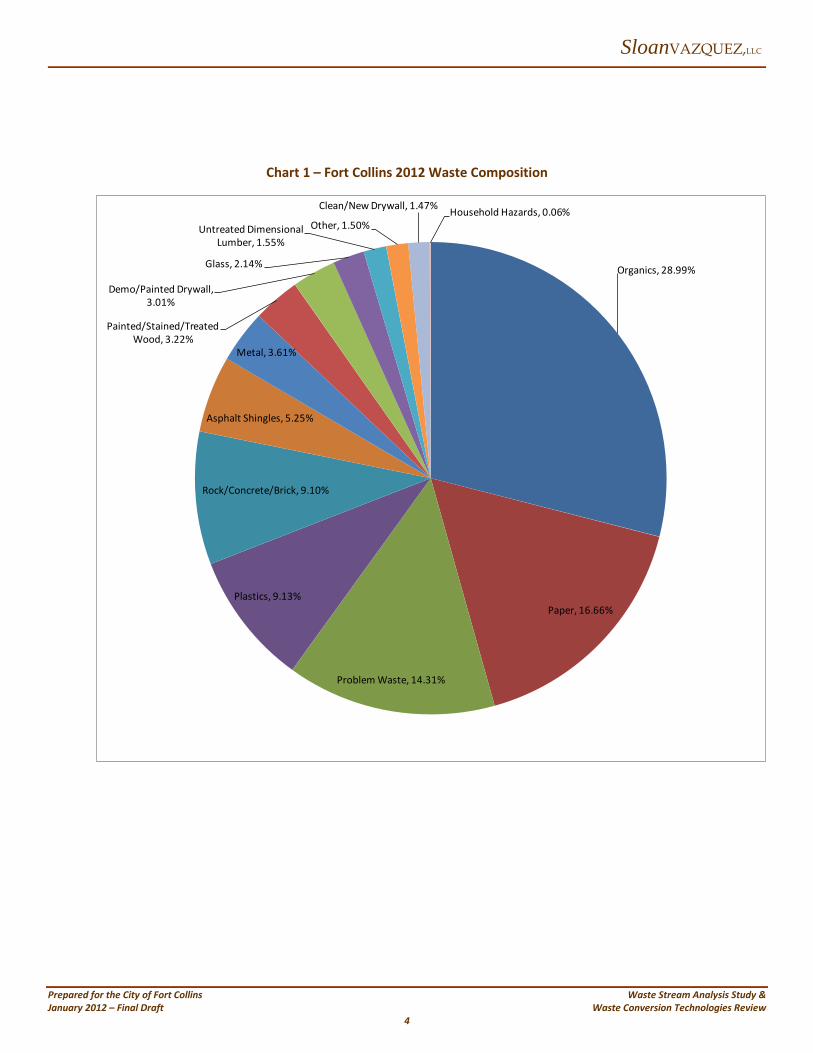
2.2 WASTE STREAM STUDY RESULTS The 2012 Waste Composition for the City is presented in Table 1 as well as in Chart 1. The waste is categorized into 14 material types. A percentage of total waste is provided by material type for each waste stream i.e. residential, commercial, and C&D as well as for the total waste.
Table 1 – Fort Collins 2012 Waste Composition*
Material Residential Commercial C&D Total Tons
Paper 20.39% 26.67% 0.38% 16.66% 21,658 Plastics 12.31% 12.29% 0.45% 9.13% 11,869 Metal 3.54% 5.24% 2.17% 3.61% 4,693 Glass 2.34% 2.79% 1.18% 2.14% 2,782 Organics 40.12% 33.40% 5.08% 28.99% 37,687 Rock/Concrete/Brick 0.85% 1.26% 31.22% 9.10% 11,830 Asphalt Shingles 0.49% 0.72% 18.02% 5.25% 6,825 Wood (Painted/Stained/Treated) 0.30% 0.44% 11.06% 3.22% 4,186 Untreated Dimensional Lumber 0.15% 0.21% 5.31% 1.55% 2,015 Clean/New Drywall 0.14% 0.20% 5.06% 1.47% 1,911 Demo/Painted Drywall 0.28% 0.42% 10.34% 3.01% 3,913 Problem Waste1 18.84% 15.94% 4.73% 14.31% 18,603 Other 0.19% 0.28% 4.98% 1.50% 1,950 Household Hazardous Waste 0.06% 0.13% 0.00% 0.06% 78 TOTAL 100.0% 100.0% 100.00% 100.00% 130,000
*Please see Appendix A for details regarding the methodology used to develop the 2012 Waste Composition.
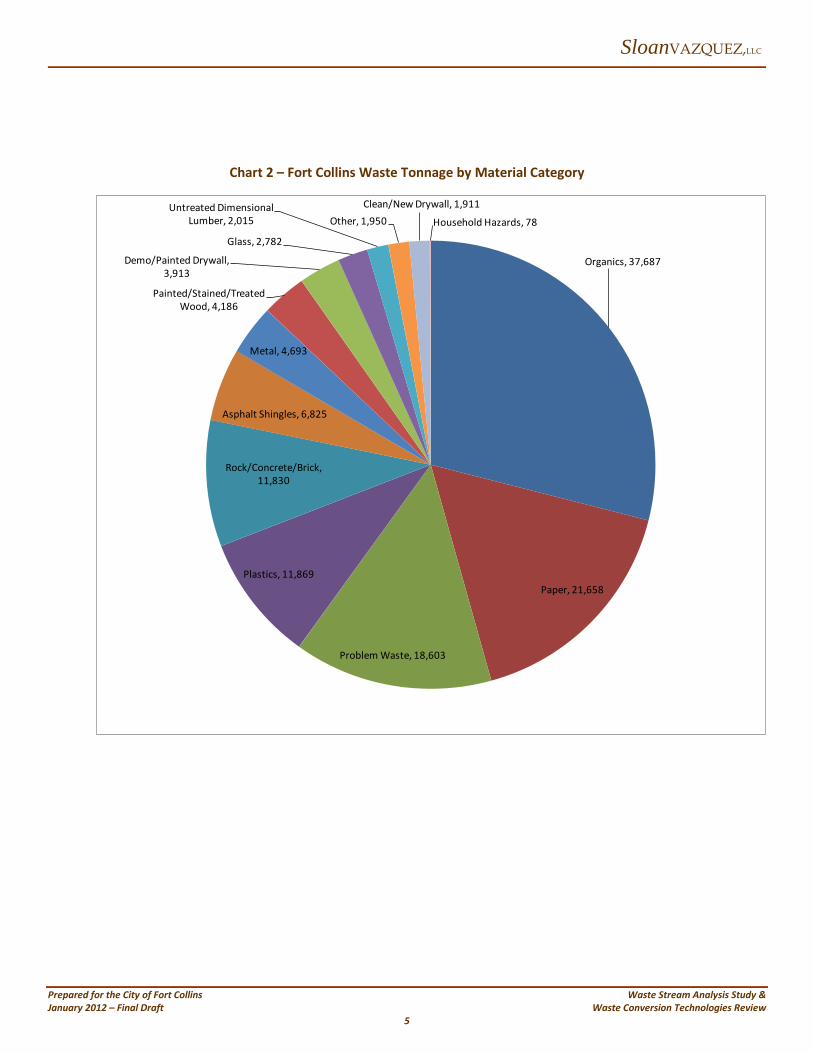
According to data collected by the City, approximately 130,000 tons of municipal solid waste generated in the City were landfill disposed. Applying the 2010 Waste Composition to the City’s landfilled tonnage produces the weights, in tons, of the specified material types as represented in Table 1, Column entitled Tons.
For the City’s planning purposes, the Project Team chose to base recovery and recycling projections upon the treatment/processing of the commingled waste stream. That is, the direct processing and separation of mixed commercial, residential and industrial materials.
1 Problem Waste includes Carpet/Padding, Batteries, Rubber, Tires, Diapers/Sanitary Products, Electronics, Furniture/Bulky Items, and Other Inorganics.
SloanVAZQUEZ,LLC
Prepared for the City of Fort Collins Waste Stream Analysis Study & January 2012 – Final Draft Waste Conversion Technologies Review 4
Chart 1 – Fort Collins 2012 Waste Composition
Organics, 28.99%
Paper, 16.66%
Problem Waste, 14.31%
Plastics, 9.13%
Rock/Concrete/Brick, 9.10%
Asphalt Shingles, 5.25%
Metal, 3.61%
Painted/Stained/Treated Wood, 3.22%
Demo/Painted Drywall, 3.01%
Glass, 2.14%
Untreated Dimensional Lumber, 1.55%
Other, 1.50%
Clean/New Drywall, 1.47% Household Hazards, 0.06%
SloanVAZQUEZ,LLC
Prepared for the City of Fort Collins Waste Stream Analysis Study & January 2012 – Final Draft Waste Conversion Technologies Review 5
Chart 2 – Fort Collins Waste Tonnage by Material Category
Organics, 37,687
Paper, 21,658
Problem Waste, 18,603
Plastics, 11,869
Rock/Concrete/Brick, 11,830
Asphalt Shingles, 6,825
Metal, 4,693
Painted/Stained/Treated Wood, 4,186
Demo/Painted Drywall, 3,913
Glass, 2,782
Untreated Dimensional Lumber, 2,015 Other, 1,950
Clean/New Drywall, 1,911
Household Hazards, 78

SloanVAZQUEZ,LLC
Prepared for the City of Fort Collins Waste Stream Analysis Study & January 2012 – Final Draft Waste Conversion Technologies Review 6
2.3 MATERIAL STREAMS AND LANDFILL ALTERNATIVES The 2012 Waste Composition identifies fourteen (14) material categories. At the onset of the study, only eight (8) categories were selected, with C&D material listed as a single-segment of the eight. Subsequently, because of the number of significant C&D subsets, the C&D segment was divided into six (6) separate categories which were included as separate components in the 2012 Waste Composition.
To accomplish the City’s goal of reducing the amount of landfilled MSW, the Project Team developed an operating proforma for a conceptual waste/recycling management facility where the targeted materials and waste streams could be delivered, processed, and diverted from landfill disposal.
As conceived for the purpose of this study, the facility will process the mixed waste stream (see Table 2), into four categories, as follows:
1. Feedstock for waste conversion technology, 2. Marketable fiber, plastics, glass, and metals, 3. Compostable organic materials, 4. Items recovered for reuse.
The conceptual facility was designed for the practicable, economically feasible recovery, reuse, and recycling of the City’s currently landfilled MSW. As conceived, the use of the facility, as applied to the 2012 Waste Composition, will reduce the City’s landfilled waste from 130,000 tons per year to 52,600 tons per year and send 77,400 tons that is currently landfilled into productive uses, as shown in Table 2.
Table 2 –Recycling Facility Outputs
Landfill Alternatives Tons %
Waste/Energy Conversion 27,500 21.2% Recycling Markets 27,850 21.4% Compost/Organic Processes 12,000 9.2% Reuse/Re-purpose 10,500 7.7% TOTAL 77,400 59.5%
In summary, of the 130,000 annual tons disposed in landfills, 77,400 tons or 59.5% may be recovered, recycled or reused. The remaining 52,600 or 40.5% will be landfilled.

SloanVAZQUEZ,LLC
Prepared for the City of Fort Collins Waste Stream Analysis Study & January 2012 – Final Draft Waste Conversion Technologies Review 7
2.4 MARKET VALUE OF RECYCLABLE MATERIALS THAT ARE CURRENTLY LANDFILLED
Of the fourteen (14) material categories identified in the 2012 Waste Composition, only four demonstrate a continuously positive market value. These four material types represented approximately 44% of the currently landfilled materials.
Table 3 – Landfilled Materials with Positive Market Value
Materials %
Paper (cardboard, news, mixed paper, etc.) 16.66% Plastics (soda, juice, water, milk bottles & film) 9.13% Metals (aluminum & tin cans, ferrous & non-ferrous) 3.61% Problem Wastes (including large appliances, metals) 14.31% TOTAL 43.71%
Of the 130,000 tons that are currently disposed, the annualized market value of these four categories is $4,025,4762.
Table 4 – Annualized Estimate of Value for Positive Value Materials
in Fort Collins’ Waste Stream
Materials Tons Price/Ton Value
Paper 16.66% $100 $866,320 Plastics 9.13% $300 $2,136,420 Metals 3.61% $300 $985,530 Problem Waste 14.31% $5 $37,206 TOTAL 43.71% $4,025,476
Though these identified categories, percentages, and tonnage are realistic projections of the MSW content, the recovery and sale of 100% of these materials is improbable. Practicable recovery rates and values for all material categories are included in the financial proforma as described in Section 2.5.
2.5 ENVIRONMENTAL AND ECONOMIC IMPACTS OF LANDFILL DISPOSAL REDUCTION
In order to project the local economic impact of recycling and reusing the recoverable portion of the City’s currently landfilled MSW, the Project Team developed a cost proforma to capture the capital and operating costs of a multiple-process system capable of processing the City’s entire waste stream.
2 The value of these commodities is a conservative estimate of market prices in January 2012 obtained by contacting local buyers whenever possible and from consulting Waste & Recycling News indices for the region.

SloanVAZQUEZ,LLC
Prepared for the City of Fort Collins Waste Stream Analysis Study & January 2012 – Final Draft Waste Conversion Technologies Review 8
Significant reduction in landfill disposal is not likely without significant investment in MSW management infrastructure, e.g. conversion technology, waste/recycling processing, etc.
2.5.1 MATERIAL RECOVERY FACILITY (MRF) PROCESS TO REDUCE LANDFILLED WASTE As conceived in the cost proforma, the recycling processing plant will receive and process all of the City’s 130,000 tons per year of MSW. The plant will process approximately 35 tons per hour, working two, eight-hour shifts in a five-day work-week, and processing about 500 tons per day. With the addition of a third shift, the facility has sufficient capacity to process tonnage currently going to other MRFs.
As presented in Table 5, the MRF will generate four primary outputs.
Table 5 – Volume Allocation of Recycling Facility Outputs
Material Tons CT(*) Recycle(**) Organics(+) Reuse(++) Recovered Disposed
Paper 21,658 8,663 8,663 0 0 17,326 4,332 Plastics 11,869 0 7,121 0 0 7,121 4,748 Metal 4,693 0 3,285 0 0 3,285 1,408 Glass 2,782 0 835 0 566 1,391 1,391 Organics 37,687 18,844 0 9,422 0 28,265 9,422 Rock/Concrete/Brick 11,830 0 0 0 5,915 5,915 5,915 Asphalt Shingles 6,825 0 0 0 1,706 1,706 5,119 Wood (Painted/Stained/Treated)
4,186 0 0 0 0 0 4,186
Untreated Dimensional Lumber
2,015 0 0 1,612 0 1,612 403
Clean/New Drywall 1,911 0 0 956 0 956 956 Demo/Painted Drywall 3,913 0 0 0 0 0 3,913 Problem Waste1 18,603 0 7,441 0 1,860 9,302 9,302 Other 1,950 0 0 0 0 0 1,950 Household Hazardous Waste
78 0 0 0 0 0 78
TOTAL 130,000 27,507 27,833 11,989 10,038 77,367 52,633
NOTES: * CT – Conversion Technology ** Recycle – Traditional recyclables; paper, plastics, metals, etc. + Organics – Yard waste, tree trimmings, food waste, etc. ++ Reuse – Inert materials, appliances, etc.
Considering the current capabilities of solid waste recycling technology and mechanical systems, the following allocation of materials (as listed in Table 5) into value-added streams can be reasonably

SloanVAZQUEZ,LLC
Prepared for the City of Fort Collins Waste Stream Analysis Study & January 2012 – Final Draft Waste Conversion Technologies Review 9
expected. Please note that these material had been destined to disposal at a landfill and therefore do not include materials that are currently being recycled.
Table 6 – % of Material Type Allocated to Landfill Alternative
Material % Diverted to Landfill Alternative
Paper 40% into Energy production 40% into secondary recycling markets Plastics 60% into secondary recycling markets Glass 30% into secondary recycling markets 20% into reuse (e.g. pipe-bedding, trench drains, etc. Organics 50% into Energy conversion technology 25% into soil amendments and composting Rock/Concrete 50% into reuse Asphalt 25% into reuse Treated Wood Disposed Lumber 80% into soil amendment and composting Clean Drywall 50% into soil amendment and composting Demo Drywall Disposed Problem Waste1 40% into secondary recycling markets 10% into reuse HHW Disposed
2.5.2 GREEN HOUSE GAS REDUCTION FROM LANDFILL DISPOSAL REDUCTION According to the WARM Model Greenhouse Gas (GHG) Emission Analysis, the implementation of the processes to reduce landfill disposal will reduce total GHG emission.
The total GHG emission reductions are equivalent to the following:
• Removing annual emissions from 16,124 passenger vehicles • Conserving 9,992,222 gallons of gasoline • Conserving 36,679,783 cylinders of propane used for home barbeques • Conserving 460 railway cars of coal
Please see Appendix C for the WARM Model Greenhouse Gas (GHG) Analysis.
SloanVAZQUEZ,LLC
Prepared for the City of Fort Collins Waste Stream Analysis Study & January 2012 – Final Draft Waste Conversion Technologies Review 10
2.5.3 LOCAL ECONOMIC IMPACTS OF LANDFILL DISPOSAL REDUCTION The development of local infrastructure to process the City’s MSW, reduce landfill disposal, and create value-added recyclable outputs will produce the following:
a) $29,000,000 Capital Investment in local infrastructure − $7.5M Land & Buildings − $12.0M Recycling Processing Equipment − $6.0M Energy Conversion Equipment − $2.25M Ancillary Processing Equipment − $1.1M Loaders, Lifts, Sweepers, Trucks, Etc.
b) Direct creation of 74 “green” jobs for the operation of recycling processing and energy
conversion process: − Material Processors 50 − Equipment Operators 12 − Mechanics 4 − Supervisors 2 − Administration 3 − Managers 3
74
Indirectly, additional jobs will be created as a result of the economic activity generated by the recycling and energy conversion plants, including; truck drivers to transport plant outputs, industrial service jobs to meet the operational requirements of the plant, and retail service jobs to meet the consumer needs of the new workforce.
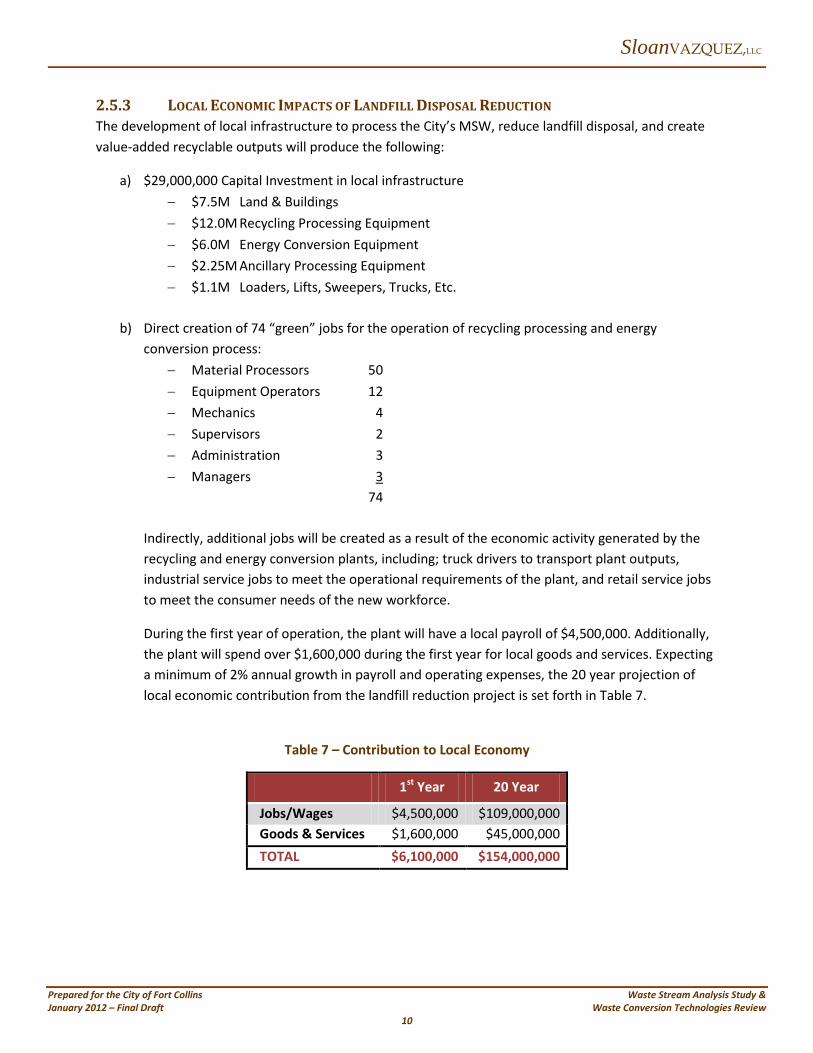
During the first year of operation, the plant will have a local payroll of $4,500,000. Additionally, the plant will spend over $1,600,000 during the first year for local goods and services. Expecting a minimum of 2% annual growth in payroll and operating expenses, the 20 year projection of local economic contribution from the landfill reduction project is set forth in Table 7.
Table 7 – Contribution to Local Economy
1st Year 20 Year
Jobs/Wages $4,500,000 $109,000,000 Goods & Services $1,600,000 $45,000,000 TOTAL $6,100,000 $154,000,000

SloanVAZQUEZ,LLC
Prepared for the City of Fort Collins Waste Stream Analysis Study & January 2012 – Final Draft Waste Conversion Technologies Review 11
2.5.4 THE COST OF LANDFILL DISPOSAL REDUCTION In order to implement the conceptual landfill disposal reduction, solid waste service fees will require adjustment to reflect the described capital and operating costs. Assuming that landfill disposal costs constitute twenty-five percent (25%) of the total cost of solid waste service fees paid by the City’s residents and businesses, it is estimated that service costs will increase by approximately forty percent (40%). For example, a resident that currently pays $15 per month for solid waste service will pay $21 per month after the described landfill disposal reduction plan is implemented.

SloanVAZQUEZ,LLC
Prepared for the City of Fort Collins Waste Stream Analysis Study & January 2012 – Final Draft Waste Conversion Technologies Review 12
3.0 WASTE CONVERSION TECHNOLOGIES REVIEW The purpose of the this portion of the study is to evaluate the feasibility of new technologies to reduce solid waste currently being disposed at the Larimer County Landfill, and to assist in achieving the City’s mission to meet the solid waste disposal needs of its residents and businesses through strategic planning, efficient, operations, sound environmental practices, innovation, and technology.
Specifically, the Project Team determined the most feasible types of energy-conversion systems and/or technologies in which the City may wish to invest for future waste stream management. The following factors were considered in the evaluation:
• CT throughput capacities and residuals management
• Quantification of energy generation
• Scalability of the system
• Environmental and health impacts and mitigations
• Permitting procedures and issues
• Diversion credits
• CT tipping fees compared to projected landfill fees
• Capitol and operational costs
• Financing options including private/public partnership potential
It important to reiterate that any references to specific products, systems, or companies in this report are for factual purposes only and are not intended to represent an endorsement by the City of Fort Collins.
3.1 OVERVIEW
3.1.1 WHAT ARE CONVERSION TECHNOLOGIES? Conversion technologies include a wide array of thermal, biological, chemical, and mechanical technologies capable of converting municipal solid waste (MSW) into energy such as steam and electricity; fuels such as hydrogen, natural gas, ethanol and synthetic diesel; and other useful products and chemicals.
Most conversion technologies can be described as having three separate and distinct components:
1. front-end MSW preprocessing or feedstock preparation 2. the conversion unit itself, and 3. the energy/chemicals production system
Front-end preprocessing is used to prepare the solid waste for treatment by helping to separate out any recyclables. The level of preprocessing varies depending on technology. Shredding, grinding, and/or

SloanVAZQUEZ,LLC
Prepared for the City of Fort Collins Waste Stream Analysis Study & January 2012 – Final Draft Waste Conversion Technologies Review 13
drying the MSW may be required to create a more homogeneous feedstock. The energy production module can be a gas turbine, boiler, or reciprocating engine for power production or a system that converts the biogas or syngas into fuels such as ethanol and Compressed Natural Gas (CNG).
These technologies not only create beneficial products, but have the potential to reduce greenhouse gas emissions and other air pollutants, from disposal and transportation avoidance as well as fuel/electricity offsets.
3.1.2 WHY ARE CONVERSION TECHNOLOGIES OF INTEREST NOW? There are several driving factors contributing to the proliferation of CT projects across the US and Canada:
1. Decreasing capacity and increasing tipping fees for landfill disposal of MSW 2. Desire to reduce dependence on landfills and waste exporting, maintaining local control over
disposal 3. Ability to recover materials not feasibly recyclable for beneficial use 4. Demand for increased level of recycling and diversion from landfills to reach “Zero Waste” 5. Ability to manage excess biomass and organic wastes (including biosolids, agricultural residue,
etc.) 6. Demand for renewable energy, especially local, and higher values for this energy due to
renewable energy credits and other mechanisms 7. Demand for low-carbon, renewable fuels such as: CNG, ethanol, and synthetic diesel and
gasoline 8. Demand for reduction in GHG emissions to combat Global Warming 9. Desire for energy independence from foreign oil, especially from troubled and dangerous areas
of the world 10. Availability of grants and low-interest loans for CT projects 11. Strong interest from entrepreneurs and the investment community in renewable energy as a
major growth industry of the future 12. Diversification of mid-level and major waste management companies into the energy field 13. Public and political perception that this is the “right” thing to do 14. Desire to reduce pollution and environmental impacts from landfill disposal 15. Creation of “green collar” jobs
3.1.3 WHAT IS THE STATUS OF CONVERSION TECHNOLOGIES IN THE UNITED STATES? There are scores of commercial-scale conversion technology facilities operating worldwide. To date, growth in this industry has primarily been in Europe and Japan, where hundreds of plants are in operation. However, in recent years, several commercial projects have made significant progress in North America. Below are several examples of projects that have recently been completed or are currently under construction:
• Enerkem (Edmonton, Alberta, Canada): The Enerkem Edmonton Facility is designed to convert municipal solid waste to biofuels (ethanol). Construction began in 2010 and is expected to be

SloanVAZQUEZ,LLC
Prepared for the City of Fort Collins Waste Stream Analysis Study & January 2012 – Final Draft Waste Conversion Technologies Review 14
completed with the start of operations in 2012. The Advanced Energy Research Facility at the same location had its grand opening in June of 2011. The picture below shows the progress of construction as of August 2011.
Picture 1 – Enerkem (Edmonton, Alberta, Canada)
• Plasco Energy Group (Ottawa, Ontario, Canada and Salinas, California): Plasco Energy Group is in the process of developing a 400 tpd plasma-arc gasification plant in Salinas, CA. The Salinas Valley Solid Waste Authority chose a CEQA consultant in the summer of 2011 and recently gave approval to begin the preparation of an Environmental Impact Report (EIR).
This picture below shows Plasco’s demonstration plant in Ottawa. This facility began operating in 2007 and has recently been reconfigured to demonstrate continuous commercial performance. The Ottawa City Council also approved a long-term contract with Plasco in December 2011.
Picture 2 – Plasco’s Demonstration Plant, Ottawa
• BIOFermTM Energy Systems (University of Wisconsin - Oshkosh): Construction on the first dry fermentation system in the United States began in September of 2010. The facility accepts food, agriculture, and yard waste, primarily from the University. Biogas from the anaerobic digestion of organic wastes is collected and used to generate electricity for use on campus. The facility began operations in the fall of 2011. The picture below shows the completed facility in Oshkosh, Wisconsin.

SloanVAZQUEZ,LLC
Prepared for the City of Fort Collins Waste Stream Analysis Study & January 2012 – Final Draft Waste Conversion Technologies Review 15
Picture 3 – BIOFermTM Energy Systems (University of Wisconsin)
• Zero Waste Energy (San Jose, California): The first Kompoferm facility to be constructed in the United States will be located in San Jose, CA. Eventually, the City of San Jose plans to process all of its commercial organic waste at the site, over 270,000 tons per year. In June, the city adopted the Mitigated Negative Declaration for the project and authorized the City Manager to execute a ground lease with Zero Waste Energy Development Company for the construction and operation of the facility on Water Pollution Control Plant land. Groundbreaking for this project was in September 2011. The picture below shows a rendering of the facility.
Picture 4 – Zero Waste Energy (San Jose, California)
• Fulcrum BioEnergy (McCarran, Nevada): Construction on a municipal solid waste to biofuels plant was set to begin by the end of 2011. Located in the Tahoe-Reno Industrial Center, in the City of McCarran, Storey County, Nevada, the Plant will produce up to 10.5 million gallons of ethanol per year.
Fulcrum has already obtained the necessary local and state regulatory permits necessary to begin site preparation. They have also begun detailed engineering of the plant design,

SloanVAZQUEZ,LLC
Prepared for the City of Fort Collins Waste Stream Analysis Study & January 2012 – Final Draft Waste Conversion Technologies Review 16
contracted for feedstock and have entered into an off-take agreement for the full output of the plant. The projected completion date of the plant is the second half of 2013. The photo below shows a rendering of the plant.
Picture 5 – Fulcrum BioEnergy (McCarran, Nevada)
• INEOS New Planet BioEnergy (Vero Beach, Florida): INEOS will convert organic material into a syngas, which will then be converted to ethanol through fermentation. The project construction was 30% complete as of October 2011. The project is currently on schedule to be mechanically complete by April 2012 and operating in the second half of the year. The photo below shows the status of construction in October 2011.
Picture 6 – INEOS New Planet BioEnergy (Vero Beach, Florida)

SloanVAZQUEZ,LLC
Prepared for the City of Fort Collins Waste Stream Analysis Study & January 2012 – Final Draft Waste Conversion Technologies Review 17
3.1.4 IDENTIFICATION AND GENERAL DESCRIPTION OF CONVERSION TECHNOLOGIES Table 8 lists CT vendors that have been identified in the most recent search efforts. Although the list provided in Table 1 does not capture all possible vendors, it represents a broad spectrum of conversion technologies, including companies that are more established in the industry and that have achieved the greatest level of development (including, in several cases, commercial operation overseas and in Canada). Companies that are highlighted submitted responses to the County of Los Angeles Department of Public Works Request for Expression of Interest distributed in June 2011.
Table 8 – Conversion Technology Vendors (1)
Thermal Processing Biological Processing
Gasification Bioengineering Resources, Inc./New Planet Energy/Ineos Bio CBES Global, LLC Crystal Creek Energy Dynecology Ebara Corporation Ecosystems Projects EcoTech Fuels, LLC Enerkem Entech Solutions Envirepel Energy, LLC Global Alternative Green Energy Global Energy Solutions Global Recycling Group Green Energy Corporation Holloway Environmental/Entech ILS Partners/Pyromex Interstate Waste Technologies (Thermoselect) KAME/DePlano MaxWest Environmental Systems Mustang Renewable Power Ventures (Waste 2 Energy) Primenergy Princeton Environmental Group Taylor Biomass Taylor Recycling Facility Thermogenics Urbaser, Inc. (Energos AS) Waste Gasification Systems / Allan Environmental Waste to Energy, LLC/BioEnergy Design, LLC World Waste Technologies Ze-Gen Zeros Technology Holding Zero Waste Energy Systems
Anaerobic Digestion ArrowBio Arrow Ecology and Engineering Bekon BioFERM Biogas Energy, Inc. Canada Composting CCI BioEnergy Clean World Partners CR&R, Inc. with Organic Waste Systems (DRANCO) Ecocorp Harvest Power KAME/DePlano Mustang Renewable Power Ventures (Bekon) New Bio Orgaworld Ros Roca Envirotec Strategic Management Group w/ Entec Biogas USA Urbaser, Inc. (Valorga) Vagron Waste Recovery Systems, Inc. (Urbaser/Valorga) Zero Waste Energy, LLC (Kompoferm) Aerobic Digestion/Composting Civic Environmental Systems Conporec Mining Organics Management

SloanVAZQUEZ,LLC
Prepared for the City of Fort Collins Waste Stream Analysis Study & January 2012 – Final Draft Waste Conversion Technologies Review 18
Plasma Gasification AdaptiveARC Alter NRG Corporation / Westinghouse BioGold Fuels Corporation / Alter NRG
Environmental Energy Resources/ SNC-Lavalin EnviroArc Technologies / Nordic American Group Global Environmental Technologies GSB Technologies InEnTec NRG Energy, Inc. Peat International / Menlo Int. Plasco Energy Group Solena Group Startech Environmental Technip USA, Inc. Pyrolysis Bioconversion Technology LLC (Emerald Power) Eco Waste Solutions Entropic Technologies Corporation GEM America Pan-American Resources Pyrogenesis Canada, Inc. Recycled Energy Corporation/Pyrolysis “Plus” Technology Renewable Energy Resources, Inc. International Environmental Solutions Steam Reformation Synterra Energy
Chemical Processing Hydrolysis Arkenol Fuels/Blue Fire Ethanol Biofine / BioMetics Genahol Masada OxyNol RCR International Other Changing World Technologies Innovative Energy Solutions, Inc. Terrabon, Inc. w/ Waste Management California
Mechanical Processing
CES Autoclaves Cleansave Waste Corporation Comprehensive Resources EnerTech Environmental Herhof Gmbh Recycled Refuse International Ros Roca Envirotec (MBT) Tempico Vorus Biopower WET Systems World Waste Technologies WSI Management, LLC
(1) Highlighted companies submitted responses to the County of Los Angeles Department of Public Works Request for Expression of Interest, Conversion Technology Providers distributed in June 2011.
As shown in Table 8, conversion technologies can be grouped into several broad categories. The following sections provide brief descriptions of these categories.
THERMAL Thermal technologies encompass a variety of processes that use or produce heat, under controlled conditions, to convert MSW to usable products. The organic fraction of MSW is converted to energy, and the inorganic fraction is recovered as products (e.g., aggregate, metal). Thermal technologies can potentially convert all organic components of MSW into energy (i.e., all carbon and hydrogen-based materials, including plastic, rubber, textiles, and other organic materials that are not converted in biological processes). Thermal processing includes such technologies as gasification, plasma gasification, and pyrolysis. Distinctions between the different thermal technologies center around the processing temperature, the means of maintaining the elevated temperatures, and the degree of decomposition of the organic fraction of the MSW. Some of these distinctions are noted in Section 3.2. The distinction between the different types of thermal technologies is not always clearly defined, and therefore, the sub-classification of many thermal technologies is based largely on the representations made by the
SloanVAZQUEZ,LLC
Prepared for the City of Fort Collins Waste Stream Analysis Study & January 2012 – Final Draft Waste Conversion Technologies Review 19
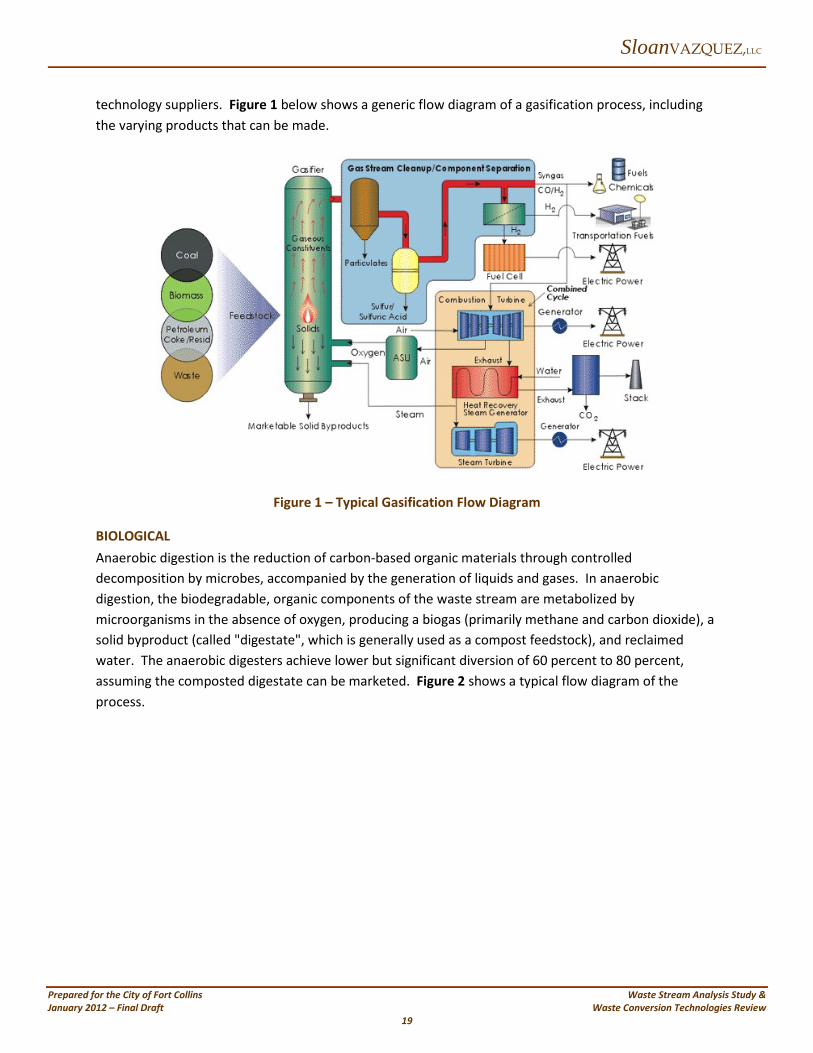
technology suppliers. Figure 1 below shows a generic flow diagram of a gasification process, including the varying products that can be made.
Figure 1 – Typical Gasification Flow Diagram
BIOLOGICAL Anaerobic digestion is the reduction of carbon-based organic materials through controlled decomposition by microbes, accompanied by the generation of liquids and gases. In anaerobic digestion, the biodegradable, organic components of the waste stream are metabolized by microorganisms in the absence of oxygen, producing a biogas (primarily methane and carbon dioxide), a solid byproduct (called "digestate", which is generally used as a compost feedstock), and reclaimed water. The anaerobic digesters achieve lower but significant diversion of 60 percent to 80 percent, assuming the composted digestate can be marketed. Figure 2 shows a typical flow diagram of the process.

SloanVAZQUEZ,LLC
Prepared for the City of Fort Collins Waste Stream Analysis Study & January 2012 – Final Draft Waste Conversion Technologies Review 20
Figure 2 – Typical Anaerobic Digestion Flow Diagram
CHEMICAL Chemical processing technologies use one or a combination of various chemical means to convert MSW into usable products, often uniquely encompassing aspects of other conversion processes such as digestion and gasification. An example of a chemical processing technology is depolymerization, which is the permanent breakdown of large molecular compounds into smaller, relatively simple compounds. Depolymerization is thermal in nature, but instead of a single thermal reaction step it involves a number of complex and interrelated processing steps, some similar to petroleum refining.
Hydrolysis is also subset of chemical processing technologies. Hydrolysis is generally a chemical reaction in which water reacts with another substance to form two or more new substances. Specifically in relation to MSW, hydrolysis refers to a chemical reaction of the cellulose fraction of the waste (e.g., paper, food waste, yard waste) with water and acid to produce sugars. The sugars are then fermented to produce an alcohol, followed by distillation to separate the water from the alcohol and recover a concentrated, fuel-grade ethanol.
Chemical conversion technologies have not gained the popularity gasification and anaerobic digestion. Although several notable companies are currently pursuing hydrolysis projects for the production of ethanol, they are focused on woodwaste as a feedstock, not MSW. Therefore, chemical conversion technologies will not be examined further for the purposes of this report.
MECHANICAL Mechanical processing technologies employ physical processing, such as steam classification (autoclaving), primarily to recover recyclables and separate the organic and inorganic fractions of MSW. Mechanical processing technologies are typically followed by other conversion processes and can be viewed as a “pre-processing” step for conversion technologies (CT).
Autoclaving of medical waste for sterilization before disposal has long been practiced throughout the U.S. However, in recent years, a much broader, larger, and innovative application has emerged as a

SloanVAZQUEZ,LLC
Prepared for the City of Fort Collins Waste Stream Analysis Study & January 2012 – Final Draft Waste Conversion Technologies Review 21
process for MSW. Mixed residential and commercial MSW or post-MRF residue is “pressure cooked” with steam in large, rotating drums up to 25 ft in diameter and 100 ft long. This facilitates subsequent separation of organic biomass (processed paper, cardboard, foodwaste, etc.) from inorganic (glass, metal, plastic, textiles, etc.). The initial purpose for autoclave development was the recovery and sale of paper fiber.
To date there have been two autoclave plants build in the U.S. processing MSW (Minnesota and California), but neither sustained commercial operation. A demonstration autoclave has been operating in Salinas, CA on and off for the past three years and the Salinas Valley Solid Waste Authority is pursuing a demonstration project there. In the following sections, wherever MRFs are discussed, autoclaves could be included as well as a future refinement. To date, the CT vendors have chosen to go with standard MRF processing.
3.2 THERMAL (GASIFICATION/PYROLYSIS)
3.2.1 TECHNICAL ASPECTS Typically gasification, plasma gasification, and pyrolysis facilities have a capacity on the order of 300 to 500 TPD and are modular in design with each module capable of processing roughly 100 to 150 TPD. There are exceptions, such as the ThermoSelect process marketed by IWT which prefers much larger facilities and can process up to 1,500 TPD. Additionally, gasification has the potential for high diversion from landfill disposal, between 85% and 100% diversion by weight.
Thermal processing occurs in a high-temperature reaction vessel. Reactor temperatures may range from approximately 800°F for a pyrolysis technology to as high as 8,000°F for a plasma gasification technology. Within the reaction vessel, the organic fraction of the MSW is converted to a gas typically composed of hydrogen, carbon monoxide and carbon dioxide gases. This gas is commonly called synthesis gas or “syngas”. Some thermal technologies, such as pyrolysis, produce a gas that also consists of various low molecular weight organic compounds. Thermal technologies sometimes introduce a supplemental fuel (e.g., natural gas, coke, etc.) to improve the quality and consistency of the synthesis gas. Plasma gasification technologies use a supplemental source of energy, most commonly electricity, to produce an electric arc to elevate the temperature and enhance dissociation of the molecules in the MSW. The syngas and other products of the thermal technologies represent unoxidized or incompletely oxidized compounds, which in most cases differentiate these technologies from the more complete combustion attained in traditional waste-to-energy (WTE) projects.
With some thermal technologies, such as gasification, the inorganic fraction of MSW is commonly recovered in the form of a vitrified material (i.e., a solid, glassy, rock-like substance often used as aggregate), mixed metals, industrial salts, chemicals, and other byproducts. Some thermal technologies, such as pyrolysis, generate a char (i.e., a carbon-based solid) rather than a vitrified product. Depending upon market conditions, these byproducts of thermal processes may have beneficial uses or may require landfill disposal. The syngas produced by thermal conversion technologies can be combusted to generate electricity or converted to fuels.

SloanVAZQUEZ,LLC
Prepared for the City of Fort Collins Waste Stream Analysis Study & January 2012 – Final Draft Waste Conversion Technologies Review 22
In an overview fashion, thermal processing of MSW can be described in two primary steps: (1) pre-processing, if required, and (2) thermal conversion, including combustion of the syngas to generate electricity.
• Pre-processing. Pre-processing requirements are often very minimal for thermal technologies. Except for the common requirement to remove or size-reduce very large, over-sized materials such as furniture and large appliances, many thermal processing technologies do not require size reduction or separation of MSW by component. This is not always the case, though, as some thermal technologies (e.g., many pyrolysis technologies) shred and/or dry the waste prior to processing. While recyclables such as metals can be recovered in a pre-processing step, many of the thermal technologies recover the metal after the thermal conversion process (i.e., as a "product" rather than as a front-end "recyclable".)
• Thermal Conversion and Use of Gas. The thermal conversion process results in a syngas and other products, as described above. The gas may be processed into fuels such as hydrogen or chemicals such as methanol, but currently, most technology suppliers have been or are focusing on converting the syngas to energy by using it as a fuel in traditional boilers, reciprocating engines and combustion turbines. Some of the thermal technologies pre-clean the syngas prior to combustion using standard, commercially-available technology to remove sulfur compounds, chlorides, heavy metals and other impurities. Pre-cleaning the syngas prior to power generation can be more cost-effective than air emission controls at the back end. The extent of syngas cleaning and the type of air pollution control varies by technology.
3.2.2 ENVIRONMENTAL ASPECTS Air emissions from thermal technologies are tightly controlled and information gathered to date shows that these facilities can meet the strictest air quality standards in the country, including all current California standards. These facilities have a low air emissions profile comparable to engine/generators running on natural gas, and cleaner than engines running on landfill gas. None the less, the evaluation of air emissions and the conducting of health risk assessments related to those emissions are critical and controversial aspects of these projects.
Some thermal technologies generate a small amount of air pollution control residue that requires disposal, and some thermal technologies incorporate pre-processing for feedstock preparation, which generates an inert residue such as dirt and other inert debris removed from the MSW. The inert residue associated with pre-processing should be suitable for disposal in an MSW landfill. Air pollution control residue may not be suitable for disposal in a Class 3 landfill, depending on the thermal CT, and may need to be disposed at a landfill permitted to receive hazardous material. Alternatively, some technologies process and recycle this material.
Thermal technologies provide reductions in GHGs in two ways:

SloanVAZQUEZ,LLC
Prepared for the City of Fort Collins Waste Stream Analysis Study & January 2012 – Final Draft Waste Conversion Technologies Review 23
1. Avoidance of methane emissions that would have been released if the feedstock had been landfilled, and
2. Offset of the GHG emissions that would have been generated by the local fossil fuel burning power plant for the electricity the CT project generates; or offset of the tailpipe emissions that would have resulted by burning fossil fuel instead of the ethanol or CNG produced by the CT plant
Depending on the type of fossil fueled supplanted, and the amount of methane control (or lack thereof) at the landfill, CT projects are typically awarded between 0.5 and 2.0 tons of CO2 equivalent for every ton of MSW processed. This can amount to tens or even hundreds of thousands of tons of CO2E reduced each year.
One major advantage of Thermal CTs is their ability to process mixed post-recycled MSW and provide extremely high diversion, typically over 95%. This implies that large Thermal CT projects can essentially replace landfills in the future; although landfills will always be needed for inert residues and non-processible waste.
3.2.3 INSTITUTIONAL ASPECTS In the choice of technologies, institutional aspects can be just as important to a jurisdiction as technical ones.
POLICIES The City has adopted several policies that encourage the development of CT projects:
1. A goal of 50% diversion from landfills; likely to be raised in the future 2. A goal of 10% renewable power generation by 2020
Furthermore, the City has a strong desire to work with local enterprises to advance the use of Renewable Energy Credits (RECs) to raise the value of renewable energy generation as enacted by the State of Colorado.
PERMITTING Permitting of a Thermal CT project is expected to be arduous, controversial, expensive, and lengthy based on experience gained in the projects moving forward in the U.S. and Canada. A period of two to three years is required in most cases. Often it is not the actual technical aspects of the permitting that is so expensive and time-consuming but the opposition from environmental and EJ (environmental justice) groups as discussed in the public acceptance section below.
In addition to a Land Use permit and the attendant detailed environmental review, a thermal CT facility will require a solid waste permit from the Colorado Hazardous Materials and Waste Management Division. Additionally, an Application for Stormwater Discharges must be submitted to the Colorado Water Quality Control Division in order to obtain a Heavy and Light Industrial Activity General Permit for stormwater. As part of the stormwater permitting process, a Stormwater Management Plan must be prepared and certified.

SloanVAZQUEZ,LLC
Prepared for the City of Fort Collins Waste Stream Analysis Study & January 2012 – Final Draft Waste Conversion Technologies Review 24
Lastly, the type of air permit required depends on the levels of criteria pollutants anticipated for the project. For a thermal CT facility, engine exhaust from producing electricity is the primary source of air emissions. All sources of air emissions in Colorado are required to obtain a construction permit from the Colorado Air Pollution Control Division unless they are specifically exempted. Additionally, all major sources of air emissions in Colorado are required to obtain an Operating Permit if they emit pollutants beyond the level required for a construction permit only. Air emission limits for criteria pollutants differ depending on whether the facility is located in an attainment area or not. New major sources must first obtain a construction permit, and must apply for an operating permit within 12 months of commencing operation.
FUNDING CT vendors realize that for initial projects, they are not likely to receive financing from the public sector. Therefore, virtually all the vendors will secure their own financing in the form of equity and loans. Many are also working on obtaining grant money to support the projects, and some have received substantial grants and low interest loans already from the Dept. of Energy (DOE) and other federal agencies.
This being said, there may be instances where the City could participate in funding a project, taking advantage of the City’s ability to secure low-interest loans that would not be available to a private company.
PUBLIC ACCEPTANCE Lastly, Thermal CT projects are subject to significant controversy, mostly from environmental groups who support zero waste through complete recycling and composting, and who believe that conversion of organic waste to energy is not the best and highest use. In addition, there is a perception among the public (not justified) that Thermal CT is “incineration in disguise”, and that the air emissions are a health issue. Once the first commercial scale Thermal CT projects are in operation, perhaps these attitudes will change, but at this point, when there are no such projects in the U.S., it is difficult to turn these negative attitudes around.
In fact, several jurisdictions are considering anaerobic digestion projects (especially in California) at least in major part because they do not want to go through the agony and opposition in trying to develop a Thermal project.
3.3 BIOLOGICAL (ANAEROBIC DIGESTION)
3.3.1 TECHNICAL ASPECTS Current anaerobic digestion facilities are designed to process from 5 tpd, up to 300 TPD. However, in combination with a comprehensive MRF, total facility capacities of up to 750 TPD are feasible. Some AD technologies (namely “dry fermentation” types) are batch processes, with cycles of 21-28 days which also limit the quantity of waste they can treat. Other high-solids AD technologies are continuous feed.
Anaerobic digestion can be described by four primary steps: (1) pre-processing, or separation/preparation, of the MSW to obtain a prepared organic feedstock; (2) digestion of the

SloanVAZQUEZ,LLC
Prepared for the City of Fort Collins Waste Stream Analysis Study & January 2012 – Final Draft Waste Conversion Technologies Review 25
prepared organic feedstock; (3) for some anaerobic digestion technologies, post-treatment of the digestate to produce a clean, mature compost, and (4) management and use of the biogas generated during the anaerobic digestion process. These primary steps are described below.
• Pre-processing. For source-separated materials (foodwaste and greenwaste in particular) little or no pre-processing is necessary depending on the technology used. For mixed MSW, pre-processing or preparation/separation is necessary for separating biodegradable, organic materials from other waste components as well as for size reduction and preparation of the organic feedstock. Pre-processing can be accomplished using traditional, mechanical sorting processes, or it can employ more innovative and technology-specific approaches (e.g., the water-based preparation/separation system designed by ArrowBio.) Pre-processing will result in residue requiring disposal, generally consisting of broken glass and other inert materials present in the wastestream. Pre-processing can be combined with recovery of traditional recyclables that are not readily biodegradable and not of value in the digestion process. Recovered recyclables from pre-processing may include ferrous metal, aluminum, plastic, and glass. Recent initiatives are underway to sort paper and cardboard as recyclables, particularly when there are high market values for these materials. In general, maximizing the recovery of recyclables and the removal of non-degradable, inert materials during pre-processing will result in higher quality compost at the end of the process.
• Digestion. The separation and preparation of biodegradable, organic material from the MSW results in an organic feedstock for the digestion process. The fundamental objective of anaerobic digestion is to produce a large quantity of methane-rich biogas and a small quantity of well-stabilized digestate from the organic feedstock. In all anaerobic digestion technologies, the process occurs in an enclosed, controlled environment (i.e., within the "digester", or "bioreactor"). However, different digestion technologies are available, which produce different results regarding biogas and compost quantity and characteristics. The process may be "wet" or "dry", depending on the percent solids of the organic feedstock in the digester. The process temperature may also be controlled in order to promote the growth of a specific population of microorganisms, with process temperatures ranging from approximately 35-55°C (95-131°F). The process may be conducted in a single-stage or two-stage reactor vessel, and on a continuous or batch basis. Retention times of material in the digester can also vary.
• Post-processing. Anaerobic digestion results in a solid byproduct, called "digestate". It consists of organic material that is not readily digestible, along with inorganic material that escaped pre-processing. Digestate varies in consistency. Wet digestion technologies produce a digestate with a thinner, or wetter, consistency than dry digestion technologies, which produce a wet solids mass. The digestate is commonly dewatered, with the liquid returned to the process or managed as a wastewater. The dewatered solids may be screened to remove inorganic materials, and are then aerobically finished, if necessary, to produce stable, mature compost, for sale as a product. The extent of post-treatment

SloanVAZQUEZ,LLC
Prepared for the City of Fort Collins Waste Stream Analysis Study & January 2012 – Final Draft Waste Conversion Technologies Review 26
required to achieve a stable, mature compost, as well as the quantity of compost produced, varies based on the digestion technology used. Also, depending on the extent of separation and preparation conducted prior to the digestion process, some technologies require more post-processing than others (e.g., some technologies require screening of digestate prior to aerobic finishing, and/or screening of mature compost, in order to improve the quality of the resulting compost for purposes of beneficial use).
• Biogas Management. Anaerobic digestion results in a biogas, composed primarily of methane and carbon dioxide. Higher-quality biogas has a higher percentage of methane, with individual digestion technologies producing biogas with methane concentrations ranging from approximately 55% to 80%. Biogas may also include small amounts of contaminants, such as hydrogen sulfide (H2S). The concentration of H2S and other contaminants in the biogas generally depends on the characteristics of the waste stream. Commercially available technologies may be utilized to remove contaminants and otherwise improve the quality of the biogas (i.e., achieve a higher percentage of methane), if such a step is necessary for a particular project. Often without any cleanup steps, the biogas can be beneficially used to generate electricity.
The organic fraction of MSW can also be aerobically (“with oxygen”) digested through in-vessel systems, covered composting systems, or open windrows to produce either a soil amendment (compost) or a solid fuel.
3.3.2 ENVIRONMENTAL ASPECTS Like most treatment processes, there will be some emissions from anaerobic digestion (AD) facilities. Air emissions are low due to the enclosed nature of the process, though combustion of the methane-based biogas will produce some criteria air emissions (NOx, CO, hydrocarbons, etc.). However, emissions from AD-CHP are generally lower than other forms of waste disposal and reduce greenhouse gas emissions as compared to landfill disposal.
Additionally, solid and liquid digestate from the AD facility must be dealt with appropriately to prevent unnecessary impacts to the environment. The health risk from the solid and liquid residue from the AD plant should be low as long as source-separated waste is being used (i.e. no chemical contaminants are entering the system from other waste). Also, the digestate is typically processed further aerobically and marketed as a compost product, and this operation will have typical environmental aspects such as dust and odor to be mitigated.
3.3.3 INSTITUTIONAL ASPECTS
POLICIES The same policies and framework that may affect the Thermal (Gasification/Pyrolysis) technologies as discussed in Section 3.2.3 also apply to the Biological (Anaerobic Digestion) and are repeated here for convenience.
1. A goal of 50% diversion from landfills; likely to be raised in the future

SloanVAZQUEZ,LLC
Prepared for the City of Fort Collins Waste Stream Analysis Study & January 2012 – Final Draft Waste Conversion Technologies Review 27
2. A goal of 10% renewable power generation by 2020
Furthermore, the City has a strong desire to work with local enterprises to advance the use of Renewable Energy Credits (RECs) to raise the value of renewable energy generation as enacted by the State of Colorado.
PERMITTING Construction and operation of an anaerobic digestion facility will require a Land Use permit and the attendant environmental review, as well as a solid waste permit from the Colorado Hazardous Materials and Waste Management Division. Additionally, an Application for Stormwater Discharges must be submitted the Colorado Water Quality Control Division in order to obtain a Heavy and Light Industrial Activity General Permit for stormwater. As part of the stormwater permitting process, a Stormwater Management Plan must be prepared and certified.
Lastly, the type of air permit required depends on the levels of criteria pollutants anticipated for the project. For an AD facility, engine exhaust from producing electricity is the primary source of air emissions. All sources of air emissions in Colorado are required to obtain a construction permit from the Colorado Air Pollution Control Division unless they are specifically exempted. Additionally, all major sources of air emissions in Colorado are required to obtain an Operating Permit if they emit pollutants beyond the level required for a construction permit only. Air emission limits for criteria pollutants differ depending on whether the facility is located in an attainment area or not. New major sources must first obtain a construction permit, and must apply for an operating permit within 12 months of commencing operation. If the facility converts the biogas to CNG, air emissions from the facility will be very low as no combustion of the gas would take place onsite.
AD projects typically have an easier permitting pathway than thermal technologies because of their simpler format, low temperatures, and favorable public perception, as discussed below. However, it must be remembered that an AD project needs a composting facility to handle the digestate, and the permitting of a new composting facility can be as arduous as permitting the AD facility itself. Many of the existing AD projects in Europe were built at existing composting sites for this reason.
FUNDING Funding framework is similar to that discussed in Section 3.2.3 for Thermal (Gasification/Pyrolysis) technologies. Because CT vendors realize that for the initial projects, financing from the public sector is unlikely, they generally secure their own financing in the form of equity and loans. Many are also working on obtaining grant money to support the projects, and some have received substantial grants and low interest loans already from the Dept. of Energy (DOE) and other federal agencies. Again, there may be instances where the City could participate in funding a project, taking advantage of the City’s ability to secure low-interest loans that would not be available to a private company.

SloanVAZQUEZ,LLC
Prepared for the City of Fort Collins Waste Stream Analysis Study & January 2012 – Final Draft Waste Conversion Technologies Review 28
PUBLIC ACCEPTANCE Lastly, biological CT projects (AD) are supported by the majority of environmental groups and are seen as the next step in moving toward zero waste. Although there is still resistance in the environmental community to the conversion to energy aspect of AD, the fact that the process is biological and also includes a significant composting element is viewed as favorable. In California, the State waste agency, CalRecycle, has gone as far as to develop and certify a programmatic Environmental Impact Report (EIR), that can be used by individual AD projects to support permitting.
The key concern for the public is typically odor, and its control is a critical feature of AD projects, both at the digestion facility and the composting site.
3.4 CONVERSION TECHNOLOGY PROJECT RECOMMENDATIONS
3.4.1 INTRODUCTION The City is in the process of evaluating system-wide approaches to Zero Waste, renewable energy, and best and highest use of organics from commercial and industrial users; and also to the optimization of existing resources and infrastructure, such as the wastewater treatment plants. The figure below shows the theoretical synergies between various components of such a system.
In a region that has very low waste disposal costs, it is important to look for such synergies and local advantages in order to develop CT projects that are economically feasible. Based on data from other projects, and the strong environmental consciousness in the City, it is likely that a CT project with strong environmental benefits and marginally higher costs per ton would be acceptable; but large increases in cost would not be widely supported either by the public, local businesses or elected officials.
On the other hand, a more positive economic factor is the City’s renewable energy goal of 6% of their total power by 2015, and 10% by 2020. The latter represents roughly 215,000 MWh of electricity. In addition, the State of Colorado has “incentivized” the development of renewable energy in the State by awarding multiple values for Renewable Energy Credits (RECs), which in essence raises the value of renewable electricity generated from local biomass from approximately $0.06/kWh to $0.09-$0.12/kWh.

SloanVAZQUEZ,LLC
Prepared for the City of Fort Collins Waste Stream Analysis Study & January 2012 – Final Draft Waste Conversion Technologies Review 29
Figure 3 – System Integration Possibilities
Given that the local County landfill still has plenty of life, and very low tipping fees in the $20/ton range. It is unlikely that a large CT facility will be economically feasible, at least for the foreseeable future. But there may be opportunities for smaller, more customized CT projects such as digesters for source-separated food waste and green waste, or CT plants connected with specific large generators like the breweries that produce a consistent organic waste every day. These applications are less expensive, easier to finance and develop, and may offer a feasible “entry level” project for the City.
Another possibility would be to divert source-separated organics to a digester at the Drake Water Reclamation Facility. Several communities throughout the U.S. are evaluating or starting up such projects, particularly where there is excess digester capacity. These treatment plants are already equipped with engines or turbines that combust the digester gas to create electricity or boilers that convert the gas to heat, which can also be a big savings to the project.
WWTP
MSW/IRF
Breweries
Composting
Restaurants Conversion
Technology
Foodwaste
Foodwaste
Foodwaste
AD
Residuals
Organics
Biosolids
Foodwaste
Organics/ Residuals Organi
cs
Biosolids (To
Composting)
Biosolids
(From WWTP)
Heat/Power
Heat/Power
SloanVAZQUEZ,LLC
Prepared for the City of Fort Collins Waste Stream Analysis Study & January 2012 – Final Draft Waste Conversion Technologies Review 30
The following sections present the four project alternatives that were found to be best suited for the City, both now and for the future.
1. A Demonstration Scale Anaerobic Digestion (AD) Facility 2. Small-Scale Gasification Facility (with select local feedstocks) 3. Commercial scale Gasification or AD Facility (future) 4. Foodwaste Digestion at the Drake WWTP
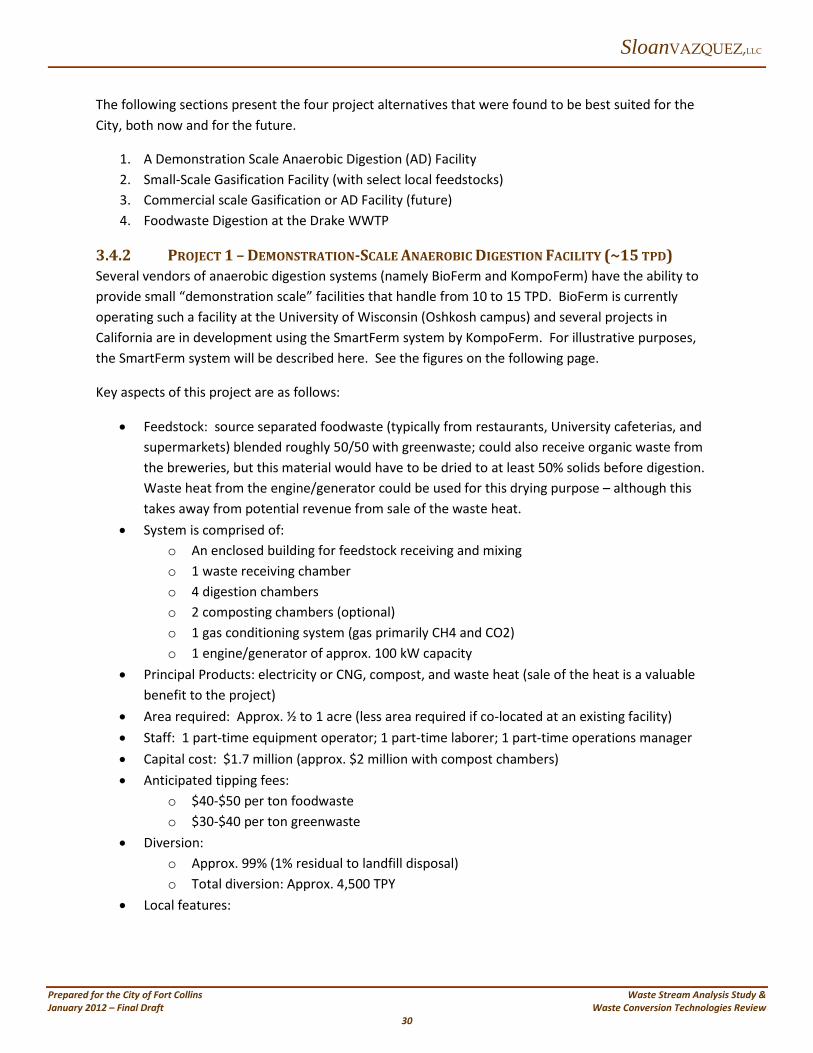
3.4.2 PROJECT 1 – DEMONSTRATION-SCALE ANAEROBIC DIGESTION FACILITY (~15 TPD) Several vendors of anaerobic digestion systems (namely BioFerm and KompoFerm) have the ability to provide small “demonstration scale” facilities that handle from 10 to 15 TPD. BioFerm is currently operating such a facility at the University of Wisconsin (Oshkosh campus) and several projects in California are in development using the SmartFerm system by KompoFerm. For illustrative purposes, the SmartFerm system will be described here. See the figures on the following page.
Key aspects of this project are as follows:
• Feedstock: source separated foodwaste (typically from restaurants, University cafeterias, and supermarkets) blended roughly 50/50 with greenwaste; could also receive organic waste from the breweries, but this material would have to be dried to at least 50% solids before digestion. Waste heat from the engine/generator could be used for this drying purpose – although this takes away from potential revenue from sale of the waste heat.
• System is comprised of: o An enclosed building for feedstock receiving and mixing o 1 waste receiving chamber o 4 digestion chambers o 2 composting chambers (optional) o 1 gas conditioning system (gas primarily CH4 and CO2) o 1 engine/generator of approx. 100 kW capacity
• Principal Products: electricity or CNG, compost, and waste heat (sale of the heat is a valuable benefit to the project)
• Area required: Approx. ½ to 1 acre (less area required if co-located at an existing facility) • Staff: 1 part-time equipment operator; 1 part-time laborer; 1 part-time operations manager • Capital cost: $1.7 million (approx. $2 million with compost chambers) • Anticipated tipping fees:
o $40-$50 per ton foodwaste o $30-$40 per ton greenwaste
• Diversion: o Approx. 99% (1% residual to landfill disposal) o Total diversion: Approx. 4,500 TPY
• Local features:

SloanVAZQUEZ,LLC
Prepared for the City of Fort Collins Waste Stream Analysis Study & January 2012 – Final Draft Waste Conversion Technologies Review 31
o Could be co-located with the Integrated Recycling Facility (IRF), if space permits. If composting of digestate conducted onsite, final compost product could be given away to IRF users.
o Waste heat from engine/generator could be used at a local brewery or the public ice skating rink, for example, depending on location
o The project could be configured to produce compressed natural gas (CNG) rather than electricity, if the economics are more favorable and the vehicle fuel could be readily used by the City or other transportation company.
The process is quite simple. Material is received, mixed and loaded into the enclosed receiving chamber. Once sufficient material is on hand (roughly every four days or so), one of the digestion chambers that has finished its 21-day cycle is emptied and the new material placed in. With each chamber filled about every four or so days, by the time the fourth chamber is filled, the first chamber is ready to be emptied and reused. The feedstock is then digested anaerobically (no oxygen) for three weeks. Biogas from the process is collected in a bladder on top of the chambers, conditioned, and fed into an engine/generator where it is combusted to make electricity. Digestate (solid residual) from the process can either be trucked to an off-site composting operation or processed onsite in two additional composting chambers. Although the latter is more expensive from a capital cost standpoint, it eliminates extensive trucking to the distant composting site, provides an “in-vessel” environmentally controlled operation, and produces a local compost product. Contamination of the incoming feedstock is estimated at roughly 1%, and this material would need to be landfilled.
Project development would most likely be a public/private partnership with the City providing the land, basic utilities, and Power Purchase Agreement through the PRPA. The vendor would provide all financing, permitting, design, and construction. Operation requires only part-time labor and could most easily be done by City employees manning the IRF, if such a co-location is possible.
Biosolids would not be a suitable feedstock as this material has already been digested at the WWTP.
The facility is expandable and could easily be doubled or tripled in size in the future, space permitting.

SloanVAZQUEZ,LLC
Prepared for the City of Fort Collins Waste Stream Analysis Study & January 2012 – Final Draft Waste Conversion Technologies Review 32
Picture 7 – SMARTFERM Dry Fermentation System Rendering & Photo
3.4.3 PROJECT 2 – SMALL-SCALE THERMAL FACILITY (~25-100 TPD) Throughout N. America there has been renewed focus on small thermal conversion technologies, down to as low as 10 TPD. None of these technologies are yet in commercial use, but the target market is small jurisdictions and large industries. A crucial question is going to be the economics at this small size, where there will be virtually no economy of scale. Clearly, there will need to be other key synergies at work to make such a project feasible. However, these could possibly include:
1. Grants and low-interest loans from the DOE or other government organizations 2. Local industries willing to pay higher costs for waste diversion and energy (heat and/or
electricity) in exchange for environmental benefit 3. Special compensation from the City and the PRPA for innovative and renewable energy 4. Tipping fee concessions from CT vendors willing to sacrifice profit to get a first project in the
ground
Several vendors of small scale thermal CT systems are in the process of developing, or have already developed, “demonstration scale” facilities with individual modules that handle from 10 to 30 TPD. These include the following (See the figures on the following page):
• IES (International Environmental Systems – Mecca, CA; pyrolysis to electricity) • GEM America (NJ and the United Kingdom; thermal cracking to electricity or fuels) • Powerhouse Energy (Pyromex technology – Palm Desert, CA and Germany; gasification to
electricity) • SynTerra (Sacramento, CA; pyrolysis and steam reformation to fuels) • Crystal Creek Energy (Fort Collins, CO; gasification to electricity)
This is not an exhaustive list as new companies continue to enter or drop out. As in any new field, the list of players is dynamic.

SloanVAZQUEZ,LLC
Prepared for the City of Fort Collins Waste Stream Analysis Study & January 2012 – Final Draft Waste Conversion Technologies Review 33
Picture 8 – International Environmental Systems
Picture 9 – SynTerra Energy
Picture 10 – Crystal Creek Energy
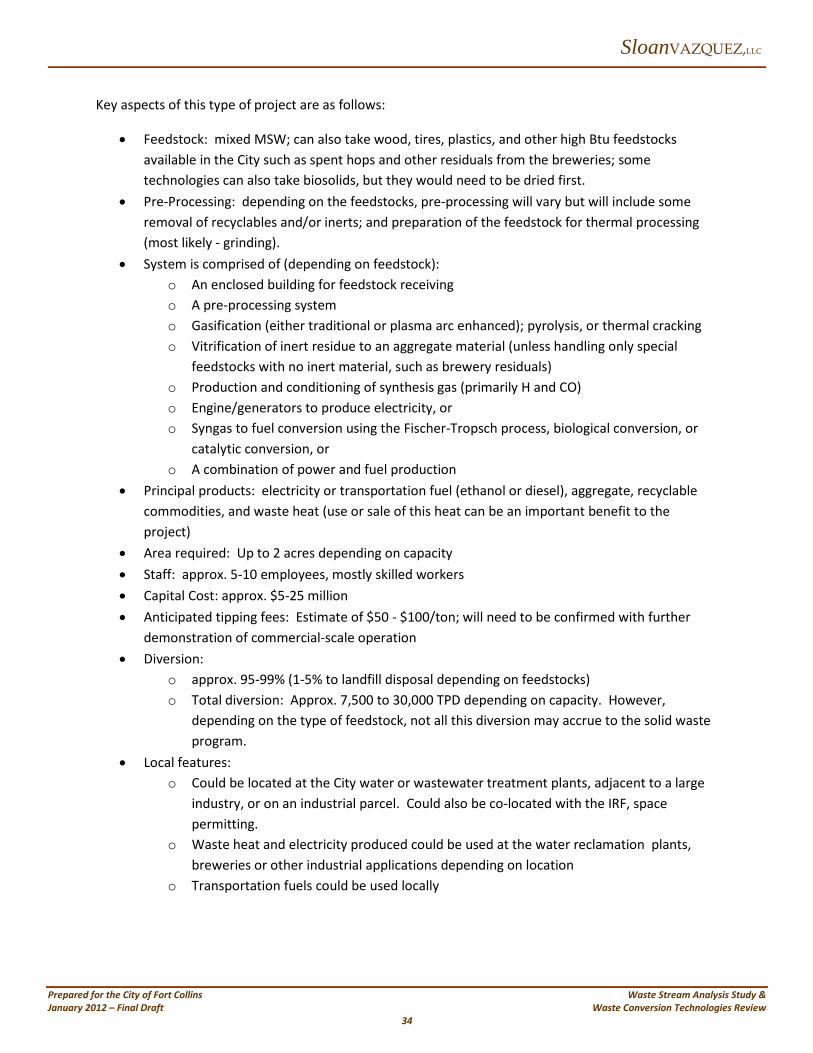
SloanVAZQUEZ,LLC
Prepared for the City of Fort Collins Waste Stream Analysis Study & January 2012 – Final Draft Waste Conversion Technologies Review 34
Key aspects of this type of project are as follows:
• Feedstock: mixed MSW; can also take wood, tires, plastics, and other high Btu feedstocks available in the City such as spent hops and other residuals from the breweries; some technologies can also take biosolids, but they would need to be dried first.
• Pre-Processing: depending on the feedstocks, pre-processing will vary but will include some removal of recyclables and/or inerts; and preparation of the feedstock for thermal processing (most likely - grinding).
• System is comprised of (depending on feedstock): o An enclosed building for feedstock receiving o A pre-processing system o Gasification (either traditional or plasma arc enhanced); pyrolysis, or thermal cracking o Vitrification of inert residue to an aggregate material (unless handling only special
feedstocks with no inert material, such as brewery residuals) o Production and conditioning of synthesis gas (primarily H and CO) o Engine/generators to produce electricity, or o Syngas to fuel conversion using the Fischer-Tropsch process, biological conversion, or
catalytic conversion, or o A combination of power and fuel production
• Principal products: electricity or transportation fuel (ethanol or diesel), aggregate, recyclable commodities, and waste heat (use or sale of this heat can be an important benefit to the project)
• Area required: Up to 2 acres depending on capacity • Staff: approx. 5-10 employees, mostly skilled workers • Capital Cost: approx. $5-25 million • Anticipated tipping fees: Estimate of $50 - $100/ton; will need to be confirmed with further
demonstration of commercial-scale operation • Diversion:
o approx. 95-99% (1-5% to landfill disposal depending on feedstocks) o Total diversion: Approx. 7,500 to 30,000 TPD depending on capacity. However,
depending on the type of feedstock, not all this diversion may accrue to the solid waste program.
• Local features: o Could be located at the City water or wastewater treatment plants, adjacent to a large
industry, or on an industrial parcel. Could also be co-located with the IRF, space permitting.
o Waste heat and electricity produced could be used at the water reclamation plants, breweries or other industrial applications depending on location
o Transportation fuels could be used locally

SloanVAZQUEZ,LLC
Prepared for the City of Fort Collins Waste Stream Analysis Study & January 2012 – Final Draft Waste Conversion Technologies Review 35
As compared to anaerobic digestion, gasification projects are expensive and complex and require sophisticated operations personnel; however the resulting power or fuel production is much more significant.
Project development would most likely be a public/private partnership with the City providing the land, basic utilities, and Power Purchase Agreement through the PRPA. The vendor would provide all financing, permitting, design, construction, and operation.
3.4.4 PROJECT 3 – FUTURE COMMERCIAL-SCALE GASIFICATION OR ANAEROBIC DIGESTION
FACILITY (~300 - 400 TPD) Although current economic conditions, namely the large remaining landfill capacity and low tipping fees, discourage the development of an MSW-based, commercial scale CT facility, it may be that in the future as landfill capacity dwindles, such a project could become viable.
GASIFICATION FACILITY The advantage of a commercial-scale thermal facility is that it can essentially replace the landfill, while providing diversion of over 95% of the mixed residual waste being disposed. These plants are powerful generators of renewable electricity or low-carbon fuel. The City currently disposes of roughly 130,000 TPY or about 400-450 TPD. A CT plant of 300-400 TPD would be a perfect fit.
Several gasification projects are in development in the U.S. and Canada of roughly this size as discussed in a previous section:
1. Taylor Biomass (Montgomery, NY; 500 TPD MSW, 450 TPD C&D, 100 TPD wood waste; MSW gasification to electricity)
2. Fulcrum BioEnergy (McCarran, NV; 400 TPD; MSW plasma-arc gasification and alcohol synthesis to ethanol)
3. Plasco Energy (Salinas Valley, CA; 330 TPD; MSW plasma-arc gasification to electricity) 4. Enerkem (Edmonton, Alberta; 300 TPD; MSW plasma-arc gasification and catalytic synthesis to
ethanol) 5. INEOS Bio (Vero Beach, FL; 400 TPD; MSW gasification and fermentation to ethanol)
Key aspects of this type of project are:
• Feedstock: mixed MSW as received at the County landfill; can also take tires, plastics and other high Btu feedstocks; biosolids could be a suitable feedstock but would need to be dried to a high solids consistency before gasification. Waste heat from the process could be used for this purpose, but could result in lost revenue if a purchaser of the heat were available.
• Pre-Processing: all plants have a MRF on the front end to: 1) remove recyclables for sale and inerts not convertible in the system; and 2) prepare the feedstock for gasification (grinding). MRFs vary from relatively simple (metal and inerts recovery and grinding) to extensive, full “dirty MRF” systems recovering cardboard, paper, glass, metal and plastic.
• System is comprised of: o An enclosed building for feedstock receiving

SloanVAZQUEZ,LLC
Prepared for the City of Fort Collins Waste Stream Analysis Study & January 2012 – Final Draft Waste Conversion Technologies Review 36
o A pre-processing MRF system o Gasification (either traditional or plasma arc enhanced) o Vitrification of inert residue to an aggregate material o Production and conditioning of synthesis gas (primarily H and CO) o Engine/generators of approx. 20 MW capacity, or; o Gas to fuel conversion using the Fischer-Tropsch process, biological conversion, or
catalytic conversion making roughly 10 million gallons per year, or; o A combination of power and fuel production
• Principal products: electricity or fuel, aggregate, recyclable commodities, waste heat • Area required: Approx. 6 acres • Staff: approx. 40 employees, mostly skilled workers • Capital Cost: approx. $100-150 million • Anticipated tipping fees: approx. $75-120 per ton (actual cost will be confirmed upon
operations start of first N. American plants in 2012) • Diversion:
o Approx. 95-99% (1-5% to landfill disposal) o Total: approx. 100,000 TPY
• Local features: o Could be located at the County landfill, one of the City water reclamation plants or on
an industrial parcel o Waste heat electricity produced could be used at the treatment plants, breweries or
other industrial application depending on location o Could provide up to 10% of the ultimate 2020 renewable electricity goal of the City
Project development would most likely be a public/private partnership with the City providing the land, basic utilities, and Power Purchase Agreement through the PRPA. The vendor would provide all financing, permitting, design, construction, and operation.
ANAEROBIC DIGESTION FACILITY For dealing with an MSW feedstock, anaerobic digestion systems are coupled with an extensive MRF on the front end to not only recover recyclables and remove inert material, but to prepare an organic feedstock for digestion. The City currently disposes of roughly 130,000 TPY or about 400-450 TPD. A commercial scale plant of 300-400 TPD would be a perfect fit.
Two such projects are in development in the U.S.:
1. Mustang Power (Santa Barbara, CA; 600 TPD; MSW digestion to electricity) 2. Los Angeles County Dept. of Public Works (Calabasas, CA; 700 TPD; MSW digestion to electricity)

SloanVAZQUEZ,LLC
Prepared for the City of Fort Collins Waste Stream Analysis Study & January 2012 – Final Draft Waste Conversion Technologies Review 37
Key aspects of these types of projects are as follows:
• Feedstock: mixed MSW as received at the County landfill; source separated foodwaste and greenwaste; biosolids would typically not be a suitable feedstock as this material has already been digested at the WWTP.
• Pre-Processing: extensive MRF on the front end to remove recyclables; remove inerts not convertible in the system; and prepare an organic feedstock for digestion.
• System is comprised of: o An enclosed building for feedstock receiving o An extensive “dirty MRF” system o Digestion o Composting of digestate (onsite or offsite, in-vessel or windrow) o Production and conditioning of biogas gas (primarily CH4 and CO2) o Engine/generators or turbines of approx. 1-2 MW capacity
• Principal products: electricity, compost, and significant recyclable commodities, waste heat • Area required: Approx.6 - 10 acres (depending on composting requirement) • Staff: up to approx. 75 employees (largely associated with the MRF) • Capital Cost: approx. $25-50 million • Anticipated tipping fees: approx. $50-75 per ton • Diversion:
o Approx. 65% (35% to landfill disposal) o Total: approx. 70,000 TPY
• Local features: o Could be located at the County landfill, one of the City water reclamation plants or on
an industrial parcel o Waste heat and electricity produced could be used at the treatment plants, breweries or
other industrial application depending on location o Could provide up to 1% of the ultimate 2020 renewable electricity goal of the City
A critical component of these projects is the MRF, and the economics are very sensitive to the pricing of the recycled commodities. Although an advantage in the Southern California area, this would not be as advantageous in the City, where the markets for recyclables are not as strong.
Project development would most likely be a public/private partnership with the City providing the land, basic utilities, and Power Purchase Agreement through the PRPA. The vendor would provide all financing, permitting, design, construction, and operation.
3.4.5 PROJECT 4 – FOOD WASTE DIGESTION AT THE DRAKE WATER RECLAMATION FACILITY The Colorado State University Civil Engineering Department, in association with the City’s Water Reclamation plant staff, is evaluating the feasibility of adding source-separated food waste from local restaurants and University cafeterias to the influent of the Drake Water Reclamation Plant. Currently, the plant is operating below design organic loading; meaning that existing treatment and digestion

SloanVAZQUEZ,LLC
Prepared for the City of Fort Collins Waste Stream Analysis Study & January 2012 – Final Draft Waste Conversion Technologies Review 38
capacity is underutilized. The addition of foodwaste would provide additional BOD loading and residual solids for digestion and energy generation in the plant’s existing system.
The hope is that the addition of food waste will result in a positive economic impact on the plant operation’s budget by making better use of the existing infrastructure; while also providing renewable heat and electricity for the City.
For the plant to become a facility for unprocessed food waste, additional capital improvements would be required to screen and prepare the food waste into a form acceptable to the anaerobic digester. Existing Septage facilities, which have the required power, non-potable water, and trash receiving facilities, could be modified to perform this task. A biogas conditioning system would also be required to remove carbon dioxide and siloxanes, but then the gas could be used for power generation and/or converted to CNG for vehicle usage or return to the grid.
At the time of this report, the outcome of this study is still in the offing regarding both the amount of food waste that could be received and the final economics. However, should the results be positive, this could represent a viable means of converting food waste into electricity without having to develop a stand-alone CT plant. As mentioned elsewhere in this report, other communities are experimenting with just such a system including the East Bay Municipal Utility District (EBMUD) in the San Francisco Bay area, and the City of Los Angeles at its Hyperion Treatment Plant, among others.
It should be noted that the foodwaste that could be used as feedstock for this project is likely the same material that could be used in the demonstration AD project.

SloanVAZQUEZ,LLC
Prepared for the City of Fort Collins Waste Stream Analysis Study & January 2012 – Final Draft Waste Conversion Technologies Review 39
4.0 CONCLUSIONS The City is striving for sustainable, system-wide solutions to both waste disposal, carbon reduction and renewable energy. To pursue these goals, the City asked the Sloan Vazquez and Clements team to analyze the City’s wastestream and evaluate the feasibility of new conversion technologies to divert portions of it from the landfill and generate renewable energy.
WASTE STREAM ANALYSIS The 2012 Waste Composition was primarly derived from the integration of hetergeneous data sources; the Larimer and Boulder County Studies. In addition, tonnage data collected by the City and anecdotal information gathered from local waste haulers and recyclers informed the analysis.
The 2012 Waste Composition identified three (3) primary waste streams; residential, commercial, and construction and demolition. Fourteen (14) material categories were selected in order to best identify opportunities for recovery and diversion from landfill disposal.
By applying the 2012 Waste Composition to the described conceptual landfill disposal reduction processes to increase recycling and create energy, the following outcomes are expected:
• 60% reduction in landfill disposal • Contribution to local economy of $6,100,000 annually • Generation of at least 3,300,000 kilowatt hours of electricity annually • 40% rate adjustment to offset the captial and operating costs of the landfill disposal
reduction processess
CONVERSION TECHNOLOGIES Although power pricing for renewable energy projects has increased in recent years to a respectable range of $0.09 to $0.12 per kWh, the other driving forces for conversion technology, namely landfill capacity and tipping fees remain “extensive” and “low” respectively. This indicates that for a conversion technology to be feasible economically, it will most likely include some of the following features:
• be small in scale • be supported by grants and/or low interest loans • take advantage of other local waste streams (breweries, ag operations), • partner with local industries willing to pay more for waste diversion and/or renewable
heat, electricity, or fuel in exchange for increased environmental benefit • take advantage of a Public/Private partnership with the City • take advantage ofexisting infrastructure such as the under-utilized digesters and energy
generation system at the Drake Water Reclamation Plant
In the near to mid-term, the most feasible CT projects for the City are:

SloanVAZQUEZ,LLC
Prepared for the City of Fort Collins Waste Stream Analysis Study & January 2012 – Final Draft Waste Conversion Technologies Review 40
1. Demonstration scale AD plant (approx. 15 TPD)for source-separated foodwaste and greenwaste
2. Small scale Thermal plant (25-100 TPD) for specialty feedstocks, possibly including wood recovered at the IRF
3. Addition of foodwaste to the Drake Water Reclamation Plant
In the long-term, the City should continue to track the progress of the first commercial-scale projects to go into operation in the U.S. and Canada over the next two years. Depending on landfill capacity and tipping fees, and refinement of these commercial-scale CT projects, there may be a future nexus where improved economics and environmental benefit make these projects more attractive in the City.

SloanVAZQUEZ,LLC
Prepared for the City of Fort Collins Waste Stream Analysis Study & January 2012 – Final Draft Waste Conversion Technologies Review 41
5.0 RECOMMENDATIONS
This section provides several recommendations for the City to consider in moving forward.
Waste Stream Analysis
1. Identify quantities of source-separated foodwaste and other organics for future CT projects 2. Consider municipal investment in solid waste management infrastructure (MRF) to
maximize long-term environmental and economic benefits to the community
Conversion Technologies
1. Plan field trips to operating CT facilitiies: a. the small AD facility at University of Wisconsin, Osh Kosh b. AD and gasification plants in Europe coupled with staff trips for related purposes
2. Issue a Request for Expressions of Interest or Request for Qualifications for a Demonstration AD project to process source-separated foodwaste and greenwaste:
a. It would be very beneficial if the City could identify a site for the CT project in the request as this shows the vendors that the City is serious and has value to add to the project
b. Also beneficial to: i. include a commitment from the City to purchase renewable electricity through
the PRPA at a certain price or price range ii. confirm that the City has control over a sufficient amount of foodwaste and
greenwaste to feed the project 3. Include the domonstration AD or small scale Thermal CT projects in the broader RFP to be
issued by the City early this year for system-wide solutions involving innovative waste management and energy generation
4. Follow the progress of the first generation smsall-scale and commercial scale CT projects currently in permitting or construction in the U.S. and Canada
5. Evaluate synergies with the IRF: a. Further refine the design and operation of the IRF to include a demonstration scale AD
project as an option b. Identify potential waste heat customers
i. Located within piping distance of the IRF (no more than ___ ft) ii. Willing to host the energy generation portion of the AD project which would
allow longer distance pumping of the biogas to an industrial location (e.g. a brewery)

SloanVAZQUEZ,LLC
Prepared for the City of Fort Collins Waste Stream Analysis Study & January 2012 – Final Draft Waste Conversion Technologies Review 42
This page left intentionally blank.

SloanVAZQUEZ,LLC
Prepared for the City of Fort Collins Waste Stream Analysis Study & January 2012 – Final Draft Waste Conversion Technologies Review A-1
6.0 APPENDICES
6.1 APPENDIX A – FORT COLLINS WASTE COMPOSITION METHODOLOGY
6.2 APPENDIX B – WASTE COMPOSITION STUDIES
6.2.1 BOULDER COUNTY – 2010 WASTE COMPOSITION STUDY
6.2.2 LARIMER COUNTY – TWO-SEASON WASTE COMPOSITION STUDY
6.3 APPENDIX C – WARM GHG EMISSIONS ANALYSIS

SloanVAZQUEZ,LLC
Prepared for the City of Fort Collins Waste Stream Analysis Study & January 2012 – Final Draft Waste Conversion Technologies Review A-2
This page left intentionally blank.

SloanVAZQUEZ,LLC
Prepared for the City of Fort Collins Waste Stream Analysis Study & January 2012 – Final Draft Waste Conversion Technologies Review A-3
6.1 APPENDIX A – FORT COLLINS WASTE COMPOSITION METHODOLOGY

SloanVAZQUEZ,LLC
Prepared for the City of Fort Collins Waste Stream Analysis Study & January 2012 – Final Draft Waste Conversion Technologies Review A-4
This page left intentionally blank.

SloanVAZQUEZ,LLC
Prepared for the City of Fort Collins Waste Stream Analysis Study & January 2012 – Final Draft Waste Conversion Technologies Review A-5
BACKGROUND The Fort Collins Waste Stream Study consisted of the development of new, data-based waste composition (2012 Waste Composition) of the waste generated from the City of Fort Collins that is currently landfilled. The 2012 Waste Composition is based primarily upon two prior waste composition studies; one prepared for Larimer County (Larimer County Study) and the other for Boulder County (Boulder County Study). In addition, the Project Team referred to tonnage data collected by the City, anecdotal information gathered from Larimer County Public Works/Solid Waste (including the observation of loads disposed at the Larimer County Landfill), local waste collection companies, and recyclers.
Each Study provides a waste composition of their respective waste stream by material categories for each generator sector class. The waste composition in these studies were developed by the physical sorting of material samples using well establish industry methodologies.
This Appendix provides a step by step description of the methodology used to produce the 2012 Waste Composition for the City of Fort Collins using the Boulder and Larimer County Studies.
METHDODOLOGY
Step One As shown in Table A1, the Larimer County Study used four waste generator sectors while the Boulder County Study used three. To facilitate the merger of two waste composition results, the generator sector used in each study were aligned or mapped to produce a common set of categories.
Table A1 – Waste Generator Sector Classes by Study
Larimer County Generator Sector
Boulder County Generator Sector
1. Residential 1. Residential 2. Commercial 2. Industrial, Commercial & Institutional (ICI) 3. Self-Haul 3. Mountain Drop Boxes 4. C&D Debris
To accomplish this, the Self-Haul tons from the Larimer County Study waste were combined into the Residential Sector category. Traditionally, self-hauls to a landfill originate from residents of the surrounding area. Similarly, the Mountain Drop Boxes from the Boulder County Study were combined into the Commercial Sector category.
Tonnage by generator sector for Larimer and Boulder County for the “Original Sectors” and “Mapped Sectors” is provided in Table A2 and Table A3, respectively.

SloanVAZQUEZ,LLC
Prepared for the City of Fort Collins Waste Stream Analysis Study & January 2012 – Final Draft Waste Conversion Technologies Review A-6
Table A2 – Larimer County Estimated Tonnage by Generator Sector3
Mapped Sectors Original Sectors Generator Tons Generator Tons
1. Residential 73,835 1. Residential 63,624 3. Self-Haul 10,211 2. Commercial 55,211 2. Commercial 55,211 4. C&D Debris 24,516 4. C&D Debris 24,516 TOTAL 153,562 TOTAL 153,562
Table A3 – Boulder County Estimated Tonnage by Generator Sector 4
Mapped Sectors Original Sectors Generator Tons Generator Tons
1. Residential 102,963 1. Residential 102,963 2. Commercial 42,057 2. Industrial, Commercial,
Institutional (ICI) 117,228
3. Mountain Drop Boxes 24,516 3. C&D Debris 75,797 TOTAL 220,817 TOTAL 220,817
Total for the C&D annual tonnage in the Boulder County Study were taken from table 3-7 of the same Study. The same C&D tons appeared to be counted in Table ES-1 within the Industrial/Commercial/Institutional generator sector. Due to this inclusion, the Industrial/Commercial/Institutional annual total tonnage was reduced by the C&D annual tonnage and moved to the C&D total tonnage so as to not change the overall annual tonnage provided in table 3-7, but allow for proper breakout of the C&D annual tons.
The combined tonnage for both Studies are summarized in Tabel A4.
Table A4 – Larimer and Boulder Counties Combined Tonnage
Residential Commercial C&D Total Larimer County 73,835 55,211 24,516 153,562 Boulder County 102,963 42,057 75,797 220,817 TOTAL 176,798 97,268 100,313 374,379
Percent 47.2% 26.0% 26.8% 100.0%
3 “Larimer County, Colorado Two-Season Waste Composition Study”, Final Report May 2007, p. 4-3, table 4-1, by Mid Atlantic Solid Waste Consultants. 4 “2010 WASTE COMPOSITION STUDY” Final Report, December 29, 2010, by MSW Consultants, Cascadia Consulting Group, Prepared for Boulder County Resource Conservation Division.

SloanVAZQUEZ,LLC
Prepared for the City of Fort Collins Waste Stream Analysis Study & January 2012 – Final Draft Waste Conversion Technologies Review A-7
Step Two Next, a weighted percentage attributable to each source (Study) by generator sector was calculated as indicated in Table A5. For example, for the Residential Generator Sector, 41.76% of the tonnage originated from the Larimer County Study while 58.24% originated from the Boulder County Study. The weighted percentage will be used to allocate the waste composition percentage results from each individual study to create a unified waste composition.
Table A5 – Weighted Percentage Calculation
Generator Sector
Residential Commercial C&D
SOURCE Tons Weighted Percent Tons
Weighted Percent Tons
Weighted Percent
Larimer County 73,835 41.76% 55,211 56.76% 24,516 24.44% Boulder County 102,963 58.24% 42,057 43.24% 75,797 75.56% TOTAL 176,798 100.00% 97,268 100.0% 100,313 100.00%
Step Three To facilitate the merger of two waste composition results, the material classifications used in each study were aligned or mapped to produce a common set of classifications. This procedure was done separately for each of the three waste generator sectors (i.e., residential, commercial, and construction & demolition debris). For the residential and commercial generator sectors, the Larimer County Study used ten material classifications while the Boulder used eight as shown in Table A6. The C&D generator sector used an expanded list appropriate for materials in that waste stream and is addressed separately in this document.
Table A6 – Waste Composition Classifications by Study
Boulder County Material Classifications
Larimer County Material Classifications
1. Paper 1. Paper Products 2. Plastic 2. Food Waste 3. Metal 3. Other 4. C&D 4. Plastics, Leather, Rubber 5. Glass 5. Yard Waste 6. Organics 6. Glass & Ceramics 7. Problem Waste 7. Textiles 8. HHW 8. Ferrous Metals
TOTAL 9. Wood Products 10. Non-Ferrous Metals TOTAL
Because the Boulder County study used less material classifications, the Larimer County material classifications were re-classified to conform to those used in the Boulder Study.

SloanVAZQUEZ,LLC
Prepared for the City of Fort Collins Waste Stream Analysis Study & January 2012 – Final Draft Waste Conversion Technologies Review A-8
The material labels used in the Larimer County Study were mapped to match those in the Boulder County study that represented the equivalent material category. Specifically, “Paper Products”, “Plastics, Leather, Rubber” and “Glass & Ceramics” as used in the Larimer County study were assigned to “Paper”, “Plastic”, and “Glass”, respectively, as used in the Boulder County study. Similarly, “Ferrous Metals” and “Non-Ferrous Metals” were assigned to “Metal”; “Food Waste”, “Yard Waste” and “Wood Products” were assigned to “Organics”; and “Other” and “Textiles” were assigned to “Problem Waste”.
Table A7 shows the Larimer County waste composition for the residential sector after mapping the material classifications to match those of the Boulder County Study.
Table A7 – Larimer County Waste Composition – Residential Sector
Residential Generator Sector Mapped Larimer County Original Larimer County
Material Classifications Percent Material Classifications Percent 1. Paper 31.4% 1. Paper Products 31.4% 2. Plastic 11.9% 4. Plastics, Leather,
Rubber 11.9%
3. Metal 4.7% 8. Ferrous Metals 3.0% 10. Non-Ferrous
Metals 1.7%
4. C&D 0.0% 5. Glass 3.5% 6. Glass & Ceramics 3.5% 6. Organics 28.8% 2. Food Waste 17.4%
5. Yard Waste 8.4% 9. Wood Products 3.0%
7. Problem Waste 19.7% 3. Other 16.4% 7. Textiles 3.3%
8. HHW 0.0%
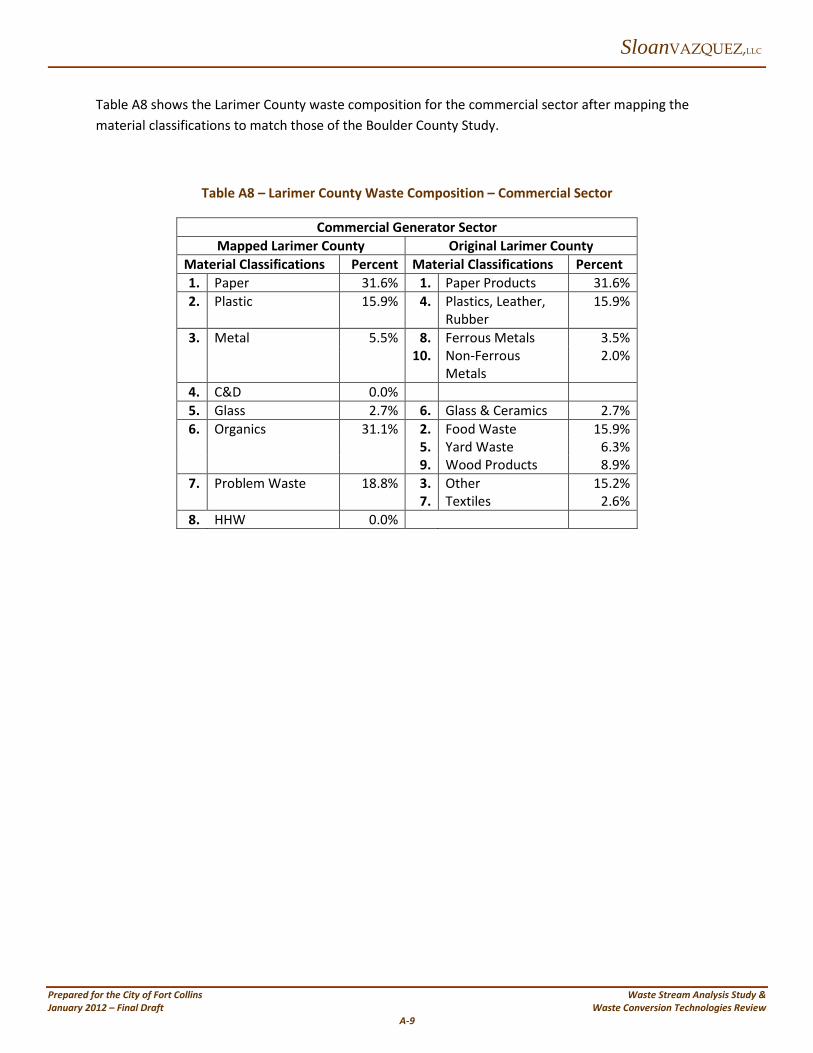
SloanVAZQUEZ,LLC
Prepared for the City of Fort Collins Waste Stream Analysis Study & January 2012 – Final Draft Waste Conversion Technologies Review A-9
Table A8 shows the Larimer County waste composition for the commercial sector after mapping the material classifications to match those of the Boulder County Study.
Table A8 – Larimer County Waste Composition – Commercial Sector
Commercial Generator Sector Mapped Larimer County Original Larimer County
Material Classifications Percent Material Classifications Percent 1. Paper 31.6% 1. Paper Products 31.6% 2. Plastic 15.9% 4. Plastics, Leather,
Rubber 15.9%
3. Metal 5.5% 8. Ferrous Metals 3.5% 10. Non-Ferrous
Metals 2.0%
4. C&D 0.0% 5. Glass 2.7% 6. Glass & Ceramics 2.7% 6. Organics 31.1% 2. Food Waste 15.9%
5. Yard Waste 6.3% 9. Wood Products 8.9%
7. Problem Waste 18.8% 3. Other 15.2% 7. Textiles 2.6%
8. HHW 0.0%

SloanVAZQUEZ,LLC
Prepared for the City of Fort Collins Waste Stream Analysis Study & January 2012 – Final Draft Waste Conversion Technologies Review A-10
As previously stated, the construction and demolition debris generator sector had an expanded list of material classifications more appropriate to that waste stream. In this case, the material classifications used in the Boulder County Study were re-classified to conform to those used in the Larimer County Study. Additionally, For the Boulder County Study, “Dirt/Sand” which was included in the “Organics” classification was re-classified into the “Rock/Concrete/Brick” classification for consistency. This adjustment is shown on Table A9.
Table A9 – Boulder County Waste Composition Adjustment
Boulder County
Material Categories Original Percent Adj
Adjusted Percent
1. Paper 0.5% 0.5% 2. Plastic 0.6% 0.6% 3. Metal 2.1% 2.1% 4. Glass 0.3% 0.3% 5. Organics 13.4% -10.2 3.2% 6. Problem Waste 0.7% 0.7% 7. Rock/Concrete/Brick 27.5% 10.2 37.7% 8. Asphalt Shingles 19.1% 19.1% 9. Painted/Stained/Tre
ated Wood 12.7% 12.7%
10. Untreated Dimensional Lumber
3.7% 3.7%
11. Clean/New Drywall 6.7% 6.7% 12. Demo/Painted
Drywall 8.8% 8.8%
13. Other C&D 3.9% 3.9% TOTAL 100.0% 100.0%

SloanVAZQUEZ,LLC
Prepared for the City of Fort Collins Waste Stream Analysis Study & January 2012 – Final Draft Waste Conversion Technologies Review A-11
Table A10 shows the Larimer County waste composition for the construction and demolition debris sector after mapping the material classifications to match those of the Boulder County Study.
Table A10 – Re-classification of Larimer County to Conform to Boulder County
Original Larimer County Material Categories
Mapped to Boulder County Material
Categories 1. Paper 0.0% 2. Plastic 0.0% 3. Metal 2.4% 10. Other Ferrous
Metal 2.4%
4. Glass 3.9% 9. Other Broken Glass
3.9%
5. Organics 10.9 5. Clean Wood 10.9% 6. Problem Waste 17.2% 3. Carpet 11.8%
5.4% 8. Other Inorganics 5.4% 7. Rock/Concrete/Brick 11.2% 4. Block/Brick/Stone 11.2% 8. Asphalt Shingles 14.7% 2. Asphalt Shingles 14.7% 9. Painted/Stained/Treated
Wood 6.0% 7. Painted/Stained
Wood 6.0%
10. Untreated Dimensional Lumber
10.3% 6. Other Wood 10.3%
11. Clean New Drywall 12. Demo Painted Drywall 15.1% 1. Drywall 15.1% 13. Other C&D 8.3% 11. Other 8.3%
TOTAL 100.0% TOTAL 100.0%

SloanVAZQUEZ,LLC
Prepared for the City of Fort Collins Waste Stream Analysis Study & January 2012 – Final Draft Waste Conversion Technologies Review A-12
Step Four The next step is to combine the two waste compositions into one by applying the percentage weights applicable to each source (Study) for each generator sector (residential, commercial, construction & demolition debris). The percentage weights were calculated in Step One and are shown in Table 12.
The combined waste composition for the residential sector is provided in Table A11.
Table A11 – Combined Waste Composition – Residential Sector
Boulder County Waste Composition
Larimer County Waste Composition
Combined Waste
Composition Material Classification Percent Weighted
at 58.24% Percent Weighted
at 41.76% Percent
1. Paper 12.5% 7.28% 13.11% 20.39% 2. Plastic 12.6% 7.34% 11.9% 4.97% 12.31% 3. Metal 2.6% 1.51% 4.7% 1.96% 3.48% 4. C&D 4.7% 2.74% 0.0% 0.00% 2.74% 5. Glass 1.5% 0.87% 3.5% 1.46% 2.34% 6. Organics 48.0% 27.96% 28.8% 12.03% 39.98% 7. Problem Waste 18.0% 10.48% 19.7% 8.23% 18.71% 8. HHW 0.1% .06% 0.0% 0.00% 0.06% TOTAL 100.0% 58.24 100.0% 41.76% 100.00%
The combined waste composition for the commercial sector is provided in Table A12.
Table A12 – Combined Waste Composition – Commercial Sector
Boulder County Waste Composition
Larimer County Waste Composition
Combined Waste
Composition Material Classification Percent Weighted
at 43.24% Percent Weighted
at 56.76% Percent
1. Paper 20.20% 8.73% 31.60% 17.94% 26.67% 2. Plastic 13.70% 5.92% 11.22% 6.37% 12.29% 3. Metal 4.70% 2.03% 5.50% 3.12% 5.15% 4. C&D 9.30% 4.02% 0.0% 0.00% 4.02% 5. Glass 2.90% 1.25% 2.70% 1.53% 2.79% 6. Organics 35.9% 15.52% 31.14% 17.68% 33.20% 7. Problem Waste 13.00% 5.62% 17.84% 10.13% 15.75% 8. HHW 0.30% .13% 0.0% 0.00% 0.13% TOTAL 100.0% 43.24 100.0% 56.76% 100.00%

SloanVAZQUEZ,LLC
Prepared for the City of Fort Collins Waste Stream Analysis Study & January 2012 – Final Draft Waste Conversion Technologies Review A-13
The combined waste composition for the construction and demolition debris sector is provided in Table A13.
Table A13 – Combined Waste Composition – Construction & Demolition Debris Sector
Boulder County Waste Composition
Larimer County Waste Composition
Combined Waste
Composition Material Classification Percent Weighted
at 75.56% Percent Weighted
at 24.44% Percent
1. Paper 0.50% 0.38% 0.00% 0.00% 0.38% 2. Plastic 0.60% 0.45% 0.00% 0.00% 0.45% 3. Metal 2.10% 1.59% 2.40% 0.59% 2.17% 4. Glass 0.30% 0.23% 3.90% 0.95% 1.18% 5. Organics 3.20% 2.42% 10.9% 2.66% 5.08% 6. Problem Waste 0.70% 0.53% 17.20% 4.20% 4.73% 7. Rock/Concrete/Brick 37.70% 28.49% 11.20% 2.74% 31.22% 8. Asphalt Shingles 19.10% 14.43% 14.70% 3.59% 18.02% 9. Painted/Stained/Treated
Wood 12.70% 9.60% 6.00% 1.47% 11.06%
10. Untreated Dimensional Lumber
3.70% 2.80% 10.30% 2.52% 5.31%
11. Clean New Drywall 6.70% 5.06% 0.00% 0.00% 5.06% 12. Demo Painted Drywall 8.80% 6.65% 15.10% 3.69% 10.34% 13. Other C&D 3.90% 2.95% 8.30% 2.03% 4.98%
TOTAL 100.0% 75.56% 100% 24.44% 100.00%
Step Five The next step is to expand the construction and demolition debris category within the residential and commercial generator sectors by allocating the proportionate share from the construction and demolition generator sector.
Table A14 provides the steps taken to adjust the combined residential waste composition to include the additional construction and demolition classifications. Column A in Table 22 represents the combined residential waste composition from Table 19. The C&D classification represents 2.74% of the total. However, the C&D classification can be further broken down into the classifications used in the C&D waste generator sector composition. This is accomplished by multiplying the 2.74% (Column B) by the percentage for each material classification from the C&D waste composition (Column C). The resultant amount (Column D) is then added to the combined residential material classification (Column A). The final residential waste composition is shown in Column E.
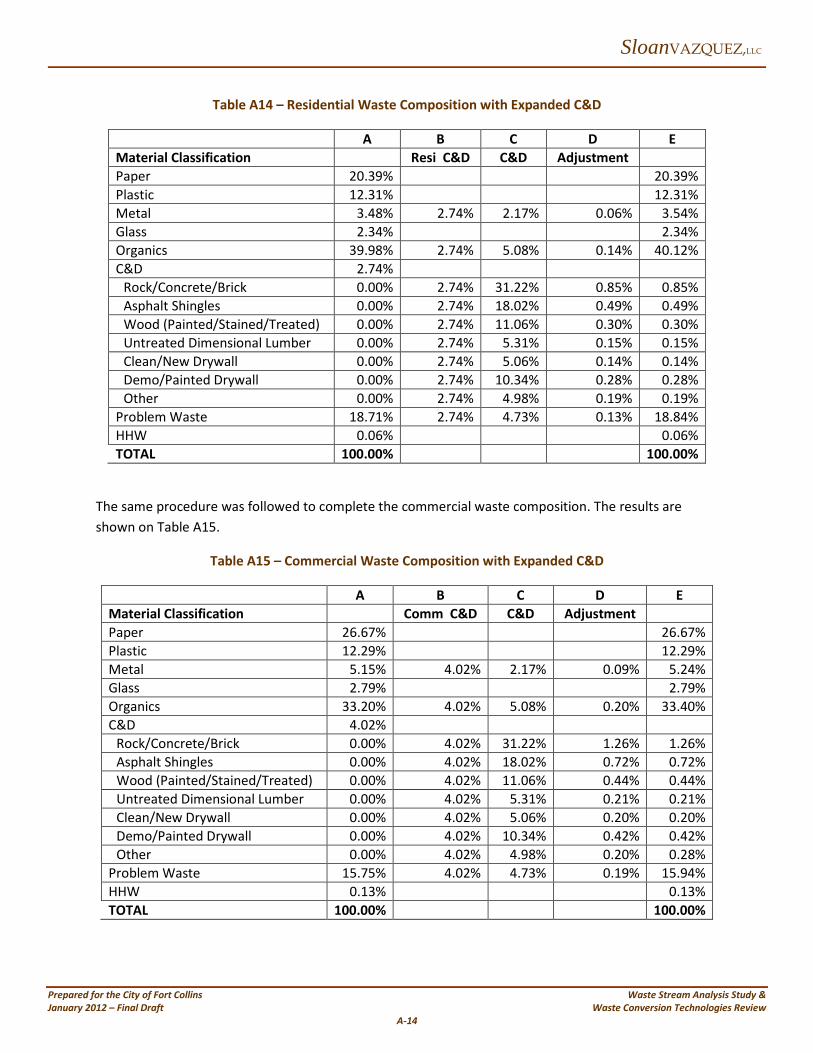
SloanVAZQUEZ,LLC
Prepared for the City of Fort Collins Waste Stream Analysis Study & January 2012 – Final Draft Waste Conversion Technologies Review A-14
Table A14 – Residential Waste Composition with Expanded C&D
A B C D E Material Classification Resi C&D C&D Adjustment Paper 20.39% 20.39% Plastic 12.31% 12.31% Metal 3.48% 2.74% 2.17% 0.06% 3.54% Glass 2.34% 2.34% Organics 39.98% 2.74% 5.08% 0.14% 40.12% C&D 2.74%
Rock/Concrete/Brick 0.00% 2.74% 31.22% 0.85% 0.85% Asphalt Shingles 0.00% 2.74% 18.02% 0.49% 0.49% Wood (Painted/Stained/Treated) 0.00% 2.74% 11.06% 0.30% 0.30% Untreated Dimensional Lumber 0.00% 2.74% 5.31% 0.15% 0.15% Clean/New Drywall 0.00% 2.74% 5.06% 0.14% 0.14% Demo/Painted Drywall 0.00% 2.74% 10.34% 0.28% 0.28% Other 0.00% 2.74% 4.98% 0.19% 0.19%
Problem Waste 18.71% 2.74% 4.73% 0.13% 18.84% HHW 0.06% 0.06% TOTAL 100.00% 100.00%
The same procedure was followed to complete the commercial waste composition. The results are shown on Table A15.
Table A15 – Commercial Waste Composition with Expanded C&D
A B C D E Material Classification Comm C&D C&D Adjustment Paper 26.67% 26.67% Plastic 12.29% 12.29% Metal 5.15% 4.02% 2.17% 0.09% 5.24% Glass 2.79% 2.79% Organics 33.20% 4.02% 5.08% 0.20% 33.40% C&D 4.02%
Rock/Concrete/Brick 0.00% 4.02% 31.22% 1.26% 1.26% Asphalt Shingles 0.00% 4.02% 18.02% 0.72% 0.72% Wood (Painted/Stained/Treated) 0.00% 4.02% 11.06% 0.44% 0.44% Untreated Dimensional Lumber 0.00% 4.02% 5.31% 0.21% 0.21% Clean/New Drywall 0.00% 4.02% 5.06% 0.20% 0.20% Demo/Painted Drywall 0.00% 4.02% 10.34% 0.42% 0.42% Other 0.00% 4.02% 4.98% 0.20% 0.28%
Problem Waste 15.75% 4.02% 4.73% 0.19% 15.94% HHW 0.13% 0.13% TOTAL 100.00% 100.00%

SloanVAZQUEZ,LLC
Prepared for the City of Fort Collins Waste Stream Analysis Study & January 2012 – Final Draft Waste Conversion Technologies Review A-15
Step Six The final step is to adjust the waste composition for each waste generator sector by its proportion to the total tonnage represented in the two Studies. This amount was calculated in Table A4 for each generator sector and has been entered into Table A16 in row 3, columns C, E, and G. Each material classification for each generator sector was multiplied by this factor to calculate an adjusted amount. For example, for paper in the residential generator sector, Column 20.39% is multiplied by 47.2% to arrive at 9.63%. This process was followed for each classification and for each generator sector. Finally, the amounts in Column C, E, and F were added for each row and entered into Column H.
Table A16 – Waste Composition Adjustment by Residential, Commercial & CD
A B C D E F G H Residential Commercial C&D TOTAL Material Classification 47.2% 26.0% 26.8% Paper 20.39% 9.63% 26.67% 6.93% 26.67% 0.10% 16.66% Plastic 12.31% 5.81% 12.29% 3.19% 12.29% 0.12% 9.13% Metal 3.54% 1.67% 5.24% 1.36% 5.24% 0.58% 3.61% Glass 2.34% 1.10% 2.79% 0.72% 2.79% 0.32% 2.14% Organics 40.12% 18.95% 33.40% 8.68% 33.40% 1.36% 28.99% C&D Rock/Concrete/Brick 0.85% 0.40% 1.26% 0.33% 1.26% 8.37% 9.10% Asphalt Shingles 0.49% 0.23% 0.72% 0.19% 0.72% 4.83% 5.25% Wood (Painted/Stained/Treated)
0.30% 0.14% 0.44% 0.12% 0.44% 2.96% 3.22%
Untreated Dimensional Lumber
0.15% 0.07% 0.21% 0.06% 0.21% 1.42% 1.55%
Clean/New Drywall 0.14% 0.07% 0.20% 0.05% 0.20% 1.36% 1.47% Demo/Painted Drywall 0.28% 0.13% 0.42% 0.11% 0.42% 2.77% 3.01% Other 0.19% 0.09% 0.28% 0.07% 0.28% 1.33% 1.50% Problem Waste 18.84% 8.90% 15.94% 4.14% 15.94% 1.27% 14.31% HHW 0.06% 0.03% 0.13% 0.03% 0.13% 0.00% 0.06% TOTAL 100.00% 47.20% 100.00% 25.98 100.00% 26.79 100.0%

SloanVAZQUEZ,LLC
Prepared for the City of Fort Collins Waste Stream Analysis Study & January 2012 – Final Draft Waste Conversion Technologies Review A-16
Table A17 – Fort Collins 2012 Waste Composition
Residential Commercial C&D Total Material Classification Percent Percent Percent Percent Tonnage Paper 9.63% 6.93% 0.10% 16.66% 21,658 Plastic 5.81% 3.19% 0.12% 9.13% 11,869 Metal 1.67% 1.36% 0.58% 3.61% 4,693 Glass 1.10% 0.72% 0.32% 2.14% 2,782 Organics 18.95% 8.68% 1.36% 28.99% 37,687 C&D Rock/Concrete/Brick 0.40% 0.33% 8.37% 9.10% 11,830 Asphalt Shingles 0.23% 0.19% 4.83% 5.25% 6,825 Wood (Painted/Stained/Treated)
0.14% 0.12% 2.96% 3.22% 4,186
Untreated Dimensional Lumber
0.07% 0.06% 1.42% 1.55% 2,015
Clean/New Drywall 0.07% 0.05% 1.36% 1.47% 1,911 Demo/Painted Drywall 0.13% 0.11% 2.77% 3.01% 3,913 Other 0.09% 0.07% 1.33% 1.50% 1,950 Problem Waste 8.90% 4.14% 1.27% 14.31% 18,603 HHW 0.03% 0.03% 0.00% 0.06% 78 TOTAL 47.20% 25.98 26.79 100.0% 130,000

SloanVAZQUEZ,LLC
Prepared for the City of Fort Collins Waste Stream Analysis Study & January 2012 – Final Draft Waste Conversion Technologies Review A-15
6.2 APPENDIX B – WASTE COMPOSITION STUDIES
6.2.1 BOULDER COUNTY – 2010 WASTE COMPOSITION STUDY
6.2.2 LARIMER COUNTY – TWO-SEASON WASTE COMPOSITION STUDY


2010 WASTE COMPOSITION STUDY
Prepared for: BOULDER COUNTY RESOURCE
CONSERVATION DIVISION
Final Report December 29, 2010
vember

MidAtlantic Solid Waste Consultants Boulder County WCS Cascadia Consulting Group
ACKNOWLEDGEMENTS
The Project Team of MidAtlantic Solid Waste Consultants (MSW Consultants) and Cascadia Consulting Group would like to thank the management and participating operations staff of the following transfer station, landfill, and private waste collection companies that hosted field data collection events for their assistance during various stages of this project.
Lisa Friend, Sustainability Planner, Boulder County Commissioners’ Office;
Hillary Collins, Assistant Manager, Boulder County Resource Conservation Division;
Charles Kamenides, Operations Manager, City of Longmont;
Gary Horton, General Manager, Western Disposal Transfer Station;
Larry Shea, Operations Manager, Western Disposal Waste Collection;
Jeff Burrier, District Manager, Waste Connections, Erie Landfill;
Chris Gronquist, Operations Manager, Waste Connections, Erie Landfill;
Scott McDonald, Operations Manager, McDonald Farms.
Additionally, the Project Team would like to thank all of the active municipal solid waste (MSW) public and private haulers, all of which were contacted and surveyed to provide disposal data that was used to both formulate the sampling plan for the field work, and to accurately aggregate the resulting waste composition data. We would also like to thank City of Longmont for providing loads of segregated multi-family wastes to be sampled and sorted at the Erie Landfill.
Prime Contractor
MidAtlantic Solid Waste Consultants, LLC 6225 Sawyer Road, New Market, MD 21774 (301) 607-6428
Subcontractor
Cascadia Consulting Group

ACKNOWLEDGEMENTS
Boulder County WCS MidAtlantic Solid Waste Consultants Cascadia Consulting Group
This page intentionally left blank.
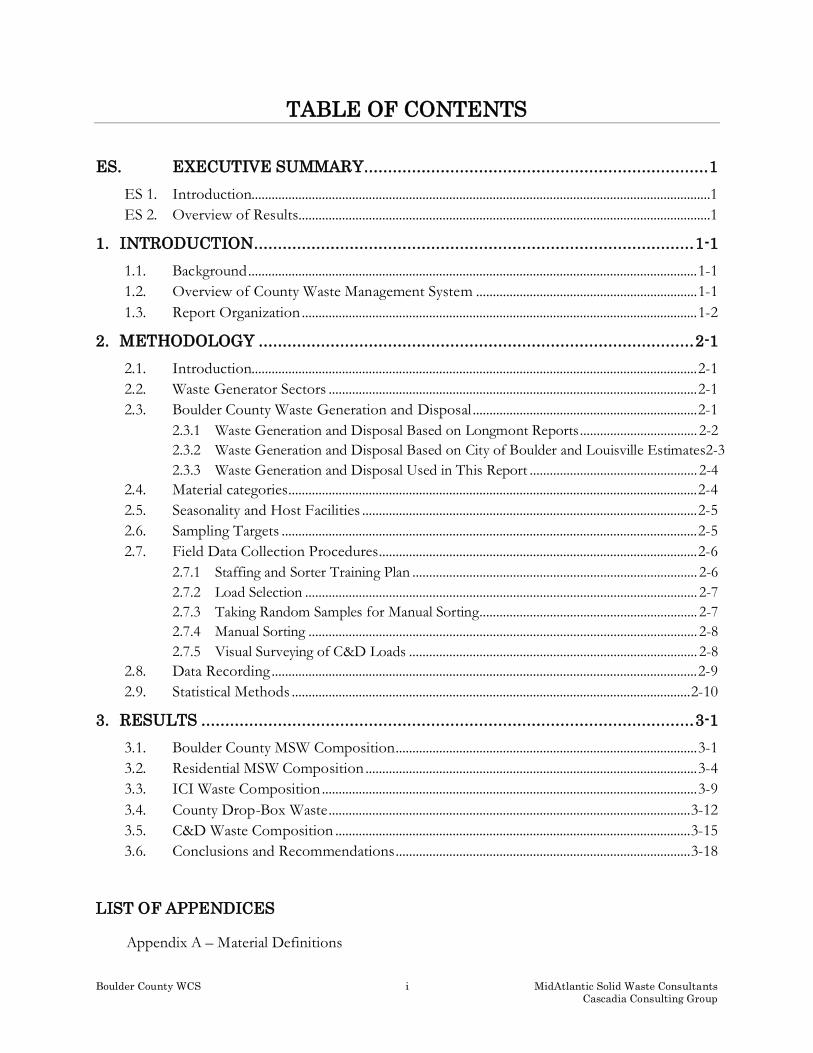
Boulder County WCS i MidAtlantic Solid Waste Consultants Cascadia Consulting Group
TABLE OF CONTENTS
ES. EXECUTIVE SUMMARY ........................................................................ 1
ES 1. Introduction.........................................................................................................................................1 ES 2. Overview of Results...........................................................................................................................1
1. INTRODUCTION ............................................................................................ 1-1
1.1. Background ...................................................................................................................................... 1-1 1.2. Overview of County Waste Management System .................................................................. 1-1 1.3. Report Organization ...................................................................................................................... 1-2
2. METHODOLOGY ........................................................................................... 2-1
2.1. Introduction..................................................................................................................................... 2-1 2.2. Waste Generator Sectors .............................................................................................................. 2-1 2.3. Boulder County Waste Generation and Disposal ................................................................... 2-1
2.3.1 Waste Generation and Disposal Based on Longmont Reports ................................... 2-2 2.3.2 Waste Generation and Disposal Based on City of Boulder and Louisville Estimates2-3 2.3.3 Waste Generation and Disposal Used in This Report .................................................. 2-4
2.4. Material categories .......................................................................................................................... 2-4 2.5. Seasonality and Host Facilities .................................................................................................... 2-5 2.6. Sampling Targets ............................................................................................................................ 2-5 2.7. Field Data Collection Procedures ............................................................................................... 2-6
2.7.1 Staffing and Sorter Training Plan ..................................................................................... 2-6 2.7.2 Load Selection ..................................................................................................................... 2-7 2.7.3 Taking Random Samples for Manual Sorting................................................................. 2-7 2.7.4 Manual Sorting .................................................................................................................... 2-8 2.7.5 Visual Surveying of C&D Loads ...................................................................................... 2-8
2.8. Data Recording ............................................................................................................................... 2-9 2.9. Statistical Methods ....................................................................................................................... 2-10
3. RESULTS ....................................................................................................... 3-1
3.1. Boulder County MSW Composition .......................................................................................... 3-1 3.2. Residential MSW Composition ................................................................................................... 3-4 3.3. ICI Waste Composition ................................................................................................................ 3-9 3.4. County Drop-Box Waste ............................................................................................................ 3-12 3.5. C&D Waste Composition .......................................................................................................... 3-15 3.6. Conclusions and Recommendations ........................................................................................ 3-18
LIST OF APPENDICES
Appendix A – Material Definitions

TABLE OF CONTENTS
MidAtlantic Solid Waste Consultants ii Boulder County WCS Cascadia Consulting Group
Appendix B – Field Forms List of Figures
Figure ES-1 Boulder County MSW Composition, 2010 ................................................................................. 2 Figure 2-1 Example of a Grab Sample Staged for Manual Sorting .......................................................... 2-7 Figure 2-2 Sort Table and Bins ......................................................................................................................... 2-8 Figure 3-1 Boulder County MSW Composition, 2010 ................................................................................. 3-1 Figure 3-2 Top 10 Most Prevalent Material Categories in Boulder County MSW ............................... 3-2 Figure 3-3 Boulder County Residential Waste Composition, 2010 ........................................................... 3-4 Figure 3-4 Top 10 Most Prevalent Material Categories in Residential Waste ........................................ 3-5 Figure 3-5 Boulder County ICI Waste Composition, 2010 ......................................................................... 3-9 Figure 3-6 Top 10 Most Prevalent Material Categories in ICI Waste....................................................3-10 Figure 3-7 Boulder County Foothill Transfer Site Waste Composition, 2010 ......................................3-12 Figure 3-8 Top 10 Most Prevalent Material Categories in County Drop-box Waste .........................3-13 Figure 3-9 C&D Waste Composition, 2010 ..................................................................................................3-15 Figure 3-10 Top 10 Most Prevalent Material Categories in C&D Waste..............................................3-16 Figure 3-11 C&D Waste Composition by C&D Material Category ........................................................3-17
List of Tables
Table ES-1 Estimated Countywide MSW Disposal by Generator Sector .................................................. 2 Table ES-2 Top 5 Most Prevalent Material Categories ................................................................................... 3 Table 2-1 Boulder County Waste Generation ............................................................................................... 2-2 Table 2-2 Estimated Countywide MSW Generation and Disposal by Generator Sector Based on
Reported Longmont Data .......................................................................................................................... 2-3 Table 2-3 Estimated Countywide MSW Generation and Disposal by Generator Sector Based on
Hauler Report Assumptions from the Cities of Boulder and Louisville ......................................... 2-3 2-4 Countywide MSW Disposal Used in This Report ................................................................................. 2-4 Table 2-5 Field Data Collection Schedule ...................................................................................................... 2-5 Table 2-6 Planned vs. Actual Distribution Samples ..................................................................................... 2-6 Table 3-1 Boulder County Detailed MSW Composition ............................................................................ 3-3 Table 3-2 Comparison of Top Ten Materials in the Single Family and Multi-Family Waste ............. 3-6 Table 3-3 2010 Detailed Residential Waste Composition .......................................................................... 3-7 Table 3-4 2010 Comparison of Single Family and Multi-Family Waste Composition......................... 3-8 Table 3-5 2010 Detailed ICI Waste Composition ......................................................................................3-11 Table 3-6 2010 Detailed Foothill Transfer Site Waste Composition .....................................................3-14 Table 3-7 2010 Detailed C&D Waste Composition ..................................................................................3-16 Table 3-8 Mapping of C&D Material Categories to Groups ...................................................................3-18

Boulder County WCS ES-1 MidAtlantic Solid Waste Consultants Cascadia Consulting Group
ES. EXECUTIVE SUMMARY
ES 1. INTRODUCTION Boulder County has long been at the forefront of progressive waste management and recycling. To better understand the opportunities available for increasing recycling and diversion of wastes in Boulder County, the County retained the Project Team of MidAtlantic Solid Waste Consultants (MSW Consultants) and Cascadia Consulting Group (Cascadia) to conduct a statistically representative analysis of the County’s disposed waste stream. This study sought to meet the following objectives:
Quantify the amount of disposed wastes generated in Boulder County, in total and by generator sector.
Estimate and compare the composition of wastes from individual generator sectors as well as in the aggregate.
Provide feedback to recycling and solid waste planners in the County and within incorporated municipalities about the efficacy of existing recycling programs so that those programs can maintain or increase their effectiveness.
Identify materials that represent future opportunities for increasing diversion in Boulder County.
Establish a baseline so that future waste composition studies can be performed to inform the County as it makes its way towards its zero waste goal.
For solid waste and recycling planners, it is important to differentiate between the sources of wastes so that recycling and diversion programs can be properly targeted. This study defines the following sub-streams of MSW that were targeted for separate sampling and analysis:
Single Family Residential: Waste generated in single family households.
Multi-family Residential: Waste generated in multi-family apartments and condominiums.
Industrial, Commercial and Institutional (ICI): Waste generated by industrial, commercial, institutional, and other non-residential sources.
Construction and Demolition (C&D): Wastes generated as a result of construction, renovation, and demolition activities.
The study also separately obtained and analyzed samples of wastes disposed at the County’s foothill transfer station sites.
ES 2. OVERVIEW OF RESULTS Table ES-1 summarizes the estimated quantity of materials generated in Boulder County that require disposal in a landfill. This information was compiled from a combination of County reports, hauler interviews, and extrapolation of waste generation based on unit generation rates. As shown, Boulder County generated almost 221,000 tons of material that was delivered to a local transfer station or landfill for disposal.

EXECUTIVE SUMMARY
MidAtlantic Solid Waste Consultants ES -2 Boulder County WCS Cascadia Consulting Group
Table ES-1 Estimated Countywide MSW Disposal by Generator Sector
Generator Sector Tons Percent Residential 102,963 46.6%
Industrial, Commercial and Institutional (ICI) 117,228 53.1%
Mountain Drop Boxes 626 0.3%
Total MSW 220,817 100.0%
Figure ES-1 shows the breakdown of major material groups for the aggregate Boulder County waste stream (encompassing residential and ICI wastes, but excluding C&D). Results are shown in estimated percent composition disposed. As shown, Organics is far and away the largest material group, followed by Paper, Problem Waste, and Plastic.
Figure ES-1 Boulder County MSW Composition, 2010
Paper, 16.6% 36,597 Tons
Plastic, 13.2% 29,180 Tons
Metal, 3.8%8,315 Tons
C&D, 7.2% 15,800 Tons
Glass, 2.2% 4,941 Tons
Organics, 41.5% 91,692 Tons
Problem Waste, 15.3%
33,859 Tons
Household Hazardous, 0.2%
432 Tons

EXECUTIVE SUMMARY
Boulder County WSC ES-3 MidAtlantic Solid Waste Consultants Cascadia Consulting Group
Table ES-2 shows the five most prevalent individual material categories disposed by residential, ICI, and C&D generating sectors. The percent composition is shown in the table.
Table ES-2 Top 5 Most Prevalent Material Categories
Ranking Residential ICI C&D
1 Food Waste (13.1%) Food Waste (14.9%) Rock/Concrete/Brick (27.5%)
2 Mixed Yard Waste (12.9%)
Compostable Paper (7.1%) Asphalt Shingles (19.1%)
3 Textiles/Leather (7.7%) Corrugated Cardboard (6.7%)
Painted/Stained/Treated Wood (12.7%)
4 Furniture/Bulky Items (6.9%)
Other Rigid Plastics (6.2%) Dirt/Sand (10.2%)
5 Other Rigid Plastics (6.5%)
Other plastic Film (4.4%) Demo/Painted Drywall (8.8%)
Top 5 47.1% 39.2% 78.3% Full results for the County as a whole, as well as for individual generator sectors, is contained in the full report.

EXECUTIVE SUMMARY
MidAtlantic Solid Waste Consultants ES -4 Boulder County WCS Cascadia Consulting Group
This page intentionally left blank.
Boulder County WCS 1-1 MidAtlantic Solid Waste Consultants Cascadia Consulting Group
1. INTRODUCTION
1.1. BACKGROUND Boulder County has long been at the forefront of progressive waste management and recycling. In November 2005 the Board of County Commissioners passed a resolution seeking to achieve Zero Waste (or “darn near”) by 2025. Doing so will require an acute focus on changing an entire mindset from waste management to materials management.
To aggressively pursue a zero waste goal, it is critical to understand the amount and composition of the waste stream that is currently being disposed. If wastes are to be turned into resources, it is imperative to know what those resources are. Anecdotal information and available market data suggest that recent history – including the economic downturn in late 2008 and 2009, disruption in the markets for recyclable materials, a crash in the housing and construction market, and the continued changes in product packaging and consumption trends, to name examples – appear to have impacted both waste volume and composition on a national and local scale.
The County retained the Project Team of MidAtlantic Solid Waste Consultants (MSW Consultants) and Cascadia Consulting Group (Cascadia) to conduct a statistically representative analysis of the County’s disposed waste stream. This study sought to meet the following objectives:
Quantify the amount of disposed wastes generated in Boulder County, in total and by generator sector.
Estimate and compare the composition of wastes from individual generator sectors as well as in the aggregate.
Provide feedback to recycling and solid waste planners in the County and within incorporated municipalities about the efficacy of existing recycling programs so that those programs can maintain or increase their effectiveness.
Identify materials that represent future opportunities for increasing diversion in Boulder County.
Establish a baseline so that future waste composition studies can be performed to inform the County as it makes its way towards its zero waste goal.
1.2. OVERVIEW OF COUNTY WASTE MANAGEMENT SYSTEM The U.S. Census Bureau indicates a county-wide population of almost 300,000, with approximately two-thirds residing in the cities of Boulder and Longmont. There are a total of 10 incorporated cities and towns in the County, as well as unincorporated area that is spread around the population centers and up into the foothills of the Rocky Mountains.
Solid waste collection and disposal within the County is performed by 19 or more collection companies (and public operations), as well as through citizen self-haul in the rural areas. The cities of Lafayette and Louisville contract for residential waste collection; Longmont provides
1. INTRODUCTION
MidAtlantic Solid Waste Consultants 1-2 Boulder County WCS Cascadia Consulting Group
public collection services to its residents. Additionally, the City of Boulder is predominantly served by Western Disposal, which also owns the in-county transfer station. However, residential collection in the rest of the County, as well as all commercial collection, is provided via open market. While the County receives reports from haulers on collected quantities, these data are provided in the aggregate and do not inform about waste generation by generator sector or by municipality.
Boulder County and its municipalities are aggressive recyclers. Curbside recycling is offered in most of the municipalities, and the County provides a network of drop-off centers for use by residents and small businesses for recycling containers, paper, and yard waste (residents only). Pay-as-you-throw (PAYT) rates are standard in several municipalities. Boulder County owns a recycling processing center where single stream materials are delivered for sortation and sale to markets. The County offers resources to its residents about hard-to-recycle items through a local non-profit organization.
Boulder County’s disposed wastes are currently delivered to at least four disposal facilities. However, significant fractions of wastes are delivered to the Western Disposal Transfer Station in the City of Boulder, as well as direct haul to Waste Connection Denver Regional Erie Landfill in Erie, Colorado. Boulder County wastes also end up at the Larimer County Landfill, BFI Foothills Landfill, and Front Range Landfill.
1.3. REPORT ORGANIZATION The remainder of this report presents the methodology and results of the Boulder County waste composition study. The report is divided into the following sections:
Methodology: This section provides an overview of waste generation and disposal data available from County reports and supplemented with direct surveys, and provides the detailed sampling plan that was developed to govern the study process and to provide statistically defensible data. This section also summarizes the field data collection methods and analytical methods applied in the study.
Results: Detailed results about the composition of the County’s landfilled waste are presented in this section. Results are presented in both tabular and graphical format to highlight findings of interest. Results are presented in the aggregate and by generator sector.
Appendices: Supplemental data and field data collection forms are contained in several appendices. Specific appendices include detailed material category definitions for MSW and C&D waste, and field data forms.

Boulder County WCS 2-1 MidAtlantic Solid Waste Consultants Cascadia Consulting Group
2. METHODOLOGY
2.1. INTRODUCTION Boulder County, Colorado engaged the Project Team of MidAtlantic Solid Waste Consultants (MSW Consultants) and Cascadia Consulting Group (Cascadia) to conduct a waste composition study of Boulder County wastes.
The Project Team submitted a full proposal and approach for conducting a baseline study of waste composition within Boulder County. The Project Team’s full approach, including sampling plan development, sampling procedures, field data collection methods, and statistical analysis, was contained in the original proposal. It has been summarized in this section, along with the results of subsequent hauler surveys and waste generation research that was conducted to develop specific sampling targets at the host disposal facilities within and adjacent to Boulder County.
2.2. WASTE GENERATOR SECTORS This project analyzed the composition of the County’s aggregate waste stream, as well as individually from the following generator sectors:
Single Family Residential: Waste generated in single family households.
Multi-family Residential: Waste generated in multi-family apartments and condominiums.
Industrial, Commercial and Institutional (ICI): Waste generated by industrial, commercial, institutional, and other non-residential source.
Construction and Demolition (C&D): Wastes generated as a result of construction, renovation, and demolition activities.
The study also separately obtained and analyzed samples of wastes disposed at the County’s foothill transfer station sites.
2.3. BOULDER COUNTY WASTE GENERATION AND DISPOSAL
In order to aggregate the results of the waste composition analysis for each of the generator sectors, it is necessary to derive waste generation and waste disposal, both in total and by generator sector. Boulder County has previously expended effort to document its waste generation rate as part of its zero waste planning efforts. Table 2-1 summarizes the three waste generation estimates contained in a March 2009 report that attempted to model waste generation.1
1 Boulder County Zero Waste Model, Skumatz Economic Research Associates, March 2009.
This report concluded that the best estimate of County waste generation was 344,532 tons, shown in the middle row of the table.
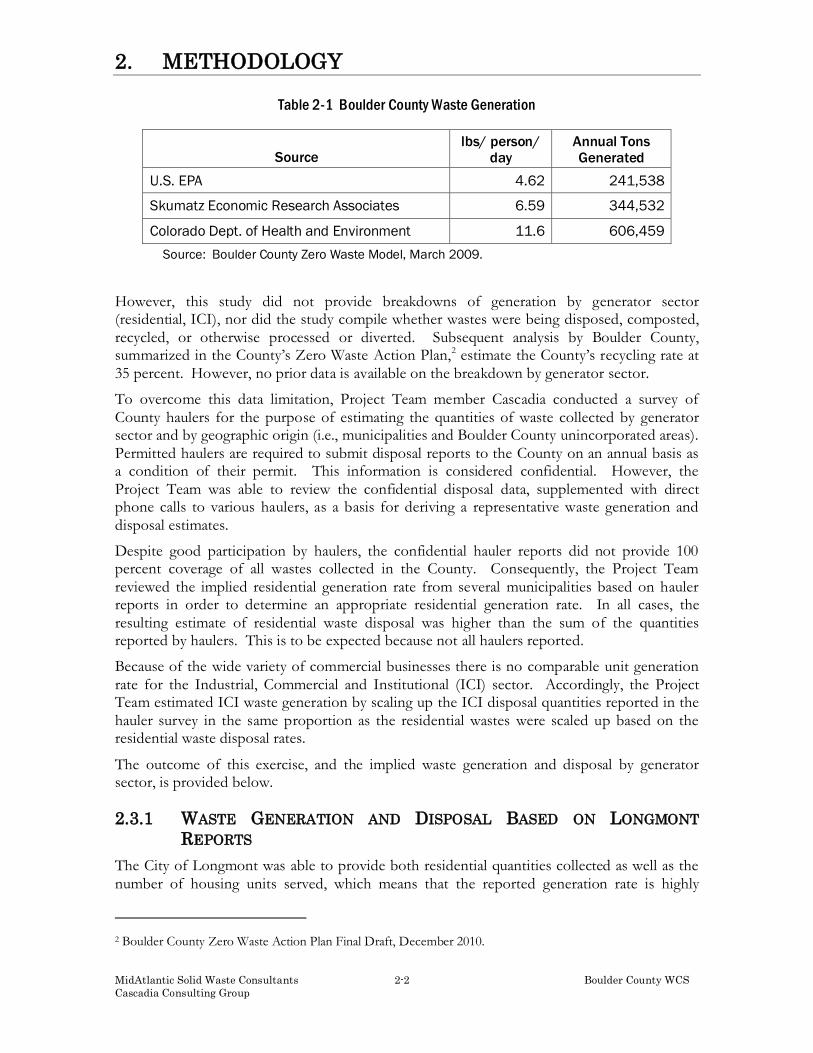
2. METHODOLOGY
MidAtlantic Solid Waste Consultants 2-2 Boulder County WCS Cascadia Consulting Group
Table 2-1 Boulder County Waste Generation
Source lbs/ person/
day Annual Tons Generated
U.S. EPA 4.62 241,538
Skumatz Economic Research Associates 6.59 344,532
Colorado Dept. of Health and Environment 11.6 606,459 Source: Boulder County Zero Waste Model, March 2009.
However, this study did not provide breakdowns of generation by generator sector (residential, ICI), nor did the study compile whether wastes were being disposed, composted, recycled, or otherwise processed or diverted. Subsequent analysis by Boulder County, summarized in the County’s Zero Waste Action Plan,2
To overcome this data limitation, Project Team member Cascadia conducted a survey of County haulers for the purpose of estimating the quantities of waste collected by generator sector and by geographic origin (i.e., municipalities and Boulder County unincorporated areas). Permitted haulers are required to submit disposal reports to the County on an annual basis as a condition of their permit. This information is considered confidential. However, the Project Team was able to review the confidential disposal data, supplemented with direct phone calls to various haulers, as a basis for deriving a representative waste generation and disposal estimates.
estimate the County’s recycling rate at 35 percent. However, no prior data is available on the breakdown by generator sector.
Despite good participation by haulers, the confidential hauler reports did not provide 100 percent coverage of all wastes collected in the County. Consequently, the Project Team reviewed the implied residential generation rate from several municipalities based on hauler reports in order to determine an appropriate residential generation rate. In all cases, the resulting estimate of residential waste disposal was higher than the sum of the quantities reported by haulers. This is to be expected because not all haulers reported.
Because of the wide variety of commercial businesses there is no comparable unit generation rate for the Industrial, Commercial and Institutional (ICI) sector. Accordingly, the Project Team estimated ICI waste generation by scaling up the ICI disposal quantities reported in the hauler survey in the same proportion as the residential wastes were scaled up based on the residential waste disposal rates.
The outcome of this exercise, and the implied waste generation and disposal by generator sector, is provided below.
2.3.1 WASTE GENERATION AND DISPOSAL BASED ON LONGMONT REPORTS
The City of Longmont was able to provide both residential quantities collected as well as the number of housing units served, which means that the reported generation rate is highly
2 Boulder County Zero Waste Action Plan Final Draft, December 2010.

2. METHODOLOGY
Boulder County WCS 2-3 MidAtlantic Solid Waste Consultants Cascadia Consulting Group
defensible. However, Longmont does not provide a curbside collection service for yard waste and organics, unlike some other municipalities and County unincorporated areas. This suggests that use of the Longmont data may slightly overestimate disposed waste quantities. Table 2-2 shows the derived waste generation using the City of Longmont residential generation estimates. As shown, this yields almost identical generation as predicted in the City’s Zero Waste Model report in Table 2-1.
Table 2-2 Estimated Countywide MSW Generation and Disposal by Generator Sector Based on Reported Longmont Data
Generator Sector Tons Percent
Residential 102,963 46.6%
Industrial, Commercial and Institutional (ICI) 117,228 53.1%
Mountain Drop Boxes 626 0.3%
Total Disposed MSW 220,817 100.0%
Recycling Rate (Zero Waste Action Plan) 35%
Implied Waste Generation 339,718
2.3.2 WASTE GENERATION AND DISPOSAL BASED ON CITY OF BOULDER AND LOUISVILLE ESTIMATES
The Project Team was able to derive reasonably accurate estimates of waste disposal quantities from the City of Boulder and from the City of Louisville. These municipalities offer curbside organics collection, as well as single stream recycling and weekly refuse collection. However, it was necessary to estimate the number of households generating these quantities. Table 2-3 summarizes the derived waste generation and disposal estimates based on City of Boulder and Louisville data. As shown in this table, waste generation and disposal was found to be somewhat lower using these assumptions.
Table 2-3 Estimated Countywide MSW Generation and Disposal by Generator Sector Based on Hauler Report Assumptions from the Cities of Boulder and Louisville
Generator Sector Tons Percent
Residential 88,973 46.6%
Industrial, Commercial and Institutional (ICI) 101,383 53.1%
Mountain Drop Boxes 626 0.3%
Total MSW 190,982 100.0%
Recycling Rate (Zero Waste Action Plan) 35%
Implied Waste Generation 293,818

2. METHODOLOGY
MidAtlantic Solid Waste Consultants 2-4 Boulder County WCS Cascadia Consulting Group
2.3.3 WASTE GENERATION AND DISPOSAL USED IN THIS REPORT The Project Team believes that there are merits to using either the Longmont data or the City of Boulder and Louisville estimates to justify aggregate waste generation and disposal in Boulder County. The resulting projections for residential and ICI waste disposal reasonably reflect the quantity of wastes being disposed. Further, the Mountain Box quantities are directly reported by the County and are therefore accurate.
Because the Longmont generation derivation was based on verified reports of quantities and units served, the Project Team has applied waste composition results to these quantities of wastes disposed, for the purpose of estimating the quantity of disposed material in the waste stream. The resulting disposal estimates may be slightly high for the County as a whole, but are very reasonable in the context of prior County-sponsored studies on waste generation. The final weighting factors and waste disposal quantities used in the remainder of this report are shown in Table 2-4.
2-4 Countywide MSW Disposal Used in This Report
Generator Sector Tons Percent
Residential 102,963 46.6%
Industrial, Commercial and Institutional (ICI) 117,228 53.1%
Mountain Drop Boxes 626 0.3%
Total MSW 220,817 100.0%
As a final comment, it is important to note that it was not possible to obtain defensible estimates of the quantity of construction and demolition (C&D) debris generated and disposed in Boulder County. For this reason, only the composition of C&D is reported. Because of this, aggregate waste composition therefore includes only municipal solid wastes (MSW), but does not attempt to combine C&D debris.
2.4. MATERIAL CATEGORIES The list of material categories was developed based on a draft list included in the County’s RFP. Appendix A contains the material categories and associated definitions used for the manually sorted samples obtained for this project.
The Project Team’s approach relies on manual sorting for residential and commercial wastes, and visual surveying for C&D debris. Because of the visual surveying process and because C&D wastes typically have a different mix of commonly-occurring materials, Appendix A also shows the abbreviated list of material categories and associated definitions for visual surveying of C&D wastes. Note that there is a catch-all category in the C&D list called “Mixed MSW.” This category was used to record bagged and loose wastes that are often discarded in C&D wastes at de minimus levels.

2. METHODOLOGY
Boulder County WCS 2-5 MidAtlantic Solid Waste Consultants Cascadia Consulting Group
2.5. SEASONALITY AND HOST FACILITIES The 2010 Study included two four-day seasonal sampling and sorting events, which were held at Western Disposal’s transfer station in Boulder and at the privately-owned Erie Landfill. Table 2-5 summarizes the specific seasonal sampling and sorting schedule.
Table 2-5 Field Data Collection Schedule
Day of Week Summer Season: July 12 - 15
Winter Season: Oct 26 – 29
Monday Western Disposal TS N/A
Tuesday Western Disposal TS Erie Landfill
Wednesday Western Disposal TS Erie Landfill
Thursday Erie Landfill Western Disposal TS
Friday N/A Western Disposal TS
Saturday N/A Western Disposal TS
As shown in the table, the winter season field data collection event required an additional day of sampling and sorting because of high winds at the outset of the data collection event. Despite weather-related delays, samples were successfully obtained across all six days of the work week and at both of the host disposal facilities that were found to receive the majority of wastes generated in the County.
2.6. SAMPLING TARGETS The Project Team relied on the results of the hauler survey to develop daily sampling targets at each facility during each season. The Project Team worked with individual haulers to identify the date and time of delivery for targeted loads. In most cases, loads were scheduled to be delivered to one of the two host facilities and were obtained upon regular delivery. However, several haulers – including the City of Longmont – dispatched trucks to the Erie Landfill specifically in support of this project.
Table 2-6 summarizes the planned versus actual distribution of samples by generator sector. As shown, the Project Team successfully obtained the targeted number of samples, and was generally able to achieve the targeted sample distribution. The Project Team believes that the samples obtained provide a representative snapshot of the wastes disposed in Boulder County.

2. METHODOLOGY
MidAtlantic Solid Waste Consultants 2-6 Boulder County WCS Cascadia Consulting Group
Table 2-6 Planned vs. Actual Distribution Samples
Generator Sector Proposed Manually
Sorted Samples
Actual Manually
Sorted
Proposed Visually
Surveyed Samples
Actual Visually
Surveyed Samples
1 Single Family 25 26 0 0
2 Multi-family 10 8 0 0
3 Commercial 35 36 0 0
4 Foothill Transfer Sites 10 10 0 0
5 C&D 0 0 30 37
Total 80 80 30 37
2.7. FIELD DATA COLLECTION PROCEDURES This section describes in detail the steps that were performed in the field to successfully acquire, sort, weigh, and discard manually sorted samples.
2.7.1 STAFFING AND SORTER TRAINING PLAN The Project Team managed and conducted all refuse sampling, sorting, and visual surveying required throughout the study. Specifically, field data collection team included the following individuals:
Field Supervisor: MSW Consultants provided a Field Supervisor. The Field Supervisor’s lead responsibility was for planning each sampling and sorting event, and for interacting with the facility personnel whose cooperation was needed throughout the field data collection. The Field Supervisor generally led the sampling selection process and oversaw the physical taking of the 200-250 pound samples. The Field Supervisor was ultimately responsible for the successful completion of the project. The Field Supervisor also made visual surveys of the targeted C&D loads as time permitted at each host facility.
Crew Chief: MSW Consultants provided a Crew Chief. The Crew Chief was the second professional staff person. The Crew Chief was responsible for managing the manual sorting area, including crew management, sorting productivity and accuracy, data recording, work site health and safety, and cleaning up at the end of the day.
Sorting Labor: MSW Consultants contracted locally-based light industrial temporary workers to serve as sorting labor. Training and oversight was provided by the MSW Consultants field operations management staff above.
As a final note, MSW Consultants maintained the guidelines in the Safety and Health Plan that was submitted in the proposal which governs our conduct of waste characterization studies.

2. METHODOLOGY
Boulder County WCS 2-7 MidAtlantic Solid Waste Consultants Cascadia Consulting Group
2.7.2 LOAD SELECTION Daily routes were pre-selected at each facility each day for most waste substreams. C&D loads were systematically selected.
The Field Supervisor interviewed the drivers of selected loads to confirm the geographic origin and type of waste, as well as any other pertinent data. This information was noted on the vehicle selection form, along with a unique identifying number associated with that vehicle on that day. A copy of the weight ticket (if available) for each vehicle was obtained for every incoming truck selected for sampling and sorting.3
2.7.3 TAKING RANDOM SAMPLES FOR MANUAL SORTING
Selected loads of waste designated for sorting were tipped in the designated area at the host facility. From each selected load, one sample of waste was selected based on systematic “grabs” from the perimeter of the load. For example, if the tipped pile is viewed from the top as a clock face with 12:00 being the part of the load closest to the front of the truck, the first samples was taken from 3 o’clock, 6 o’clock, 9 o’clock, 12 o’clock, and then from 1, 4, 7, and 10 o’clock, and so-on .
Figure 2-1 Example of a Grab Sample Staged for Manual Sorting Once the area of the tipped load was selected, the Field Supervisor coordinated with a facility-provided loader operator to take a “grab” sample of wastes from that point in the tipped load. The loader operator removed a sample of waste that exceeded the targeted sample weight, and placed the grab sample in a secure area to await sorting. This is shown in Figure 2-1.
It should be notes that only one sample was obtained from single family residential and ICI truckloads.
Either one or two samples were taken from the foothill transfer site drop boxes. At the two host disposal facilities, the Project Team arranged with Western Disposal and the City of Longmont to have segregated loads of multi-family wastes delivered for sampling and sorting. Because these loads were specially arranged, the Project Team acquired two grab samples from each load. Because of unforeseen weather challenges during the second season, one of the pre-arranged multi-family loads could not be delivered.
3 Some haulers delivering C&D to the Western Disposal Transfer Station operated under a “flat rate” charge agreement with the facility. These C&D loads were charged by volume rather than weight. For these loads, the field supervisor noted the cubic yardage of the container and the weight was calculated based upon industry standard C&D density estimates.

2. METHODOLOGY
MidAtlantic Solid Waste Consultants 2-8 Boulder County WCS Cascadia Consulting Group
Refuse samples were deposited on a tarp or paved surface designated to receive samples. Each was labeled by its identifying number using a white board. The white board for sample identification stayed with the sample until sorting and weigh out was completed.
2.7.4 MANUAL SORTING Once each sample was acquired, the material was manually sorted into the prescribed component categories. Plastic 20-gallon bins with sealed bottoms were used to contain the separated components. A picture of the sorting table and bins is shown in Figure 2-2.
Figure 2-2 Sort Table and Bins
Sorters were asked to specialize in certain material groups, with someone handling the paper categories, another the plastics, another the glass and metals, and so on. In this way, sorters became highly knowledgeable in a short period of time as to the definitions of individual material categories.
The Crew Chief monitored the bins as each sample was sorted, rejecting materials that were improperly classified. Open bins allowed the Crew Chief to see the material at all times. The Crew Chief also verified the
purity of each component during the weigh-out (discussed below). The materials were sorted to particle size of 2-inches or less by hand, until no more than a small amount of homogeneous fine material (“mixed residue”) remained. This layer of mixed 2-inch-minus material was be allocated to the appropriate categories based on the best judgment of the Crew Chief—most often a combination of Other Paper, Other Organics, or Food Waste. Particles falling through a half inch screen were swept into a Fines category.
2.7.5 VISUAL SURVEYING OF C&D LOADS C&D debris is by nature very different in composition compared to residential and commercial waste collected in compacting vehicles. Where residential and commercial waste loads consist of waste from dozens (commercial) or hundreds (residential) generators, and since most particles are relatively small (less than 12 inches), physical grab sampling and sorting is both practical from an operations standpoint and is also statistically appropriate.
However, C&D debris is very different. C&D typically contains large items that are difficult to “grab” and manually sort, such as drywall, dimensional lumber, and a number of bulky items. Furthermore, grabs of C&D waste frequently miss the densest items in the load – concrete, brick, block and dirt – which sink to the bottom center of the tipped load. Even a 300 pound grab of a C&D load may not come close to representing the full contents of the load.
Since the mid 1990s, the solid waste industry has studied various methods for characterizing C&D debris, and has generally found that visual surveying of C&D loads provides the best combination of accuracy and cost effectiveness to enable a statistically meaningful number of samples to be collected.

2. METHODOLOGY
Boulder County WCS 2-9 MidAtlantic Solid Waste Consultants Cascadia Consulting Group
The Project Team’s protocol for characterizing C&D loads entailed visual surveying of the entire load of C&D. Visual surveying of a load of C&D waste involves detailed volumetric measurements of the truck and load dimensions, followed by the systematic observation of the major material components in the tipped load. The basic steps to visual surveying were:
1. Measure the dimensions of the incoming load prior to tipping and estimate the percent full of the vehicle.
2. Tip the load. If it is a large load, and if possible, have a loader spread out the material so that it is possible to discern dense materials such as block, brick, and dirt that tend to sink to the bottom of the pile.
3. Make a first pass around the load marking the major material categories that are present in the load—cardboard, drywall, dimensional lumber, etc. Estimate the percentage of the load made up of these major materials. If possible, estimate the yardage associated with this material.
4. Make a second pass around the load, noting the secondary material categories contained in the load. Estimate the percentage of the load made up of these materials. If possible, estimate the yardage associated with this material.
5. Validate that the estimated percentages sum to 100 percent, and that the estimated yardage of major material categories is realistic given the overall truck dimensions and volume.
2.8. DATA RECORDING The MSW Team believes that the weigh-out and data recording process is the most critical process of the sort. The Crew Chief was singularly responsible for overseeing all weighing and data recording of each sample. Once each sample had been sorted, the weigh-out was performed. Each bin containing sorted materials from the just-completed samples was carried over to a digital scale provided by the Project Team. Sorting laborers assisted with carrying and weighing the bins of sorted material, the Crew Chief recorded all data.
The Crew Chief used a waste composition data sheet to record the composition weights, as well as to record other observed or emperical information. Each data sheet containing the sorted weights of each sample were matched up against the Field Supervisor’s sample sheet to assure accurate tracking of the samples each day.
The Project Team designed a customized database to manage the data from waste sorting, and the Crew Chief entered the data from the waste sample tally sheets to assure that all handwriting could be deciphered. Entered data was subjected to quality control queries, and any anomalies were resolved against the hand-written information on the sample tally sheets or supervisor’s sheet. Specific steps taken to ensure the integrity of data during entry and analysis included:
Verifying that data forms were obtained for each day the data collection crew was in the field.
Having the data collection crew keep copies of all forms while the originals were shipped to the office.
Random checks of the computer-entered data against the paper form, to verify that all numbers were entered and to look for any systematic or random mistakes.

2. METHODOLOGY
MidAtlantic Solid Waste Consultants 2-10 Boulder County WCS Cascadia Consulting Group
Encoding the composition analysis formulae into a routine that can be applied consistently to different data sets. (This minimizes errors that could arise from mistyping formulae, etc.)
2.9. STATISTICAL METHODS Using tested statistical procedures, Project Team member Cascadia developed detailed estimates of waste composition and quantities for each generator sector to statistically represent the County’s waste stream.
The statistical confidence interval was calculated for each generator sector and in total. The approach used for calculating the mean weight estimates and the confidence intervals is described below. Confidence intervals were calculated at 90 percent.
Composition estimates represent the ratio of the material’s weight to the total material for each noted material component in a particular segment of the waste stream. They are derived by summing each component’s weight across all of the relevant samples and dividing by the sum of the total weight of waste/recyclables, as shown in the following equation:
where:
c = weight of particular material component
w = sum of all component weights
for i = 1 to n, where n = number of selected samples
for j = 1 to m, where m = number of material components
The confidence interval for this estimate is derived in two steps. First, the variance around the estimate is calculated, accounting for the fact that the ratio includes two random variables (the component and total sample weights). The variance of the ratio estimator equation follows:
where
Second, confidence intervals at the 90% confidence level are calculated for a component’s mean as follows:
where
t = the value of the t-statistic corresponding to a 90 percent confidence level.
r
c
wj
iji
ii
=∑∑
( )V
n w
c r w
nr
ij j ii
j=
⋅
⋅
−
−
∑1 112
2
w
w
n
ii=∑
( )r t Vj rj± ⋅

2. METHODOLOGY
Boulder County WCS 2-11 MidAtlantic Solid Waste Consultants Cascadia Consulting Group
As a final step, the County-wide composition of waste was calculated as the weighted average of the various generator sectors that were individually analyzed. Weighting factors are shown in Table 2-1.

2. METHODOLOGY
MidAtlantic Solid Waste Consultants 2-12 Boulder County WCS Cascadia Consulting Group
This page intentionally left blank.

Boulder County WCS 3-1 MidAtlantic Solid Waste Consultants Cascadia Consulting Group
3. RESULTS
3.1. BOULDER COUNTY MSW COMPOSITION Figure 3-1 shows the breakdown of major material groups for the aggregate countywide municipal solid waste stream (encompassing residential, ICI, and mountain box wastes). Results are shown both in percentage terms as well as the estimated mean tons disposed. As shown, Organics is far and away the largest material group, followed by Paper, Problem Waste, and Plastic.
Figure 3-1 Boulder County MSW Composition, 2010
Paper, 16.6% 36,597 Tons
Plastic, 13.2% 29,180 Tons
Metal, 3.8%8,315 Tons
C&D, 7.2% 15,800 Tons
Glass, 2.2% 4,941 Tons
Organics, 41.5% 91,692 Tons
Problem Waste, 15.3%
33,859 Tons
Household Hazardous, 0.2%
432 Tons
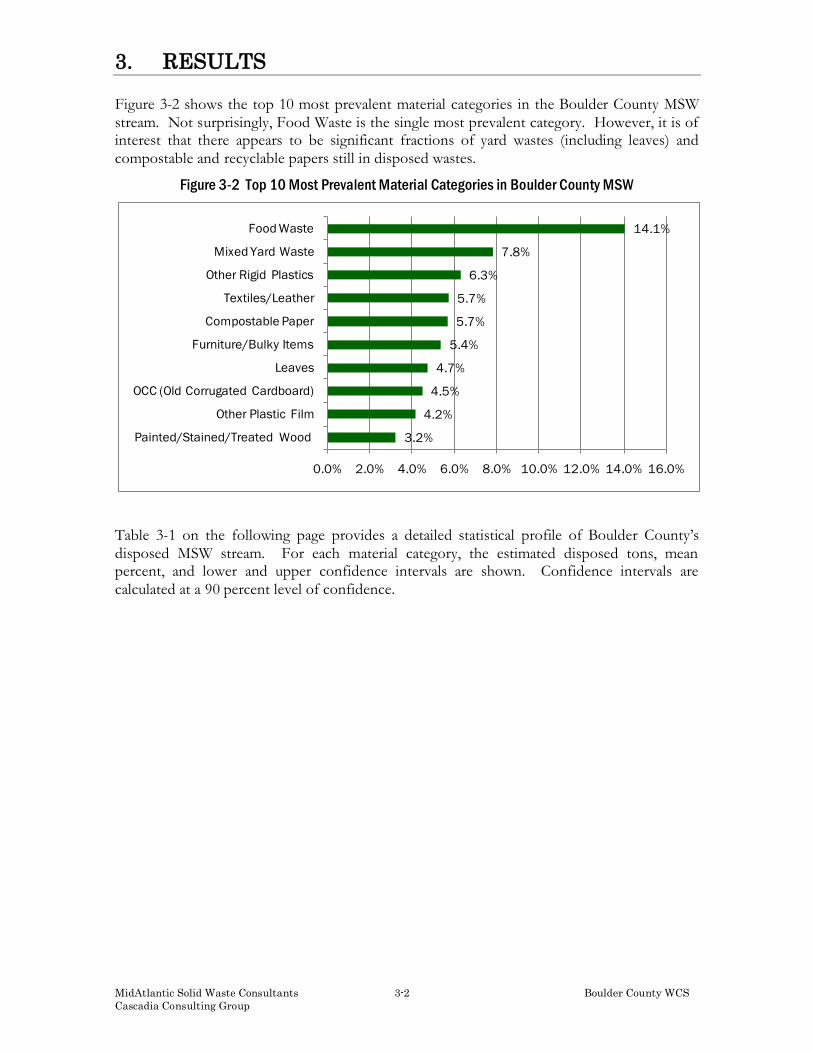
3. RESULTS
MidAtlantic Solid Waste Consultants 3-2 Boulder County WCS Cascadia Consulting Group
Figure 3-2 shows the top 10 most prevalent material categories in the Boulder County MSW stream. Not surprisingly, Food Waste is the single most prevalent category. However, it is of interest that there appears to be significant fractions of yard wastes (including leaves) and compostable and recyclable papers still in disposed wastes.
Figure 3-2 Top 10 Most Prevalent Material Categories in Boulder County MSW
Table 3-1 on the following page provides a detailed statistical profile of Boulder County’s disposed MSW stream. For each material category, the estimated disposed tons, mean percent, and lower and upper confidence intervals are shown. Confidence intervals are calculated at a 90 percent level of confidence.
3.2%
4.2%
4.5%
4.7%
5.4%
5.7%
5.7%
6.3%
7.8%
14.1%
0.0% 2.0% 4.0% 6.0% 8.0% 10.0% 12.0% 14.0% 16.0%
Painted/Stained/Treated Wood
Other Plastic Film
OCC (Old Corrugated Cardboard)
Leaves
Furniture/Bulky Items
Compostable Paper
Textiles/Leather
Other Rigid Plastics
Mixed Yard Waste
Food Waste

3. RESULTS
Boulder County WCS 3-3 MidAtlantic Solid Waste Consultants Cascadia Consulting Group
Table 3-1 Boulder County Detailed MSW Composition
Est. Est.Material + / - Tons Material + / - TonsPaper 16.6% 36,597 Glass 2.2% 4,941Newsprint 0.8% 0.2% 1,769 Glass Bottles and Jars 1.9% 0.6% 4,103High Grade Office Paper 0.8% 0.4% 1,824 Other Glass 0.4% 0.2% 838Shredded Paper 0.3% 0.2% 632OCC (Old Corrugated Cardboard) 4.5% 1.2% 9,908 Organics 41.5% 91,692Magazines/Catalogs 0.9% 0.3% 2,091 Mixed Yard Waste including Small Branches 7.8% 2.5% 17,271Recyclable Mixed Paper 2.1% 0.3% 4,642 Branches/Limbs and Stumps >6" Diameter 1.3% 0.6% 2,765Polycoated/Aseptic Containers 0.1% 0.0% 278 Leaves 4.7% 1.6% 10,471Compostable Paper 5.7% 0.8% 12,559 Food Waste 14.1% 1.7% 31,055Unrecyclable Mixed Paper 1.3% 0.3% 2,895 Other Untreated Wood 0.5% 0.4% 1,100
Textiles/Leather 5.7% 1.5% 12,666Plastic 13.2% 29,180 Fines/Dirt 2.9% 0.7% 6,318#1 PET Bottles/Jars 0.5% 0.1% 997 Pallets 2.2% 1.4% 4,769#2 HDPE Bottles/Jars 0.4% 0.1% 908 Other Organics 2.4% 0.6% 5,277Bottles #3-7 0.1% 0.0% 194Other Plastic Containers <3 Gallons 0.2% 0.1% 479 Problem Waste 15.3% 33,859Large Plastic Containers >3 Gallons 0.3% 0.2% 732 Large Electronics (Plug-in) 2.2% 1.0% 4,874Plastic Retail Bags 0.4% 0.1% 781 Small Electronics (Rechargeable) 0.2% 0.2% 468Other Plastic Film 4.2% 0.6% 9,169 Small Appliances 0.7% 0.5% 1,506Expanded Polystyrene 0.9% 0.5% 2,019 Diapers/Sanitary Products 1.7% 0.4% 3,728Other Rigid Plastics 6.3% 1.3% 13,901 Carpet/Padding 3.2% 1.9% 7,019
Batteries 0.2% 0.2% 482Metal 3.8% 8,315 Rubber 0.7% 0.2% 1,524Aluminum Containers 0.3% 0.1% 570 Tires 0.9% 0.7% 1,981Aluminum Foil & Trays 0.2% 0.1% 369 Furniture/Bulky Items 5.4% 2.0% 11,868Ferrous Containers 0.5% 0.1% 1,097 Other Inorganics 0.2% 0.1% 410Other Ferrous 1.7% 0.7% 3,852Other Non-Ferrous 0.9% 0.4% 1,948 Household Hazardous Waste (HHW) 0.2% 432White Goods 0.2% 0.4% 479 Fluorescent Tubes and Bulbs 0.0% 0.0% 12
Pharmaceuticals and Syringes 0.0% 0.0% 35C&D 7.2% 15,800 Oil-based Paint & Finishes 0.0% 0.0% 0Aggregate/Concrete/Asphalt/Ceramics 0.5% 0.4% 1,176 Latex Paint & Finishes 0.0% 0.0% 35Asphalt Shingles 0.0% 0.0% 60 Pesticides 0.0% 0.0% 0Painted/Stained/Treated Wood 3.2% 1.2% 7,155 Automotive Fluids 0.0% 0.1% 87Clean Dimensional Lumber 1.7% 1.0% 3,749 Other Household Hazardous Waste 0.1% 0.1% 263Clean/New Drywall 0.2% 0.2% 349Demo/Painted Drywall 0.5% 0.5% 1,031Other C&D 1.0% 0.5% 2,279 Totals 100.0% 220,817
Sample Count 80Confidence intervals calculated at the 90% confidence level. Percentages for material types may not total 100% due to rounding.

3. RESULTS
MidAtlantic Solid Waste Consultants 3-4 Boulder County WCS Cascadia Consulting Group
3.2. RESIDENTIAL MSW COMPOSITION Figure 3-3 presents the breakdown of residential wastes. The top pie chart shows results for all residential wastes (i.e., single family and multi-family). The bottom pie charts split out the composition of single family wastes and multi-family wastes so that the reader can see the difference in the two substreams. Because the majority of residential wastes are generated by single family households, the single family composition dominates multi-family in the overall residential waste stream.
Figure 3-3 Boulder County Residential Waste Composition, 2010
Paper, 12.5% 12,915 Tons
Plastic, 12.6% 12,976 Tons
Metal, 2.6% 2,720 Tons
C&D, 4.7% 4,794 Tons
Glass, 1.5% 1,584 Tons
Organics, 48.0% 49,394 Tons
Problem Waste, 18.0%
18,499 Tons
Household Hazardous, 0.1%
80 Tons
Paper12.7%
Plastic12.3%
Metal2.4%
C&D5.9%
Glass1.5%
Organics53.0%
Problem Waste12.1%
Household Hazardous
0.0%
Single Family Portion
Paper12.0%
Plastic13.5%
Metal3.4%
C&D0.7%
Glass1.7%
Organics31.6%
Problem Waste36.8%
Household Hazardous
0.2%
Multi-Family Portion

3. RESULTS
Boulder County WCS 3-5 MidAtlantic Solid Waste Consultants Cascadia Consulting Group
As shown in Figure 3-3, Organics make up almost half of residential wastes. However, the single family profile and the multi-family profiles are significantly different. Organics dominate single family wastes, but in the multi-family waste stream, Problem Materials are the single largest material group. Figure 3-4 shows the top 10 most prevalent material categories in Residential waste. Food waste, yard waste, and leaves are large contributors.
Figure 3-4 Top 10 Most Prevalent Material Categories in Residential Waste
Table 3-2 compares the 10 most prevalent materials in disposed single family and multi-family wastes. This table highlights the significant differences between single family and multi-family materials. Of particular interest are the large fraction of bulky items, furniture, and small appliances in multi-family wastes. The following notable observations are made about multi-family wastes:
Two of the eight multi-family samples contained television sets, which are categorized as Large Electronics. In both samples, the televisions weighed 30 pounds or more; which caused the relatively high reported fraction of Large Electronics in the multi-family results.
Three of the eight multi-family samples contained a significant quantity of leaves, which caused the relatively high percentage of this material.
The Project Team notes that these findings suggest that further investigation would be informative, as the relatively low sample size (eight samples) does not provide the level of representativeness that would be needed to better analyze the prevalence of these materials in multi-family wastes. However, the fact that two televisions were found in multi-family
3.3%
3.9%
3.9%
4.1%
5.2%
6.5%
6.9%
7.7%
12.9%
13.1%
0.0% 2.0% 4.0% 6.0% 8.0% 10.0% 12.0% 14.0%
Large Electronics (Plug-in)
Other Organics
Other Plastic Film
Compostable Paper
Leaves
Other Rigid Plastics
Furniture/Bulky Items
Textiles/Leather
Mixed Yard Waste
Food Waste

3. RESULTS
MidAtlantic Solid Waste Consultants 3-6 Boulder County WCS Cascadia Consulting Group
samples, as well as a significantly higher fraction of furniture and bulky items, suggests that the multi-family waste stream is significantly different from single family wastes.
Table 3-2 Comparison of Top Ten Materials in the Single Family and Multi-Family Waste
Single Family MSW % Multi-Family MSW %
Mixed Yard Waste 16.6% Furniture/Bulky Items 18.9% Food Waste 14.6% Large Electronics (Plug-in) 9.0% Textiles/Leather 7.5% Food Waste 8.4% Other Rigid Plastics 5.9% Textiles/Leather 8.3% Leaves 4.3% Other Rigid Plastics 8.2% Compostable Paper 4.2% Leaves 8.1% Other Plastic Film 4.1% Corrugated Cardboard 4.4% Other Organics 4.0% Compostable Paper 4.0% Diapers/Sanitary 3.2% Small Appliances 3.7% Furniture/Bulky Items 3.2% Other Organics 3.5%
67.6% 76.4%

3. RESULTS
Boulder County WCS 3-7 MidAtlantic Solid Waste Consultants Cascadia Consulting Group
Table 3-3 provides a detailed statistical profile of the County’s Residential waste stream.
Table 3-3 2010 Detailed Residential Waste Composition
Est. Est. Est. Est.Material Percent + / - Tons Material Percent + / - TonsPaper 12.5% 12,915 Glass 1.5% 1,584Newsprint 0.9% 0.4% 934 Glass Bottles and Jars 1.2% 0.3% 1,280High Grade Office Paper 0.6% 0.5% 586 Other Glass 0.3% 0.1% 304Shredded Paper 0.4% 0.3% 409OCC (Old Corrugated Cardboard) 2.0% 1.4% 2,017 Organics 48.0% 49,394Magazines/Catalogs 1.0% 0.5% 997 Mixed Yard Waste including Small Branches 12.9% 4.8% 13,284Recyclable Mixed Paper 2.1% 0.3% 2,136 Branches/Limbs and Stumps >6" Diameter 1.6% 0.9% 1,624Polycoated/Aseptic Containers 0.1% 0.0% 141 Leaves 5.2% 2.2% 5,366Compostable Paper 4.1% 0.5% 4,253 Food Waste 13.1% 1.9% 13,539Unrecyclable Mixed Paper 1.4% 0.5% 1,442 Other Untreated Wood 0.6% 0.9% 622
Textiles/Leather 7.7% 1.9% 7,932Plastic 12.6% 12,976 Fines/Dirt 2.6% 0.6% 2,629#1 PET Bottles/Jars 0.4% 0.1% 426 Pallets 0.4% 0.5% 376#2 HDPE Bottles/Jars 0.4% 0.1% 371 Other Organics 3.9% 1.1% 4,022Bottles #3-7 0.1% 0.1% 126Other Plastic Containers <3 Gallons 0.2% 0.1% 191 Problem Waste 18.0% 18,499Large Plastic Containers >3 Gallons 0.3% 0.2% 282 Large Electronics (Plug-in) 3.3% 1.9% 3,376Plastic Retail Bags 0.4% 0.1% 422 Small Electronics (Rechargeable) 0.4% 0.4% 385Other Plastic Film 3.9% 0.9% 4,032 Small Appliances 1.2% 0.9% 1,217Expanded Polystyrene 0.5% 0.3% 482 Diapers/Sanitary Products 2.9% 0.8% 2,989Other Rigid Plastics 6.5% 1.5% 6,644 Carpet/Padding 2.2% 1.4% 2,249
Batteries 0.1% 0.1% 111Metal 2.6% 2,720 Rubber 0.4% 0.2% 363Aluminum Containers 0.3% 0.1% 270 Tires 0.5% 0.5% 547Aluminum Foil & Trays 0.1% 0.0% 92 Furniture/Bulky Items 6.9% 3.4% 7,143Ferrous Containers 0.6% 0.1% 589 Other Inorganics 0.1% 0.1% 120Other Ferrous 1.0% 0.9% 1,069Other Non-Ferrous 0.2% 0.3% 223 Household Hazardous Waste (HHW) 0.1% 80White Goods 0.5% 0.8% 477 Fluorescent Tubes and Bulbs 0.0% 0.0% 4
Pharmaceuticals and Syringes 0.0% 0.0% 30C&D 4.7% 4,794 Oil-based Paint & Finishes 0.0% 0.0% 0Aggregate/Concrete/Asphalt/Ceramics 0.9% 0.9% 964 Latex Paint & Finishes 0.0% 0.0% 0Asphalt Shingles 0.0% 0.0% 32 Pesticides 0.0% 0.0% 0Painted/Stained/Treated Wood 1.9% 0.9% 1,993 Automotive Fluids 0.0% 0.0% 0Clean Dimensional Lumber 0.7% 0.6% 694 Other Household Hazardous Waste 0.0% 0.0% 46Clean/New Drywall 0.3% 0.5% 349Demo/Painted Drywall 0.0% 0.0% 12Other C&D 0.7% 0.5% 750 Totals 100.0% 102,963
Sample Count 34Confidence intervals calculated at the 90% confidence level. Percentages for material types may not total 100% due to rounding.

3. RESULTS
MidAtlantic Solid Waste Consultants 3-8 Boulder County WCS Cascadia Consulting Group
Table 3-4 compares the single family and multi-family waste stream composition.
Table 3-4 2010 Comparison of Single Family and Multi-Family Waste Composition
Single Family Multi-Family Single Family Multi-FamilyEst. Est. Est. Est.
Material Percent + / - Percent + / - Material Percent + / - Percent + / -Paper 12.7% 12.0% Glass 1.5% 1.7%Newsprint 1.0% 0.4% 0.7% 0.7% Glass Bottles and Jars 1.2% 0.3% 1.3% 0.7%High Grade Office Paper 0.7% 0.6% 0.1% 0.1% Other Glass 0.3% 0.1% 0.4% 0.4%Shredded Paper 0.5% 0.4% 0.0% 0.0%OCC (Old Corrugated Cardboard) 1.2% 0.8% 4.4% 5.4% Organics 53.0% 31.6%Magazines/Catalogs 1.2% 0.7% 0.3% 0.2% Mixed Yard Waste including Small Branches 16.6% 5.8% 1.1% 1.8%Recyclable Mixed Paper 2.2% 0.4% 1.7% 0.6% Branches/Limbs and Stumps >6" Diameter 2.0% 1.1% 0.1% 0.1%Polycoated/Aseptic Containers 0.1% 0.0% 0.1% 0.1% Leaves 4.3% 1.9% 8.1% 7.2%Compostable Paper 4.2% 0.5% 4.0% 0.9% Food Waste 14.6% 2.2% 8.4% 2.4%Unrecyclable Mixed Paper 1.6% 0.6% 0.7% 0.5% Other Untreated Wood 0.8% 1.2% 0.0% 0.0%
Textiles/Leather 7.5% 2.3% 8.3% 3.5%Plastic 12.3% 13.5% Fines/Dirt 2.7% 0.7% 2.0% 1.4%#1 PET Bottles/Jars 0.4% 0.1% 0.6% 0.5% Pallets 0.5% 0.6% 0.0% 0.0%#2 HDPE Bottles/Jars 0.4% 0.2% 0.3% 0.2% Other Organics 4.0% 1.3% 3.5% 2.4%Bottles #3-7 0.1% 0.1% 0.1% 0.1%Other Plastic Containers <3 Gallons 0.2% 0.1% 0.1% 0.1% Problem Waste 12.1% 36.8%Large Plastic Containers >3 Gallons 0.3% 0.3% 0.1% 0.1% Large Electronics (Plug-in) 1.5% 1.5% 9.0% 5.1%Plastic Retail Bags 0.4% 0.1% 0.3% 0.2% Small Electronics (Rechargeable) 0.5% 0.5% 0.0% 0.0%Other Plastic Film 4.1% 1.0% 3.5% 1.8% Small Appliances 0.4% 0.5% 3.7% 3.4%Expanded Polystyrene 0.5% 0.4% 0.3% 0.2% Diapers/Sanitary Products 3.2% 1.1% 1.8% 0.9%Other Rigid Plastics 5.9% 1.7% 8.2% 3.1% Carpet/Padding 2.1% 1.6% 2.5% 3.0%
Batteries 0.1% 0.1% 0.0% 0.0%Metal 2.4% 3.4% Rubber 0.3% 0.1% 0.6% 0.6%Aluminum Containers 0.2% 0.1% 0.4% 0.2% Tires 0.6% 0.6% 0.4% 0.6%Aluminum Foil & Trays 0.1% 0.0% 0.1% 0.1% Furniture/Bulky Items 3.2% 3.0% 18.9% 7.7%Ferrous Containers 0.5% 0.2% 0.7% 0.3% Other Inorganics 0.1% 0.1% 0.0% 0.0%Other Ferrous 1.3% 1.2% 0.2% 0.1%Other Non-Ferrous 0.3% 0.3% 0.1% 0.0% Household Hazardous Waste (HHW) 0.0% 0.2%White Goods 0.0% 0.0% 2.0% 3.2% Fluorescent Tubes and Bulbs 0.0% 0.0% 0.0% 0.0%
Pharmaceuticals and Syringes 0.0% 0.0% 0.0% 0.0%C&D 5.9% 0.7% Oil-based Paint & Finishes 0.0% 0.0% 0.0% 0.0%Aggregate/Concrete/Asphalt/Ceramics 1.2% 1.1% 0.1% 0.1% Latex Paint & Finishes 0.0% 0.0% 0.0% 0.0%Asphalt Shingles 0.0% 0.0% 0.1% 0.1% Pesticides 0.0% 0.0% 0.0% 0.0%Painted/Stained/Treated Wood 2.5% 1.2% 0.2% 0.4% Automotive Fluids 0.0% 0.0% 0.0% 0.0%Clean Dimensional Lumber 0.9% 0.8% 0.0% 0.0% Other Household Hazardous Waste 0.0% 0.0% 0.2% 0.2%Clean/New Drywall 0.4% 0.7% 0.1% 0.1%Demo/Painted Drywall 0.0% 0.0% 0.0% 0.0%Other C&D 0.9% 0.6% 0.3% 0.3% Totals 100.0% 100.0%Confidence intervals calculated at the 90% confidence level. Percentages for material types may not total 100% due to rounding.

3. RESULTS
Boulder County WCS 3-9 MidAtlantic Solid Waste Consultants Cascadia Consulting Group
3.3. ICI WASTE COMPOSITION Figure 3-5 presents the breakdown of ICI wastes by material group. The largest material group in the ICI sector was found to be Organics, followed by Paper, Plastics and Problem Waste.
Figure 3-5 Boulder County ICI Waste Composition, 2010
Paper, 20.2% 23,636 Tons
Plastic, 13.8% 16,140 Tons
Metal, 4.7% 5,558 Tons
C&D, 9.3% 10,907 Tons
Glass, 2.9% 3,350 Tons
Organics, 35.9% 42,104 Tons
Problem Waste, 13.0%
15,195 Tons
Household Hazardous,
0.3% 339 Tons
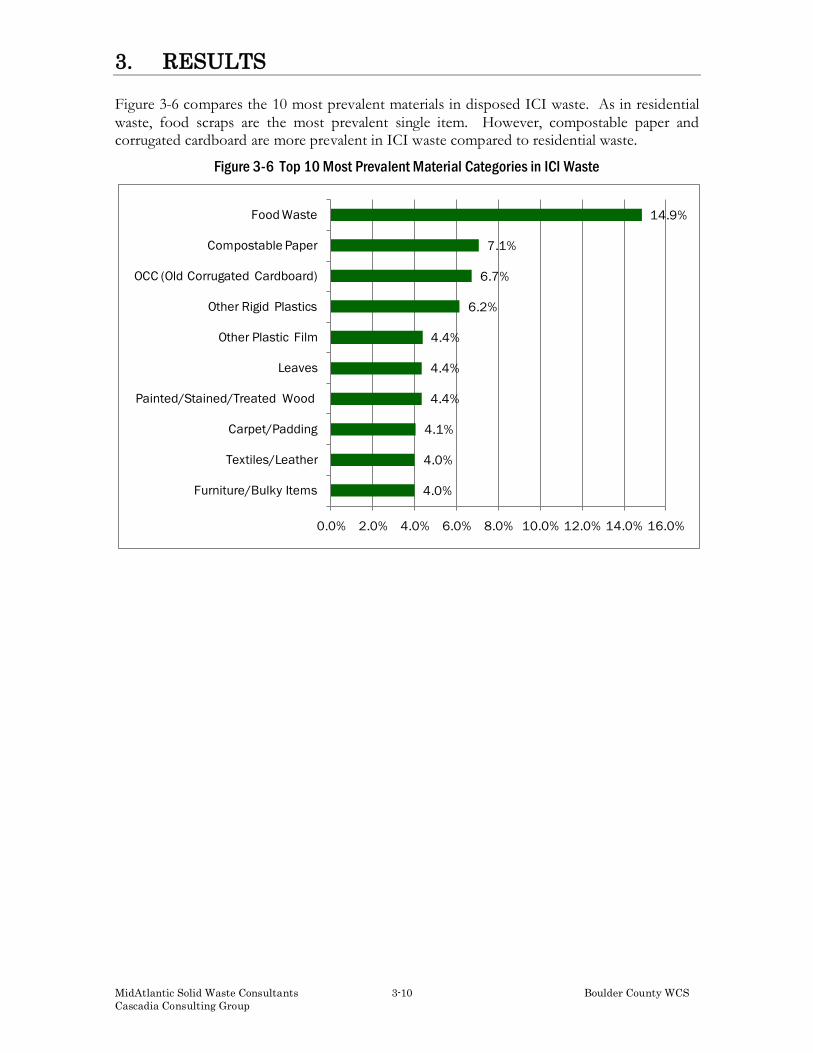
3. RESULTS
MidAtlantic Solid Waste Consultants 3-10 Boulder County WCS Cascadia Consulting Group
Figure 3-6 compares the 10 most prevalent materials in disposed ICI waste. As in residential waste, food scraps are the most prevalent single item. However, compostable paper and corrugated cardboard are more prevalent in ICI waste compared to residential waste.
Figure 3-6 Top 10 Most Prevalent Material Categories in ICI Waste
4.0%
4.0%
4.1%
4.4%
4.4%
4.4%
6.2%
6.7%
7.1%
14.9%
0.0% 2.0% 4.0% 6.0% 8.0% 10.0% 12.0% 14.0% 16.0%
Furniture/Bulky Items
Textiles/Leather
Carpet/Padding
Painted/Stained/Treated Wood
Leaves
Other Plastic Film
Other Rigid Plastics
OCC (Old Corrugated Cardboard)
Compostable Paper
Food Waste

3. RESULTS
Boulder County WCS 3-11 MidAtlantic Solid Waste Consultants Cascadia Consulting Group
Table 3-5 provides a detailed statistical profile of the County’s ICI waste stream.
Table 3-5 2010 Detailed ICI Waste Composition
Est. Est. Est. Est.Material Percent + / - Tons Material Percent + / - TonsPaper 20.2% 23,636 Glass 2.9% 3,350Newsprint 0.7% 0.2% 828 Glass Bottles and Jars 2.4% 1.2% 2,822High Grade Office Paper 1.1% 0.7% 1,238 Other Glass 0.5% 0.4% 528Shredded Paper 0.2% 0.2% 223OCC (Old Corrugated Cardboard) 6.7% 1.8% 7,889 Organics 35.9% 42,104Magazines/Catalogs 0.9% 0.3% 1,091 Mixed Yard Waste including Small Branches 3.4% 2.1% 3,956Recyclable Mixed Paper 2.1% 0.5% 2,498 Branches/Limbs and Stumps >6" Diameter 1.0% 0.7% 1,140Polycoated/Aseptic Containers 0.1% 0.0% 135 Leaves 4.4% 2.4% 5,105Compostable Paper 7.1% 1.4% 8,287 Food Waste 14.9% 2.8% 17,415Unrecyclable Mixed Paper 1.2% 0.5% 1,445 Other Untreated Wood 0.4% 0.3% 460
Textiles/Leather 4.0% 2.2% 4,714Plastic 13.8% 16,140 Fines/Dirt 3.1% 1.1% 3,685#1 PET Bottles/Jars 0.5% 0.2% 569 Pallets 3.7% 2.6% 4,381#2 HDPE Bottles/Jars 0.5% 0.1% 535 Other Organics 1.1% 0.3% 1,249Bottles #3-7 0.1% 0.0% 67Other Plastic Containers <3 Gallons 0.2% 0.1% 288 Problem Waste 13.0% 15,195Large Plastic Containers >3 Gallons 0.4% 0.3% 450 Large Electronics (Plug-in) 1.2% 0.9% 1,445Plastic Retail Bags 0.3% 0.2% 358 Small Electronics (Rechargeable) 0.1% 0.1% 75Other Plastic Film 4.4% 0.7% 5,119 Small Appliances 0.2% 0.2% 286Expanded Polystyrene 1.3% 0.8% 1,535 Diapers/Sanitary Products 0.6% 0.3% 722Other Rigid Plastics 6.2% 2.1% 7,220 Carpet/Padding 4.1% 3.4% 4,762
Batteries 0.3% 0.3% 369Metal 4.7% 5,558 Rubber 1.0% 0.4% 1,156Aluminum Containers 0.3% 0.1% 299 Tires 1.2% 1.2% 1,422Aluminum Foil & Trays 0.2% 0.2% 277 Furniture/Bulky Items 4.0% 2.2% 4,683Ferrous Containers 0.4% 0.2% 504 Other Inorganics 0.2% 0.2% 274Other Ferrous 2.4% 1.0% 2,778Other Non-Ferrous 1.4% 0.7% 1,700 Household Hazardous Waste (HHW) 0.3% 339White Goods 0.0% 0.0% 0 Fluorescent Tubes and Bulbs 0.0% 0.0% 8
Pharmaceuticals and Syringes 0.0% 0.0% 4C&D 9.3% 10,907 Oil-based Paint & Finishes 0.0% 0.0% 0Aggregate/Concrete/Asphalt/Ceramics 0.2% 0.1% 212 Latex Paint & Finishes 0.0% 0.0% 35Asphalt Shingles 0.0% 0.0% 25 Pesticides 0.0% 0.0% 0Painted/Stained/Treated Wood 4.4% 2.2% 5,102 Automotive Fluids 0.1% 0.1% 87Clean Dimensional Lumber 2.6% 1.8% 3,045 Other Household Hazardous Waste 0.2% 0.2% 205Clean/New Drywall 0.0% 0.0% 0Demo/Painted Drywall 0.9% 0.9% 1,019Other C&D 1.3% 0.9% 1,504 Totals 100.0% 117,228
Sample Count 36Confidence intervals calculated at the 90% confidence level. Percentages for material types may not total 100% due to rounding.

3. RESULTS
MidAtlantic Solid Waste Consultants 3-12 Boulder County WCS Cascadia Consulting Group
3.4. COUNTY DROP-BOX WASTE Figure 3-7 presents the breakdown of wastes collected at the Foothill Transfer sites. As shown, the waste that is deposited at these sites has significantly different composition from other residential and ICI wastes in Boulder County.
Figure 3-7 Boulder County Foothill Transfer Site Waste Composition, 2010
Paper, 7.3% 45 Tons Plastic, 10.2%
64 Tons
Metal, 6.0% 37 Tons
C&D, 15.9% 99 Tons
Glass, 1.2% 7 Tons
Organics, 31.0% 194 Tons
Problem Waste, 26.5%
166 Tons
Household Hazardous,
2.0% 12 Tons

3. RESULTS
Boulder County WCS 3-13 MidAtlantic Solid Waste Consultants Cascadia Consulting Group
Figure 3-8 summarizes the 10 most prevalent materials from Foothill Transfer Sites. While Food Waste is once again the most prevalent item, a number of C&D-related material categories were also found in large fractions.
Figure 3-8 Top 10 Most Prevalent Material Categories in County Drop-box Waste
It should be noted that one of the Foothill Transfer Site samples contained two large electronic items that collectively totaled 58 pounds. An insufficient number of samples were obtained from Foothill Transfer Sites to discern if this sample was an outlier, and further investigation would be needed to determine the prevalence of large electronics.
3.1%
3.3%
4.0%
4.1%
5.0%
5.9%
6.8%
8.4%
9.4%
16.2%
0.0% 5.0% 10.0% 15.0% 20.0%
Compostable Paper
Textiles/Leather
Other Non-Ferrous
Other C&D
Mixed Yard Waste
Other Rigid Plastics
Furniture/Bulky Items
Large Electronics (Plug-in)
Painted/Stained/Treated Wood
Food Waste
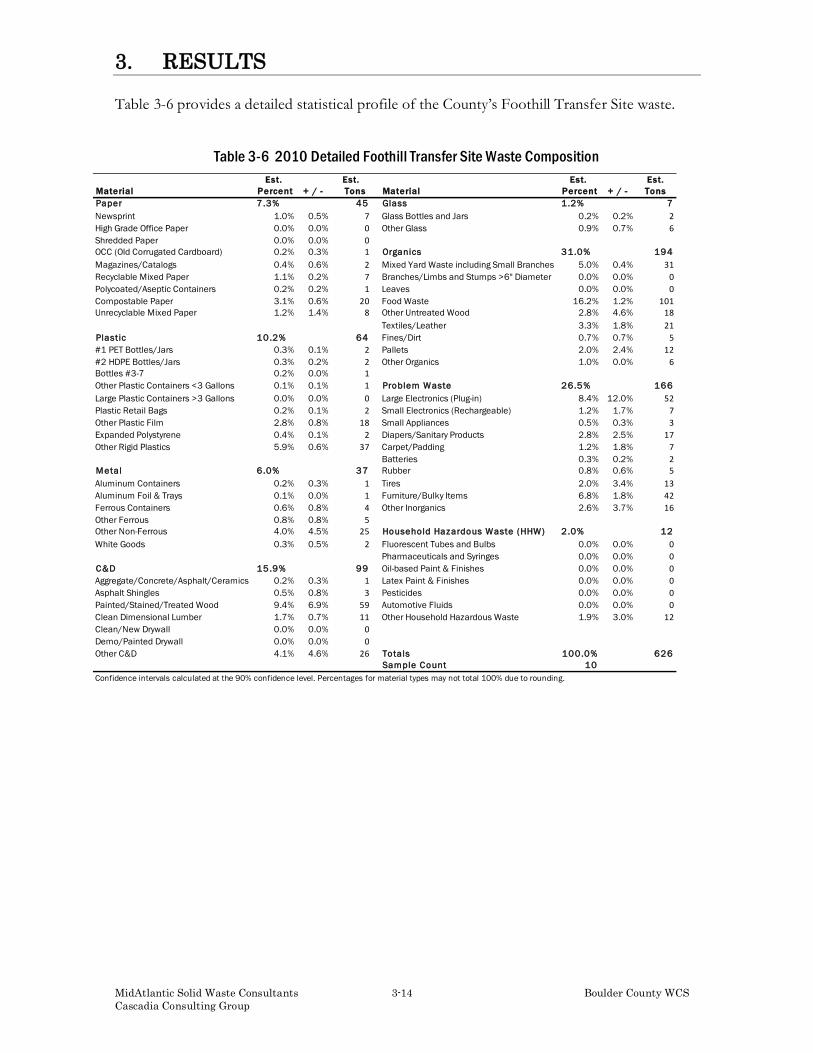
3. RESULTS
MidAtlantic Solid Waste Consultants 3-14 Boulder County WCS Cascadia Consulting Group
Table 3-6 provides a detailed statistical profile of the County’s Foothill Transfer Site waste.
Table 3-6 2010 Detailed Foothill Transfer Site Waste Composition
Est. Est. Est. Est.Material Percent + / - Tons Material Percent + / - TonsPaper 7.3% 45 Glass 1.2% 7Newsprint 1.0% 0.5% 7 Glass Bottles and Jars 0.2% 0.2% 2High Grade Office Paper 0.0% 0.0% 0 Other Glass 0.9% 0.7% 6Shredded Paper 0.0% 0.0% 0OCC (Old Corrugated Cardboard) 0.2% 0.3% 1 Organics 31.0% 194Magazines/Catalogs 0.4% 0.6% 2 Mixed Yard Waste including Small Branches 5.0% 0.4% 31Recyclable Mixed Paper 1.1% 0.2% 7 Branches/Limbs and Stumps >6" Diameter 0.0% 0.0% 0Polycoated/Aseptic Containers 0.2% 0.2% 1 Leaves 0.0% 0.0% 0Compostable Paper 3.1% 0.6% 20 Food Waste 16.2% 1.2% 101Unrecyclable Mixed Paper 1.2% 1.4% 8 Other Untreated Wood 2.8% 4.6% 18
Textiles/Leather 3.3% 1.8% 21Plastic 10.2% 64 Fines/Dirt 0.7% 0.7% 5#1 PET Bottles/Jars 0.3% 0.1% 2 Pallets 2.0% 2.4% 12#2 HDPE Bottles/Jars 0.3% 0.2% 2 Other Organics 1.0% 0.0% 6Bottles #3-7 0.2% 0.0% 1Other Plastic Containers <3 Gallons 0.1% 0.1% 1 Problem Waste 26.5% 166Large Plastic Containers >3 Gallons 0.0% 0.0% 0 Large Electronics (Plug-in) 8.4% 12.0% 52Plastic Retail Bags 0.2% 0.1% 2 Small Electronics (Rechargeable) 1.2% 1.7% 7Other Plastic Film 2.8% 0.8% 18 Small Appliances 0.5% 0.3% 3Expanded Polystyrene 0.4% 0.1% 2 Diapers/Sanitary Products 2.8% 2.5% 17Other Rigid Plastics 5.9% 0.6% 37 Carpet/Padding 1.2% 1.8% 7
Batteries 0.3% 0.2% 2Metal 6.0% 37 Rubber 0.8% 0.6% 5Aluminum Containers 0.2% 0.3% 1 Tires 2.0% 3.4% 13Aluminum Foil & Trays 0.1% 0.0% 1 Furniture/Bulky Items 6.8% 1.8% 42Ferrous Containers 0.6% 0.8% 4 Other Inorganics 2.6% 3.7% 16Other Ferrous 0.8% 0.8% 5Other Non-Ferrous 4.0% 4.5% 25 Household Hazardous Waste (HHW) 2.0% 12White Goods 0.3% 0.5% 2 Fluorescent Tubes and Bulbs 0.0% 0.0% 0
Pharmaceuticals and Syringes 0.0% 0.0% 0C&D 15.9% 99 Oil-based Paint & Finishes 0.0% 0.0% 0Aggregate/Concrete/Asphalt/Ceramics 0.2% 0.3% 1 Latex Paint & Finishes 0.0% 0.0% 0Asphalt Shingles 0.5% 0.8% 3 Pesticides 0.0% 0.0% 0Painted/Stained/Treated Wood 9.4% 6.9% 59 Automotive Fluids 0.0% 0.0% 0Clean Dimensional Lumber 1.7% 0.7% 11 Other Household Hazardous Waste 1.9% 3.0% 12Clean/New Drywall 0.0% 0.0% 0Demo/Painted Drywall 0.0% 0.0% 0Other C&D 4.1% 4.6% 26 Totals 100.0% 626
Sample Count 10Confidence intervals calculated at the 90% confidence level. Percentages for material types may not total 100% due to rounding.
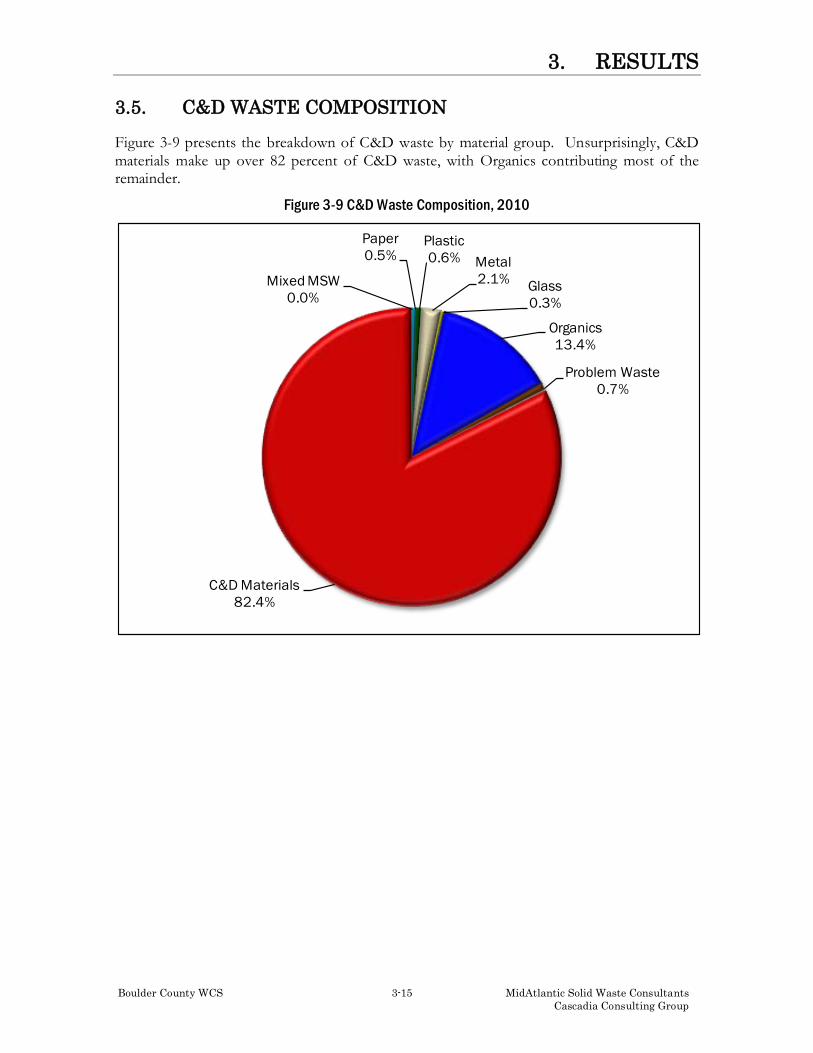
3. RESULTS
Boulder County WCS 3-15 MidAtlantic Solid Waste Consultants Cascadia Consulting Group
3.5. C&D WASTE COMPOSITION Figure 3-9 presents the breakdown of C&D waste by material group. Unsurprisingly, C&D materials make up over 82 percent of C&D waste, with Organics contributing most of the remainder.
Figure 3-9 C&D Waste Composition, 2010
Paper0.5%
Plastic0.6% Metal
2.1% Glass0.3%
Organics13.4%
Problem Waste0.7%
C&D Materials82.4%
Mixed MSW0.0%

3. RESULTS
MidAtlantic Solid Waste Consultants 3-16 Boulder County WCS Cascadia Consulting Group
Figure 3-10 compares the 10 most prevalent materials in disposed C&D waste. Rock/Concrete, Asphalt Shingles, Painted/Stained Wood and Drywall are the most prevalent items.
Figure 3-10 Top 10 Most Prevalent Material Categories in C&D Waste
Table 3-6 provides a detailed statistical profile of the County’s C&D waste stream.
Table 3-7 2010 Detailed C&D Waste Composition
1.7%
2.0%
3.7%
3.8%
6.7%
8.8%
10.2%
12.7%
19.1%
27.5%
0% 5% 10% 15% 20% 25% 30%
Other Ferrous Scrap
Wood Pallets
Untreated Dimensional Lumber
Other C&D
Clean/New Drywall
Demo/Painted Drywall
Dirt/Sand
Painted/Stained/Treated Wood
Asphalt Shingles
Rock/Concrete/Brick
Est. Est. Est. Est.Material Percent + / - Tons Material Percent + / - TonsPaper 0.5% 381 Problem Waste 0.7% 559Uncoated OCC-Recyclable 0.1% 0.0% 51 Electronics 0.0% 0.0% 0Other Paper 0.4% 0.4% 329 Small Appliances 0.3% 0.5% 240
Carpet/Padding 0.3% 0.3% 250Plastic 0.6% 424 Batteries 0.0% 0.0% 0PET Bottles-Beverage 0.0% 0.0% 1 Tires 0.0% 0.0% 0Film Packaging 0.0% 0.0% 25 Furniture/Bulky Items 0.1% 0.1% 70Other Plastic 0.5% 0.4% 398 Fluorescent Light Bulbs 0.0% 0.0% 0
Household Hazardous Waste 0.0% 0.0% 0Metal 2.1% 1,615Aluminum Containers 0.0% 0.0% 4 C&D Materials 82.4% 62,442Other Ferrous Scrap 1.7% 1.7% 1,254 Rock/Concrete/Brick 27.5% 19.4% 20,861Non-ferrous Metal 0.4% 0.4% 325 Asphalt Shingles 19.1% 11.5% 14,499White Goods 0.0% 0.1% 32 Painted/Stained/Treated Wood 12.7% 7.3% 9,624
Untreated Dimensional Lumber 3.7% 2.1% 2,792Glass 0.3% 226 Clean/New Drywall 6.7% 5.8% 5,111Glass Bottles and Jars 0.0% 0.0% 0 Demo/Painted Drywall 8.8% 6.5% 6,670Glass 0.3% 0.4% 226 Other C&D 3.8% 3.0% 2,885
Organics 13.4% 10,130 Mixed MSW 0.0% 0.0% 19Yard Waste 1.2% 1.4% 905Wood Pallets 2.0% 2.5% 1,508Dirt/Sand 10.2% 9.2% 7,716 Totals 100.0% 75,797
Sample Count 37Confidence intervals calculated at the 90% confidence level. Percentages for material types may not total 100% due to rounding.

3. RESULTS
Boulder County WCS 3-17 MidAtlantic Solid Waste Consultants Cascadia Consulting Group
Figure 3-11 shows the C&D waste stream subdivided by material groups that are more closely associated with C&D waste.
Figure 3-11 C&D Waste Composition by C&D Material Category
Rock,Concrete, & Brick, 27.5%
Asphalt Shingles, 19.1%Painted,
Stained, & Treated Wood,
12.7%
Demo & Painted Drywall, 8.8%
Clean & New Drywall, 6.7%
Other C&D, 3.8%
Untreated Dimensional
Lumber , 3.7%
All Other Waste, 17.6%
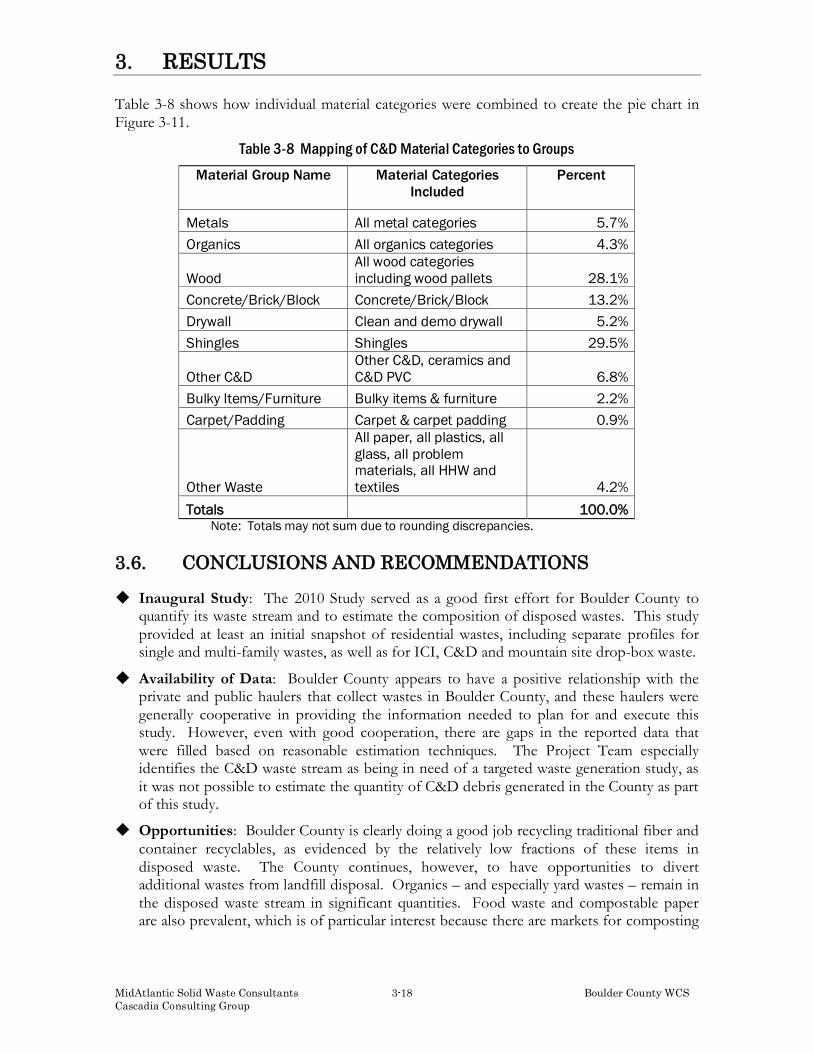
3. RESULTS
MidAtlantic Solid Waste Consultants 3-18 Boulder County WCS Cascadia Consulting Group
Table 3-8 shows how individual material categories were combined to create the pie chart in Figure 3-11.
Table 3-8 Mapping of C&D Material Categories to Groups
Material Group Name Material Categories Included
Percent
Metals All metal categories 5.7% Organics All organics categories 4.3%
Wood All wood categories including wood pallets 28.1%
Concrete/Brick/Block Concrete/Brick/Block 13.2% Drywall Clean and demo drywall 5.2% Shingles Shingles 29.5%
Other C&D Other C&D, ceramics and C&D PVC 6.8%
Bulky Items/Furniture Bulky items & furniture 2.2% Carpet/Padding Carpet & carpet padding 0.9%
Other Waste
All paper, all plastics, all glass, all problem materials, all HHW and textiles 4.2%
Totals
100.0% Note: Totals may not sum due to rounding discrepancies.
3.6. CONCLUSIONS AND RECOMMENDATIONS
Inaugural Study: The 2010 Study served as a good first effort for Boulder County to quantify its waste stream and to estimate the composition of disposed wastes. This study provided at least an initial snapshot of residential wastes, including separate profiles for single and multi-family wastes, as well as for ICI, C&D and mountain site drop-box waste.
Availability of Data: Boulder County appears to have a positive relationship with the private and public haulers that collect wastes in Boulder County, and these haulers were generally cooperative in providing the information needed to plan for and execute this study. However, even with good cooperation, there are gaps in the reported data that were filled based on reasonable estimation techniques. The Project Team especially identifies the C&D waste stream as being in need of a targeted waste generation study, as it was not possible to estimate the quantity of C&D debris generated in the County as part of this study.
Opportunities: Boulder County is clearly doing a good job recycling traditional fiber and container recyclables, as evidenced by the relatively low fractions of these items in disposed waste. The County continues, however, to have opportunities to divert additional wastes from landfill disposal. Organics – and especially yard wastes – remain in the disposed waste stream in significant quantities. Food waste and compostable paper are also prevalent, which is of particular interest because there are markets for composting

3. RESULTS
Boulder County WCS 3-19 MidAtlantic Solid Waste Consultants Cascadia Consulting Group
these materials commercially in Boulder County. Additionally, the fraction of bulky items and furniture were high enough to suggest that incremental reuse opportunities may exist.
Continue Performing Countywide Studies: Waste composition studies inform about the overall disposed waste stream for local planners. While results are helpful to compare against other municipalities in Colorado and nationally, time series waste composition data will provide the County with an informative commentary on its ongoing recycling and diversion efforts. The County should continue to perform a similar project over five to 10 year intervals.
Expanded Multi-family Analysis: The multi-family sampling and sorting performed for this study was helpful in confirming that the disposed waste stream, and therefore the recycling and diversion outreach and programs that are needed, are significantly different for multi-family dwellings in Boulder County. However, the occurrence of several items in the multi-family waste stream – notably, leaves and large electronics – suggest that more study is needed to defensibly determine if these materials are truly occurring in multi-family wastes to the extent shown, or if these samples represent outliers.
Expanded Foothill Transfer Site Analysis: The Foothill Transfer Site sampling and sorting performed for this study was helpful in confirming that the disposed waste stream at the Transfer Sites is significantly different compared to other waste in Boulder County. However, the occurrence of several items in this waste stream – notably, large electronics, HHW, and bulky items – suggest that more study is needed to defensibly determine if these materials are truly occurring at the drop-sites to the extent shown, or if these samples represent outliers.
Focus on C&D: The generation and disposal of C&D debris follows its own unique local market drivers. Although this study was able to obtain some samples of C&D that were obtained at two facilities, spanning the County’s geographic region, it was beyond the scope of this study to defensibly document the generation and distribution of C&D debris, and to determine the composition of C&D debris. Boulder County should consider a more focused effort to characterize C&D as the County continues investigating opportunities to enhance overall recycling rates.

3. RESULTS
MidAtlantic Solid Waste Consultants 3-20 Boulder County WCS Cascadia Consulting Group
This page intentionally left blank.

Boulder County WCS MidAtlantic Solid Waste Consultants Cascadia Consulting Group
APPENDIX A
MATERIAL DEFINITIONS

MidAtlantic Solid Waste Consultants Boulder County WCS Cascadia Consulting Group
This page intentionally left blank.
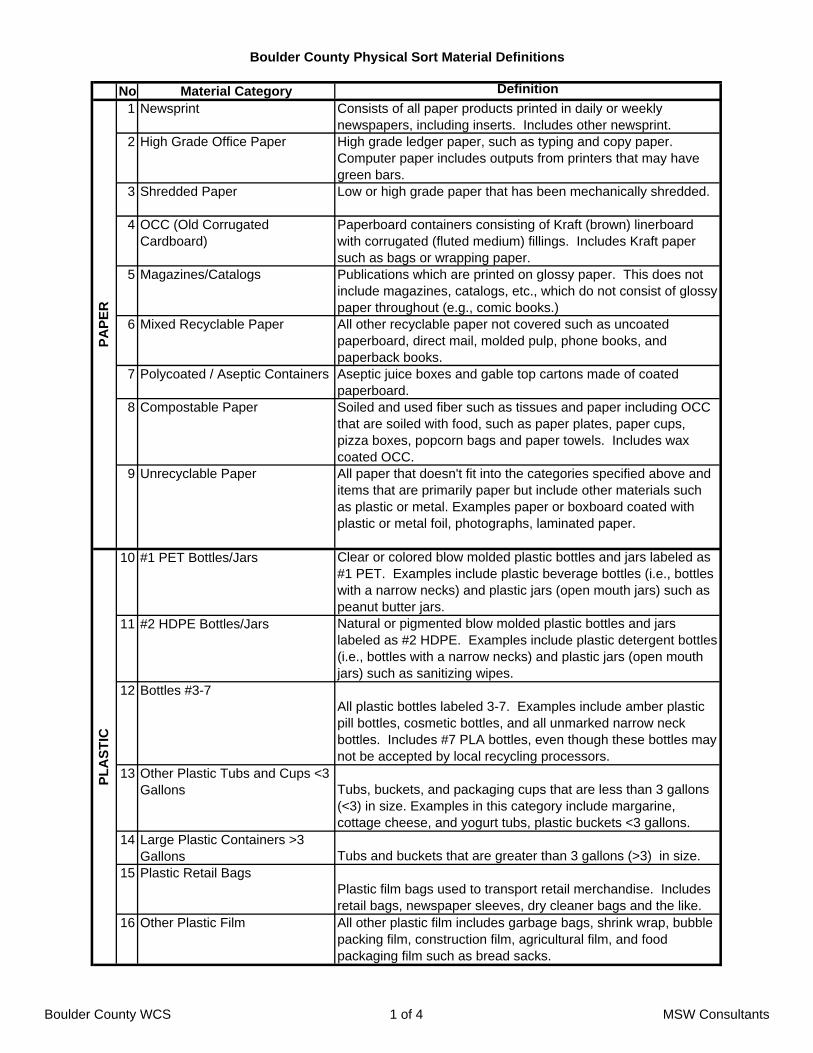
Boulder County Physical Sort Material Definitions
No Material Category Definition
1 Newsprint Consists of all paper products printed in daily or weekly newspapers, including inserts. Includes other newsprint.
2 High Grade Office Paper High grade ledger paper, such as typing and copy paper. Computer paper includes outputs from printers that may have green bars.
3 Shredded Paper Low or high grade paper that has been mechanically shredded.
4 OCC (Old Corrugated Cardboard)
Paperboard containers consisting of Kraft (brown) linerboard with corrugated (fluted medium) fillings. Includes Kraft paper such as bags or wrapping paper.
5 Magazines/Catalogs Publications which are printed on glossy paper. This does not include magazines, catalogs, etc., which do not consist of glossy paper throughout (e.g., comic books.)
6 Mixed Recyclable Paper All other recyclable paper not covered such as uncoated paperboard, direct mail, molded pulp, phone books, and paperback books.
7 Polycoated / Aseptic Containers Aseptic juice boxes and gable top cartons made of coated paperboard.
8 Compostable Paper Soiled and used fiber such as tissues and paper including OCC that are soiled with food, such as paper plates, paper cups, pizza boxes, popcorn bags and paper towels. Includes wax coated OCC.
9 Unrecyclable Paper All paper that doesn't fit into the categories specified above and items that are primarily paper but include other materials such as plastic or metal. Examples paper or boxboard coated with plastic or metal foil, photographs, laminated paper.
10 #1 PET Bottles/Jars Clear or colored blow molded plastic bottles and jars labeled as #1 PET. Examples include plastic beverage bottles (i.e., bottles with a narrow necks) and plastic jars (open mouth jars) such as peanut butter jars.
11 #2 HDPE Bottles/Jars Natural or pigmented blow molded plastic bottles and jars labeled as #2 HDPE. Examples include plastic detergent bottles (i.e., bottles with a narrow necks) and plastic jars (open mouth jars) such as sanitizing wipes.
12 Bottles #3-7All plastic bottles labeled 3-7. Examples include amber plastic pill bottles, cosmetic bottles, and all unmarked narrow neck bottles. Includes #7 PLA bottles, even though these bottles may not be accepted by local recycling processors.
13 Other Plastic Tubs and Cups <3 Gallons Tubs, buckets, and packaging cups that are less than 3 gallons
(<3) in size. Examples in this category include margarine, cottage cheese, and yogurt tubs, plastic buckets <3 gallons.
14 Large Plastic Containers >3 Gallons Tubs and buckets that are greater than 3 gallons (>3) in size.
15 Plastic Retail BagsPlastic film bags used to transport retail merchandise. Includes retail bags, newspaper sleeves, dry cleaner bags and the like.
16 Other Plastic Film All other plastic film includes garbage bags, shrink wrap, bubble packing film, construction film, agricultural film, and food packaging film such as bread sacks.
PA
PE
RP
LA
ST
IC
Boulder County WCS 1 of 4 MSW Consultants

No Material Category Definition
17 Expanded Polystyrene Expanded plastic polymer used for protecting items during shipping, storage, or cold or heat. Includes expanded foam trays, packing peanuts, packing blocks, food clamshells, and coolers.
18 Other Rigid PlasticsAll other rigid plastic not elsewhere classified. Items such as food service, cup lids, toothbrushes, toys, and composite items that are made of 50% or more plastic. May include bioplastics.
19 Aluminum Cans Aluminum beverage and food containers20 Aluminum Foil & Trays Aluminum foil, trays and pie pans21 Ferrous Containers Fabricated, magnetizable metal containers such as steel or
bimetal designed to hold food or beverage products such as soups, vegetables, pet food and juices. Includes two piece containers with aluminum tops other empty spray cans.
22 Other Ferrous Ferrous and alloyed ferrous scrap materials originated from residential commercial, or institutional sources which are attracted to a magnet. This category includes wire coat hangers auto parts and composite materials that are made of 50% more ferrous.
23 Other Non-Ferrous Non-magnetic metals such as brass, bronze, silver, lead copper, aluminum, zinc and composite non-ferrous materials that are made of 50% or more metal. Items such as insulated wiring or plumbing parts. Stainless steel house wares are also part of this category.
24 White Goods Large household appliances such as refrigerators, stoves, air conditioners, and washing machines.
25 Glass Bottles and Jars Clear, green, and brown glass food and beverage containers.
26 Other Glass All other glass items such as plate glass such as window and door glass, table-tops; auto glass; heat resistant cookware (Pyrex); pottery; drinking glasses; and. any other glass that was not used for containing food or drinks.
27 Mixed Yard Waste including SmaGrass clippings, leaves, flowers, small potted plant roots, and branches less than 2" in diameter.
28 Branches, Limbs and Stumps Branches, limbs and logs greater than 2" in diameter29 Leaves Leaves from trees and shrubs. Does not include clippings or
trimmings.30 Food Waste Putrescible organic materials which are the by-products of
activities connected with the growing, preparation, cooking, processing, or consumption of food by humans or pets. This also includes liquids from beverage contains.
31 Non-C&D wood Any wood other than wood generated in the C&D waste stream. Examples include popsicle sticks, chopsticks, pencils, and household items made of wood.
32 Textiles/Leather Woven natural or manmade fibers used to make items such as clothing, bedding, curtains, blankets, stuffed animals, cotton diapers, other cloth material. Natural animal skin used to make shoes, belts and other leather goods.
33 Fines / Dirt Small fragments that pass through the ¼” sort screen, and miscellaneous fines and dirt.
34 Wood Pallets Wood pallets and crating materials commonly used for industrial and commercial packaging and shipping.
PL
AS
TIC
ME
TA
LG
LA
SS
OR
GA
NIC
Boulder County WCS 2 of 4 MSW Consultants
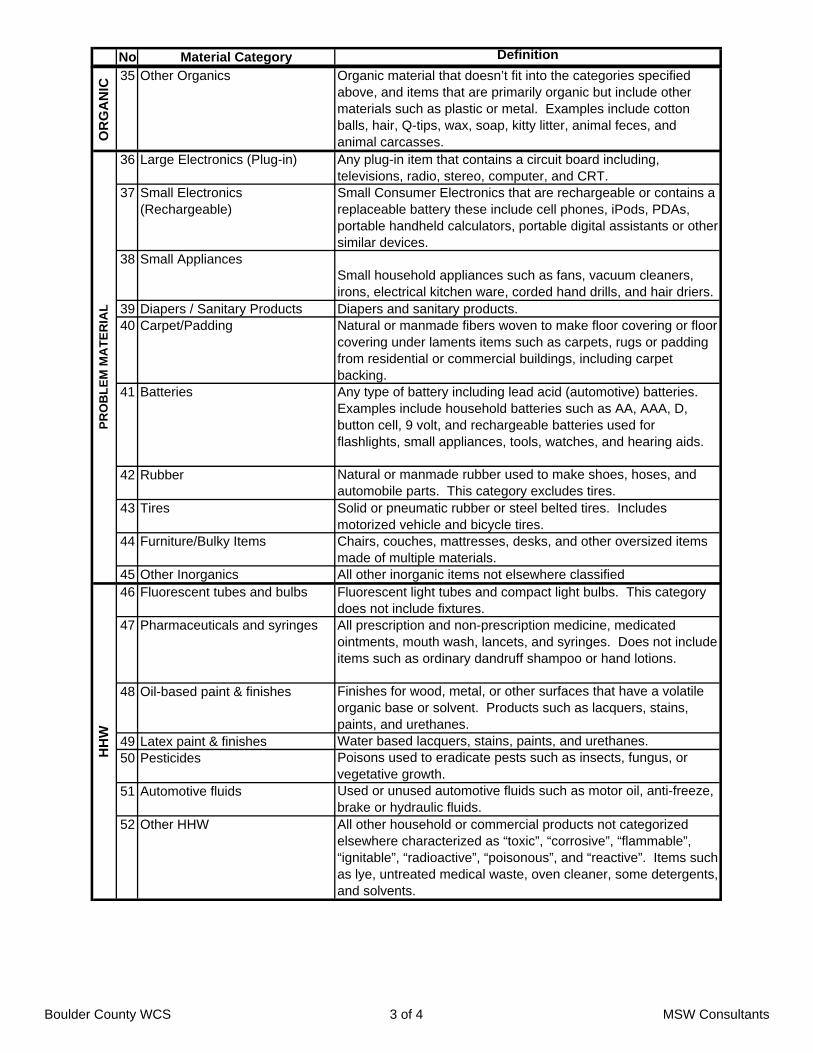
No Material Category Definition
OR
GA
NIC
35 Other Organics Organic material that doesn’t fit into the categories specified above, and items that are primarily organic but include other materials such as plastic or metal. Examples include cotton balls, hair, Q-tips, wax, soap, kitty litter, animal feces, and animal carcasses.
36 Large Electronics (Plug-in) Any plug-in item that contains a circuit board including, televisions, radio, stereo, computer, and CRT.
37 Small Electronics (Rechargeable)
Small Consumer Electronics that are rechargeable or contains a replaceable battery these include cell phones, iPods, PDAs, portable handheld calculators, portable digital assistants or other similar devices.
38 Small AppliancesSmall household appliances such as fans, vacuum cleaners, irons, electrical kitchen ware, corded hand drills, and hair driers.
39 Diapers / Sanitary Products Diapers and sanitary products.40 Carpet/Padding Natural or manmade fibers woven to make floor covering or floor
covering under laments items such as carpets, rugs or padding from residential or commercial buildings, including carpet backing.
41 Batteries Any type of battery including lead acid (automotive) batteries. Examples include household batteries such as AA, AAA, D, button cell, 9 volt, and rechargeable batteries used for flashlights, small appliances, tools, watches, and hearing aids.
42 Rubber Natural or manmade rubber used to make shoes, hoses, and automobile parts. This category excludes tires.
43 Tires Solid or pneumatic rubber or steel belted tires. Includes motorized vehicle and bicycle tires.
44 Furniture/Bulky Items Chairs, couches, mattresses, desks, and other oversized items made of multiple materials.
45 Other Inorganics All other inorganic items not elsewhere classified46 Fluorescent tubes and bulbs Fluorescent light tubes and compact light bulbs. This category
does not include fixtures.47 Pharmaceuticals and syringes All prescription and non-prescription medicine, medicated
ointments, mouth wash, lancets, and syringes. Does not include items such as ordinary dandruff shampoo or hand lotions.
48 Oil-based paint & finishes Finishes for wood, metal, or other surfaces that have a volatile organic base or solvent. Products such as lacquers, stains, paints, and urethanes.
49 Latex paint & finishes Water based lacquers, stains, paints, and urethanes.50 Pesticides Poisons used to eradicate pests such as insects, fungus, or
vegetative growth.51 Automotive fluids Used or unused automotive fluids such as motor oil, anti-freeze,
brake or hydraulic fluids.52 Other HHW All other household or commercial products not categorized
elsewhere characterized as “toxic”, “corrosive”, “flammable”, “ignitable”, “radioactive”, “poisonous”, and “reactive”. Items such as lye, untreated medical waste, oven cleaner, some detergents, and solvents.
PR
OB
LE
M M
AT
ER
IAL
HH
W
Boulder County WCS 3 of 4 MSW Consultants
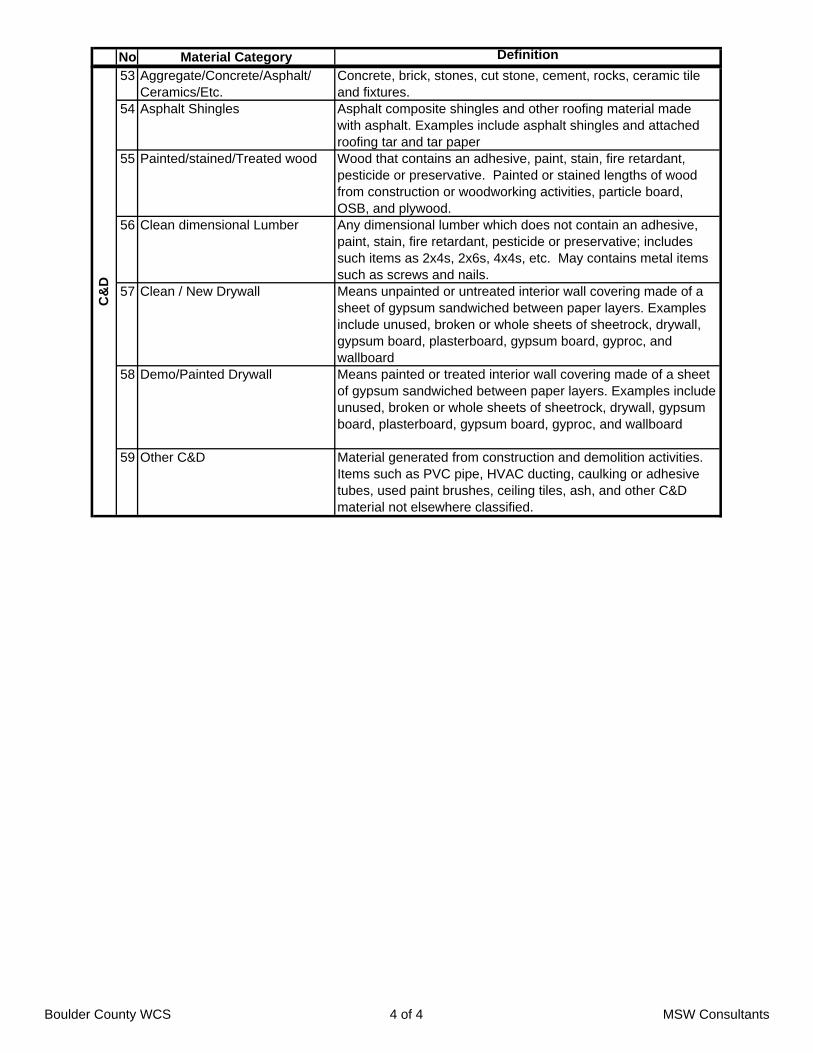
No Material Category Definition
53 Aggregate/Concrete/Asphalt/ Ceramics/Etc.
Concrete, brick, stones, cut stone, cement, rocks, ceramic tile and fixtures.
54 Asphalt Shingles Asphalt composite shingles and other roofing material made with asphalt. Examples include asphalt shingles and attached roofing tar and tar paper
55 Painted/stained/Treated wood Wood that contains an adhesive, paint, stain, fire retardant, pesticide or preservative. Painted or stained lengths of wood from construction or woodworking activities, particle board, OSB, and plywood.
56 Clean dimensional Lumber Any dimensional lumber which does not contain an adhesive, paint, stain, fire retardant, pesticide or preservative; includes such items as 2x4s, 2x6s, 4x4s, etc. May contains metal items such as screws and nails.
57 Clean / New Drywall Means unpainted or untreated interior wall covering made of a sheet of gypsum sandwiched between paper layers. Examples include unused, broken or whole sheets of sheetrock, drywall, gypsum board, plasterboard, gypsum board, gyproc, and wallboard
58 Demo/Painted Drywall Means painted or treated interior wall covering made of a sheet of gypsum sandwiched between paper layers. Examples include unused, broken or whole sheets of sheetrock, drywall, gypsum board, plasterboard, gypsum board, gyproc, and wallboard
59 Other C&D Material generated from construction and demolition activities. Items such as PVC pipe, HVAC ducting, caulking or adhesive tubes, used paint brushes, ceiling tiles, ash, and other C&D material not elsewhere classified.
C&
D
Boulder County WCS 4 of 4 MSW Consultants

Boulder County C&D Material Categories
No. Visual Material Category
Physical Sort Material Category
1 OCC (Old Corrugated Cardboard)
Paperboard containers consisting of Kraft (brown) linerboard with corrugated (fluted medium) fillings. Includes yellow and waxed corrugated boxes and Kraft paper such as bags or wrapping paper. Does not include non-corrugated
b d d t h l h ift bAP
ER
paperboard products such as cereal, shoe, or gift boxes.2 Other Paper Consists of all other paper products.3 PET bottles - beverage Clear or colored blow molded plastic bottles and jars labeled as #1 PET. These
can be clear or colored. Examples include plastic beverage bottles (i.e., bottles with a narrow necks) and plastic jars (open mouth jars) such as peanut butter jars.
4 Film Plastic Film plastic wrap, bags, tarps, and other film
PA
PL
AS
TIC
5 Other plastic All other plastic.6 Aluminum Containers Aluminum containers used for holding beverages, or food.7 Ferrous metal Fabricated, magnetizable metal containers such as steel or bimetal designed to
hold food or beverage products such as soups, vegetables, pet food and juices. Includes two piece containers with aluminum tops other empty spray cans.
Ferrous and alloyed ferrous scrap materials originated from residential Ferrous and alloyed ferrous scrap materials originated from residential commercial, or institutional sources which are attracted to a magnet. This category includes wire coat hangers auto parts and composite materials that are made of 50% more ferrous.
8 Non-ferrous metal Non-magnetic metals such as brass, bronze, silver, lead copper, aluminum, zinc and composite non-ferrous materials that are made of 50% or more metal. Items such as insulated wiring or plumbing parts. Stainless steel house wares are also part of this category.
9 Whit G d L h h ld li h f i t t i diti d
ME
TA
L
9 White Goods Large household appliances such as refrigerators, stoves, air conditioners, and washing machines.
10 Glass Bottles Clear, green, and brown glass food and beverage containers.11 Other Glass All other glass items such as plate glass such as window and door glass, table-
tops; auto glass; heat resistant cookware (Pyrex); pottery; drinking glasses; and. any other glass that was not used for containing food or drinks.
12 Yard Waste Grass clippings, leaves, flowers, small potted plant roots, and branches less than <1/4' in diameter
GL
AS
S
<1/4 in diameter.Branches, limbs and logs greater than 6 (>6) inches in diameterLeaves from trees and shrubs. Does not include clippings or trimmings.
13 Wood Pallets Wood pallets and crating materials commonly used for industrial and commercial packaging and shipping.
14 Dirt/Fines Small fragments that pass through the ¼” sort screen, and miscellaneous fines and dirt.
15 Electronics Any plug-in item that contains a circuit board including, televisions, radio, stereo, SO
RG
AN
IC
5 ect o cs y p ug te t at co ta s a c cu t boa d c ud g, te e s o s, ad o, ste eo,computer, and CRT.Small Consumer Electronics that are rechargeable or contains a replaceable battery these include cell phones, iPods, PDAs, portable handheld calculators, portable digital assistants or other similar devices.
16 Small Appliances Small household appliances such as fans, vacuum cleaners, irons, electrical kitchen ware, corded hand drills, and hair driers.
17 Carpet/Padding Natural or manmade fibers woven to make floor covering or floor covering under l t it h t ddi f id ti l i lO
BL
EM
MA
TE
RIA
LS
laments items such as carpets, rugs or padding from residential or commercial buildings, including carpet backing.P
RO
Boulder County WCS 1 of 2 MSW Consultants

No. Visual Material Category
Physical Sort Material Category
18
Batteries
Any type of battery including lead acid (automotive) batteries. Examples include household batteries such as AA, AAA, D, button cell, 9 volt, and rechargeable batteries used for flashlights, small appliances, tools, watches, and hearing aids.
19 Tires Solid or pneumatic rubber or steel belted tiresMA
TE
RIA
LS
19 Tires Solid or pneumatic rubber or steel belted tires.
20 Furniture/Bulky items Chairs, couches, mattresses, desks, and other oversized items made of multiple materials.
21 Fluorescent Light Bulbs fluorescent light tubes and compact light bulbs. This category does not include fixtures.
22 Household Hazardous Pharmaceuticals and syringes: All prescription and non prescription medicine
PR
OB
LE
M M
22 Household Hazardous Waste
Pharmaceuticals and syringes: All prescription and non-prescription medicine, medicated ointments, mouth wash, lancets, and syringes. Does not include items such as ordinary dandruff shampoo or hand lotions.Oil-based paint & finishes: Finishes for wood, metal, or other surfaces that have a volatile organic base or solvent. Products such as lacquers, stains, paints, and urethanes.Latex paint & finishes: Water based lacquers, stains, paints, and urethanes.Pesticides: Poisons used to eradicate pests such as insects, fungus, or vegetative H
HW
Pesticides: Poisons used to eradicate pests such as insects, fungus, or vegetative growth.Automotive fluids: Used or unused automotive fluids such as motor oil, anti-freeze, brake or hydraulic fluids.Household Hazardous Waste means all household or commercial products not categorized elsewhere characterized as “toxic”, “corrosive”, “flammable”, “ignitable”, “radioactive”, “poisonous”, and “reactive”. Items such as lye, untreated medical waste, oven cleaner, some detergents, and solvents.
23 R k t b i k C t b i k t t t t k i til d fi t23 Rock, concrete, brick Concrete, brick, stones, cut stone, cement, rocks, ceramic tile and fixtures.24 Asphalt Shingles Asphalt composite shingles and other roofing material made with asphalt.
Examples include asphalt shingles and attached roofing tar and tar paper25 Painted/stained/Treate
d wood Wood that contains an adhesive, paint, stain, fire retardant, pesticide or preservative. Painted or stained lengths of wood from construction or woodworking activities, particle board, OSB, and plywood.
26 Clean dimensional lumber
Any dimensional lumber which does not contain an adhesive, paint, stain, fire retardant pesticide or preservative; includes such items as 2x4s 2x6s 4x4s etclumber retardant, pesticide or preservative; includes such items as 2x4s, 2x6s, 4x4s, etc. May contains metal items such as screws and nails.
27 Clean / New Drywall Means unpainted or untreated interior wall covering made of a sheet of gypsum sandwiched between paper layers. Examples include unused, broken or whole sheets of sheetrock, drywall, gypsum board, plasterboard, gypsum board, gyproc, and wallboard
28 Demo/Painted Drywall Means painted or treated interior wall covering made of a sheet of gypsum sandwiched between paper layers. Examples include unused, broken or whole
C&
D
p p y p ,sheets of sheetrock, drywall, gypsum board, plasterboard, gypsum board, gyproc, and wallboard
29 Other C&D Material generated from construction and demolition activities. Items such as PVC pipe, HVAC ducting, caulking or adhesive tubes, used paint brushes, ceiling tiles, ash, and other related C&D material.
MS
W 30 Mixed MSW Bagged waste and/or loose wastes that appear to be mixed residential or commercial waste
M
Boulder County WCS 2 of 2 MSW Consultants

Boulder County WCS MidAtlantic Solid Waste Consultants Cascadia Consulting Group
APPENDIX B
FIELD FORMS

MidAtlantic Solid Waste Consultants Boulder County RFP Cascadia Consulting Group
This page intentionally left blank.
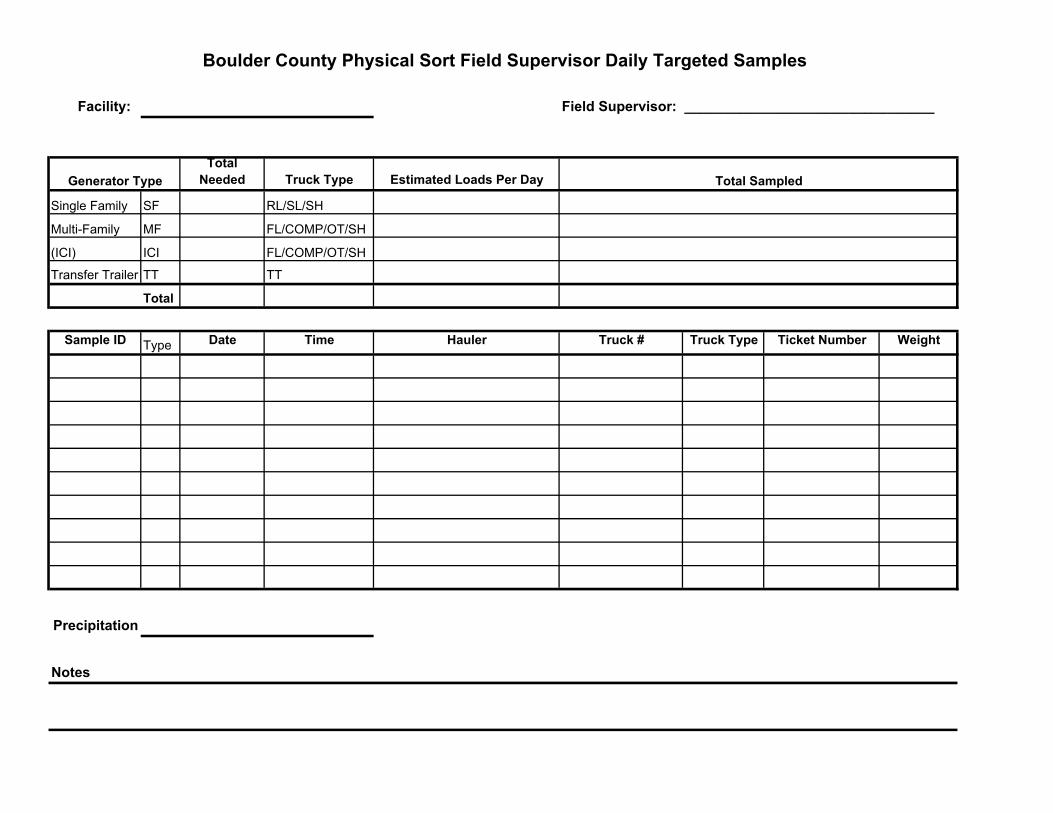
Boulder County Physical Sort Field Supervisor Daily Targeted Samples
Facility: Field Supervisor: ________________________________
Generator TypeTotal
Needed Truck Type Estimated Loads Per Day Total Sampled
Single Family SF RL/SL/SH
Multi-Family MF FL/COMP/OT/SH
(ICI) ICI FL/COMP/OT/SH
Transfer Trailer TT TT
Total
Sample ID Type Date Time Hauler Truck # Truck Type Ticket Number Weight
Precipitation
Notes

Boulder County Refuse Sort Field Data Sheet
Sample ID:___________________ Crew Chief: ___________________________________
Date: ______________________ Time: _______________________________ Location:Material Group Weight (Circle if net weight)
1 Newsprint
2 High Grade Office Paper
3 Shredded Paper
4 OCC (Old Corrugated Cardboard)
5 Magazines/Catalogs
6 Mixed Recyclable Paper
7 Polycoated / Aseptic Containers
8 Compostable Paper
9 Unrecyclable Paper
10 #1 PET Bottles/Jars
11 #2 HDPE Bottles/Jars
12 Bottles #3-7
13 Other Plastic Tubs and Cups <3 Gallons
14 Large Plastic Containers >3 Gallons
15 Plastic Retail Bags16 Other Plastic Film17 Expanded Polystyrene
18 Other Rigid Plastics
19 Aluminum Cans
20 Aluminum Foil & Trays
21 Ferrous Containers
22 Other Ferrous
23 Other Non-Ferrous
24 White Goods
25 Glass Bottles and Jars
26 Other Glass
27 Mixed Yard Waste including Small Branches
28 Branches, Limbs and Stumps
29 Leaves
30 Food Waste
30A Pumpkin Waste
31 Non-C&D wood
32 Textiles/Leather
33 Fines / Dirt
34 Wood Pallets
35 Other Organics
36 Large Electronics (Plug-in)
37 Small Electronics (Rechargeable)
38 Small Appliances
39 Diapers / Sanitary Products
40 Carpet/Padding
41 Batteries
42 Rubber
43 Tires
44 Furniture/Bulky Items
45 Other Inorganics
46 Fluorescent tubes and bulbs
47 Pharmaceuticals and syringes
48 Oil-based paint & finishes
49 Latex paint & finishes
50 Pesticides
51 Automotive fluids
52 Other HHW
53 Aggregate/Concrete/Asphalt/ Ceramics/Etc.
54 Asphalt Shingles
55 Painted/stained/Treated wood
56 Clean dimensional Lumber
57 Clean / New Drywall
58 Demo/Painted Drywall
59 Other C&D
Notes
C&
D D
EB
RIS
HO
US
EH
OL
D H
AZ
AR
DO
US
PA
PE
RP
LA
ST
ICS
GL
AS
SP
RO
BL
EM
WA
ST
EO
RG
AN
ICS
ME
TA
LS

Boulder County Visual Survey Field Data Sheet
Sample ID:___________________ Field Supervisor: ____________________
Circle Generator Sector Residential Non-Residential
Date: __________ Time: ___________ Circle Construction ManufacturingOne Renovation Retail Activity Demolition Warehouse
Location Clean Out Other:
Hauler: ________________________________Truck Number __________________________
Ticket Number _____________________________Load YRD or Weight __________________________
Container Dimensions: _______________________ Container Yardage: ________ Percent Full: _______
Trailer Dimensions: __________________________ Container Yardage: ________ Percent Full: _______
Material Group % By Volume % By Volume
1 Uncoated OCC - recyclable 2 Other Paper
Subtotal 100%
3 PET bottles - beverage
4 Film Packaging5 Other plastic
Subtotal 100%6 Aluminum Containers7 Other ferrous scrap 8 Non-ferrous metal 9 White Goods9 White Goods
Subtotal 100%
10 Glass Bottles and Jars
11 Glass Subtotal 100%
12 Yard Waste
13 Dirt/Sand
Subtotal 100%14 Electronics15 Small Appliances16 Carpet/Padding17 Batteries18 Tires19 Furniture/Bulky items 20 Fluorescent Light Bulbs 21 Household Hazardous Waste
Subtotal 100%22 Rock, concrete, brick 23 Asphalt Shingles24 Painted/stained/Treated wood 25 Untreated dimensional lumber 26 Pallets 27 Usable Durable Items28 Unusable Durable Items29 Clean / New Drywall30 Demo/Painted Drywall31 Other C&D
Subtotal 100%38 Mixed MSW
Subtotal 100%
100% Total
ME
TA
LP
RO
BL
EM
MA
TE
RIA
LC
&D
MA
TE
RIA
LS
PA
PE
RG
LA
SS
OR
GA
NIC
PL
AS
TIC

November
LARIMER COUNTY, COLORADO
TWO-SEASON WASTE COMPOSITION STUDY
Final Report
May 2007
MID ATLANTIC SOLID WASTE CONSULTANTS 625 Sawyer Road, New Market, MD 21774 301/607-6428 842 Spring Island Way, Orlando, FL 32828 407/380-8954 2291 Limehurst Drive, Atlanta, GA 30319 404/496-4872
www.mswconsultants.us

LARIMER COUNTY
TWO-SEASON WASTE COMPOSITION STUDY
TABLE OF CONTENTS
SECTION 1. INTRODUCTION
SECTION 2. METHODOLOGY
SECTION 3. GATE SURVEY
SECTION 4. RESULTS
Exhibits
Appendix A – Material Category Definitions
Larimer County Waste Composition Study i

This page intentionally left blank.
ii Larimer County Waste Composition Study

1. INTRODUCTION
BACKGROUND
The Larimer County Solid Waste Department operates the Larimer County Landfill, a 180-acre municipal solid waste disposal facility just south of Fort Collins. Situated on a 650-acre site, the landfill receives approximately 500 tons of solid waste per day. In addition to the County Landfill, the Solid Waste Department is responsible for an integrated waste management system that includes four transfer stations, five recycling drop-off sites, two permanent household hazardous waste (HHW) collection sites, and a Material Recovery Facility (MRF, a.k.a. Recycling Center). The MRF, which is owned by Larimer County and operated by Waste Management-Recycle America, recently converted to a “single stream” facility, and processes over 100 tons of recyclable containers and paper fiber materials each day.
In any integrated waste management system, it is critical to understand both waste generation and waste composition patterns of the local wasteshed. Regular monitoring of these data improve the Solid Waste Department’s ability to operate and maintain current solid waste infrastructure, plan for future facility needs, and evaluate current and potential new source reduction and recycling programs. To this end, in 1998 Larimer County conducted a waste characterization study (1998 Study) to determine the composition of residential, commercial, and self-haul waste disposed at the Larimer County Landfill. The study results have been used to support planning efforts for the County’s waste management services and to provide a baseline for monitoring changes in waste disposal.
In the ensuing years since the completion of the 1998 Study, a great deal has changed in Larimer County that has impacted the waste stream. County demographics have evolved significantly. Changes in the private collection and disposal market have caused a shift in waste flows. Further, over time, other more recent waste composition studies have consistently shown that the waste stream itself is changing. Such changes in disposed waste come about because of trends like light-weighting of products and packaging, the ongoing shift from glass and fiber-based packaging to plastic packaging, and fluctuations in residential and commercial construction, renovation, and demolition activities, to name but a few examples.
In 2006, Larimer County retained MSW Consultants, LLC, to perform an updated waste composition study (2006 Study). The 2006 Study seeks to achieve the following objectives:
Develop statistically defensible estimates of the annual composition of wastes disposed at the Larimer County Landfill;
Differentiate between the composition of Residential, Commercial, Construction and Demolition (C&D), and Self-haul Wastes to enable sector-specific recycling and diversion program evaluation;
Estimate the quantity of Residential, Commercial, C&D, and Self-haul wastes currently delivered to the Landfill so that a Landfill-aggregate waste composition can be estimated
Larimer County Waste Composition Study 1-1
1. INTRODUCTION
based on the weighted average contribution of wastes from each of these four generator sectors;
Evaluate the efficacy of current recycling and diversion programs in place in Larimer County;
Identify opportunities for incremental recycling and diversion programs that may target disposed materials that are still occurring in high volumes; and
Enable a comparison of waste composition against the 1998 Study to detect trends in the composition of disposed waste.
REPORT ORGANIZATION
This report presents the background, methodology, and results of the two-season waste composition study that was conducted at the County Landfill. The report is divided into the remaining three sections:
Methodology: This section summarizes the detailed sampling plan that was developed to assure that waste composition results would be statistically representative of the total disposed waste stream and also achieve a meaningful level of statistical validity. This section also summarizes elements of the field data collection methodology.
Gate Survey: Because of limitations to the landfill accounting system, it is not currently possible to tabulate incoming material volumes by waste generator (especially residential and commercial wastes in compactor trucks; and C&D and commercial loose waste in roll-offs and other non-compactor commercial trucks). This section summarizes the methodology and results of a gate survey that was conducted to provide defensible estimates of the quantity of wastes delivered to the facility by the main waste generator classes.
Results: Detailed composition results are presented for the aggregate of disposed waste at the Landfill, as well as for the Residential, Commercial, C&D and Self-Haul streams individually. This section also provides comparative data with the 1998 Study.
ACKNOWLEDGEMENTS
MSW Consultants would like to thank the following parties for their help in accomplishing the field data collection for this project:
Steve Harem, Larimer County Environmental Specialist; and
Robert “Dane” Nielsen, Landfill Manager.
The project would not have been successful without the ongoing help and cooperation from these individuals and their staff.
1-2 Larimer County Waste Composition Study

2. METHODOLOGY
SAMPLING PLAN SUMMARY
Prior to conducting any field data collection, a Sampling Plan was developed to assure that the incoming truckloads of waste that were ultimately sampled and sorted were representative of the entire incoming waste stream. This section summarizes the pertinent details of the Sampling Plan that governed field data collection.
SEASONALITY
There were two separate one-week field data collection events. The first field data event started on September 11, 2006 and was completed September 15, 2006; these dates were representative of the “summer” season. The second field data event started on December 4, 2006 and was completed December 8, 2006; these dates were representative of the “winter” season. Collectively, the data from these two seasonal sorts have been combined and analyzed to develop an annual aggregate estimate of the composition of wastes disposed in the County landfill.
WASTE GENERATION SECTORS
For the purposes of this study, a total of four generator sectors were defined:
Residential Waste: Includes residentially generated garbage and trash that is collected by private or public haulers, primarily in compactor vehicles. Residential wastes encompass waste from single family households as well as multi-family apartments and condominiums.
Commercial Waste: Includes municipal solid wastes generated in the commercial, institutional, agricultural, and industrial sectors, and delivered by private haulers primarily in compactor trucks or in compacting roll-off boxes. May include some non-compacted wastes delivered in open top roll-off boxes and in other vehicles. Note that commercial wastes exclude any “special” wastes that may be generated in these sectors.
Self-haul Waste: Encompasses residentially generated wastes that are delivered to the landfill by the actual residential generator. Self-haul waste includes small to mid-size deliveries of waste in cars, pick-up trucks and vans, including those with trailers. Self-haul wastes are recorded separately by the gate house.
C&D Waste: This includes all wastes that are generated as a result of construction, demolition and renovation activities, regardless of who is delivering the wastes. C&D wastes may be delivered by private (or public) haulers in roll-off boxes, and also may be delivered by self-haulers or contractors on construction/demolition/renovation projects (e.g., roofing contractor delivering shingles).
Larimer County Waste Composition Study 2-1

2. METHODOLOGY
SAMPLE SELECTION
MSW Consultants requested, and the County provided, a range of data about incoming material deliveries to the landfill. The following tables were assembled from the incoming material data and provided a basis for targeting a stratified random allocation of incoming loads that reflects the overall delivery patterns at the landfill.
RESIDENTIAL WASTE DELIVERIES AND SAMPLING TARGETS Larimer County was able to provide summary information on the haulers that delivered virtually 100 percent of the COMPACTED WASTE, which includes all Residential Waste. Table 2-1 estimates the proportion of each hauler’s deliveries that are believed to be Residential Waste, and shows the resultant seasonal sampling targets.1 Further, Table 2-1 shows how close the actual samples were compared to the stratified targets.
Table 2-1 Residential Waste Deliveries (cubic yards, 2005) and Sampling Targets
Hauler Total COMPACTED
WASTE (CY) [1]
Residential Fraction
Residential Volume
(CY)
Percentage of Total
Sample Targets
Actual Samples
Canyon Utilities 3,485 80% 2,788 1.7% 0 0
City of Loveland, Solid Waste
39,889 100% 39,889 23.9% 8 9
Dick's Trash Hauling Service
27,143 75% 20,357 12.2% 2 3
GSI (Gallegos Sanitation, Inc.)
91,058 60% 54,635 32.7% 10 11
Ram Waste Systems, Inc.
34,964 60% 20,978 12.6% 4 7
S & S Sanitation
12,464 80% 9,971 6.0% 2 0
Skyline 1,238 100% 1,238 0.7% 0 0
United Waste (new customer)
0 100% unknown 0.0% 0 1
Waste Management
28,339 60% 17,003 10.2% 2 0
Total 258,681 [2] 100.0% 30 31
[1] Unadjusted for compaction. [2] Column does not sum because several haulers with limited deliveries are not shown.
1 At the time the sampling plan was developed, calendar year 2005 data was the most current. Interviews with County staff were used to supplement the 2005 data to assure its representativeness.
2-2 Larimer County Waste Composition Study
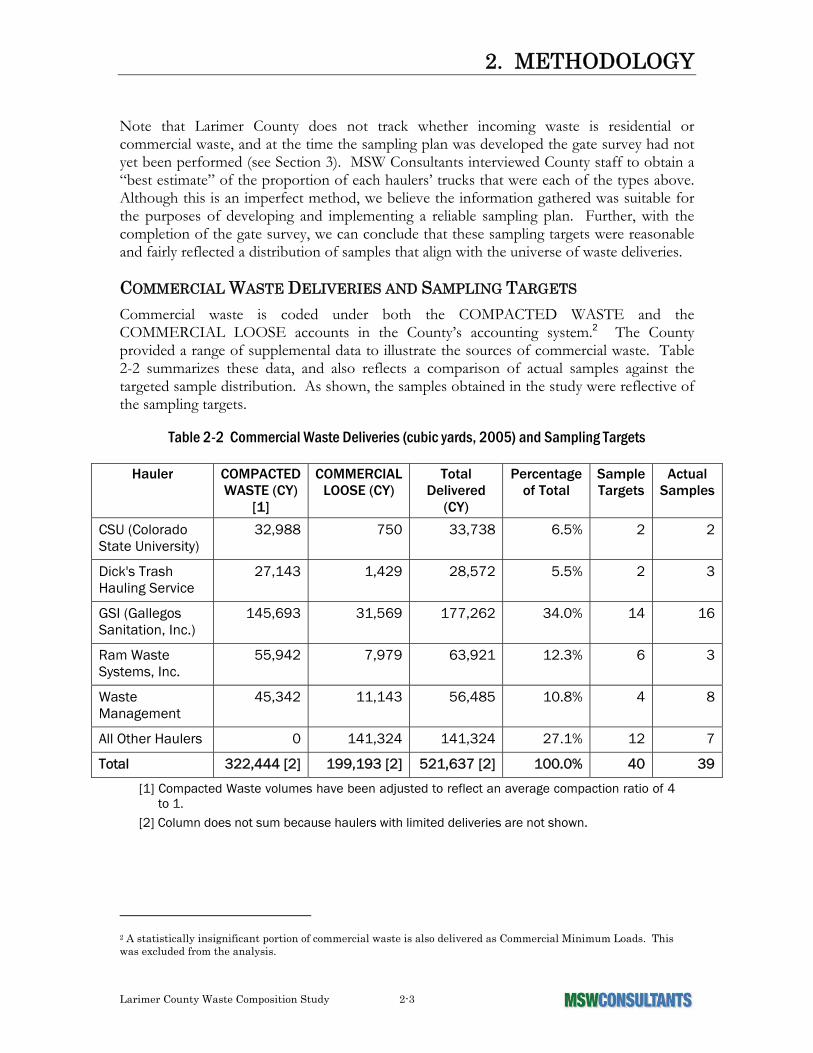
2. METHODOLOGY
Note that Larimer County does not track whether incoming waste is residential or commercial waste, and at the time the sampling plan was developed the gate survey had not yet been performed (see Section 3). MSW Consultants interviewed County staff to obtain a “best estimate” of the proportion of each haulers’ trucks that were each of the types above. Although this is an imperfect method, we believe the information gathered was suitable for the purposes of developing and implementing a reliable sampling plan. Further, with the completion of the gate survey, we can conclude that these sampling targets were reasonable and fairly reflected a distribution of samples that align with the universe of waste deliveries.
COMMERCIAL WASTE DELIVERIES AND SAMPLING TARGETS Commercial waste is coded under both the COMPACTED WASTE and the COMMERCIAL LOOSE accounts in the County’s accounting system.2 The County provided a range of supplemental data to illustrate the sources of commercial waste. Table 2-2 summarizes these data, and also reflects a comparison of actual samples against the targeted sample distribution. As shown, the samples obtained in the study were reflective of the sampling targets.
Table 2-2 Commercial Waste Deliveries (cubic yards, 2005) and Sampling Targets
Hauler COMPACTED WASTE (CY)
[1]
COMMERCIAL LOOSE (CY)
Total Delivered
(CY)
Percentage of Total
Sample Targets
Actual Samples
CSU (Colorado State University)
32,988 750 33,738 6.5% 2 2
Dick's Trash Hauling Service
27,143 1,429 28,572 5.5% 2 3
GSI (Gallegos Sanitation, Inc.)
145,693 31,569 177,262 34.0% 14 16
Ram Waste Systems, Inc.
55,942 7,979 63,921 12.3% 6 3
Waste Management
45,342 11,143 56,485 10.8% 4 8
All Other Haulers 0 141,324 141,324 27.1% 12 7
Total 322,444 [2] 199,193 [2] 521,637 [2] 100.0% 40 39
[1] Compacted Waste volumes have been adjusted to reflect an average compaction ratio of 4 to 1.
[2] Column does not sum because haulers with limited deliveries are not shown.
2 A statistically insignificant portion of commercial waste is also delivered as Commercial Minimum Loads. This was excluded from the analysis.
Larimer County Waste Composition Study 2-3

2. METHODOLOGY
SELF HAUL DELIVERIES AND SAMPLING TARGETS Self haul wastes are wastes delivered in cars, trucks, and other vehicles not specifically designed for waste hauling. Larimer County maintains close track of self-haul wastes in the landfill accounting system. Table 2-3 summarizes the quantities and coding of self-haul wastes. Table 2-3 also shows the actual samples that were obtained in comparison to the targeted number of samples. Note that MSW Consultants was able to obtain significantly more samples than originally expected; this additional data will further increase the statistical validity of the findings.
Table 2-3 Self Haul Waste Deliveries (cubic yards, 2005) and Sampling Targets
Landfill Account Volume (CY)
Percent of Total
Sample Targets
Actual Sampled
Minimum Load in Car 1,687 1.1% 0 0
Minimum Load in Truck
3,188 2.1% 2 2
Loose Waste in Car 8,970 5.9% 4 4
Loose Waste in Truck 136,930 90.8% 54 70
Total 150,775 100.0% 60 76
C&D DELIVERIES AND SAMPLING TARGETS C&D Waste is coded as such at the County Landfill. Table 2-4 summarizes the estimated C&D waste deliveries, sampling targets, and actual samples obtained. MSW Consultants was again able to obtain significantly more samples for this generator sector.
Table 2-4 C&D Waste Deliveries (cubic yards, 2005) and Sampling Targets
Landfill Account Volume (CY)
Percent of Total
Sampling Targets
Actual Sample
C&D Waste coded as COMMERCIAL LOOSE [1] 49,798 23.6% 14 0
Compacted C&D [2] 7,833 3.7% 2 2
C&D Debris in Car 194 0.1% 0 0
Commercial C&D Waste 148,356 70.2% 42 72
C&D Debris in Truck 5,150 2.4% 2 2
Total 211,331 100.0% 60 76
[1] Estimated at 25 percent of total COMMERCIAL LOOSE for purposes of sampling plan development.
[2] No adjustment has been made for compaction based on limited ability to compact C&D debris.
2-4 Larimer County Waste Composition Study

2. METHODOLOGY
We note that the fraction of C&D waste in COMMERCIAL LOOSE was unknown during development of the sampling plan. Although the gate survey (see the following section) validated the sampling plan, it was determined during the field data collection that is was not possible to screen incoming COMMERCIAL LOOSE vehicles to determine that they in fact contained C&D. For this reason, the targeted COMMERCIAL LOOSE samples were shifted to loads that were definitively recorded in the landfill accounting system as being C&D waste.
SAMPLING TARGET SUMMARY
Table 2-5 summarizes the targeted and the actual number of physical and visual samples obtained each season for each of the four waste generator classes targeted in the study.
Table 2-5 Proposed Sampling Targets vs Actual Sampled Targets by Generator Class
Generator Class Targeted Samples
Actual Samples
Difference
Residential – Physical Sorts 30 31 +1
Commercial – Physical Sorts 40 39 -1
C&D Debris – Visual Estimates
60 76 +16
Self Haul – Visual Estimates 60 76 +16
Total 190 222 +32
As shown, MSW Consultants achieved or exceeded sampling targets for three of the four waste generator classes. Commercial waste generator sampling fell one sample shy of the target. This shortfall was due to the practical challenges associated with waste sampling. Specifically, on days the sorting team is in the field, it cannot be predicted the order and timing of the targeted incoming loads of waste. MSW Consultants made every effort to meet the detailed, stratified sampling targets as shown in Table 2-1 through 2-4, and in general succeeded in this effort. We do not believe the one sample shortfall in the commercial waste stream will significantly degrade the results of the analysis. Further, given the much higher inherent variation in the composition of C&D and self-haul wastes, we believe the extra samples obtained for these generator classes will improve the statistical validity of results for these sectors.
FIELD SAMPLING AND SORTING METHODS
Field sampling and sorting methods generally conformed with ASTM standards, refined based on the extensive experience of MSW Consultants in performing numerous similar studies. The following sections summarize field sampling and sorting procedures.
Larimer County Waste Composition Study 2-5

2. METHODOLOGY
LOAD SELECTION
For all four waste generator sectors, the MSW Consultants Field Supervisor remained in communication with the gate attendant(s) to obtain assistance in identifying the loads to be sampled. Each day, the Field Supervisor had a list of targeted deliveries. (For example, on Monday there may have been one Loveland truck, three GSI trucks, one Waste Management truck, etc.). Gate attendants were asked to notify the Field Supervisor when any of these deliveries arrived. The Field Supervisor attempted to take a sample from the targeted incoming loads, although retained freedom to exercise professional judgment in taking alternate loads based on timing and availability of the sort crew and landfill support personnel.
The Field Supervisor further interviewed the drivers of selected loads to obtain information such as origin of the load, waste generating sector, hauler, vehicle type and number, and other data. This information was noted on the vehicle selection form, along with a unique identifying number associated with that vehicle on that day. A summary of the physically sampled loads is shown as Exhibit 1.
We note that even though the County alerted its primary haulers that this study was taking place so that drivers were not caught by surprise, some of the drivers said they lost the Gate Ticket or did not want to divulge any information about the incoming load. In these instances, the sampling selection data was completed to the greatest extent possible.
SIZE OF PHYSICALLY SORTED AND VISUALLY SURVEYED SAMPLES
Consistent with industry literature, we attempted to take samples that weighed between 200 and 250 pounds for all manually-sorted samples. Table 2-6 below summarizes the average, maximum and minimum sample weights from the summer and winter seasons
Table 2-6 Sample Weight Summary
Generating Sector
Number of Samples
Number of Samples <200
Lbs
Minimum Sample Lbs
Maximum Sample Lbs
Average Sample
Lbs
Residential 31 2 155 265 219
Commercial 39 2 170 558 253
As shown in Table 2-6, the average weights of the two seasonal sorts were 219 pounds for the residential and 253 pounds for the commercial sectors, both within or even slightly above the target sample sizes. We note that a total of four samples out of the 70 taken fell below the target sample weight. This reflects the inherent differences in density of tipped wastes. As described further below, samples were taken with the help of a loader taking a scoop from the tipped load. In instances where the wastes in a grab sample were especially “fluffy” (i.e., less dense), even a full bucket of waste may not have achieved the 200 pound target. MSW Consultants does not believe the small number of light samples will bias the results, and upon further analysis of these individual samples to confirm that none were clear outliers, we have opted to include them in the statistical analysis.
2-6 Larimer County Waste Composition Study

2. METHODOLOGY
Visually surveyed samples consisted of the entire load. Load weights for self-haul and C&D waste may range from less than 100 pounds (for car and small truck loads) up to 10+ tons (for C&D loads containing a large fraction of cement block and other dense materials). Table 2-7 below summarizes the cubic yards (CY) and estimated weights for the self-haul and C&D generating sectors.
Table 2-7 Self-Haul and C&D Cubic Yardage and Weight Summary
Cubic Yardage Tons Generating Sector
Number of Samples Min Max Avg Min Max Avg
Self-Haul 76 0.3 30 6.6 0.1 11.5 1.3
C&D 76 1 40 10.8 0.06 12.9 3.4
As expected, C&D loads were larger on average than self-haul loads.
MATERIAL CATEGORIES
Material categories were selected to meet two main objectives. First, the categories were intended to provide meaningful breakdowns of the waste stream from the perspective of evaluating current and potential future source reduction, diversion and recycling programs. Second, the categories were established such that they could be aligned with the results of the 1998 Study for the purpose of evaluating changes in the waste stream.
A total of 45 material categories were ultimately defined for this study. The material categories, detailed definitions, and a mapping of 2006 Study to 1998 Study material categories is included as Appendix A.
TAKING SAMPLES FOR PHYSICAL SORTING
Selected loads of residential and commercial wastes were tipped in a designated area on the landfill face near the sorting area. From each selected load, a sample of waste was selected based on systematic “grabs” originating from the perimeter of the load. MSW Consultants uses a systematic grabbing methodology that pre-selects the location of the grab prior to tipping of the load. For example, if the tipped pile is viewed from the top as a clock face with 12:00 being the part of the load closest to the front of the truck, the first samples will be taken from 3 o’clock, 6 o’clock, 9 o’clock, 12 o’clock, and then from 1, 4, 7, and 10 o’clock, and so-on.
Once the area of the tipped load to be grabbed was selected, the Field Supervisor coordinated with a loader operator to take a grab sample of wastes from that point in the tipped load. The loader operator used the loader (both provided by Larimer County) to remove a sample of waste weighing at least 250 pounds. This sample was deposited on a tarp designated to receive samples. Each sample was labeled by its identifying number using brightly colored spray paint, and digitally photographed.
Larimer County Waste Composition Study 2-7

2. METHODOLOGY
PHYSICAL SORTING
Once the sample had been acquired and placed on a tarp, the material was manually sorted into the prescribed component categories. Plastic 18-gallon bins with sealed bottoms were used to contain the separated components.
Sorters were trained to specialize in certain material groups, with someone handling the paper categories, another the plastics, another the glass and metals, and so on. In this way, sorters became highly knowledgeable in a short period of time as to the definitions of individual material categories.
The Crew Chief monitored the bins as each sample was being sorted, requiring a re-sort of materials that were improperly classified. Open bins allowed the Crew Chief to see the material at all times. The Crew Chief also verified the sorting accuracy of each component during the weigh-out. The materials were sorted to particle size of 2-inches or less by hand, until no more than a small amount of homogeneous material remained. This layer of mixed 2-inch-minus material was allocated to the appropriate categories based on the best judgment of the Crew Chief—most often a combination of Other Paper, Other Organics, or Food Waste. The overall goal was to sort each sample directly into component categories in order to reduce the amount of indistinguishable fines or miscellaneous categories. Note that the sorting methodology included the use of a customized, sturdy framed sort table that has a removable screen sized at ½ inch. Small particles passing through the screen were swept into a separate container and recorded in their own material category called “Fines” (categorized under the Organics material group).
VISUAL SURVEYING
Visual surveying of a load of self-haul or C&D waste involved detailed volumetric measurements of the truck and load dimensions, followed by the systematic observation of the major material components in the tipped load. The basic steps to visual surveying are:
1. Measure the dimensions of the incoming load prior to tipping and (if possible) estimate the percent full of the vehicle.
2. Tip the load. If it is a large load, and if conditions permit, have a loader spread out the material so that it is possible to discern dense materials such as block, brick, and dirt that tend to sink to the bottom of the pile.
3. Make a first pass around the load marking the major material categories that are present in the load—cardboard, drywall, dimensional lumber, etc. Estimate the percentage of the load made up of these major materials. If possible, estimate of the yardage associated with this material.
4. Make a second pass around the load, noting the secondary material categories contained in the load. Estimate the percentage of the load made up of these materials. Because the MSW Consultants Field Supervisor conducting this study is highly experienced in visual surveying of C&D and Self Haul loads, this step also included estimating the actual weight, in pounds, of each of the material identified in the load. Volume and weight estimates will be reconciled in the QC process.
2-8 Larimer County Waste Composition Study

2. METHODOLOGY
5. Validate that the estimated percentages sum to 100 percent, and that the estimated weight and volume of major material categories is realistic given the overall truck dimensions and volume.
Because some residential and commercial waste was included in self-haul and C&D waste, the field data form included a category for “Mixed MSW.” Mixed MSW has been apportioned back into the self-haul and C&D composition estimates based on the composition of residential and commercial waste observed in the physical sorting.
DATA RECORDING
The weigh-out and data recording process is arguably the most critical process of the sort. The Crew Chief was singularly responsible for overseeing all weighing and data recording of each sample. Once each sample had been sorted, and fines swept from the table, the weigh-out was performed. Each bin containing sorted materials from the just-completed samples were carried over to a digital scale provided by MSW Consultants. Sorting laborers assisted with carrying and weighing the bins of sorted material, the Crew Chief recorded all data.
The Crew Chief used a waste composition data sheet to record the composition weights. Each data sheet containing the sorted weights of each sample was matched up against the Field Supervisor’s sample sheet to assure accurate tracking of the samples each day.
Visual survey sheets were filled out by the Field Supervisor, who could easily match them up against the master sample sheet.
Data sheets were entered into a spreadsheet each evening to assure that sample weights were meeting targeted minimum levels, and that sample data appears to be reasonable.
CONCLUSION
Field data collection methods closely followed industry-standard procedures. With almost no precipitation during the field data collection events, MSW Consultants believes that external contamination from moisture was minimal to nil. Given the careful logistical management of the sample collection process, the field data collection was performed with no known problems. The resulting data meet the objective of being representative of disposed wastes within each of the four generator classes targeted in the study.
Larimer County Waste Composition Study 2-9

2. METHODOLOGY
This page intentionally left blank.
2-10 Larimer County Waste Composition Study

3. GATE SURVEY
INTRODUCTION
The Larimer County Landfill tracks incoming waste quantities based on several categories, including Loose Waste, Compacted Waste, C&D Debris, and a range of special wastes such as tires, rip-rap, and tree limbs. The landfill further tracks whether deliveries are in a car, a truck, or a commercial vehicle, as there are different state-imposed surcharges on each type of delivery vehicle. Table 3-1 summarizes the quantities of wastes received for calendar year 2006 based on the landfill’s gatehouse coding system.
Table 3-1 2006 Incoming Waste Quantities [1]
Transaction Type Material Description
Cubic Yards
MIN CAR Loads delivered in a car that are less than ½ CY 2,481
MIN COMM Loads delivered in a commercial non-compacting vehicle that are less than ½ CY 261
MIN TRK Loads delivered in a pick-up truck that are less than ½ CY 2,427
LOOSE CAR Loose waste delivered in a car 15,012
LOOSE COMM Loose waste delivered in a commercial vehicle 129,047
XFERSTATION Transfer trailers from Estes Park, Berthoud, or Wellington 56,425
LOOSE NO X Commercial wastes with no disposal charge 1,418
LOOSE TRK Loose waste delivered in a pick-up truck 120,641
ROADSIDE Commercial waste from roadside cleaning 86
COMPACTED Waste delivered in commercial compacting vehicles 263,781
COMPCT C&D C&D Debris delivered in commercial compacting vehicles 592
C&D CAR C&D delivered in a car 223
C&D COMM C&D delivered in a commercial non-compacting vehicle 117,383
C&D TRK C&D delivered in a pick-up truck 4,290
Totals [2] 714,067
[1] Source: Larimer County [2] This table excludes Rip/Fill, Tree limbs, Animal carcasses, Non-friable asbestos, Tires,
Appliances, and Auto bodies.
Given the transaction codes shown above, Larimer County landfill gate records are limited for two reasons. First, it is not possible to query the database in such a way as to subdivide deliveries by generator sector. Second, the landfill does not have scales and consequently all deliveries, whether loose or compacted, are recorded in cubic yards. Although the Landfill
Larimer County Waste Composition Study 3-1

3. GATE SURVEY
accounting software stores material densities and the corresponding weight estimate, the County reports waste deliveries based on volume.
Because of these limitations, a comprehensive survey of incoming vehicles was performed to better estimate the true proportion of material from the following four main generator classes:
Residential (compactor trucks),
Commercial,
Construction and Demolition (C&D), and
Self haul (personal cars and pick-up trucks).
METHODOLOGY
MSW Consultants conducted a gate survey of incoming vehicles over a one-week period from September 14 through September 20, 2006. The survey was performed from the time the facility opened until close (i.e., 7:00 am to 4:00 pm) each day during this period, except Sunday. Sunday deliveries were found to be predominantly self-haul and therefore did not need to be surveyed.
Based on a review of detailed gatehouse records, two delivery codes were targeted in the survey: COMPACTED WASTE and COMMERCIAL LOOSE waste. The MSW Consultants Surveyor remained in or outside the gate houses and interviewed drivers of incoming truckloads that were recorded as COMMERCIAL LOOSE or COMPACTED WASTE definitions (either by gate attendants or by the automated attendant). (Although out of scope, vehicles that were recorded as C&D COMM [Commercial C&D Waste] were also surveyed, primarily because the roll-off, dump, and other non-compacting vehicles that deliver C&D COMM are also the type of vehicle that typically deliver COMMERCIAL LOOSE.) Upon confirming that an incoming vehicle was among the two targeted classifications (primarily the compactor trucks and roll-offs), MSW Consultants staff interviewed the driver to determine the origin of the waste and the generator type. The data was recorded on a customized field data form that recorded the proportion, by volume, of the waste contained in that load that was (i) residential, (ii) commercial, (iii) C&D, or (iv) Other. The survey form also recorded the transaction/ticket number for each surveyed vehicle.
The Surveyor moved between the automated entry way and the two staffed entries to capture the majority of incoming COMPACTED and COMMERCIAL LOOSE loads. To overcome the potential for missing any incoming loads, MSW Consultants provided a survey form to the gate attendants in each gate house to supplement data collected by MSW Consultants during especially busy times. Table 3-2 summarizes the vehicles surveyed.
3-2 Larimer County Waste Composition Study

3. GATE SURVEY
Table 3-2 Summary of Vehicles Surveyed
WASTE TYPE Number of
Vehicles
Number of Vehicles Surveyed
Percentage Surveyed
C&D COMM 243 184 75.7%
COMPACTED 265 252 95.1%
LOOSE COMM[1] 266 208 78.2%
Total 774 644 83.2%
[1] Excludes Transfer Trailers, which are also recorded as LOOSE COMM
A total of 664 incoming vehicles were surveyed during the 5 day period, or about 111 vehicles per day. Of the targeted loads, 75.7 percent of the C&D COMM, 95.1 percent of the COMPACTED and 78.2 percent of the LOOSE COMM were surveyed. The LOOSE COMM waste delivered in transfer trailers from a known origin were excluded from the survey.
Table 3-3 provides a parallel summary of the proportion of all incoming cubic yards that were surveyed. As shown, just shy of 90 percent of all incoming cubic yards were captured in the survey for all waste types. Although this is not perfect coverage, we believe it is sufficient to derive the estimated breakdown of incoming wastes by generator sector.
Table 3-3 Summary of Cubic Yards Surveyed
WASTE TYPE Incoming Yardage
Yards Surveyed
Percentage Surveyed
C&D COMM 2,008 1,652 82.3%
COMPACTED 5,304 4,765 89.8%
LOOSE COMM[1] 2,497 2,183 87.4%
Total 9,809 8,600 87.7%
[1] Excludes Transfer Trailers, which are also recorded as LOOSE COMM
At the conclusion of the gate survey, Larimer County provided MSW Consultants with a complete data dump of all landfill gate transactions from that week, including ticket number, material volume, type of waste, gate attendant on duty, etc. MSW Consultants entered all data obtained in the gate survey and mapped the survey data to the facility transaction data. Once mapped, the two data sets provide a very detailed breakdown of the proportion of each incoming material type for the targeted week. Results of this process are contained in the following section.
Larimer County Waste Composition Study 3-3
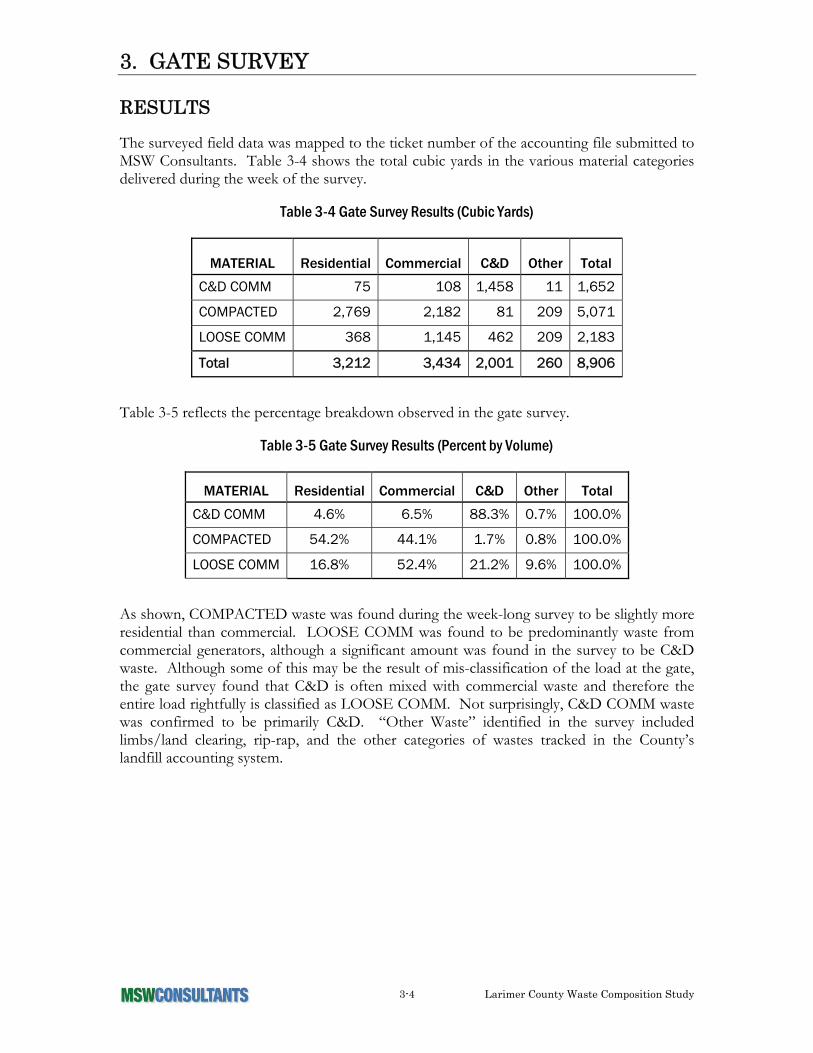
3. GATE SURVEY
RESULTS
The surveyed field data was mapped to the ticket number of the accounting file submitted to MSW Consultants. Table 3-4 shows the total cubic yards in the various material categories delivered during the week of the survey.
Table 3-4 Gate Survey Results (Cubic Yards)
MATERIAL Residential Commercial C&D Other Total
C&D COMM 75 108 1,458 11 1,652
COMPACTED 2,769 2,182 81 209 5,071
LOOSE COMM 368 1,145 462 209 2,183
Total 3,212 3,434 2,001 260 8,906
Table 3-5 reflects the percentage breakdown observed in the gate survey.
Table 3-5 Gate Survey Results (Percent by Volume)
MATERIAL Residential Commercial C&D Other Total
C&D COMM 4.6% 6.5% 88.3% 0.7% 100.0%
COMPACTED 54.2% 44.1% 1.7% 0.8% 100.0%
LOOSE COMM 16.8% 52.4% 21.2% 9.6% 100.0%
As shown, COMPACTED waste was found during the week-long survey to be slightly more residential than commercial. LOOSE COMM was found to be predominantly waste from commercial generators, although a significant amount was found in the survey to be C&D waste. Although some of this may be the result of mis-classification of the load at the gate, the gate survey found that C&D is often mixed with commercial waste and therefore the entire load rightfully is classified as LOOSE COMM. Not surprisingly, C&D COMM waste was confirmed to be primarily C&D. “Other Waste” identified in the survey included limbs/land clearing, rip-rap, and the other categories of wastes tracked in the County’s landfill accounting system.
3-4 Larimer County Waste Composition Study

3. GATE SURVEY
ANNUAL PROJECTIONS
Table 3-6 below summarizes calendar year 2006 material volumes received at the landfill. This table shows the allocation of the various material categories tracked by the current accounting system.
Table 3-6 2006 Annual Waste Quantities (cubic yards) by Generating Sector, Raw Data [1]
Material Residential Commercial Self Haul C&D Other Annual Cubic
Yards
MIN CAR 0 0 2,481 0 0 2,481
MIN COMM 0 261 0 0 0 261
MIN TRK 0 0 2,427 0 0 2,427
LOOSE CAR 0 0 15,012 0 0 15,012
LOOSE COMM Unknown 129,047
XFERSTATION Unknown 56,425
LOOSE NO X 0 1,418 0 0 0 1,418
LOOSE TRK 0 0 120,641 0 0 120,641
ROADSIDE 0 86 0 0 0 86
COMPACTED Unknown 263,781
COMPCT C&D 0 0 0 592 0 592
C&D CAR 0 0 0 223 0 223
C&D COMM 0 0 0 117,383 0 117,383
C&D TRK 0 0 0 4,290 0 4,290
Totals [2] 0 1,765 140,561 122,488 0 714,067
[1] Source: Larimer County Landfill [2] Excludes Rip/Fill, Rip/Fill F, Tree Car, Tree Comm, Tree Trk, Tree Disc, Tree Trunk, Tree
Xmas, Animal carcasses, Non-friable asbestos, Tires, Appliances, and Auto bodies.
As shown in the table, the LOOSE COMM, XFERSTATION, and COMPACTED categories cannot be allocated to a generator type. MSW Consultants applied the results of the gate survey to allocate the LOOSE COMM and COMPACTED wastes to the appropriate generator class. Further, we assume that XFERSTATION loads contain a mix of residential, commercial, self haul and C&D waste roughly in proportion to the direct-haul quantities received at the Larimer County landfill. Based on these assumptions, Table 3-7 applies the results of the gate survey to allocate all wastes to the appropriate generator sector.
Larimer County Waste Composition Study 3-5

3. GATE SURVEY
Table 3-7 2006 Annual Waste Volume (cubic yards) by Generator, Allocated [1]
Material Residential Commercial Self Haul C&D Other Annual
Cubic Yards
MIN CAR 0 0 2,481 0 0 2,481
MIN COMM 0 261 0 0 0 261
MIN TRK 0 0 2,427 0 0 2,427
LOOSE CAR 0 0 15,012 0 0 15,012
LOOSE COMM 21,739 67,669 0 27,302 12,337 129,047
LOOSE NO X 0 1,418 0 0 0 1,418
LOOSE TRK 0 0 120,641 0 0 120,641
ROADSIDE 0 86 0 0 0 86
COMPACTED 144,021 113,479 0 4,200 2,081 263,781
COMPCT C&D 0 0 0 592 0 592
C&D CAR 0 0 223 0 223
C&D COMM 5,358 7,646 0 103,598 782 117,384
C&D TRK 0 0 4,290 0 4,290
Subtotal [2] 117,118 190,559 140,561 140,205 15,200 657,643
Percent of Total 28.3% 30.1% 19.7% 19.8% 2.2% 100.0%
XFERSTATION 15,968 16,984 11,116 11,172 1,241 56,425
GRAND TOTAL 133,086 207,543 151,677 151,377 16,441 714,068
[1] Larimer County data allocated based on the results of the gate survey [2] Excludes Rip/Fill, Rip/Fill F, Tree Car, Tree Comm, Tree Trk, Tree Disc, Tree Trunk, Tree
Xmas, Animal carcasses, Non-friable asbestos, Tires, Appliances, and Auto bodies.
As shown, the Larimer County landfill received 714 thousand yards of waste in 2006. Of this amount 28.3 percent was residential waste delivered by commercial haulers, 30.1 percent was commercial waste delivered by commercial haulers, and 19.7 percent was delivered by self-haulers. C&D wastes made up 19.8 percent, and other wastes were 2.2 percent.
The composition of wastes from each of these generator sectors will be addressed in Section 4 of this report. The weighted average aggregate waste composition will be based on the weighting factors derived in this gate survey.
As a final step, MSW Consultants applied density estimates for the different waste types to convert Table 3-7 from volume to weight. These density estimates are based on other density data points available to MSW Consultants, Larimer County, the U.S. Environmental Protection Agency (EPA), as well as on truck body manufacturer specifications. The following densities were used to convert volume to weight:
COMPACTED – 750 Lbs/CY
3-6 Larimer County Waste Composition Study

3. GATE SURVEY
COMPACTED C&D – 625 Lbs/CY
XFERSTATION – 600 Lbs/CY
C&D COM , C&D TRUCK, and C&D CAR – 325 Lbs/CY
LOOSE COM and MIN COMM – 200 Lbs/CY
MIN TRUCK, LOOSE NOX, LOOSE TRUCK, and ROADSIDE – 150 Lbs/CY
MIN CAR and LOOSE CAR – 100 Lbs/CY
Table 3-8 applies these density factors to each type of waste to calculate the total weight of the incoming material categories.
Table 3-8 2006 Annual Waste Quantities (Tons) by Generator, Allocated [1]
Material Residential Commercial Self Haul C&D Other Annual
Tons
MIN CAR 0 0 124 0 0 124
MIN COMM 0 26 0 0 0 26
MIN TRK 0 0 182 0 0 182
LOOSE CAR 0 0 751 0 0 751
LOOSE COMM 2,174 6,767 0 2,730 1,234 12,905
XFERSTATION 9,242 7,282 0 270 134 16,927
LOOSE NO X 0 0 106 0 0 106
LOOSE TRK 0 0 9,048 0 0 9,048
ROADSIDE 0 0 0 0 6 6
COMPACTED 52,208 41,136 0 1,523 754 95,621
COMPCT C&D 0 0 0 185 0 185
C&D CAR 0 0 0 36 0 36
C&D COMM 0 0 0 19,075 0 19,075
C&D TRK 0 0 0 697 0 697
Total 63,624 55,211 10,211 24,516 2,128 155,689
Percentage 41% 35% 7% 16% 1% 100%
[1] Larimer County data allocated based on the results of the gate survey [2] Excludes Rip/Fill, Rip/Fill F, Tree Car, Tree Comm, Tree Trk, Tree Disc, Tree Trunk, Tree
Xmas, Animal carcasses, Non-friable asbestos, Tires, Appliances, and Auto bodies.
As shown, the Larimer County landfill was estimated to receive 155,689 tons of waste in 2006. Of this amount 41 percent by weight was Residential waste, 35 percent was Commercial waste, and 7 percent was delivered by Self-haulers. C&D wastes made up 16 percent, and Other Wastes were one percent. Figure 3-1 summarizes the relative
Larimer County Waste Composition Study 3-7
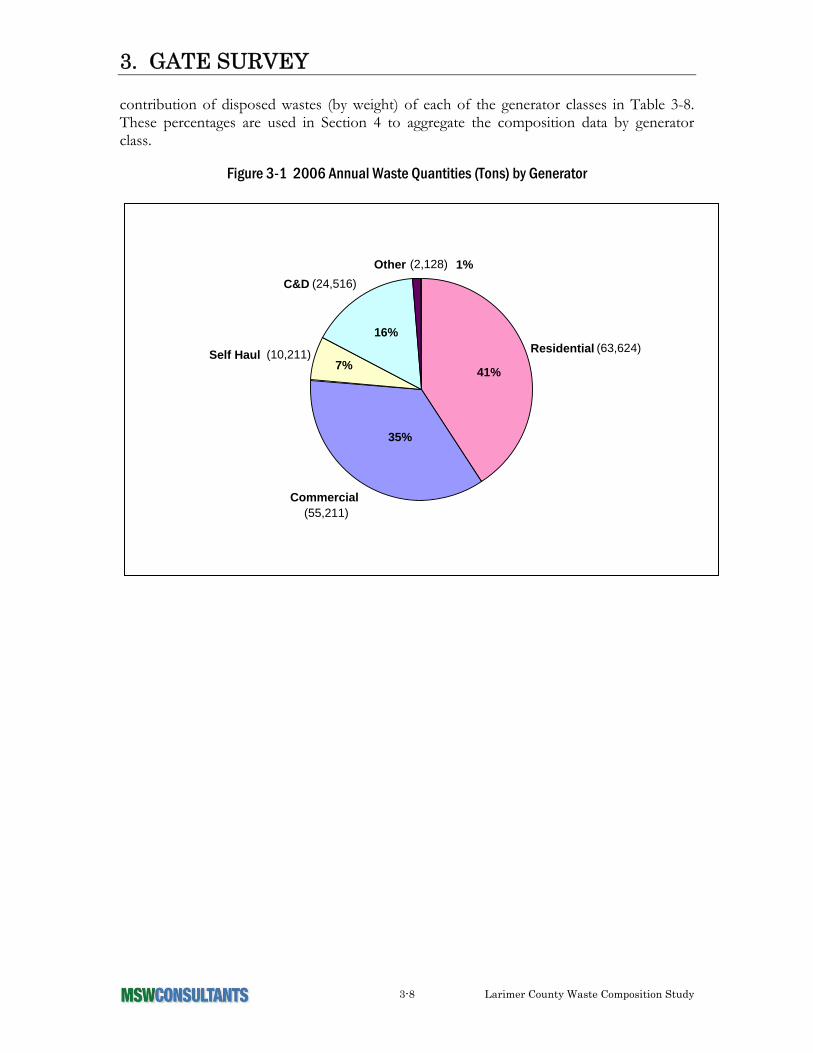
3. GATE SURVEY
contribution of disposed wastes (by weight) of each of the generator classes in Table 3-8. These percentages are used in Section 4 to aggregate the composition data by generator class.
Figure 3-1 2006 Annual Waste Quantities (Tons) by Generator
(2,128)Other
Commercial (55,211)
Self Haul (10,211)
C&D (24,516)
Residential (63,624)
1%
16%
7%41%
35%
3-8 Larimer County Waste Composition Study
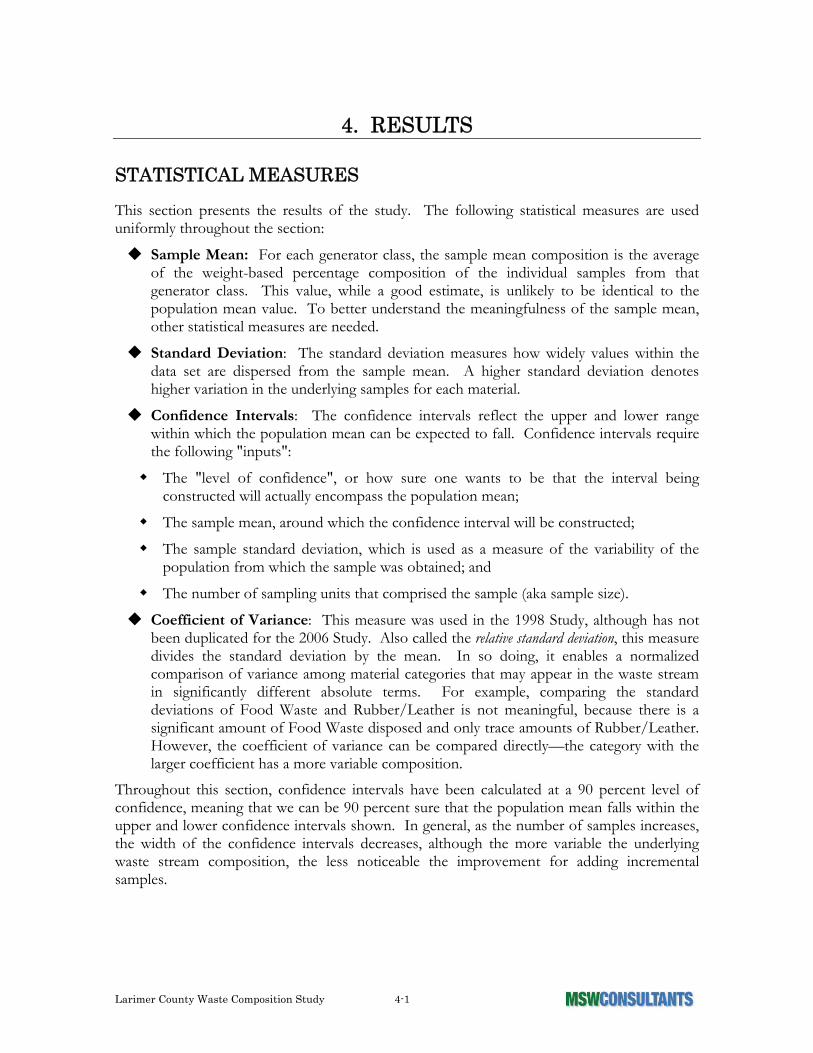
4. RESULTS
STATISTICAL MEASURES
This section presents the results of the study. The following statistical measures are used uniformly throughout the section:
Sample Mean: For each generator class, the sample mean composition is the average of the weight-based percentage composition of the individual samples from that generator class. This value, while a good estimate, is unlikely to be identical to the population mean value. To better understand the meaningfulness of the sample mean, other statistical measures are needed.
Standard Deviation: The standard deviation measures how widely values within the data set are dispersed from the sample mean. A higher standard deviation denotes higher variation in the underlying samples for each material.
Confidence Intervals: The confidence intervals reflect the upper and lower range within which the population mean can be expected to fall. Confidence intervals require the following "inputs":
The "level of confidence", or how sure one wants to be that the interval being constructed will actually encompass the population mean;
The sample mean, around which the confidence interval will be constructed;
The sample standard deviation, which is used as a measure of the variability of the population from which the sample was obtained; and
The number of sampling units that comprised the sample (aka sample size).
Coefficient of Variance: This measure was used in the 1998 Study, although has not been duplicated for the 2006 Study. Also called the relative standard deviation, this measure divides the standard deviation by the mean. In so doing, it enables a normalized comparison of variance among material categories that may appear in the waste stream in significantly different absolute terms. For example, comparing the standard deviations of Food Waste and Rubber/Leather is not meaningful, because there is a significant amount of Food Waste disposed and only trace amounts of Rubber/Leather. However, the coefficient of variance can be compared directly—the category with the larger coefficient has a more variable composition.
Throughout this section, confidence intervals have been calculated at a 90 percent level of confidence, meaning that we can be 90 percent sure that the population mean falls within the upper and lower confidence intervals shown. In general, as the number of samples increases, the width of the confidence intervals decreases, although the more variable the underlying waste stream composition, the less noticeable the improvement for adding incremental samples.
Larimer County Waste Composition Study 4-1

4. RESULTS
ADJUSTING FOR CONTAMINATION
Note that the results shown in this report have not been adjusted for contamination.
During the collection, tipping, and sorting of samples of residential and commercial wastes, moisture and particulate matter of some material categories cross-contaminate other material categories. For example, liquids in food waste may be absorbed by the various paper categories; broken glass particles may embed or adhere to foam plastics or textiles. Based on testing performed in other studies, the impact of contamination is minimal for many categories, but can be significant for some. The following categories from the 2006 Study are most likely to be impacted by moisture and particulate contamination:
All of the grades of paper:
Expanded Polystyrene;
Plastic Film Bags;
Other Rigid Plastic, which encompasses food and deli trays that may be heavily contaminated; and
Other Aluminum, which often includes foil and tins that are heavily food-encrusted.
It was beyond the scope of this project to develop contamination correction factors for these material categories. However, readers should recognize that the annual quantities that are calculated in this section of the report overstate the actual quantity of these materials that are being disposed. Further, the annual quantities of food wastes and possibly certain other organic wastes (e.g., Yard Waste) would likely be greater than that shown, as much of the moisture that contaminates the paper likely originated from these organics. Had there been no cross-contamination of moisture and particulates, the disposed quantity of the more absorbent material categories would be at least marginally lower, and the disposed content of moisture-containing categories would have been marginally higher, than what is shown in this section.
4-2 Larimer County Waste Composition Study

4. RESULTS
AGGREGATION OF DATA BY GENERATOR SECTOR
As discussed in the previous section, a week-long gate survey was performed to develop a defensible breakdown of the incoming quantity of wastes from each of the four main generator sectors targeted in the study. Table 4-1 summarizes the annual wastes disposed by generator sector based on the results of the gate survey.
Table 4-1 Waste Disposal by Generator Sector
Sector 2006 Tons Disposed Percent of Total
Residential 63,624 41.4%
Commercial 55,211 36.0%
Self-Haul 10,211 6.6%
C&D Debris 24,516 16.0%
Total 153,562 100.0%
Note: The gate survey also identified “Other” waste categories such as rip/fill, tree limbs, etc. For the purpose of developing weighting factors for the Residential, Commercial, Self-haul and C&D generator sectors, the Other category has been excluded and the remaining percentages re-calculated based on the sum of these four generator sectors. See Table 3-8 for details.
The percentages in the far right column of Table 4-1 are used as weighting factors to develop an aggregate composition of all waste delivered to the Larimer County Landfill.
Larimer County Waste Composition Study 4-3

4. RESULTS
RESULTS
AGGREGATE COMPOSITION, ALL WASTE DELIVERIES
Figure 4-1 presents a graphical breakdown of the major material categories entering the Larimer County Landfill from the Residential, Commercial, Self-Haul, and C&D sectors. Note that these material groups have been defined to be directly comparable to the 1998 Study (discussed later in this section). As shown in the Figure, the Paper material group makes up over one quarter of the aggregate waste stream, while Food Waste is the single most prevalent material category. Although the “Other Waste” category is actually the largest material group shown in the Figure, this category comprises 14 different material categories and includes primarily materials generated from C&D activities, which accounts for the size of the group as a whole.
Figure 4-1 Aggregate Composition (Percent by Weight), All Wastes Delivered to Landfill [1]
PAPER 25.5%
PLASTIC/LEATHER/RUBBER
9.4%
GLASS &CERAMICS
3.2%
FERROUS METAL 3.1%
WOOD 9.8%
FOOD WASTE 13.2%
TEXTILES 1.4%
OTHER [2] 26.4%
YARD WASTE 6.6%
NONFERROUS METAL1.5%
[1] Excludes rip-rap, tree limbs, and other homogeneous categories that are tracked separately in the landfill accounting system.
[2] OTHER waste includes C&D materials such as drywall, block/brick/stone, insulation, and asphalt roofing, and miscellaneous organics and inorganics not elsewhere classified including diapers/sanitary products, electronics, bulky items, carpet, tires, fines, and household hazardous waste (HHW).
4-4 Larimer County Waste Composition Study

4. RESULTS
Figure 4-2 shows the ten most prevalent individual material categories being disposed at the Larimer County Landfill. It is of definite interest that Corrugated Cardboard, Newspaper, Yard Waste, and even Mixed Paper are on the top ten list. These materials are generally easy to separate, and many municipalities offer separate collections for these materials. The appearance of these materials in the top ten may suggest opportunities for Larimer County to increase recycling and diversion somewhat significantly. Interestingly, all of the most prevalent disposed wastes are either compostable (Food Waste, Other Compostable Paper, Yard Waste) or recyclable (Carpet, Film Bags, Clean Wood). However, these wastes are at a minimum difficult or costly to separate, and at the current time there likely is no local market that can accept these materials. In the short term, therefore, many of these materials do not offer significant potential for diversion, although diversion of at least some of these materials may be a longer term opportunity.
Figure 4-2 Ten Most Prevalent Material Categories (Percent by Weight), Aggregate
0.0%2.0%4.0%6.0%8.0%
10.0%12.0%14.0%
Food W
aste
OCC/Kraft
Yard W
aste
-Gras
s/Lea
ves
Other C
ompo
stalbe
Pap
er
Clean W
ood
Newpa
per
Mixed R
ecyc
lable
Paper
Block/B
rick/S
tone
Films/B
ags
Carpet
Larimer County Waste Composition Study 4-5
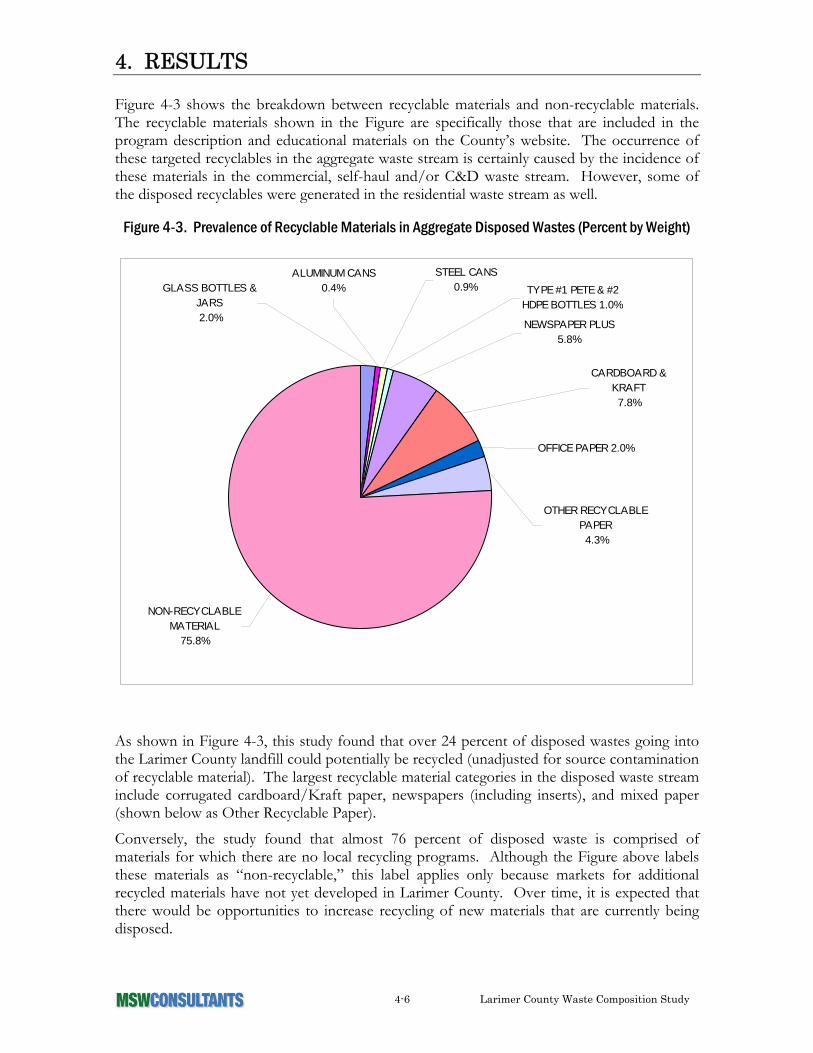
4. RESULTS
Figure 4-3 shows the breakdown between recyclable materials and non-recyclable materials. The recyclable materials shown in the Figure are specifically those that are included in the program description and educational materials on the County’s website. The occurrence of these targeted recyclables in the aggregate waste stream is certainly caused by the incidence of these materials in the commercial, self-haul and/or C&D waste stream. However, some of the disposed recyclables were generated in the residential waste stream as well.
Figure 4-3. Prevalence of Recyclable Materials in Aggregate Disposed Wastes (Percent by Weight)
ALUMINUM CANS 0.4%
NEWSPAPER PLUS 5.8%
CARDBOARD & KRAFT 7.8%
OFFICE PAPER 2.0%
OTHER RECYCLABLE PAPER 4.3%
STEEL CANS0.9%GLASS BOTTLES &
JARS 2.0%
TYPE #1 PETE & #2 HDPE BOTTLES 1.0%
NON-RECYCLABLE MATERIAL
75.8%
As shown in Figure 4-3, this study found that over 24 percent of disposed wastes going into the Larimer County landfill could potentially be recycled (unadjusted for source contamination of recyclable material). The largest recyclable material categories in the disposed waste stream include corrugated cardboard/Kraft paper, newspapers (including inserts), and mixed paper (shown below as Other Recyclable Paper).
Conversely, the study found that almost 76 percent of disposed waste is comprised of materials for which there are no local recycling programs. Although the Figure above labels these materials as “non-recyclable,” this label applies only because markets for additional recycled materials have not yet developed in Larimer County. Over time, it is expected that there would be opportunities to increase recycling of new materials that are currently being disposed.
4-6 Larimer County Waste Composition Study

4. RESULTS
Aggregate waste composition data for the County in detailed tabular format, including statistical measures of standard deviation and 90 percent confidence intervals, is contained in Exhibit 2.
COMPARISON OF COMPOSITION BY GENERATOR CLASS
Table 4-2 compares the mean composition of wastes by generator class for the major material groups. There are several items of interest to be seen in this table:
Residential and Commercial wastes are reasonably similar;
Residential and Commercial wastes contain a diverse mix of materials encompassing all of the major material groups;
Self haul and C&D wastes are much more limited in the materials disposed, and their composition differs significantly from Residential and Commercial waste;
Self-haul wastes contain a significant fraction of Wood and Other waste, the latter of which is largely made up of C&D material categories;
C&D Debris contains significant amounts of green and woody wastes associated with land clearing, as well as Other waste (i.e., the C&D material categories).
Table 4-2 Comparison of Waste Composition By Generator Class
Material Group Residential Commercial Self-Haul C&D
Paper 31.4% 31.6% 13.9% 1.0%
Plastic/Rubber/Leather 10.6% 11.2% 4.5% 0.4%
Glass 4.8% 2.7% 2.8% 3.9%
Ferrous Metal 3.0% 3.5% 2.9% 2.5%
Non-ferrous Metal 1.7% 2.0% 0.4% 0.6%
Yard/Land Clearing 8.4% 6.3% 9.5% 27.2%
Wood 3.0% 8.9% 15.0% 1.6%
Food Waste 17.4% 15.9% 0.3% 0.1%
Textiles 2.4% 1.0% 0.3% 0.0%
Other [1] 17.3% 16.9% 48.7% 62.8%
TOTAL 100.0% 100.0% 100.0% 100.0%
[1] OTHER waste includes C&D materials such as drywall, block/brick/stone, insulation, and asphalt roofing, and miscellaneous organics and inorganics not elsewhere classified including diapers/sanitary products, electronics, bulky items, carpet, tires, fines, and household hazardous waste (HHW).
Detailed results for the Residential, Commercial, Self-haul and C&D generator classes are shown in Exhibits 3, 4, 5, and 6.
Larimer County Waste Composition Study 4-7
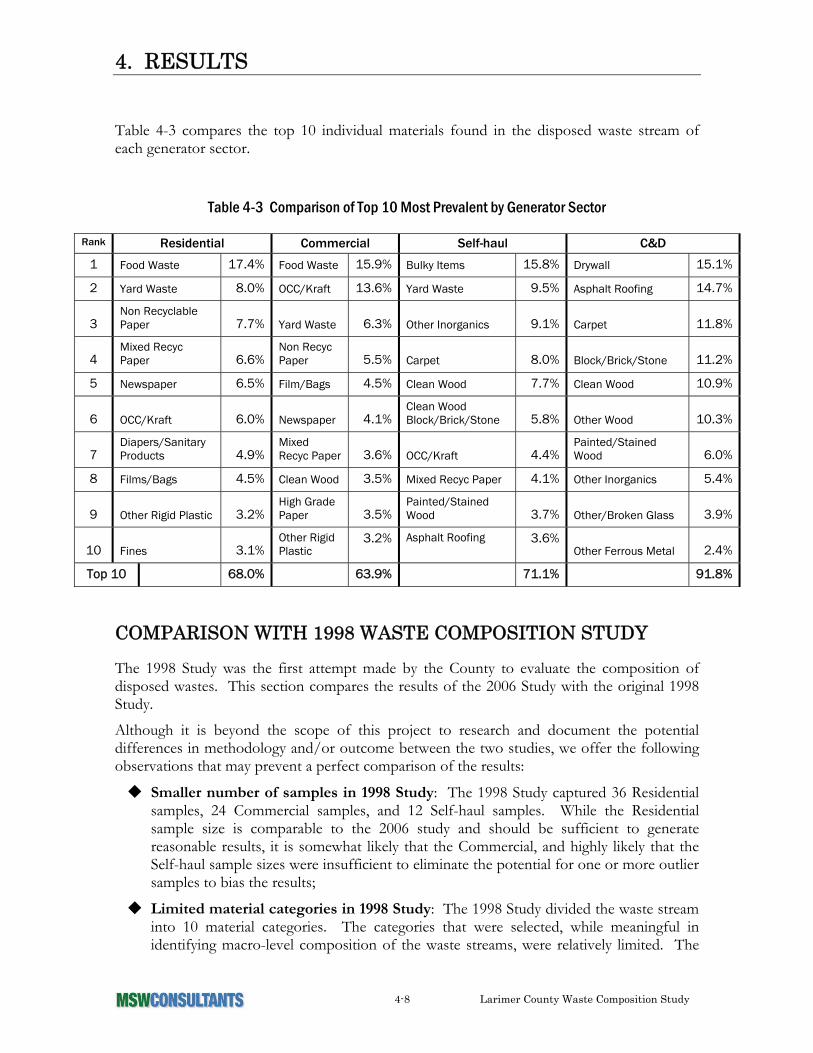
4. RESULTS
Table 4-3 compares the top 10 individual materials found in the disposed waste stream of each generator sector.
Table 4-3 Comparison of Top 10 Most Prevalent by Generator Sector
Rank Residential Commercial Self-haul C&D
1 Food Waste 17.4% Food Waste 15.9% Bulky Items 15.8% Drywall 15.1%
2 Yard Waste 8.0% OCC/Kraft 13.6% Yard Waste 9.5% Asphalt Roofing 14.7%
3 Non Recyclable Paper 7.7% Yard Waste 6.3% Other Inorganics 9.1% Carpet 11.8%
4 Mixed Recyc Paper 6.6%
Non Recyc Paper 5.5% Carpet 8.0% Block/Brick/Stone 11.2%
5 Newspaper 6.5% Film/Bags 4.5% Clean Wood 7.7% Clean Wood 10.9%
6 OCC/Kraft 6.0% Newspaper 4.1% Clean Wood Block/Brick/Stone 5.8% Other Wood 10.3%
7 Diapers/Sanitary Products 4.9%
Mixed Recyc Paper 3.6% OCC/Kraft 4.4%
Painted/Stained Wood 6.0%
8 Films/Bags 4.5% Clean Wood 3.5% Mixed Recyc Paper 4.1% Other Inorganics 5.4%
9 Other Rigid Plastic 3.2% High Grade Paper 3.5%
Painted/Stained Wood 3.7% Other/Broken Glass 3.9%
10 Fines 3.1% Other Rigid Plastic
3.2% Asphalt Roofing 3.6% Other Ferrous Metal 2.4%
Top 10 68.0% 63.9% 71.1% 91.8%
COMPARISON WITH 1998 WASTE COMPOSITION STUDY
The 1998 Study was the first attempt made by the County to evaluate the composition of disposed wastes. This section compares the results of the 2006 Study with the original 1998 Study.
Although it is beyond the scope of this project to research and document the potential differences in methodology and/or outcome between the two studies, we offer the following observations that may prevent a perfect comparison of the results:
Smaller number of samples in 1998 Study: The 1998 Study captured 36 Residential samples, 24 Commercial samples, and 12 Self-haul samples. While the Residential sample size is comparable to the 2006 study and should be sufficient to generate reasonable results, it is somewhat likely that the Commercial, and highly likely that the Self-haul sample sizes were insufficient to eliminate the potential for one or more outlier samples to bias the results;
Limited material categories in 1998 Study: The 1998 Study divided the waste stream into 10 material categories. The categories that were selected, while meaningful in identifying macro-level composition of the waste streams, were relatively limited. The
4-8 Larimer County Waste Composition Study
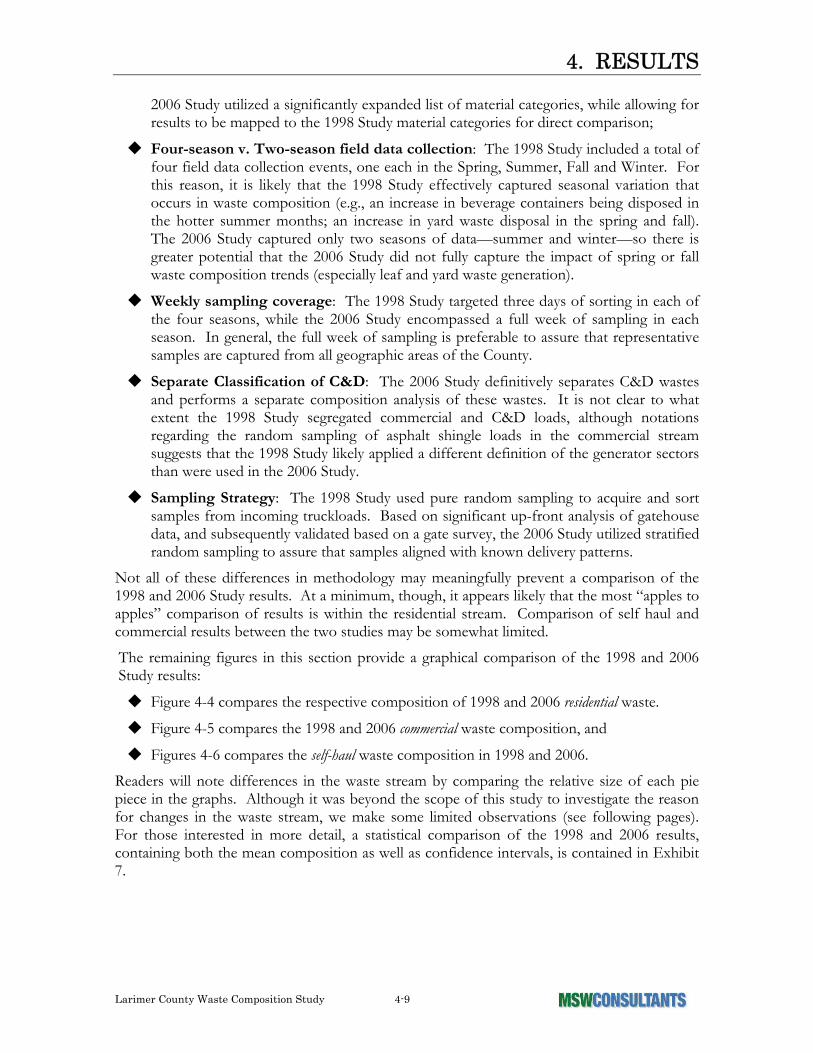
4. RESULTS
2006 Study utilized a significantly expanded list of material categories, while allowing for results to be mapped to the 1998 Study material categories for direct comparison;
Four-season v. Two-season field data collection: The 1998 Study included a total of four field data collection events, one each in the Spring, Summer, Fall and Winter. For this reason, it is likely that the 1998 Study effectively captured seasonal variation that occurs in waste composition (e.g., an increase in beverage containers being disposed in the hotter summer months; an increase in yard waste disposal in the spring and fall). The 2006 Study captured only two seasons of data—summer and winter—so there is greater potential that the 2006 Study did not fully capture the impact of spring or fall waste composition trends (especially leaf and yard waste generation).
Weekly sampling coverage: The 1998 Study targeted three days of sorting in each of the four seasons, while the 2006 Study encompassed a full week of sampling in each season. In general, the full week of sampling is preferable to assure that representative samples are captured from all geographic areas of the County.
Separate Classification of C&D: The 2006 Study definitively separates C&D wastes and performs a separate composition analysis of these wastes. It is not clear to what extent the 1998 Study segregated commercial and C&D loads, although notations regarding the random sampling of asphalt shingle loads in the commercial stream suggests that the 1998 Study likely applied a different definition of the generator sectors than were used in the 2006 Study.
Sampling Strategy: The 1998 Study used pure random sampling to acquire and sort samples from incoming truckloads. Based on significant up-front analysis of gatehouse data, and subsequently validated based on a gate survey, the 2006 Study utilized stratified random sampling to assure that samples aligned with known delivery patterns.
Not all of these differences in methodology may meaningfully prevent a comparison of the 1998 and 2006 Study results. At a minimum, though, it appears likely that the most “apples to apples” comparison of results is within the residential stream. Comparison of self haul and commercial results between the two studies may be somewhat limited.
The remaining figures in this section provide a graphical comparison of the 1998 and 2006 Study results:
Figure 4-4 compares the respective composition of 1998 and 2006 residential waste.
Figure 4-5 compares the 1998 and 2006 commercial waste composition, and
Figures 4-6 compares the self-haul waste composition in 1998 and 2006.
Readers will note differences in the waste stream by comparing the relative size of each pie piece in the graphs. Although it was beyond the scope of this study to investigate the reason for changes in the waste stream, we make some limited observations (see following pages). For those interested in more detail, a statistical comparison of the 1998 and 2006 results, containing both the mean composition as well as confidence intervals, is contained in Exhibit 7.
Larimer County Waste Composition Study 4-9

4. RESULTS
Figure 4-4 Comparison of 1998 (top) and 2006 (bottom) Residential Waste Composition
NON-FERROUS METALS 1.0%
FERROUS METALS 3.6%
OTHER 3.1%[1]
PlLASTIC, LEATHER, & RUBBER
12.2%
WOOD PRODUCTS
3.9%
TEXTILES 2.6%
YARD WASTE 13.6%
FOOD WASTE 14.2%
PAPER PRODUCTS 43.9%
GLASS & CERAMICS
1.9%
FOOD WASTE 17.4%
TEXTILES, 3.3%
YARD WASTE 8.4%
WOOD PRODUCTS, 3.0%
PLASTIC, LEATHER & Rubber, 11.9%
OTHER 16.4%[1]
GLASS & CERAMICS
3.5%
NON-FERROUS METALS
1.7%
FERROUS METALS
3.0%
PAPER PRODUCTS 31.4%
[1] OTHER waste includes C&D materials such as drywall, block/brick/stone, insulation, and
asphalt roofing, and miscellaneous organics and inorganics not elsewhere classified including diapers/sanitary products, electronics, bulky items, carpet, tires, fines, and household hazardous waste (HHW).
These results suggest that there have been significant changes in the residential disposed waste stream. First, the fraction of paper has evidently decreased significantly. To some degree this is not surprising, as recovered paper markets were extremely poor through much of the 1990s, and have been much better in recent years. Differences in other categories are harder to explain.
4-10 Larimer County Waste Composition Study
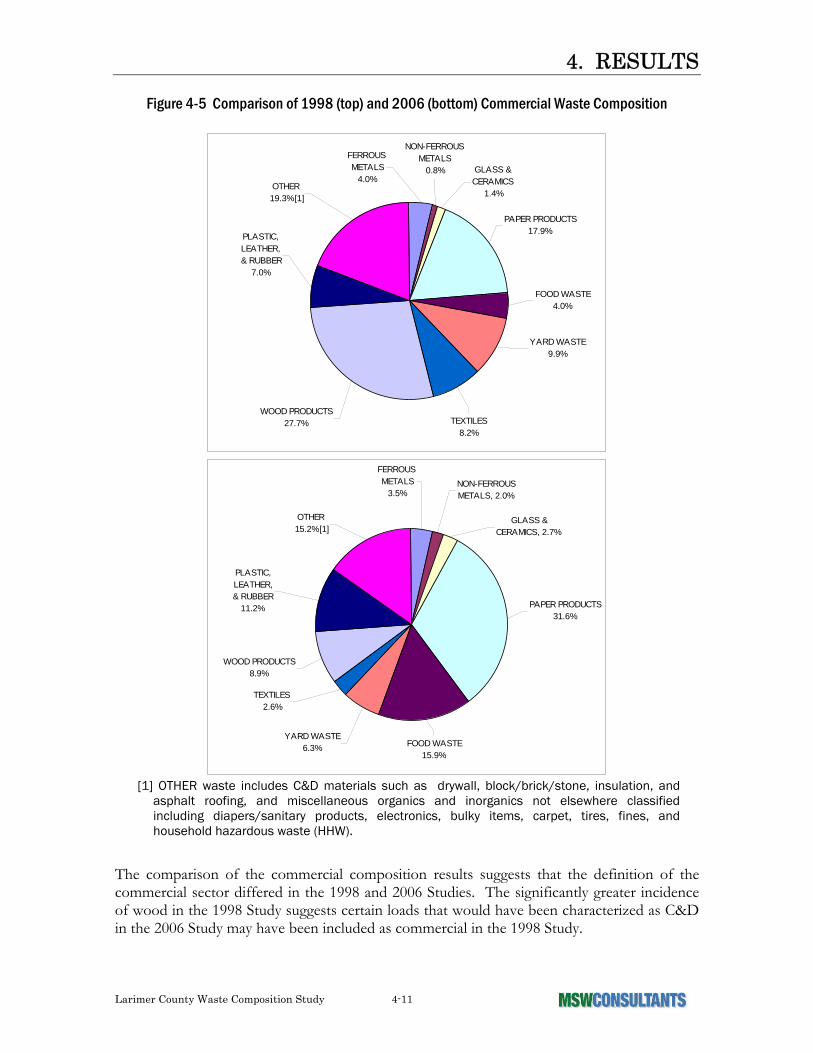
4. RESULTS
Figure 4-5 Comparison of 1998 (top) and 2006 (bottom) Commercial Waste Composition
OTHER 19.3%[1]
PLASTIC, LEATHER, & RUBBER
7.0%
WOOD PRODUCTS 27.7% TEXTILES
8.2%
YARD WASTE 9.9%
FOOD WASTE 4.0%
PAPER PRODUCTS 17.9%
GLASS & CERAMICS
1.4%
NON-FERROUS METALS 0.8%
FERROUS METALS
4.0%
PAPER PRODUCTS 31.6%
FOOD WASTE 15.9%
YARD WASTE 6.3%
TEXTILES 2.6%
WOOD PRODUCTS 8.9%
PLASTIC, LEATHER, & RUBBER
11.2%
OTHER 15.2%[1]
NON-FERROUS METALS, 2.0%
GLASS & CERAMICS, 2.7%
FERROUS METALS
3.5%
[1] OTHER waste includes C&D materials such as drywall, block/brick/stone, insulation, and
asphalt roofing, and miscellaneous organics and inorganics not elsewhere classified including diapers/sanitary products, electronics, bulky items, carpet, tires, fines, and household hazardous waste (HHW).
The comparison of the commercial composition results suggests that the definition of the commercial sector differed in the 1998 and 2006 Studies. The significantly greater incidence of wood in the 1998 Study suggests certain loads that would have been characterized as C&D in the 2006 Study may have been included as commercial in the 1998 Study.
Larimer County Waste Composition Study 4-11

4. RESULTS
Figure 4-6 Comparison of 1998 (top) and 2006 (bottom) Self Haul Waste Composition
FOOD WASTE, 4.0%
PLASTIC, LEATHER, & RUBBER
8.3%
WOOD PRODUCTS 27.4%
TEXTILES 3.2%YARD WASTE
10.6%
PAPER PRODUCTS 13.3%
GLASS & CERAMICS
4.4%
NON-FERROUS METALS 3.3%
FERROUSMETALS 13.9%
OTHER 11.6%[1]
NON-FERROUS
METALS 0.4%
FERROUS METALS
2.9%
GLASS& CERAMICS
2.8%
PAPER PRODUCTS 13.9%
FOOD WASTE 2.1%
YARD WASTE 9.5%
TEXTILES 8.4%
WOOD PRODUCTS 15.0%
PLASTIC, LEATHER, & RUBBER
4.5%
OTHER 40.7%[1]
[1] OTHER waste includes C&D materials such as drywall, block/brick/stone, insulation, and
asphalt roofing, and miscellaneous organics and inorganics not elsewhere classified including diapers/sanitary products, electronics, bulky items, carpet, tires, fines, and household hazardous waste (HHW).
Once again, a comparison of the 1998 and 2006 Study results for self haul waste suggest that a different definition of the self haul generator sector may have been applied. However, it must also be noted that the very small sample size of self haul samples in the 1998 Study resulted in extremely wide confidence intervals, making comparison difficult (see Exhibit 7).
4-12 Larimer County Waste Composition Study

Exhibit 1: Summary of Physical Sample Loads
Summer Season SortSample Number Date
Sample Type
Time of Delivery Hauler
Vehicle Type
Generator Type Origin of Waste
1 9/11/06 Physical 8:00 GSI Front Load Commercial Fort Collins 2 9/11/06 Physical 8:50 WM Front Load Commercial Fort Collins 3 9/11/06 Physical 8:55 GSI Rear Load Commercial Fort Collins 4 9/11/06 Physical 9:50 S&S Rear Load Commercial Loveland5 9/11/06 Physical 10:10 GSI Rear Load Commercial Fort Collins 6 9/11/06 Physical 10:10 Dick's Rear Load Commercial Fort Collins 7 9/11/06 Physical 10:30 Ram Rear Load Residential Fort Collins 8 9/11/06 Physical 11:10 Dick's Rear Load Residential Fort Collins 9 9/11/06 Physical 12:18 Loveland Front Load Residential Loveland
10 9/11/06 Physical 13:00 GSI Rear Load Residential Fort Collins 11 9/11/06 Physical 15:15 GSI Front Load Residential Fort Collins 12 9/12/06 Physical 9:07 WM Front Load Commercial South Fort Collins13 9/12/06 Physical 9:07 GSI Rear Load Commercial Loveland14 9/12/06 Physical 9:35 GSI Front Load Commercial Fort Collins 15 9/12/06 Physical 10:07 CSU Front Load Commercial CSU16 9/12/06 Physical 10:55 Ram Rear Load Residential Fort Collins 17 9/12/06 Physical 11:00 GSI Rear Load Commercial Wellington18 9/12/06 Physical 11:30 GSI Rear Load Residential Fort Collins 19 9/12/06 Physical 12:30 Loveland Front Load Residential City of Loveland20 9/12/06 Physical 12:40 Ram Rear Load Commercial Fort Collins 21 9/12/06 Physical 13:15 Ram Rear Load Residential Fort Collins CSU North22 9/12/06 Physical 15:00 Loveland Front Load Residential Loveland23 9/13/06 Physical Loveland Rear Load Residential Loveland Apartment24 9/13/06 Physical 8:50 GSI Front Load Commercial Fort Collins25 9/13/06 Physical 9:55 GSI Rear Load Residential Fort Collins26 9/13/06 Physical 10:40 S&S Rear Load Commercial Loveland27 9/13/06 Physical 10:40 GSI Front Load Commercial Fort Collins28 9/13/06 Physical 11:10 Ram Rear Load Commercial Fort Collins29 9/13/06 Physical 11:20 GSI Front Load Residential Fort Collins30 9/13/06 Physical 11:30 Mike's RO Commercial Fort Collins31 9/13/06 Physical 12:30 Shroder RoTrailer Commercial Fort Collins32 9/13/06 Physical 12:40 GSI Rear Load Residential Fort Collins33 9/13/06 Physical 13:30 RAM Rear Load Residential Fort Collins34 9/13/06 Physical 13:50 GSI Rear Load Residential Fort Collins35 9/13/06 Physical 14:30 RO Commercial Fort Collins
Larimer County Waste Composition Study 1 of 2 MSW Consultants

Exhibit 1: Summary of Physical Sample Loads
Winter Season SortSample Number Date
Sample Type
Time of Delivery Hauler
Vehicle Type
Generator Type Origin of Waste
1 12/5/06 Physical 8:25 CSU Front Load Commercial CSU2 12/5/06 Physical 9:45 Gullage Rear Load Commercial Fort Collins3 12/5/06 Physical 11:00 GSI Rear Load Commercial Fort Collins4 12/5/06 Physical 11:30 WM Front Load Commercial Fort Collins5 12/5/06 Physical 12:00 GSI SL Residential Fort Collins6 12/5/06 Physical 13:00 Loveland Front Load Residential Fort Collins South7 12/5/06 Physical 13:15 RAM Rear Load Residential Fort Collins8 12/5/06 Physical 14:20 GSI Rear Load Residential Fort Collins9 12/6/06 Physical 9:20 GSI Front Load Commercial Fort Collins
10 12/6/06 Physical 9:40 GSI Rear Load Commercial11 12/6/06 Physical 10:45 RAM SL Residential Fort Collins12 12/6/06 Physical 10:50 GSI SL Residential Fort Collins13 12/6/06 Physical 11:30 Dick's Rear Load Commercial Fort Collins14 12/6/06 Physical 11:30 Dick's Rear Load Residential Fort Collins15 12/6/06 Physical 15:30 RAM Rear Load Residential Fort Collins16 12/7/06 Physical 9:00 WM Front Load Commercial Fort Collins17 12/7/06 Physical 9:10 WM Front Load Commercial Fort Collins18 12/7/06 Physical 9:45 United Front Load Residential BertLoud19 12/7/06 Physical 10:00 RAM Rear Load Commercial Fort Collins20 12/7/06 Physical 10:15 GSI Rear Load Commercial Fort Collins/Loveland21 12/7/06 Physical 10:30 WM Front Load Commercial Loveland22 12/7/06 Physical 11:30 GSI Rear Load Commercial Loveland-South23 12/7/06 Physical 11:40 GSI Front Load Commercial All Over24 12/7/06 Physical 12:15 WM Front Load Commercial Loveland25 12/7/06 Physical 12:30 Loveland Rear Load Residential Loveland26 12/7/06 Physical 13:50 Loveland Front Load Residential Loveland27 12/7/06 Physical 14:30 Loveland Front Load Residential Loveland28 12/7/06 Physical 15:50 GSI Rear Load Residential Fort Collins29 12/7/06 Physical 15:15 Loveland Front Load Residential Loveland30 12/8/06 Physical 9:00 GSI Front Load Commercial Fort Collins31 12/8/06 Physical 9:20 GSI Front Load Commercial South Fort Collins32 12/8/06 Physical 10:00 WM Front Load Commercial Loveland33 12/8/06 Physical 10:20 Dick's Rear Load Residential Outside Ft. Collins34 12/8/06 Physical 10:35 Dick's Front Load Commercial Fort Collins35 12/8/06 Physical 11:40 S&S Front Load Commercial BertLoud
Larimer County Waste Composition Study 2 of 2 MSW Consultants
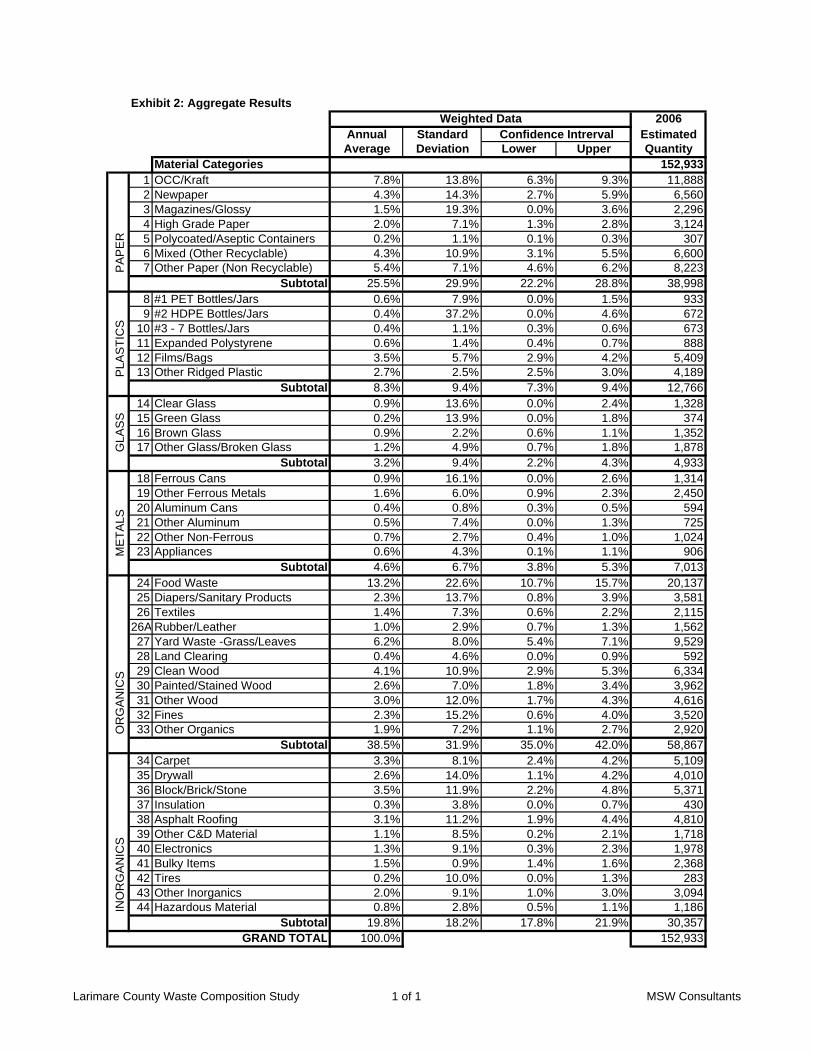
Exhibit 2: Aggregate ResultsWeighted Data 2006
Annual Standard Confidence Intrerval EstimatedAverage Deviation Lower Upper Quantity
Material Categories 152,9331 OCC/Kraft 7.8% 13.8% 6.3% 9.3% 11,8882 Newpaper 4.3% 14.3% 2.7% 5.9% 6,5603 Magazines/Glossy 1.5% 19.3% 0.0% 3.6% 2,2964 High Grade Paper 2.0% 7.1% 1.3% 2.8% 3,1245 Polycoated/Aseptic Containers 0.2% 1.1% 0.1% 0.3% 3076 Mixed (Other Recyclable) 4.3% 10.9% 3.1% 5.5% 6,6007 Other Paper (Non Recyclable) 5.4% 7.1% 4.6% 6.2% 8,223
Subtotal 25.5% 29.9% 22.2% 28.8% 38,9988 #1 PET Bottles/Jars 0.6% 7.9% 0.0% 1.5% 9339 #2 HDPE Bottles/Jars 0.4% 37.2% 0.0% 4.6% 672
10 #3 - 7 Bottles/Jars 0.4% 1.1% 0.3% 0.6% 67311 Expanded Polystyrene 0.6% 1.4% 0.4% 0.7% 88812 Films/Bags 3.5% 5.7% 2.9% 4.2% 5,40913 Other Ridged Plastic 2.7% 2.5% 2.5% 3.0% 4,189
Subtotal 8.3% 9.4% 7.3% 9.4% 12,76614 Clear Glass 0.9% 13.6% 0.0% 2.4% 1,32815 Green Glass 0.2% 13.9% 0.0% 1.8% 37416 Brown Glass 0.9% 2.2% 0.6% 1.1% 1,35217 Other Glass/Broken Glass 1.2% 4.9% 0.7% 1.8% 1,878
Subtotal 3.2% 9.4% 2.2% 4.3% 4,93318 Ferrous Cans 0.9% 16.1% 0.0% 2.6% 1,31419 Other Ferrous Metals 1.6% 6.0% 0.9% 2.3% 2,45020 Aluminum Cans 0.4% 0.8% 0.3% 0.5% 59421 Other Aluminum 0.5% 7.4% 0.0% 1.3% 72522 Other Non-Ferrous 0.7% 2.7% 0.4% 1.0% 1,02423 Appliances 0.6% 4.3% 0.1% 1.1% 906
Subtotal 4.6% 6.7% 3.8% 5.3% 7,01324 Food Waste 13.2% 22.6% 10.7% 15.7% 20,13725 Diapers/Sanitary Products 2.3% 13.7% 0.8% 3.9% 3,58126 Textiles 1.4% 7.3% 0.6% 2.2% 2,115
26A Rubber/Leather 1.0% 2.9% 0.7% 1.3% 1,56227 Yard Waste -Grass/Leaves 6.2% 8.0% 5.4% 7.1% 9,52928 Land Clearing 0.4% 4.6% 0.0% 0.9% 59229 Clean Wood 4.1% 10.9% 2.9% 5.3% 6,33430 Painted/Stained Wood 2.6% 7.0% 1.8% 3.4% 3,96231 Other Wood 3.0% 12.0% 1.7% 4.3% 4,61632 Fines 2.3% 15.2% 0.6% 4.0% 3,52033 Other Organics 1.9% 7.2% 1.1% 2.7% 2,920
Subtotal 38.5% 31.9% 35.0% 42.0% 58,86734 Carpet 3.3% 8.1% 2.4% 4.2% 5,10935 Drywall 2.6% 14.0% 1.1% 4.2% 4,01036 Block/Brick/Stone 3.5% 11.9% 2.2% 4.8% 5,37137 Insulation 0.3% 3.8% 0.0% 0.7% 43038 Asphalt Roofing 3.1% 11.2% 1.9% 4.4% 4,81039 Other C&D Material 1.1% 8.5% 0.2% 2.1% 1,71840 Electronics 1.3% 9.1% 0.3% 2.3% 1,97841 Bulky Items 1.5% 0.9% 1.4% 1.6% 2,36842 Tires 0.2% 10.0% 0.0% 1.3% 28343 Other Inorganics 2.0% 9.1% 1.0% 3.0% 3,09444 Hazardous Material 0.8% 2.8% 0.5% 1.1% 1,186
Subtotal 19.8% 18.2% 17.8% 21.9% 30,357GRAND TOTAL 100.0% 152,933
OR
GA
NIC
SIN
OR
GA
NIC
SP
AP
ER
PLA
STI
CS
GLA
SS
ME
TALS
Larimare County Waste Composition Study 1 of 1 MSW Consultants

Exhibit 3: Residential Results
90%Conf. Interval
MaterialsAverage Percent
Standard Deviation Lower Upper
Annual Tons
1 OCC/Kraft 6.0% 5.7% 4.4% 7.6% 3,8172 Newpaper 6.5% 6.5% 4.7% 8.4% 4,1643 Magazines/Glossy 2.8% 2.8% 2.0% 3.6% 1,7734 High Grade Paper 1.6% 2.0% 1.0% 2.2% 1,0075 Polycoated/Aseptic Containers 0.2% 0.4% 0.1% 0.4% 1486 Mixed (Other Recyclable) 6.6% 3.9% 5.4% 7.7% 4,1697 Other Paper (Non Recyclable) 7.7% 2.4% 7.0% 8.4% 4,926
Subtotal 31.4% 9.9% 28.6% 34.3% 20,0048 #1 PET Bottles/Jars 0.8% 0.4% 0.7% 1.0% 5409 #2 HDPE Bottles/Jars 0.7% 0.6% 0.5% 0.9% 424
10 #3 - 7 Bottles/Jars 0.8% 0.9% 0.5% 1.0% 49911 Expanded Polystyrene 0.6% 0.4% 0.4% 0.7% 35212 Films/Bags 4.5% 1.6% 4.0% 5.0% 2,86113 Other Ridged Plastic 3.2% 1.6% 2.8% 3.7% 2,053
Subtotal 10.6% 2.9% 9.7% 11.4% 6,72914 Clear Glass 1.4% 1.0% 1.2% 1.7% 92115 Green Glass 0.3% 0.4% 0.2% 0.5% 20616 Brown Glass 1.4% 1.7% 0.9% 1.8% 86117 Other Glass/Broken Glass 0.4% 0.5% 0.2% 0.5% 228
Subtotal 3.5% 2.6% 2.7% 4.2% 2,21718 Ferrous Cans 1.4% 0.8% 1.1% 1.6% 87519 Other Ferrous Metals 0.9% 1.4% 0.5% 1.3% 56420 Aluminum Cans 0.7% 0.5% 0.5% 0.8% 42921 Other Aluminum 0.5% 0.8% 0.3% 0.7% 31122 Other Non-Ferrous 0.5% 1.0% 0.2% 0.8% 32723 Appliances 0.7% 3.1% 0.0% 1.6% 438
Subtotal 4.6% 3.2% 3.7% 5.5% 2,94424 Food Waste 17.4% 9.1% 14.8% 20.1% 11,09725 Diapers/Sanitary Products 4.9% 4.0% 3.8% 6.1% 3,12526 Textiles/Rubber/Leather 2.4% 2.0% 1.8% 3.0% 1,521
26A Rubber/Leather 1.4% 1.8% 0.8% 1.9% 86227 Yard Waste -Grass/Leaves 8.0% 10.4% 5.0% 11.0% 5,08528 Yard Waste - Stumps/Logs 0.4% 1.3% 0.0% 0.8% 25329 Clean Wood 1.5% 4.6% 0.2% 2.9% 98230 Painted/Stained Wood 1.1% 3.4% 0.1% 2.1% 69031 Other Wood 0.4% 1.0% 0.1% 0.7% 24632 Fines 3.1% 1.5% 2.7% 3.6% 1,98933 Other Organics 2.7% 2.8% 1.9% 3.4% 1,687
Subtotal 43.3% 11.4% 40.0% 46.5% 27,53634 Carpet 0.9% 2.2% 0.3% 1.5% 56335 Drywall 0.2% 0.8% 0.0% 0.4% 12136 Block/Brick/Stone 0.7% 2.0% 0.2% 1.3% 47037 Insulation 0.0% 0.1% 0.0% 0.0% 838 Asphalt Roofing 0.0% 0.1% 0.0% 0.1% 2239 Other C&D Material 0.8% 1.6% 0.3% 1.2% 49940 Electronics 2.2% 5.4% 0.6% 3.7% 1,36841 Furniture 0.4% 2.3% 0.0% 1.0% 25742 Tires 0.0% 0.0% 0.0% 0.0% 043 Other Inorganic 0.6% 1.5% 0.2% 1.1% 40544 Other Hazardous Material 0.8% 1.0% 0.5% 1.0% 481
Subtotal 6.6% 7.1% 4.6% 8.6% 4,194TOTAL 100.0% 63,624
OR
AN
ICS
INO
RG
AN
ICS
PAPE
RP
LAS
TIC
GLA
SS
ME
TALS
Larimer County Waste Composition Study 1 of 1 MSW Consultants, LLC

Exhibit 4: Commercial Results
90%Conf. Interval
MaterialsAverage Percent
Standard Deviation Lower Upper
Annual Tons
1 OCC/Kraft 13.6% 11.9% 10.4% 16.9% 7,5332 Newpaper 4.1% 10.7% 1.2% 7.0% 2,2783 Magazines/Glossy 0.9% 1.1% 0.6% 1.2% 4934 High Grade Paper 3.5% 10.9% 0.5% 6.4% 1,9255 Polycoated/Aseptic Containers 0.3% 0.6% 0.1% 0.4% 1566 Mixed (Other Recyclable) 3.6% 2.7% 2.9% 4.4% 1,9937 Other Paper (Non Recyclable) 5.5% 4.4% 4.3% 6.7% 3,049
Subtotal 31.6% 18.0% 26.7% 36.4% 17,4288 #1 PET Bottles/Jars 0.7% 0.6% 0.5% 0.9% 3849 #2 HDPE Bottles/Jars 0.4% 0.5% 0.3% 0.6% 240
10 #3 - 7 Bottles/Jars 0.3% 0.4% 0.2% 0.4% 16611 Expanded Polystyrene 0.9% 1.3% 0.5% 1.2% 47412 Films/Bags 4.5% 3.6% 3.5% 5.5% 2,48213 Other Ridged Plastic 3.2% 2.7% 2.5% 4.0% 1,774
Subtotal 10.0% 6.3% 8.3% 11.7% 5,52014 Clear Glass 0.7% 0.8% 0.5% 0.9% 39115 Green Glass 0.3% 1.2% 0.0% 0.6% 16416 Brown Glass 0.8% 1.6% 0.4% 1.3% 46417 Other Glass/Broken Glass 0.9% 3.2% 0.0% 1.7% 473
Subtotal 2.7% 4.1% 1.6% 3.8% 1,49318 Ferrous Cans 0.8% 0.9% 0.5% 1.0% 42419 Other Ferrous Metals 1.9% 2.9% 1.1% 2.7% 1,04320 Aluminum Cans 0.3% 0.3% 0.2% 0.4% 15721 Other Aluminum 0.6% 1.3% 0.2% 0.9% 32522 Other Non-Ferrous 1.1% 3.2% 0.3% 2.0% 61923 Appliances 0.8% 3.8% 0.0% 1.8% 454
Subtotal 5.5% 5.5% 4.0% 7.0% 3,02224 Food Waste 15.9% 14.6% 12.0% 19.9% 8,80125 Diapers/Sanitary Products 0.7% 2.1% 0.2% 1.3% 40526 Textiles 1.0% 2.1% 0.4% 1.6% 541
26A Rubber/Leather 1.2% 2.1% 0.6% 1.8% 67527 Yard Waste -Grass/Leaves 6.3% 12.1% 3.1% 9.6% 3,49028 Yard Waste - Stumps/Logs 0.0% 0.0% 0.0% 0.0% 029 Clean Wood 3.5% 8.7% 1.2% 5.9% 1,93930 Painted/Stained Wood 2.6% 6.4% 0.9% 4.3% 1,43931 Other Wood 2.8% 6.4% 1.1% 4.6% 1,55632 Fines 2.7% 3.6% 1.7% 3.7% 1,49533 Other Organics 1.6% 4.7% 0.3% 2.9% 873
Subtotal 38.4% 18.3% 33.5% 43.4% 21,21534 Carpet 1.6% 5.8% 0.1% 3.2% 89935 Drywall 0.1% 0.6% 0.0% 0.3% 7836 Block/Brick/Stone 2.9% 8.2% 0.7% 5.1% 1,60937 Insulation 0.0% 0.0% 0.0% 0.0% 138 Asphalt Roofing 1.5% 8.7% 0.0% 3.9% 83339 Other C&D Material 1.7% 4.3% 0.5% 2.8% 91940 Electronics 0.6% 1.8% 0.2% 1.1% 35541 Furniture 0.7% 4.5% 0.0% 2.0% 40142 Tires 0.5% 2.2% 0.0% 1.1% 26843 Other Inorganic 0.9% 4.1% 0.0% 2.0% 48444 Other Hazardous Material 1.2% 2.6% 0.5% 2.0% 686
Subtotal 11.8% 14.8% 7.8% 15.8% 6,533Total 100.0% 55,211
OR
AN
ICS
INO
RG
AN
ICS
PAPE
RP
LAS
TIC
GLA
SS
ME
TALS
Larimer County Waste Composition Study 1 of 1 MSW Consultants, LLC

Exhibit 5: Self-Haul Results
AdjustedAdjusted Adjusted 90%Conf. Interval
MaterialsAverage Percent
Standard Deviation Lower Upper
Annual Tons 2006
1 OCC/Kraft 4.4% 16.2% 1.4% 7.5% 4252 Newspaper 1.2% 8.2% 0.0% 2.7% 1113 Magazines/Glossy 0.3% 0.7% 0.2% 0.4% 284 High Grade Paper 1.9% 4.5% 0.0% 4.4% 1865 Polycoated/Aseptic Containers 0.0% 0.1% 0.0% 0.0% 26 Mixed (Other Recyclable) 4.1% 14.8% 1.3% 6.9% 3927 Other Paper (Non Recyclable) 1.9% 9.6% 0.1% 3.7% 182
Subtotal 13.8% 33.0% 7.6% 20.1% 1,3268 #1 PET Bottles/Jars 0.1% 0.2% 0.0% 0.2% 99 #2 HDPE Bottles/Jars 0.1% 0.2% 0.0% 0.1% 7
10 #3 - 7 Bottles/Jars 0.1% 0.2% 0.0% 0.1% 811 Expanded Polystyrene 0.3% 1.4% 0.0% 0.6% 2812 Films/Bags 0.5% 2.9% 0.0% 1.1% 4913 Other Ridged Plastic 3.3% 11.0% 1.3% 5.4% 319
Subtotal 4.4% 13.4% 1.8% 6.9% 41914 Clear Glass 0.2% 0.4% 0.1% 0.2% 1515 Green Glass 0.0% 0.1% 0.0% 0.0% 316 Brown Glass 0.3% 2.4% 0.0% 0.7% 2617 Other Glass/Broken Glass 2.4% 12.2% 0.1% 4.7% 232
Subtotal 2.9% 13.8% 0.3% 5.5% 27618 Ferrous Cans 0.1% 0.3% 0.1% 0.2% 1419 Other Ferrous Metals 2.6% 8.8% 0.9% 4.2% 24720 Aluminum Cans 0.1% 0.6% 0.0% 0.2% 721 Other Aluminum 0.2% 0.4% 0.0% 0.3% 1722 Other Non-Ferrous 0.2% 0.4% 0.0% 0.4% 1623 Appliances 0.1% 0.2% 0.0% 0.2% 8
Subtotal 3.2% 10.6% 1.2% 5.2% 30724 Food Waste 2.2% 19.3% 0.0% 5.9% 21225 Diapers/Sanitary Products 0.5% 1.2% 0.3% 0.7% 4926 Textiles 0.5% 2.2% 0.1% 0.9% 45
26A Rubber/Leather 0.2% 0.5% 0.0% 0.5% 2127 Yard Waste -Grass/Leaves 9.5% 25.5% 4.7% 14.3% 91028 Land Clearing 0.2% 0.4% 0.0% 0.4% 1729 Clean Wood 7.7% 22.6% 3.5% 12.0% 74130 Painted/Stained Wood 3.7% 11.4% 1.6% 5.9% 35531 Other Wood 2.9% 7.9% 1.4% 4.4% 27732 Fines 0.3% 0.8% 0.2% 0.5% 3233 Other Organics 1.9% 13.6% 0.0% 4.5% 183
Subtotal 29.7% 39.8% 22.2% 37.2% 2,84334 Carpet 8.0% 24.8% 3.3% 12.6% 76235 Drywall 1.0% 9.1% 0.0% 2.8% 10036 Block/Brick/Stone 5.8% 21.9% 1.7% 9.9% 55637 Insulation 0.1% 0.3% 0.0% 0.4% 1338 Asphalt Roofing 3.6% 14.5% 0.8% 6.3% 34239 Other C&D Material 0.1% 0.2% 0.0% 0.1% 840 Electronics 2.4% 12.9% 0.0% 4.8% 22541 Bulky Items 15.8% 33.8% 9.4% 22.2% 1,51442 Tires 0.1% 0.2% 0.0% 0.3% 1043 Other Inorganic 9.1% 23.6% 4.6% 13.5% 87144 Other Hazardous Material 0.1% 0.2% 0.0% 0.2% 8
Subtotal 46.0% 43.5% 37.8% 54.2% 4,411TOTAL 100.0% 9,582
OR
AN
ICS
INO
RG
AN
ICS
PA
PE
RP
LAS
TIC
GLA
SS
ME
TAL
Larimer County Waste Composition Study 1 of 1 MSW Consultants, LLC

Exhibit 6: C&D Results
AdjustedAdjusted Adjusted 90%Conf. Interval
MaterialsAverage Percent
Standard Deviation Lower Upper
Annual Tons
1 OCC/Kraft 0.5% 1.4% 0.2% 0.7% 1132 Newspaper 0.0% 0.0% 0.0% 0.0% 73 Magazines/Glossy 0.0% 0.0% 0.0% 0.0% 14 High Grade Paper 0.0% 0.0% 0.0% 0.0% 65 Polycoated/Aseptic Containers 0.0% 0.0% 0.0% 0.0% 06 Mixed (Other Recyclable) 0.2% 0.0% 0.0% 0.4% 467 Other Paper (Non Recyclable) 0.3% 1.1% 0.1% 0.5% 65
Subtotal 1.0% 3.1% 0.4% 1.6% 2398 #1 PET Bottles/Jars 0.0% 0.0% 0.0% 0.0% 19 #2 HDPE Bottles/Jars 0.0% 0.0% 0.0% 0.0% 2
10 #3 - 7 Bottles/Jars 0.0% 0.0% 0.0% 0.0% 111 Expanded Polystyrene 0.1% 1.2% 0.0% 0.4% 3512 Films/Bags 0.1% 0.4% 0.0% 0.2% 1713 Other Ridged Plastic 0.2% 0.7% 0.0% 0.3% 43
Subtotal 0.4% 1.6% 0.1% 0.7% 9814 Clear Glass 0.0% 0.0% 0.0% 0.0% 115 Green Glass 0.0% 0.0% 0.0% 0.0% 016 Brown Glass 0.0% 0.0% 0.0% 0.0% 117 Other Glass/Broken Glass 3.9% 15.8% 0.9% 6.8% 944
Subtotal 3.9% 15.8% 0.9% 6.8% 94718 Ferrous Cans 0.0% 0.0% 0.0% 0.0% 219 Other Ferrous Metals 2.4% 6.4% 1.2% 3.6% 59620 Aluminum Cans 0.0% 0.0% 0.0% 0.0% 021 Other Aluminum 0.3% 1.7% 0.0% 0.6% 7222 Other Non-Ferrous 0.3% 1.5% 0.0% 0.5% 6323 Appliances 0.0% 0.2% 0.0% 0.1% 6
Subtotal 3.0% 7.5% 1.6% 4.4% 74024 Food Waste 0.1% 0.0% 0.0% 0.2% 2725 Diapers/Sanitary Products 0.0% 0.0% 0.0% 0.0% 126 Textiles 0.0% 0.0% 0.0% 0.1% 8
26A Rubber/Leather 0.0% 0.1% 0.0% 0.0% 327 Yard Waste -Grass/Leaves 0.2% 0.0% 0.1% 0.3% 4428 Land Clearing 1.3% 11.5% 0.0% 3.5% 32229 Clean Wood 10.9% 21.0% 6.9% 14.9% 2,67130 Painted/Stained Wood 6.0% 17.1% 2.8% 9.2% 1,47831 Other Wood 10.3% 25.5% 5.5% 15.2% 2,53732 Fines 0.0% 0.0% 0.0% 0.0% 533 Other Organics 0.7% 4.8% 0.0% 1.6% 177
Subtotal 29.7% 33.9% 23.3% 36.1% 7,27334 Carpet 11.8% 25.7% 6.9% 16.6% 2,88635 Drywall 15.1% 32.7% 9.0% 21.3% 3,71036 Block/Brick/Stone 11.2% 26.7% 6.1% 16.2% 2,73737 Insulation 1.7% 11.4% 0.0% 3.8% 40738 Asphalt Roofing 14.7% 31.7% 8.8% 20.7% 3,61339 Other C&D Material 1.2% 10.4% 0.0% 3.2% 29240 Electronics 0.1% 0.7% 0.0% 0.2% 2941 Bulky Items 0.8% 4.6% 0.0% 1.7% 19542 Tires 0.0% 0.0% 0.0% 0.1% 643 Other Inorganic 5.4% 19.3% 1.8% 9.1% 1,33444 Other Hazardous Material 0.0% 0.0% 0.0% 0.1% 11
Subtotal 62.1% 37.8% 55.0% 69.2% 15,219TOTAL 100.0% 24,516
PA
PE
RP
LAS
TIC
GLA
SS
ME
TAL
OR
AN
ICS
INO
RG
AN
ICS
Larimer County Waste Composition Study 1 of 1 MSW Consultants

Exhibit 7: Comparison of 1998 and 2006 Study Results
Residential Waste
Material Group Difference
Lower Mean Upper Lower Mean UpperFERROUS METALS 2.2% 3.6% 5.0% 2.0% 3.0% 3.9% 0.6%NON-FERROUS METALS 0.8% 1.0% 1.2% 1.3% 1.7% 2.1% -0.7%GLASS & CERAMICS 1.4% 1.9% 2.4% 2.7% 3.5% 4.2% -1.6%PAPER PRODUCTS 40.8% 43.9% 47.1% 28.6% 31.4% 34.3% 12.5%FOOD WASTE 11.9% 14.2% 16.5% 14.8% 17.4% 20.1% -3.2%YARD WASTE 9.0% 13.6% 18.1% 5.3% 8.4% 11.5% 5.2%TEXTILES 1.8% 2.6% 3.3% 2.4% 3.3% 4.2% -0.7%WOOD PRODUCTS 2.3% 3.9% 5.5% 1.4% 3.0% 4.6% 0.9%PLASTIC, LEATHER, 7 RUBBER 10.7% 12.2% 13.7% 11.0% 11.9% 12.9% 0.3%OTHER 2.1% 3.1% 4.2% 13.8% 16.4% 19.0% -13.3%
TOTAL 100% 100%
Commercial Waste
Material Group Difference
Lower Mean Upper Lower Mean UpperFERROUS METALS 2.4% 4.0% 5.5% 2.2% 3.5% 4.8% 0.5%NON-FERROUS METALS 0.5% 0.8% 1.1% 1.1% 2.0% 2.9% -1.2%GLASS & CERAMICS 0.7% 1.4% 2.1% 1.6% 2.7% 3.8% -1.3%PAPER PRODUCTS 11.1% 17.9% 24.6% 26.7% 31.6% 36.4% -13.7%FOOD WASTE 1.8% 4.0% 6.1% 12.0% 15.9% 19.9% -12.0%YARD WASTE 1.8% 9.9% 18.0% 3.1% 6.3% 9.6% 3.6%TEXTILES 3.9% 8.2% 12.6% 0.9% 2.6% 4.3% 5.6%WOOD PRODUCTS 17.8% 27.7% 37.6% 5.3% 8.9% 12.6% 18.8%PLASTIC, LEATHER, & RUBBER 4.6% 7.0% 9.3% 9.4% 11.2% 13.0% -4.3%OTHER 9.8% 19.3% 28.7% 11.3% 15.2% 19.1% 4.0%
TOTAL 100% 100%
Self-Haul Waste
Material Group Difference
Lower Mean Upper Lower Mean UpperFERROUS METALS 4.3% 13.9% 23.5% 1.0% 2.9% 4.7% 11.1%NON-FERROUS METALS 1.3% 3.3% 5.4% 0.0% 0.4% 0.9% 2.9%GLASS & CERAMICS 2.2% 4.4% 6.6% 0.3% 2.8% 5.3% 1.6%PAPER PRODUCTS 6.5% 13.3% 20.0% 7.6% 13.9% 20.1% -0.6%FOOD WASTE 0.7% 4.0% 7.3% 0.0% 2.1% 5.4% 1.9%YARD WASTE 0.0% 10.6% 23.4% 4.7% 9.5% 14.2% 1.2%TEXTILES 1.2% 3.2% 5.2% 3.6% 8.4% 13.1% -5.1%WOOD PRODUCTS 15.4% 27.4% 39.4% 9.7% 15.0% 20.2% 12.4%PLASTIC, LEATHER, & RUBBER 6.0% 8.3% 10.5% 2.0% 4.5% 7.1% 3.8%OTHER 2.8% 11.6% 20.4% 32.3% 40.7% 49.1% -29.1%
TOTAL 100% 100%
C&D Debris (not performed in 1998 Study)
Material GroupLower Mean Upper
FERROUS METALS 1.2% 3.5% 1.2%NON-FERROUS METALS 0.5% 2.0% 0.1%GLASS & CERAMICS 3.3% 2.7% 0.6%PAPER PRODUCTS 0.4% 31.6% 0.5%FOOD WASTE 0.1% 15.9% 0.0%YARD WASTE 3.1% 6.3% 0.0%TEXTILES 0.0% 2.6% 0.0%WOOD PRODUCTS 5.1% 8.9% 22.2%PLASTIC, LEATHER, & RUBBER 0.4% 11.2% 0.0%OTHER 7.0% 15.2% 55.8%
TOTAL 100%
1998 Study 2006 Study
2006 Study
1998 Study 2006 Study
1998 Study 2006 Study

AppendixAppendix A: Material Definitions
Material Categories Description Recyclable [1]
1 Corrugated Cardboard Paperboard containers consisting of Kraft (brown) linerboard with corrugated (fluted medium) fillings. Includes yellow and waxed corrugated boxes and Kraft paper such as bags or wrapping paper. Does not include non-corrugated paperboard products such as cereal, shoe, or gift boxes.
Yes
2 Newspaper Consists of all paper products printed on daily or weekly newspapers, advertising, catalogs, and other similar items. Publications can be one color (e.g., black and white) or multicolor.
Yes
3 Magazines/Catalogs Publications which are printed on glossy paper. This does not include magazines, catalogs, etc., which do not consist of glossy paper throughout (e.g., comic books.)
4 Office/Computer Paper High grade ledger paper, such as typing and copy paper. Computer paper includes outputs from printers that may have green bars.
Yes
5 Polycoated / Aseptic Containers Aseptic juice boxes and gable top cartons.6 Mixed (Other Recyclable) All other recyclable paper not covered such as non-
corrugated paperboard boxes, direct mail, and books.Yes
7 Other Paper (Non-Recyclable) All products not covered by the above categories, including soiled and unsoiled tissues, paper towels, napkins, file folders, carbonless paper forms, and tissue (tracing) paper.
8 #1 PET Bottles Clear or colored blow molded plastic bottles (i.e., with a narrow neck) labeled #1 PET.
Yes
9 #2 HDPE Bottles Natural or pigmented blow molded plastic bottles (i.e., with a narrow neck) labeled #2 HDPE.
Yes
10 #3 - 7 Bottles Blow molded bottles labeled #3, #4, #5 or #7.11 Expanded Polystyrene Expanded foam packaging, trays or containers labeled #6
PS. Includes foam polystyrene cups and food service containers (i.e., "clamshells") as well as clean service containers and packing "peanuts".
12 Films/Bags Linear, translucent to opaque films/bags, such as grocery bags, dry film, trash and garbage bags.
13 Other Ridge Plastic Rigid plastic not elsewhere classified. Includes plastic tubs, cups, trays, straws, and cutlery. Unmarked plastics such as materials made of multi-composite materials that may contain more than one type of plastic and/or metal, and all other plastics not otherwise described including items such as toys.
Pap
erP
last
ics
Larimer County Material Definitions 1 MSW Consultants

AppendixAppendix A: Material Definitions
Material Categories Description Recyclable [1]
14 Clear Glass Clear glass food and beverage containers. Yes15 Green Glass Green Glass food and beverage containers. Yes16 Brown Glass Brown glass food and beverage containers. Yes17 Other Glass Includes a variety of miscellaneous glass products such
as mirrors, leaded crystal, eyeglasses, and blown glass such as light bulbs, auto glass, windows, TV tubes heat resistant cookware (Pyrex), pottery, and drinking glasses.
18 Steel Cans Fabricated, magnetizable metal containers such as steel or bimetal designed to hold food or beverage products such as soups, vegetables, pet food and juices. Includes two piece containers with aluminum tops.
Yes
19 Other Ferrous Metals Ferrous and alloyed ferrous scrap materials originated from residential commercial, or institutional sources which are attracted to a magnet. This category includes wire coat hangers, aerosol cans, and auto parts.
20 Aluminum Cans Aluminum containers used for holding beverages Yes21 Other Aluminum This category includes all other aluminum products such
as lawn chairs, tables, carts, house siding, rain gutters, window frames, cookware, flatware, aluminum foil, other miscellaneous utensils, and die cast aluminum auto or machine parts.
22 Other Non-Ferrous Non-magnetic metals such as brass, bronze, silver, lead copper, and zinc. Stainless steel house wares are also part of this category.
23Appliances Stoves, refrigerators, dishwashers and all other large and
small household appliances including fragments.24 Food Waste Putrescible organic materials which are the by-products of
activities connected with the growing, preparation, cooking, processing, or consumption of food by human beings or domesticated animals.
25 Diapers/Sanitary Products Diapers and sanitary products.26 Textiles Fabric materials including natural and synthetic fibers
such as cotton, wool, silk, nylon, rayon, or polyester; and Products included within this category would be woven clothing, curtains, stuffed toys, pillows, rags, and upholstery.
26A Rubber/Leather Materials consisting of natural or synthetic rubber and leather. Products included within this category would be belts, handbags, wallets, and mixed items such as footwear.
27 Yard Waste Grass clippings, leaves, brush and prunings.28 Land Clearing Logs, stumps, trunks, and limbs29 Clean Wood Unpainted or unfinished (saw cut) lengths of wood from
building structures, furniture or vehicles (e.g., cars, boats), pallets and creates.
Org
anic
sG
lass
Met
als
Larimer County Material Definitions 2 MSW Consultants
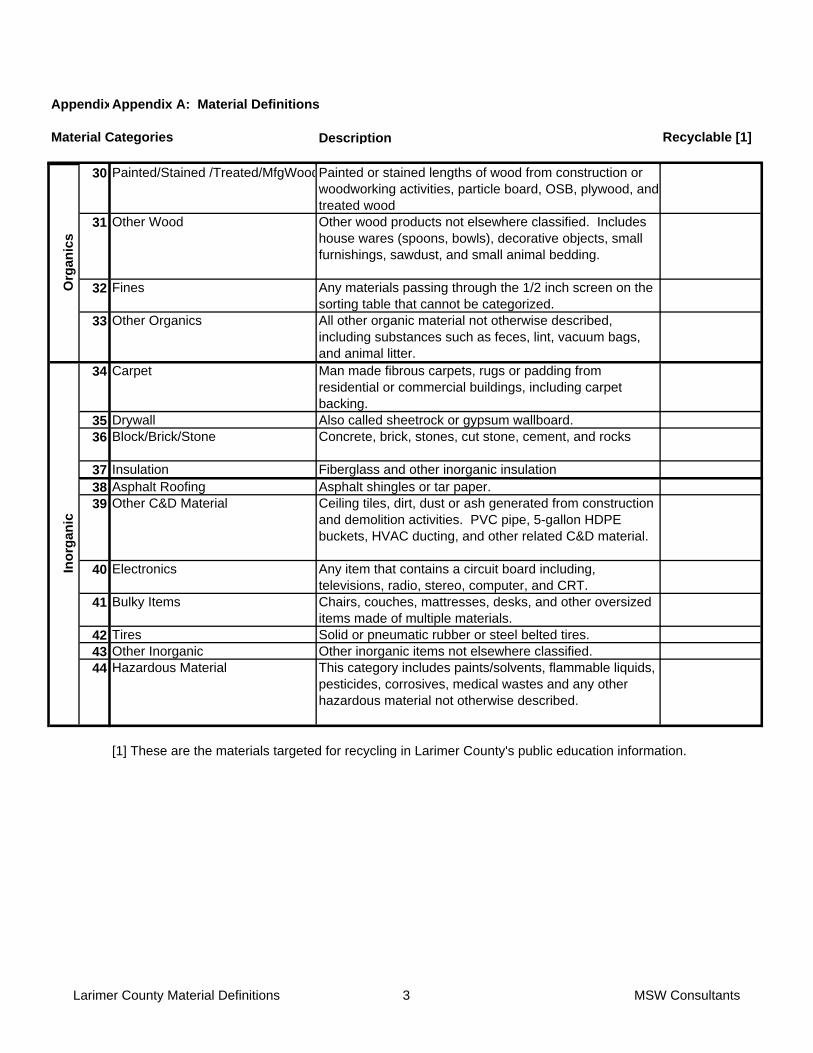
AppendixAppendix A: Material Definitions
Material Categories Description Recyclable [1]
30 Painted/Stained /Treated/MfgWoodPainted or stained lengths of wood from construction or woodworking activities, particle board, OSB, plywood, and treated wood
31 Other Wood Other wood products not elsewhere classified. Includes house wares (spoons, bowls), decorative objects, small furnishings, sawdust, and small animal bedding.
32 Fines Any materials passing through the 1/2 inch screen on the sorting table that cannot be categorized.
33 Other Organics All other organic material not otherwise described, including substances such as feces, lint, vacuum bags, and animal litter.
34 Carpet Man made fibrous carpets, rugs or padding from residential or commercial buildings, including carpet backing.
35 Drywall Also called sheetrock or gypsum wallboard.36 Block/Brick/Stone Concrete, brick, stones, cut stone, cement, and rocks
37 Insulation Fiberglass and other inorganic insulation38 Asphalt Roofing Asphalt shingles or tar paper.39 Other C&D Material Ceiling tiles, dirt, dust or ash generated from construction
and demolition activities. PVC pipe, 5-gallon HDPE buckets, HVAC ducting, and other related C&D material.
40 Electronics Any item that contains a circuit board including, televisions, radio, stereo, computer, and CRT.
41 Bulky Items Chairs, couches, mattresses, desks, and other oversized items made of multiple materials.
42 Tires Solid or pneumatic rubber or steel belted tires.43 Other Inorganic Other inorganic items not elsewhere classified.44 Hazardous Material This category includes paints/solvents, flammable liquids,
pesticides, corrosives, medical wastes and any other hazardous material not otherwise described.
[1] These are the materials targeted for recycling in Larimer County's public education information.
Ino
rgan
icO
rgan
ics
Larimer County Material Definitions 3 MSW Consultants

Appendix A: Mapping of Material Categories Between 1998 and 2006 Studies
2006 Separated Material Categories18 Steel Cans19 Other Ferrous Metals23 Appliances20 Aluminum Cans21 Other Aluminum22 Other Non-Ferrous14 Clear Glass15 Green Glass16 Brown Glass17 Other Glass
1 Corrugated Cardboard2 Newspaper3 Magazines/Catalogs4 Office/Computer Paper5 Polycoated / Aseptic Containers6 Mixed (Other Recyclable)7 Other Paper (Non-Recyclable)
Food Waste Food Waste 24 Food Waste27 Yard Waste28 Land Clearing
Textiles Textiles 26 Textiles29 Clean Wood30 Painted/Stained /Treated/MfgWood31 Other Wood
8 #1 PET Bottles9 #2 HDPE Bottles
10 #3 - 7 Bottles11 Expanded Polystyrene12 Films/Bags13 Other Ridge Plastic
26A Rubber/Leather35 Drywall36 Block/Brick/Stone37 Insulation38 Asphalt Roofing39 Other C&D Material40 Electronics41 Bulky Items25 Diapers/Sanitary Products34 Carpet42 Tires43 Other Inorganic32 Fines33 Other Organics44 Hazardous Material
Other Waste Rock, Brick, Concrete, Dirts, Drywall, Asphalt Shingles, Flashlight Batteries, Etc.
1998 Material Categories
Yard Waste Yard Waste
Wood Products Lumber, Funiture, Etc.
Junk Mail, Newspaper, Magazines, Cereal Boxes and Cardboard
Paper Products
Plastic, Leather & Rubber
Plastic Bags, Plastic Containers, Toys, and Shoes
Ferrous Metals Soup Cans, Scrap Steel, and Auto Parts
Aluminum Cans/Foil, Electrical Wire, Scrap Metal
Non-Ferrous Metals
Glass & Ceramics
Bottles, Dishes, Etc.
Larimer County Material Definitions 1 MSW Consultants


SloanVAZQUEZ,LLC
Prepared for the City of Fort Collins Waste Stream Analysis Study & January 2012 – Final Draft Waste Conversion Technologies Review A-16
6.3 APPENDIX C – WARM GHG EMISSIONS ANALYSIS

(818) 267-5100 ph (818) 782-6712 fax 15230 Burbank Boulevard Suite 103 Sherman Oaks, California 91411
Subject: Fort Collins, CO - Greenhouse Gas Emissions Analysis and Equivalence
Table – WARM Model Joe, Please find attached the Annual Tonnage table and the WARM Model Greenhouse Gas (GHG) Emission Analysis for the Fort Collins job, which includes a GHG Equivalence table that translates GHG savings into more commonplace terms, such as passenger cars removed from the Roadway each year. (As you will see I had to merge some of the materials into broader categories in order to appropriately use the WARM model) The negative value (i.e., a value in parentheses) indicates an emission reduction. So if you look at the attached WARM GHG analysis, the Baseline waste management scenario is simply landfilling all the material received. The Alternative waste management scenario is recovering approximately 60% of the material that would have gone to the landfill by means of recycling, composting, or combustion (which we are using as the AD/CT category, the WARM model does not include an Anaerobic Digestion or any other type of CT). As you will see, the Baseline scenario calculated to negative 12,060 metric tons of carbon dioxide equivalent (MTCO2E). The Alternative scenario however is negative 100,091 MTCO2E. So therefore, the total change in GHG emissions is negative 88,031 MTCO2E per year (the Alternative scenario minus the Baseline). The total GHG emission reductions associated with using the Alternative scenario is equivalent to the following:
• Removing annual emissions from 16,124 passenger vehicles • Conserving 9,992,222 gallons of gasoline • Conserving 36,679,783 cylinders of propane used for home barbeques • Conserving 460 railway cars of coal
Best Regards,
Carrie Ferrier Carrie Ferrier Clements Environmental

Fort Collins, CO GHG Emissions Analysis – WARM Model
Clements Environmental 2 January 2012
Ft Collins Annual Tonnages
Material Tons
Received Tons
Recycled Tons
Landfilled Tons
Combusted Tons
Composted Glass 2,786.0 1393.0 1393.0 - - Mixed Paper (general) 21,659.1 8663.7 4331.8 8663.6 - Mixed Plastics 4,698.0 3288.0 1410.0 - - Mixed Recyclables 20,542.8 7119.6 4746.0 - - Mixed Organics 41,612.4 - 10,781.8 18,841.5 11,989.1 Mixed MSW 8,184.9 - 8,184.9 - - Concrete 11,824.8 5912.4 5912.4 - - Asphalt Shingles 6,826.2 1,707.0 5,119.2 - - Notes: Landfilling –approximately 7 miles (LFG flare); Recycling - approximately 7 miles; Composting – approximately 7miles ; Combustion – approximately 7 miles (AD/CT category)

Fort Collins, CO GHG Emissions Analysis – WARM Model
Clements Environmental 3 January 2012