waste reduction and recycling plan 2017-2021
TRANSCRIPT

WASTE REDUCTION AND RECYCLING PLAN
2017–2021

2 WASTE REDUCTION AND RECYCLING PLAN 2017–2021
CONTENTS
I. INTRODUCTION 3
II. STRATEGIC FIT 8
III. VISION - WHERE DO WE WANT TO BE? 12
IV. OUTCOMES 12
V. POLICY POSITION 13
VI. WHERE ARE WE NOW? 14
VII. WHERE ARE WE GOING? 24
VIII. KEY AREAS OF INTEREST 25
IX. HOW ARE WE GOING TO GET THERE? 26

3
I. INTRODUCTION
MAYOR AND CEO’S MESSAGELogan’s population is expected to increase by 180,000 people
over the next 20 years. Increased waste generation comes
with population growth, which is why it is important that we
can adequately cater for this increase while also focussing on
minimising the amount of waste that ends up in landfill. We
do this by encouraging residents and businesses to recycle,
recover and reuse wherever possible.
While our residents have embraced kerbside recycling, there
are still greater opportunities to divert more waste away from
landfill and into beneficial reuse through recycling, reuse and
composting. Council is committed to ensuring that its waste
facilities and services keep up with population growth and
effectively assist in minimising waste going to landfill. Logan
City Council’s Waste Reduction and Recycling Plan 2017-
2021 plays an important part in setting Council’s strategic
direction to meet the city’s future waste and recycling needs.
Silvio Trinca, Acting Chief Executive Officer Logan City CouncilActing Mayor Cherie Dalley City of Logan
4 WASTE REDUCTION AND RECYCLING PLAN 2017–2021
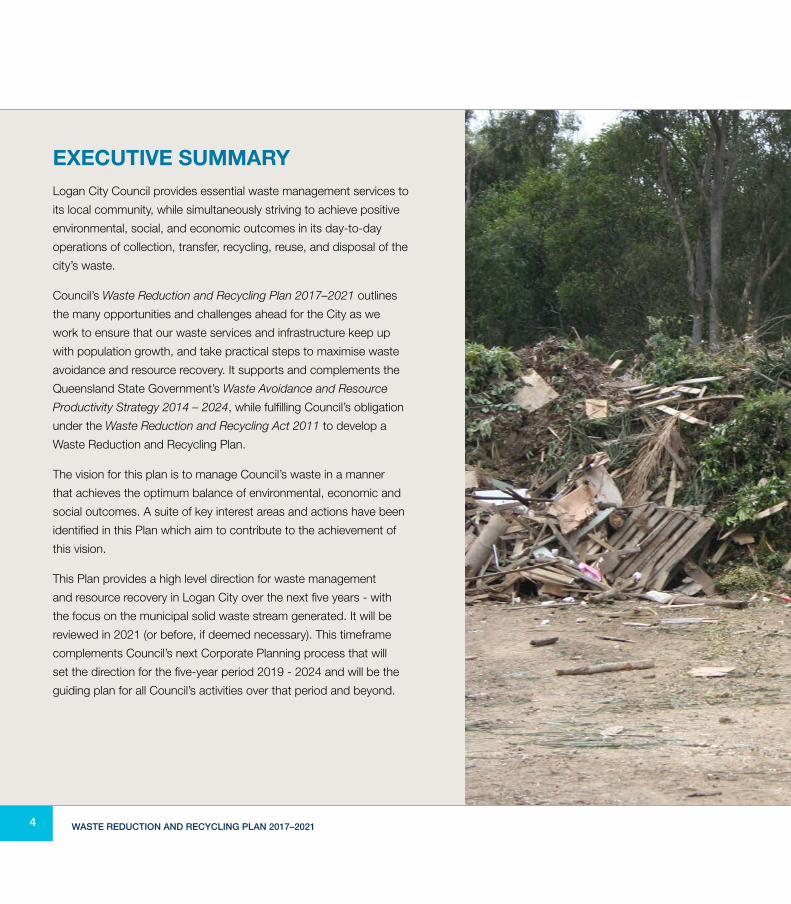
EXECUTIVE SUMMARYLogan City Council provides essential waste management services to
its local community, while simultaneously striving to achieve positive
environmental, social, and economic outcomes in its day-to-day
operations of collection, transfer, recycling, reuse, and disposal of the
city’s waste.
Council’s Waste Reduction and Recycling Plan 2017–2021 outlines
the many opportunities and challenges ahead for the City as we
work to ensure that our waste services and infrastructure keep up
with population growth, and take practical steps to maximise waste
avoidance and resource recovery. It supports and complements the
Queensland State Government’s Waste Avoidance and Resource
Productivity Strategy 2014 – 2024, while fulfilling Council’s obligation
under the Waste Reduction and Recycling Act 2011 to develop a
Waste Reduction and Recycling Plan.
The vision for this plan is to manage Council’s waste in a manner
that achieves the optimum balance of environmental, economic and
social outcomes. A suite of key interest areas and actions have been
identified in this Plan which aim to contribute to the achievement of
this vision.
This Plan provides a high level direction for waste management
and resource recovery in Logan City over the next five years - with
the focus on the municipal solid waste stream generated. It will be
reviewed in 2021 (or before, if deemed necessary). This timeframe
complements Council’s next Corporate Planning process that will
set the direction for the five-year period 2019 - 2024 and will be the
guiding plan for all Council’s activities over that period and beyond.
5

6 WASTE REDUCTION AND RECYCLING PLAN 2017–2021
WHY WE NEED THE STRATEGIC DOCUMENTOver the last decade the nature of waste
management in Australia has changed.
It has moved from a ‘haul and bury’ to a
‘resource recovery’ approach.
While this shift has taken momentum in
Queensland, it is occurring at a much
slower rate than in other states. This is
due to Queensland having one of the
lowest rates of resource recovery, and the
highest rate of landfilled waste per capita
than any other state in Australia. The
Queensland State Government’s Waste
Avoidance and Resource Productivity
Strategy 2014 – 2024 outlines the many
opportunities and challenges ahead for
Queensland as we work to improve our
collective waste avoidance and recovery
performance.
Logan City Council’s Waste Reduction
and Recycling Plan 2017 – 2021 supports
and complements the State’s Waste
Avoidance and Resource Productivity
Strategy 2014 – 2024, while fulfilling
Council’s obligation under the Waste
Reduction and Recycling Act 2011
to develop a Waste Reduction and
Recycling Plan.
Logan’s population of 308,681 (ABS,
2015) is expected to increase to nearly
500,000 people over the next 20 years.
With any population increase comes an
expected increase of waste generation,
which is why it is so important that this
Plan caters for this expected increase,
while at the same time taking practical
steps to minimise the amount of waste
that ends up buried in landfill.
This Plan sets out Council’s strategic
intentions for managing waste, waste
reduction, and recycling in Logan City for
the next five years. A five-year timeframe
has been adopted to enable a medium-
long term planning process but also
to avoid any unnecessary ‘crystal ball
gazing’ in the current climate of changing
government legislation, and evolving
waste management technologies. While
the plan has been prepared with a five-
year horizon it will be reviewed in three
years as required by the Waste Reduction
and Recycling Act 2011. Any significant
changes in Council’s waste reduction and
recycling needs, legislative requirements,
technological advances, and community
needs may trigger additional reviews as
required.

7
HOW THE PLAN WAS DEVELOPEDThis document was developed by Logan City Council, and
went through a period of internal and external consultation
with stakeholders and the community.
HOW THE PLAN WILL BE IMPLEMENTED AND REPORTEDImplementation of this Plan will be monitored and reported to
Council through its corporate reporting system.
In accordance with the requirements of the Waste Reduction
and Recycling Act 2011, an annual report on waste
management will also be submitted to the Queensland
Department of Environment and Heritage Protection. The report
is due within two months of the end of each financial year.

8 WASTE REDUCTION AND RECYCLING PLAN 2017–2021
II. STRATEGIC FIT
This Plan is a statutory requirement under the Waste
Reduction and Recycling Act 2011, which stipulates that all
Queensland Local Governments have a waste reduction and
recycling plan to address all aspects of its waste management.
A range of policies, strategies, acts and regulations apply to
the management of waste in Queensland. Table 1 summarises
the relevant strategic documents that apply to this Plan.
Table 1 - Summary of relevant policy and legislation
Legislation / Strategy Administered by Intent
Environmental Protection Regulations 2008
Queensland Government Provides strategic framework for managing waste in Queensland and outlines the preferred waste management hierarchy and principles for achieving good waste management. The principles for achieving good waste management are:
• The polluter-pays principle — all costs associated with waste management should, where possible, be borne by the waste generator;
• The user-pays principle — all costs associated with the use of a resource should, where possible, be included in the price of goods and services developed from that resource; and
• The product stewardship principle — the producer or importer of a product should take all reasonable steps to minimise environmental harm from the production, use and disposal of the product.
Waste Reduction and Recycling Act 2011
Queensland Government This legislation establishes a new framework to modernise waste management and resource recovery practices in Queensland. It promotes waste avoidance and reduction, and encourages resource recovery and efficiency.
The objectives of the Queensland Waste Reduction and Recycling Act 2011 are:
• To promote waste avoidance and reduction, resource recovery and efficiency actions;
• To reduce the consumption of natural resources and minimise the disposal of waste by encouraging waste avoidance and the recovery, re-use and recycling of waste;
• To minimise the overall impact of waste generation and disposal;
• To ensure a shared responsibility between government, business and industry and the community in waste management and resource recovery; and
• To support and implement national frameworks, objectives and priorities for waste management and resource recovery.

9
Legislation / Strategy Administered by Intent
Waste Reduction and Recycling Regulation 2011
Queensland Government The key provisions of the Regulation include:
• Fees for applications under the Waste Reduction and Recycling Act 2011;
• Management of used packaging materials; and
• Details about who is required to plan and report about waste management.
Queensland Waste Avoidance and Resource Productivity Strategy 2014-2024
Queensland Government The Queensland Waste Avoidance and Resource Productivity Strategy 2014-2024 will assist the Queensland waste sector in achieving the objectives of the Waste Reduction and Recycling Act 2011.
The strategy’s broad goals are to:
• Reduce waste (specifically, to halve the amount of waste sent to landfill by 2020);
• Optimise recovery and recycling; and
• Develop sustainable waste industries and jobs.
Queensland Plan Queensland Government The Queensland Plan is a 30-year vision for the state—a roadmap for growth and prosperity. There is a recognition of the importance of protecting the environment, and the intent to reduce the environmental footprint from waste generation.
Australia’s National Waste Policy: Less Waste, More Resources
Australian Government Department of the Environment
Australia’s National Waste Policy 2009 heralds a new, coherent and environmentally responsible approach to waste management in Australia and sets Australia’s waste management and resource recovery direction to 2020.
The aims of the national waste policy are to:
• Avoid the generation of waste, reduce the amount of waste (including hazardous waste) for disposal;
• Manage waste as a resource;
• Ensure that waste treatment, disposal, recovery and re-use is undertaken in a safe, scientific and environmentally sound manner, and
• Contribute to the reduction in greenhouse gas emissions, energy conservation and production, water efficiency and the productivity of the land.
Product Stewardship Act 2011 Australian Government Department of the Environment
This legislation provides the framework to effectively manage the environmental, health and safety impacts of products, and in particular those impacts associated with the disposal of products.
The implementation of the Act will help reduce hazardous substances in products and in waste, avoid and reduce waste, and increase recycling and resource recovery.
The framework includes voluntary, co-regulatory and mandatory product stewardship.
The passage of the legislation delivers on a key commitment by the Australian Government under the National Waste Policy.

10 WASTE REDUCTION AND RECYCLING PLAN 2017–2021
Legislation / Strategy Administered by Intent
Product Stewardship Regulations 2012
Australian Government Department of the Environment
The Regulation sets out the fees and fee structure for the assessment of applications for accreditation of voluntary product stewardship arrangements.
Product Stewardship (Television and Computer) Regulation 2011
Australian Government Department of the Environment
This Regulation supports a co-regulatory recycling scheme for televisions, computers, printers and computer products. It aims to increase the recycling of covered products to 80% in 2021-22.
In line with the aims of the National Waste Policy, the objectives of the Scheme are to:
• Reduce the amount of television and computer waste (particularly hazardous waste materials) for disposal to landfill;
• Increase recovery of resources from end-of-life television and computer products in a safe, scientific and environmentally sound manner;
• Ensure national coverage; and
• Ensure fair and equitable industry participation in the Scheme.
Clean Energy Act 2011 Australian Government Department of Environment
The Australian Clean Energy Act 2011 aims to:
• Ensure compliance with international obligations;
• Support a global response to climate change; and
• Take action to meet Australia’s long-term greenhouse gas targets.
Renewable Energy Targets Australian Government Department of Environment
Targets for renewable energy were adopted by Australia with the arrangements being managed under several pieces of supporting regulations and legislation. Mandatory Renewable Energy Targets were adopted in 2010. It requires 20% of Australia’s energy generation to come from green or renewable energy sources by 2020. A target of interest is Bioenergy which includes energy from waste.
Packaging Covenant Australian Government Department of Environment
The Australian Packing Covenant (APC) provides a tool for industries in consumer packaging supply chains to contribute to managing impacts of packaging waste. Funds created by covenant arrangements are applied to projects. Previously this has included funding to Local Government for projects including littering and collection/processing of recyclables.

11
CORPORATE PLAN LINKThe Waste Reduction and Recycling Plan 2017 – 2021
supports the priority areas of Council’s Corporate Plan 2013-
2018 specifically:
MI - Building our Major Infrastructure
CI - Building our City’s Image
EB - Building our Economic Base
E - Building our Environment
SE - Building our Service Excellence
WC - Building the Wellbeing of our Communities
MG - Managing Growth in our City

12 WASTE REDUCTION AND RECYCLING PLAN 2017–2021
III. VISION - WHERE DO WE WANT TO BE?
The vision for this Plan is to manage Council’s waste in a manner that achieves the optimum balance of environmental, economic and social outcomes.
More specifically, this Plan sets out the following aspirational
targets for waste reduction and recycling:
Waste Stream Measure 2011/12 Baseline 2021 Target
Municipal Solid Waste Reduction in per household tonnage of MSW per year
14.05 kg per household, per week 13.3 kg per household per week (5% decrease)
Municipal Solid Waste Increase in per household tonnages of recycled materials, collected from recycling bins, per year
2.58 kg per household per week (figure based on post processing of recyclables and removal of waste contamination)
Increase to 3.01 kg per household per week (17% increase)
Municipal Solid Waste Reduction in contamination of recycling bins
37.3% 25%
Municipal Solid Waste Increase tonnage of items diverted through the Recycling Market
1,166 tonnes, per year 1,283 tonnes per year (10% increase)
IV. OUTCOMESThis Plan will:
• provide a framework for the collection, treatment and
disposal of waste generated within Logan City;
• maximise the recovery and reuse of waste that has a further
or alternative use, to the greatest extent practicable;
• set aspirational targets for the minimisation of waste that is
sent to landfill (or other forms of disposal); and
• ensure ongoing compliance with legislative and regulatory
requirements.

13
V. POLICY POSITIONCouncil acknowledges that the waste hierarchy (Figure 1) is
the internationally recognised framework for prioritising waste
and resource management practices.
Since all waste management options have some impact
on the environment, the only way to avoid impact is not to
produce waste in the first place, and waste avoidance and
reduction is therefore at the top of the hierarchy. Re-use,
followed by recycling, other recovery and treatment techniques
follow, while disposal to landfill is at the bottom of the
hierarchy.
Although the hierarchy holds true in general terms, there will
be certain wastes for which the waste management options
are limited, or for which the most practicable option lies
towards the bottom of the hierarchy. In deciding what is the
most appropriate disposal route environmental, economical,
and social costs and benefits need to be considered.
In addition to the waste hierarchy, the following principles are
also acknowledged:
• The ‘Proximity Principle’ - transporting waste has
environmental, social and economic costs so as a general
rule, waste should be dealt with as near to the place of
production as possible. This has the added benefit of
raising awareness about waste and encouraging ownership
of the problem at the local level.
• The “Polluter-pays” principle — all costs associated with
waste management should, where possible, be borne by
the waste generator;
• The “User-pays” principle — all costs associated with
the use of a resource should, where possible, be included
in the price of goods and services developed from that
resource; and
• The “Product stewardship” principle — the producer
or importer of a product should take all reasonable steps to
minimise environmental harm from the production, use and
disposal of the product.
Figure 1 - Waste Hierarchy
MOST PREFERABLE
Dispose
Treat
Recover energy
Recycle
Reuse
Avoid or reduce
LEAST PREFERABLE

14 WASTE REDUCTION AND RECYCLING PLAN 2017–2021
VI. WHERE ARE WE NOW?
COMMUNITY AND ECONOMIC PROFILELogan is a culturally-diverse and vibrant city which is rich in
social capital, providing a variety of economic and lifestyle
choices. Located in the fastest growth corridor in Australia,
Logan City’s goal is to be recognised as a leader in sustainable
thinking, sustainable development, and sustainable outcomes.
Logan is ideally located between Brisbane, Ipswich, and the
Gold Coast, and has good access to highways and public
transport. It has many thriving light industrial precincts at
Marsden, Crestmead, Slacks Creek, and Loganholme, which
are continuing to expand to meet the demand of quality and
responsible industry.
Data from the Commonwealth Census (ABS, 2011) shows
that the output generated by Logan’s economy is estimated
at $20.737 billion. This represents 5.53% of the $375 billion
output generated in South East Queensland, 3.22% of the
$644.290 billion output generated in Queensland, and 0.62%
of the $3.349 trillion output generated nationally. Figure 2
provides an overview of the output per economic sector in
Logan in 2011.
Figure 2 - Output generated by the various business sectors in Logan
0 5 10 15 20 25
Mining
Arts & Recreation Services
Agriculture, Forestry & Fishing
Information, Media & Telecommunications
Electricity, Gas, Water & Waste Services
Accommodation & Food Services
Administrative and Support Services
Public Administration & Safety
Financial & Insurance Services
Education & Training
Transport, Postal & Warehousing
Professional, Scientific & Technical Services
Health Care & Social Assistance
Wholesale Trade
Retail Trade
Construction
Rental, Hiring & Real Estate Services
Manufacturing
Other Services
0.5%
0.6%
0.8%
1.3%
1.4%
2.5%
2.9%
3.3%
3.8%
4.0%
4.0%
4.1%
4.7%
6.2%
6.3%
13.2%
13.9% 24.5%
2.1%

15
MANUFACTURINGLogan is a vibrant area of manufacturing activity stretched
across several industrial and commercial hubs located
throughout the city. Particular strengths in manufacturing
include: metal production, machinery, equipment, and
materials for the residential and commercial building
industry. There are is also an emerging food and beverage
manufacturing sector in Logan.
CONSTRUCTIONLogan offers a well-qualified, stable workforce for the current
and future needs of the construction sector. The construction
sector plays an important role in Logan’s economy, by
contributing significantly with income and employment
opportunities for the City. Construction represents an
integral part of Logan’s major supply chains, especially in the
manufacturing and wholesale trade sectors.
EDUCATIONLogan City boasts some of Australia’s top schools which
provide quality education from Prep right through to University
level. Logan has 36 prep schools, 50 state schools, 13 private
schools, Metropolitan South Institute of TAFE College, and
Griffith University’s Logan campus. The city has established
strong linkages between the education sector and the
business community to ensure workforce requirements are
being effectively and efficiently met at a local level.
Looking ahead to the next 20 years, Logan City will continue
to be one of the fastest growing cities in Queensland. The
population is expected to increase by up to 200,000 within the
next 20 years to 490,522 persons by 2036. This population
growth will be a major driver for job creation, and in effect will
impact waste generation and management for the city.

16 WASTE REDUCTION AND RECYCLING PLAN 2017–2021
WASTE PROFILE AND INFRASTRUCTURE
Waste Streams
Waste is typically classified into three categories:
• Municipal Solid Waste (MSW);
• Commercial and Industrial waste (C&I); and
• Construction and Demolition waste (C&D).
Council does not have total responsibility for managing all
wastes. Council is primarily responsible for the management
of waste generated by the residential sector (MSW), and
therefore can have the most influence in this waste stream.
Council’s involvement with C&I and C&D waste is limited to
the provision of optional collection services, and recycling
and disposal services for C&I and C&D waste at its waste
and recycling facilities.
Waste Collection ServicesCouncil provides the following waste collection services:
Waste Stream Standard Services*
Municipal Solid Waste • Weekly 240L general waste wheelie bin collection
• Fortnightly 240L recycling waste wheelie bin collection
• Annual Kerbside Clean Up service aimed at bulky waste removal
Commercial and Industrial waste (C&I), and Construction and Demolition waste (C&D).
A small amount of commercial waste and recyclables is collected by Council as part of the collection services. The majority of commercial waste and recycling collection services are undertaken by the private sector.
*Note that Council does offer variations to this standard collection service in certain circumstances and upon the residents’ and/or property owners’ request (e.g. smaller general waste bin, more frequent servicing frequency, additional bins, etc.). There are also a small number of properties in the City that do not receive a waste collection service primarily due to their isolation.

17
WHEELIE BIN COMPOSITIONBased on Council’s audit of domestic general waste
bins, Council’s MSW is composed of approximately 25%
food waste, 27% garden waste, 15% recyclable paper
and cardboard (recyclable), 4% textiles, 4% nappies, 6%
recyclable glass, metal, and plastics, and 19% ‘other’
(including wood, rubber, leather, non-recyclable paper,
cardboard, metal, and glass) - as shown in figure 3.
In theory, at least 77% of Council’s domestic waste
could be diverted from landfill through avoidance, reuse,
recovery and composting. This equates to approximately
61,456 tonnes of materials that could be recovered for
beneficial use rather than landfilled.
Based on Council’s audit of domestic recycling bins, a
typical recycling bin is composed of approximately 3%
PET, 3% HDPE, 1% other mixed plastic, 2% steel, 1%
aluminium, 27% paper, 18% cardboard, 13% glass, and
32% waste (contamination) - as shown in Figure 4.
Council accepts recycling materials with recycling codes
of:
Figure 3 - Composition of a typical Logan City Council 240L general waste bin
Figure 4 - Composition of a typical Logan City Council 240L recycling bin
23% “other” waste (in-cluding some avoidable and recyclable materials)
25% recyclable paper, cardboard, textiles, glass, metal, and plastics
52% garden and food organics (mostly avoidable or compostable)
7% PET, HDPE, mixed plastics
13% glass
3% steel and aluminium
45% paper and cardboard
32% waste (inc. plastic bags and glass fines)

18 WASTE REDUCTION AND RECYCLING PLAN 2017–2021
KERBSIDE CLEAN-UP
Waste Streams
Currently, Council provides a yearly kerbside clean-up service
to households, primarily for large bulky items that residents
may have difficulty in hauling to a waste and recycling facility
themselves.
Kerbside clean-ups do not encourage waste reduction, and
pose significant amenity and health and safety issues. The
manner in which materials are presented for collection and
subsequently collected does not allow for resource recovery.
Kerbside clean-ups are a popular service for many
households. However, residents perceive kerbside clean-
ups as a ‘free’, convenient service, whereas in fact only an
estimated 20-30% of residents participate in the clean-ups,
while all residents pay via rates for the service. In other words,
Council must recover the full cost of the service through rates,
which are passed on to all ratepayers.
An alternative may be for Council to provide a Recyclables
Collection Service to residents for unwanted household goods,
with the items collected used to stock the Logan Recycling
Market. The service could be on-demand, or provided
annually. The desired output of any change to the kerbside
clean-up service is a significant reduction in the quantity
of kerbside clean-up material landfilled, and an estimated
increase in the amount of reusable material recovered.
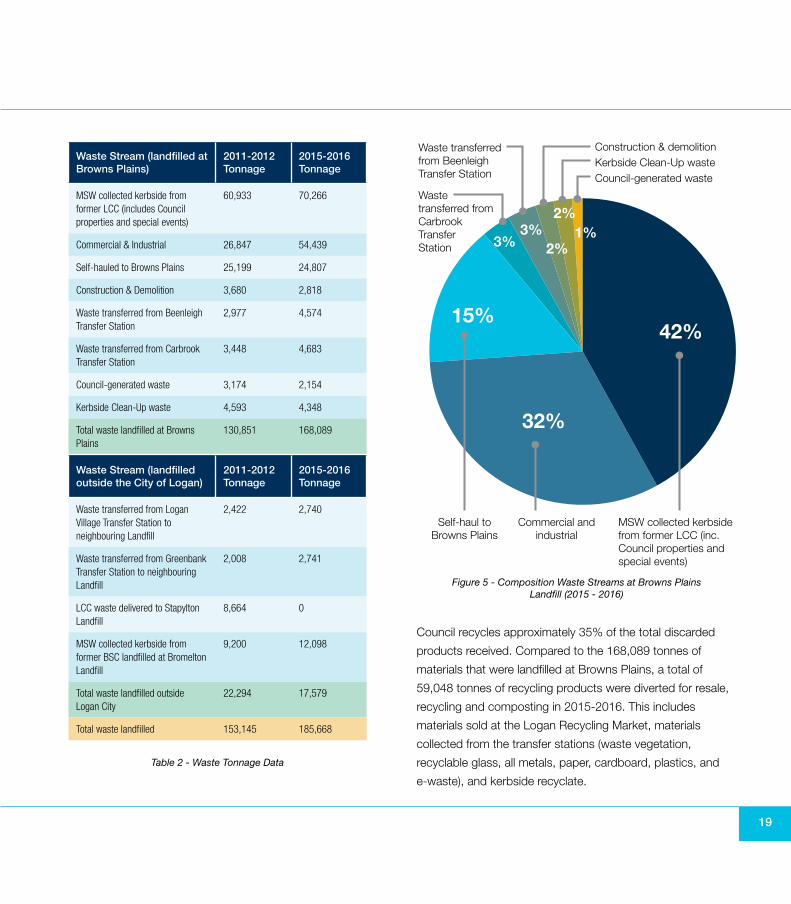
Landfill Tonnage and Composition
Table 2 at right provides data on the growth of total waste
landfilled in 2015-2016, in comparison to the baseline data of
2011-2012. Figure 5 shows the composition of waste received
at the Browns Plains Landfill.
In the 2015-2016 financial year, around 65% of the waste
landfilled at the Browns Plains Landfill was MSW collected
from residential kerbside areas, self-hauled waste to the
landfill, and self-hauled waste from the Carbrook and
Beenleigh transfer stations. The remaining waste landfilled at
Browns Plains is a combination of C&I (32%), C&D (2%) and
Council generated waste (1%).
Domestic waste generated in the former areas of Beaudesert
Shire, including waste that is received at the Logan Village and
Greenbank Transfer Stations is sent to Bromelton Landfill in
the Scenic Rim Region. 2012 was the final year in which waste
from the former areas of the Gold Coast City were disposed of
in the Stapylton Landfill. Since 2012, all waste from the former
areas of the Gold Coast City are now disposed of at the
Browns Plains Landfill.
Kerbside Collection
19
Waste Stream (landfilled at Browns Plains)
2011-2012 Tonnage
2015-2016 Tonnage
MSW collected kerbside from former LCC (includes Council properties and special events)
60,933 70,266
Commercial & Industrial 26,847 54,439
Self-hauled to Browns Plains 25,199 24,807
Construction & Demolition 3,680 2,818
Waste transferred from Beenleigh Transfer Station
2,977 4,574
Waste transferred from Carbrook Transfer Station
3,448 4,683
Council-generated waste 3,174 2,154
Kerbside Clean-Up waste 4,593 4,348
Total waste landfilled at Browns Plains
130,851 168,089
Waste Stream (landfilled outside the City of Logan)
2011-2012 Tonnage
2015-2016 Tonnage
Waste transferred from Logan Village Transfer Station to neighbouring Landfill
2,422 2,740
Waste transferred from Greenbank Transfer Station to neighbouring Landfill
2,008 2,741
LCC waste delivered to Stapylton Landfill
8,664 0
MSW collected kerbside from former BSC landfilled at Bromelton Landfill
9,200 12,098
Total waste landfilled outside Logan City
22,294 17,579
Total waste landfilled 153,145 185,668
Figure 5 - Composition Waste Streams at Browns Plains Landfill (2015 - 2016)
Council recycles approximately 35% of the total discarded
products received. Compared to the 168,089 tonnes of
materials that were landfilled at Browns Plains, a total of
59,048 tonnes of recycling products were diverted for resale,
recycling and composting in 2015-2016. This includes
materials sold at the Logan Recycling Market, materials
collected from the transfer stations (waste vegetation,
recyclable glass, all metals, paper, cardboard, plastics, and
e-waste), and kerbside recyclate.
42%
32%
15%
3%3%
2%
2%1%
MSW collected kerbside from former LCC (inc. Council properties and special events)
Commercial andindustrial
Self-haul to Browns Plains
Council-generated wasteKerbside Clean-Up wasteConstruction & demolition
Waste transferred from Carbrook Transfer Station
Waste transferred from Beenleigh Transfer Station
Table 2 - Waste Tonnage Data

20 WASTE REDUCTION AND RECYCLING PLAN 2017–2021
Waste & Recycling Facilities
Council owns and operates 5 transfer stations, 1 active landfill,
and a recycling market (tip shop), which provides a range of
waste and recycling services to residential and commercial
customers.
These facilities provide a number of services for waste
management across all three waste steams - Municipal Solid
Waste (MSW), Commercial and Industrial waste (C&I), and
Construction and Demolition waste (C&D).
A summary of Council’s current waste and recycling facilities
are as follows:
Browns Plains Waste & Recycling Facility (shown on cover and Logan Recycle Market shown above)
Site Specifics• Major Transfer Station (4x 60 cubic metre bins)
• Weighbridge
• Landfill - licensed to accept 100,000 - 200,000 tonnes per
year
• Gas extraction for energy production
• Preferred site for construction and demolition waste,
commercial and industrial waste
• Open 7 days per week
Approved Site Use• Domestic and commercial
• Limited domestic hazardous waste
• Asbestos disposal
Recycling Facilities AvailableGreen waste, tyres, oil, metals, cardboard, paper, glass
containers, plastic bottles and containers, cans (empty), x-ray
films, electrical and electronic waste, batteries, fluorescent
tubes (domestic only), printer cartridges and consumables.
Logan Recycling Market (tip shop) - open Friday, Saturday,
Sunday, Monday (excluding public holidays). The Logan
Recycling Market is one of the biggest of its kind in Australia,
and sells pre-loved items including electrical appliances,
furniture, household goods, construction materials, garden
equipment, antiques and clothing. This reduces the volume of
material that would otherwise be disposed of to landfill.

21
Greenbank Transfer Station
Site Specifics• Minor Transfer Station
• Open 7 days per week
Approved Site Use• Domestic and commercial (limited volumes only)
Recycling Facilities AvailableGreen waste, tyres, oil, metals, cardboard, paper, glass
containers, plastic bottles and containers, cans (empty),
batteries, x-ray films, electrical and electronic waste,
fluorescent tubes (domestic only), and collection of unwanted
items for resale at the Logan Recycling Market.
Carbrook Transfer Station
Site Specifics• Minor Transfer Station
• Weighbridge
• Open 7 days per week
• Former Landfill
Approved Site Use• Domestic and commercial (limited volumes only)
Recycling Facilities AvailableGreen waste, tyres, oil, metals, cardboard, paper, glass
containers, plastic bottles and containers, cans (empty),
batteries, x-ray films, electrical and electronic waste,
fluorescent tubes (domestic only), and collection of unwanted
items for resale at the Logan Recycling Market.

22 WASTE REDUCTION AND RECYCLING PLAN 2017–2021
Beenleigh Transfer Station
Site Specifics• Minor Transfer Station
• Open 7 days per week
Approved Site Use• Domestic only
Recycling Facilities AvailableGreen waste, tyres, oil, metals, cardboard, paper, glass
containers, plastic bottles and containers, cans (empty),
batteries, x-ray films, electrical and electronic waste,
fluorescent tubes (domestic only), and collection of unwanted
items for resale at the Logan Recycling Market.
Logan Village Transfer Station
Site Specifics• Minor Transfer Station
• Open 7 days per week
Approved Site Use• Domestic and commercial (limited volumes only)
Recycling Facilities AvailableGreen waste, tyres, oil, metals, cardboard, paper, glass
containers, plastic bottles and containers, cans (empty),
batteries, x-ray films, electrical and electronic waste,
fluorescent tubes (domestic only), and collection of unwanted
items for resale at the Logan Recycling Market.
23
Waste Education
Logan City Council provides a community education and
awareness program called “Watch Out Waste”. This program
is delivered to encourage residents, school groups, and
local business to “reduce, reuse, recycle and compost.
The program demonstrates the strong links between waste
avoidance and minimisation, resource conservation, cost
savings, energy and water efficiency, climate change, and
to assist the participants in understanding the impacts of
their waste management decisions on the current and future
environment.
It is acknowledged that education provided by Council plays
an important role in promoting behavioural change by gaining
awareness, co-operation, and participation in minimising
waste and maximising resource recovery. It is therefore
considered important that this program continues to provide
effective communication and promotion strategies that suit the
target audience, with a view to educate on a long term basis.
BeenleighStation
HolmviewStation
Edens LandingStation
BethaniaStation
LoganleaStation
RochedaleSouth
Priestdale
Springwood
DaisyHill
Underwood
Woodridge
ShailerPark
SlacksCreek
LoganCentral
Berrinba
KingstonMeadowbrook
Loganlea
TanahMerah
Bethania
Loganholme
Cornubia
Carbrook
Eagleby
Beenleigh
EdensLanding
Holmview
MountWarren Park
BahrsScrubBuccan
Windaroo
Belivah
Wolffdene
LoganVillage
Bannockburn
BrownsPlains
Marsden
WaterfordWest
WaterfordLoganReserve
ChambersFlat
Crestmead
HeritagePark
Park Ridge
RegentsPark
Hillcrest
Forestdale
BoroniaHeights
Park Ridge South
Munruben
Stockleigh
NorthMaclean
SouthMaclean
Greenbank
New Beith
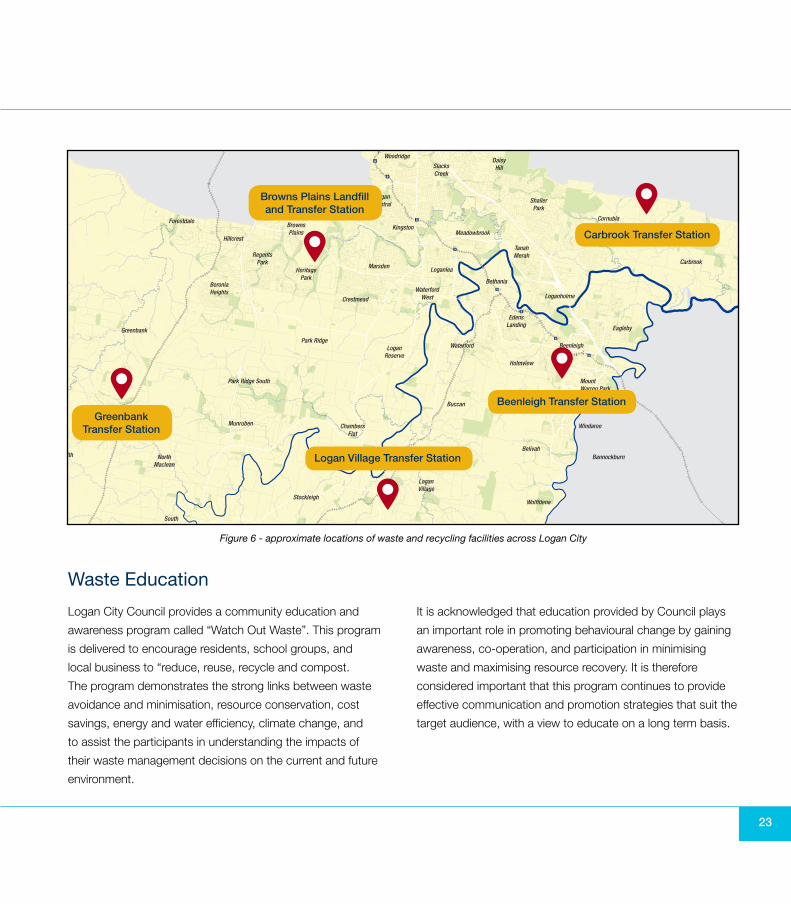
Figure 6 - approximate locations of waste and recycling facilities across Logan City
Carbrook Transfer Station
Beenleigh Transfer Station
Browns Plains Landfill and Transfer Station
Greenbank Transfer Station
Logan Village Transfer Station

24 WASTE REDUCTION AND RECYCLING PLAN 2017–2021
VII. WHERE AREWE GOING?
PREDICTED WASTE GROWTHThis Plan has been developed on the understanding that current
rates of waste generation will continue to increase, in line with
population growth. Council’s population is expected to grow at a
rate of 2.5% per year.
Council anticipates that waste generation in the City will closely
match predicted population growth rates. Under existing services
arrangements it is anticipated that by 2031, this will equate to an
estimated 251,425 tonnes of waste being landfilled, compared to
182,855 tonnes in 2015-2016 (see Table 3 and Figure 7).
Waste to landfill2015-2016
Predicted by 2031
MSW to landfill (kerbside waste, kerbside clean-ups, self-haul waste to transfer stations)
128,416 176,572
C&D +C&I to landfill 54,439 74,853
Total landfilled (tonnages) 182,855 251,425
Material diverted from landfill2015-2016
Predicted by 2031
Recyclable materials (paper, cardboard, glass, metal and plastic, e-waste, market resalable items, kerbside recyclate)
20,163 27,724
Green waste self-hauled to transfer stations 38,343 52,721
Green waste collected during kerbside clean-ups 541 743
Total diverted (tonnages) 59,048 81,188
Table 3 - Projected waste and recycling tonnages for Logan City
Figure 7 - Total Projected Waste and Recycling Tonnages for Logan 2016 – 2031* *based on current service arrangements
025,00050,00075,000
100,000125,000150,000175,000200,000225,000250,000275,000300,000325,000350,000
16/17 17/18 18/19 19/20 20/21 21/22 22/23 23/24 24/25 25/26 26/27 27/28 28/29 29/30 30/31
Kerbside greenOther to landfill
Self-haul green waste C&D + C&l to landfill
Kerbside recyclables Domestic residual to landfill

25
VIII. KEY AREAS OF INTERESTThe following are the Key Areas of Interest that will underpin
the delivery of the Plan’s vision and targets, and also align
with the objectives of the Queensland Government’s Waste
Avoidance and Resource Productivity Strategy 2014-2024:
• Driving cultural change
All stakeholders recognise their role in meeting the vision
of the waste strategy, and are informed and empowered to
participate in achieving its goal and objective
• Avoidance and minimisation
Logan will realise all opportunities environmental, economic
and social from maximising sustainable consumption and
production
• Reuse, recovery and recycling
Logan will optimise economic benefits from reuse, recovery
and recycling
• Management, treatment and disposal
Logan will reduce the impact of waste on human health and
the environment through improved waste practices
Do your best for the environment by reducing waste
Do not place plastic bags in your yellow-lidded recycling bin
No plastic bags!
Hard plastic containers Glass bottles & jars
Steel & aluminium cans Paper & cardboard
For more information about recycling, visit logan.qld.gov.au
Recycling helps!
Typical City Magazine educational advertisements
Tip#1: Reduce Buy in bulk. Make a list and only buy what you need.
I’m dreaming of a Waste-wise Christmas...
For more information about recycling, visit logan.qld.gov.au
Tip#2: Reuse Serve smaller meal portions. Safely store and reuse leftovers.
Tip#3: Recycle Recycle food and drink packaging, cards and paper gift wrapping.

26 WASTE REDUCTION AND RECYCLING PLAN 2017–2021
IX. HOW ARE WE GOING TO GET THERE? Council will implement the following specific actions to support
the Plan’s vision and performance targets:
No. ActionTarget
Date
Links with key areas of
interest
1 Review the Waste Education Program to ensure it is providing contemporary waste education messages and reaching as much of the target audience as possible
Annual • Driving cultural change
2 Promote improved recycling opportunities including within Council occupied buildings, at public events and in public places
Ongoing • Driving cultural change
• Avoidance and minimisation
• Reuse, recovery and recycling
3 Establish and promote new recycling opportunities as they become feasible Ongoing • Driving cultural change
• Avoidance and minimisation
• Reuse, recovery and recycling
4 Act as an advocate for improved legislation, policy, projects and procedures at the national, state and local levels that facilitate waste avoidance and minimisation
Ongoing • Driving cultural change
5 Encourage the use of recycled materials and re-use of materials in Council activities and procurement where feasible
Ongoing • Reuse, recovery and recycling
6 Undertake periodic reviews and continue to explore alternatives to the kerbside clean-up program
Annual • Driving cultural change
• Avoidance and minimisation
7 Survey customer behaviours, and customer satisfaction with waste facilities to identify improvement opportunities
2018 and 2020
• Driving cultural change
8 Continue to monitor the feasibility of alternative waste technologies Ongoing • Avoidance and minimisation
• Management, treatment and disposal
9 Ensure the siting and designs of any new or upgraded infrastructure minimise environmental impacts
Ongoing • Avoidance and minimisation
10 Investigate options for regional collaboration in the development of waste infrastructure
Ongoing • Avoidance and minimisation
• Management, treatment and disposal
11 Design and operate the Browns Plains Landfill to maximise life expectancy Ongoing • Avoidance and minimisation
• Reuse, recovery and recycling
• Management, treatment and disposal

27
No. ActionTarget
Date
Links with key areas of
interest
12 Participate in regional collaborative forums and workshops that aim to minimise waste and maximise resource recovery.
Ongoing • Driving cultural change
• Avoidance and minimisation
13 Set waste fees to encourage recycling and reuse of unwanted goods Annual • Driving cultural change
• Reuse, recovery and recycling
14 Promote the reuse of unwanted items through the Logan Recycling Market Ongoing • Driving cultural change
• Avoidance and minimisation
• Reuse, recovery and recycling
15 Consider opportunities to support and facilitate the development of a local green waste/compost processing and end use markets in the region
Ongoing • Reuse, recovery and recycling
• Management, treatment and disposal
16 Conduct workshops for multicultural groups to promote better recycling behaviours 2017 • Driving cultural change
• Reuse, recovery and recycling
17 Provide information via Council’s website on practical recycling behaviours Ongoing • Driving cultural change
• Avoidance and minimisation
• Reuse, recovery and recycling
• Management, treatment and disposal
18 Continue to operate the City’s waste facilities to minimise environmental impacts Ongoing • Avoidance and minimisation
• Reuse, recovery and recycling
• Management, treatment and disposal
19 Undertake environmental monitoring and reporting as required by licence conditions Ongoing • Management, treatment and disposal
20 Maintain the Quality & Environmental Management System Ongoing • Management, treatment and disposal
21 Hold quarterly community consultative committee meetings regarding the operation of the Browns Plains Landfill
Ongoing • Management, treatment and disposal
22 Continue to extend the gas capture system at the Browns Plains landfill to further reduce carbon emissions
Ongoing • Reuse, recovery and recycling
• Management, treatment and disposal
23 Investigate the feasibility for a dedicated organic waste / greenwaste collection and recycling service
2018 • Management, treatment and disposal
24 Develop concepts for the future waste and recycling infrastructure network in the City 2018 • Management, treatment and disposal
25 Continue investigations into Council’s waste disposal options upon the closure of the Browns Plains Landfill
Ongoing • Avoidance and minimisation
• Management, treatment and disposal
