waste measurement & improving performance
DESCRIPTION
Waste measurement & improving performance. trainer organisation location date. Aims. Demonstrate how to forecast and measure waste, with minimum cost and effort, using publicly available tools Equip you with the knowledge and means to train others in your organisation. Agenda. - PowerPoint PPT PresentationTRANSCRIPT
Waste measurement & improving performancetrainer organisation
locationdate
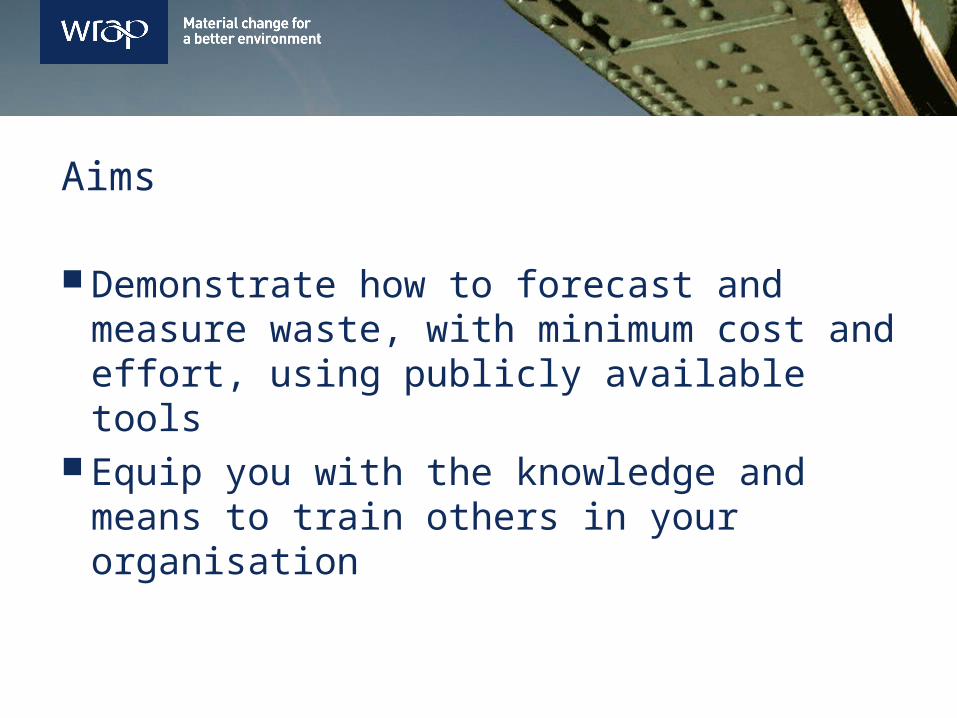
Aims
Demonstrate how to forecast and measure waste, with minimum cost and effort, using publicly available tools
Equip you with the knowledge and means to train others in your organisation
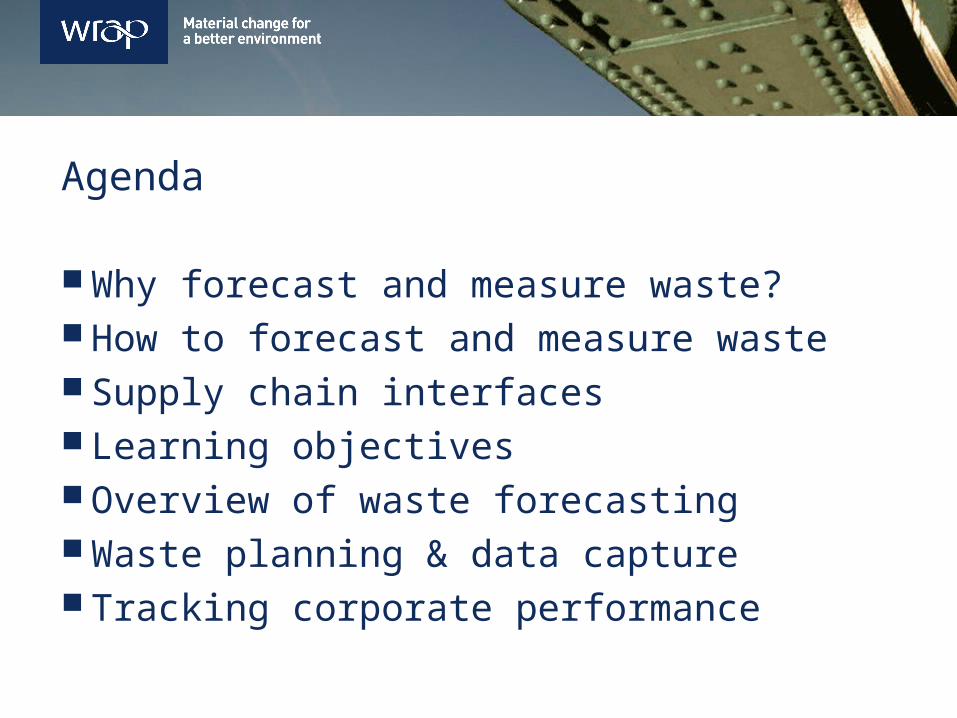
Agenda
Why forecast and measure waste? How to forecast and measure waste Supply chain interfaces Learning objectives Overview of waste forecasting Waste planning & data capture Tracking corporate performance

Why measure and forecast waste?
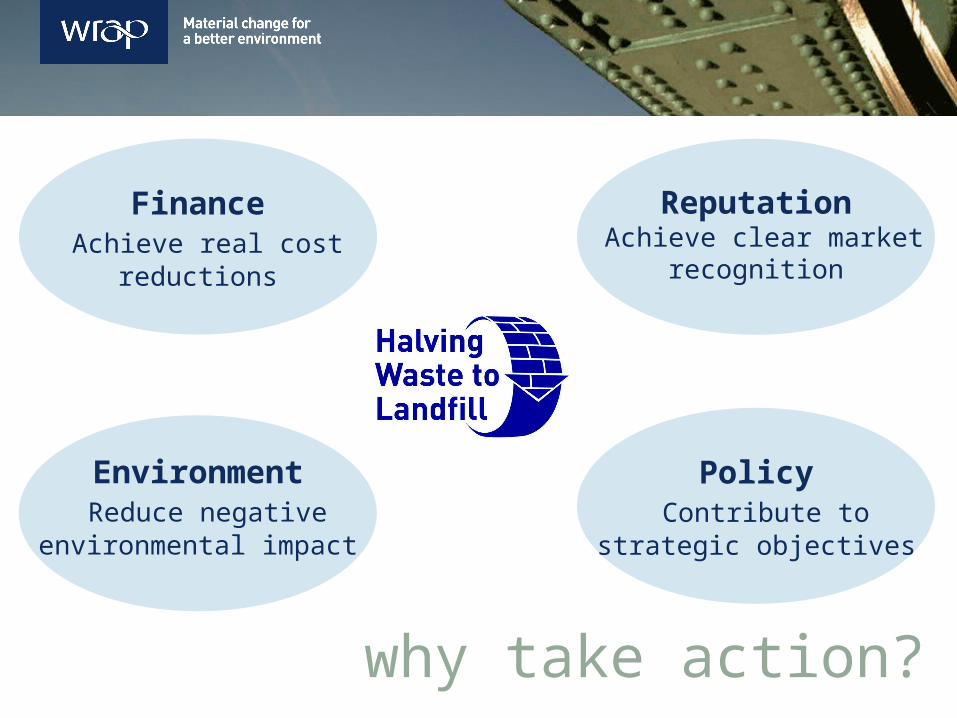
why take action?
Finance Achieve real cost
reductions
Reputation Achieve clear market
recognition
Environment Reduce negative
environmental impact
Policy Contribute to
strategic objectives
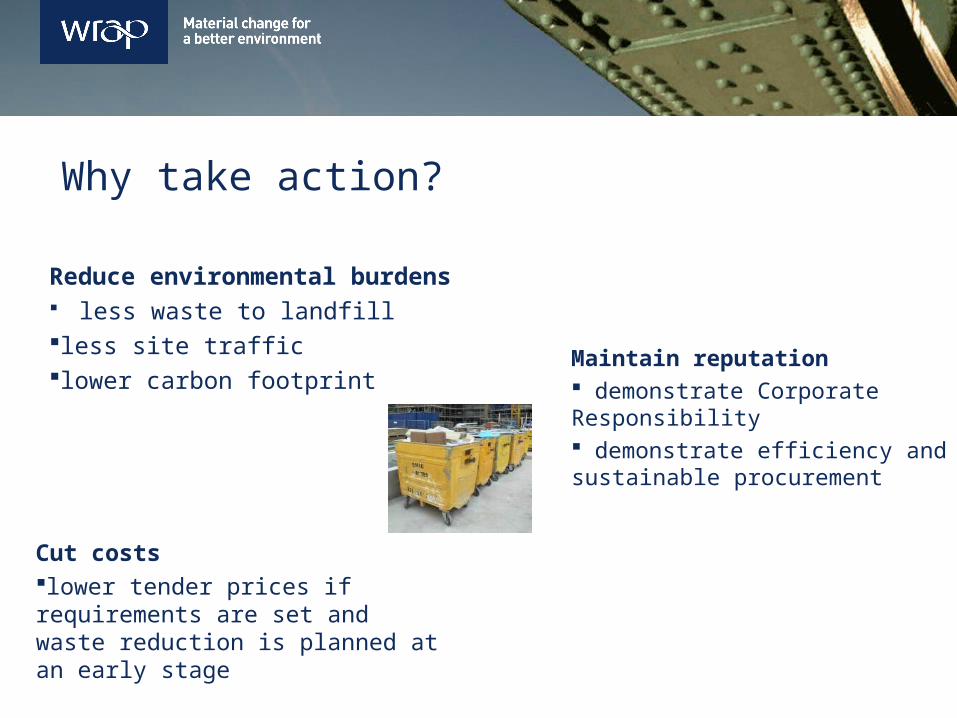
Why take action?
Reduce environmental burdens less waste to landfillless site trafficlower carbon footprint
Maintain reputation demonstrate Corporate Responsibility demonstrate efficiency and sustainable procurement
Cut costslower tender prices if requirements are set and waste reduction is planned at an early stage

Landfill tax escalator £8 landfill tax escalator extended to 2014 (active waste) non-active frozen at £2.50/t (2010/11) aggregate levy frozen at £2/t (2010/11) government considering further restrictions on landfilling
biodegradable waste and recyclable materials potential future landfill bans
2013 £72/tonne
2012 £64/tonne
2011 £56/tonne
2010 £48/tonne
2009 £40/tonne
2008 £32/tonne
2007 £24/tonne
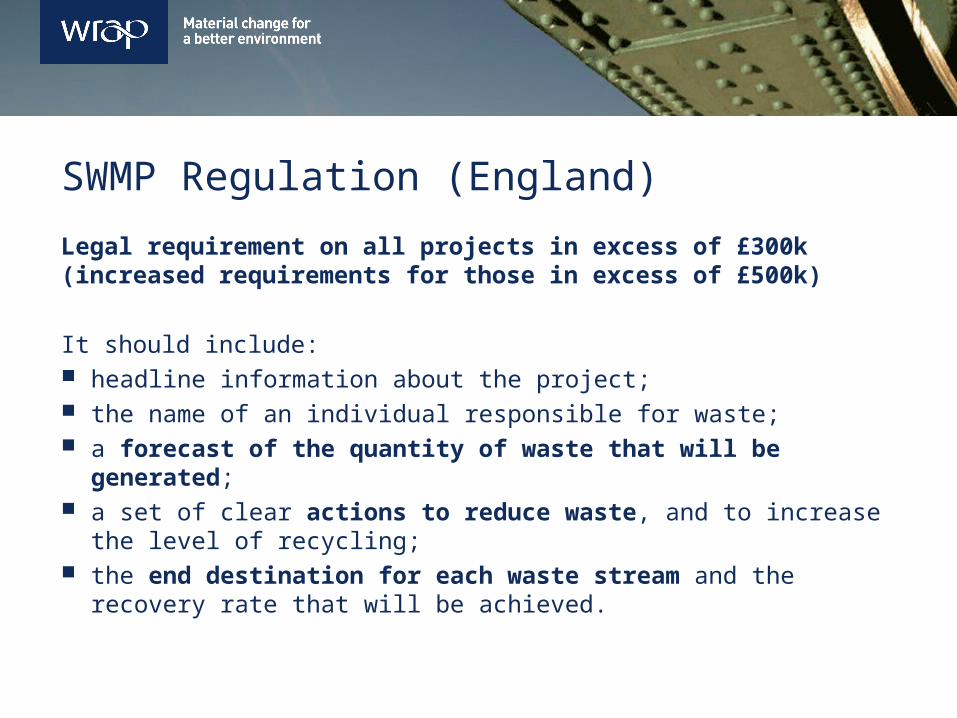
SWMP Regulation (England)
Legal requirement on all projects in excess of £300k (increased requirements for those in excess of £500k)
It should include: headline information about the project; the name of an individual responsible for waste; a forecast of the quantity of waste that will be generated; a set of clear actions to reduce waste, and to increase the level
of recycling; the end destination for each waste stream and the recovery
rate that will be achieved.
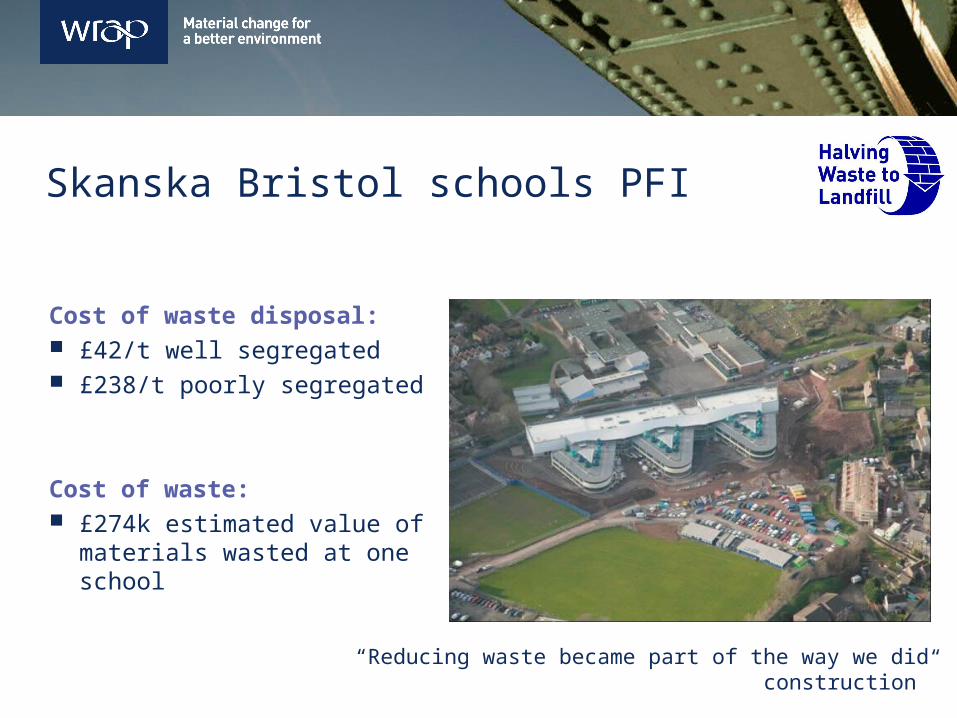
Skanska Bristol schools PFI
Cost of waste disposal: £42/t well segregated £238/t poorly segregated
Cost of waste: £274k estimated value of
materials wasted at one school
“Reducing waste became part of the way we did construction”
Waste and the supply chain

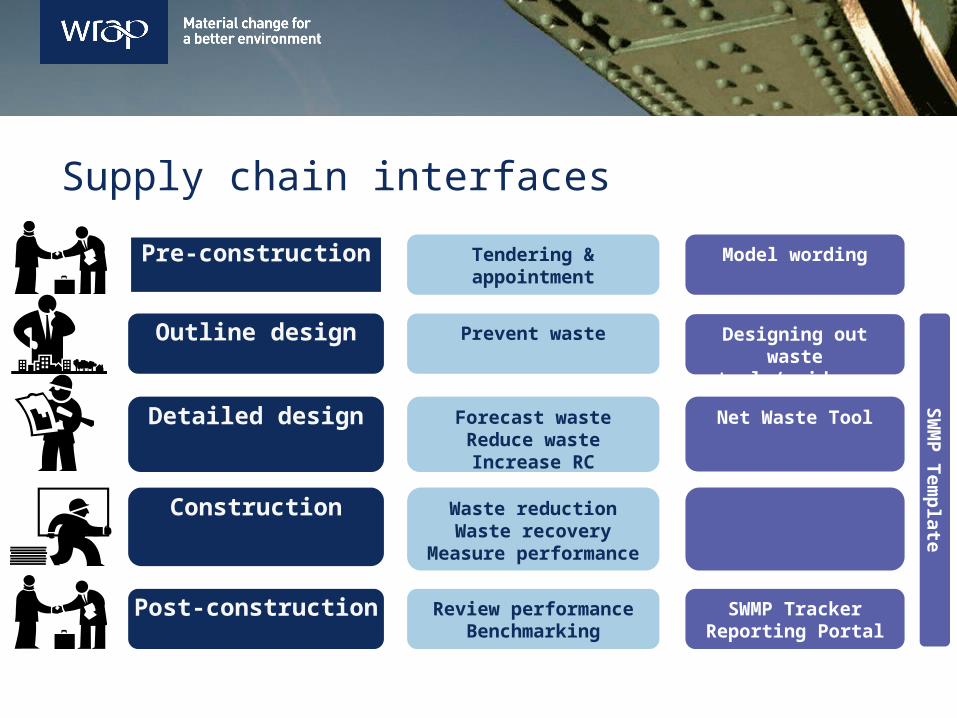
Supply chain interfaces
Pre-construction
Outline design
Detailed design
Construction
Post-construction
Tendering & appointment
Prevent waste
Forecast wasteReduce wasteIncrease RC
Waste reductionWaste recovery
Measure performance
Review performanceBenchmarking
Model wording
Net Waste Tool
Designing out waste
tools/guidance
SWMP TrackerReporting Portal
SW
MP
Tem
pla
te
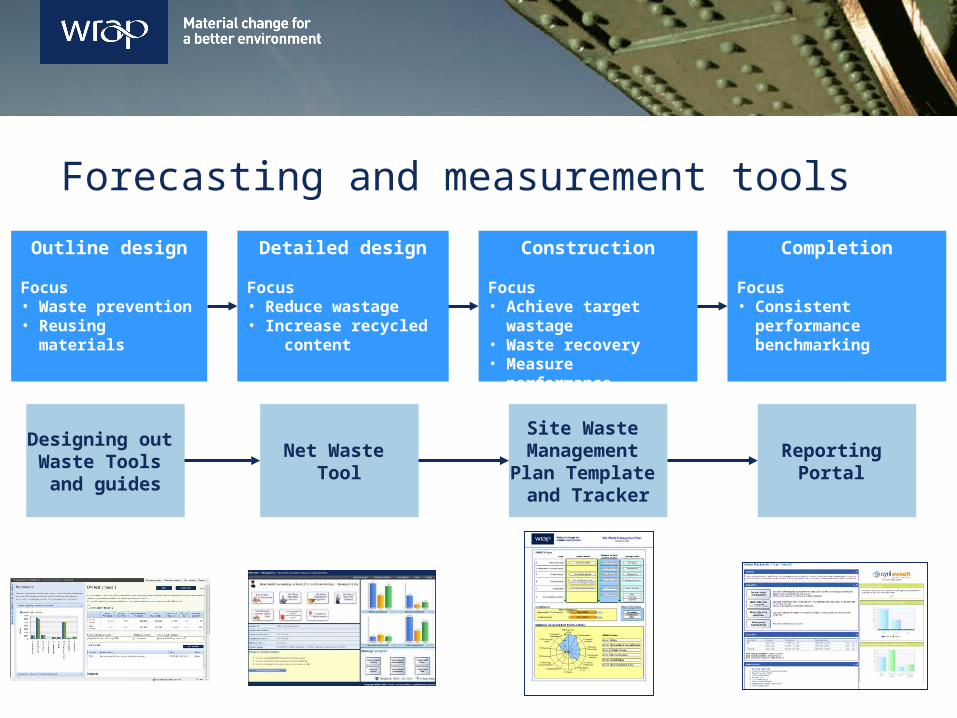
Forecasting and measurement tools
Outline design
Focus• Waste
prevention• Reusing
materials
Detailed design
Focus• Reduce wastage• Increase recycled
content
Construction
Focus• Achieve target
wastage• Waste recovery• Measure
performance
Completion
Focus• Consistent
performance benchmarking
Designing out Waste Tools and guides
Net Waste Tool
Site Waste Management
Plan Template and Tracker
Reporting Portal

What do you want to achieve today?

Overview of waste forecasting
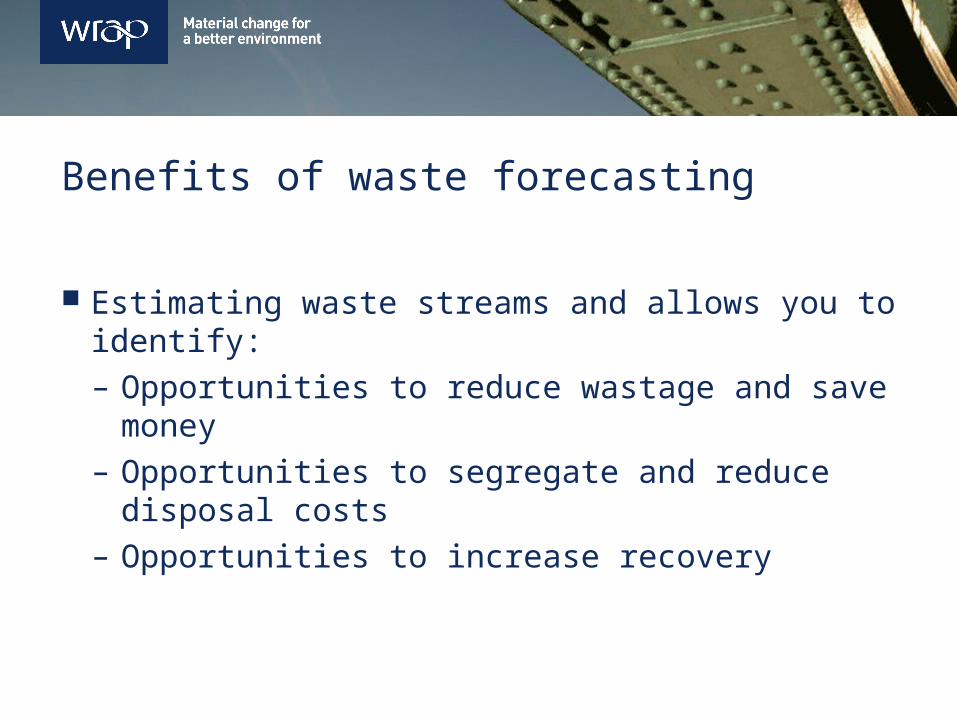
Benefits of waste forecasting
Estimating waste streams and allows you to identify:– Opportunities to reduce wastage and save
money– Opportunities to segregate and reduce disposal
costs– Opportunities to increase recovery
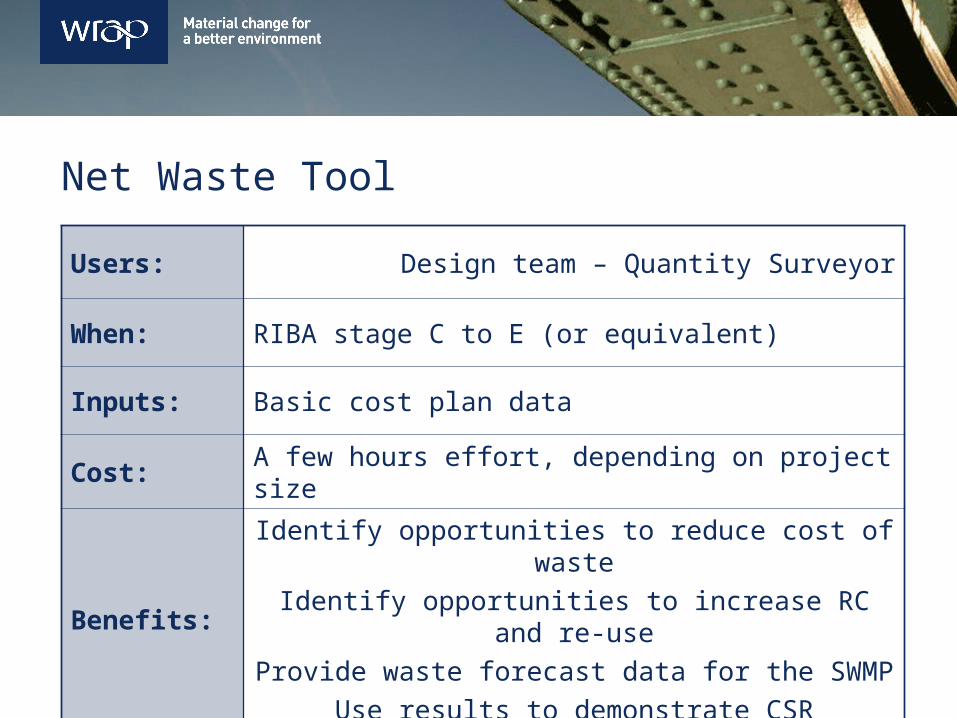
Net Waste Tool
Users: Design team – Quantity Surveyor
When: RIBA stage C to E (or equivalent)
Inputs: Basic cost plan data
Cost: A few hours effort, depending on project size
Benefits:
Identify opportunities to reduce cost of wasteIdentify opportunities to increase RC and re-use
Provide waste forecast data for the SWMPUse results to demonstrate CSR
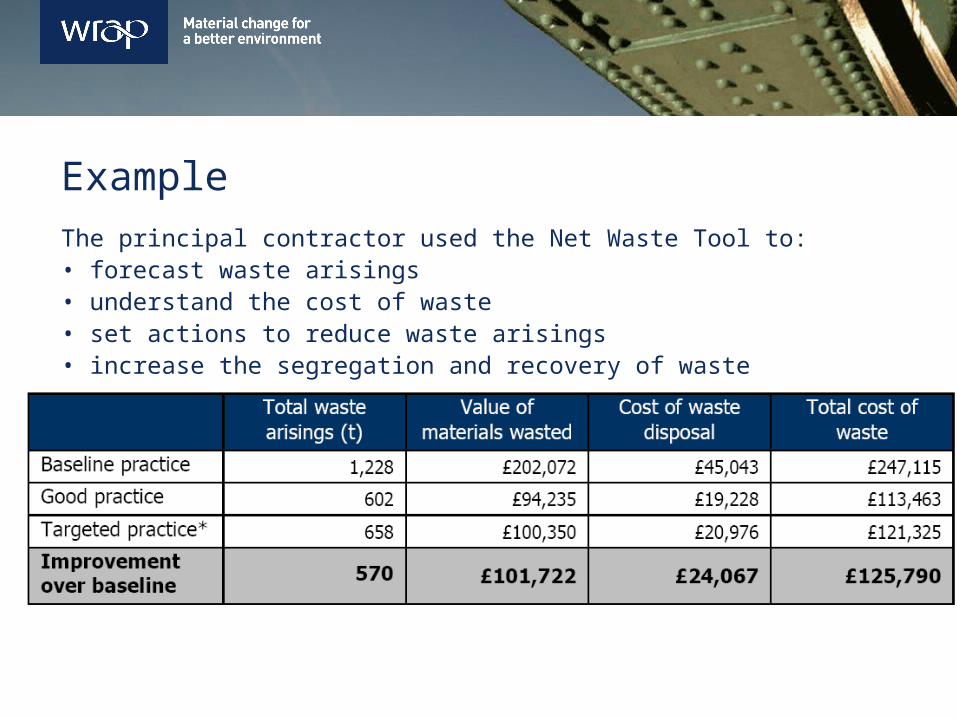
ExampleThe principal contractor used the Net Waste Tool to:• forecast waste arisings• understand the cost of waste• set actions to reduce waste arisings• increase the segregation and recovery of waste
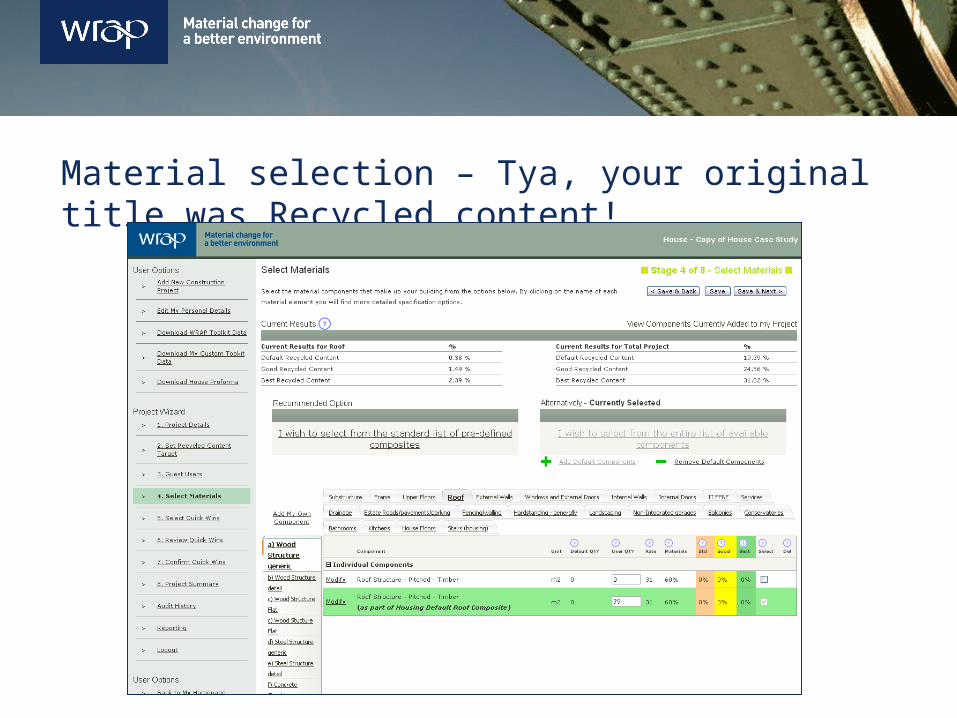
Material selection – Tya, your original title was Recycled content!
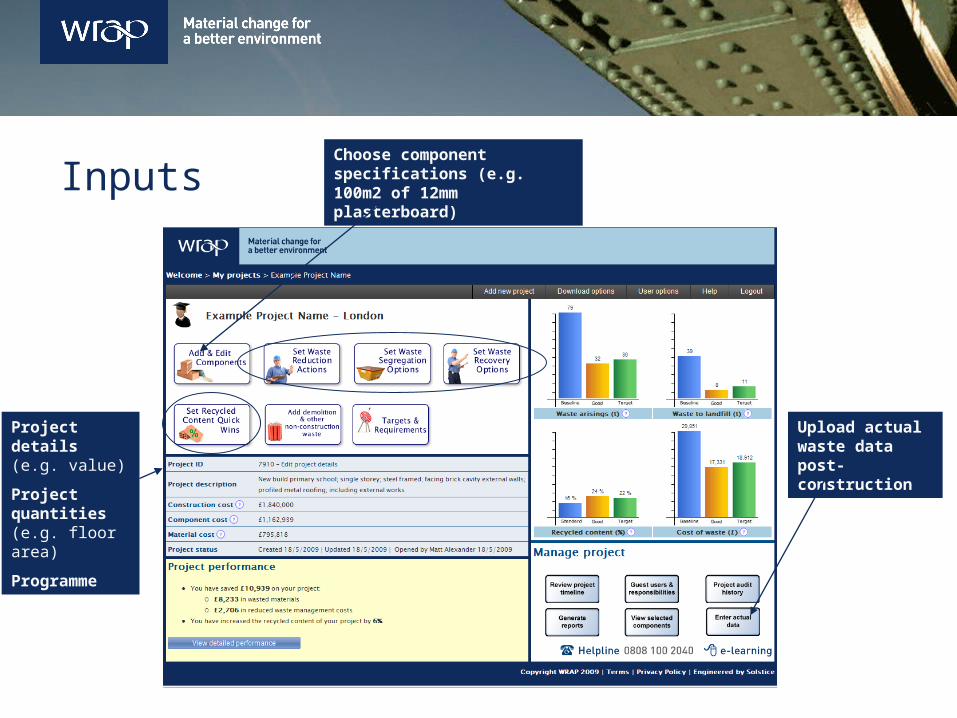
Inputs
Project details (e.g. value)
Project quantities (e.g. floor area)
Programme
Choose component specifications (e.g. 100m2 of 12mm plasterboard)
Upload actual waste data post-construction
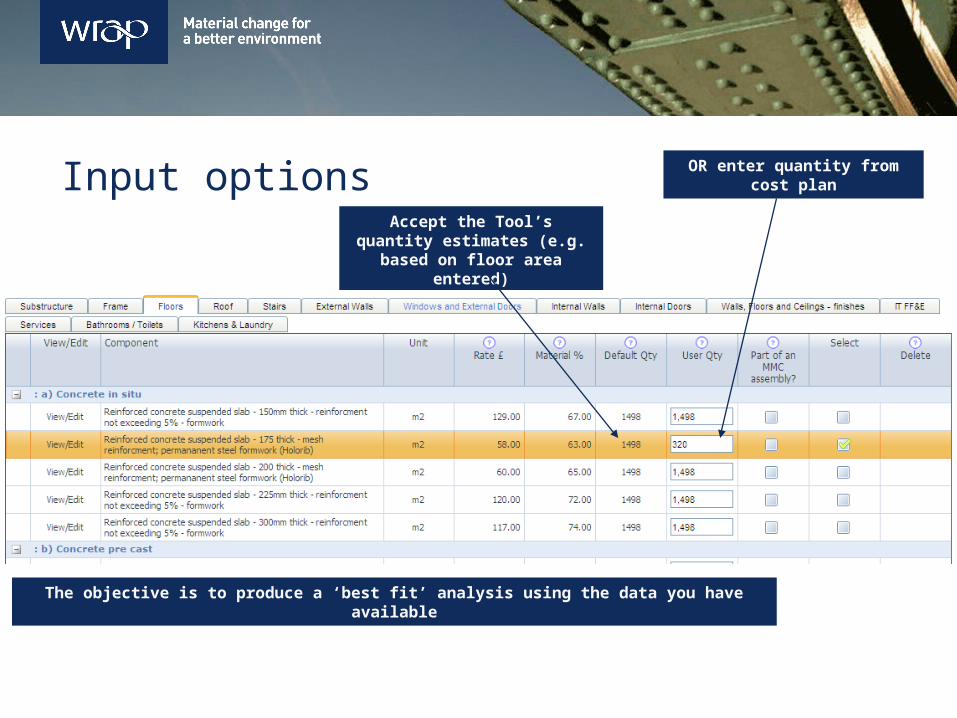
Input options OR enter quantity from cost plan
Accept the Tool’s quantity estimates (e.g. based on floor
area entered)
The objective is to produce a ‘best fit’ analysis using the data you have available
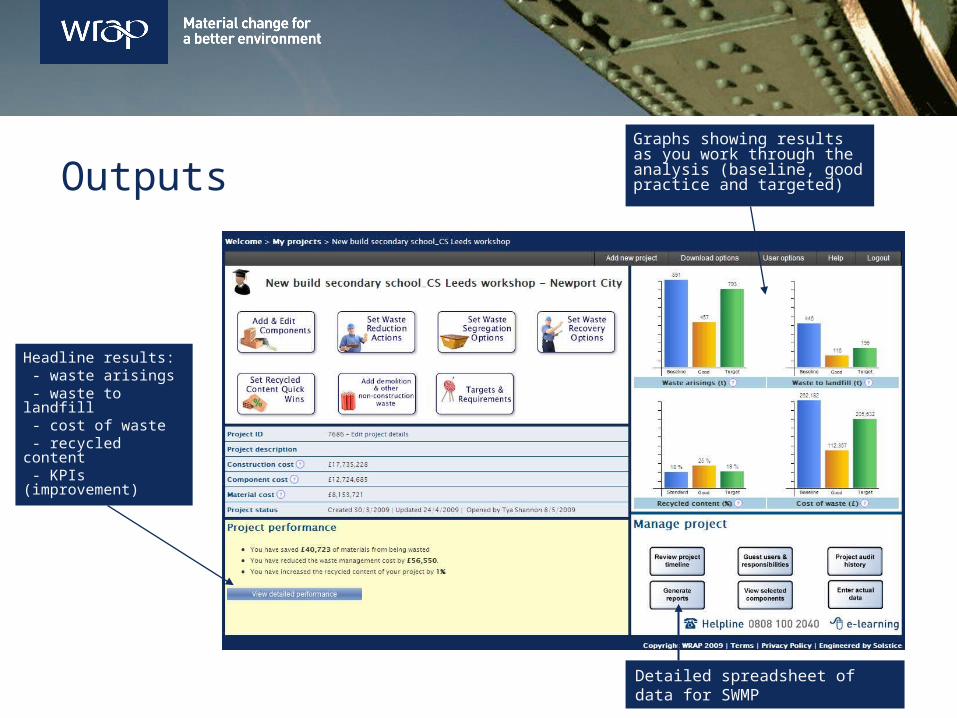
Outputs
Detailed spreadsheet of data for SWMP
Headline results: - waste arisings - waste to landfill - cost of waste - recycled content - KPIs (improvement)
Graphs showing results as you work through the analysis (baseline, good practice and targeted)
Net Waste Tool – hands on
Quick Quiz
• Does the NW Tool assess recycled content?
• What other outputs does the Tool provide?
• If you don’t have a cost plan, can you still use the Tool?
• What did the Net Waste Tool used to be called?
• Who should use the Tool and when?
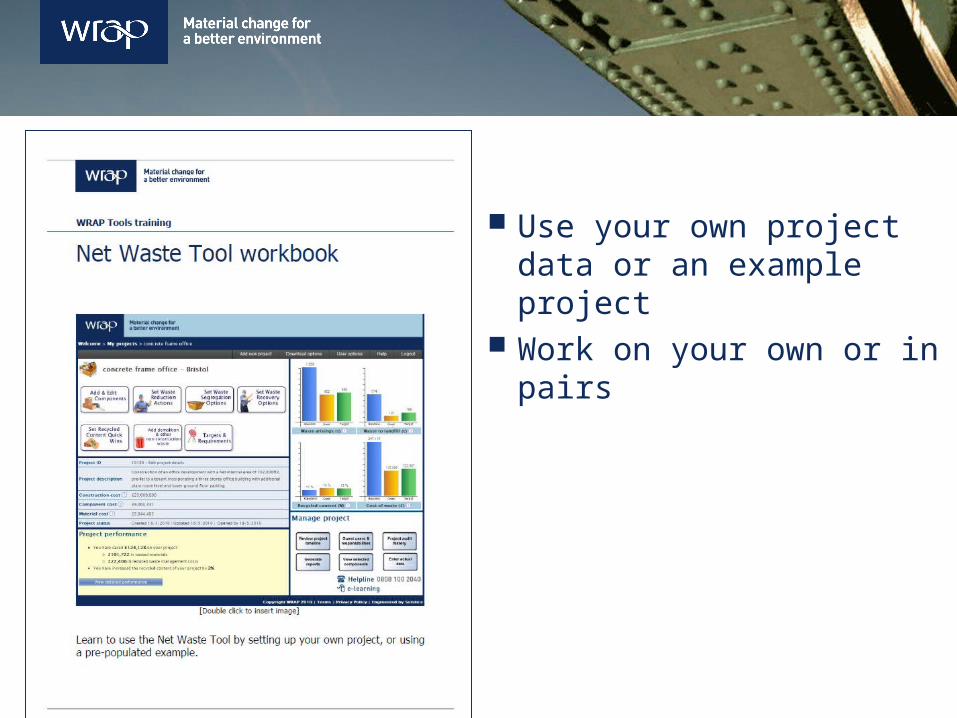
Use your own project data or an example project
Work on your own or in pairs
Access the tool at:
http://nwtool.wrap.org.uk/

Waste planning & data capture
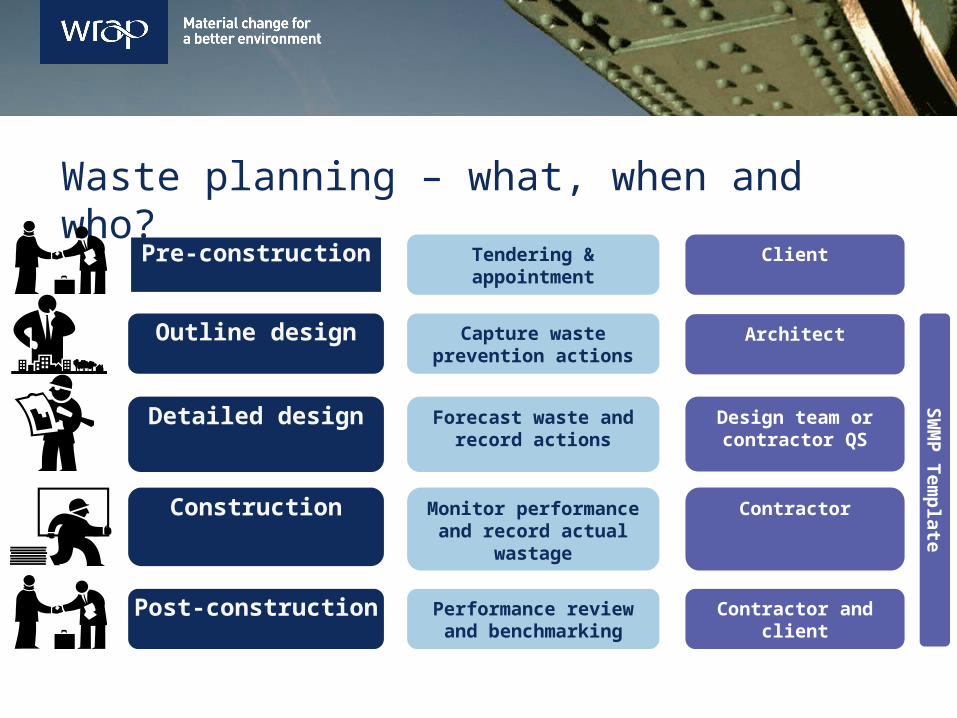
Waste planning – what, when and who?
Pre-construction
Outline design
Detailed design
Construction
Post-construction
Tendering & appointment
Capture waste prevention actions
Forecast waste andrecord actions
Monitor performance and record actual
wastage
Performance review and benchmarking
Client
Contractor
Design team or contractor QS
Architect
Contractor and client
SW
MP
Tem
pla
te

What issues do you face?
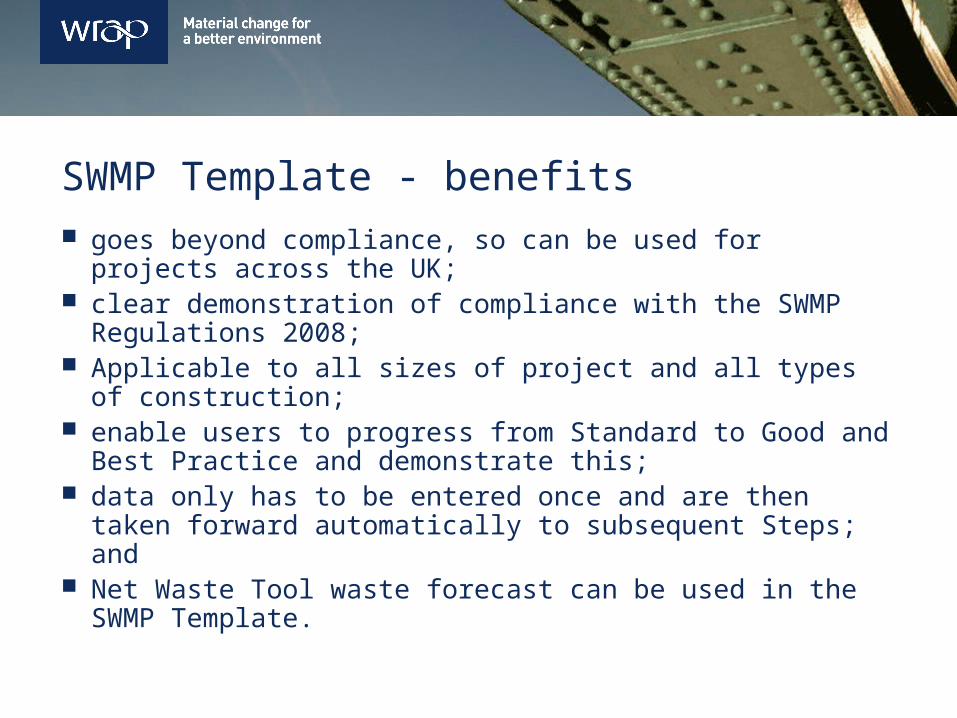
SWMP Template - benefits goes beyond compliance, so can be used for projects across
the UK; clear demonstration of compliance with the SWMP
Regulations 2008; Applicable to all sizes of project and all types of
construction; enable users to progress from Standard to Good and Best
Practice and demonstrate this; data only has to be entered once and are then taken
forward automatically to subsequent Steps; and Net Waste Tool waste forecast can be used in the SWMP
Template.
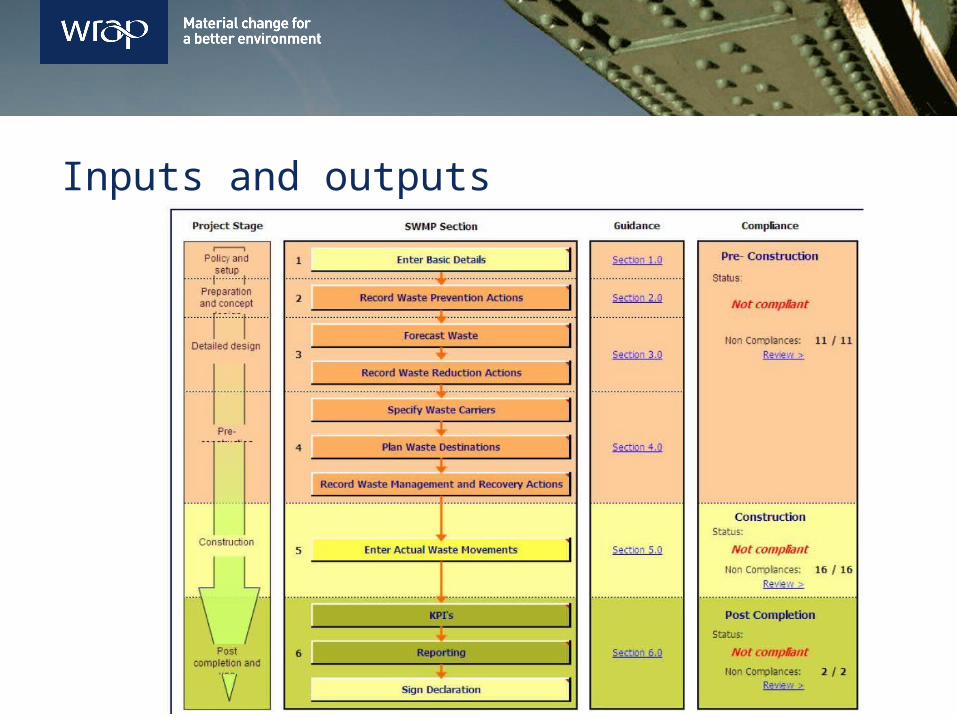
Inputs and outputs
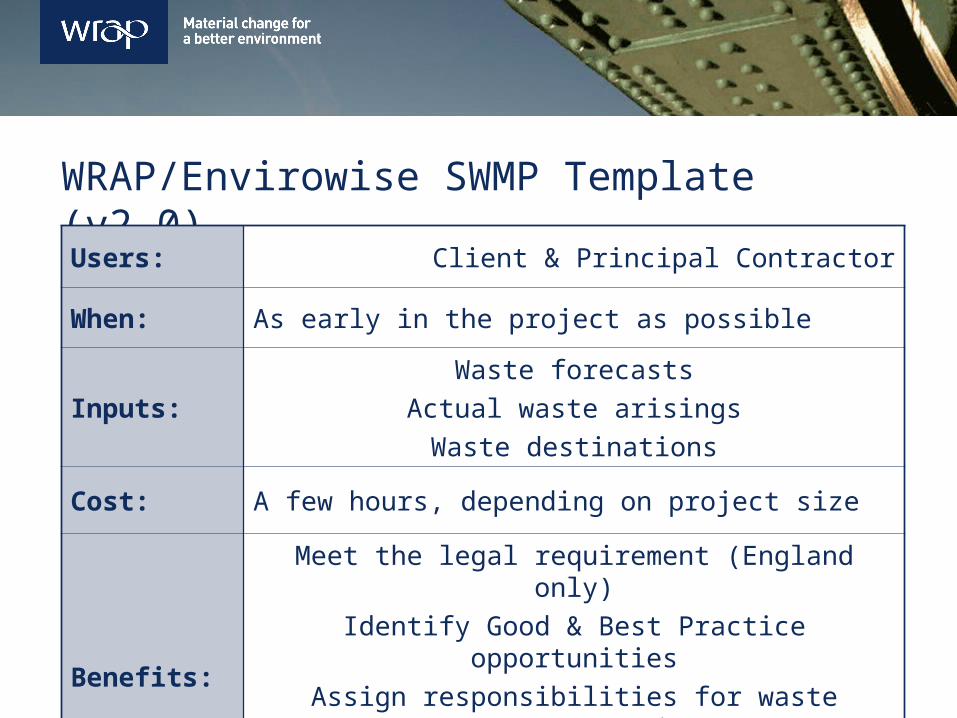
WRAP/Envirowise SWMP Template (v2.0)
Users: Client & Principal Contractor
When: As early in the project as possible
Inputs:Waste forecasts
Actual waste arisingsWaste destinations
Cost: A few hours, depending on project size
Benefits:
Meet the legal requirement (England only)Identify Good & Best Practice opportunities
Assign responsibilities for waste management actions
Identify areas for improvement & lessons learned
SWMP Template demonstration
www.wrap.org.uk/swmp
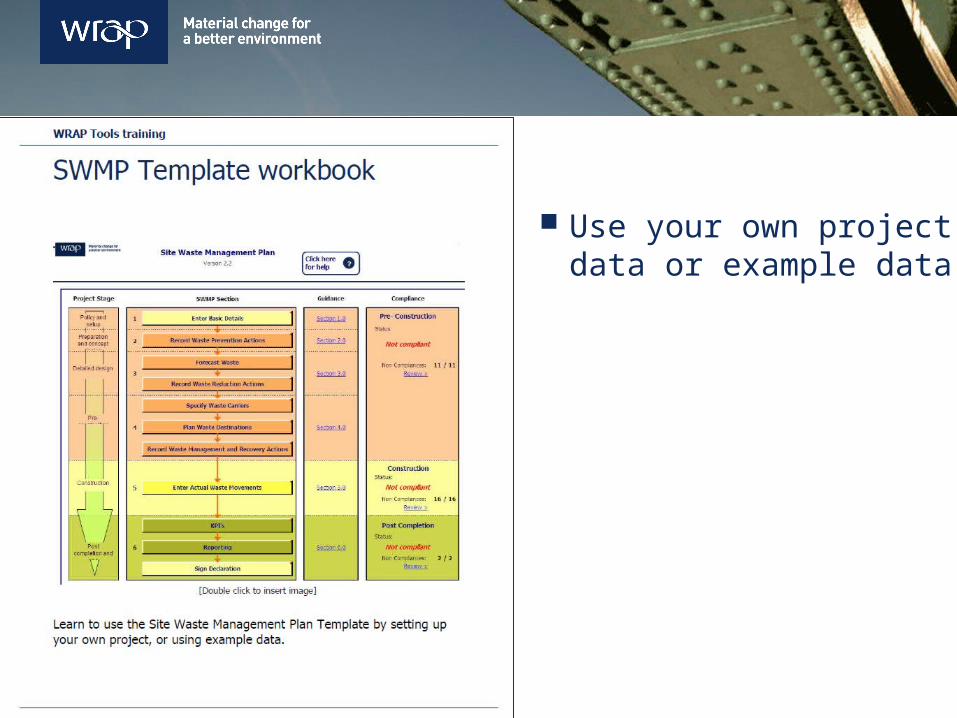
Use your own project data or example data
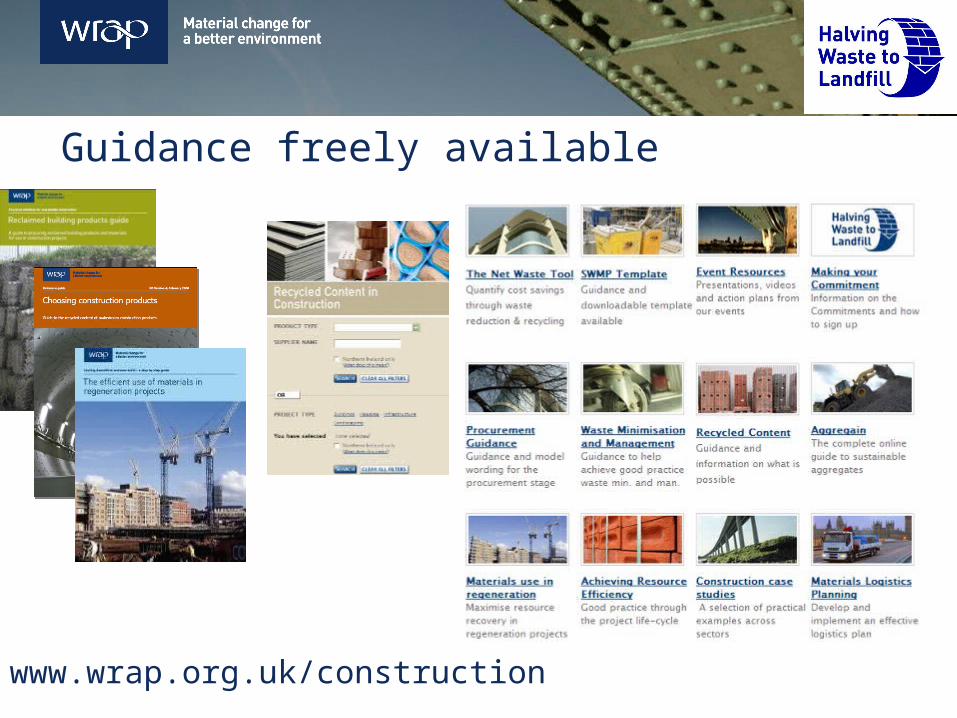
Guidance freely available
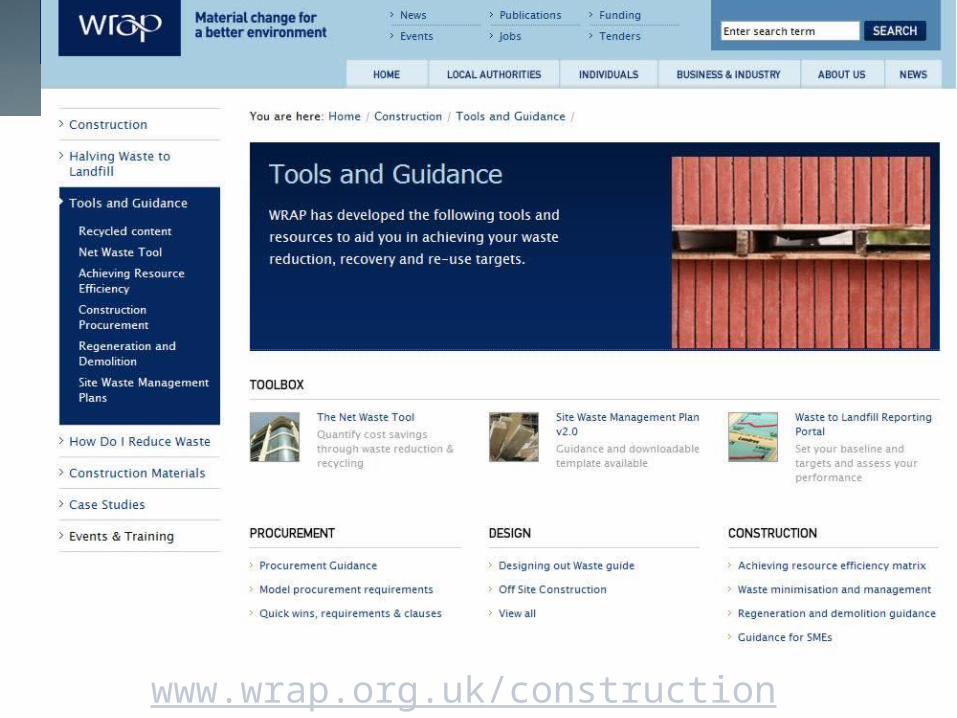
www.wrap.org.uk/construction
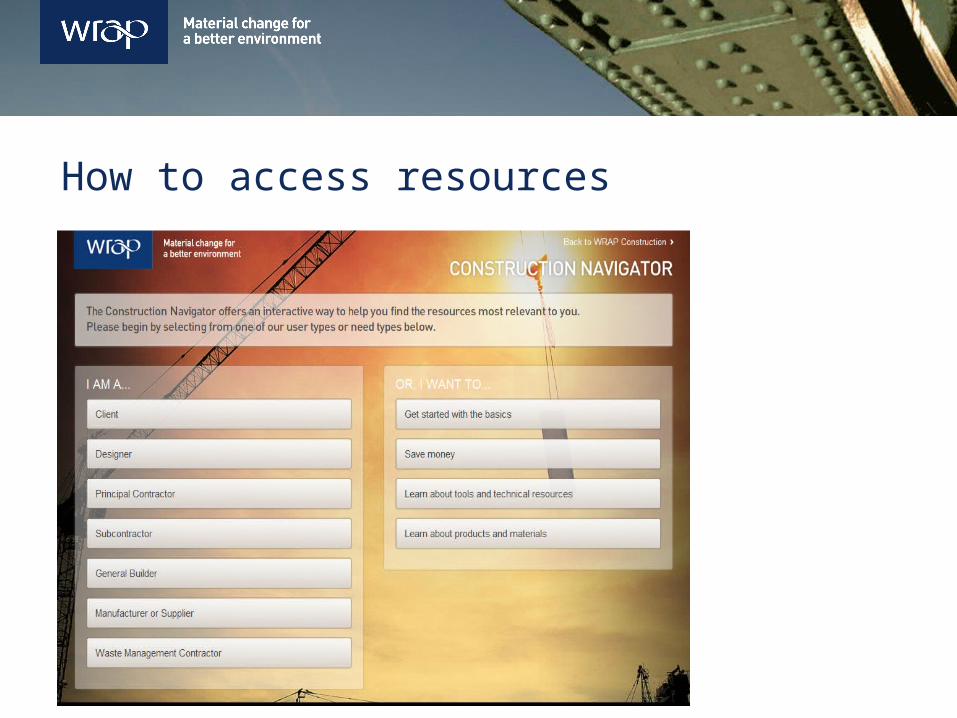
How to access resources

Tracking corporate performance
Supply chain interfaces
Pre-construction
Outline design
Detailed design
Construction
Post-construction
Tendering & appointment
Prevent waste
Forecast wasteReduce wasteIncrease RC
Waste reductionWaste recovery
Measure performance
Review performanceBenchmarking
Model wording
Net Waste Tool
Designing out waste
tools/guidance
SWMP TrackerReporting Portal
SW
MP
Tem
pla
te
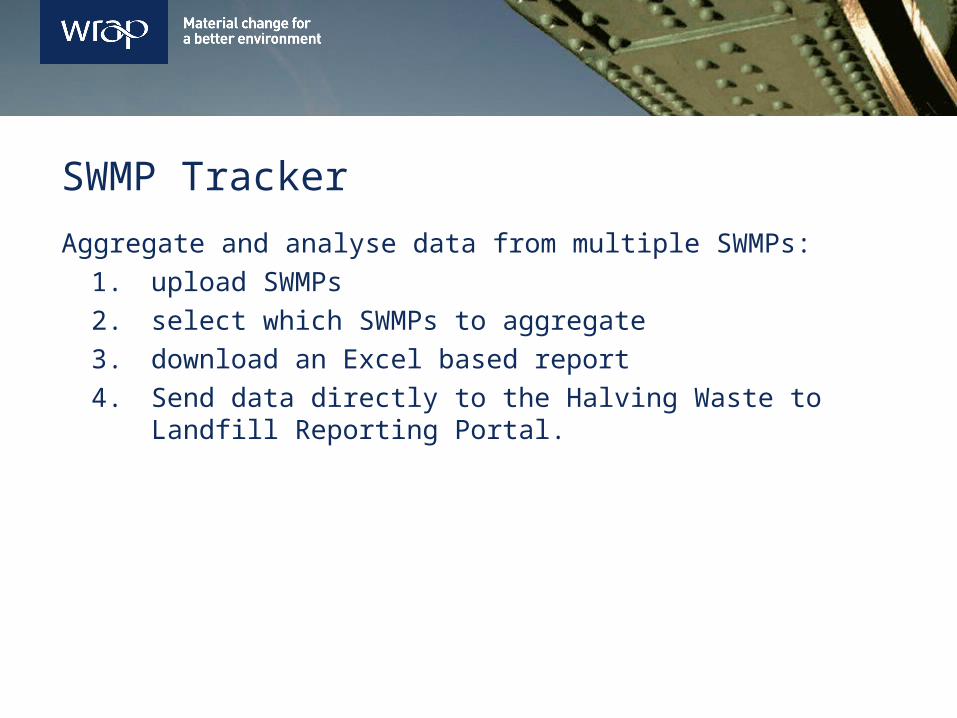
SWMP Tracker
Aggregate and analyse data from multiple SWMPs:1. upload SWMPs 2. select which SWMPs to aggregate 3. download an Excel based report 4. Send data directly to the Halving Waste to Landfill
Reporting Portal.
SWMP Tracker demonstration
www.wrap.org.uk/swmp

Insert a slide covering the reporting portal – just a link to say where it is. Hopefully most people will attend the later session so no need to cover in any detail.

Q&A
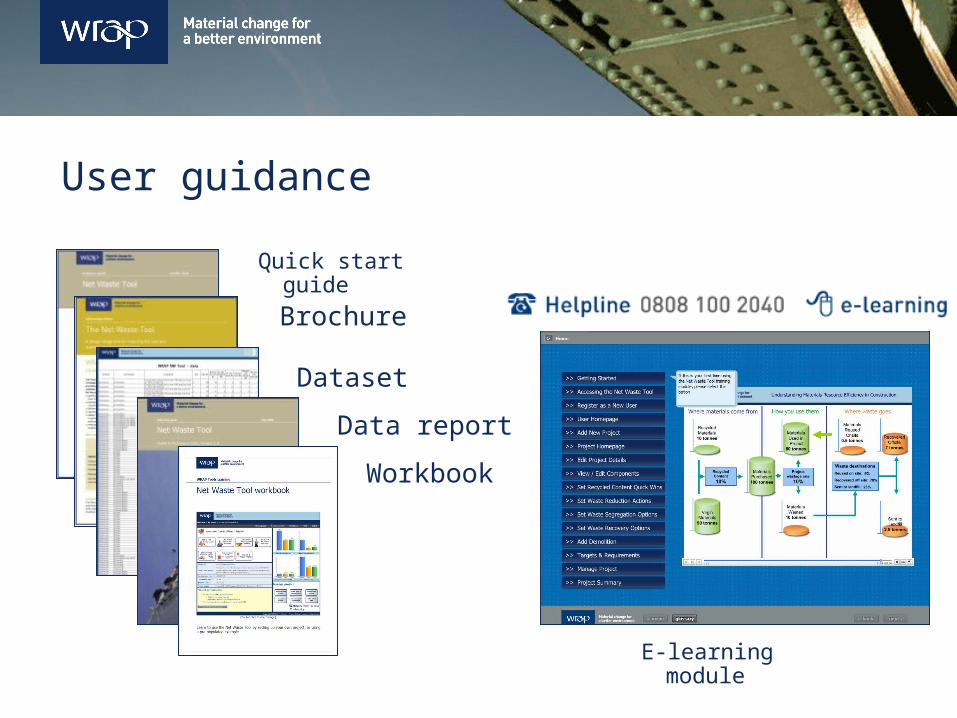
User guidance
E-learning module
Quick start guide
Brochure
Dataset
Data report
Workbook
www.wrap.org.uk/construction