waste - international facility management association
TRANSCRIPT
WASTE
A publicAtion of ifMA & tHE ifMA foundAtion | Vol.13 no.1
Sustainability How-to Guide
A Comprehensive Guide to Waste Stream Management
Bill Conley, IFMA Fellow, CFM, SFP, FMP, CFMJ, LEED AP
Sharon Jaye, D.Ed., SFP

AutHorsBill Conley, IFMA Fellow, CFM, SFP, FMP, CFMJ, LEED AP
Sharon Jaye, D.Ed., SFP
ExtErnAl rEViEwErsR. Charles Boelkins, Ph.D., Industrial Ecologist, Sustainability Division, Georgia Department of Natural Resources, Atlanta, Ga., USA
Laurie Gilmer, P.E., CFM, LEED AP, CxA, Associate, Facility Engineering Associates, P.C., Santa Rosa, Calif., USA
Gloria Hardegree, Executive Director, Georgia Recycling Coalition, Atlanta, Ga., USA
Cindy Jackson, Assistant Director, Office of Solid Waste Management & Recycling, Georgia Institute of Technology, Atlanta, Ga., USA
Maria Lazaruk, Senior Public Relations Compliance Manager, CR&R Inc., Orange County, Calif., USA
Dan Loudermilk, P.E., Sustainable Systems Engineer, Sustainability Division, Georgia Department of Natural Resources, Atlanta, Ga., USA
A publicAtion of ifMA & tHE ifMA foundAtion | Vol. 13 no. 1
Sustainability How-to Guide
WASTEA Comprehensive Guide to Waste Stream Management

Page 3IFMA SUSTAINABILITY HOW-TO GUIDE WASTE STREAM MANAGEMENT
SuStainability ElEmEntS and How-to GuidE intErSEctionS
Guide Water EnergyMaterials & Resources
Workplace Management
Indoor Environmental Quality (IEQ)
Quality of Services
Waste Site Impact
Getting Started
EPa Energy Star Portfolio manager
Food Service
no cost/low cost Energy
lighting
landscaping
water
Green building rating
data centers
Global Green cleaning
commissioning Existing buildings
u.S. Gov’t. Policy impacts & opportunities
carbon
waste
Page 4IFMA SUSTAINABILITY HOW-TO GUIDE WASTE STREAM MANAGEMENT
About the Authors . . . . . . . . . . . . . . . . . . . . . . . . . . . . . . . . . . . . . . . . . . . . . . . . . . . 5Acknowledgements . . . . . . . . . . . . . . . . . . . . . . . . . . . . . . . . . . . . . . . . . . . . . . . . . 5Foreword . . . . . . . . . . . . . . . . . . . . . . . . . . . . . . . . . . . . . . . . . . . . . . . . . . . . . . . . . . . . 6
Part 1: Executive Summary . . . . . . . . . . . . . . . . . . . . . . . . . . . . . . . . . . . . . . . . . . 7
Part 2: Introduction 2.1 Background . . . . . . . . . . . . . . . . . . . . . . . . . . . . . . . . . . . . . . . . . . . . . . . . . . 8 2.2 Resource Management . . . . . . . . . . . . . . . . . . . . . . . . . . . . . . . . . . . . . . 8
Part 3: Detailed Findings 3.1 Waste Stream Management . . . . . . . . . . . . . . . . . . . . . . . . . . . . . . . . . . 9 3.1.1 Waste Stream Management Plan . . . . . . . . . . . . . . . . . . . . . . . 9 3.1.2 Zero Waste . . . . . . . . . . . . . . . . . . . . . . . . . . . . . . . . . . . . . . . . . . . . 11 3.1.3 Waste Audit . . . . . . . . . . . . . . . . . . . . . . . . . . . . . . . . . . . . . . . . . . . 12 3.1.4 Tracking and Documentation . . . . . . . . . . . . . . . . . . . . . . . . . 14 3.1.5 Education . . . . . . . . . . . . . . . . . . . . . . . . . . . . . . . . . . . . . . . . . . . . . . 153.2 Reduction Strategies . . . . . . . . . . . . . . . . . . . . . . . . . . . . . . . . . . . . . . . . 17 3.2.1 Environmentally Preferred Purchasing . . . . . . . . . . . . . . . 17 3.2.2 Life Cycle Assessment . . . . . . . . . . . . . . . . . . . . . . . . . . . . . . . . . 213.3 Reuse Strategies . . . . . . . . . . . . . . . . . . . . . . . . . . . . . . . . . . . . . . . . . . . . . 233.4 Diversion Strategies . . . . . . . . . . . . . . . . . . . . . . . . . . . . . . . . . . . . . . . . . 23 3.4.1 Recycling. . . . . . . . . . . . . . . . . . . . . . . . . . . . . . . . . . . . . . . . . . . . . . 24 3.4.2 Organic Materials . . . . . . . . . . . . . . . . . . . . . . . . . . . . . . . . . . . . . 26 3.4.3 Electronic Scrap . . . . . . . . . . . . . . . . . . . . . . . . . . . . . . . . . . . . . . . 28 3.4.4 Document Destruction . . . . . . . . . . . . . . . . . . . . . . . . . . . . . . . . 29 3.4.5 Construction Debris . . . . . . . . . . . . . . . . . . . . . . . . . . . . . . . . . . . 31 3.4.6 Hazardous Materials . . . . . . . . . . . . . . . . . . . . . . . . . . . . . . . . . . 363.5 Energy Recovery Strategies . . . . . . . . . . . . . . . . . . . . . . . . . . . . . . . . . 37 3.5.1 Incineration . . . . . . . . . . . . . . . . . . . . . . . . . . . . . . . . . . . . . . . . . . . 38 3.5.2 Digestion Technologies . . . . . . . . . . . . . . . . . . . . . . . . . . . . . . . . 39 3.5.3 Pyrolysis and Gasification . . . . . . . . . . . . . . . . . . . . . . . . . . . . . 403.6 Disposal . . . . . . . . . . . . . . . . . . . . . . . . . . . . . . . . . . . . . . . . . . . . . . . . . . . . 41
Part 4: Making the Business Case . . . . . . . . . . . . . . . . . . . . . . . . . . . . . . . . . . . 43
Part 5: Case Studies 5.1 Case Study #1 . . . . . . . . . . . . . . . . . . . . . . . . . . . . . . . . . . . . . . . . . . . . . . . . 45 5.2 Case Study #2 . . . . . . . . . . . . . . . . . . . . . . . . . . . . . . . . . . . . . . . . . . . . . . . 46 5.3 Case Study #3 . . . . . . . . . . . . . . . . . . . . . . . . . . . . . . . . . . . . . . . . . . . . . . . 48 5.4 Case Study #4 . . . . . . . . . . . . . . . . . . . . . . . . . . . . . . . . . . . . . . . . . . . . . . . 51
Part 6: Appendices Appendix A: References . . . . . . . . . . . . . . . . . . . . . . . . . . . . . . . . . . . . . . . . . . . . 56Appendix B: Waste Management Historical Timeline . . . . . . . . . . . . . . . 57Appendix C: Fun Facts for Educational Programs . . . . . . . . . . . . . . . . . . . 59Appendix D: Glossary . . . . . . . . . . . . . . . . . . . . . . . . . . . . . . . . . . . . . . . . . . . . . . 61
Waste Stream Management

Page 5IFMA SUSTAINABILITY HOW-TO GUIDE WASTE STREAM MANAGEMENT
Editor-at-Large: Sharon Jaye, D.Ed., SFP
Creative Director: Marina Badoian-Kriticos, IFMA
Copy Editor: Erin Sevitz, IFMAEmily Mills, IFMAHeather Wiederhoeft, IFMA
Graphic Designer: Michelle Long
Sponsorship information: Marina Badoian-Kriticos +1.281.974.5676 [email protected]
-----------------------------------------------------------
Questions or comments? Drop us a line at [email protected].
-----------------------------------------------------------
The Sustainability How-to Guides are published on an ongoing basis and are free of charge.All rights reserved. No part of this publication may be reprinted or otherwise reproduced without written permission from the publisher. IFMA, 800 Gessner, Suite 900, Houston, Texas 77024.
Published by:
Waste Stream Management
About tHE AutHorsBill Conley, IFMA Fellow, CFM, SFP, FMP, CFMJ, LEED AP
Bill Conley has more than 35 years of experience in facility management. He has managed facilities for VeriFone, Hewlett-Packard and SCAN Health Plan, and has served as managing director of the LEED®/Sustainability Develop-ment Group for Pacific Building Care (PBC). He is past president of the Orange County (U.S.) Chapter of IFMA as well as the Facility Management Consultants Council and has served on the IFMA board of directors. He is a director on the board of OC IFMA and is a member of IFMA’s sustainability committee. He cur-rently practices as a facility management/sustainability consultant through his own company, CFM2.
Sharon Jaye, D.Ed., SFP
Sharon Jaye is the Director of Sustainability at the New York City Department of Education Division of School Facilities. She has a bachelor’s degree inbusiness administration from Clayton State University, a master’s degree in project management from the University of Wisconsin Platteville and a doctorate of education in educational leadership from Argosy University. She holds Sustainability Facility Professional accreditation through IFMA and currently serves on IFMA’s sustainability committee.
AcknowlEdgEMEntsThe authors would like to express their gratitude to Maria Lazaruk with CR&RInc., Chuck Boelkins and Dan Loudermilk with the Georgia Department ofNatural Resources Sustainability Division, Cindy Jackson with the GeorgiaInstitute of Technology, and Gloria Hardegree with the Georgia RecyclingCoalition for reviewing the article and lending their expertise as subjectmatter experts and external reviewers. Acknowledgement also is given toSusan Kidd and Justine Schwartz for the Agnes Scott College case study,Stephanie Busch and Susan Wood for the Georgia Department of NaturalResources case study and Laurie Gilmer with Facility Engineering Associatesfor the corporate case study.

Page 6IFMA SUSTAINABILITY HOW-TO GUIDE WASTE STREAM MANAGEMENT
Waste Stream Management
forEword
It is no secret that a focused, well-defined sustainability strategy is beneficial to an organization’s bottom line, whether it is a federal, private-sector, military or nonprofit entity. Sustainable practices are not only the right thing to do for the environment, but they also benefit the communities in which they are implemented.
One of the many steps that can be taken in an organization to enhance its sustainable practices is keeping a close eye on resource and waste management. The process and philosophy that are endemic to this practice ref lect the precepts of the triple bottom line of people, planet and profit. Maintaining controls and measuring the material inputs and outputs of a facility will lead to financial savings, and reduce impact on the physical environment while providing leadership in best practices that can be replicated in the community.
Sustainability is all around us. Federal, state and local governments are increasingly applying regulatory constraints on design, construction and facility operations standards. Employees expect their employers to act responsibly and vice versa. Going green is no longer a fad or a trend, but a course of action for individuals and businesses alike to benefit the triple bottom line.
Today’s facility manager needs to be able to clearly communicate the benefits and positive economic impact of sustainability and energy-efficient practices, not only to the public, but also to the C-suite. While there is a dramatic need for each of us — and our organizations — to care for the environment, it is just as important that we convey to executives and stakeholders how these initiatives can benefit our company’s financial success.
This document in your hands is the result of a partnership between the IFMA Foundation and the IFMA sustainability committee, each working to fulfill the shared goal of furthering sustainability knowledge. Conducting research like this provides both IFMA and the Foundation with great insight into what each can do as an organization to assist the facility management community at large.
It is my hope that you, as a facility professional, will join us in our mission of furthering sustainable practices. This resource is a good place to start.
Tony Keane, CAEPresident International Facility Management Association

Page 7IFMA SUSTAINABILITY HOW-TO GUIDE WASTE STREAM MANAGEMENT
Part 1ExEcutiVE suMMAryIn common terms, the word “waste” engenders the thought of trash; that which is thrown out. However, in the broader sense of the word, time, material and money also can also be wasted. Part of the definition of the word waste, as a transitive verb, is “To use or expend thoughtlessly, uselessly or without return; to squander.” This can be translated loosely as the useless consumption or expenditure of resources.
The purpose of this guide is to introduce waste stream management and resource management as two related areas of sustainability that are generally overlooked. The industry focus on energy consumption, greenhouse gas (GHG) emissions and water conservation sometimes overshadows the impact that facility managers have on the economy, the land and nature itself due to practices involving the purchase, use and disposal of materials.
This guide covers the use of resources from harvest through manufacture/production, transportation, use and disposal of materials. It discusses environmentally preferred purchasing programs, life cycle assessment and various disposal methods. It explains rapidly renewable resources, embedded energy, virtual water, package design, the affect of materials on indoor environmental quality, recycling, document destruction and landfills. It focuses on the four “Rs” — reduce, reuse, recycle and rethink — in managing resources and the waste products derived from them. Finally, the guide will show how managing resources throughout a product’s life cycle will save time and money.
The PurPose of This guide is To inTroduce wasTe sTream managemenT and resource managemenT as Two relaTed areas of susTainabiliTy ThaT are generally overlooked.
Sustainability How-to Guide
wAstE

Page 8IFMA SUSTAINABILITY HOW-TO GUIDE WASTE STREAM MANAGEMENT
a tHorouGHly EFFEctivE SyStEm oF waStE manaGEmEnt may nEEd an EntirEly nEw way oF lookinG at waStE.
Part 2introduction
2.1 Background
For the purpose of this guide, the term waste management will be applied to the discussion of the collection, transport, processing, monitoring, recycling and disposal of waste materials, which could take the form of solid, liquid, gaseous or radioactive substances. The term relates to materials produced by human activity, and how waste management generally is undertaken to reduce its effect on health, the environment or aesthetics. Waste management also is carried out to recover resources; capturing reusable materials and introducing them back into the product stream is an integral part of waste stream management. The term resource management encompasses the broader view of materials and resources as they enter and exit the waste stream.
The waste hierarchy refers to the four Rs — reduce, reuse, recycle and rethink — which classify waste management strategies according to their desirability. Waste management experts recently have incorporated the fourth R, rethink, with the implied meaning that the present system may have fundamental f laws, and that a thoroughly effective system of waste management may need an entirely new way of looking at waste. The waste hierarchy has taken many forms over the past decade, but the basic concept has remained the cornerstone of most minimization strategies. The aim of the hierarchy is to extract the maximum practical benefits from products and to generate a minimum amount of waste.
2.2 Resource Management
The focus of 21st-century facility managers needs to be on resource management and sustainability for future generations. Integrated resource management involves the design and implementation of management practices, taking into consideration the effects and benefits of all resources, such that the goals of a sustainability action plan are achieved over time and across the enterprise. The plan is comprised of decision making concerned with the allocation and conservation of natural resources. The main emphases are on an understanding of the processes involved in the exploitation of resources; the analysis of the allocation of resources; the development and evaluation of management strategies in resource allocation; and the proper utilization of these resources once their intended purpose has been fulfilled. It is a cross-disciplinary study, concerned with the complex relationships which govern resource exploitation, allocation, use and post-use. Sustainable development and environmental protection are major goals of a resource management approach and the concept encompasses waste stream management as one of its components.
Incumbent in this practice is the transition of the four Rs of waste management to the four Es of resource management: efficiency, economics, environment and ethics. Efficiency is doing the best possible job with the resources at hand and/or easily accessible with the understanding that waste is the visible face of inefficiency. Economics assumes that less waste is more efficient and that efficiency saves money, materials and energy. Environmental impacts relate to the preservation of natural resources as well

Page 9IFMA SUSTAINABILITY HOW-TO GUIDE WASTE STREAM MANAGEMENT
as to the minimization of the negative effects of landfills. Ethics ties in to the attempt to harmonize business with community interests, whether those community interests are local or global. Not only do people need to belong to a community, but industries, companies and corporations need to belong as well. Businesses need to take root in the ecology of commerce and that process will create new jobs, which will be necessary to develop better designers and better organizers. Waste is not a high-tech problem, it is a low-tech problem. It’s not magic machines; it is better design, better organization, better education, both at the facility and corporate levels.
wasTe sTream managemenT is The ongoing Process of Tracking whaT comes inTo a faciliTy, where iT comes from and, subsequenTly, whaT leaves The faciliTy and where iT goes. Part 3
dEtAilEd findings
3.1 Waste Stream Management
Waste stream management is the ongoing process of tracking what comes into a facility, where it comes from and, subsequently, what leaves the facility and where it goes. When designing a waste stream management plan, consideration must be given to the impact of materials on the environment. Waste stream management entails source reduction, purchasing locally, reuse strategies, diversion from landfills, energy recovery and the tracking and documentation of these activities.
Handling these activities responsibly through planning and operations will benefit an organization in numerous ways. Managing waste effectively will save money, as the practice affects both what is purchased and how much of a product stays in-house while reducing costs and fees. The process minimizes harmful impacts on the environment, through both the use of rapidly renewable resources and a reduced quantity of materials sent to landfills. It also improves the perception of a company as a good corporate citizen.
3.1.1 Waste Stream Management Plan
The focus of a waste stream management plan, just like any other type of sustainability plan, is to measure, set goals, reduce and report. Several of these steps will be expanded upon in this guide.

Page 10IFMA SUSTAINABILITY HOW-TO GUIDE WASTE STREAM MANAGEMENT
Table 1: WasTe sTream managemenT Plan ComPonenTs
� Understand the waste streams. Understand all regulatory considerations — who is responsible for each, how is each handled, what the policies and procedures are and who the waste haulers are.
� Measure current waste generation. An important first step in tracking progress is to establish a baseline against which future reductions will be measured.
� Complete a facility-wide waste operations assessment. Assess indoor container placement, color-coding and labeling. Assess exterior waste equipment utilization to maximize efficiencies and hauls to reduce costs and transportation impact.
� Build teams, get leadership support and assign dedicated resources. Create a multi-stakeholder sustainability team with representatives from departments that share responsibility for the purchase, management and/or disposal of particular waste streams.
� Set targets/goals. Set both short- and long-term reduction goals for waste minimization and integrate them into a meaningful and achievable waste management plan.
� Develop strategic action plans for improvement. Choose and document a project path to help meet goals.
� Ensure regulatory compliance across all waste streams. This is not an option.
� Adopt integrated waste management policies and procedures. This must be done for each waste stream.
� Track, measure and report. Track waste reduction measures for several reasons: to verify they are meeting the intended goal, to track cost and operational savings, to monitor staff satisfaction, to report on all of these successes/failures and to inform your next steps and give you traction as you prepare for the next project.
� Train, educate and celebrate. Users must be educated on the reasons for any changes, trained on work practice modifications and informed with ongoing feedback about how the action plan’s progress is meeting the goals. Training and education can be both formal, with specific learning objectives (compliance or policy-related training should be documented), and informal, with educational materials including posters, newsletters, e-blasts and a variety of media. Acknowledging individual and collective efforts through recognition programs provides opportunities to celebrate and communicate the valuable work being accomplished.

Page 11IFMA SUSTAINABILITY HOW-TO GUIDE WASTE STREAM MANAGEMENT
The U.S. Environmental Protection Agency (EPA) advocates a set of processes and practices called an environmental management system (EMS) that enables an organization to systematically assess and manage its environmental footprint, as well as the environmental impact associated with its activities, products and services. This process improves environmental performance by providing organizations with the tools to successfully manage their environmental activities in a cost-effective manner. An EMS can help an organization assess its waste streams and prioritize actions. An EMS is beneficial because it:
� Helps organizations comply with regulatory responsibilities and provides a means for addressing non-regulated environmental aspects such as energy efficiency and resource conservation;
� Facilitates assessment of risks and liabilities;
� Increases operating efficiency, creates standard operating procedures and captures institutional knowledge of experienced employees;
� Increases employees’ environmental awareness and involvement throughout the organization; and
� Provides potential environmental and financial benefits, a competitive edge and improved public relations.
3.1.2 Zero Waste
Zero waste refers to recycling all materials back into nature or the marketplace in a manner that protects human health and the environment. It is a philosophy that encourages the redesign of resource life cycles so all products are reused. In this program, any trash sent to landfills is minimal and the process recommended is one similar to the way in which resources are reused in nature. A working definition of zero waste, often cited by experts in the field, originated from the Zero Waste International Alliance in 2004. The definition states, “Zero waste is a goal that is ethical, economical, efficient and visionary, to guide people in changing their lifestyles and practices to emulate sustainable natural cycles, where all discarded materials are designed to become resources for others to use.” Organizations and communities that achieve more than 90 percent diversion of waste from landfills and incinerators are considered to be successful in achieving zero waste.
A zero-waste program involves designing and managing products and processes to systematically avoid or eliminate the volume and toxicity of waste and materials, and to conserve and recover all resources without burning or burying them. In industry, this process involves creating commodities out of traditional waste products, essentially making new inputs from old outputs for similar or different industrial sectors. Zero waste can represent an economical alternative to waste systems, where new resources continually are required to replenish wasted raw materials. It also can represent an environmental alternative to waste since waste represents a significant amount of pollution in the world. Figure 1 is an example of the closed-loop thinking of a zero-waste program.
an EnvironmEntal manaGEmEnt SyStEm (EmS) can HElP an orGanization aSSESS itS waStE StrEamS and PrioritizE actionS.

Page 12IFMA SUSTAINABILITY HOW-TO GUIDE WASTE STREAM MANAGEMENT
Rethink• Waste management• How we do business
Recycle/Compost• Materials• Packaging• Upcycle
Reuse• Scrap• Materials• Packaging
Reduce• Consumption• Packaging• Procurement
Redesign• Products• Services• Processes
Figure 1: Closed-loop system (www.zerowasteneo.org/page/what-is-zero-waste)
It is important to distinguish recycling from zero waste. A successful zero-waste program is a combination of waste minimization, recycling, composting and material reuse. Zero waste is a vision for a new millennium. It is a goal, a process and a way of thinking that changes the approach to resource allocation and production. Not only is zero waste about recycling, composting and diversion from landfills, it also restructures production and distribution systems to prevent waste from being manufactured in the first place.
3.1.3 Waste Audit
Facility managers are much more likely to effectively manage an issue that they can measure. Performance can be monitored periodically and annually and can be compared to that of other similar organizations. In the waste management field, this process is called a waste audit. The audit is a snapshot of the organization’s current waste practices and an accounting of what percentage of waste is recycled, composted or sent to a landfill. It will guide the facility manager with information to assist in identifying risks while offering the potential to lower facility costs and provide standards for material purchasing and reuse, and waste minimization.
Waste audits are one of the most valuable tools for facility managers in helping to identify the types of waste being generated. Identifying potentially valuable materials is an important step to take before searching for markets. Waste audits are useful because they demonstrate the need to create a recycling program; conduct a cost-benefit analysis of trash versus recycling; generate
Zero wasTe is a vision for a new millennium.

Page 13IFMA SUSTAINABILITY HOW-TO GUIDE WASTE STREAM MANAGEMENT
awareness about waste in the building; gain publicity for recycling efforts; and educate the public.
There are many types of waste audits which vary in complexity. A general dig through the garbage is a great way to get an initial idea of the true picture of the waste stream. Waste streams may vary depending on their location within the facility, so it is valuable to conduct sample waste audits at locations that may differ in terms of the types of materials being generated. For example, dining areas on a college campus will generate food waste, paper towels and napkins, all of which can be composted. Art studios may generate a wide range of materials that can be used in future projects, while dorms are likely to generate office paper, bottles, cans, food wrappers, junk mail, old notebooks and other recyclables.
The timing of a solid waste stream study is important. Waste analyses should be conducted during a time that reflects the average level of building activity. The time of year will also affect the research results. For example, more yard waste will be generated in spring and fall than in winter. The process of a waste audit, using a college campus as an example, is shown below.
Materials/Resources Needed to Conduct a Waste Audit on a Higher Education Campus* Large scale for weighing the waste * Bins for all sorting categories
* Sorting tables * Gloves * Calculator * Tally sheet * Volunteers
1. Select Campus Areas – Select various areas on campus that represent distinct waste generation locations, such as residence halls, food services outlets, administrative buildings, the student union and academic buildings.
2. Perform a Trial Waste Audit – Prior to the actual audit, conduct a preliminary audit using a small sample of garbage (five bags, for example). This will help to determine appropriate waste categories and improve methodology for the more extensive waste audit.
3. Collect Garbage – Randomly collect a minimum of five bags of garbage from dumpsters at each one of the campus locations prior to the daily waste pickup. Label each bag according to its collection point.
4. Calculate Weight and Volume – Once all of the garbage has been transferred to the sorting site, calculate the total weight and volume collected from each location before grouping similar items together into separate categories (paper, metal, plastic, etc.). Remember to weigh the sorting containers before putting garbage into them so that their weight can be subtracted from the gross weight in order to determine the net weight for each category. Carefully sort each bag of garbage into categories. Once the sorting for one location is completed, weigh the containers of material (subtracting the tare weight) and record the figures.
5. Separate Waste into Categories – Sort the waste into predetermined categories such as paper, metal, plastic, reusable goods, etc. The categories can be expanded to reflect a more detailed analysis of recyclable waste. For example, the technology exists to recycle steel-plated tin cans, phone books and lower grades of paper. However, there may not be existing markets for these materials in the area surrounding campus.
6. Use the Information – If the total amount of waste that a particular area generates is unknown, represent figures as a percentage. It is important to use both weight and volume figures because weight figures alone can be misleading. Use figures conservatively. This will provide important information about the general types and quantities of waste the campus generates.
Waste audits in public areas are great for educational purposes. For example, take a sample of three bags of garbage from five buildings on campus and sort them in a public area to increase public awareness and media attention as well as discussions with potential allies regarding consumption and waste in the community. Publish the results so they can be easily accessed by a wide range of people.

Page 14IFMA SUSTAINABILITY HOW-TO GUIDE WASTE STREAM MANAGEMENT
3.1.4 Tracking and Documentation
Keeping waste material records is a laborious process, but is worth its weight in gold. By reviewing the waste stream and tracking recyclables, facility managers can see what the trends are and how to make things more efficient while noting waste reduction. Quantitative analyses provide another avenue for legitimacy and life-cost accounting. It is important also to track the recovery rate and work toward demonstrating a qualitative view of the waste stream, including waste reduction. These records can be used to support increased funding and to validate existing funding.
Beyond spreadsheet documents, facility professionals can use data to create comparison cost-savings charts. Figure 2 shows some sample charts representing the waste streams for an organization.
Figure 2: Examples of waste stream charts

Page 15IFMA SUSTAINABILITY HOW-TO GUIDE WASTE STREAM MANAGEMENT
Figure 3: Examples of recycling logos
3.1.5 Education
Promoting the idea of recycling/waste reduction as part of any waste management program is essential to the success of sustainable practices. Unlike most operational sectors, recycling and waste reduction require a change in cultural behavior. In order to implement new systems, creative education and promotional activities must complement regular operations. It is important to train people to incorporate new practices into daily activities. The goal includes refocusing societal perceptions and collective actions.
Recycling is merely a stop-gap measure. The larger picture of best management practices involves waste reduction and material reuse. The key to successfully closing the loop is excellence in education and promotion of these ideas to the culture as a whole to stimulate environmental consciousness. When considering educational opportunities, remember there is no catch-all strategy for getting the word out. Everyone responds to different cues. Some people respond to pictures, others to printed words, music or even dance. Diversify educational and promotional activities in order to reach the greatest number of campus community members.
There are many opportunities to include waste reduction education in organizational practices (as shown in Table 2). Incorporating information into program materials and operations is just the beginning. Waste reduction and recycling promotion can be incorporated into actual activities and events such as Earth Day and America Recycles Day. There are many opportunities to advance the idea of waste reduction and recycling and also promote your facility in the process.
Create a logo or name for the recycling program (as shown in Figure 3). This should be placed on all recycling collection stations, program vehicles, signs, printed materials, employee T-shirts, newsletters, posters and recycling containers. A program logo is the foundation for building a recycling program. It identifies the program and also inspires the practice. This could be as simple as utilizing the generic recycling symbol with your facility’s name in the center.
iT is imPorTanT To Train PeoPle To incorPoraTe new PracTices inTo daily acTiviTies.

Page 16IFMA SUSTAINABILITY HOW-TO GUIDE WASTE STREAM MANAGEMENT
tablE 2: waStE ProGram Education idEaS
Design a materials collection poster using a logo, graphics and sorting guidelines. Establish clear, common-sense guidelines.
Create decals and/or signs for labeling all collection containers. These work best in conjunction with posted sorting guidelines.
Set up user-friendly, aesthetically pleasing recycling collection sites. A strong presence is the best education. Most recycling programs have inexpensive collection containers. Keep containers well labeled and clean in order to compensate for any aesthetic issues.
Create recycling program brochures. Brochures are valuable assets when tabling at educational and promotional events.
Launch a program website. A recycling program will be much more successful and visible with an online presence. Post operational information, a materials list, a site location map, a resource guide and event updates.
Utilize social networking sites. Facebook and Twitter can be used to spread the word about events and any operational changes.
Create a recycling information center.
Promote successes through well-publicized celebrations.
Have refillable cups made with your recycling program logo to use for giveaways and special events.
People love factoids! Make signs with fun visual displays of interesting statistics and place them around the facility or campus. See Appendix C for an example of facts to use.
Conduct program surveys.
Plan activities for Earth Day, Recycling Awareness Week, America Recycles Day or applicable events in your area.

Page 17IFMA SUSTAINABILITY HOW-TO GUIDE WASTE STREAM MANAGEMENT
3.2 Reduction Strategies
Waste minimization is the process and policy of reducing the amount of waste produced by a person or a society. It involves efforts to minimize resource and energy use during manufacturing or purchasing practices. For the same commercial output, decreased material use usually denotes less waste production. Waste minimization usually requires knowledge of the production process, cradle-to-grave analysis (the tracking of materials from their extraction to their return to earth) and detailed knowledge of the composition of the waste. Figure 4 represents the difference between reducing the amount of waste generated and diverting waste from the landfill.
The main sources of waste vary from organization to organization. Reasons for the creation of waste sometimes include requirements in the supply chain. For example, a company handling a product may insist it be packaged using particular materials which fit its packaging equipment. In the waste hierarchy, the most effective approaches to managing waste are at the top. In facility management, waste minimization involves environmentally preferred purchasing, product selection based on life cycle assessments and packaging.
3.2.1 Environmentally Preferred Purchasing
The term environmentally preferable means “products or services that have a lesser or reduced effect on human health and the environment when compared with competing products or services that serve the same purpose.” This comparison applies to the manufacturing, packaging, distribution, use, reuse, operation, maintenance and disposal of raw materials. An environmentally preferred purchasing (EPP) program specifies sustainable criteria for the procurement of goods in all contracts. The key to success in this program is to maintain the standards in all purchasing decisions in the organization no matter who is making them. Whether the organization has centralized or decentralized purchasing, one set of environmentally preferred purchasing standards should be instituted and followed by all decision makers.
Part of the reason EPP is practiced by more and more organizations is that it is built upon core principles that benefit the economy, environment and society. Consequently, by using a continual improvement process, better purchasing decisions will be made in the years to come. EPP provides a variety of benefits that can range from financial, human health and environmental to larger societal benefits. Financial costs and benefits are the easiest to quantify. The purchasing price and frequency of purchase is weighed against operating costs, maintenance repair and replacement costs, occupational health costs and liability. Commonly cited benefits include reduced air and water pollution, decreased emissions, materials and energy efficiency, less waste in landfills,
Figure 4: Difference between reduction and diversion

Page 18IFMA SUSTAINABILITY HOW-TO GUIDE WASTE STREAM MANAGEMENT
reductions in hazardous and toxic substances and increased durability. EPP economic benefits include:
� Reduced materials consumption. Reusable, refillable, durable and repairable products are usually more cost effective over time than single-use or disposable products. Similarly, the purchase of equipment that uses fewer materials can save money. Copiers and printers that are capable of duplex printing (and are used in this capacity) can reduce paper costs.
� Increased use of renewable products. The use of cutlery, dinnerware and other such products that can be recycled defers materials from landfills.
� Provision of a useful outlet for collected recycled materials. This helps develop the market for environmentally preferable goods and services. Buying and selling recycled products supports the economy. Diversion creates twice as many jobs and doubles the income and sales per ton of material when compared with standard disposal practices.
� Emergence of recycled-content products (RCP). Some RCPs are priced the same as, or less than, their non-recycled counterparts. Some durable RCPs, such as recycled plastic lumber and rubberized asphalt, may cost more at the outset, but have lower overall costs due to their durability and lower maintenance needs.
� Reduced greenhouse gas emissions. Buying longer term products and purchasing locally decreases the impact of transportation on the environment. Discarding less trash minimizes landfill use and incineration.
� Conservation of water. It is important to understand the concept of hidden (virtual) water in the manufacture and transportation of products and to ensure the efficient use of water to reduce the cost of pumping, heating and treating.
� Conservation of energy. Energy efficiency is a simple and effective way to save money.
In many cases it’s difficult to identify the specific value of these benefits without extensive study. Environmental and societal costs and benefits are much harder to quantify and incorporate into decision making. That is why there is legislation that directs allowable emissions or bans certain substances. It would be cost prohibitive to analyze costs and benefits for individual situations. The result is that most emphasis is placed on the easy-to-obtain initial purchase price or first cost, followed by operations and maintenance costs. However, studies have shown benefits in choosing correct products through EPP that, although they are hard to quantify, are just as hard to dispute. For instance, reducing the presence of toxic and hazardous substances in the workplace and the environment will:
� Improve public and occupational health and safety;
� Improve wildlife habitats;
� Decrease air, water and soil contamination;
� Improve compliance with regulations; and
� Decrease costs associated with waste management, disposal and cleanup.
EPP ProvidES a variEty oF bEnEFitS tHat can ranGE From Financial, Human HEaltH and EnvironmEntal to larGEr SociEtal bEnEFitS.

Page 19IFMA SUSTAINABILITY HOW-TO GUIDE WASTE STREAM MANAGEMENT
EPP considers a product over its entire lifespan. This analysis acknowledges direct and indirect environmental, health and financial costs. Consequently, a product that has a lower initial purchase price than a similar but more environmentally preferable product may cost more over the long term. The industry’s increasing sophistication in analyzing a fuller range of benefits has allowed more robust decision making.Fortunately, there are a variety of software tools that can assist in this analysis and, over time, better analyses can be expected. This will lead to an improved ability to meet environmental goals that will improve worker safety and health, and reduce liabilities and health care costs. It will provide increased availability of environmentally preferable products in the marketplace, promoting a sustainable economy.
For a facility to maintain sustainable practices, environmental considerations should become part of normal purchasing practice, consistent with such traditional factors as product safety, price, performance and availability. Facility managers should seek to minimize environmental damages associated with their purchases by increasing their acquisition of environmentally preferable products. They should consider rapidly renewable resources, embedded energy, virtual water, packaging and the effect of materials on indoor environmental quality. A challenge of instituting EPP is getting information and compliance from manufacturers and distributors, receiving information in a manageable format and implementing a policy to which people will adhere. This entails collecting information from product and service providers and may require the development of contract language to ensure vendors provide environmental information.
Environmental factors are becoming a subject of competition among vendors seeking contracts. It is becoming more prevalent in the workplace to have customers and purchasers requesting and/or demanding sustainable products that are either composed of recycled material, are recyclable themselves or have minimal impact on the environment. As these preferences become more pronounced, suppliers and providers will lose market share if their products cannot meet customer needs and wants.
The U.S. Environmental Protection Agency has established the Environmentally Preferred Purchasing program, which is utilized in federal facilities and has become the standard for green building certifications. Executive Order 13514 has mandated that all federal facilities purchase more sustainable items and providers must follow certain guidelines when supplying goods to government facilities. All of this increases competition among vendors, which stimulates continual environmental improvement and increase the availability of environmentally preferable products and services without cost premiums.
faciliTy managers should consider raPidly renewable resources, embedded energy, virTual waTer, Packaging and The effecT of maTerials on indoor environmenTal qualiTy.
Replace incandescent light bulbs with compact fluorescent ones

Page 20IFMA SUSTAINABILITY HOW-TO GUIDE WASTE STREAM MANAGEMENT
Products
As sustainability begins to pervade everything organizations do, the act of purchasing has become much more involved than just obtaining goods/services at the right price; it has become a puzzle with many components. Knowing the overall value of what is bought transcends immediate cost and deals with the benefits/detriments of its use as well as what happens when the product becomes waste. These determinations apply both to personal lives and in professional applications.
In a broader, more environmental sense, there are other important aspects of product attributes that need attention. As much as possible, “hard” products brought into a facility should be made from recycled material or contain recycled content. Not only is this cost effective, but the practice serves as an investment in the future. For example, mining and transporting raw materials for glass produces about 385 pounds of waste per ton of manufactured glass. If recycled glass is substituted for just half of those raw materials, the waste is cut by more than 80 percent. Also, the energy saved from recycling one glass bottle causes 20 percent less air pollution and 50 percent less water pollution than when a new bottle is made from raw materials.
The U.S. EPA started its Environmentally Preferable Purchasing program in 1993 after the signing of Executive Order 12873. This was re-confirmed in 2010. As part of the guidelines, the EPA has provided a template for the drafting of a plan for individual facilities which serves as a model for what needs to be addressed in an EPP program. It includes a sample list of product constitution standards that should be followed during procurement. The EPA recommends the following minimum percentages of post-consumer recycled materials in products:
� Antifreeze — 70 percent � Compost/co-compost/mulch — 80 percent � Glass products — 10 percent � Lubricating oils — 70 percent re-refined
base oil � Metal products — 10 percent � Paint — 50 percent � Paper products — 30 percent � Plastic products — 10 percent � Printing and writing paper — 30 percent � Tires retreaded or recapped — 50 percent
Figure 5: U.S. EPA EPP logo (www.epa.gov)
Packaging
Almost everything purchased comes in a package. This is to ensure the product is safe, is protected from tampering and hasn’t come into contact with harmful substances. Packaging provides the ability to transport objects more easily and protects them while in storage. It allows for the display of product information and is used for marketing purposes. Some examples of packaging materials are boxboard, cardboard, paper, stretch wrap, glass, bubble wrap, plastic, steel and aluminum cans, wooden crates, pallets with steel or plastic banding and spools.
Although packaging is necessary, it unfortunately has a considerable environmental impact. More than 30 percent of the waste stream leaving

Page 21IFMA SUSTAINABILITY HOW-TO GUIDE WASTE STREAM MANAGEMENT
buildings typically is comprised of product packaging. Sometimes a product may have packaging that weighs more and has more mass than the product itself. Out of every US$10 spent on products, $1 (10 percent) goes toward packaging that is thrown away. Packaging represents about 65 percent of household trash and about one-third of an average landfill is filled with packaging material. The environmental impact of packing materials extends beyond the effects of its disposal. Resources and energy are consumed to produce and transport packaging. This broader overall impact should be included in the assessment and purchase of products.
The basic steps of waste minimization often are easily initiated and low in cost: buying in bulk, buying in larger volume-containers or encouraging suppliers to cut down on packaging when possible. In fact, by requesting and/or utilizing less packaging, a good deal of money can be saved. These steps can reduce transportation costs, save on hauling costs due to the lower volume of waste and enhance a company’s image. Sustainability is all about doing more with less, which involves creating and providing quality products and services while reducing resource use, waste and pollution along the entire value chain. In the context of resource management, it is not only about managing waste after it has been created, but strives toward preventing and minimizing waste in the first place.
3.2.2 Life Cycle Assessment
The term life cycle assessment refers to the notion that a fair, holistic assessment includes the examination of raw material production, manufacture, distribution, use and disposal, including all intervening transportation steps caused by the product’s existence. The sum of all those steps is the product’s life cycle. Waste stream management should cover the same territory, tracking resources from harvest through manufacture/production, transportation, use and disposal. In order to assess the impact of a product upon disposal, a life cycle assessment (LCA) should be performed. LCA, also known as life cycle analysis, eco-balance and cradle-to-grave analysis, is the investigation and evaluation of the environmental impacts of a given product or service caused or necessitated by its existence and its disposal. Figure 6 shows the items examined in an LCA.
The LCA process has created new terms that are gaining recognition as sustainability and EPP programs gain more traction. Emergy is short for embodied (embedded) energy. It is a calculation of the amount of energy used for the total creation, transport, use and disposal of a product. Virtual water (also called embedded/embodied or hidden water) follows the same tracking system to gauge the amount of water consumed in material creation.
Figure 6: Life cycle assessment

Page 22IFMA SUSTAINABILITY HOW-TO GUIDE WASTE STREAM MANAGEMENT
The International Standards Organization has released guidance on this in the Environmental Management Standards ISO 14000 in the section “International Standard on Life Cycle Assessment.” This entails a process referred to as cradle-to-grave analysis. This analysis identifies the materials and energy consumed throughout a product’s lifetime, addressing resource mining (cradle) and product production, use, and disposal (grave). According to ISO 14040 and 14044 standards, a life cycle assessment entails four distinct phases. In the first phase, the goal and scope of the study are determined in relation to the intended application of the assessment. This phase includes a description of the method to be applied for assessing potential environmental impacts and which categories are to be included. The second phase addresses the inventory and involves data collection and modeling of the product system, as well as a description and verification of data. Inputs such as materials, energy and chemicals used in the product system are evaluated and outputs of air emissions, water emissions or solid waste are investigated. The third phase, life cycle impact (LCI) assessment, deals with evaluating the negative impacts of the product system, such as GHG emissions and water and land pollution. Impact potentials are calculated based on LCI results. Finally comes the interpretation phase during which sensitivity analysis, uncertainty analysis and a study of the major contributions are performed. This stage helps the user to reach a conclusion on whether the goal and scope are SMART (specific, measurable, achievable, realistic, time-bound). Interpretation also determines what can be learned from the LCA and what mitigating measures may be taken. For more information on this process, the EPA has published an “Introduction to Life Cycle Assessment” report with case studies and resources explaining the importance of proper material disposal.
Manufacturers and researchers now are looking at a process called cradle-to-cradle (C2C) assessment1. This takes LCA to the next step by designing products that can be reused after their original purpose has been fulfilled. Cradle to cradle is a specific kind of assessment in which the end-of-life disposal step for the product is a recycling process, originating new, identical products (e.g., glass bottles from collected glass bottles) or different products (e.g., glass wool insulation from collected glass bottles) from used materials. In contrast to a cradle-to-grave approach, the C2C approach reorients the design of products and systems so waste from one process becomes an input for another. Waste equals resources; there is no grave (life cycle endpoint). This is accomplished by designing products and systems so materials can flow in closed-loop cycles as either biological nutrients or technical nutrients (e.g., metals and chemicals). In a C2C world, products are designed for reuse and recycling so materials can be separated from one another to eliminate contamination. If everything is reused, there is zero waste.
C2C has given rise to the term upcycling, which is the process of converting waste materials or useless products into new materials or products of better quality or a higher environmental value. Upcycling is the opposite of downcycling, which is the other half of the recycling process. Downcycling involves converting materials and products into new materials of lesser quality. Most recycling involves converting or extracting useful materials from a product and creating a different product or material. Reducing the use of new raw materials can result in a reduction of energy usage, air pollution, water pollution and even greenhouse gas emissions. In developing countries, where new raw materials are often expensive, upcycling is commonly practiced, largely due to impoverished conditions. Upcycling has seen an increase in use due to its current marketability and the lower cost of reused materials.
rEducinG tHE uSE oF nEw raw matErialS can rESult in a rEduction oF EnErGy uSaGE, air Pollution, watEr Pollution and EvEn GrEEnHouSE GaS EmiSSionS.
1 See “Cradle to Cradle: Remaking the Way We Make Things.” Powell’s Books.
Page 23IFMA SUSTAINABILITY HOW-TO GUIDE WASTE STREAM MANAGEMENT
3.3 Reuse Strategies
To reuse is to use an item more than once. This includes conventional reuse in which an item is used again for the same function, and new-life reuse in which it is used for a different function. In contrast, recycling is the breaking down of a used item into raw materials which are used to make new items. By taking useful products and exchanging them without reprocessing, reuse helps save time, money, energy and resources. In broader economic terms, reuse offers quality products to people and organizations with limited means, while generating jobs and business activity that contribute to the economy. Several examples of conventional reuse are the doorstep delivery of milk in refillable bottles, the retreading of tires and the use of returnable/reusable plastic boxes and shipping containers.
Potential advantages of reuse include: � Energy and raw materials savings, as replacing many single-use
products with one reusable one reduces the number manufactured � Reduced disposal needs and costs � Refurbishment can bring well-paying jobs to underdeveloped economies � Cost savings for business and consumers, as reusable products are often
cheaper than the single-use products they replace � Some older items exhibit superior construction and may have
appreciated in value
Disadvantages may include: � Reuse often requires cleaning or transport which has environmental costs � Some items, such as Freon appliances or infant auto seats, can become
hazardous or less energy efficient as their duration of use increases � Reusable products need to be more durable than single-use products
and require more material per item � Sorting and preparing items for reuse takes time, which can be
inconvenient for consumers and costly for businesses
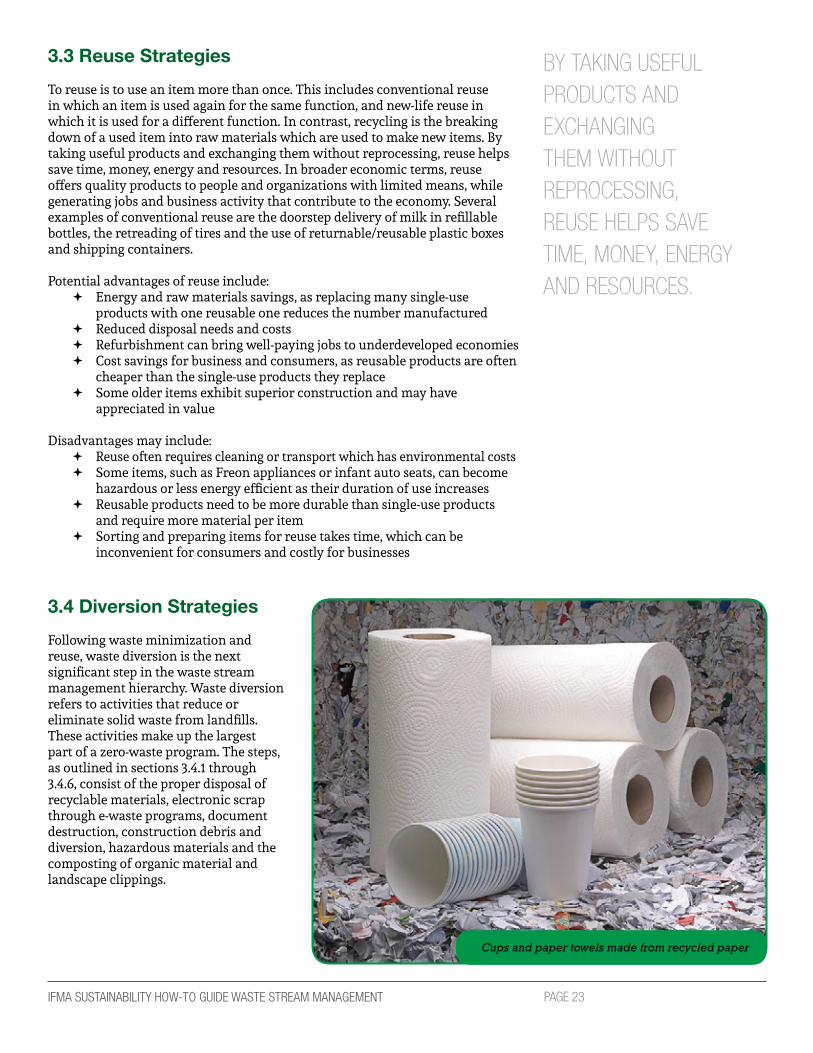
3.4 Diversion Strategies
Following waste minimization and reuse, waste diversion is the next significant step in the waste stream management hierarchy. Waste diversion refers to activities that reduce or eliminate solid waste from landfills. These activities make up the largest part of a zero-waste program. The steps, as outlined in sections 3.4.1 through 3.4.6, consist of the proper disposal of recyclable materials, electronic scrap through e-waste programs, document destruction, construction debris and diversion, hazardous materials and the composting of organic material and landscape clippings.
by Taking useful ProducTs and exchanging Them wiThouT reProcessing, reuse helPs save Time, money, energy and resources.
Cups and paper towels made from recycled paper

Page 24IFMA SUSTAINABILITY HOW-TO GUIDE WASTE STREAM MANAGEMENT
3.4.1 Recycling
Recycling is the diversion of products from landfills for processing to return to consumer circulation. Recycling efforts return valuable resources to the production process. The cumulative effects reduce landfill volume and minimize the dependence on virgin resources.
Recyclable materials can be broken down into five basic characteristics: paper, metal, plastics, glass and corrugated cardboard.
Americans use more than 80 billion aluminum soda cans a year. A recycled aluminum can is back on the grocery shelf in as little as 60 days and there is no limit to the amount of times an aluminum container can be recycled. Contrarily, an aluminum can that is thrown into a landfill still will be a can 500 years from now. A modern glass bottle takes 4,000 years or more to decompose. Each ton of recycled paper can save 17 trees, 380 gallons of oil, three cubic yards of landfill space, 4,000 kilowatts of energy and 7,000 gallons of water.
Sustainable practices and common sense dictate that all products that can be recycled should be recycled. Every facility should have a viable and functioning recycling plan that involves all occupants of the building. The plan should include documentation and tracking of the program, and continuing education regarding its benefits. Participating and learning in an atmosphere that promotes recycling creates intrinsic motivation that carries on outside of the workplace and into homes, schools and neighborhoods. Because of school programs and environmental education, children are now one of the chief advocates of sustainable practices.
Design Approach
Although some people already recycle by habit, it is still very important to ensure that the process is simple, identifiable and convenient. A successful recycling program entails a culture shift and a change in behavioral attitudes. To fully affect waste diversion, program education and ease of use are paramount. Here are a few points to consider while designing a recycling program:
� Designate well-marked and strategically placed collection and storage areas for recyclables in close proximity to personnel.
� Locate a central collection and storage area with easy access for collection vehicles.
� Research local recycling efforts to find the best method of diverting these materials from the waste stream to third-party processors.
� Provide education, training and informational resources for all personnel on recycling concepts and procedures.
� Encourage activities to reduce and reuse materials before recycling
� After researching recyclable material haulers, choose the type of collection best suited for the organization: separating recycled materials into different collection bins or using single-stream methods where all recyclables are placed in one container.
Page 25IFMA SUSTAINABILITY HOW-TO GUIDE WASTE STREAM MANAGEMENT
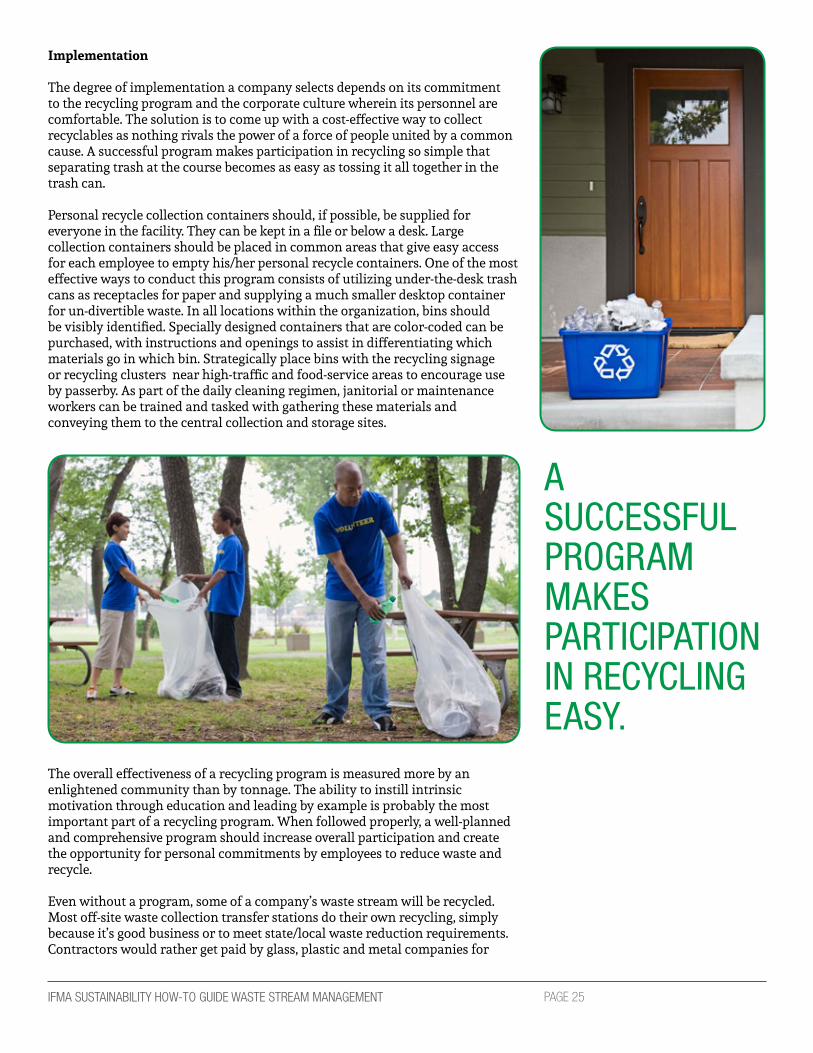
Implementation
The degree of implementation a company selects depends on its commitment to the recycling program and the corporate culture wherein its personnel are comfortable. The solution is to come up with a cost-effective way to collect recyclables as nothing rivals the power of a force of people united by a common cause. A successful program makes participation in recycling so simple that separating trash at the course becomes as easy as tossing it all together in the trash can.
Personal recycle collection containers should, if possible, be supplied for everyone in the facility. They can be kept in a file or below a desk. Large collection containers should be placed in common areas that give easy access for each employee to empty his/her personal recycle containers. One of the most effective ways to conduct this program consists of utilizing under-the-desk trash cans as receptacles for paper and supplying a much smaller desktop container for un-divertible waste. In all locations within the organization, bins should be visibly identified. Specially designed containers that are color-coded can be purchased, with instructions and openings to assist in differentiating which materials go in which bin. Strategically place bins with the recycling signage or recycling clusters near high-traffic and food-service areas to encourage use by passerby. As part of the daily cleaning regimen, janitorial or maintenance workers can be trained and tasked with gathering these materials and conveying them to the central collection and storage sites.
The overall effectiveness of a recycling program is measured more by an enlightened community than by tonnage. The ability to instill intrinsic motivation through education and leading by example is probably the most important part of a recycling program. When followed properly, a well-planned and comprehensive program should increase overall participation and create the opportunity for personal commitments by employees to reduce waste and recycle.
Even without a program, some of a company’s waste stream will be recycled. Most off-site waste collection transfer stations do their own recycling, simply because it’s good business or to meet state/local waste reduction requirements. Contractors would rather get paid by glass, plastic and metal companies for
aSuccESSFul ProGram makES ParticiPation in rEcyclinG EaSy.
Page 26IFMA SUSTAINABILITY HOW-TO GUIDE WASTE STREAM MANAGEMENT
recyclables than pay landfill fees. But this takes time, space, people and, of course, money, so they pass those costs on to consumers. Based on the size of a campus or office facility, a huge amount of waste is produced daily; through a recycling program, this waste could generate savings for the institution.
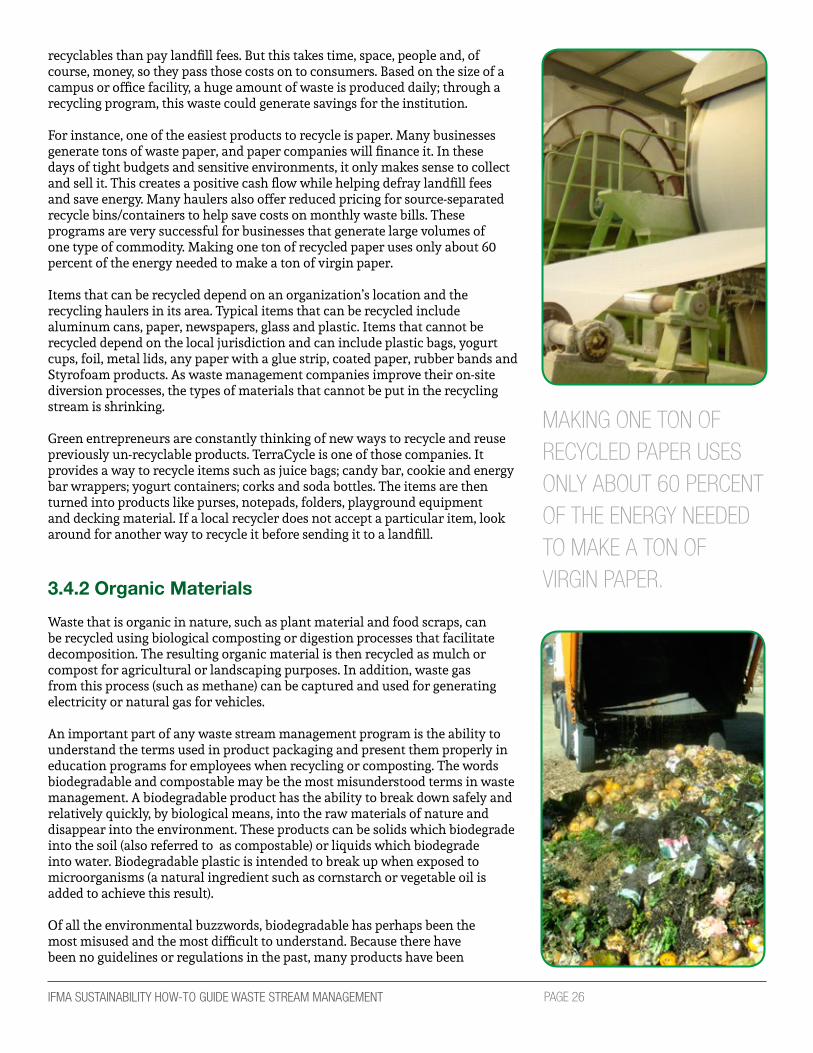
For instance, one of the easiest products to recycle is paper. Many businesses generate tons of waste paper, and paper companies will finance it. In these days of tight budgets and sensitive environments, it only makes sense to collect and sell it. This creates a positive cash flow while helping defray landfill fees and save energy. Many haulers also offer reduced pricing for source-separated recycle bins/containers to help save costs on monthly waste bills. These programs are very successful for businesses that generate large volumes of one type of commodity. Making one ton of recycled paper uses only about 60 percent of the energy needed to make a ton of virgin paper.
Items that can be recycled depend on an organization’s location and the recycling haulers in its area. Typical items that can be recycled include aluminum cans, paper, newspapers, glass and plastic. Items that cannot be recycled depend on the local jurisdiction and can include plastic bags, yogurt cups, foil, metal lids, any paper with a glue strip, coated paper, rubber bands and Styrofoam products. As waste management companies improve their on-site diversion processes, the types of materials that cannot be put in the recycling stream is shrinking. Green entrepreneurs are constantly thinking of new ways to recycle and reuse previously un-recyclable products. TerraCycle is one of those companies. It provides a way to recycle items such as juice bags; candy bar, cookie and energy bar wrappers; yogurt containers; corks and soda bottles. The items are then turned into products like purses, notepads, folders, playground equipment and decking material. If a local recycler does not accept a particular item, look around for another way to recycle it before sending it to a landfill.
3.4.2 Organic Materials
Waste that is organic in nature, such as plant material and food scraps, can be recycled using biological composting or digestion processes that facilitate decomposition. The resulting organic material is then recycled as mulch or compost for agricultural or landscaping purposes. In addition, waste gas from this process (such as methane) can be captured and used for generating electricity or natural gas for vehicles.
An important part of any waste stream management program is the ability to understand the terms used in product packaging and present them properly in education programs for employees when recycling or composting. The words biodegradable and compostable may be the most misunderstood terms in waste management. A biodegradable product has the ability to break down safely and relatively quickly, by biological means, into the raw materials of nature and disappear into the environment. These products can be solids which biodegrade into the soil (also referred to as compostable) or liquids which biodegrade into water. Biodegradable plastic is intended to break up when exposed to microorganisms (a natural ingredient such as cornstarch or vegetable oil is added to achieve this result).
Of all the environmental buzzwords, biodegradable has perhaps been the most misused and the most difficult to understand. Because there have been no guidelines or regulations in the past, many products have been
making one Ton of recycled PaPer uses only abouT 60 PercenT of The energy needed To make a Ton of virgin PaPer.

Page 27IFMA SUSTAINABILITY HOW-TO GUIDE WASTE STREAM MANAGEMENT
labeled biodegradable without any real justification. Unfortunately, the word biodegradable frequently has been applied to products that generally aren’t (such as detergents or plastics) and has almost never been used for products that really are (such as soap or paper). This term has also been misused in representing the length of time the product takes to return to the earth.
A product that is compostable is one that can be placed into a composition of decaying biodegradable materials, and eventually turns into a nutrient-rich material. It is almost synonymous with biodegradable, except it is limited to solid materials. Composting occurs in nature everyday as fallen leaves and tree limbs biodegrade into the forest floor. The EPA considers composting a form of recycling because it turns resources into a usable product. Food, leaves, grass clippings, garden waste and tree trimmings (which amount to between 50 and 70 percent of waste in the U.S.) all go into the compost pile, where hungry microorganisms eat the waste to produce carbon dioxide, water and humus. The resulting compost is an excellent natural fertilizer proven by organic gardeners to restore soil fertility, control weeds, retain ground moisture and reduce soil erosion.
As with the term biodegradable, regulators recommend the term compostable not be used unless the product currently is composted in a significant amount in the area where it is sold. Without the ability to actually compost the product, this claim is considered to be meaningless and thus deceptive. They recommend that any product promoted as compostable has packaging that clearly and prominently discloses that the product is not designed to degrade in landfills.
There are no federal regulations regarding the use of the term compostable, but the U.S. Federal Trade Commission does give guidelines: “An unqualified claim that a product or package is compostable should be substantiated by competent and reliable scientific evidence that all the materials in the product or package will break down into, or otherwise become part of, usable compost (e.g., soil conditioning material, mulch) in a safe and timely manner in an appropriate composting program or facility, or in a home compost pile or device.” Claims may be considered deceptive if municipal composting facilities are not available to a substantial majority of consumers to whom the package is sold; the claim misleads consumers about the environmental benefit provided when the product is disposed of in a landfill. Consumers may also misunderstand the claim to mean that the package can be safely composted in their home compost pile or device when, in fact, it cannot.
The intention of biological processing in waste management is to control and accelerate the natural process of decomposition of organic matter. There is a large variety of composting and digestion methods and technologies. They vary in complexity from simple home compost heaps to industrial-scale enclosed-vessel digestion of mixed domestic waste. Methods of biological decomposition are differentiated as being aerobic or anaerobic methods, though hybrids of the two methods also exist. Figure 7 explains the basic process in composting that breaks down organic material.
Figure 7: Composting process
of all The environmenTal buZZwords, biodegradable has PerhaPs been The mosT misused and The mosT difficulT To undersTand.

Page 28IFMA SUSTAINABILITY HOW-TO GUIDE WASTE STREAM MANAGEMENT
Some companies are using worm farms to eliminate food waste, especially in facilities that house restaurants or large cafeterias. The technical term for using worms to process compost and create castings is vermicomposting, and the finished product is called vermicompost or vermicast. Worm farms are a way to eliminate the waste that normally is sent to a landfill. This can save a facility thousands of dollars per year since costs for garbage removal are eliminated. This can be accomplished with virtually no startup cost.
Landscaping materials or green debris can be handled in a number of ways, by a number of different entities. While waste management companies may supply separate containers for green debris, more and more landscape companies are collecting this material for their own benefit. Green debris also can be prevented by grass-cycling and xeriscaping practices. Grass-cycling is the simple practice of leaving grass clipping on the lawn while mowing. The practice of xeriscaping means landscaping with slow-growing, drought-tolerant plants to conserve water and reduce yard trimmings.
A creative way to eliminate green debris is to feed the animals! Ruminant mammals such as goats and sheep offer an alternative use for vegetation which is otherwise wasted, while producing products (milk, meat and fiber) which are currently marketable and in demand by a growing segment of the world’s population. In addition, these types of animals offer the potential for biological control of unwanted vegetation in pastures and forests, which will reduce dependence on certain pesticides and diminish fuel for forest fires.
3.4.3 Electronic Scrap/Waste
According to the California Integrated Waste Management Board, electronic discard (e-waste) is one of the fastest-growing segments of current waste streams. In addition, some researchers estimate that nearly 75 percent of old electronics are in storage, in part because of the uncertainty of how to properly dispose of these items. The intensive energy and diverse material inputs that go into the manufacture of electronics represent a high degree of embodied energy and scarce resources such as precious metals, copper and engineered plastics. The presence of these types of substances merits greater consideration for end-of-life management. There are prime opportunities available for resource recovery through improved retirement and recycling processes.
Recycling electronics recovers valuable materials, conserves virgin resources and results in lower environmental emissions (including GHG) than making products from virgin materials. For example, recycling one million desktop computers prevents the release of greenhouse gases equivalent to the annual emissions of 16,000 passenger cars. By recycling 100 million cell phones, approximately 7,500 pounds of gold could be recovered, allowing that gold to go into new products. Recovering the gold from cell phones, rather than mining it from the earth, would prevent 12 billion pounds of loose soil, sand and rock from having to be moved, mined and processed. Electronic products that can be recycled include:
� Cell phones, PDAs, pagers � Computer monitors, software disks, CPUs � Laptop computers/tablets � Photocopiers � Printers/scanners/fax machines
� Stereos/radios/MP3 players or iPods � Telephones/answering machines � Televisions (including plasma and LCD) � VCRs/DVD players � Video game consoles

Page 29IFMA SUSTAINABILITY HOW-TO GUIDE WASTE STREAM MANAGEMENT
As technology quickly evolves and new products are becoming outdated almost as soon as they are available for purchase, the need for proper and safe disposal of e-scrap is apparent. At present, there are no U.S. federal mandates to recycle e-waste, although there have been numerous attempts to develop applicable federal law. However, 20 states and one municipality have instituted mandatory electronics recovery programs. The national standards body for the United Kingdom, BSI Group, has been commissioned to develop a Publicly Available Specification (PAS) for waste electrical and electronic equipment. This is reportedly the first attempt to develop such legislation in the European Union.
Some electronics, such as computer monitors, color CRTs and smaller items, such as cell phones and other handheld devices, are characterized as hazardous waste and are subject, by law, to special handling requirements in disposal. However, if these items are donated for reuse, management requirements can be less stringent.
If products are still in working order or need minor repairs, they should be donated to schools, libraries, charities or churches to extend their use. If they are beyond repair, there are companies that will collect and properly dispose of the waste. However, because the retirement of electronic equipment is an asset disposal issue, e-scrap guidelines and procedures must be followed. If computer hard drives contain critical information, practices should be in place to clear all data and destroy them in-house. Policies to dispose of e-waste include organizing e-scrap collection days quarterly or biannually in the workplace. Information technology and facility departments can work together to monitor and control electronics leaving the workplace. It is also very important to maintain a list of disposed items and ensure that nothing leaves the facility without proper documentation.
3.4.4 Document Destruction
Trash is not always trash. Organizations must carefully control what is thrown out and where it is deposited. All businesses have the need to discard confidential data such as customer lists, pricing documents, sales data, cost analysis as well as requests for quotes and proposals containing information
as Technology quickly evolves and new ProducTs are becoming ouTdaTed almosT as soon as They are available for Purchase, The need for ProPer and safe disPosal of e-scraP is aPParenT.
traSH iS not alwayS traSH.

Page 30IFMA SUSTAINABILITY HOW-TO GUIDE WASTE STREAM MANAGEMENT
about business activities which would interest competitors. Even memos, names and phone numbers are types of information that must be safeguarded. All businesses suffer potential exposure due to the need to discard business records. The only means of minimizing this exposure is to make sure such information is securely collected and destroyed. Every business is entrusted with information that must be kept private. Employees and customers have the legal right to have these data protected. Without proper security procedures, information can end up in a dumpster where it is readily and legally available to anyone.
Organizations that possess important or confidential information about their own business or about their customers are targets for identity theft and fraud. Trash receptacles are considered by business espionage professionals as the single most available source of competitive and private data from the average business. Any establishment that discards private and proprietary data that have not been properly destroyed exposes itself to the risk of criminal and civil prosecution, as well as the costly loss of business.
Record Retention & Destruction
The period of time for which business records are stored should be determined by a retention schedule that takes into consideration their useful value to the business as well as governing legal requirements. No record should be kept past this retention period. By not adhering to a program of routinely destroying stored records, a company exhibits suspicious disposal practices that could be negatively construed in the event of litigation or audit. Also, the new U.S. “Federal Rule 26” requires that, in the event of a lawsuit, each party provide all relevant records to the opposing counsel within 85 days of the defendants’ initial response. If either of the litigants does not fulfill this obligation, it will result in a summary finding against them. By destroying records according to a set schedule, a company appropriately limits the amount of materials it must search through to comply with this law.
Properly disposing of stored records is important from a risk management perspective. Establishing a disposition procedure ensures that sensitive information is properly discarded. Utilizing a secure disposal method that ensures the information is obliterated is the only acceptable method of discarding stored records. Documenting the exact date that a record is destroyed is a prudent and recommended legal precaution.
Record Storage Companies
Many commercial record storage facilities offer record destruction as a service to customers. However, in a survey conducted by the U.S. National Association for Information Destruction (NAID), a majority of commercial storage firms did not have the necessary equipment to provide the service themselves. It is a common practice in this industry to subcontract record destruction. In some cases, storage firms were found to be misleading their customers by charging for secure record destruction, while the materials were being sold to recycling companies for scrap.
Any business using a commercial record storage firm should inquire as to the nature of available destruction services. It is an unacceptable risk to permit a storage firm to select a subcontractor to provide the record destruction service. The owner of the records is ultimately responsible for their security and should, therefore, select the vendor directly. Facility managers should create their own qualifications when researching record storage companies. Criteria for consideration could include cost, supervision of services, site audits and a program for destroying documents.
uTiliZing a secure disPosal meThod ThaT ensures The informaTion is obliTeraTed is The only accePTable meThod of discarding sTored records.

Page 31IFMA SUSTAINABILITY HOW-TO GUIDE WASTE STREAM MANAGEMENT
Shredding Services
Internal personnel should not be responsible for destroying certain information. Common sense dictates that payroll information and materials that involve labor relations or legal affairs should not be entrusted to lower-level employees for destruction. In addition, access to any information that could provide an advantage to competitors should be limited. It has been established, time and again, that employees are the most likely to realize the value of sensitive information to competitors. If environmental responsibility is a concern, materials may be recycled after they are destroyed or firms can contract with service providers that will destroy the materials under secure conditions before recycling them. Any recycling company that minimizes the need for security has its own interests in mind and should be avoided. Secure shredding prevents information leaks and security breaches while reducing risk from improperly discarded documents which can cause identity theft.
The same guidelines for choosing a record storage provider apply when selecting a shredding service. It is important to check the reputation for integrity and service of any potential shredding vendor. The company should be bonded with security clearances and it is important to check its environmental stance and practices. For instance, paper should be shredded so it can be used as recyclable material (micro-shredding cuts the paper too finely for reuse) and then processed for recycling. Any company contracting an information destruction service should require that it provide them with a signed testimonial documenting the date that the materials were destroyed. The certificate of destruction, as it is commonly referred to, is an important legal record of compliance with a retention schedule. It does not, however, effectively transfer the responsibility to maintain the confidentiality of the materials to the contractor.
3.4.5 Construction Debris
Resource management plans for construction, renovation and demolition projects are part of a growing movement to better manage materials and create sustainable buildings. Building and demolition activities are integrating sustainability or green management techniques designed to protect the environment, save resources and conserve energy to ensure the well being of current and future generations. Every management level of the waste hierarchy is present on a construction site.
Recycling and reusing materials have long been associated with smart construction practices and this approach to waste management is being confirmed at local levels through municipal mandates on construction waste diversion. Experienced contractors are realizing the economic benefits of proper construction waste management and these practices also supply positive effects to the communities in which they occur.
Recycling, reusing and salvaging/reclaiming construction waste saves money, reduces waste disposal costs and provides revenue from the materials. Utilizing these methods on-site reduces the need for new materials, reduces the amount of waste that ends up in landfills and improves the cleanliness and safety of the project site. Many municipalities are mandating that bonds be placed to ensure a certain percentage of diversion occurs in order for the contractor to receive repayment in full.
any recycling comPany ThaT minimiZes The need for securiTy has iTs own inTeresTs in mind and should be avoided.

Page 32IFMA SUSTAINABILITY HOW-TO GUIDE WASTE STREAM MANAGEMENT
A Proactive Approach to Waste
The first step in minimizing waste is to plan ahead for uses of materials once their initial purpose has been satisfied or to use what is on hand before purchasing new products. In construction practices, this could take the form of designing to prevent waste, such as using standard sizes for building materials.
Materials and assemblies that can be easily disassembled at the end of their useful life should be specified and non-toxic interior finishes and products should be chosen. Consider reusing on-site materials or installing salvaged materials from previous projects or other off-site sources.
It is important to set up the practice of job-site waste prevention. This entails practices such as setting up central cutting areas for wood and other materials, reusing concrete forms or choosing reusable metal or fiberglass forms, and clearly marking areas key to waste prevention, such as material storage, central cutting and recycling stations. There are also standard material storage and handling procedures that can be implemented to prevent loss or damage in the first place.
Plan for Waste Prevention
Successful and profitable job-site handling of existing and unused materials begins with a waste management plan. A construction or demolition waste management plan does not need to be lengthy or complicated to be effective. Preparing a plan consists of identifying the types of debris that will be generated by the project and identifying how all waste streams will be handled. A successful waste management plan should contain the following:
� Waste recycling, salvage or reuse goals;
� Estimated types and quantities of materials or waste generated from the project site;
� Proposed and intended disposal methods for these materials;
� Intended procedures for handling the materials or waste; and
� Detailed instructions for subcontractors and laborers on how to separate or collect the materials at the job site.
A good plan outlines procedures, expectations and results for monitoring, collecting and promoting the initiative. A coordinator responsible for implementing the plan should be designated. Waste management goals, such as “reuse or recycle 75 percent of project wastes” should be set, specific waste-producing practices should be targeted and progress should be tracked. Waste management requirements should be included on all project documents, including subcontracts and specifications.
Types of waste will need to be defined and materials to be salvaged, reused, recycled and disposed of should be identified, including materials subcontractors will be responsible for. Handling procedures for removal, separation, storage and/or transportation need to be included and the disposal method for each material reused in place or on-site, salvaged, recycled or sent to a landfill should be indicated. It is extremely important that the plan is communicated repeatedly to all crew members at meetings, that it is posted online and that the final results are distributed.
Table 3:
consTrucTion maTerials
ThaT can be diverTed
� Asphalt paving
� Asphalt (bituminous) roofing
� Cardboard packing
� Carpet & carpet pads
� Ceiling tiles
� Clean wood
� Concrete
� Dimensional lumber
� Doors
� Door/window assemblies
� Electrical components
� Fibrous acoustic materials
� Glass (untempered)
� Gravel/aggregate products
� Insulation materials
� Landscape/land-clearing debris
� Lighting fixtures
� Masonry scrap/rubble
� Mechanical equipment
� Metals (ferrous/nonferrous)
� Paneling
� Plastics
� Plumbing fixtures & equipment
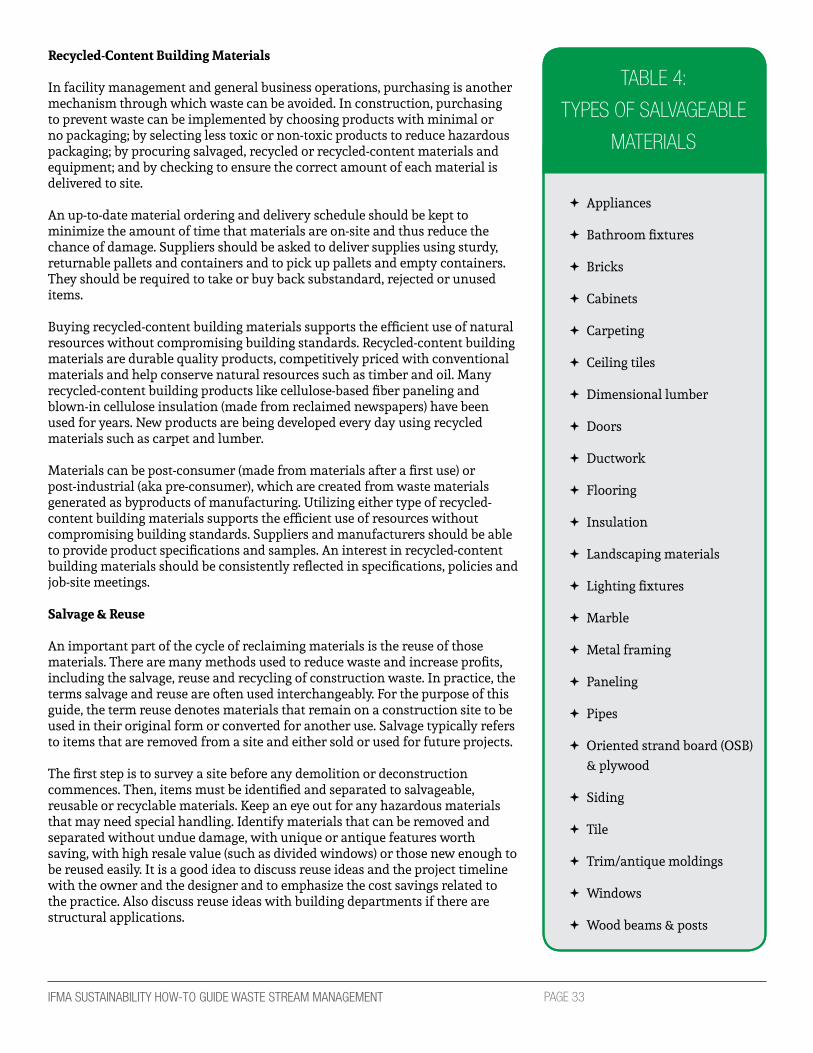
Page 33IFMA SUSTAINABILITY HOW-TO GUIDE WASTE STREAM MANAGEMENT
Recycled-Content Building Materials
In facility management and general business operations, purchasing is another mechanism through which waste can be avoided. In construction, purchasing to prevent waste can be implemented by choosing products with minimal or no packaging; by selecting less toxic or non-toxic products to reduce hazardous packaging; by procuring salvaged, recycled or recycled-content materials and equipment; and by checking to ensure the correct amount of each material is delivered to site.
An up-to-date material ordering and delivery schedule should be kept to minimize the amount of time that materials are on-site and thus reduce the chance of damage. Suppliers should be asked to deliver supplies using sturdy, returnable pallets and containers and to pick up pallets and empty containers. They should be required to take or buy back substandard, rejected or unused items.
Buying recycled-content building materials supports the efficient use of natural resources without compromising building standards. Recycled-content building materials are durable quality products, competitively priced with conventional materials and help conserve natural resources such as timber and oil. Many recycled-content building products like cellulose-based fiber paneling and blown-in cellulose insulation (made from reclaimed newspapers) have been used for years. New products are being developed every day using recycled materials such as carpet and lumber.
Materials can be post-consumer (made from materials after a first use) or post-industrial (aka pre-consumer), which are created from waste materials generated as byproducts of manufacturing. Utilizing either type of recycled-content building materials supports the efficient use of resources without compromising building standards. Suppliers and manufacturers should be able to provide product specifications and samples. An interest in recycled-content building materials should be consistently reflected in specifications, policies and job-site meetings.
Salvage & Reuse
An important part of the cycle of reclaiming materials is the reuse of those materials. There are many methods used to reduce waste and increase profits, including the salvage, reuse and recycling of construction waste. In practice, the terms salvage and reuse are often used interchangeably. For the purpose of this guide, the term reuse denotes materials that remain on a construction site to be used in their original form or converted for another use. Salvage typically refers to items that are removed from a site and either sold or used for future projects.
The first step is to survey a site before any demolition or deconstruction commences. Then, items must be identified and separated to salvageable, reusable or recyclable materials. Keep an eye out for any hazardous materials that may need special handling. Identify materials that can be removed and separated without undue damage, with unique or antique features worth saving, with high resale value (such as divided windows) or those new enough to be reused easily. It is a good idea to discuss reuse ideas and the project timeline with the owner and the designer and to emphasize the cost savings related to the practice. Also discuss reuse ideas with building departments if there are structural applications.
Table 4:
TyPes of salvageable
maTerials
� Appliances
� Bathroom fixtures
� Bricks
� Cabinets
� Carpeting
� Ceiling tiles
� Dimensional lumber
� Doors
� Ductwork
� Flooring
� Insulation
� Landscaping materials
� Lighting fixtures
� Marble
� Metal framing
� Paneling
� Pipes
� Oriented strand board (OSB) & plywood
� Siding
� Tile
� Trim/antique moldings
� Windows
� Wood beams & posts

Page 34IFMA SUSTAINABILITY HOW-TO GUIDE WASTE STREAM MANAGEMENT
Items to be reused on-site should be listed, as well as items for salvage (for reuse, resale and/or donation). There should be a plan for protecting, dismantling, handling, storing and transporting items combined with a schedule for the removal of salvageable and recyclable materials..
Removing salvageable items takes some planning as well. The deconstruction crew should be comprised of trained workers from current personnel or through subcontracting. Find waste diversion organizations, salvage companies or charities that will come on-site to remove materials. Determine a pick-up schedule, the duration of the process, what items they accept, if they offer advance site bids and whether they accept drop-offs. An important part of the salvage and reuse decision process is to determine if the repurposed items will be sold or donated. Extending the life cycle of items and diverting materials from landfill can potentially provide additional benefits including income, tax deduction or marketing opportunities.
Other viable efforts to properly dispose of these types of items include taking the materials to a local salvage center, conducting yard sales, allowing workers to take items for their own use or advertising the sale or donation of items in appropriate media. At the start of a project, evaluate whether these materials can be salvaged, donated or sold locally. Reused items can possess important functional or aesthetic features. Salvaged wood can be of a quality or variety hard to find today.
Recycling Construction & Demolition Debris
When opportunities for reuse or salvage are exhausted, recycling is the next alternative for diverting construction and demolition debris. Once the potential recyclable materials and recycling methods are identified, select what to recycle. The costs and revenues for recycling different construction debris (source-separated and co-mingled) should be compared with the costs for disposing of the waste material. Potential costs and savings for recycling can then be derived and the most cost-effective course of action can be determined. Look especially for material with high resale value such as copper wire and HVAC coils. Collection procedures and on-site space allocation, as well as removal and separation techniques, must be determined.
Contact local recyclers and haulers, Habitat for Humanity or other charities and determine which materials they would accept. Rural areas may offer alternative opportunities to recycling centers. Partner with local businesses — in particular, community groups may be interested in using construction waste materials. The same investigation into haulers and charities applies when researching possible recycling sources. Determine the specific guidelines for each material: which materials can be co-mingled and which need to be source-separated. Find out what the costs are for these types of deliveries. Drop boxes and pick-up service may be available, or there may be collection options, such as call for service, monitored drop boxes or scheduled pick-ups. There may be charges for services including drop box rental, hauling and tipping fees and receipts. A manifest of types and quantities of recyclables collected must be provided by the recycling vendor.
Space Allocation
Space is always at a premium on job sites, yet to make a waste management plan work, there need to be designated areas where materials for salvage, reuse or recycling can be placed. Place collection dumpsters as close to the work as possible and always provide a trash receptacle near these containers.
Table 5:
recyclable building
maTerials
� Acoustical ceiling tiles
� Asphalt
� Asphalt shingles
� Cardboard
� Carpet and carpet pads
� Concrete
� Drywall
� Fluorescent lights and ballasts
� Land-clearing debris (vegetation, stumpage, dirt)
� Metals
� Paint (use a hazardous waste outlet)
� Plastic film (sheeting, shrink wrap, packaging)
� Window glass
� Wood
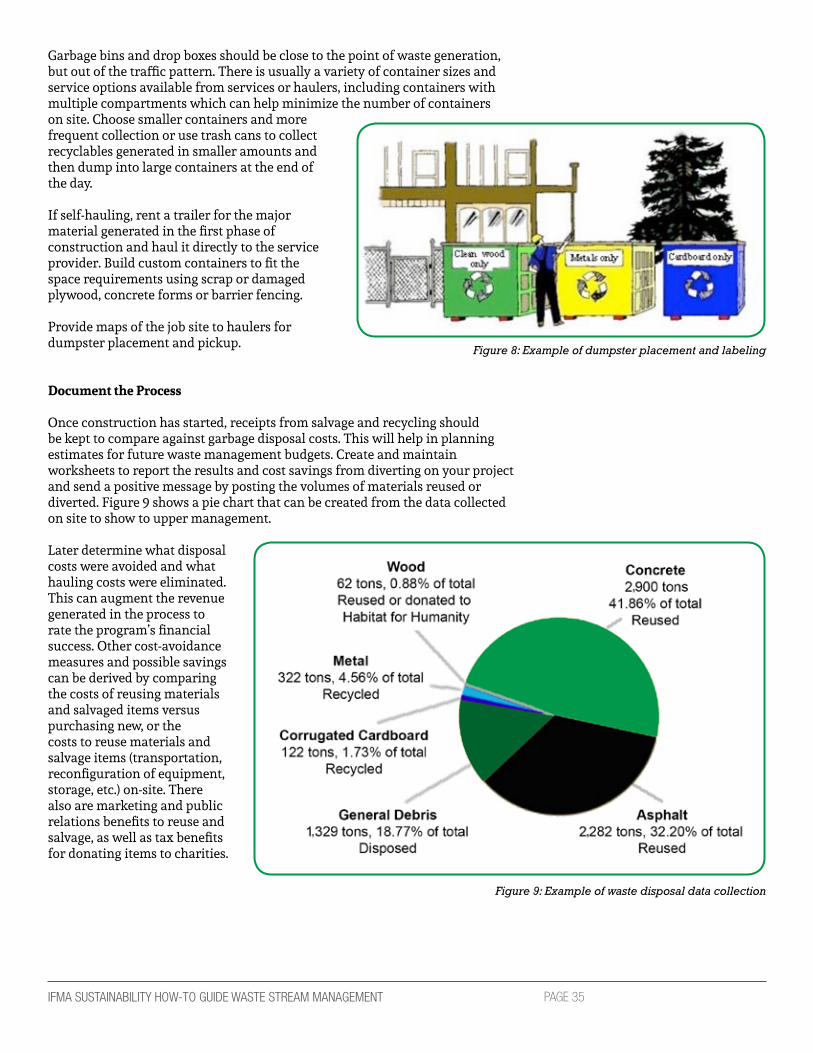
Page 35IFMA SUSTAINABILITY HOW-TO GUIDE WASTE STREAM MANAGEMENT
Garbage bins and drop boxes should be close to the point of waste generation, but out of the traffic pattern. There is usually a variety of container sizes and service options available from services or haulers, including containers with multiple compartments which can help minimize the number of containers on site. Choose smaller containers and more frequent collection or use trash cans to collect recyclables generated in smaller amounts and then dump into large containers at the end of the day.
If self-hauling, rent a trailer for the major material generated in the first phase of construction and haul it directly to the service provider. Build custom containers to fit the space requirements using scrap or damaged plywood, concrete forms or barrier fencing.
Provide maps of the job site to haulers for dumpster placement and pickup.
Document the Process
Once construction has started, receipts from salvage and recycling should be kept to compare against garbage disposal costs. This will help in planning estimates for future waste management budgets. Create and maintain worksheets to report the results and cost savings from diverting on your project and send a positive message by posting the volumes of materials reused or diverted. Figure 9 shows a pie chart that can be created from the data collected on site to show to upper management.
Later determine what disposal costs were avoided and what hauling costs were eliminated. This can augment the revenue generated in the process to rate the program’s financial success. Other cost-avoidance measures and possible savings can be derived by comparing the costs of reusing materials and salvaged items versus purchasing new, or the costs to reuse materials and salvage items (transportation, reconfiguration of equipment, storage, etc.) on-site. There also are marketing and public relations benefits to reuse and salvage, as well as tax benefits for donating items to charities.
Figure 8: Example of dumpster placement and labeling
Figure 9: Example of waste disposal data collection

Page 36IFMA SUSTAINABILITY HOW-TO GUIDE WASTE STREAM MANAGEMENT
3.4.6 Hazardous Materials
A waste that is deemed hazardous is any solid, gas or liquid that poses a substantial potential threat to public health or the environment. Hazardous waste occurs in all areas of life. The EPA regulates the storage, documentation and disposal or treatment of such wastes, and all U.S.-based companies and public buildings must have hazardous waste procedures that follow EPA regulations.
Many businesses, even small, community-based ones, generate hazardous waste. For example, dry cleaners, automobile repair shops, hospitals, exterminators and photo-processing centers all generate hazardous waste. Some hazardous waste generators are larger companies such as chemical manufacturers, electroplating companies and oil refineries. Even normal facilities generate hazardous waste. There are materials that are considered “universal wastes” that generally pose a lower threat and are produced in very large quantities by a large number of generators. Some of the most common universal wastes are fluorescent light bulbs, batteries, cathode ray tubes and mercury-containing devices (as shown in figure 10).
Regulations & Practices
Modern U.S. hazardous waste regulations began with the Resource Conservation and Recovery Act (RCRA) which was enacted in 1976. The primary contribution of RCRA was to create a cradle-to-grave system of record keeping for hazardous wastes. Hazardous wastes must be tracked from the time they are generated until their final disposition. RCRA’s record-keeping system helps to track the life cycle of hazardous waste and reduces the amount of illegally disposed hazardous waste. A U.S. facility that treats, stores or disposes of hazardous waste must obtain a permit for doing so. Generators and transporters of hazardous waste must meet specific requirements for handling, managing and tracking waste.
According to RCRA, hazardous wastes fall into two major categories. In regulatory terms, a hazardous waste is classified as a “characteristic waste” or a “listed waste.”2 Characteristic hazardous wastes are materials that are known to exhibit (or have exhibited in testing) a trait of at least one of the four characteristics of hazardous waste (ignitability, corrosiveness, reactivity or toxicity). These wastes may be found in different physical states such as gaseous, liquid, or solid. Furthermore, a hazardous waste is a special type of waste because it cannot be disposed of by common means like other by-products of everyday lives. Depending on the physical state of the waste, treatment and solidification processes might be available. In other cases, however, there is not much that can be done to prevent harm.
Hazardous materials are categorized by analysis and experience and are assigned hazard classes and packing groups based upon the risks they present during storage and transportation. They specify appropriate packaging and handling requirements for hazardous materials, and require a shipper to communicate the material’s hazards through the use of paperwork, package marking/labeling and vehicle placards. Regulations also require shippers to provide emergency response information applicable to the specific hazard or hazards of the material being transported. The proper storage of hazardous wastes is essential in keeping them from reaching the environment or damaging the health of individuals. Storage for hazardous wastes is heavily restricted 2 www.epa.gov/epawaste
Figure 10: Universal waste (http://www.deq.virginia.gov/Programs/LandProtec-
tionRevitalization/SolidHazardousWasteRegulatory-Programs/HazardousWaste/)
haZardous wasTes musT be Tracked from The Time They are generaTed unTil Their final disPosiTion.

Page 37IFMA SUSTAINABILITY HOW-TO GUIDE WASTE STREAM MANAGEMENT
and always considered temporary — hazardous materials are stored until they are moved, used or treated to be safe. One of the most basic storage units is the container, commonly a 55-gallon (208-liter) drum. Containers may be as large as buildings or railroad cars or as small as test tubes, but each container must be approved. Other storage units in which hazardous wastes may be placed include tanks, open waste piles, impoundments and containment facilities.
Facilities that store hazardous waste are documented as permitted or interim facilities. It is extremely important for the hazardous waste generator to keep well-organized and accurate records of hazardous waste management, not only for possible reporting requirements, but also because the EPA and other federal, state and local agencies can audit the business at any time. With an increasing focus on reducing, reusing and recycling, measures are being implemented at federal, state and local levels that affect many organizations. Some companies that were previously exempt from registering or reporting hazardous waste now are required to do so.
Record Keeping
Facilities that store hazardous waste must be permitted by the government to do so. Reports of these wastes are due annually to regulating parties to ensure they are properly kept, used and disposed of. Managing waste through record keeping is governed by many different bodies. Most governmental offices instruct proper record keeping at the highest levels, while companies might detail additional procedures. Permission for keeping hazardous waste is obtained through regulatory offices, which supply the proper documents. Procedures include permits and identification numbers for stored wastes and a manifest system that tracks all hazmat waste products and byproducts as they are transported.
3.5 Energy Recovery Strategies
There are several ways to recover energy from waste, including incineration, digestion, pyrolysis and gasification. Incineration is a type of direct combustion that is the controlled burning of municipal solid waste to reduce waste volume and to produce energy. Digestion is a naturally occurring process of decomposition and decay in which organic matter is broken down to simpler chemical components under aerobic (with oxygen) or anaerobic (without oxygen) conditions. Pyrolysis is the heating of waste to high temperatures to break down any carbon content, to a mixture of gaseous and liquid fuels and solid residue through
Figure 11: Potential energy of different household waste compared with solid fuels (Source: Assure – Energy from Waste fact sheet. http://www.igd.com/our-expertise/
Sustainability/Packaging-waste/3517/Energy-Recovery-and-Disposal/#4)

Page 38IFMA SUSTAINABILITY HOW-TO GUIDE WASTE STREAM MANAGEMENT
an absence of air. Gasification is the conversion of the carbonaceous content of a material through high-temperature partial oxidation into a gas stream comprised essentially of carbon monoxide, hydrogen and methane. Each strategy requires different ingredients and has different carbon emissions, outputs and efficiencies.
Using waste as fuel can have important environmental benefits. It can provide a safe and cost-effective disposal option for wastes that would otherwise present significant disposal problems. It can help reduce CO2 emissions through the displacement of fossil fuels and also improve energy security. Additionally, methane emissions from landfills can be avoided.
In terms of what should be incinerated, different waste types have different calorific (energy) values (see Figure 11). For example, power generated from mixed plastic waste represents a calorific value similar to coal.
3.5.1 Incineration Incineration is a disposal method that involves combustion of waste material. Incineration and other high-temperature waste treatment systems are sometimes described as “thermal treatment.” Incinerators convert waste materials into heat, gas, steam and ash. This disposal method is carried out both on a small scale by individuals and on a large scale by industry. It is used to dispose of solid, liquid and gaseous waste. It is recognized as a practical method of disposing of certain hazardous waste materials (such as biological medical waste). However, incineration is a controversial method of waste disposal, due to issues such as the emission of gaseous pollutants.
Incineration is common in countries such as Japan where land is scarce, as these facilities generally do not require as much area as landfills. Waste-to-energy (WtE) and energy-from-waste (EfW) are broad terms for facilities that burn waste in furnaces or boilers to generate heat, steam and/or electricity. Combustion in an incinerator is not always perfect and there are concerns about micro-pollutants in gaseous emissions from incinerator stacks. Particular concern has focused on some very persistent organics such as dioxins which may be created within the incinerator and may have serious environmental consequences in the area immediately around the incinerator. On the other hand, this method produces heat that can be used as energy.
In Europe, there have been steady improvements in waste treatment and efficient recovery of energy from waste. Waste is increasingly being seen as a resource. WtE plants are the keystone in modern waste management systems, playing a developing role in the environmentally sound processing of waste and in improving Europe’s resource efficiency. The facilities produce sustainable energy from the treatment of mixed municipal and household waste that remains after waste prevention and recycling.
Further, valuable parts of the bottom ash, the residue from a combustion process, can be recycled. Ferrous and non-ferrous metals in waste can be extracted from the bottom ashes and recycled into new products, such as aluminum castings for the automotive industry. Other remaining minerals can be used as secondary aggregates necessary for road construction or building products.
incinEration iS a controvErSial mEtHod oF waStE diSPoSal, due To issues such as The emission of gaseous PolluTanTs.

Page 39IFMA SUSTAINABILITY HOW-TO GUIDE WASTE STREAM MANAGEMENT
3.5.2 Digestion Technologies Waste materials that are organic in nature, such as plant material, food scraps and paper products, can be recycled using biological composting and digestion processes to decompose the organic matter. The resulting organic material then is recycled as mulch or compost for agricultural or landscaping purposes. In addition, waste gas from the process (such as methane) can be captured and used for generating electricity and heat (CHP/cogeneration) to maximize efficiency. The intention of biological processing in waste management is to control and accelerate the natural process of decomposing organic matter.
There exists a large variety of composting and digestion methods and technologies varying in complexity from simple home composts, to small-town scale-batch digesters, to industrial-scale enclosed-vessel digestion of mixed domestic waste. Methods of biological decomposition are differentiated as being aerobic or anaerobic, though hybrids of the two methods do exist.
Aerobic digestion needs oxygen. If aerobic bacteria are added to environmental conditions that are oxygen deficient, they will start to produce oxygen in these conditions for the duration of their life expectancy and for as long as they multiply. Bacteria which require oxygen will multiply and exist in soil or a liquid medium as long as there is enough dampness and a source of nourishment. When aerobic bacteria take over, aerobic waste digestion takes place. A wonderful aspect of aerobic digestion is that it does not give off foul-smelling gases like anaerobic digestion. Environmental conditions for humans and livestock improve due to aerobic digestion keeping disease-causing agents under control.
Anaerobic digestion is a series of processes in which microorganisms break down biodegradable material in the absence of oxygen and is frequently used to treat wastewater. As part of an integrated waste management system, anaerobic digestion reduces the emission of landfill gas into the atmosphere. Anaerobic digestion is used widely as a renewable energy source because the process produces a methane- and carbon dioxide-rich biogas suitable for energy production which helps replace fossil fuels. Also, the nutrient-rich digestate can be used as fertilizer.
Anaerobic digestion of the organic parts of municipal solid waste has been found in some LCA studies to be more environmentally effective than landfills, incineration or pyrolisis. The resulting biogas (methane) can be used for cogeneration. With further upgrading to synthetic natural gas, it can be injected into the natural gas network or further refined to hydrogen for use in stationary cogeneration fuel cells. Its use in fuel cells eliminates the pollution from products of combustion (SOx, NOx, particulates, dioxin, furans, etc.). Utilizing
The inTenTion of biological Processing in wasTe managemenT is To conTrol and acceleraTe The naTural Process of decomPosing organic maTTer.
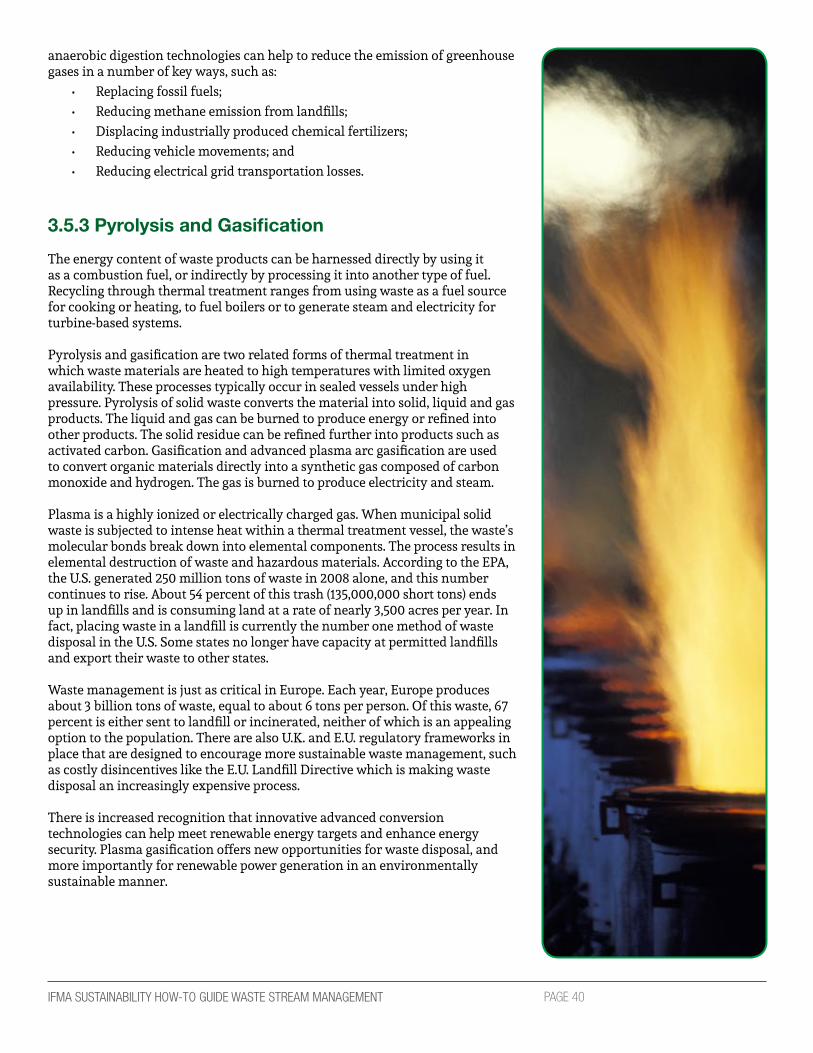
Page 40IFMA SUSTAINABILITY HOW-TO GUIDE WASTE STREAM MANAGEMENT
anaerobic digestion technologies can help to reduce the emission of greenhouse gases in a number of key ways, such as:
• Replacing fossil fuels; • Reducing methane emission from landfills; • Displacing industrially produced chemical fertilizers; • Reducing vehicle movements; and • Reducing electrical grid transportation losses.
3.5.3 Pyrolysis and Gasification The energy content of waste products can be harnessed directly by using it as a combustion fuel, or indirectly by processing it into another type of fuel. Recycling through thermal treatment ranges from using waste as a fuel source for cooking or heating, to fuel boilers or to generate steam and electricity for turbine-based systems.
Pyrolysis and gasification are two related forms of thermal treatment in which waste materials are heated to high temperatures with limited oxygen availability. These processes typically occur in sealed vessels under high pressure. Pyrolysis of solid waste converts the material into solid, liquid and gas products. The liquid and gas can be burned to produce energy or refined into other products. The solid residue can be refined further into products such as activated carbon. Gasification and advanced plasma arc gasification are used to convert organic materials directly into a synthetic gas composed of carbon monoxide and hydrogen. The gas is burned to produce electricity and steam.
Plasma is a highly ionized or electrically charged gas. When municipal solid waste is subjected to intense heat within a thermal treatment vessel, the waste’s molecular bonds break down into elemental components. The process results in elemental destruction of waste and hazardous materials. According to the EPA, the U.S. generated 250 million tons of waste in 2008 alone, and this number continues to rise. About 54 percent of this trash (135,000,000 short tons) ends up in landfills and is consuming land at a rate of nearly 3,500 acres per year. In fact, placing waste in a landfill is currently the number one method of waste disposal in the U.S. Some states no longer have capacity at permitted landfills and export their waste to other states.
Waste management is just as critical in Europe. Each year, Europe produces about 3 billion tons of waste, equal to about 6 tons per person. Of this waste, 67 percent is either sent to landfill or incinerated, neither of which is an appealing option to the population. There are also U.K. and E.U. regulatory frameworks in place that are designed to encourage more sustainable waste management, such as costly disincentives like the E.U. Landfill Directive which is making waste disposal an increasingly expensive process.
There is increased recognition that innovative advanced conversion technologies can help meet renewable energy targets and enhance energy security. Plasma gasification offers new opportunities for waste disposal, and more importantly for renewable power generation in an environmentally sustainable manner.
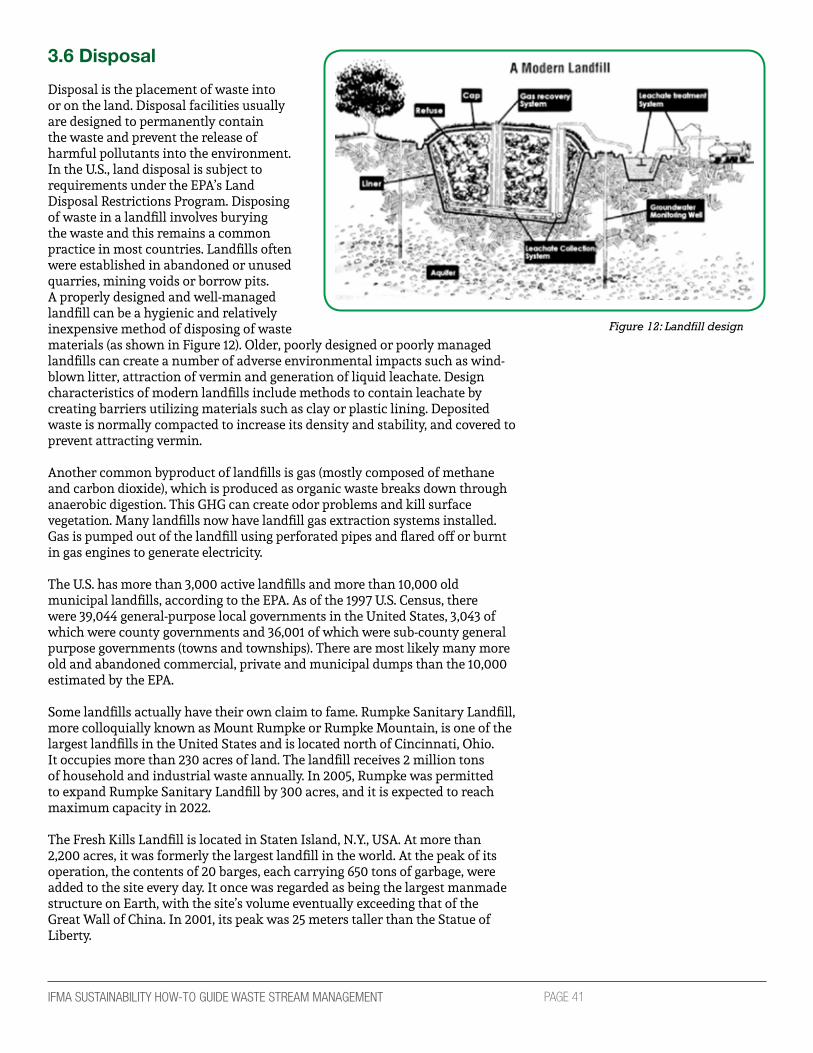
Page 41IFMA SUSTAINABILITY HOW-TO GUIDE WASTE STREAM MANAGEMENT
3.6 Disposal
Disposal is the placement of waste into or on the land. Disposal facilities usually are designed to permanently contain the waste and prevent the release of harmful pollutants into the environment. In the U.S., land disposal is subject to requirements under the EPA’s Land Disposal Restrictions Program. Disposing of waste in a landfill involves burying the waste and this remains a common practice in most countries. Landfills often were established in abandoned or unused quarries, mining voids or borrow pits. A properly designed and well-managed landfill can be a hygienic and relatively inexpensive method of disposing of waste materials (as shown in Figure 12). Older, poorly designed or poorly managed landfills can create a number of adverse environmental impacts such as wind-blown litter, attraction of vermin and generation of liquid leachate. Design characteristics of modern landfills include methods to contain leachate by creating barriers utilizing materials such as clay or plastic lining. Deposited waste is normally compacted to increase its density and stability, and covered to prevent attracting vermin.
Another common byproduct of landfills is gas (mostly composed of methane and carbon dioxide), which is produced as organic waste breaks down through anaerobic digestion. This GHG can create odor problems and kill surface vegetation. Many landfills now have landfill gas extraction systems installed. Gas is pumped out of the landfill using perforated pipes and flared off or burnt in gas engines to generate electricity.
The U.S. has more than 3,000 active landfills and more than 10,000 old municipal landfills, according to the EPA. As of the 1997 U.S. Census, there were 39,044 general-purpose local governments in the United States, 3,043 of which were county governments and 36,001 of which were sub-county general purpose governments (towns and townships). There are most likely many more old and abandoned commercial, private and municipal dumps than the 10,000 estimated by the EPA.
Some landfills actually have their own claim to fame. Rumpke Sanitary Landfill, more colloquially known as Mount Rumpke or Rumpke Mountain, is one of the largest landfills in the United States and is located north of Cincinnati, Ohio. It occupies more than 230 acres of land. The landfill receives 2 million tons of household and industrial waste annually. In 2005, Rumpke was permitted to expand Rumpke Sanitary Landfill by 300 acres, and it is expected to reach maximum capacity in 2022.
The Fresh Kills Landfill is located in Staten Island, N.Y., USA. At more than 2,200 acres, it was formerly the largest landfill in the world. At the peak of its operation, the contents of 20 barges, each carrying 650 tons of garbage, were added to the site every day. It once was regarded as being the largest manmade structure on Earth, with the site’s volume eventually exceeding that of the Great Wall of China. In 2001, its peak was 25 meters taller than the Statue of Liberty.
Figure 12: Landfill design

Page 42IFMA SUSTAINABILITY HOW-TO GUIDE WASTE STREAM MANAGEMENT
In Mexico City, the government has taken an aggressive stance regarding waste and the detrimental effects of landfills. They have closed the Bordo Poniente Landfill, a 927-acre garbage dump that houses upwards of 76 million tons of refuse. As of Dec. 19, 2011, garbage vehicles have not been permitted to use the site, which was receiving 12,000 tons of trash daily.
Mexico City has been working for years to turn one of the planet’s biggest and messiest waste management systems into one of the greenest. Three years prior to this move, the city recycled only 6 percent of its garbage. At the end of 2011, that number is closer to 60 percent. A plan is in place to open a new plant to recycle construction waste into building material; the concrete company Cemex SAB has agreed to purchase 3,000 tons of garbage daily to turn into energy; and the city also is negotiating with a guild of scavengers who traditionally have been a part of Mexico’s waste management system.
Closing the landfill will reduce greenhouse gas emissions by a minimum of 2 million tons of carbon dioxide a year. Solid waste in landfills is also the third-largest source of anthropogenic methane emissions, which is 23 times more potent as a greenhouse gas agent than CO2. Capturing methane from the Bordo Poniente landfill could further reduce GHG emissions by 25 million tons of CO2 equivalent over the next 25 years, which is more than 25 percent of the city’s total emissions. Globally, this represents one of the largest reductions of GHG emissions associated with solid waste management.
Mexico City will implement a major project to harness the methane gas produced at the dump into energy. It is estimated that this methane could generate more than 250 GWh, or enough power for an estimated 35,000 homes in Mexico City during the first years of operations.
This project represents one of the most important environmental actions for the entire country of Mexico. Not only will it stem the city’s largest source of GHG emissions, it also will create renewable energy and jobs. Developed in close collaboration with the Clinton Climate Initiative (CCI) cities program and its partner, the C40 Cities Climate Leadership Group (C40), this project provides a model for reducing GHG emissions through sustainable waste management that can be replicated worldwide.
Bordo Poniente Landfill
mexico ciTy has been working for years To Turn one of The PlaneT’s biggesT and messiesT wasTe managemenT sysTems inTo one of The greenesT.

Page 43IFMA SUSTAINABILITY HOW-TO GUIDE WASTE STREAM MANAGEMENT
Part 4MAking tHE businEss cAsE
Waste management is just what it claims to be; a management process put in place to handle the unused and unwanted remnants created through a number of other processes. It may be more appropriate to refer to this aspect of business as resource management. Taking a step back from the trash can provides a more holistic view of how a piece of residue actually was created: from the harvesting of materials, production, packaging, transportation and delivery; to the selection and purchase of a product, its utilization, evaluation of possible repurposing; to where it’s going to go, how it’s going to get there and what will happen to it once it arrives.
Each of the above steps involves certain costs. A proper waste/resource management plan can mitigate or minimize expenses and, perhaps, help recoup some of the money spent in the process. Such a policy will involve more than compliance. It should entail action taken to eliminate the generation, discharge and disposal of waste materials and to efficiently utilize all possible resources. This can be done with a plan that will change materials, equipment, and processes to eliminate by-products of business activities.
The benefits of resource/waste management include cost savings and cost avoidance through source reduction and waste prevention and reduction. It creates the opportunity to initiate improved operations and increased management efficiencies. These could be devised through policy review and development, as anything that is managed can be measured, and anything that is measured can be improved. Increased sustainability and diversion from landfills achieved through recycling alternatives can also minimize hauling fees and, perhaps, create a supplemental revenue stream for the facility.
A less obvious benefit of such an initiative is that it tends to bring out the best in employees. Employee training, education and continual communication can emphasize that all employees have a responsibility to protect the environment and that this can be easily achieved. It will lead to a cleaner, neater, safer facility and will contribute to higher employee morale and community pride. Such programs can lead to corporate environmental and recycling awareness that can be used to promote the company as a responsible corporate citizen.
wasTe managemenT is resource managemenT.

Page 44IFMA SUSTAINABILITY HOW-TO GUIDE WASTE STREAM MANAGEMENT
The implementation of a waste and resource management program involves the creation of a strategic plan and is not a short-term project. It should be actively embedded in a company’s business philosophy. Secure an executive charter and commitment and establish procedures and standard practices that focus on sound purchasing practices, resource conservation and waste prevention. Everyone in the organization should be involved, including customers, suppliers, subcontractors and stakeholders. Rather than focusing on the science behind the plan, concentrate on making the program fit your company culture. Track and report all meaningful results and recognize and reward success in all phases. This type of program will allow companies to stay ahead of regulations through innovation and develop a mindset of continuous improvement.
Any company not using practices of environmental excellence and sustainability is leaving money on the table, losing competitive advantage and missing the opportunity to position itself for the future. Implementing a waste/resource management program will help companies become more efficient, save money and improve their reputations. It has been reported that the first 80 percent of waste reduction yields a 10:1 return on capital investment and not all the solutions have been invented yet. This is why making a plan as soon as possible makes sense and why planning for continuous improvement is vital. Waste/resource management is just one way in which the future of an organization, the environment and society as a whole will be determined.
imPlemenTing a wasTe/resource managemenT Program will helP comPanies become more efficienT, save money and imProve Their rePuTaTions.

Page 45IFMA SUSTAINABILITY HOW-TO GUIDE WASTE STREAM MANAGEMENT
Part 5cAsE studiEs
5.1 Case Study #1: Commercial Facility, California, USA
A commercial enterprise in California, committed to sustainability, is working proactively to be a model for other organizations and the local community. Their policy is to improve environmental quality through wise business decisions, including best business practices, energy conservation and resource and waste management. Company leaders believe it is their responsibility to minimize the business’ effect on the environment while maintaining a healthy workplace for their employees. They feel that sustainable operations directly factor into the growth, operational excellence and financial success of their organization.
As part of a Leadership in Energy and Environmental Design (LEED) certification effort, in which they achieved a LEED Platinum certification through the Existing Building: Operations and Maintenance program of the United States Green Building Council, the organization implemented a plan that included purchasing sustainable products and recycling waste.
The facility management team worked with the purchasing department to audit current purchase practices for all office supplies, equipment and furniture to determine what qualified as a “sustainable purchase.” For example, they looked for items containing at least 70 percent salvaged materials, 10 percent post-consumer content or 20 percent post-industrial content. Their goal was to increase the percentage of purchases that met sustainable criteria to at least 50 percent of their total: they achieved 54 percent. Their purchases included recycled paper, energy-efficient office equipment and recycling containers.
The organization set in place a program through which it would purchase alternative materials and utilize indoor air quality-compliant materials and sustainable cleaning products and materials. The initial outlay of costs for the purchases was US$42,828 with a projected annual savings of US$21,888. This created an estimated time frame for return on investment of about two years, with the benefits of this initiative extending far beyond that.
Another purchasing decision they made would have even a greater cost impact. The company stopped purchasing polystyrene cups and replaced them with washable cups and mugs. The cost was US$7,587 for cups and mugs, eliminating the purchase of 750,000 polystyrene cups per year for a total savings of US$52,000.
The organization also implemented a recycling program. Their goal was to achieve at least a 50 percent diversion rate for their waste stream to obtain the maximum number of LEED points in the certification process. However, the facilities department set its own more aggressive goal of recycling 95 percent of all recyclable materials. The organization was already recycling cans, bottles and paper throughout the campus and thought they were doing very well. After they performed an audit of all of their waste, they found their recycling rate was only 40 percent. They now recycle all metals, f luorescent lights, batteries and construction waste. Through these efforts, they have achieved a 70.4 percent recycling rate.
The comPany believes iT is Their resPonsibiliTy To minimiZe Their effecT on The environmenT while mainTaining a healThy workPlace for Their emPloyees.

Page 46IFMA SUSTAINABILITY HOW-TO GUIDE WASTE STREAM MANAGEMENT
5.2 Case Study #2: Agnes Scott College, Atlanta, Ga., USA
Agnes Scott College is a small liberal arts college in Atlanta, Ga., USA and a signatory of the American College and University Presidents’ Climate Commitment. In 2008, the college created a zero waste goal as part of its campus-wide sustainability efforts.
The first step of the program was to understand the definition of zero waste and each department’s responsibilities. The facilities department and the office of sustainability outlined each person’s responsibilities and delineated what the student volunteers would do and what the custodians would do. The office of sustainability also drafted a zero waste and closed-loop system goals policy statement that fit in with the college’s overarching sustainability goals. This policy, in addition to a new “reduce, reuse, recycle, rethink” logo, created a foundation for the education program that followed. Student involvement was very important to the college. The sustainability office recruited residents to be responsible for sustainability efforts in each residence hall. The office also had student volunteers and interns work on education and communication programs. Student volunteers also ran a “Recyclemania” contest each spring.
In the first year of the program, the college focused on its recycling efforts and got students involved. The first step was to inventory the current trash and recycling bins on campus. Where cans were lacking, they discussed whether or not to buy more bins or to use different color bags. To save money, the college used colored bags in existing trash cans. Clear bags were used for trash and blue bags for recycling. The college also decided to use a single-stream collection process for recycling. At the time, the college did not have a large enough volume to make money off of individual streams such as paper, cardboard or plastic, so single-stream collection was simpler.
In the program’s second year, the college implemented composting collections in their two dining locations and in the residence hall kitchens. At the time, there was only one vendor that hauled food waste to their facility for composting, and access to that vendor was limited. At the beginning of the program, containers were placed at customer-accessible locations so customers had to sort their trash/recycling/composting before placing dishes on the dish return. The containers then were emptied into 35-gallon containers and placed on the loading dock for pickup, along with waste materials from the kitchen prep area containers. Two of the residence halls were chosen to pilot the composting program. Bins were placed in the kitchens of each floor and the students removed the waste bags to combine them with the containers on the loading dock. Contamination of the food waste with such non-compostable items as plastic straw wrappers and ketchup containers was a problem in the beginning.The variety of locations and waste streams managed by the facilities department resulted in many different locations and types of containers offered on campus.
Figure 13: Agnes Scott College Woodruff Quad (picture provided by
Agnes Scott College)
Figure 14: Recyclemania trophy (picture provided by Agnes Scott
College)
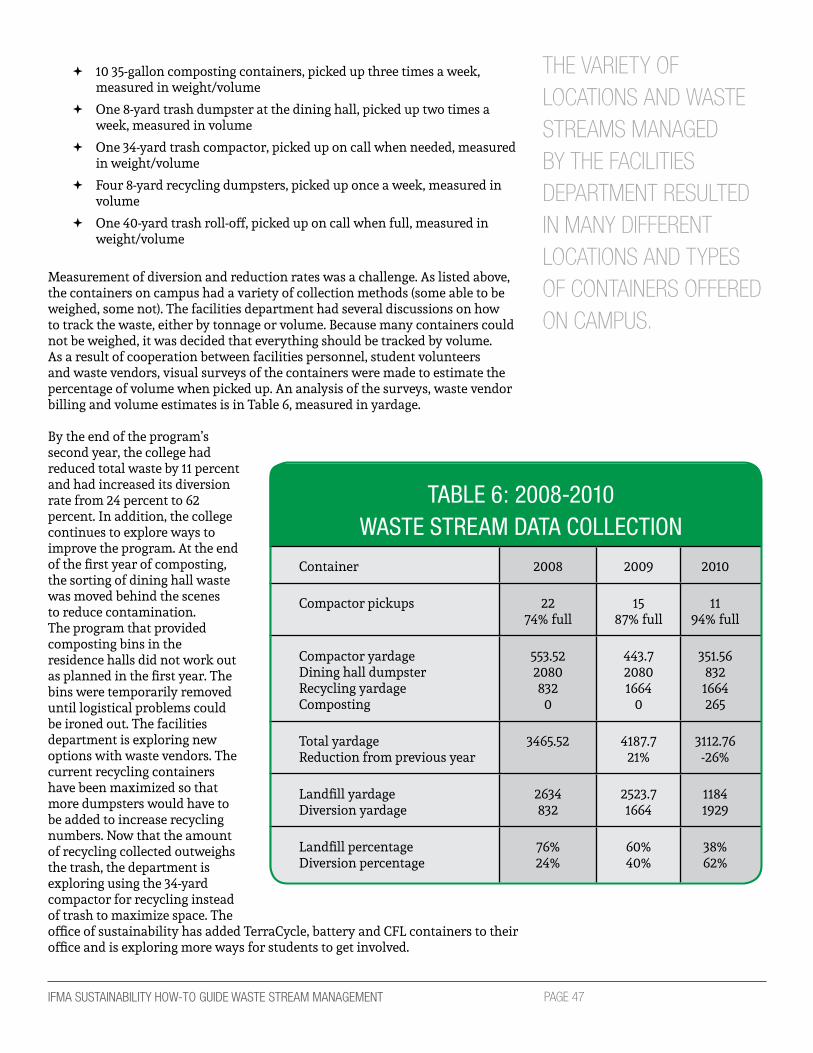
Page 47IFMA SUSTAINABILITY HOW-TO GUIDE WASTE STREAM MANAGEMENT
The varieTy of locaTions and wasTe sTreams managed by The faciliTies deParTmenT resulTed in many differenT locaTions and TyPes of conTainers offered on camPus.
Table 6: 2008-2010 WasTe sTream DaTa ColleCTion
Container 2008 2009 2010
Compactor pickups 2274% full
1587% full
1194% full
Compactor yardageDining hall dumpsterRecycling yardageComposting
553.522080832
0
443.720801664
0
351.56832
1664265
Total yardageReduction from previous year
3465.52 4187.721%
3112.76-26%
Landfill yardageDiversion yardage
2634832
2523.71664
11841929
Landfill percentageDiversion percentage
76%24%
60%40%
38%62%
� 10 35-gallon composting containers, picked up three times a week, measured in weight/volume
� One 8-yard trash dumpster at the dining hall, picked up two times a week, measured in volume
� One 34-yard trash compactor, picked up on call when needed, measured in weight/volume
� Four 8-yard recycling dumpsters, picked up once a week, measured in volume
� One 40-yard trash roll-off, picked up on call when full, measured in weight/volume
Measurement of diversion and reduction rates was a challenge. As listed above, the containers on campus had a variety of collection methods (some able to be weighed, some not). The facilities department had several discussions on how to track the waste, either by tonnage or volume. Because many containers could not be weighed, it was decided that everything should be tracked by volume. As a result of cooperation between facilities personnel, student volunteers and waste vendors, visual surveys of the containers were made to estimate the percentage of volume when picked up. An analysis of the surveys, waste vendor billing and volume estimates is in Table 6, measured in yardage.
By the end of the program’s second year, the college had reduced total waste by 11 percent and had increased its diversion rate from 24 percent to 62 percent. In addition, the college continues to explore ways to improve the program. At the end of the first year of composting, the sorting of dining hall waste was moved behind the scenes to reduce contamination. The program that provided composting bins in the residence halls did not work out as planned in the first year. The bins were temporarily removed until logistical problems could be ironed out. The facilities department is exploring new options with waste vendors. The current recycling containers have been maximized so that more dumpsters would have to be added to increase recycling numbers. Now that the amount of recycling collected outweighs the trash, the department is exploring using the 34-yard compactor for recycling instead of trash to maximize space. The office of sustainability has added TerraCycle, battery and CFL containers to their office and is exploring more ways for students to get involved.

Page 48IFMA SUSTAINABILITY HOW-TO GUIDE WASTE STREAM MANAGEMENT
5.3 Case Study #3: Environmental Protection Division, Georgia Department of Natural Resources, Atlanta, Ga., USA
The Georgia Environmental Protection Division’s (EPD) Tradeport campus, located near Atlanta’s Hartsfield-Jackson International Airport, is home to approximately 500 state of Georgia employees. Since becoming the first state facility in Georgia to join the U.S. EPA’s WasteWise program as a partner member in November 2006, the Tradeport has instituted and sustained a number of waste reduction efforts. The 2009 program accomplishments and enhancements are listed in this case study.
The complex has a comprehensive single-stream recycling program which accepts paper, glass, plastic and metal. Employees have small, blue desk-side bins which are emptied nightly by the janitorial staff. In 2009, Tradeport employees recycled an estimated 92.5 tons of paper, aluminum, cardboard and plastic. Employees also continued to divert used coffee grounds from the employee break room. In 2009, this accounted for an additional 1.04 tons of material; the grounds are collected by employees for use in their home compost bins. Through these efforts alone, the complex achieved an overall waste diversion rate of 1.87 pounds of recovered material per employee per workday in 2009.
All Tradeport activities are coordinated by an internal employee green team known as the Recycling Awareness Team (RAT). The team includes representatives from various programs and branches within the organization, as well as the on-site facility manager. A key task of the team is to evaluate the effectiveness of the program and look for opportunities to improve and expand ongoing waste reduction and recycling initiatives.
In addition to managing this traditional ongoing recycling program, the team also is called upon to assist other divisions within the agency with special or one-time waste reduction projects. For example, the team worked with four EPD branches to find management options for items from the clean out of a warehouse and coordinate logistics for managing the material. The team identified companies to recycle paper and metals from the project and provide waste hauling services for those items that could not be recycled or reused. During the project:
• 2.4 tons of waste were removed• One 30 cubic yard container was diverted for recycling• One 30 cubic yard container was diverted for reuse
In 2009, the team worked with both property managers at the complex and representatives from Waste Management Inc. to revise the waste hauling contract to encourage resource management. Under the new agreement, EPD reduced the number of pulls for waste hauling by two pulls per week and worked with Waste Management to bundle both the single-stream recycling and waste collection services for the facility. As a result of these two modifications, the property saves US$6,482.64 per year — equivalent to a 38 percent reduction — in waste management costs.
Figure 15: Waste audit (picture provided by the Georgia
Environmental Protection Division)
in 2009, TradePorT emPloyees recycled an esTimaTed 92.5 Tons of PaPer, aluminum, cardboard and PlasTic.

Page 49IFMA SUSTAINABILITY HOW-TO GUIDE WASTE STREAM MANAGEMENT
Figure 16: Recycling Awareness Team participating in a clean-up event
(Picture provided by the Georgia EPD)
The team also streamlined collection efficiencies and addressed contamination and logistical issues with the recycling program, including working with haulers to resolve collection problems and placing additional explanatory signage near the recycling bin in a kitchen/break room. To minimize contamination, bins are labeled with a sticker that lists acceptable materials and an email address to which questions and suggestions can be directed.
To increase participation and collection rates, the team placed new single-stream recycling bins in common and public areas around the Tradeport. A total of 40 22-gallon bins featuring a customized lid which reinforces the single-stream recycling message were purchased and placed throughout the complex. The team estimated the number of bins needed based on the layout of the office complex, including the locations of common printer/copier stations, paper shredders, kitchen/break room areas and public spaces. Signage produced in-house was affixed to the bins for educational and practical purposes.
A 60-gallon dual-purpose bin (one side for mixed recyclables and one side for waste) also was purchased and placed in the Tradeport’s largest conference room. Signage was also produced to explain the bin’s two openings. Before delivery of the new bins, the team worked with the property manager and janitorial staff to ensure there was nothing in the existing contract to prevent the janitorial staff from emptying the bins. Ongoing employee education and outreach is a critical component of the Tradeport’s waste reduction program. In addition to continually reinforcing the importance of waste reduction and specific program attributes to employees through employee newsletters, special outreach events and posters, the Recycling Awareness Team also emails employees throughout the year. These emails serve as reminders about ongoing waste reduction initiatives within the facility, as well as special events. The team also uses email to emphasize that waste reduction and sustainable practices can be integrated into employees’ lives outside the workplace. For example, the team sends emails to let employees know about upcoming community recycling events. In 2009, these included Keep Atlanta Beautiful Electronics Recycling Day, Living Green Festival and CBS Atlanta’s Third Great Shredder Event.
Another strategy used to reinforce the waste reduction message is outreach events throughout the year that highlight specific internal programs, celebrate green holidays or promote sustainable living practices. To celebrate Earth Day 2009, the Tradeport Recycling Awareness Team sponsored four “lunch-and-learn” events, introduced a green purchasing promotion on Administrative Professional’s Day, and kicked off a pilot organic produce box delivery program for the campus. The waste reduction lunch-and-learn was a hands-on workshop during which employees constructed their own vermicomposting bin, complete with worms! Other lunchtime events focused on alternative commute methods and incentives available for carpooling, the benefits of planting native and drought-tolerant species and an update on the drought in Georgia.
onGoinG EmPloyEE Education and outrEacH iS a critical comPonEnt oF tHE tradEPort’S waStE rEduction ProGram.

Page 50IFMA SUSTAINABILITY HOW-TO GUIDE WASTE STREAM MANAGEMENT
For Administrative Professional’s Day, the Recycling Awareness Team presented arrangements of native flowers to each employee tasked with purchasing. Tied to the vase was a card reminding them of the proliferation of green office products readily available from local retailers and suppliers under state contract.
Introduced for Earth Day, the team began an organic produce box program for employees in May 2009. This employee-led program gives Tradeport employees (as well as others in the community) the opportunity to purchase boxes of certified organic produce directly from a wholesale distributor. To reduce the cost of the program, participants take turns picking up the boxes from the distributor and delivering them to the Tradeport the first and third Thursday of every month. From May to December 2009, employees ordered 202 boxes of organic produce. This program helps reinforce the idea of how choices we make can reduce our environmental footprint. It also provides an opportunity to support community-based agriculture in our area, since many locally grown items are also included in the boxes.
Another ongoing recycling/waste reduction program that began in 2009 was the placement of collection bins around Tradeport for gently worn shoes to benefit the Soles4Souls program. An employee outside the green team initiated and coordinates this effort. Participation increased steadily following the initial placement of the bins in the fall.
In response to devastating local flooding in the greater Atlanta area, the team sponsored a diaper and used clothing drive for flood victims and relief organizations in Cobb County. More than 200 diapers and 10 bags of clothing (approximately 350 pounds of materials) were collected.
The team also promotes the internal waste reduction program through orientation materials given to new employees. In 2009, 35 employees participated in orientation sessions. The materials include general information on greening the office; a primer on waste generation, reduction and recycling in Georgia; and a list of recycling options available at the various EPD office locations around the state.
The Tradeport is committed to promoting waste reduction and the EPA WasteWise program outside the facility boundaries and routinely mentions its participation in WasteWise during presentations to outside audiences. For example, in 2009 a member of the team gave four presentations (to a total audience of 165) that included information on the benefits of WasteWise:
� Compost and recycling options for commercial businesses — given to six business associations in Cobb County, one of Georgia’s largest counties
� Waste reduction practices — given at the Green Foodservice Alliance’s “Recycling: Waste or Product” workshop
� Organics recovery — given at a Green Expo held in Cobb County
� Environmental benefits (e.g., climate change, soil, water) associated with diverting organics from landfills — given to restaurant industry representatives

Page 51IFMA SUSTAINABILITY HOW-TO GUIDE WASTE STREAM MANAGEMENT
5.4 Case Study #4: Corporate Real Estate Division, Pacific Gas & Electric, San Francisco, Calif., USA
The term “waste” in facility management often brings to mind visions of trash, particularly trash that is headed to landfills, but waste can also mean inefficiencies in cost, energy, time, and labor. When combining these two visions of “waste” and sending less material to landfills, the facility can improve efficiencies in cost, energy, time and labor in managing its waste stream. Pacific Gas & Electric (PG&E) developed a multi-year program to reduce the amount of waste it delivers to landfills and began changing its culture in the process.
The PG&E Waste Reduction program is one element in PG&E’s overall environmental leadership program. The larger goal is to achieve and demonstrate top-tier environmental leadership by reducing its environmental footprint, promoting healthy environments and supporting PG&E business goals. Besides waste, PG&E’s program includes elements of energy and water reduction, and LEED certifications.
PG&E is a gas and electric energy provider in Northern California, known for being a leader in energy conservation for its customers. But PG&E also has 7 million square feet of building facilities for its own operations. The portfolio includes a headquarters high-rise block in downtown San Francisco, which is about 25 percent of the square footage, 15 percent other office space and the balance is mostly service centers with a few payment centers, warehouses and a data center. About 80 percent of the portfolio is owned.
The U.S. EPA states that the methane gas produced by decomposing landfill waste contributes more than 20 times the greenhouse gas effect to the atmosphere than carbon dioxide, and also causes harmful chemicals to leak into the ground, contaminating the soil and threatening the water supply.
With that in mind, in 2009 PG&E recognized that if it were to meet its goal of being considered an environmental leader, it would need to set up a formalized program to address its facility’s waste stream. Although some office recycling was underway at some sites, there was no cohesive vision, no goals and no data to measure progress. The first step was to agree upon an objective: to establish a multi-year, comprehensive program to measure and reduce the amount of waste sent to landfills from Corporate Real Estate (CRE) managed buildings and activities. In order to focus the program, PG&E elected not to include hazardous waste, construction waste and other waste produced by operations. Based on this, CRE developed an outline for a five-year program with the specific goal of demonstrating that the company is in the top performance decile by 2014.
Program Strategy and Plan
The program was outlined with a stepped approach in all areas. The team elected to start with pilots to uncover opportunities and identify challenges and risks. They were then able to successfully expand to include more sites and more materials. By demonstrating the financial, operational and environmental
Figure 17: PG&E, San Francisco(Picture provided by the PG&E)
Pg&e is a gas and elecTric energy Provider in norThern california, known for being a leader in energy conservaTion for iTs cusTomers.

Page 52IFMA SUSTAINABILITY HOW-TO GUIDE WASTE STREAM MANAGEMENT
benefits on a smaller scale initially, they built confidence in the program and eased the way for adoption at new sites and by more employees. The program outline included:
1. Strategy:
a. Vision
b. Pilots — learn lessons, identify risks and challenges
c. Annual scope increases
d. Report and communicate
2. Plan:
a. Goals — quarterly, annual and five-year
b. Data gathering, tracking, verification and reporting
c. Define types of waste included
d. Benchmarking
3. Implement:
a. Identify and obtain resources — consultants, equipment, funding, management and engagement
b. Steps for improvement:
i. Start with larger sites in diverse geographic areas
ii. Identify and prioritize opportunities — perform audits, review data
iii. Easy fixes of existing set ups — right-sizing bins, adding signage
iv. Employee and janitorial education and engagement
v. Work with existing hauler to divert more types of waste
vi. Review applicable regulations for potential limitations
vii. Change haulers if needed to increase waste diversion opportunities
viii. Further engage and incent employees to support and implement goals
Importance and Challenges of Waste Data
As with most process improvement, PG&E recognized that “you can’t manage what you don’t measure.” PG&E’s waste program implementers began gathering data on its current practices in order to understand and benchmark its performance both internally between sites and externally with other companies, and to determine the actual quantities of waste.
PG&E found that some waste haulers report waste in cubic yards, some in tons and others in number of bins. Team members reached out to the industry and found a consulting service provider that was set up with a process and computer program to convert the invoice data into a consistent set of data, with all waste measured in tons. Through external benchmarking they found inconsistent metrics reported by other corporations. Some reported total tons diverted on a project or process, while others reported specific diversion rates they met or had hoped to meet. Furthermore, the types of waste included were not specified in their reports. No universal standard reporting metrics were found.
aS witH moSt ProcESS imProvEmEnt, PG&E rEcoGnizEd tHat “you can’t manaGE wHat you don’t mEaSurE.”

Page 53IFMA SUSTAINABILITY HOW-TO GUIDE WASTE STREAM MANAGEMENT
However, the most common metric found referred to the percent of diversion of waste from landfills using weight in tons or volume in cubic yards. This diversion percentage is calculated by dividing the total tons of waste by the tons that are recycled, composted or otherwise diverted. Government entity and other non-profit reports often use this metric. Therefore, PG&E elected to use as their metric the percent of waste diverted from landfills as measured in tons.
As PG&E began to work with this metric based on weight, they found some interesting nuances. The details of what materials were included greatly influenced the diversion rate. For instance, office waste had a typical diversion rate in the 40 to 60 percent range. When they expanded the scope to include waste in their service center yards — pallets, metals and other maintenance-related materials — the base diversion rate climbed to a combined 71 percent. The added materials were much heavier, changing the results and making the target of 70 percent indefensible. The solution was to increase the target diversion rate from 70 to 80 percent.
Employee Engagement
The success of waste programs is highly dependent upon how they are utilized. Facility managers can set up all the right bins, but if the waste is not placed into the right bins by employees or handled correctly by the janitorial staff, the program cannot succeed. PG&E found this involved the following key elements:
1. Making it as easy as possible; preferably easier than it had beenWaste-sorting bins should be placed in locations most convenient to where the waste is produced. For instance, in office break rooms, the compost bin should be close to the coffee maker and sink to collect coffee grounds and leftover food items. In addition, making the waste bins smaller than the recycling bins sends the visual message that fewer items should be going into the landfill bins. These subtle changes were implemented in the headquarters and the diversion rate improved by five percentage points.
2. Considering the impacts of every aspect of the business and facility PG&E service centers accommodate office employees and physical crews who construct and maintain the gas and electric operating systems. This involves a variety of work schedules, significant materials handling and maintaining strict traffic patterns on site for safety. All work groups need to be consulted and need to buy into the changes in operations involving waste. By learning the details of the work processes, facility managers were able to strategically place the recycling bins to reduce labor and time, which ensured the new arrangement could be accepted and even embraced.
3. Training and educationTraining begins with the janitorial staff. They need to know how to place items in various recycling, waste and storage collection bins and the importance of maintaining material separation. This expectation is then integrated into the janitorial contract to ensure that new janitors are trained and that existing staff receives regular refresher trainings.
The success of wasTe Programs is highly dePendenT uPon how They are uTiliZed.

Page 54IFMA SUSTAINABILITY HOW-TO GUIDE WASTE STREAM MANAGEMENT
For employees, signage is key! New habits are hard to integrate into behavior, and waste sorting is no exception. Clear, color-coded signs help people navigate new processes and provide real-time guidance. Materials may be sorted differently in different locations depending upon the service available in the area. New employees may need to learn a different waste sorting system at their new site. In addition, the recycling program at an employee’s home may be different from the program at work. This means that education and training cannot be considered a one-time event. Constant visual reinforcement is required. In addition to signage on and adjacent to bins, PG&E found it helpful in office areas to tape samples of the most commonly used items above the bins into which the items are to be placed.
4. Communication and feedbackIn order to raise awareness and elevate the importance of waste sorting, PG&E elected to utilize various communication channels. The first step in introducing the new process was to hold kick-off events as employees arrived at work in the morning. They were greeted with coffee and pastries near a display outlining the new waste disposal system.
Going forward, the waste program team provided regular feedback to employees with emails and by posting quarterly site-by-site thermometer-style graphs of progress on an internal website, with paper copies posted on breakroom bulletin boards. The website also provided tools such as a spreadsheet outlining how to sort waste at each site, one-page documents focusing on particular waste disposal topics for use at staff meetings and links to other related resources. To reinforce leadership’s support, the company’s website often featured special articles as well.
5. Creating a forum for engagement/participationAlong the way, an all-volunteer employee-led group, known as the Grassroots Green Network, sprang up. The group grew by 400 percent in three years, created its own website, began holding monthly group meetings and has created a planning and leadership council. Individuals are encouraged to hold brown bag lunches on waste sorting and to reach out to new employees for one-on-one training. With CRE guidance and executive sponsorship, they are incorporated into virtually all facilities across the company. One proof of integration into company culture is that the group’s need to recruit members to ensure geographic coverage lessens every year.
6. Sharing best practicesThe Grassroots Green Network team is spread across the PG&E service territory which spans most of central and northern California. In order to connect within the group, members began holding quarterly green happy hours and annual trainings. These began in the headquarters but expanded to various outlying areas, providing an opportunity for team members to meet and share tips. Although websites and emails can convey a great deal of information, the face-to-face interactions have proven invaluable.
7. Finding what matters to employees taking initiativeThe team found that although there are core passionate employees who take extra initiative, many employees are focused on their work and have difficulty relating to the importance and value of sorting waste. The Grassroots Green Network found that with management support to allocate a little time and funding, small local efforts can reap big rewards to bring appreciation and recognition to the program. Where employees may not relate to recycling, they could relate to and embrace giving back to the community. This took the form of drives to recycle eyeglasses, books or other

Page 55IFMA SUSTAINABILITY HOW-TO GUIDE WASTE STREAM MANAGEMENT
items that were then donated to local non-profits. One site even gathered spent toilet paper cores for donation to the art program at a local library.
8. Incentives and feedbackFor two years, achieving the waste program goals was included in the annual bonus program for all management employees, raising visibility of the issue throughout the company. In addition, annual competitions are held between floors to see which groups can have the highest diversion rate. This educates, builds teams and adds much-needed fun to the workplace.
Influencing the Market
PG&E found that one of its waste disposal companies was set up to sort office waste offsite. This meant that the employees did not need to sort their waste by type, and yet the waste was sorted and redirected so accurately that the hauler was able to claim a 98 percent diversion rate. Before publicly reporting this, however, PG&E physically verified this claim with a visit to the hauler’s operations, which brought attention to process improvement and quality control aspects which the hauler corrected. PG&E also worked with the hauler to provide consistent, accurate reports. This hauler now provides these reports to its other clients, enabling them to better understand their waste streams as well.
PG&E also worked with other waste haulers to expand their services by recycling more types of materials, adding composting and expanding their territories of service. The company worked closely with the haulers to identify opportunities, analyze the waste stream to support the increased scope and confirm the benefits to the service providers. Ensuring there are benefits to both the waste producers and the waste disposal companies is the key to sustainable success. These services are now available to other waste-producing businesses as well. Not only has PG&E made a difference by reducing the impact of its landfill waste on the environment, but by changing the market, its leadership has created opportunities for even greater reductions in the market as a whole.
Summary — Added Value
The PG&E waste program has reduced waste to landfill significantly, reduced waste disposal and operational costs, and achieved other benefits, including:
� Creating more than US$100,000 in annual savings and a less than two-year return on investment;
� Increasing waste diversion by 12 percent over baseline;
� Adding composting to more than 15 sites;
� Diverting more than 3,424 tons of waste annually; and
� Increasing employee engagement.
This program required relatively small cost, no capital investments, and demonstrated the value of integrating basic principles of reducing operational waste in many forms.
Project Recognition: PG&E: James Nelson, iReuse: Ken Kurtzig and Scott Finnell, Cushman and Wakefield: Jason Dallas and Bill Dugan
EnSurinG tHErE arE bEnEFitS to botH tHE waStE ProducErS and tHE waStE diSPoSal comPaniES iS tHE kEy to SuStainablE SuccESS.

Page 56IFMA SUSTAINABILITY HOW-TO GUIDE WASTE STREAM MANAGEMENT
Part 6: AppendicesAppEndix A: rEfErEncEs
PRINT RESOURCE
Leonard, J. and Robinson, G., Eds. 2009. Managing Hazardous Materials. Institute of Hazardous Materials Management, p. 422-423.
ONLINE RESOURCES
Absolute Astronomy Waste Managementwww.absoluteastronomy.com/topics/waste_management
GrassRoots Recycling Network green paper — Zero Waste: Management Principles for the Coming Age of Zero Waste
www.grrn.org/zerowaste/grrn1.html
National Association for Information Destructionwww.naidonline.org
United States Department of Energywww.energy.gov
United States Environmental Protection Agencywww.epa.gov
United States Environmental Protection Agency Electronics Donation and Recyclingwww.epa.gov/epawaste/conserve/materials/ecycling/donate.htm
Washington State Department of Enterprise Services Facilities & Leasinghttp://www.des.wa.gov/services/facilities/Pages/default.aspx
Waste Management Worldwww.waste-management-world.com
Zero Waste International Alliancehttp://zwia.org/news/zero-waste-articles/

Page 57IFMA SUSTAINABILITY HOW-TO GUIDE WASTE STREAM MANAGEMENT
AppEndix b: wAstE MAnAgEMEnt HistoricAl tiMElinE
10,000 BCE Permanent settlements begin to create a disposal issue for garbage.
400 BCE Athens, Greece, creates the first waste dump in the Western World. Regulations require waste to be dumped at least one mile from the city.
200 AD Rome creates a sanitation force. Two-man teams walk through the streets picking up trash and putting it into wagons.
1348 The Plague, or Black Death, hits the city of Florence, Italy, forcing it to draw up laws for inspections and cleaning of the streets to remove filth and garbage.
1357 London, England, authorities forbid the disposal of rubbish, dung, gravel or earth into the River Thames and other city waterways.
1372 Fines are levied against those citizens caught throwing slops, the contents of chamber pots and other “water” from their windows into the streets.
1388 English Parliament bars waste disposal in public waterways and ditches.
1392 Butchering waste is cut up on a certain pier of the Thames and dumped in the center of the river at ebb tide to be carried away. Cleaning of the city of London is assigned to a serjeant of the channels, scavengers, constables, beadles, rakers and surveyors of the pavements.
1400 Waste piles so high outside gates in Paris, France, that it interferes with city defense.
1405 London authorities declare that tumbrils (carts) must be used to haul garbage from the city.
1550 Henry II of France suggests that some of Paris’ sewers be diverted into the Seine. This suggestion is vetoed by the municipal authorities as a danger to public health.
1554 800 carts are used to remove garbage from Paris twice a day.
1657 New Amsterdam — later Manhattan — makes it illegal to throw garbage into the streets.
1690 Rittenhouse Mill in Philadelphia, Pa., USA, produces paper from recycled fibers originating from waste paper and rags.
1710 Virginia colonists bury their trash, including oyster shells, bones, building debris, broken glass and even suits of armor.
1724 Human waste is recycled in Japan for fertilizer. It is so popular that even with the threat of imprisonment, it is sometimes stolen due to its high cost.
1800 Pigs are used in many cities to eat garbage in the streets.
1820 In London, England almost 100 percent of waste collected by ‘dust-men’ is recycled/recovered/reused through manual separation and re-distribution.
1834 A law is put in place to protect vultures from hunters in Charleston, W.Va., USA because the birds help by eating garbage.
1842 A report published in London, England, links disease to filthy environmental conditions, beginning the “Age of Sanitation.”
1860 Washington, D.C., residents dump slops and garbage into the streets. Pigs roam the city at large and buildings are infested with cockroaches and rats.

Page 58IFMA SUSTAINABILITY HOW-TO GUIDE WASTE STREAM MANAGEMENT
1865 The first waste incinerator is built in Gibralter, Mich., USA.
1872 New York City, N.Y., USA, stops the dumping of trash into the East River.
1874 Trash is collected and incinerated in Nottingham, England.
1885 New York City begins incinerating garbage on Governors Island in New York Harbor.
1889 Washington, D.C., reports that the U.S. is running out of appropriate space for refuse.
1900 Piggeries become common. It is thought 75 pigs can eat a ton of garbage daily.
1905 New York City uses a garbage incinerator to provide electricity to light the Williamsburg Bridge.
1916 New York City citizens produce 4.6 pounds of refuse per day.
1920 Landfills become the disposal method of choice for garbage. Wetlands are filled with garbage and dirt as a method of reclaiming the land.
1932 Compactor garbage trucks allow more garbage to be transported efficiently.
1942 Wartime salvage efforts reduce waste as most materials are recycled.
1954 The city of Olympia, Wa., USA, pays for return of aluminum cans.
1959 A guide for sanitary landfills is published by the American Society of Civil Engineers, suggesting that compacting the garbage and covering it with soil every day will reduce rodents and odors.
1961 Sam Yorty wins the mayoral race of Los Angeles, Calif., USA, on a platform to end the inconvenience of separating recyclables from garbage.
1965 First United States federal solid waste management laws enacted.
1968 Companies begin to buy back recyclable containers.
1970 U.S. Federal Clean Air Act and Environmental Protection Agency created. First Earth Day.
1971 Oregon passes the first bill for bottle recycling.
1979 U.S. Congress creates the superfund, setting aside large amounts of money to clean up hazardous waste sites across the United States.
1980 The U.S. Environmental Protection Agency issues criteria for landfills to prohibit the open dumping of garbage.
1987 The University of Arizona–Tucson starts excavating a landfill like an archeological site to study how much is biodegradable.
1990 140 recycling laws are passed in 38 U.S. states.
2000 California cities are required to recycle 50 percent of their waste.
2005 World Environment Day held in San Francisco, Ca., USA, the first time the event was held in the U.S. in 30 years.
2009 U.S. President Barack Obama signs the American Recovery and Reinvestment Act of 2009.

Page 59IFMA SUSTAINABILITY HOW-TO GUIDE WASTE STREAM MANAGEMENT
AppEndix c: fun fActs for EducAtion progrAMs
Aluminum Recycling Facts
♻ A used aluminum can is recycled and back on the grocery shelf as a new can in as few as 60 days.
♻ Recycling one aluminum can saves enough energy to run a TV for three hours.
♻ More aluminum goes into beverage cans than any other product.
♻ An aluminum can that is thrown away will still be a can 500 years from now!
♻ There is no limit to the amount of times an aluminum can be recycled.
♻ The United States uses more than 80,000,000,000 aluminum soda cans every year.
Paper Recycling Facts
♻ To produce each week’s Sunday newspapers, 500,000 trees must be cut down.
♻ The average American uses seven trees a year in paper, wood and other products made from trees.
♻ Approximately 1 billion trees worth of paper are thrown away every year in the U.S.
♻ Americans use 85,000,000 tons of paper a year; about 680 pounds per person.
♻ Each ton (2,000 pounds) of recycled paper can save 17 trees, 380 gallons of oil, three cubic yards of landfill space, 4,000 kilowatts of energy and 7,000 gallons of water. This represents a 64 percent energy savings, a 58 percent water savings and 60 pounds less of air pollution!
♻ The 17 trees saved (above) can absorb a total of 250 pounds of carbon dioxide from the air each year. Burning that same ton of paper would create 1,500 pounds of carbon dioxide.
♻ The construction costs of a paper mill designed to use waste paper are 50 to 80 percent less than those of a mill using new pulp.
Plastic Recycling Facts
♻ Americans use 2,500,000 plastic bottles every hour!
♻ Americans throw away 25,000,000,000 Styrofoam coffee cups every year.

Page 60IFMA SUSTAINABILITY HOW-TO GUIDE WASTE STREAM MANAGEMENT
Glass Recycling Facts
♻ The energy saved from recycling one glass bottle can run a 100-watt light bulb for four hours or a compact fluorescent bulb for 20 hours. It also causes 20 percent less air pollution and 50 percent less water pollution than when a new bottle is made from raw materials.
♻ A modern glass bottle will take 4,000 years or more to decompose, or longer if it’s in a landfill.
♻ Mining and transporting raw materials for glass produces about 385 pounds of waste for every ton of glass that is made. If recycled glass is substituted for half of the raw materials, the waste is cut by more than 80 percent.
Solid Waste and Landfill Facts
♻ About one-third of an average landfill is made up of packaging material.
♻ Every year, each American throws out about 1,200 pounds of organic garbage that could be composted.
♻ The U.S. is the number one trash-producing country in the world at 1,609 pounds per person, per year. This means that 5 percent of the world’s people generate 40 percent of the world’s waste.
♻ Each year the U.S. population discards 16 billion diapers, 1.6 billion pens, 2 billion razor blades, 22 billion car tires and enough aluminum to rebuild the U.S. commercial air fleet four times over.
♻ Out of every US$10 spent buying things, US$1 (10 percent) goes toward packaging that is thrown away. Packaging represents about 65 percent of household trash.
Miscellaneous Recycling Facts
♻ An estimated 80 billion Hershey’s Kisses are wrapped each day, using enough aluminum foil to cover more than 50 acres of space — that’s almost 40 football fields. All that foil is recyclable, but not many people realize it.
♻ A single quart of motor oil, if disposed of improperly, can contaminate up to 2 million gallons of fresh water.
♻ On average, each person produces 4.4 pounds of solid waste each day. This adds up to almost a ton of trash per person, per year.

Page 61IFMA SUSTAINABILITY HOW-TO GUIDE WASTE STREAM MANAGEMENT
AppEndix d: glossAry
Biological nutrients and materials: Organic matter that can decompose into the natural environment (soil, water, etc.), without affecting it in a negative way, providing food for bacteria and microbiological life.
Carbon footprint: The total set of greenhouse gas (GHG) emissions caused by an organization, event or product.
Combustion: Burning of municipal solid waste performed in order to reduce the amount of landfill space needed.
Co-mingled: Materials of varied types deposited into the same receptacle or pile, or mixed together during demolition.
Composting: Collecting organic waste, such as food scraps and yard trimmings, and storing it under conditions designed to help it break down naturally. The resulting compost can then be used as a natural fertilizer.
Construction waste: Waste materials generated by construction activities, such as scrap; damaged or spoiled materials; temporary and expendable construction materials and aids not included in the finished project; packaging materials and waste generated by the workforce.
Cradle to cradle (C2C): A method used to minimize the environmental impact of products by employing sustainable production, operation and disposal practices which aims to incorporate social responsibility into product development. Under the cradle-to-cradle philosophy, products are evaluated for sustainability and efficiency in manufacturing processes, material properties and toxicity as well as potential to reuse materials through recycling or composting.
Deconstruction: The systematic disassembly of a building, generally in the reverse order of construction, in an economical and safe fashion, for the purposes of preserving materials for their reuse.
Demolition debris: Waste resulting from removing a building from a site by wrecking.
Disposal (or landfill disposal): Depositing materials in a solid waste disposal facility licensed for the subject materials.
Downcycling: Conventionally known as recycling, this involves breaking materials down into lesser products, such as a plastic computer housing becoming a plastic cup, then a park bench and then, eventually, waste.
Energy recovery: The conversion of non-recyclable waste materials into useable heat, electricity or fuel.
Food waste: Basic concept of organic waste materials becoming food for bugs, insects and other small forms of life that can feed on it, decompose it and return it to the natural environment which we then indirectly use for food ourselves.
Land clearing debris: Vegetative waste materials removed from a site.
Landfills: Engineered areas where waste is placed into the land. Landfills usually have liner systems and other safeguards to prevent groundwater pollution.
LEED: Leadership in Energy and Environmental Design rating criteria developed by the U.S. Green Building Council. The LEED rating system is recognized nationally and internationally as the green building design standard.
Materials: The building blocks of items, such as the dyes used in coloring fibers or rubbers used in the soles of shoes.

Page 62IFMA SUSTAINABILITY HOW-TO GUIDE WASTE STREAM MANAGEMENT
Material recovery/reclamation facility (MRF): A general term used to describe a waste-sorting facility. Mechanical, hand-separation or a combination of both procedures are used to recover recyclable materials from other waste.
Municipal solid waste (MSW): More commonly known as trash or garbage; consists of everyday items used and then thrown away, such as product packaging, grass clippings, furniture, clothing, bottles, food scraps, newspapers, appliances, paint and batteries.
Off-site separation: Sorting and separating co-mingled waste at a location other than the construction jobsite, that location having been established for the purpose of recycling. Post-consumer recycled-content products: Products that contain materials that have been used by consumers and collected for reprocessing.
Pre-consumer or post-industrial recycled-content products: Products that contain “waste” materials created as a byproduct of manufacturing that are re-incorporated into a manufactured product.
Recycle or recycling: Introducing a material into some process for remanufacture into a new product, which may be the same as or similar to the original product or a completely different type of product. The recovery of useful materials, such as paper, glass, plastic and metals, from trash reduces the amount of new raw materials needed to make new products.
Reuse: To use waste material in a subsequent application on-site. Examples include grinding concrete to use again on-site and manipulating building lumber to construct forms. The subsequent use of a material, product or component upon salvage.
Salvage: Recovery of components, products or materials for the purpose of reusing them for the same purposes as, or similar purposes to, their original use. Salvage of construction or demolition waste material removes it from an existing structure for reuse in the same form. Examples of salvage materials include lumber, doors, trim, plumbing fixtures or brick.
Single-stream recycling (also known as single-sort or co-mingled): The process whereby all recycled materials are mixed in a single container and not sorted into separate commodities.
Source reduction: Also known as waste prevention. Designing products to reduce the amount of waste that will need to be thrown away and to make the resulting waste less toxic.
Source separation (or segregation): Keeping materials separated by type from the time they become scrap or waste until the time they are salvaged or recycled.
Source separated recycling service: Involves collecting recyclables in separate containers as they are generated. The recycling hauler takes the materials directly to a recycler or to a transfer site. This method requires more individualized containers but makes accounting of materials easier and safeguards material quality. Items such as concrete, drywall, carpet, film plastic and ceiling tiles may need to be source separated for recycling.
Technical nutrients: Inorganic or synthetic materials manufactured by humans―such as plastics and metals that can be used many times without any loss in quality, staying in a continuous cycle.
Transfer stations: Facilities where municipal solid waste is unloaded from collection vehicles and briefly held while it is reloaded onto larger, long-distance transport vehicles for shipment to landfills or other treatment or disposal facilities.
Upcycling: The process of converting waste materials or useless products into new materials or products of better quality or a higher environmental value.
Zero waste: The recycling of all materials back into nature or the marketplace in a manner that protects human health and the environment.

Page 63IFMA SUSTAINABILITY HOW-TO GUIDE WASTE STREAM MANAGEMENT

IFMA and the IFMA Foundation would like to thank the corporate contributors, IFMA chapters, councils and members, as well as other organizations and individuals for their sponsorship. Your generous support helps to make the Foundation’s education, research and scholarship initiatives possible.
Guides can be downloaded at: www.ifma.org/know-base/how-to-guides
© IFMA Foundation 2013. All rights reserved.