washington state electric utility resource planning
TRANSCRIPT
Washington State Electric Utility Resource Planning
2018 Report
December 2018 Report to the Legislature
Brian Bonlender, Director
Acknowledgements
Washington Department of Commerce, State Energy Office
Jill Nordstrom – Energy Contracts and Programs Manager Greg Nothstein - Energy Policy Specialist Carolee Sharp - Editor Washington State Department of Commerce Energy Office 1011 Plum St. SE P.O. Box 42525 Olympia, WA 98504-2525 www.commerce.wa.gov/energy For people with disabilities, this report is available on request in other formats. To submit a request, please call 360-725-4000 (TTY 360-586-0772).
Washington State Utility Resource Planning Report 2018
3
Table of Contents
Introduction .................................................................................................................................... 4
Utility Reporting ............................................................................................................................. 6
Results ............................................................................................................................................ 8
Comparison to Regional Plans ................................................................................................... 16
Overgeneration Concerns ........................................................................................................... 18
Appendix A: Utility Cover Sheets................................................................................................ 21
Appendix B: 2017 WA Utility Sales, Customer Count, Revenue and Price ............................. 83

Washington State Utility Resource Planning Report 2018
4
Introduction
Background
Washington consumers and businesses depend on electricity service from one or more of over 60 electric utilities operating in this state. These utilities vary greatly in size, geographic scope, history and governance, but each is responsible for ensuring an adequate supply of an essential resource.
Washington law requires each utility plan for the future by examining the projected amounts of electricity that will be required by customers in the coming decade, and identifying the power resources that will be used to meet those demands.1 Each utility must prepare a report every two years and submit it to the Department of Commerce. Commerce reviews the utility reports and submits a summary to the Legislature. This is the fifth report since the Legislature enacted the resource planning law in 2006.
Depending on their size and power sources, utilities submit either a “resource plan” (RP) or an “integrated resource plan” (IRP). The RP is a short-form report of load2 resources and is primarily provided by utilities having only one or two suppliers of power resources (usually, the Bonneville Power Administration and, perhaps, market power). The IRP is more complex plan and must incorporate a number of specific requirements identified in statute. IRPs are generally required for utilities with 25,000 or more customers.
Purpose of this Report
Utilities develop resource plans to assess their specific future load and resource situations. This report aggregates the individual reports to provide an assessment at the statewide level of whether utilities are planning for adequate supplies, and what resources are expected to meet any growth in electric power demand, per 19.280.060 RCW.
This report summarizes the electricity loads and resources reported by Washington utilities in their 2018 reports to Commerce. It compares them to estimated summaries of previous years. Resources proposed to meet load are categorized by generating fuel type and source type (such as contract or market). An imbalance of loads and resources may indicate either a resource surplus or deficit, and this will be identified.
1 Chapter 19.280 Revised Code of Washington, Electric Utility Resource Plans. http://app.leg.wa.gov/RCW/default.aspx?cite=19.280 2 As used in the statute and this report, “load” means the amount of electric energy demanded by a utility’s customers during a defined period.

Washington State Utility Resource Planning Report 2018
5
The information collected for this report is limited to the identification of loads and resources and their associated aggregate quantities. It does not attempt to evaluate specific goals or outcomes for resource acquisition strategies used by utilities.
This report provides information on utilities’ energy efficiency and renewable energy resources. It does not analyze issues related to the energy efficiency and renewable energy requirement of, or compliance with, the Energy Independence Act (RCW 19.285).

Washington State Utility Resource Planning Report 2018
6
Utility Reporting
The utility resource planning statutes in Chapter 19.280 RCW3 require that each utility prepare a resource plan (RP) and submit it to Commerce by Sept. 1 of each even-numbered year. Commerce received reports from 62 utilities. The individual reports are presented in Appendix B.
Electric utilities in Washington vary significantly in size and the scope of operations. This is reflected in the way utilities approach resource planning and forecasting. Larger utilities typically use multiple sources of electricity supply to meet their customers’ requirements and engage in sophisticated assessments of risks and benefits in evaluating alternative sources of new energy. Many smaller utilities rely on a single supplier to supply all of the power required by their customers. For smaller utilities, the upstream provider – often the Bonneville Power Administration but sometimes another electric utility – undertakes the complex planning and forecasting exercise that leads to a resource plan.
The resource planning statute reflects this difference in approaches. It requires that larger utilities prepare and submit IRPs, which are the product of a thorough assessment of future needs and alternatives for meeting those needs through both demand-side and supply-side resources. Smaller utilities are allowed to prepare and submit a simplified assessment of loads and resources.
Interpretation of base-year, five-year, and 10-year data
The resource plan summary submitted to Commerce includes load and resource information for three points in a 10-year planning cycle. These points are the base-year, a five-year plan and a 10-year plan. In 2018, most utilities used 2017 as the base-year, and the five-year and 10-year points are 2022 and 2027, respectively. However, utilities vary in their planning cycles, and some utilities use an earlier or later set of years in their reporting: the base year ranges from 2015 to 2019. For purposes of the statewide summary, Commerce aggregates all base-year data into a single value (2017) and does likewise for the five-year (2022) data and 10-year data (2027).
Interpretation of conservation and load data
An important principle of integrated resource planning is that all resources should be evaluated on a consistent basis. This includes both different generating resources – such as wind and natural gas – and demand-side resources in the form of energy conservation. With conservation analyzed as resource and compared to supply-side options, utilities are able to determine whether customers are better served by improving the efficiency of their energy consumption or increasing the amount of energy delivered to them.
3 http://apps.leg.wa.gov/rcw/default.aspx?cite=19.280
Washington State Utility Resource Planning Report 2018
7
A consequence of this approach is that energy conservation is sometimes portrayed as a reduction in the utility’s load and sometimes portrayed as a resource available to meet load. This can lead to confusion in interpreting utility plans.
Here is how this potential confusion is resolved in the reports submitted to Commerce and summarized in this document:
Utilities report a base-year load amount that reflects whatever conservation has occurred in the past. For the five-year and 10-year values, utilities are directed to report the load that they would expect to serve in the absence of any additional conservation savings. The report separately lists the conservation resources that the utility expects to acquire during the five-year and 10-year periods.
For example, Clark Public Utilities reports that its load in 2017 was 528.5 average megawatts (aMW).4 This figure represents the actual load of its customers in the base-year. It reflects many years of conservation programs at Clark Public Utilities and would be significantly higher without those historical conservation achievements. For the five-year interval, Clark forecasts a load of 572 aMW and conservation savings of 34.2 aMW. The first number represents the load that Clark would expect if it achieved no conservation savings after the base-year. Without conservation, its load would increase by 43.6 aMW, but with conservation the forecast load increase is only 9.3 aMW for an adjusted total load of 537.8 aMW at the end of the five-year interval.
In summary, the amounts reported as load for the five-year and 10-year intervals are based on an assumption of no new conservation. The actual loads at these future time points are likely to be lower by the amount of energy conservation identified by each utility.
4 aMW, or average megawatt, is an amount of electric energy equal to one megawatt-hour per hour for an entire year, or 8,760 megawatt-hours.
Washington State Utility Resource Planning Report 2018
8
Results
The 2018 resource plans submitted to Commerce are summarized in Table 1 through Table 5 and Figures 1 and 3 of this report.
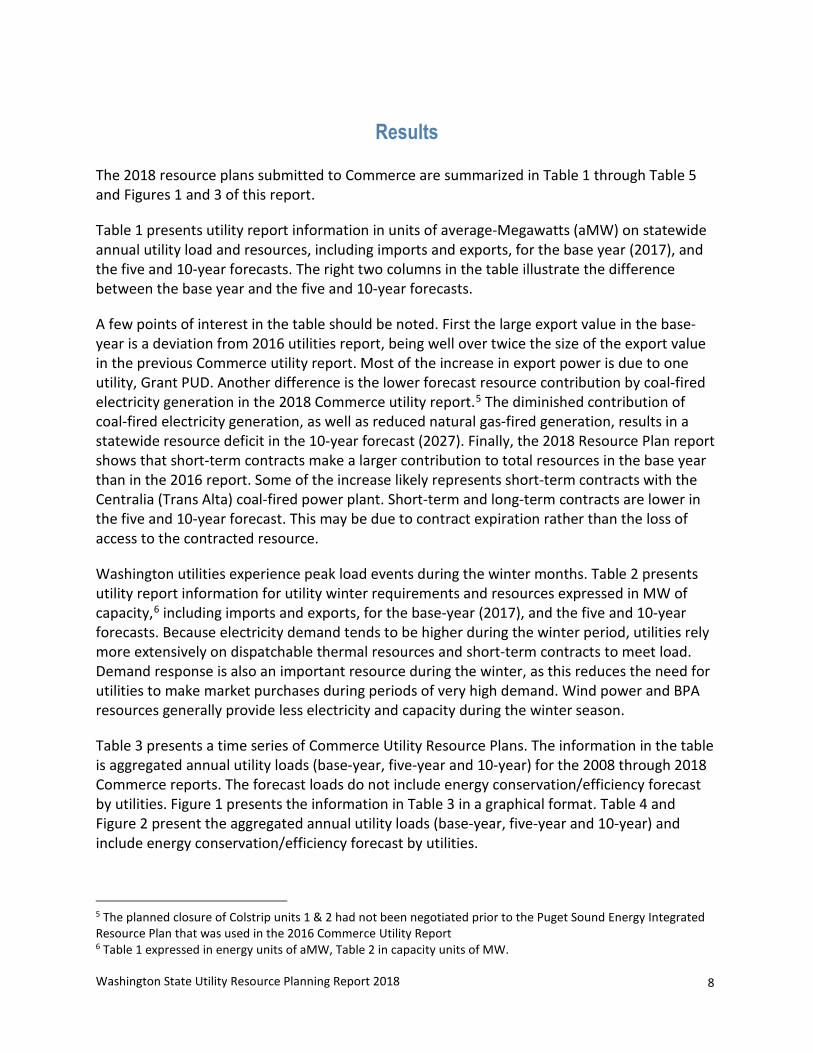
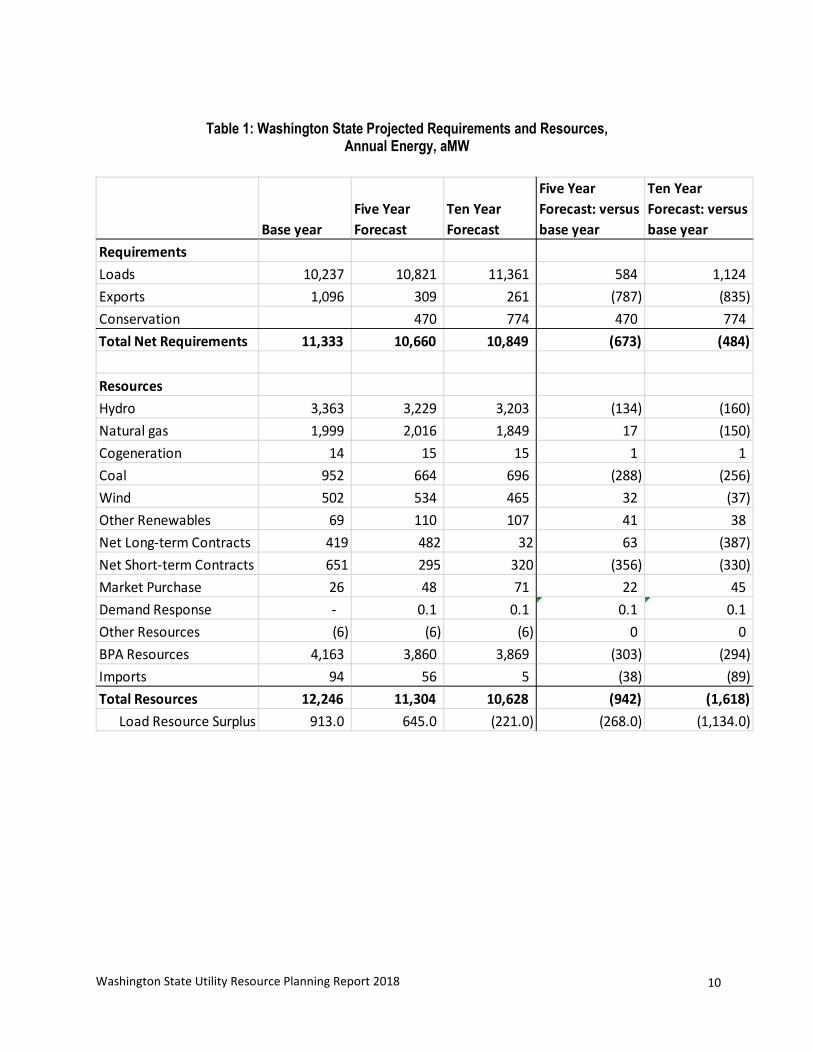
Table 1 presents utility report information in units of average-Megawatts (aMW) on statewide annual utility load and resources, including imports and exports, for the base year (2017), and the five and 10-year forecasts. The right two columns in the table illustrate the difference between the base year and the five and 10-year forecasts.
A few points of interest in the table should be noted. First the large export value in the base-year is a deviation from 2016 utilities report, being well over twice the size of the export value in the previous Commerce utility report. Most of the increase in export power is due to one utility, Grant PUD. Another difference is the lower forecast resource contribution by coal-fired electricity generation in the 2018 Commerce utility report.5 The diminished contribution of coal-fired electricity generation, as well as reduced natural gas-fired generation, results in a statewide resource deficit in the 10-year forecast (2027). Finally, the 2018 Resource Plan report shows that short-term contracts make a larger contribution to total resources in the base year than in the 2016 report. Some of the increase likely represents short-term contracts with the Centralia (Trans Alta) coal-fired power plant. Short-term and long-term contracts are lower in the five and 10-year forecast. This may be due to contract expiration rather than the loss of access to the contracted resource.
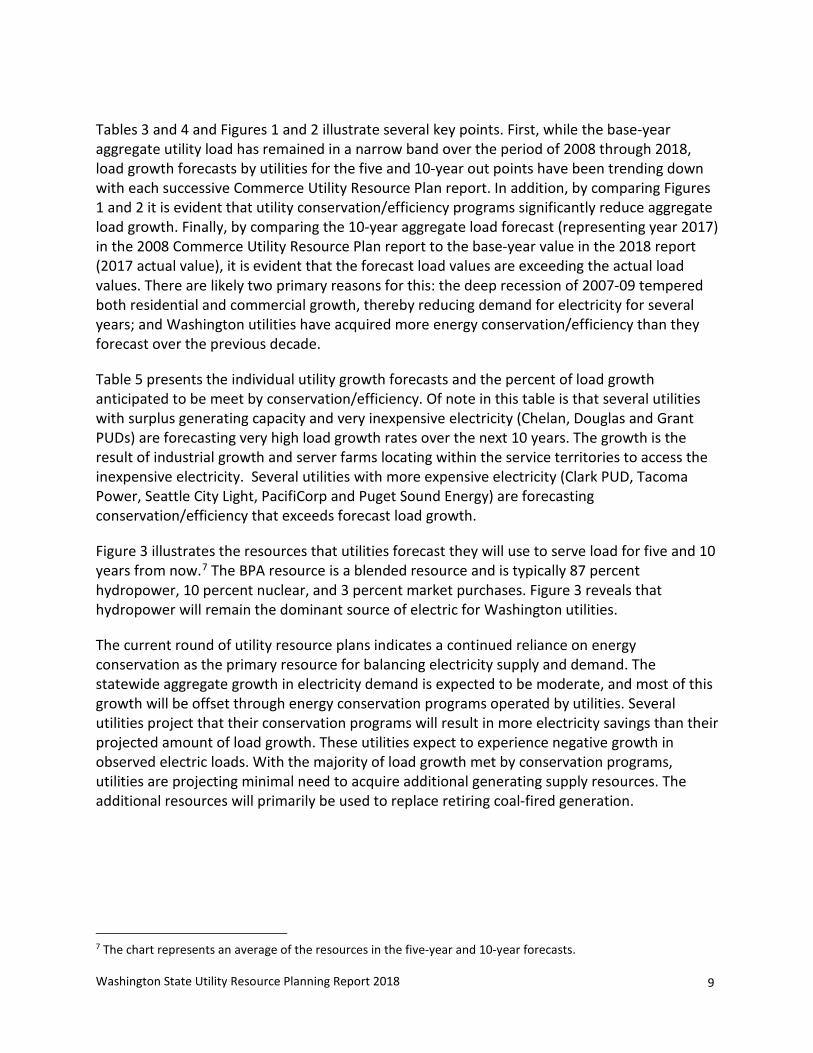
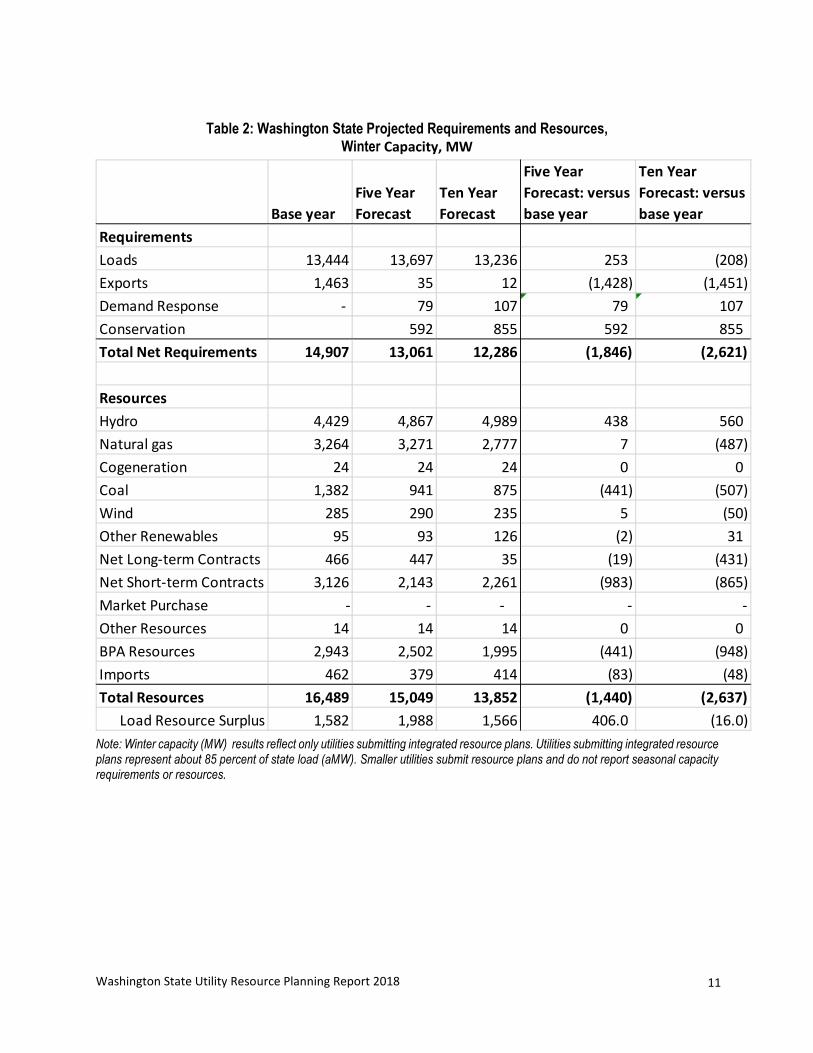
Washington utilities experience peak load events during the winter months. Table 2 presents utility report information for utility winter requirements and resources expressed in MW of capacity,6 including imports and exports, for the base-year (2017), and the five and 10-year forecasts. Because electricity demand tends to be higher during the winter period, utilities rely more extensively on dispatchable thermal resources and short-term contracts to meet load. Demand response is also an important resource during the winter, as this reduces the need for utilities to make market purchases during periods of very high demand. Wind power and BPA resources generally provide less electricity and capacity during the winter season.
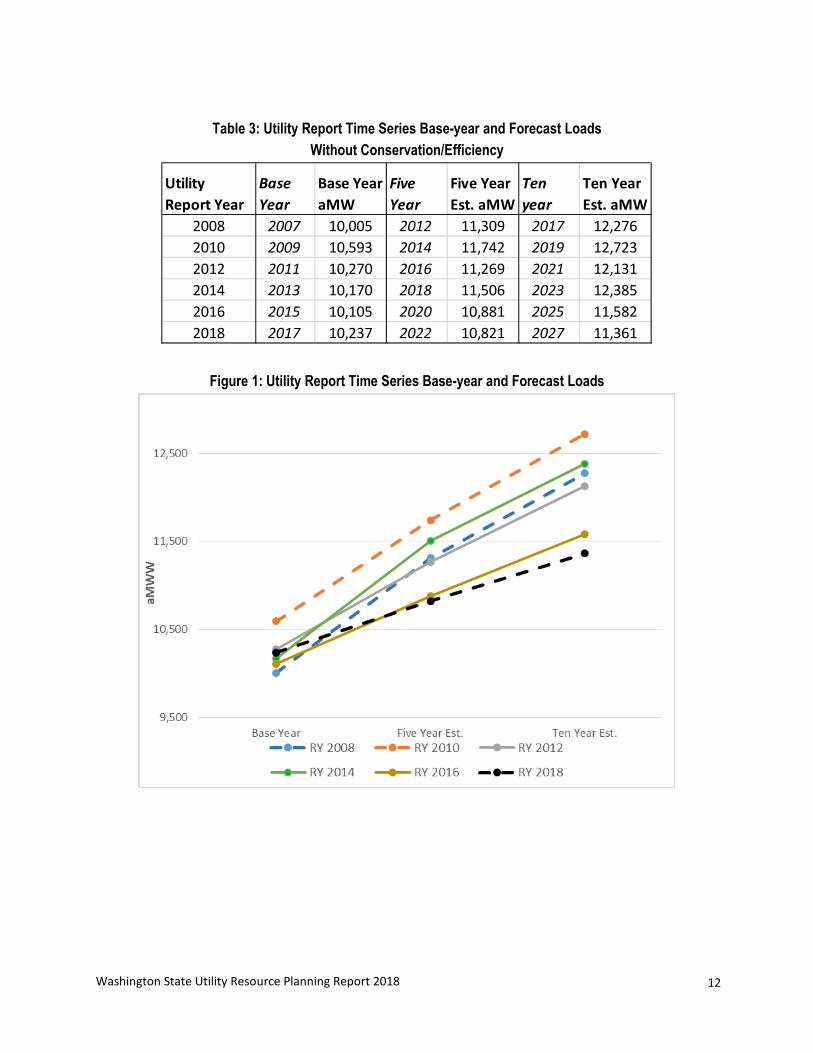
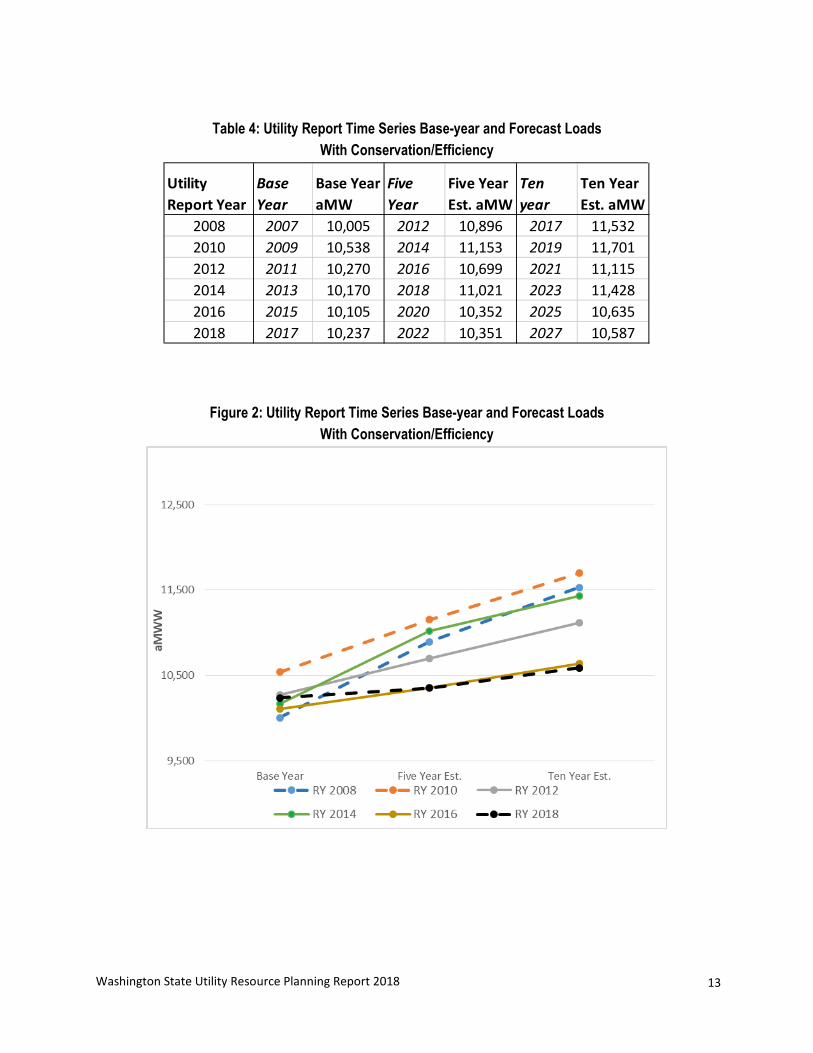
Table 3 presents a time series of Commerce Utility Resource Plans. The information in the table is aggregated annual utility loads (base-year, five-year and 10-year) for the 2008 through 2018 Commerce reports. The forecast loads do not include energy conservation/efficiency forecast by utilities. Figure 1 presents the information in Table 3 in a graphical format. Table 4 and Figure 2 present the aggregated annual utility loads (base-year, five-year and 10-year) and include energy conservation/efficiency forecast by utilities.
5 The planned closure of Colstrip units 1 & 2 had not been negotiated prior to the Puget Sound Energy Integrated Resource Plan that was used in the 2016 Commerce Utility Report 6 Table 1 expressed in energy units of aMW, Table 2 in capacity units of MW.
Washington State Utility Resource Planning Report 2018
9
Tables 3 and 4 and Figures 1 and 2 illustrate several key points. First, while the base-year aggregate utility load has remained in a narrow band over the period of 2008 through 2018, load growth forecasts by utilities for the five and 10-year out points have been trending down with each successive Commerce Utility Resource Plan report. In addition, by comparing Figures 1 and 2 it is evident that utility conservation/efficiency programs significantly reduce aggregate load growth. Finally, by comparing the 10-year aggregate load forecast (representing year 2017) in the 2008 Commerce Utility Resource Plan report to the base-year value in the 2018 report (2017 actual value), it is evident that the forecast load values are exceeding the actual load values. There are likely two primary reasons for this: the deep recession of 2007-09 tempered both residential and commercial growth, thereby reducing demand for electricity for several years; and Washington utilities have acquired more energy conservation/efficiency than they forecast over the previous decade.
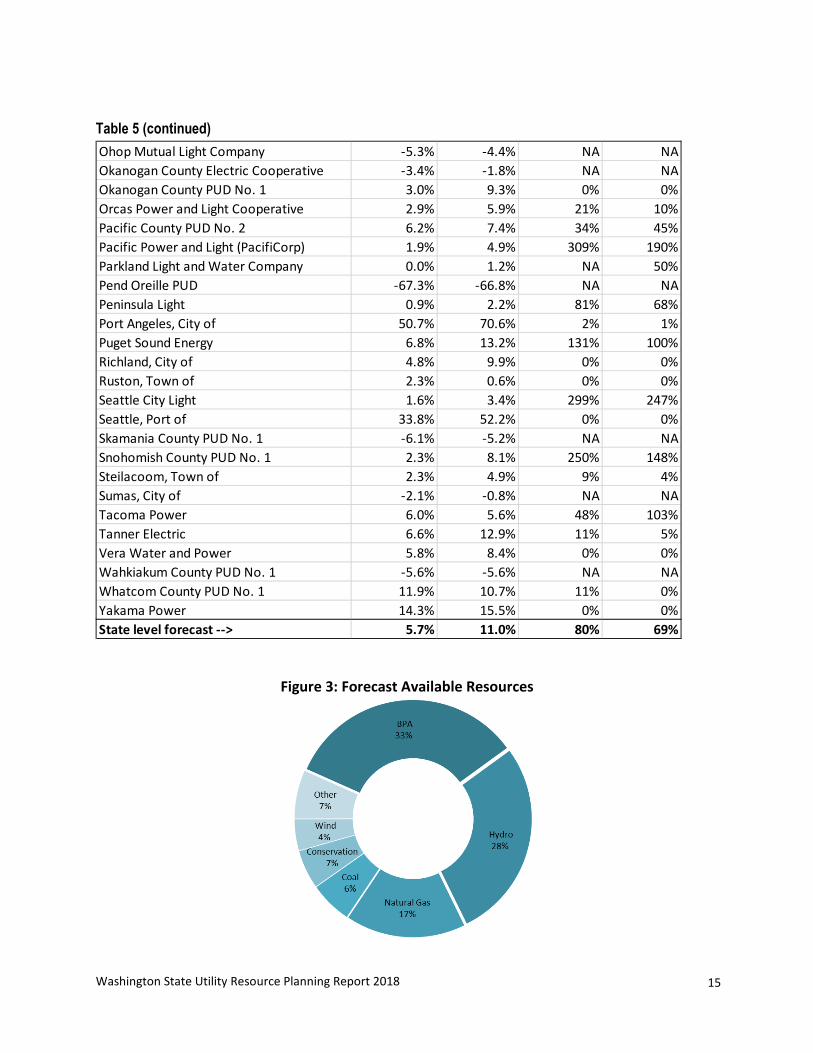
Table 5 presents the individual utility growth forecasts and the percent of load growth anticipated to be meet by conservation/efficiency. Of note in this table is that several utilities with surplus generating capacity and very inexpensive electricity (Chelan, Douglas and Grant PUDs) are forecasting very high load growth rates over the next 10 years. The growth is the result of industrial growth and server farms locating within the service territories to access the inexpensive electricity. Several utilities with more expensive electricity (Clark PUD, Tacoma Power, Seattle City Light, PacifiCorp and Puget Sound Energy) are forecasting conservation/efficiency that exceeds forecast load growth.
Figure 3 illustrates the resources that utilities forecast they will use to serve load for five and 10 years from now.7 The BPA resource is a blended resource and is typically 87 percent hydropower, 10 percent nuclear, and 3 percent market purchases. Figure 3 reveals that hydropower will remain the dominant source of electric for Washington utilities.
The current round of utility resource plans indicates a continued reliance on energy conservation as the primary resource for balancing electricity supply and demand. The statewide aggregate growth in electricity demand is expected to be moderate, and most of this growth will be offset through energy conservation programs operated by utilities. Several utilities project that their conservation programs will result in more electricity savings than their projected amount of load growth. These utilities expect to experience negative growth in observed electric loads. With the majority of load growth met by conservation programs, utilities are projecting minimal need to acquire additional generating supply resources. The additional resources will primarily be used to replace retiring coal-fired generation.
7 The chart represents an average of the resources in the five-year and 10-year forecasts.
Washington State Utility Resource Planning Report 2018
10
Table 1: Washington State Projected Requirements and Resources, Annual Energy, aMW
Base yearFive Year Forecast
Ten Year Forecast
Five Year Forecast: versus base year
Ten Year Forecast: versus base year
RequirementsLoads 10,237 10,821 11,361 584 1,124Exports 1,096 309 261 (787) (835)Conservation 470 774 470 774Total Net Requirements 11,333 10,660 10,849 (673) (484)
ResourcesHydro 3,363 3,229 3,203 (134) (160)Natural gas 1,999 2,016 1,849 17 (150)Cogeneration 14 15 15 1 1Coal 952 664 696 (288) (256)Wind 502 534 465 32 (37)Other Renewables 69 110 107 41 38Net Long-term Contracts 419 482 32 63 (387)Net Short-term Contracts 651 295 320 (356) (330)Market Purchase 26 48 71 22 45Demand Response - 0.1 0.1 0.1 0.1Other Resources (6) (6) (6) 0 0BPA Resources 4,163 3,860 3,869 (303) (294)Imports 94 56 5 (38) (89)Total Resources 12,246 11,304 10,628 (942) (1,618)
Load Resource Surplus 913.0 645.0 (221.0) (268.0) (1,134.0)
Washington State Utility Resource Planning Report 2018
11
Table 2: Washington State Projected Requirements and Resources, Winter Capacity, MW
Note: Winter capacity (MW) results reflect only utilities submitting integrated resource plans. Utilities submitting integrated resource plans represent about 85 percent of state load (aMW). Smaller utilities submit resource plans and do not report seasonal capacity requirements or resources.
Base yearFive Year Forecast
Ten Year Forecast
Five Year Forecast: versus base year
Ten Year Forecast: versus base year
RequirementsLoads 13,444 13,697 13,236 253 (208)Exports 1,463 35 12 (1,428) (1,451)Demand Response - 79 107 79 107Conservation 592 855 592 855Total Net Requirements 14,907 13,061 12,286 (1,846) (2,621)
ResourcesHydro 4,429 4,867 4,989 438 560Natural gas 3,264 3,271 2,777 7 (487)Cogeneration 24 24 24 0 0Coal 1,382 941 875 (441) (507)Wind 285 290 235 5 (50)Other Renewables 95 93 126 (2) 31Net Long-term Contracts 466 447 35 (19) (431)Net Short-term Contracts 3,126 2,143 2,261 (983) (865)Market Purchase - - - - -Other Resources 14 14 14 0 0BPA Resources 2,943 2,502 1,995 (441) (948)Imports 462 379 414 (83) (48)Total Resources 16,489 15,049 13,852 (1,440) (2,637)
Load Resource Surplus 1,582 1,988 1,566 406.0 (16.0)
Washington State Utility Resource Planning Report 2018
12
Table 3: Utility Report Time Series Base-year and Forecast Loads Without Conservation/Efficiency
Figure 1: Utility Report Time Series Base-year and Forecast Loads
Utility Report Year
Base Year
Base Year aMW
Five Year
Five Year Est. aMW
Ten year
Ten Year Est. aMW
2008 2007 10,005 2012 11,309 2017 12,2762010 2009 10,593 2014 11,742 2019 12,7232012 2011 10,270 2016 11,269 2021 12,1312014 2013 10,170 2018 11,506 2023 12,3852016 2015 10,105 2020 10,881 2025 11,5822018 2017 10,237 2022 10,821 2027 11,361
Washington State Utility Resource Planning Report 2018
13
Table 4: Utility Report Time Series Base-year and Forecast Loads With Conservation/Efficiency
Figure 2: Utility Report Time Series Base-year and Forecast Loads With Conservation/Efficiency
Utility Report Year
Base Year
Base Year aMW
Five Year
Five Year Est. aMW
Ten year
Ten Year Est. aMW
2008 2007 10,005 2012 10,896 2017 11,5322010 2009 10,538 2014 11,153 2019 11,7012012 2011 10,270 2016 10,699 2021 11,1152014 2013 10,170 2018 11,021 2023 11,4282016 2015 10,105 2020 10,352 2025 10,6352018 2017 10,237 2022 10,351 2027 10,587

Washington State Utility Resource Planning Report 2018
14
Table 5: Individual Utility Load Forecasts with and without Conservation
UtilityFive Yr Change %
Ten Year Change %
Five Year Forecast
Ten Year Forecast
Alder Mutual Light Company -8.3% -8.3% 0% 0%Asotin County PUD No. 1 1.9% 5.2% 0% 0%Avista 3.5% 5.2% 78% 109%Benton County PUD No. 1 4.3% 8.8% 70% 76%Benton Rural Electric Assn 7.1% 15.2% 0% 0%Big Bend Electric Cooperative 5.9% 9.4% 8% 5%Blaine, City of -0.3% -0.3% NA NACentralia, City of 22.8% 23.3% 0% 0%Chelan County PUD No.1 20.7% 45.5% 16% 14%Cheney, City of 4.6% 11.3% 0% 0%Chewelah, City of 0.0% 1.2% 0% 0%Clallam County PUD No. 1 14.3% 22.1% 36% 47%Clark Public Utilities 8.2% 15.1% 79% 73%Columbia REA 10.1% 23.5% 0% 0%Consolidated Irrigation District No. 19 -14.8% -11.1% 0% 0%Coulee Dam, Town of -5.8% -2.4% 0% 0%Cowlitz County PUD No. 1 -18.2% -18.8% NA NADouglas County PUD No, 1 113.4% 137.5% 1% 1%Eatonville, Town of 2.4% 4.2% 0% 0%Ellensburg, City of -2.2% -1.5% NA NAElmhurst Mutual Power and Light Company -1.2% 2.7% NA 5%Ferry County PUD -12.5% -11.5% NA NAFranklin County PUD No. 1 2.9% 8.4% 109% 75%Grant County PUD No. 2 28.9% 45.6% 1% 1%Grays Harbor County PUD No. 1 8.6% 8.6% 0% 0%Inland Power and Light 5.4% 9.2% 19% 10%Jefferson County PUD No. 1 -0.9% 0.6% NA 28%Kittitas County PUD No. 1 3.1% 5.6% 5% 4%Klickitat County PUD No. 1 4.0% 7.4% 9% 6%Lakeview Power and Light 2.9% 5.5% 16% 8%Lewis County PUD No. 1 -2.6% -1.8% NA NAMason County PUD No. 1 2.0% 2.9% 21% 15%Mason County PUD No. 3 4.1% 7.6% 11% 7%McCleary, City of -4.9% -4.4% NA NAMilton, City of -0.9% -0.1% NA NAModern Electric 2.7% 4.9% NA NANespelem Valley Electric Cooprative 12.8% 14.4% 0% 0%
Load Growth with No Conservation
Percent of Load Growth Met by Conservation
Washington State Utility Resource Planning Report 2018
15
Table 5 (continued)
Figure 3: Forecast Available Resources
Ohop Mutual Light Company -5.3% -4.4% NA NAOkanogan County Electric Cooperative -3.4% -1.8% NA NAOkanogan County PUD No. 1 3.0% 9.3% 0% 0%Orcas Power and Light Cooperative 2.9% 5.9% 21% 10%Pacific County PUD No. 2 6.2% 7.4% 34% 45%Pacific Power and Light (PacifiCorp) 1.9% 4.9% 309% 190%Parkland Light and Water Company 0.0% 1.2% NA 50%Pend Oreille PUD -67.3% -66.8% NA NAPeninsula Light 0.9% 2.2% 81% 68%Port Angeles, City of 50.7% 70.6% 2% 1%Puget Sound Energy 6.8% 13.2% 131% 100%Richland, City of 4.8% 9.9% 0% 0%Ruston, Town of 2.3% 0.6% 0% 0%Seattle City Light 1.6% 3.4% 299% 247%Seattle, Port of 33.8% 52.2% 0% 0%Skamania County PUD No. 1 -6.1% -5.2% NA NASnohomish County PUD No. 1 2.3% 8.1% 250% 148%Steilacoom, Town of 2.3% 4.9% 9% 4%Sumas, City of -2.1% -0.8% NA NATacoma Power 6.0% 5.6% 48% 103%Tanner Electric 6.6% 12.9% 11% 5%Vera Water and Power 5.8% 8.4% 0% 0%Wahkiakum County PUD No. 1 -5.6% -5.6% NA NAWhatcom County PUD No. 1 11.9% 10.7% 11% 0%Yakama Power 14.3% 15.5% 0% 0%State level forecast --> 5.7% 11.0% 80% 69%
Washington State Utility Resource Planning Report 2018
16
Comparison to Regional Plans
PNUCC 2018 Northwest Regional Forecast
The Pacific Northwest Utilities Conference Committee (PNUCC) is an electric utility association that compiles information on expected loads and resources of electric utilities in the Pacific Northwest. It includes the loads and resources of Washington utilities along with those of utilities in Oregon, Idaho and Montana.8
The 2018 Northwest Regional Forecast (through 2028) concluded that regional utilities are expecting only modest growth in retail loads and expect to acquire substantial amounts of energy efficiency through utility programs, market transformation programs and governmental codes and standards. The report notes that forecast growth in winter peak demand is flattening, while the summer peak demand growth is remaining steady. It was also noted that load growth varies greatly by utility.
PNUCC highlights winter-peaking requirements as a concern. The region’s projected peak demand, including a planning margin that increases over time, is projected to exceed utilities’ firm resources in every year of the planning period. The supply of winter peaking resources does not include out-of-region imports, the capacity of independent power projects within the Northwest or hydroelectric system capacity in excess of critical water conditions.
The compiled results from PNUCC indicate that on an annual energy basis the Northwest utilities collectively expect to have surplus energy resources through the 2021-2022 operating year. The regional forecast shows an energy deficit starting in 2022 (522 aMW) and continuing to grow through the end of the 10-year planning period (1595 aMW). Much of the deficit is the result of the planned retirement of five coal-fired generating units representing nearly 3,000 MW of capacity: Boardman, Colstrip Units 1 and 2 in July 2022, and Centralia Unit 1 in 2020 and Centralia Unit 2 in 2025.
According to the PNUCC report, Northwest utilities made no capacity additions in 2017 and are only committed to additions of about 200 MW by 2020--primarily wind, solar and unspecified projects. PNUCC identifies a larger amount of planned resources in the region, but because they have less certainty from a financial or regulatory standpoint, they are not included in the forecast. Planned resources through 2025 include almost 900 MW of wind and solar capacity, and 1,000 MW of dispatchable resources (for peak demand), including 114 MW of battery storage.
8 Northwest Regional Forecast of Power Loads and Resources, April 2018. www.pnucc.org/system-planning/northwest-regional-forecast. The PNUCC report provides considerably more detail on individual generating units than utilities submit through the state resource plan reporting requirements.
Washington State Utility Resource Planning Report 2018
17
Pacific Northwest Power Supply Adequacy Assessment for 2021
The region’s power planning body, the Northwest Power and Conservation Council (Power Council), evaluated the adequacy of the electric power supply in 2018 and concluded that resources are expected to be adequate through 2020. Resources are considered adequate when the loss-of-load probability (LOLP) is less than 5 percent.9 However, with the planned retirements of five Northwest coal units by July 2022, the system will reach a LOLP of 7 percent in 2023 and will no longer meet the Power Council’s adequacy standard. An additional 600 to 700 MW of capacity will have to be acquired to maintain the LOLP 5 percent standard through the remainder of the 10-year forecast period.10
Like the PNUCC report, the Power Council notes that the Pacific Northwest is a winter peaking region, and that a resource shortfall exists and is likely to occur during December, January and February. They also noted that many utilities are developing notable summer demand peaks and that the region will begin to see a higher likelihood of summer shortfalls within the next 10 years.
The Power Council found these results to be “not surprising” and noted that utilities have identified 540 MW of wind capacity and about 800 MW of unspecified capacity. These are planned resources and are not included in their analysis. The council also noted that there are approximately 400 MW of demand response that will likely be available by 2021, and this resource is also not included in the analysis. The analysis also assumed a slightly conservative amount of imported market power being available from the Southwest region during the winter. Higher imports would diminish the region’s LOLP.
9 A LOLP above 5 percent should not be interpreted to mean that actual curtailments will occur. Rather, it means that the likelihood of utilities having to take extraordinary and costly measures to provide continuous service exceeds the tolerance for such events. The analyses to determine LOLP are somewhat conservative. 10 Pacific Northwest Power Supply Adequacy Assessment for 2023, September 27, 2018, Document 2018-10. https://www.nwcouncil.org/reports/pacific-northwest-power-supply-adequacy-assessment-2023
Washington State Utility Resource Planning Report 2018
18
Overgeneration Concerns
In 2013, the Legislature amended the resource planning statute to address concerns about the potential for “overgeneration” events. The legislation required that utilities consider this potential in their planning “if applicable to the utility's resource portfolio,” and required that Commerce include in this report an assessment of utility approaches to overgeneration.
The statute defines an overgeneration event as:
“an event within an operating period of a balancing authority when the electricity supply, including generation from intermittent renewable resources, exceeds the demand for electricity for that utility's energy delivery obligations and when there is a negatively priced regional market.”
Overgeneration might occur when high river flows and high wind volumes coincide. The capacity of the hydroelectric system to store extra river flow is limited, and even the option of spilling water over the dams is restricted by fish mortality concerns. In these rare and short-lived circumstances, the regional power system may have more electric generation from hydroelectric and wind resources than what is required to meet regional loads and export opportunities.
Since 2013, the Bonneville Power Administration has adopted an Oversupply Management Protocol, providing tools for the operators of the hydroelectric system and transmission grid to manage oversupply situations.11 The implementation of this protocol has generally shifted the overgeneration issue from a planning concern to an operational concern.
In many cases, utilities did not find it necessary in their 2017-2018 integrated resource plans to address overgeneration as an issue separate from the more general assessment of generating resource alternatives. The overgeneration prospect is one that contributes to an increasing interest among utilities in energy storage technologies, such as pumped storage and battery storage systems.
Here are excerpts illustrating utilities’ analyses of the overgeneration issue:
Clark Public Utilities (2016 IRP, p. 33): Pumped storage provides probably the best combination of size and response to integrate renewables on a wholesale power scale at a reasonable cost. However, the 10-year planning horizon now contemplated in this IRP removes pumped storage from consideration. Any new pumped storage development in close proximity to Clark Public Utilities to make it cost effective from a transmission viewpoint is at least 10 years away from operation, if not more.
11 www.bpa.gov/projects/initiatives/oversupply/Pages/default.aspx

Washington State Utility Resource Planning Report 2018
19
Grant Public Utilities (2018 IRP, p. 66 and 88): The primary impact of California’s increasing renewable goals is a reduction in the size of the potential export market for the Northwest— particularly during hydro runoff. This will increase the likelihood of oversupply and renewable curtailment.
Renewable generation is an important component of a low-carbon future; however a Renewables Portfolio Standard results in higher costs and higher carbon emissions than a policy that focuses directly on carbon. RPS policy has been successful at driving investment in renewables but ignores other measures, such as energy efficiency and coal displacement. RPS policy has unintended consequences, such as oversupply and negative wholesale electricity prices that create challenges for reinvestment in existing zero-carbon resources.
Grays Harbor PUD (2016 IRP, p. 47): During spring months in the Northwest, hydroelectric resources produce significant amounts of energy from spring run-off. At the same time, windy spring conditions result in large quantities of wind energy available at the same time when demands for electricity are low. This oversupply of energy has been resolved in the past by generation curtailment, which can be highly contentious and disruptive. Pumped storage may become the energy storage solution of choice as more wind is added to the balancing area and curtailments increase. During periods of high wind and high water, water is pumped to a storage reservoir using wind energy to power the pumps. The water is then released through the hydroelectric facility once demand increases or there is less generation from wind resources. The cost-effectiveness of pumped storage is determined by the price differential between heavy load hours (high demand) and low load hours (low demand). The efficiency of the pumps and hydroelectric generators are also an important factor. As facilities become more efficient and require less energy, the cost-effectiveness increases. Generally, however, pumped storage is a net consumer of energy in that it takes more energy to pump the water uphill than is recouped in the generation process when the water is released through the generator.
Snohomish PUD (2017 IRP, pp. 5-26): The district resides in the Bonneville Power Administration’s (BPA’s) footprint or balancing authority area (BAA). BPA is responsible for moment-to-moment balancing of loads and resources within its footprint, including the district. BPA mitigates overgeneration conditions or oversupply events through its Oversupply Management Protocol. An oversupply event is an event that historically occurs in the late spring, and is marked by moderate temperatures that reduce demand at the same time regional snows melt and spring rains begin, resulting in high hydroelectric energy production that combines with high energy production from regional wind projects. The district’s portfolio is subject to BPA’s Oversupply Management Protocol and pays the oversupply rate assessed by BPA.
The district’s efforts to mitigate oversupply for its own portfolio and electric system are also being assessed via use cases being conducted as part of the MESA energy storage initiative.
Washington State Utility Resource Planning Report 2018
20
Avista (2017 IRP, pp. 9-9, 9-10):
Increasing solar and wind generation on the electric grid makes energy storage technologies attractive from an operational perspective. Storage could be an ideal way to smooth out renewable generation variability, oversupply, and assist in load following and regulation needs. The technology could help meet peak demand, provide voltage support, relieve transmission congestion, take power during over-supply events, and supply other non-energy needs for the system. The IRP considered several storage technologies, including pumped hydroelectric, lead-acid batteries, lithium-ion batteries, vanadium flow batteries, flywheels, compressed air, liquefied air, and gravity systems. Avista installed a vanadium flow battery in Pullman, Wash. to learn more about storage technology. The Turner Energy Storage Project provides insight about the technology’s reliability, potential benefit to the transmission and/or distribution systems, and potential power supply benefits including oversupply events. The battery has 1.2 megawatts of power capability and 3.5 megawatt-hours of energy storage. A Washington research and development grant partially funded this project.
Chelan PUD (2018 draft IRP, p. 13): Oversupply in the region continues to have a financial impact to utilities. In spite of the Northwest seeing a rapid end to the wind fleet buildout as many financial incentives are ending, regional policies, California markets and solar energy continue to create oversupply conditions throughout the Western Interconnect.
For comparison, the spring runoff period (April-July) of 2016 had two day-ahead days with negative local prices, and 2017 had 35 days. In the hourly balancing or real-time market, 2016 had 23 hours with negative local prices, and 2017 had 368 hours. Snowpack and timing of spring runoff can impact the number of days and hours with oversupply and negative prices.
As wind’s intermittent nature can push a region into oversupply, behind-the-meter or unmetered solar (residential) and metered (utility-sized) solar continues to increase due to an exponential drop in solar panel cost and similar growth in solar panel output. Full solar output can just as easily push a region into oversupply as wind alone once did.
In the Northwest, the BPA has developed new business practices that push the burden of oversupply back to the market and away from themselves. These new practices include not selling at negative prices until spilled water reaches dissolved gas limits, holding renewable generators to a fixed schedule, not accepting unplanned surplus and canceling transmission loss returns. The cancelling of transmission loss returns can add hundreds of megawatts to an already oversupplied period and drive prices even more negative.
Washington State Utility Resource Planning Report 2018
21
Appendix A: Utility Cover Sheets
Washington Electric Utility Loads and Resources Estimates reported to the Department of Commerce in 2018.

Alder Mutual Light Co. << Utility Name
Washington State Utility Resource Plan Year 2018
Prepared by: BPA
Base Year 5 Yr. Est. 10 Yr Est.
Estimate Year 2017 2022 2027
Period Annual Annual Annual
Units (MWa) (MWa) (MWa)
Loads 0.60 0.55 0.55
Resources:
Future Conservation/Efficiency
Demand Response
BPA Tier 1 (include BPA PF) 0.60 0.55 0.55
BPA Tier 2
Non BPA:
Co-generation
Hydro (critical water)
Wind
Other Renewables
Thermal-Natural Gas
Thermal-Coal
Market Purchase (non BPA)
Other
Distributed Generation
Undecided
Total Resources 0.60 0.55 0.55
Load Resource Balance 0.00 0.00 0.00
22
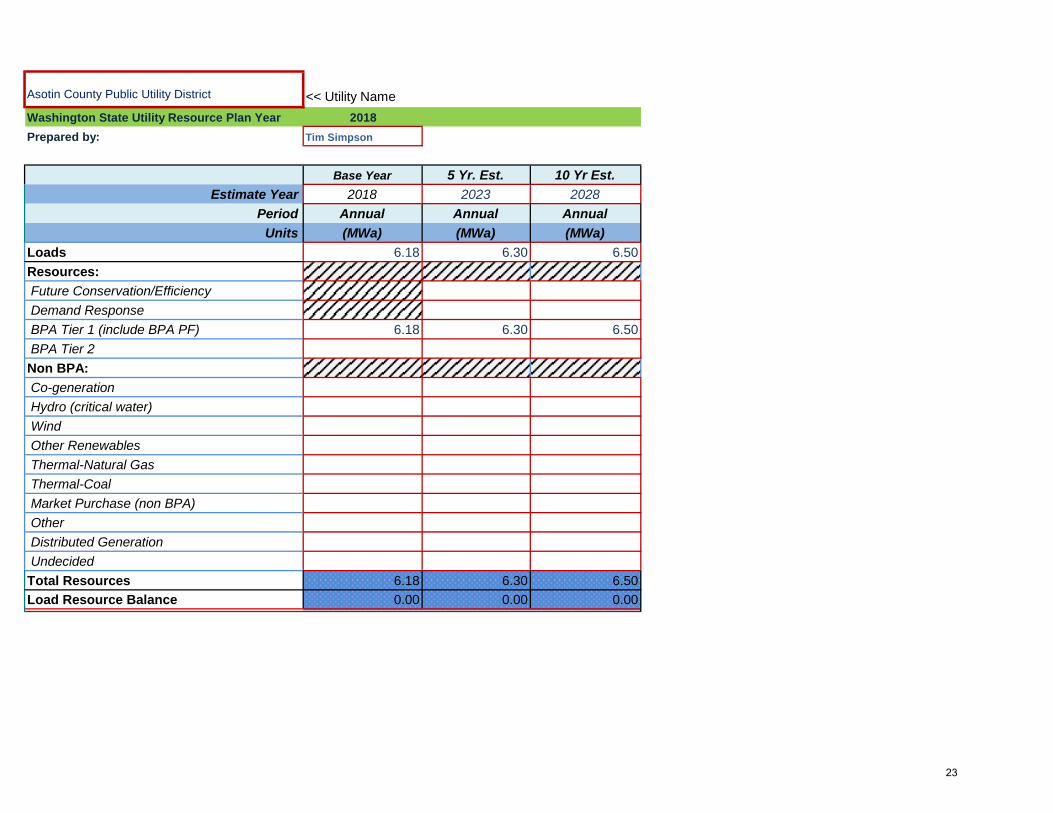
Asotin County Public Utility District << Utility Name
Washington State Utility Resource Plan Year 2018
Prepared by: Tim Simpson
Base Year 5 Yr. Est. 10 Yr Est.
Estimate Year 2018 2023 2028
Period Annual Annual Annual
Units (MWa) (MWa) (MWa)
Loads 6.18 6.30 6.50
Resources:
Future Conservation/Efficiency
Demand Response
BPA Tier 1 (include BPA PF) 6.18 6.30 6.50
BPA Tier 2
Non BPA:
Co-generation
Hydro (critical water)
Wind
Other Renewables
Thermal-Natural Gas
Thermal-Coal
Market Purchase (non BPA)
Other
Distributed Generation
Undecided
Total Resources 6.18 6.30 6.50
Load Resource Balance 0.00 0.00 0.00
23
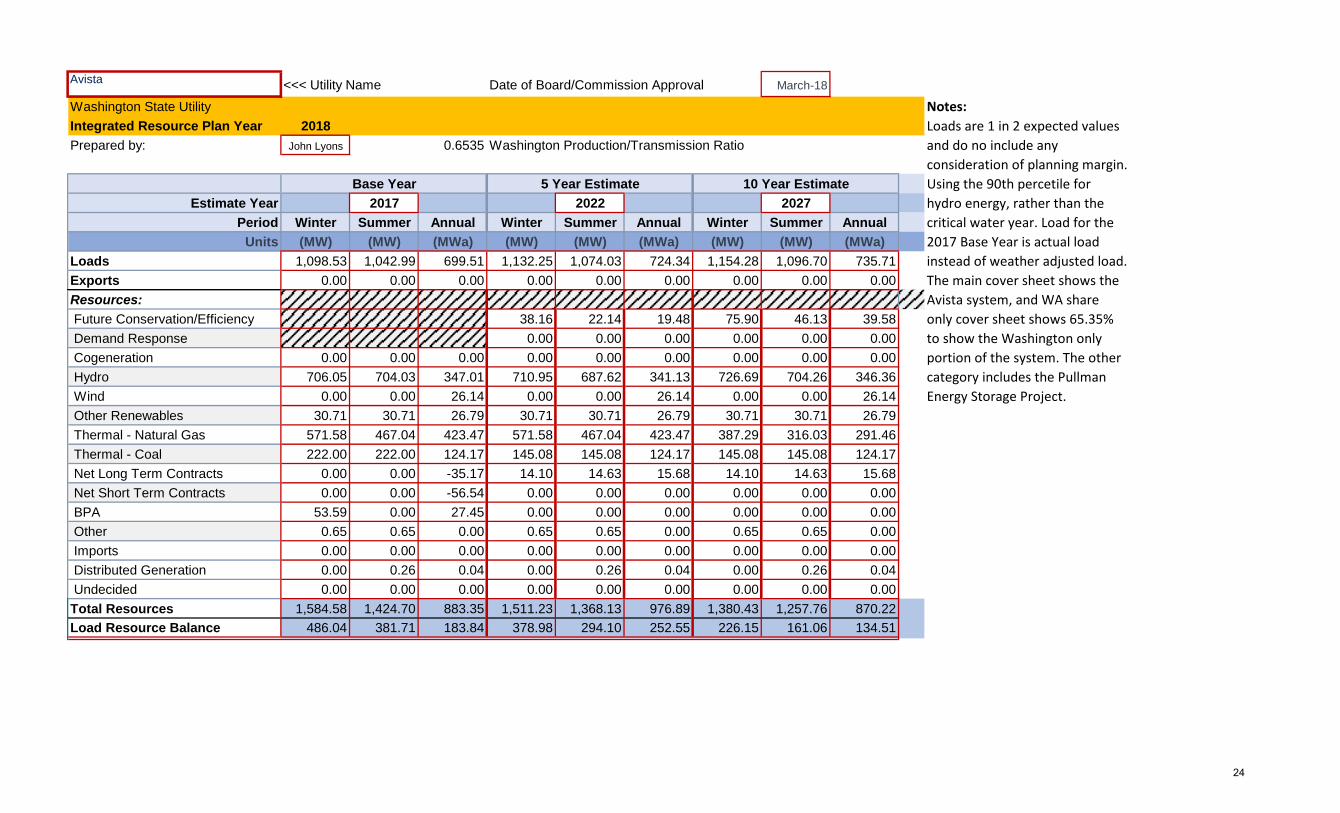
Avista <<< Utility Name Date of Board/Commission Approval March-18
Washington State Utility Notes:
Integrated Resource Plan Year 2018
Prepared by: John Lyons 0.6535 Washington Production/Transmission Ratio
Base Year 5 Year Estimate 10 Year Estimate
Estimate Year 2017 2022 2027
Period Winter Summer Annual Winter Summer Annual Winter Summer Annual
Units (MW) (MW) (MWa) (MW) (MW) (MWa) (MW) (MW) (MWa)
Loads 1,098.53 1,042.99 699.51 1,132.25 1,074.03 724.34 1,154.28 1,096.70 735.71
Exports 0.00 0.00 0.00 0.00 0.00 0.00 0.00 0.00 0.00
Resources:
Future Conservation/Efficiency 38.16 22.14 19.48 75.90 46.13 39.58
Demand Response 0.00 0.00 0.00 0.00 0.00 0.00
Cogeneration 0.00 0.00 0.00 0.00 0.00 0.00 0.00 0.00 0.00
Hydro 706.05 704.03 347.01 710.95 687.62 341.13 726.69 704.26 346.36
Wind 0.00 0.00 26.14 0.00 0.00 26.14 0.00 0.00 26.14
Other Renewables 30.71 30.71 26.79 30.71 30.71 26.79 30.71 30.71 26.79
Thermal - Natural Gas 571.58 467.04 423.47 571.58 467.04 423.47 387.29 316.03 291.46
Thermal - Coal 222.00 222.00 124.17 145.08 145.08 124.17 145.08 145.08 124.17
Net Long Term Contracts 0.00 0.00 -35.17 14.10 14.63 15.68 14.10 14.63 15.68
Net Short Term Contracts 0.00 0.00 -56.54 0.00 0.00 0.00 0.00 0.00 0.00
BPA 53.59 0.00 27.45 0.00 0.00 0.00 0.00 0.00 0.00
Other 0.65 0.65 0.00 0.65 0.65 0.00 0.65 0.65 0.00
Imports 0.00 0.00 0.00 0.00 0.00 0.00 0.00 0.00 0.00
Distributed Generation 0.00 0.26 0.04 0.00 0.26 0.04 0.00 0.26 0.04
Undecided 0.00 0.00 0.00 0.00 0.00 0.00 0.00 0.00 0.00
Total Resources 1,584.58 1,424.70 883.35 1,511.23 1,368.13 976.89 1,380.43 1,257.76 870.22
Load Resource Balance 486.04 381.71 183.84 378.98 294.10 252.55 226.15 161.06 134.51
Loads are 1 in 2 expected values
and do no include any
consideration of planning margin.
Using the 90th percetile for
hydro energy, rather than the
critical water year. Load for the
2017 Base Year is actual load
instead of weather adjusted load.
The main cover sheet shows the
Avista system, and WA share
only cover sheet shows 65.35%
to show the Washington only
portion of the system. The other
category includes the Pullman
Energy Storage Project.
24
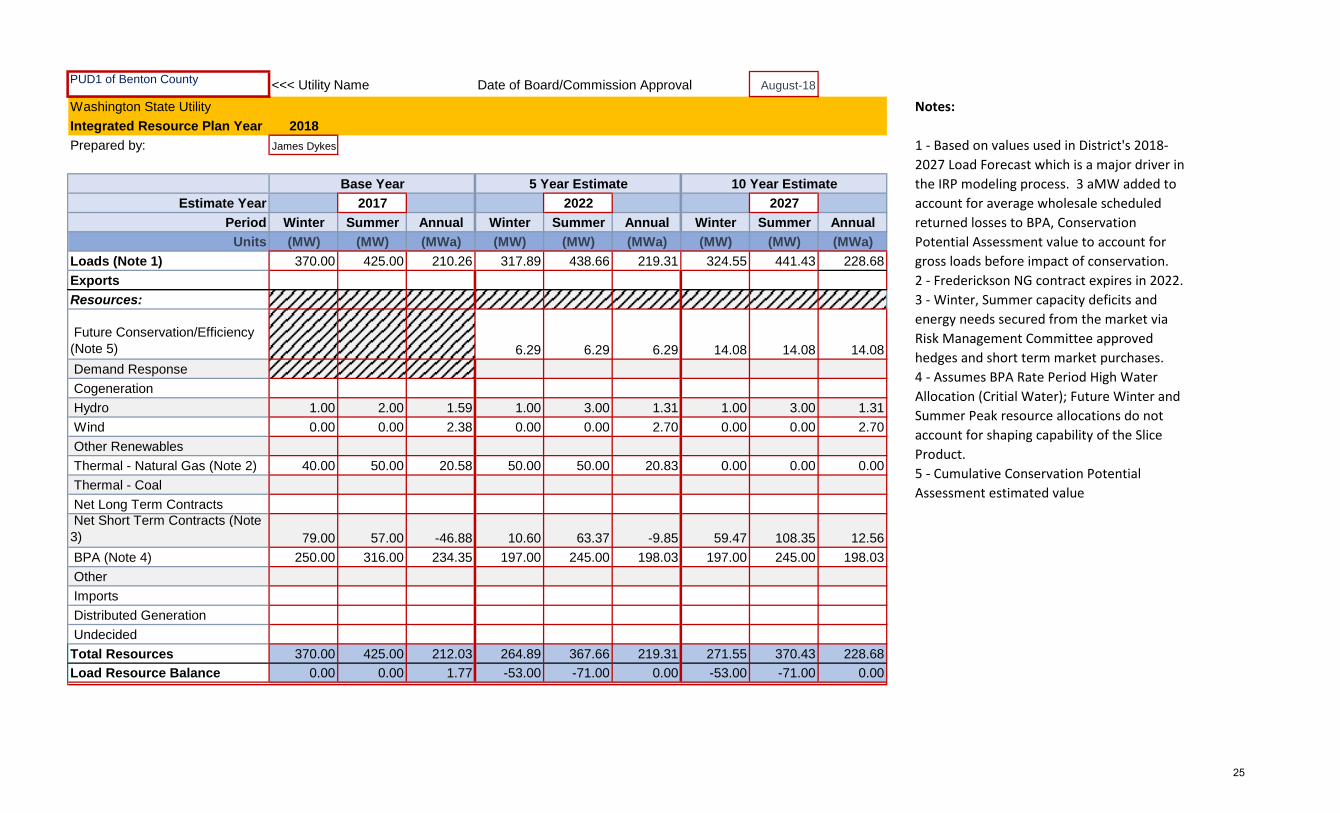
PUD1 of Benton County <<< Utility Name Date of Board/Commission Approval August-18
Washington State Utility Notes:
Integrated Resource Plan Year 2018
Prepared by: James Dykes
Base Year 5 Year Estimate 10 Year Estimate
Estimate Year 2017 2022 2027
Period Winter Summer Annual Winter Summer Annual Winter Summer Annual
Units (MW) (MW) (MWa) (MW) (MW) (MWa) (MW) (MW) (MWa)
Loads (Note 1) 370.00 425.00 210.26 317.89 438.66 219.31 324.55 441.43 228.68
Exports
Resources:
Future Conservation/Efficiency (Note 5) 6.29 6.29 6.29 14.08 14.08 14.08
Demand Response
Cogeneration
Hydro 1.00 2.00 1.59 1.00 3.00 1.31 1.00 3.00 1.31
Wind 0.00 0.00 2.38 0.00 0.00 2.70 0.00 0.00 2.70
Other Renewables
Thermal - Natural Gas (Note 2) 40.00 50.00 20.58 50.00 50.00 20.83 0.00 0.00 0.00
Thermal - Coal
Net Long Term Contracts Net Short Term Contracts (Note 3) 79.00 57.00 -46.88 10.60 63.37 -9.85 59.47 108.35 12.56
BPA (Note 4) 250.00 316.00 234.35 197.00 245.00 198.03 197.00 245.00 198.03
Other
Imports
Distributed Generation
Undecided
Total Resources 370.00 425.00 212.03 264.89 367.66 219.31 271.55 370.43 228.68
Load Resource Balance 0.00 0.00 1.77 -53.00 -71.00 0.00 -53.00 -71.00 0.00
1 - Based on values used in District's 2018-
2027 Load Forecast which is a major driver in
the IRP modeling process. 3 aMW added to
account for average wholesale scheduled
returned losses to BPA, Conservation
Potential Assessment value to account for
gross loads before impact of conservation.
2 - Frederickson NG contract expires in 2022.
3 - Winter, Summer capacity deficits and
energy needs secured from the market via
Risk Management Committee approved
hedges and short term market purchases.
4 - Assumes BPA Rate Period High Water
Allocation (Critial Water); Future Winter and
Summer Peak resource allocations do not
account for shaping capability of the Slice
Product.
5 - Cumulative Conservation Potential
Assessment estimated value
25
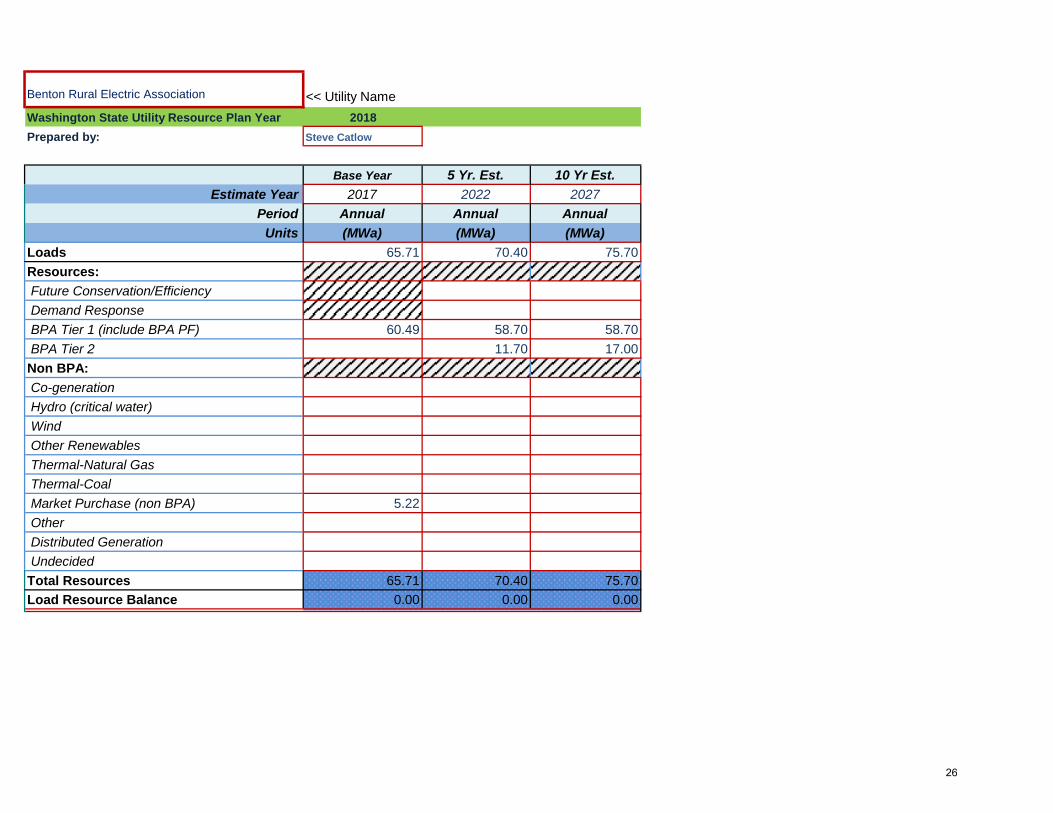
Benton Rural Electric Association << Utility Name
Washington State Utility Resource Plan Year 2018
Prepared by: Steve Catlow
Base Year 5 Yr. Est. 10 Yr Est.
Estimate Year 2017 2022 2027
Period Annual Annual Annual
Units (MWa) (MWa) (MWa)
Loads 65.71 70.40 75.70
Resources:
Future Conservation/Efficiency
Demand Response
BPA Tier 1 (include BPA PF) 60.49 58.70 58.70
BPA Tier 2 11.70 17.00
Non BPA:
Co-generation
Hydro (critical water)
Wind
Other Renewables
Thermal-Natural Gas
Thermal-Coal
Market Purchase (non BPA) 5.22
Other
Distributed Generation
Undecided
Total Resources 65.71 70.40 75.70
Load Resource Balance 0.00 0.00 0.00
26
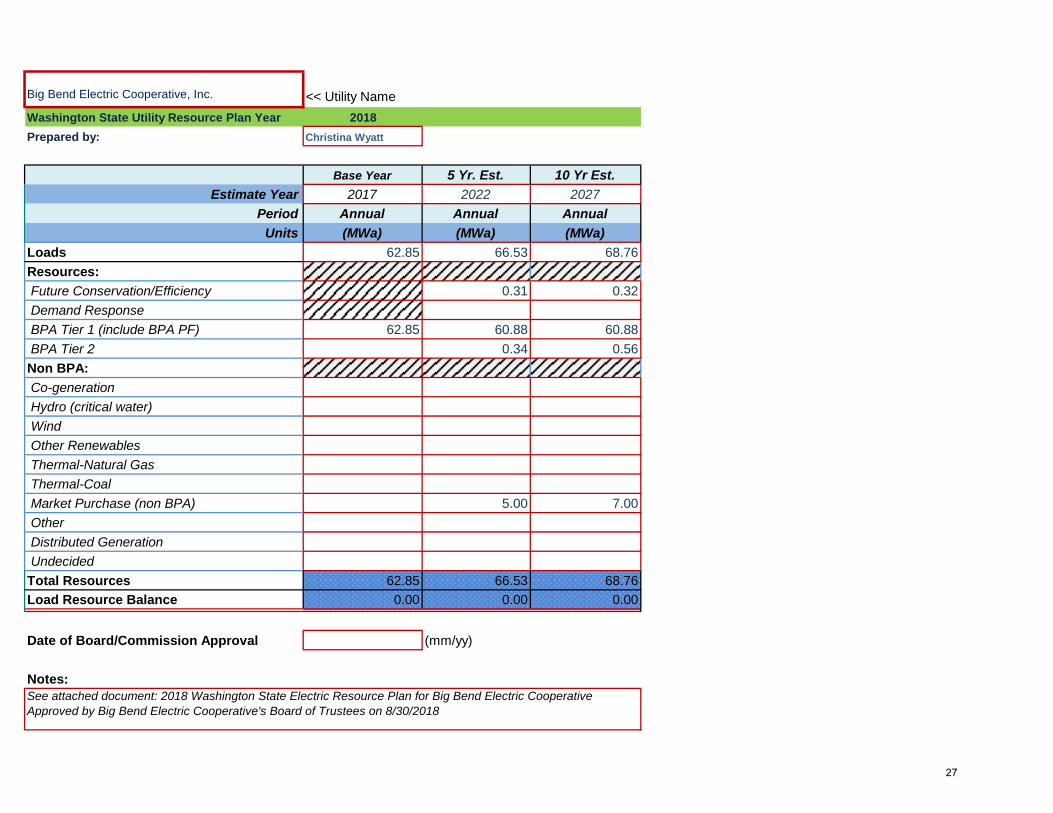
Big Bend Electric Cooperative, Inc. << Utility Name
Washington State Utility Resource Plan Year 2018
Prepared by: Christina Wyatt
Base Year 5 Yr. Est. 10 Yr Est.
Estimate Year 2017 2022 2027
Period Annual Annual Annual
Units (MWa) (MWa) (MWa)
Loads 62.85 66.53 68.76
Resources:
Future Conservation/Efficiency 0.31 0.32
Demand Response
BPA Tier 1 (include BPA PF) 62.85 60.88 60.88
BPA Tier 2 0.34 0.56
Non BPA:
Co-generation
Hydro (critical water)
Wind
Other Renewables
Thermal-Natural Gas
Thermal-Coal
Market Purchase (non BPA) 5.00 7.00
Other
Distributed Generation
Undecided
Total Resources 62.85 66.53 68.76
Load Resource Balance 0.00 0.00 0.00
Date of Board/Commission Approval (mm/yy)
Notes: See attached document: 2018 Washington State Electric Resource Plan for Big Bend Electric Cooperative
Approved by Big Bend Electric Cooperative's Board of Trustees on 8/30/2018
27
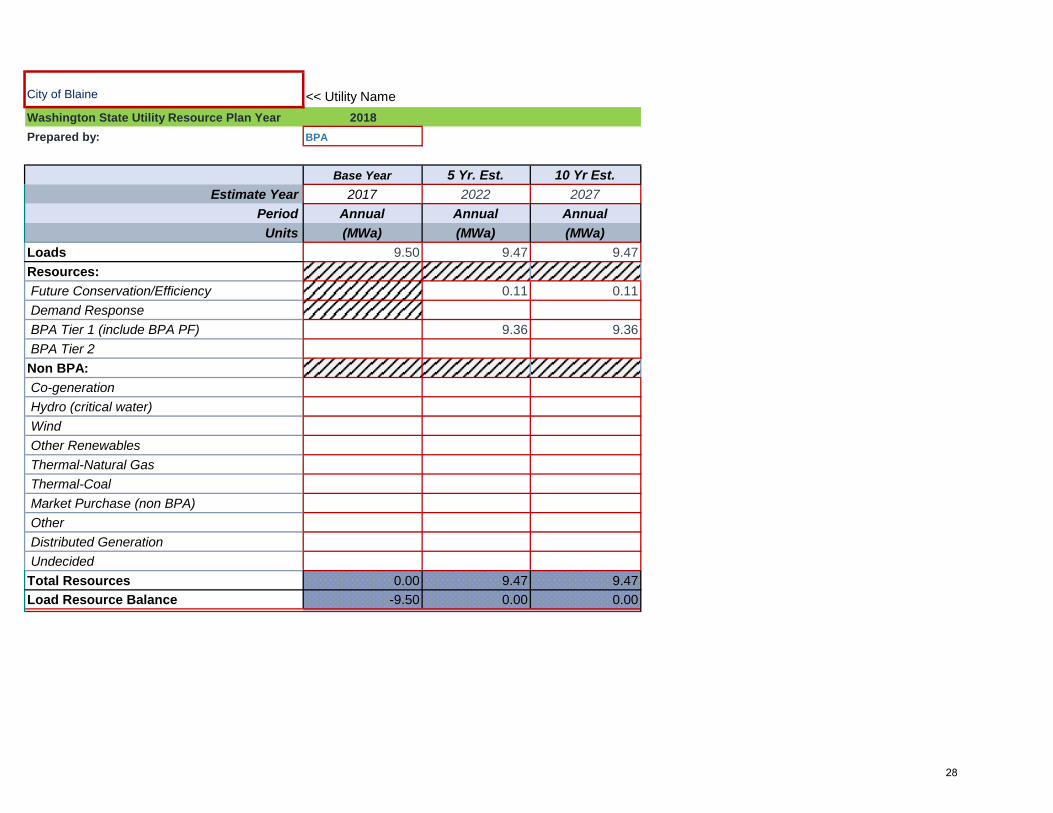
City of Blaine << Utility Name
Washington State Utility Resource Plan Year 2018
Prepared by: BPA
Base Year 5 Yr. Est. 10 Yr Est.
Estimate Year 2017 2022 2027
Period Annual Annual Annual
Units (MWa) (MWa) (MWa)
Loads 9.50 9.47 9.47
Resources:
Future Conservation/Efficiency 0.11 0.11
Demand Response
BPA Tier 1 (include BPA PF) 9.36 9.36
BPA Tier 2
Non BPA:
Co-generation
Hydro (critical water)
Wind
Other Renewables
Thermal-Natural Gas
Thermal-Coal
Market Purchase (non BPA)
Other
Distributed Generation
Undecided
Total Resources 0.00 9.47 9.47
Load Resource Balance -9.50 0.00 0.00
28
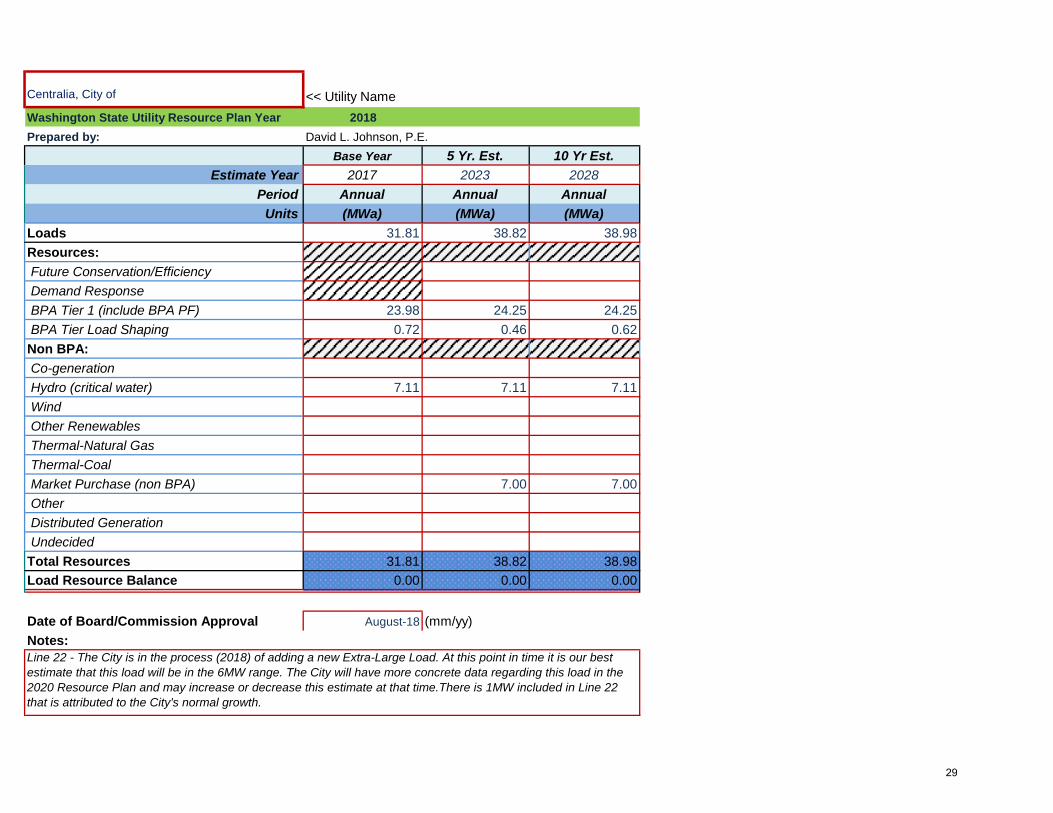
Centralia, City of << Utility Name
Washington State Utility Resource Plan Year 2018
Prepared by: David L. Johnson, P.E.
Base Year 5 Yr. Est. 10 Yr Est.
Estimate Year 2017 2023 2028
Period Annual Annual Annual
Units (MWa) (MWa) (MWa)
Loads 31.81 38.82 38.98
Resources:
Future Conservation/Efficiency
Demand Response
BPA Tier 1 (include BPA PF) 23.98 24.25 24.25
BPA Tier Load Shaping 0.72 0.46 0.62
Non BPA:
Co-generation
Hydro (critical water) 7.11 7.11 7.11
Wind
Other Renewables
Thermal-Natural Gas
Thermal-Coal
Market Purchase (non BPA) 7.00 7.00
Other
Distributed Generation
Undecided
Total Resources 31.81 38.82 38.98
Load Resource Balance 0.00 0.00 0.00
Date of Board/Commission Approval August-18 (mm/yy)
Notes: Line 22 - The City is in the process (2018) of adding a new Extra-Large Load. At this point in time it is our best
estimate that this load will be in the 6MW range. The City will have more concrete data regarding this load in the
2020 Resource Plan and may increase or decrease this estimate at that time.There is 1MW included in Line 22
that is attributed to the City's normal growth.
29
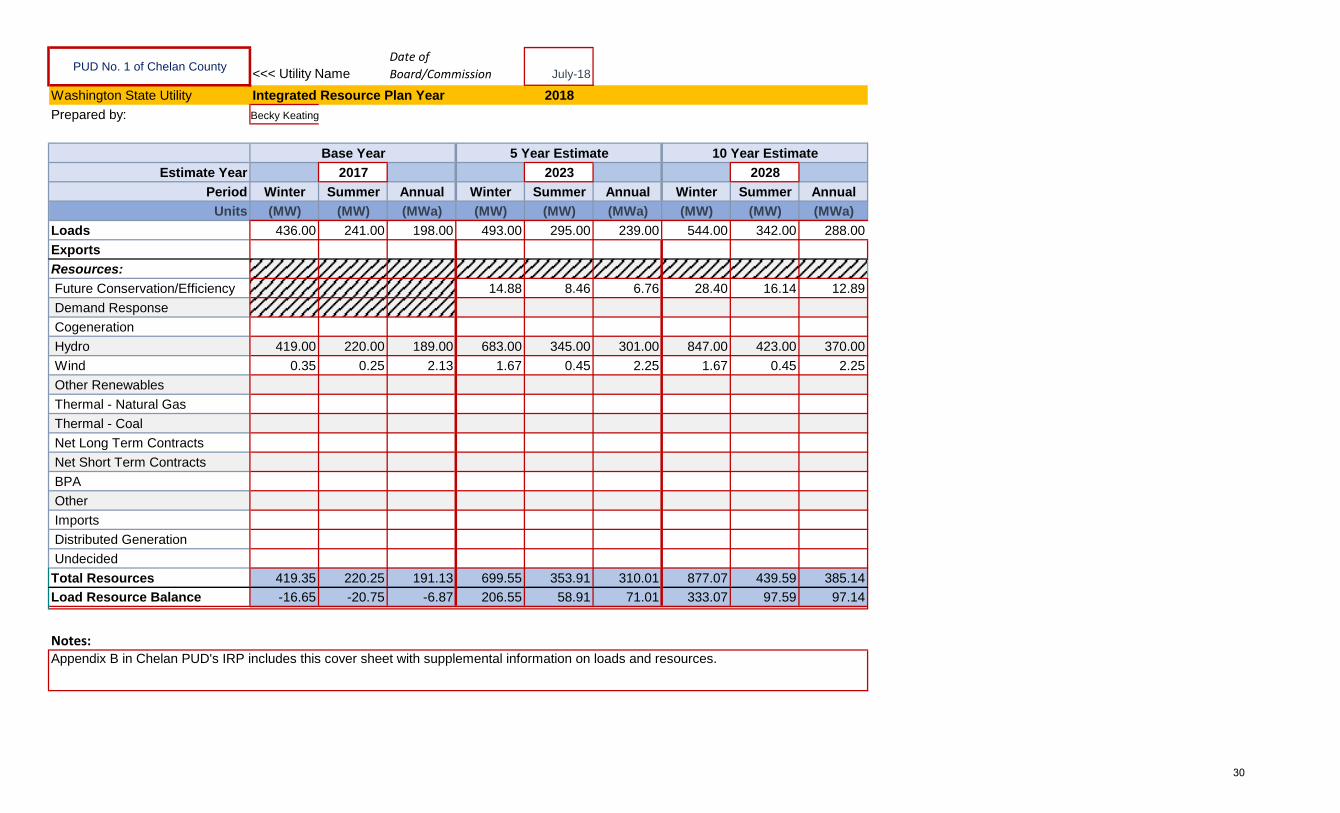
PUD No. 1 of Chelan County<<< Utility Name July-18
Washington State Utility Integrated Resource Plan Year 2018
Prepared by: Becky Keating
Base Year 5 Year Estimate 10 Year Estimate
Estimate Year 2017 2023 2028
Period Winter Summer Annual Winter Summer Annual Winter Summer Annual
Units (MW) (MW) (MWa) (MW) (MW) (MWa) (MW) (MW) (MWa)
Loads 436.00 241.00 198.00 493.00 295.00 239.00 544.00 342.00 288.00
Exports
Resources:
Future Conservation/Efficiency 14.88 8.46 6.76 28.40 16.14 12.89
Demand Response
Cogeneration
Hydro 419.00 220.00 189.00 683.00 345.00 301.00 847.00 423.00 370.00
Wind 0.35 0.25 2.13 1.67 0.45 2.25 1.67 0.45 2.25
Other Renewables
Thermal - Natural Gas
Thermal - Coal
Net Long Term Contracts
Net Short Term Contracts
BPA
Other
Imports
Distributed Generation
Undecided
Total Resources 419.35 220.25 191.13 699.55 353.91 310.01 877.07 439.59 385.14
Load Resource Balance -16.65 -20.75 -6.87 206.55 58.91 71.01 333.07 97.59 97.14
Appendix B in Chelan PUD's IRP includes this cover sheet with supplemental information on loads and resources.
Notes:
Date of
Board/Commission
Approval
30
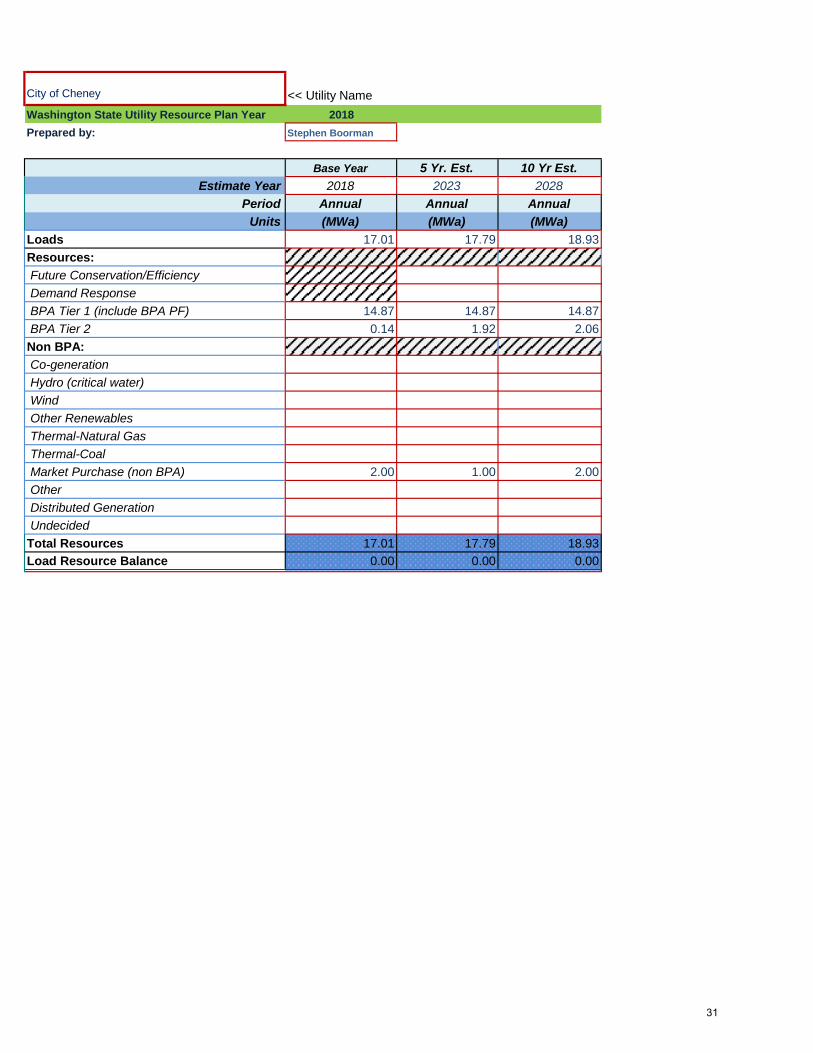
City of Cheney << Utility Name
Washington State Utility Resource Plan Year 2018
Prepared by: Stephen Boorman
Base Year 5 Yr. Est. 10 Yr Est.
Estimate Year 2018 2023 2028
Period Annual Annual Annual
Units (MWa) (MWa) (MWa)
Loads 17.01 17.79 18.93
Resources:
Future Conservation/Efficiency
Demand Response
BPA Tier 1 (include BPA PF) 14.87 14.87 14.87
BPA Tier 2 0.14 1.92 2.06
Non BPA:
Co-generation
Hydro (critical water)
Wind
Other Renewables
Thermal-Natural Gas
Thermal-Coal
Market Purchase (non BPA) 2.00 1.00 2.00
Other
Distributed Generation
Undecided
Total Resources 17.01 17.79 18.93
Load Resource Balance 0.00 0.00 0.00
31
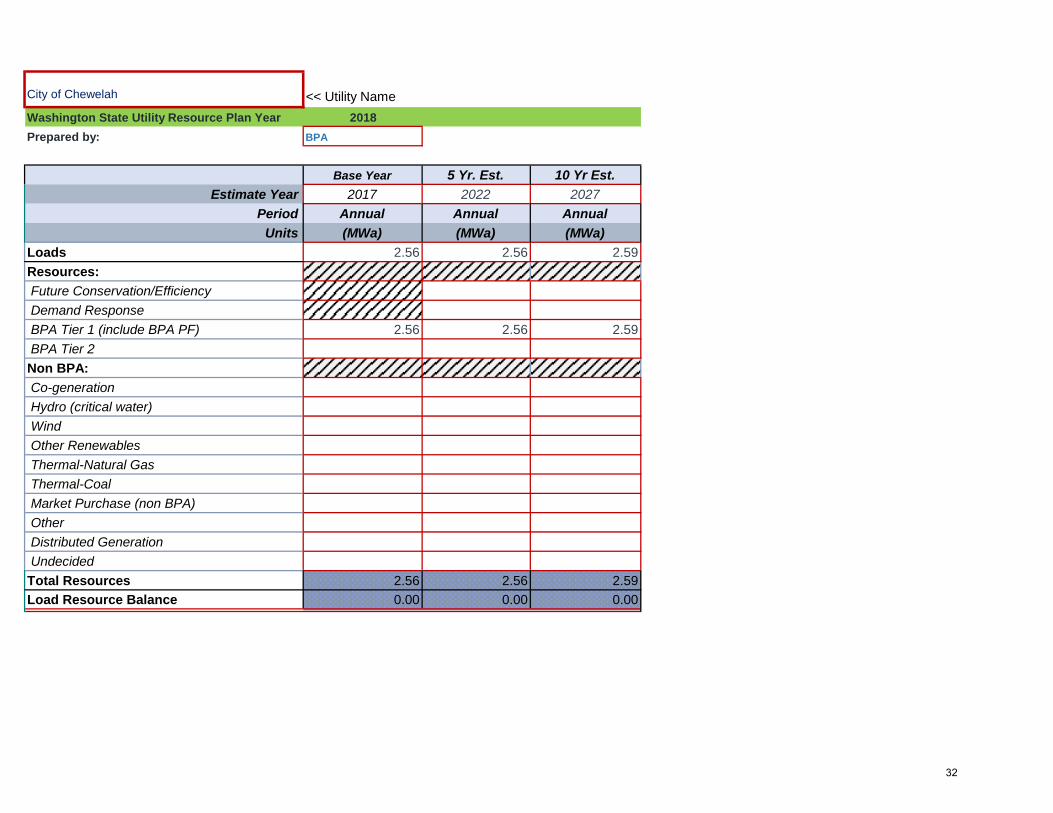
City of Chewelah << Utility Name
Washington State Utility Resource Plan Year 2018
Prepared by: BPA
Base Year 5 Yr. Est. 10 Yr Est.
Estimate Year 2017 2022 2027
Period Annual Annual Annual
Units (MWa) (MWa) (MWa)
Loads 2.56 2.56 2.59
Resources:
Future Conservation/Efficiency
Demand Response
BPA Tier 1 (include BPA PF) 2.56 2.56 2.59
BPA Tier 2
Non BPA:
Co-generation
Hydro (critical water)
Wind
Other Renewables
Thermal-Natural Gas
Thermal-Coal
Market Purchase (non BPA)
Other
Distributed Generation
Undecided
Total Resources 2.56 2.56 2.59
Load Resource Balance 0.00 0.00 0.00
32
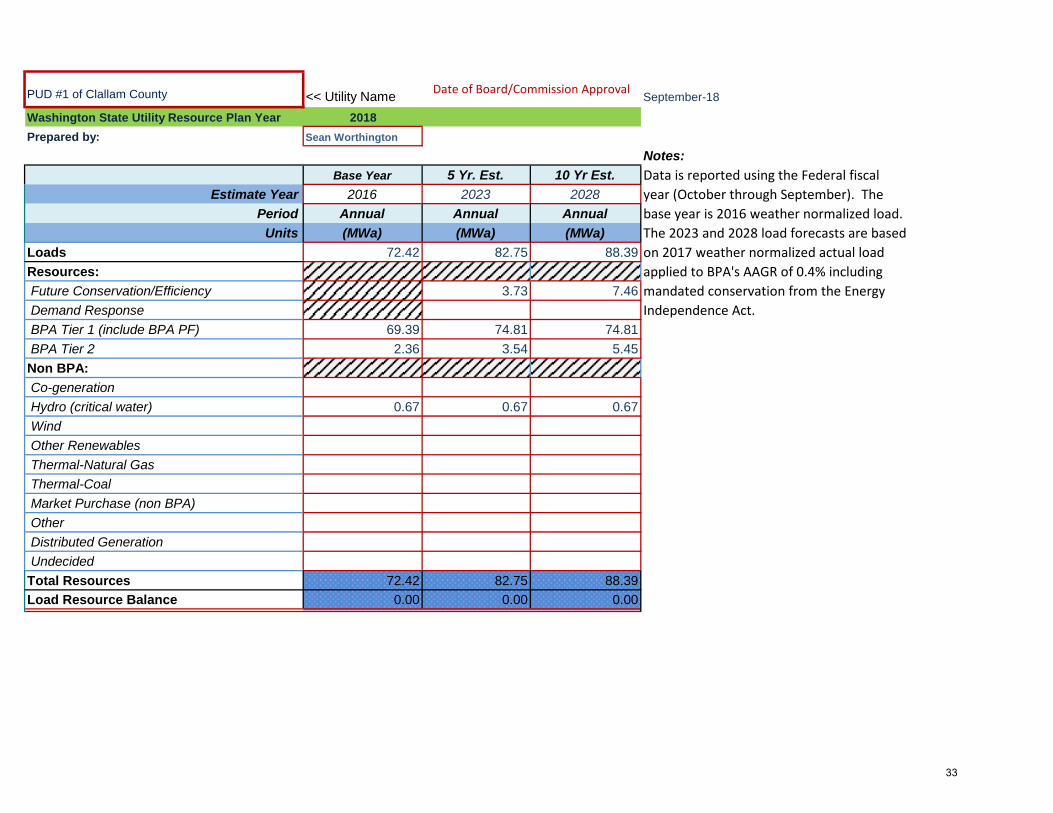
PUD #1 of Clallam County << Utility Name September-18
Washington State Utility Resource Plan Year 2018
Prepared by: Sean Worthington
Notes:
Base Year 5 Yr. Est. 10 Yr Est.
Estimate Year 2016 2023 2028
Period Annual Annual Annual
Units (MWa) (MWa) (MWa)
Loads 72.42 82.75 88.39
Resources:
Future Conservation/Efficiency 3.73 7.46
Demand Response
BPA Tier 1 (include BPA PF) 69.39 74.81 74.81
BPA Tier 2 2.36 3.54 5.45
Non BPA:
Co-generation
Hydro (critical water) 0.67 0.67 0.67
Wind
Other Renewables
Thermal-Natural Gas
Thermal-Coal
Market Purchase (non BPA)
Other
Distributed Generation
Undecided
Total Resources 72.42 82.75 88.39
Load Resource Balance 0.00 0.00 0.00
Date of Board/Commission Approval
Data is reported using the Federal fiscal
year (October through September). The
base year is 2016 weather normalized load.
The 2023 and 2028 load forecasts are based
on 2017 weather normalized actual load
applied to BPA's AAGR of 0.4% including
mandated conservation from the Energy
Independence Act.
33
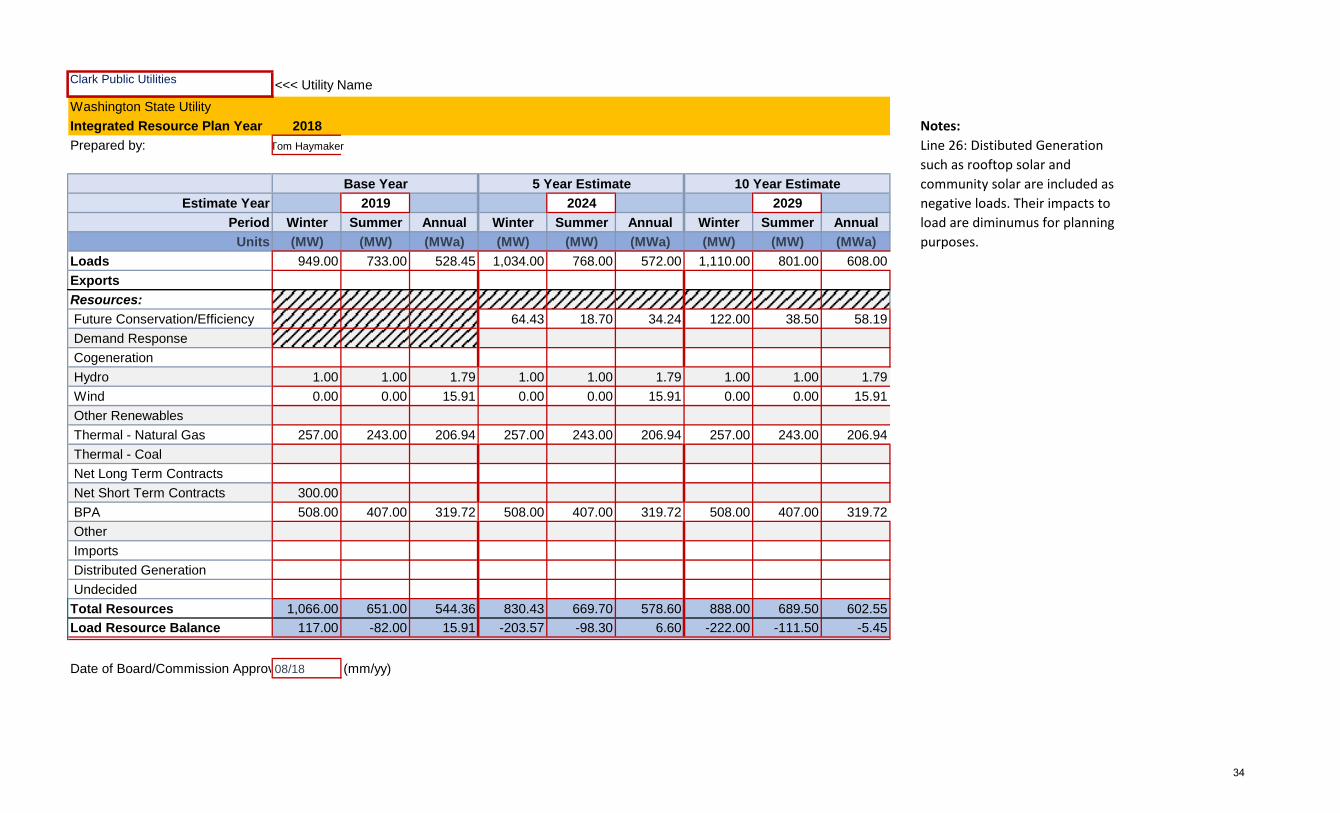
Clark Public Utilities <<< Utility Name
Washington State Utility
Integrated Resource Plan Year 2018 Notes:
Prepared by: Tom Haymaker
Base Year 5 Year Estimate 10 Year Estimate
Estimate Year 2019 2024 2029
Period Winter Summer Annual Winter Summer Annual Winter Summer Annual
Units (MW) (MW) (MWa) (MW) (MW) (MWa) (MW) (MW) (MWa)
Loads 949.00 733.00 528.45 1,034.00 768.00 572.00 1,110.00 801.00 608.00
Exports
Resources:
Future Conservation/Efficiency 64.43 18.70 34.24 122.00 38.50 58.19
Demand Response
Cogeneration
Hydro 1.00 1.00 1.79 1.00 1.00 1.79 1.00 1.00 1.79
Wind 0.00 0.00 15.91 0.00 0.00 15.91 0.00 0.00 15.91
Other Renewables
Thermal - Natural Gas 257.00 243.00 206.94 257.00 243.00 206.94 257.00 243.00 206.94
Thermal - Coal
Net Long Term Contracts
Net Short Term Contracts 300.00
BPA 508.00 407.00 319.72 508.00 407.00 319.72 508.00 407.00 319.72
Other
Imports
Distributed Generation
Undecided
Total Resources 1,066.00 651.00 544.36 830.43 669.70 578.60 888.00 689.50 602.55
Load Resource Balance 117.00 -82.00 15.91 -203.57 -98.30 6.60 -222.00 -111.50 -5.45
Date of Board/Commission Approval08/18 (mm/yy)
Line 26: Distibuted Generation
such as rooftop solar and
community solar are included as
negative loads. Their impacts to
load are diminumus for planning
purposes.
34

Columbia REA << Utility Name
Washington State Utility Resource Plan Year 2018
Prepared by: Jim Cooper
Base Year 5 Yr. Est. 10 Yr Est.
Estimate Year
Period Annual Annual Annual
Units (MWa) (MWa) (MWa)
Loads 41.82 46.04 51.65
Resources:
Future Conservation/Efficiency
Demand Response
BPA Tier 1 (include BPA PF) 37.56 37.49 37.49
BPA Tier 2 2.41
Non BPA:
Co-generation
Hydro (critical water) 1.35
Wind
Other Renewables
Thermal-Natural Gas
Thermal-Coal
Market Purchase (non BPA) 0.50 8.55 14.16
Other
Distributed Generation
Undecided
Total Resources 41.82 46.04 51.65
Load Resource Balance 0.00 0.00 0.00
Date of Board/Commission Approval October-17 (mm/yy)
35

Consolidated Irrigation District No. 19 << Utility Name
Washington State Utility Resource Plan Year 2018
Prepared by: BPA
Base Year 5 Yr. Est. 10 Yr Est.
Estimate Year 2017 2022 2027
Period Annual Annual Annual
Units (MWa) (MWa) (MWa)
Loads 0.27 0.23 0.24
Resources:
Future Conservation/Efficiency
Demand Response
BPA Tier 1 (include BPA PF) 0.27 0.23 0.24
BPA Tier 2
Non BPA:
Co-generation
Hydro (critical water)
Wind
Other Renewables
Thermal-Natural Gas
Thermal-Coal
Market Purchase (non BPA)
Other
Distributed Generation
Undecided
Total Resources 0.27 0.23 0.24
Load Resource Balance 0.00 0.00 0.00
36

Town of Coulee Dam << Utility Name
Washington State Utility Resource Plan Year 2018
Prepared by: BPA
Base Year 5 Yr. Est. 10 Yr Est.
Estimate Year 2017 2022 2027
Period Annual Annual Annual
Units (MWa) (MWa) (MWa)
Loads 2.06 1.94 2.01
Resources:
Future Conservation/Efficiency
Demand Response
BPA Tier 1 (include BPA PF) 2.06 1.94 2.01
BPA Tier 2
Non BPA:
Co-generation
Hydro (critical water)
Wind
Other Renewables
Thermal-Natural Gas
Thermal-Coal
Market Purchase (non BPA)
Other
Distributed Generation
Undecided
Total Resources 2.06 1.94 2.01
Load Resource Balance 0.00 0.00 0.00
37
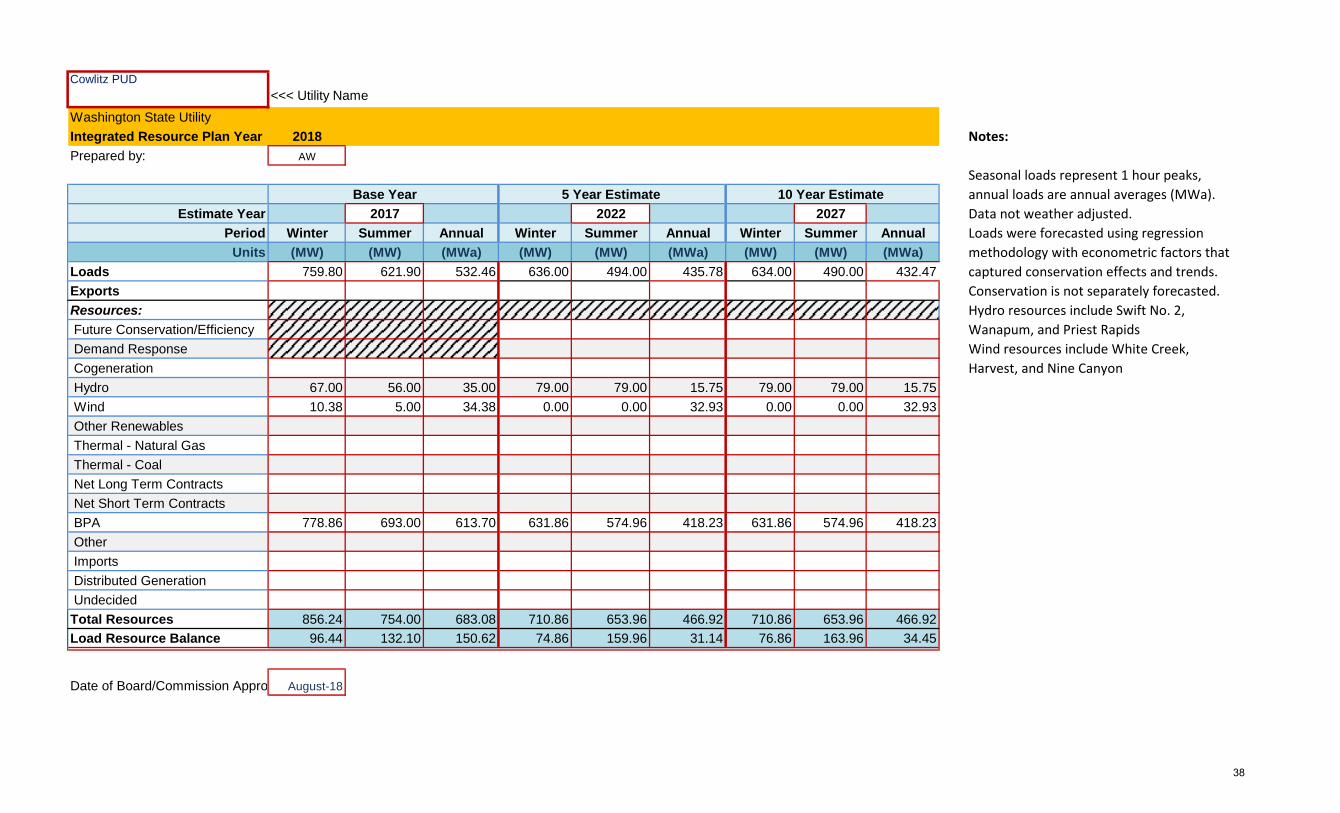
Cowlitz PUD
<<< Utility Name
Washington State Utility
Integrated Resource Plan Year 2018 Notes:
Prepared by: AW
Base Year 5 Year Estimate 10 Year Estimate
Estimate Year 2017 2022 2027
Period Winter Summer Annual Winter Summer Annual Winter Summer Annual
Units (MW) (MW) (MWa) (MW) (MW) (MWa) (MW) (MW) (MWa)
Loads 759.80 621.90 532.46 636.00 494.00 435.78 634.00 490.00 432.47
Exports
Resources:
Future Conservation/Efficiency
Demand Response
Cogeneration
Hydro 67.00 56.00 35.00 79.00 79.00 15.75 79.00 79.00 15.75
Wind 10.38 5.00 34.38 0.00 0.00 32.93 0.00 0.00 32.93
Other Renewables
Thermal - Natural Gas
Thermal - Coal
Net Long Term Contracts
Net Short Term Contracts
BPA 778.86 693.00 613.70 631.86 574.96 418.23 631.86 574.96 418.23
Other
Imports
Distributed Generation
Undecided
Total Resources 856.24 754.00 683.08 710.86 653.96 466.92 710.86 653.96 466.92
Load Resource Balance 96.44 132.10 150.62 74.86 159.96 31.14 76.86 163.96 34.45
Date of Board/Commission Approval August-18
Seasonal loads represent 1 hour peaks,
annual loads are annual averages (MWa).
Data not weather adjusted.
Loads were forecasted using regression
methodology with econometric factors that
captured conservation effects and trends.
Conservation is not separately forecasted.
Hydro resources include Swift No. 2,
Wanapum, and Priest Rapids
Wind resources include White Creek,
Harvest, and Nine Canyon
38
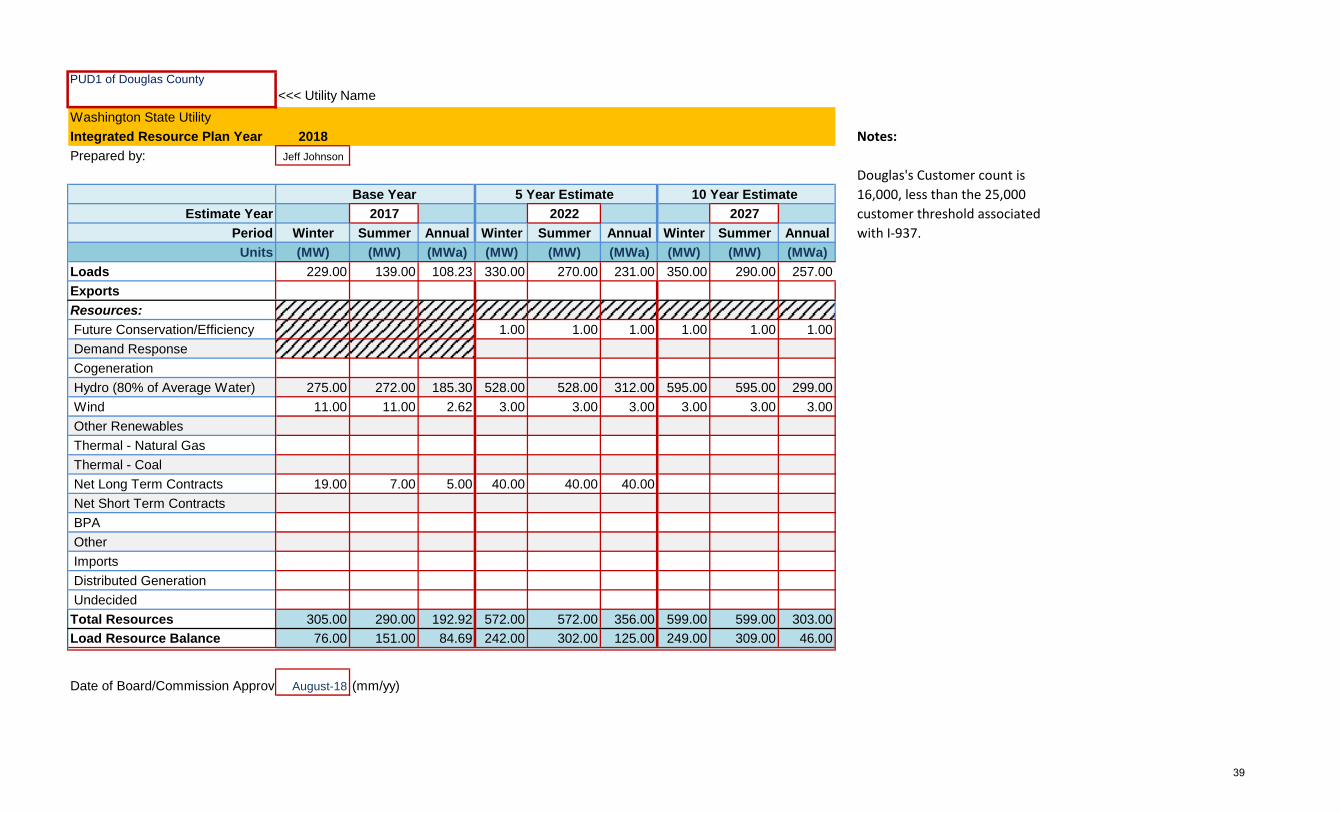
PUD1 of Douglas County
<<< Utility Name
Washington State Utility
Integrated Resource Plan Year 2018 Notes:
Prepared by: Jeff Johnson
Base Year 5 Year Estimate 10 Year Estimate
Estimate Year 2017 2022 2027
Period Winter Summer Annual Winter Summer Annual Winter Summer Annual
Units (MW) (MW) (MWa) (MW) (MW) (MWa) (MW) (MW) (MWa)
Loads 229.00 139.00 108.23 330.00 270.00 231.00 350.00 290.00 257.00
Exports
Resources:
Future Conservation/Efficiency 1.00 1.00 1.00 1.00 1.00 1.00
Demand Response
Cogeneration
Hydro (80% of Average Water) 275.00 272.00 185.30 528.00 528.00 312.00 595.00 595.00 299.00
Wind 11.00 11.00 2.62 3.00 3.00 3.00 3.00 3.00 3.00
Other Renewables
Thermal - Natural Gas
Thermal - Coal
Net Long Term Contracts 19.00 7.00 5.00 40.00 40.00 40.00
Net Short Term Contracts
BPA
Other
Imports
Distributed Generation
Undecided
Total Resources 305.00 290.00 192.92 572.00 572.00 356.00 599.00 599.00 303.00
Load Resource Balance 76.00 151.00 84.69 242.00 302.00 125.00 249.00 309.00 46.00
Date of Board/Commission Approval August-18 (mm/yy)
Douglas's Customer count is
16,000, less than the 25,000
customer threshold associated
with I-937.
39

Town of Eatonville << Utility Name
Washington State Utility Resource Plan Year 2018
Prepared by: BPA
Base Year 5 Yr. Est. 10 Yr Est.
Estimate Year 2017 2022 2027
Period Annual Annual Annual
Units (MWa) (MWa) (MWa)
Loads 3.34 3.42 3.48
Resources:
Future Conservation/Efficiency
Demand Response
BPA Tier 1 (include BPA PF) 3.34 3.42 3.48
BPA Tier 2
Non BPA:
Co-generation
Hydro (critical water)
Wind
Other Renewables
Thermal-Natural Gas
Thermal-Coal
Market Purchase (non BPA)
Other
Distributed Generation
Undecided
Total Resources 3.34 3.42 3.48
Load Resource Balance 0.00 0.00 0.00
40
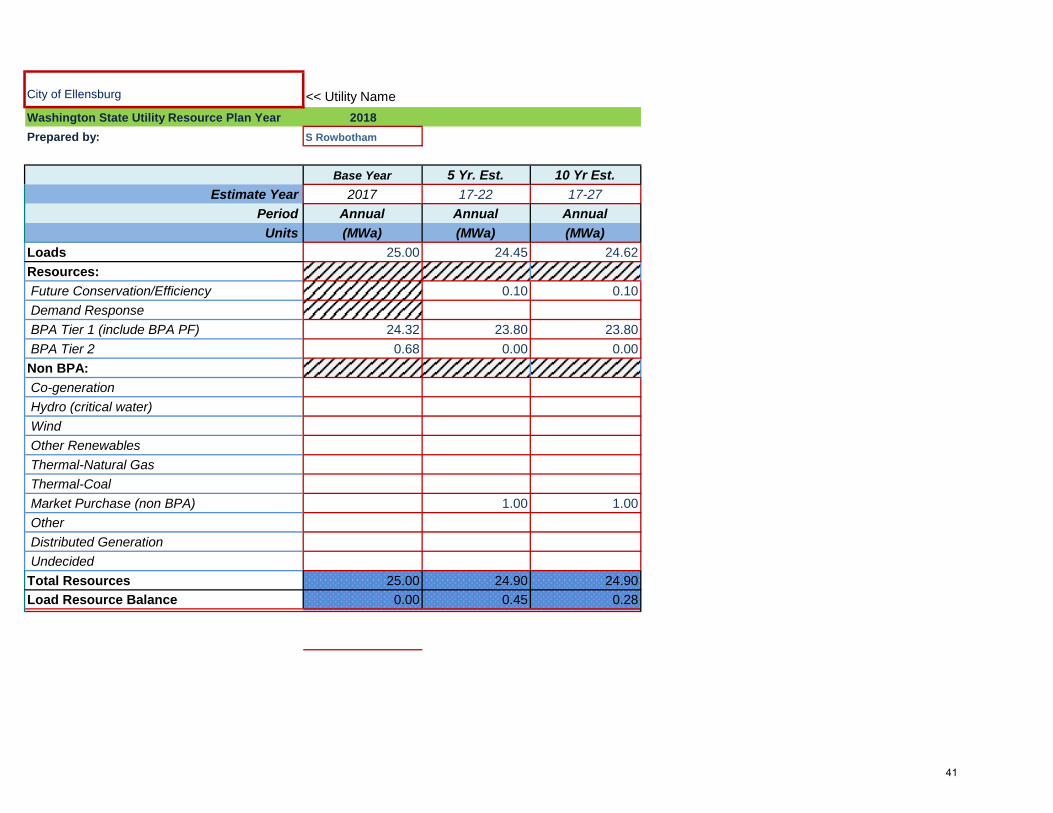
City of Ellensburg << Utility Name
Washington State Utility Resource Plan Year 2018
Prepared by: S Rowbotham
Base Year 5 Yr. Est. 10 Yr Est.
Estimate Year 2017 17-22 17-27
Period Annual Annual Annual
Units (MWa) (MWa) (MWa)
Loads 25.00 24.45 24.62
Resources:
Future Conservation/Efficiency 0.10 0.10
Demand Response
BPA Tier 1 (include BPA PF) 24.32 23.80 23.80
BPA Tier 2 0.68 0.00 0.00
Non BPA:
Co-generation
Hydro (critical water)
Wind
Other Renewables
Thermal-Natural Gas
Thermal-Coal
Market Purchase (non BPA) 1.00 1.00
Other
Distributed Generation
Undecided
Total Resources 25.00 24.90 24.90
Load Resource Balance 0.00 0.45 0.28
41

Elmhurst Mutual Power & Light Co. << Utility Name
Washington State Utility Resource Plan Year 2018
Prepared by: BPA
Base Year 5 Yr. Est. 10 Yr Est.
Estimate Year 2017 2022 2027
Period Annual Annual Annual
Units (MWa) (MWa) (MWa)
Loads 33.13 32.72 34.04
Resources:
Future Conservation/Efficiency 0.05 0.05
Demand Response
BPA Tier 1 (include BPA PF) 33.13 32.67 32.07
BPA Tier 2 1.92
Non BPA:
Co-generation
Hydro (critical water)
Wind
Other Renewables
Thermal-Natural Gas
Thermal-Coal
Market Purchase (non BPA)
Other
Distributed Generation
Undecided
Total Resources 33.13 32.72 34.04
Load Resource Balance 0.00 0.00 0.00
42

Public Utility District No. 1 of Ferry County << Utility Name
Washington State Utility Resource Plan Year 2018
Prepared by: BPA
Base Year 5 Yr. Est. 10 Yr Est.
Estimate Year 2017 2022 2027
Period Annual Annual Annual
Units (MWa) (MWa) (MWa)
Loads 10.60 9.27 9.38
Resources:
Future Conservation/Efficiency
Demand Response
BPA Tier 1 (include BPA PF) 10.60 9.27 9.38
BPA Tier 2
Non BPA:
Co-generation
Hydro (critical water)
Wind
Other Renewables
Thermal-Natural Gas
Thermal-Coal
Market Purchase (non BPA)
Other
Distributed Generation
Undecided
Total Resources 10.60 9.27 9.38
Load Resource Balance 0.00 0.00 0.00
43

Attachment A, Agenda Item 10
Public Utility District No 1. of Franklin County
Washington State Utility Resource Plan Year 2018
Prepared by: Richard Sargent
Base Year 5 Yr. Est. 10 Yr Est.
Estimate Year 2017 2022 2027
Period Annual Annual Annual
Units (MWa) (MWa) (MWa)
9 Loads 125.08 128.69 135.57
10 Resources:
11 Future Conservation/Efficiency 3.94 7.88
12 Demand Response
13 BPA Tier 1 (include BPA PF) 135.82 115.47 115.47
14 BPA Tier 2
15 Non BPA:
16 Co-generation
17 Hydro (critical water) 1.23 0.70 0.70
18 Wind 5.28 6.00 6.00
19 Other Renewables
20 Thermal-Natural Gas 12.35 20.00
21 Thermal-Coal
22 Market Purchase (non BPA) 5.39 5.00
23 Other
24 Distributed Generation 0.60 0.80 1.00
25 Undecided
26 Total Resources 160.66 146.91 136.05
27 Load Resource Balance 35.58 18.22 0.48
Date of Board/Commission Approval August-18 (mm/yy)
Base year load is actual and not weather normalized. Forecasted loads are weather normalized. Line 13 base year is actual Block/Slice received. Future BPA Resource is based upon Critical Water for Block/Slice; Line 20 is based upon remaining 9 month term of PPA; Line 22 based upon recent Aurora models that show Market Purchases as least cost resource. Line 24 "Distributed Generation" represents small hydro and community solar; Franklin has enough generation from contracted renewable resources to meet it's RPS requirements for the initial period and may seek purchasing renewable energy credits for any deficiencies in outlying years.
Notes: Explain resource choices other than conservation / Use of renewable energy credits in
planning / Distributed Generation Sources.
08.21.18 1 of 144
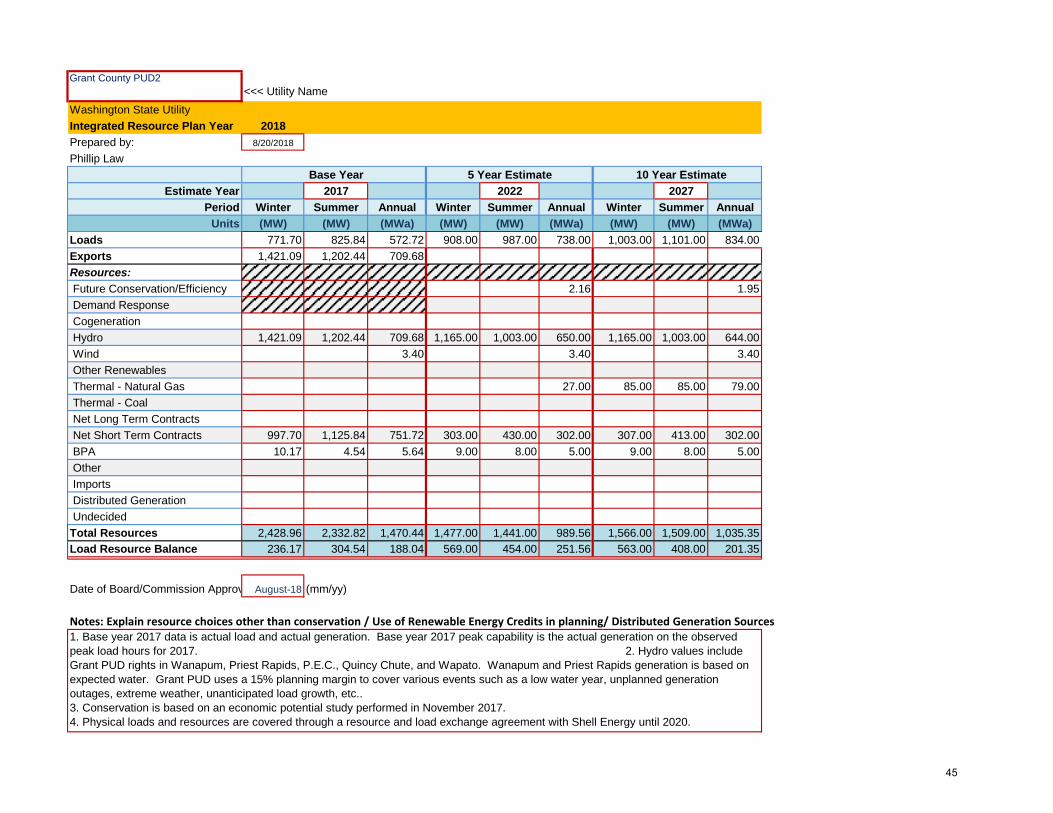
Grant County PUD2
<<< Utility Name
Washington State Utility
Integrated Resource Plan Year 2018
Prepared by: 8/20/2018
Phillip Law
Base Year 5 Year Estimate 10 Year Estimate
Estimate Year 2017 2022 2027
Period Winter Summer Annual Winter Summer Annual Winter Summer Annual
Units (MW) (MW) (MWa) (MW) (MW) (MWa) (MW) (MW) (MWa)
Loads 771.70 825.84 572.72 908.00 987.00 738.00 1,003.00 1,101.00 834.00
Exports 1,421.09 1,202.44 709.68
Resources:
Future Conservation/Efficiency 2.16 1.95
Demand Response
Cogeneration
Hydro 1,421.09 1,202.44 709.68 1,165.00 1,003.00 650.00 1,165.00 1,003.00 644.00
Wind 3.40 3.40 3.40
Other Renewables
Thermal - Natural Gas 27.00 85.00 85.00 79.00
Thermal - Coal
Net Long Term Contracts
Net Short Term Contracts 997.70 1,125.84 751.72 303.00 430.00 302.00 307.00 413.00 302.00
BPA 10.17 4.54 5.64 9.00 8.00 5.00 9.00 8.00 5.00
Other
Imports
Distributed Generation
Undecided
Total Resources 2,428.96 2,332.82 1,470.44 1,477.00 1,441.00 989.56 1,566.00 1,509.00 1,035.35
Load Resource Balance 236.17 304.54 188.04 569.00 454.00 251.56 563.00 408.00 201.35
Date of Board/Commission Approval August-18 (mm/yy)
Notes: Explain resource choices other than conservation / Use of Renewable Energy Credits in planning/ Distributed Generation Sources 1. Base year 2017 data is actual load and actual generation. Base year 2017 peak capability is the actual generation on the observed
peak load hours for 2017. 2. Hydro values include
Grant PUD rights in Wanapum, Priest Rapids, P.E.C., Quincy Chute, and Wapato. Wanapum and Priest Rapids generation is based on
expected water. Grant PUD uses a 15% planning margin to cover various events such as a low water year, unplanned generation
outages, extreme weather, unanticipated load growth, etc..
3. Conservation is based on an economic potential study performed in November 2017.
4. Physical loads and resources are covered through a resource and load exchange agreement with Shell Energy until 2020.
45
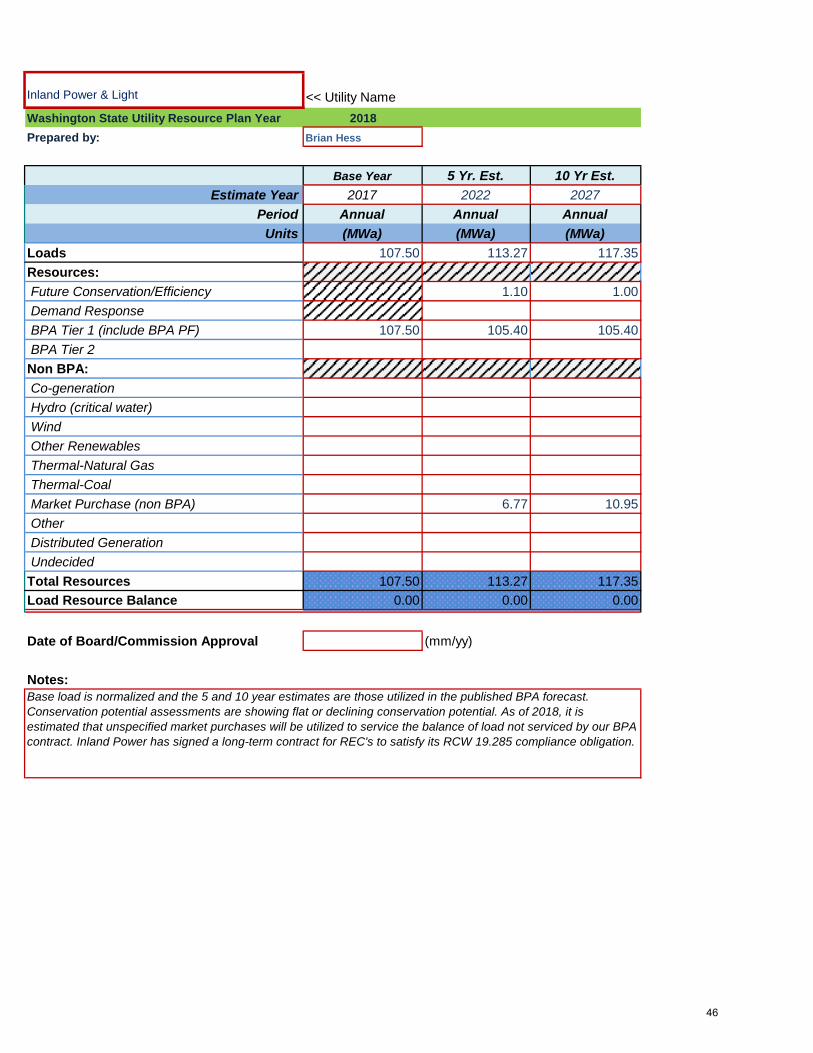
Inland Power & Light << Utility Name
Washington State Utility Resource Plan Year 2018
Prepared by: Brian Hess
Base Year 5 Yr. Est. 10 Yr Est.
Estimate Year 2017 2022 2027
Period Annual Annual Annual
Units (MWa) (MWa) (MWa)
Loads 107.50 113.27 117.35
Resources:
Future Conservation/Efficiency 1.10 1.00
Demand Response
BPA Tier 1 (include BPA PF) 107.50 105.40 105.40
BPA Tier 2
Non BPA:
Co-generation
Hydro (critical water)
Wind
Other Renewables
Thermal-Natural Gas
Thermal-Coal
Market Purchase (non BPA) 6.77 10.95
Other
Distributed Generation
Undecided
Total Resources 107.50 113.27 117.35
Load Resource Balance 0.00 0.00 0.00
Date of Board/Commission Approval (mm/yy)
Notes: Base load is normalized and the 5 and 10 year estimates are those utilized in the published BPA forecast.
Conservation potential assessments are showing flat or declining conservation potential. As of 2018, it is
estimated that unspecified market purchases will be utilized to service the balance of load not serviced by our BPA
contract. Inland Power has signed a long-term contract for REC's to satisfy its RCW 19.285 compliance obligation.
46
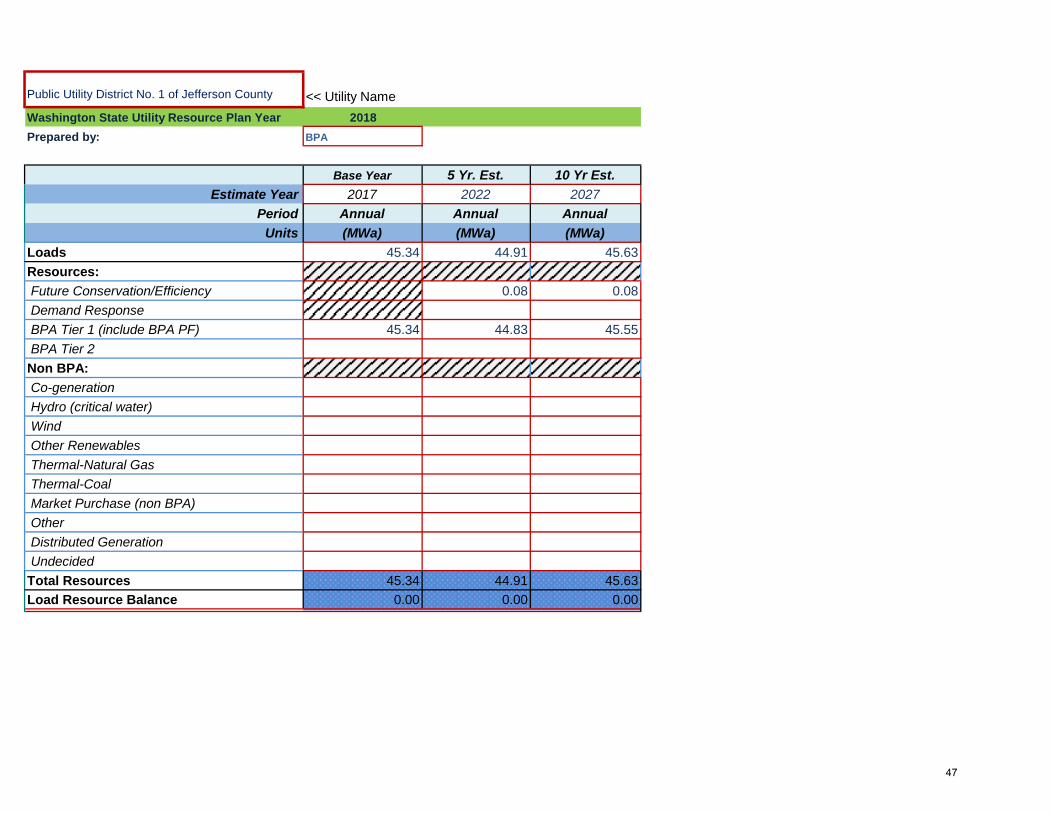
Public Utility District No. 1 of Jefferson County << Utility Name
Washington State Utility Resource Plan Year 2018
Prepared by: BPA
Base Year 5 Yr. Est. 10 Yr Est.
Estimate Year 2017 2022 2027
Period Annual Annual Annual
Units (MWa) (MWa) (MWa)
Loads 45.34 44.91 45.63
Resources:
Future Conservation/Efficiency 0.08 0.08
Demand Response
BPA Tier 1 (include BPA PF) 45.34 44.83 45.55
BPA Tier 2
Non BPA:
Co-generation
Hydro (critical water)
Wind
Other Renewables
Thermal-Natural Gas
Thermal-Coal
Market Purchase (non BPA)
Other
Distributed Generation
Undecided
Total Resources 45.34 44.91 45.63
Load Resource Balance 0.00 0.00 0.00
47
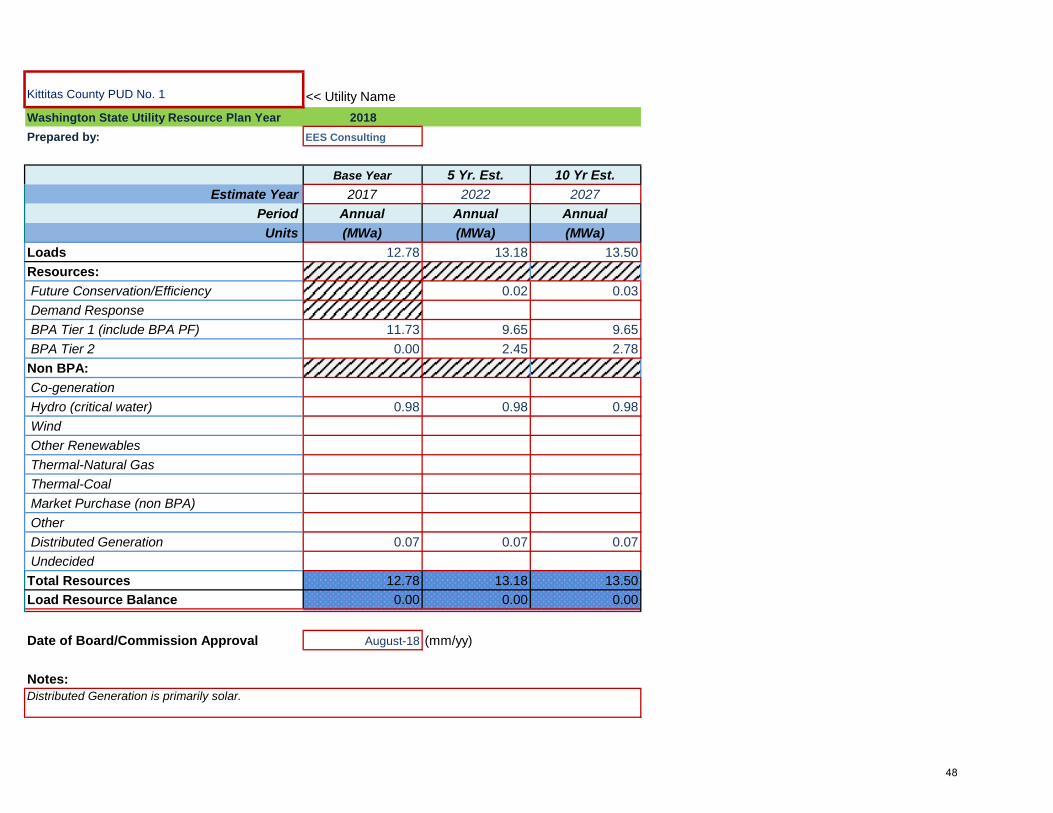
Kittitas County PUD No. 1 << Utility Name
Washington State Utility Resource Plan Year 2018
Prepared by: EES Consulting
Base Year 5 Yr. Est. 10 Yr Est.
Estimate Year 2017 2022 2027
Period Annual Annual Annual
Units (MWa) (MWa) (MWa)
Loads 12.78 13.18 13.50
Resources:
Future Conservation/Efficiency 0.02 0.03
Demand Response
BPA Tier 1 (include BPA PF) 11.73 9.65 9.65
BPA Tier 2 0.00 2.45 2.78
Non BPA:
Co-generation
Hydro (critical water) 0.98 0.98 0.98
Wind
Other Renewables
Thermal-Natural Gas
Thermal-Coal
Market Purchase (non BPA)
Other
Distributed Generation 0.07 0.07 0.07
Undecided
Total Resources 12.78 13.18 13.50
Load Resource Balance 0.00 0.00 0.00
Date of Board/Commission Approval August-18 (mm/yy)
Notes: Distributed Generation is primarily solar.
48
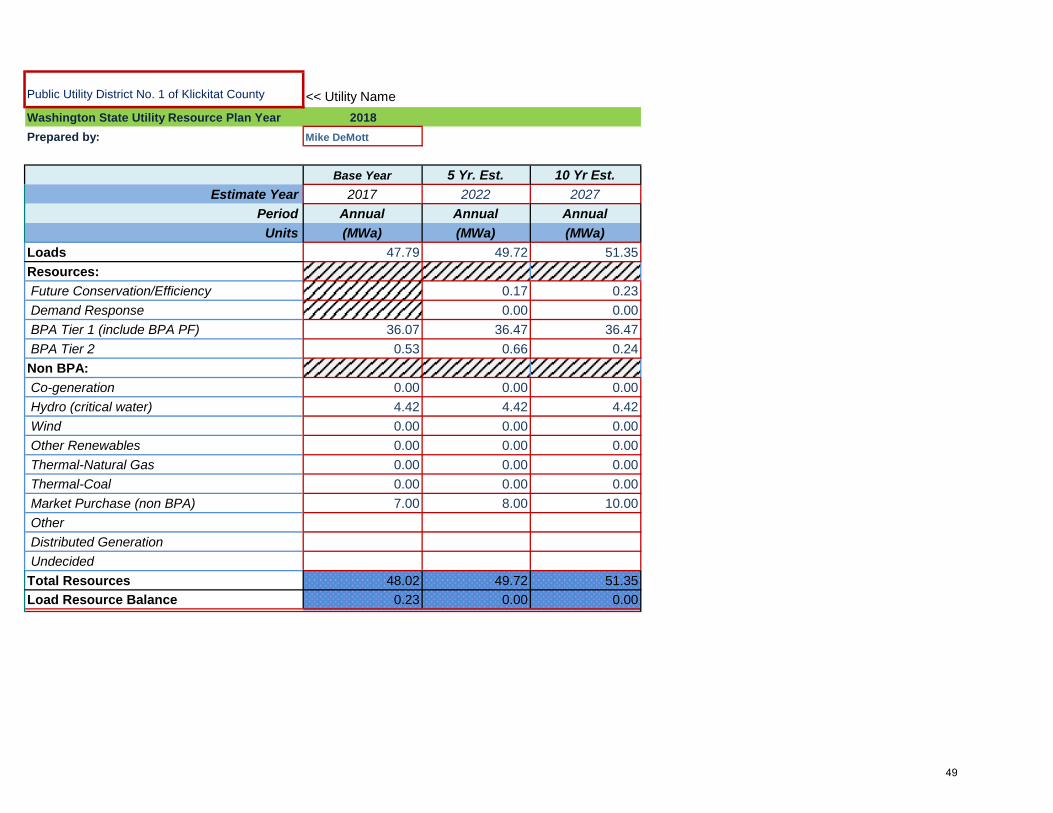
Public Utility District No. 1 of Klickitat County << Utility Name
Washington State Utility Resource Plan Year 2018
Prepared by: Mike DeMott
Base Year 5 Yr. Est. 10 Yr Est.
Estimate Year 2017 2022 2027
Period Annual Annual Annual
Units (MWa) (MWa) (MWa)
Loads 47.79 49.72 51.35
Resources:
Future Conservation/Efficiency 0.17 0.23
Demand Response 0.00 0.00
BPA Tier 1 (include BPA PF) 36.07 36.47 36.47
BPA Tier 2 0.53 0.66 0.24
Non BPA:
Co-generation 0.00 0.00 0.00
Hydro (critical water) 4.42 4.42 4.42
Wind 0.00 0.00 0.00
Other Renewables 0.00 0.00 0.00
Thermal-Natural Gas 0.00 0.00 0.00
Thermal-Coal 0.00 0.00 0.00
Market Purchase (non BPA) 7.00 8.00 10.00
Other
Distributed Generation
Undecided
Total Resources 48.02 49.72 51.35
Load Resource Balance 0.23 0.00 0.00
49

Lakeview Light & Power Co. << Utility Name
Washington State Utility Resource Plan Year 2018
Prepared by: BPA
Base Year 5 Yr. Est. 10 Yr Est.
Estimate Year 2017 2022 2027
Period Annual Annual Annual
Units (MWa) (MWa) (MWa)
Loads 30.97 31.86 32.66
Resources:
Future Conservation/Efficiency 0.14 0.14
Demand Response
BPA Tier 1 (include BPA PF) 30.97 31.72 32.52
BPA Tier 2
Non BPA:
Co-generation
Hydro (critical water)
Wind
Other Renewables
Thermal-Natural Gas
Thermal-Coal
Market Purchase (non BPA)
Other
Distributed Generation
Undecided
Total Resources 30.97 31.86 32.66
Load Resource Balance 0.00 0.00 0.00
50
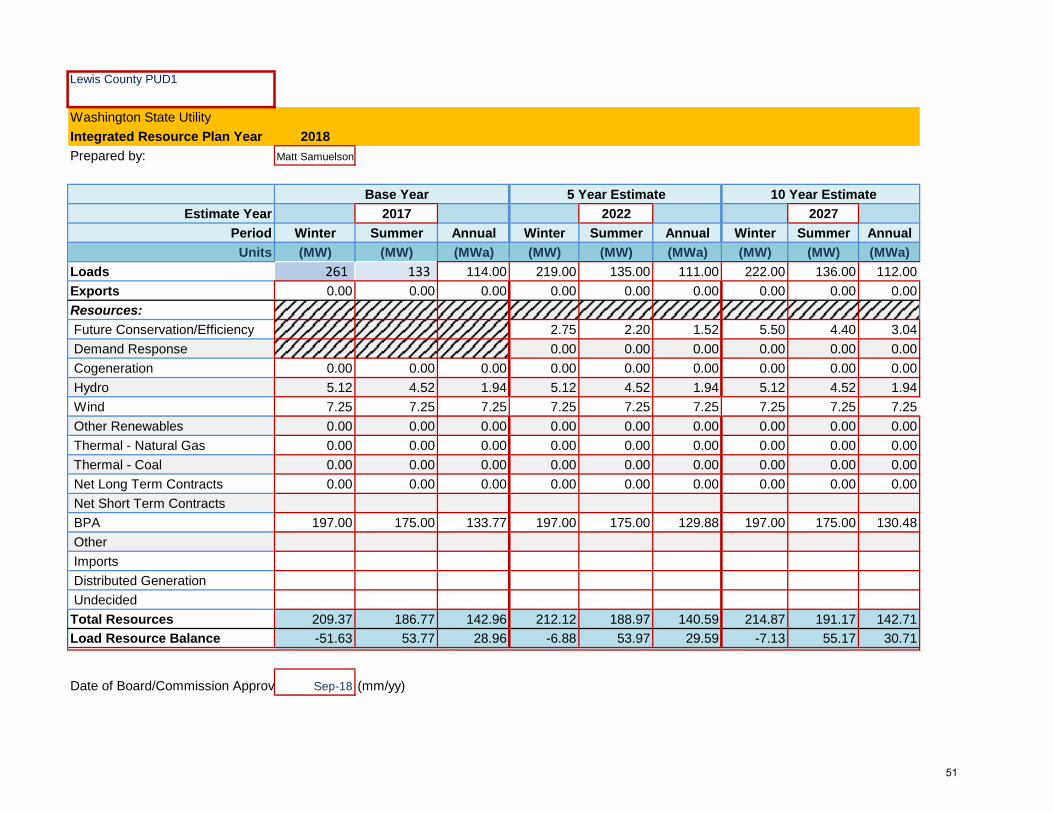
Lewis County PUD1
Washington State Utility
Integrated Resource Plan Year 2018
Prepared by: Matt Samuelson
Base Year 5 Year Estimate 10 Year Estimate
Estimate Year 2017 2022 2027
Period Winter Summer Annual Winter Summer Annual Winter Summer Annual
Units (MW) (MW) (MWa) (MW) (MW) (MWa) (MW) (MW) (MWa)
Loads 261 133 114.00 219.00 135.00 111.00 222.00 136.00 112.00
Exports 0.00 0.00 0.00 0.00 0.00 0.00 0.00 0.00 0.00
Resources:
Future Conservation/Efficiency 2.75 2.20 1.52 5.50 4.40 3.04
Demand Response 0.00 0.00 0.00 0.00 0.00 0.00
Cogeneration 0.00 0.00 0.00 0.00 0.00 0.00 0.00 0.00 0.00
Hydro 5.12 4.52 1.94 5.12 4.52 1.94 5.12 4.52 1.94
Wind 7.25 7.25 7.25 7.25 7.25 7.25 7.25 7.25 7.25
Other Renewables 0.00 0.00 0.00 0.00 0.00 0.00 0.00 0.00 0.00
Thermal - Natural Gas 0.00 0.00 0.00 0.00 0.00 0.00 0.00 0.00 0.00
Thermal - Coal 0.00 0.00 0.00 0.00 0.00 0.00 0.00 0.00 0.00
Net Long Term Contracts 0.00 0.00 0.00 0.00 0.00 0.00 0.00 0.00 0.00
Net Short Term Contracts
BPA 197.00 175.00 133.77 197.00 175.00 129.88 197.00 175.00 130.48
Other
Imports
Distributed Generation
Undecided
Total Resources 209.37 186.77 142.96 212.12 188.97 140.59 214.87 191.17 142.71
Load Resource Balance -51.63 53.77 28.96 -6.88 53.97 29.59 -7.13 55.17 30.71
Date of Board/Commission Approval Sep-18 (mm/yy)
51
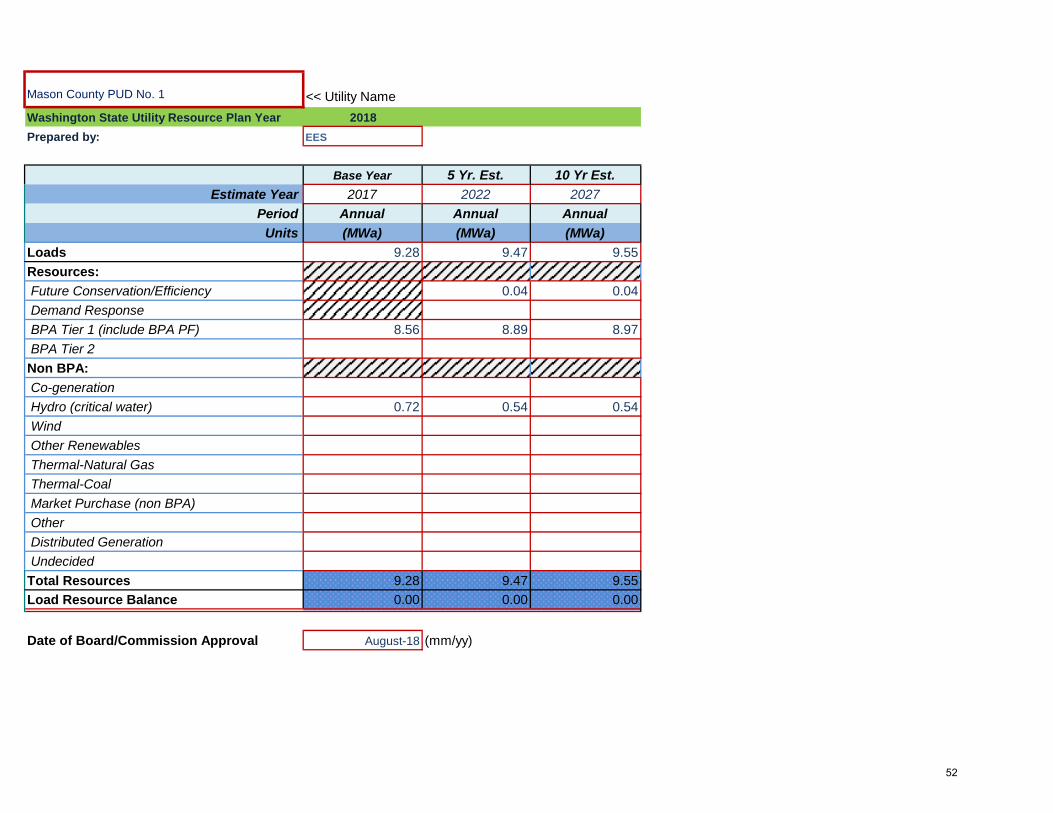
Mason County PUD No. 1 << Utility Name
Washington State Utility Resource Plan Year 2018
Prepared by: EES
Base Year 5 Yr. Est. 10 Yr Est.
Estimate Year 2017 2022 2027
Period Annual Annual Annual
Units (MWa) (MWa) (MWa)
Loads 9.28 9.47 9.55
Resources:
Future Conservation/Efficiency 0.04 0.04
Demand Response
BPA Tier 1 (include BPA PF) 8.56 8.89 8.97
BPA Tier 2
Non BPA:
Co-generation
Hydro (critical water) 0.72 0.54 0.54
Wind
Other Renewables
Thermal-Natural Gas
Thermal-Coal
Market Purchase (non BPA)
Other
Distributed Generation
Undecided
Total Resources 9.28 9.47 9.55
Load Resource Balance 0.00 0.00 0.00
Date of Board/Commission Approval August-18 (mm/yy)
52
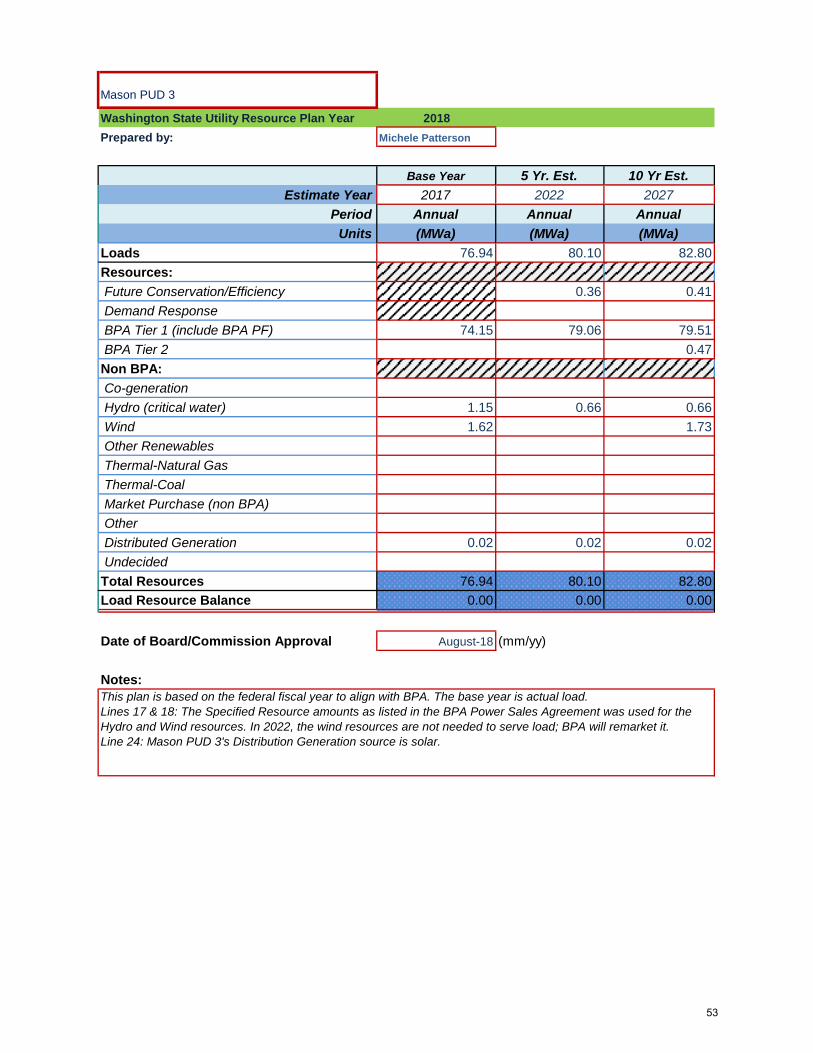
Mason PUD 3
Washington State Utility Resource Plan Year 2018
Prepared by: Michele Patterson
Base Year 5 Yr. Est. 10 Yr Est.
Estimate Year 2017 2022 2027
Period Annual Annual Annual
Units (MWa) (MWa) (MWa)
Loads 76.94 80.10 82.80
Resources:
Future Conservation/Efficiency 0.36 0.41
Demand Response
BPA Tier 1 (include BPA PF) 74.15 79.06 79.51
BPA Tier 2 0.47
Non BPA:
Co-generation
Hydro (critical water) 1.15 0.66 0.66
Wind 1.62 1.73
Other Renewables
Thermal-Natural Gas
Thermal-Coal
Market Purchase (non BPA)
Other
Distributed Generation 0.02 0.02 0.02
Undecided
Total Resources 76.94 80.10 82.80
Load Resource Balance 0.00 0.00 0.00
Date of Board/Commission Approval August-18 (mm/yy)
Notes:This plan is based on the federal fiscal year to align with BPA. The base year is actual load.
Lines 17 & 18: The Specified Resource amounts as listed in the BPA Power Sales Agreement was used for the
Hydro and Wind resources. In 2022, the wind resources are not needed to serve load; BPA will remarket it.
Line 24: Mason PUD 3's Distribution Generation source is solar.
53
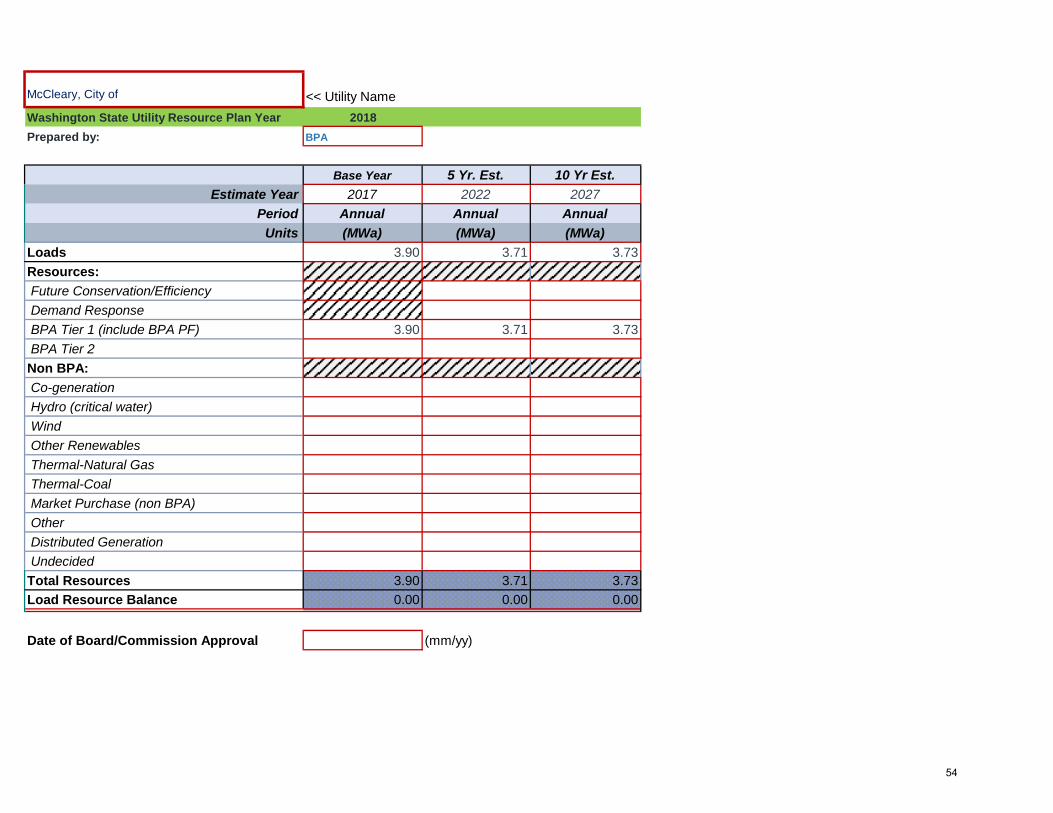
McCleary, City of << Utility Name
Washington State Utility Resource Plan Year 2018
Prepared by: BPA
Base Year 5 Yr. Est. 10 Yr Est.
Estimate Year 2017 2022 2027
Period Annual Annual Annual
Units (MWa) (MWa) (MWa)
Loads 3.90 3.71 3.73
Resources:
Future Conservation/Efficiency
Demand Response
BPA Tier 1 (include BPA PF) 3.90 3.71 3.73
BPA Tier 2
Non BPA:
Co-generation
Hydro (critical water)
Wind
Other Renewables
Thermal-Natural Gas
Thermal-Coal
Market Purchase (non BPA)
Other
Distributed Generation
Undecided
Total Resources 3.90 3.71 3.73
Load Resource Balance 0.00 0.00 0.00
Date of Board/Commission Approval (mm/yy)
54
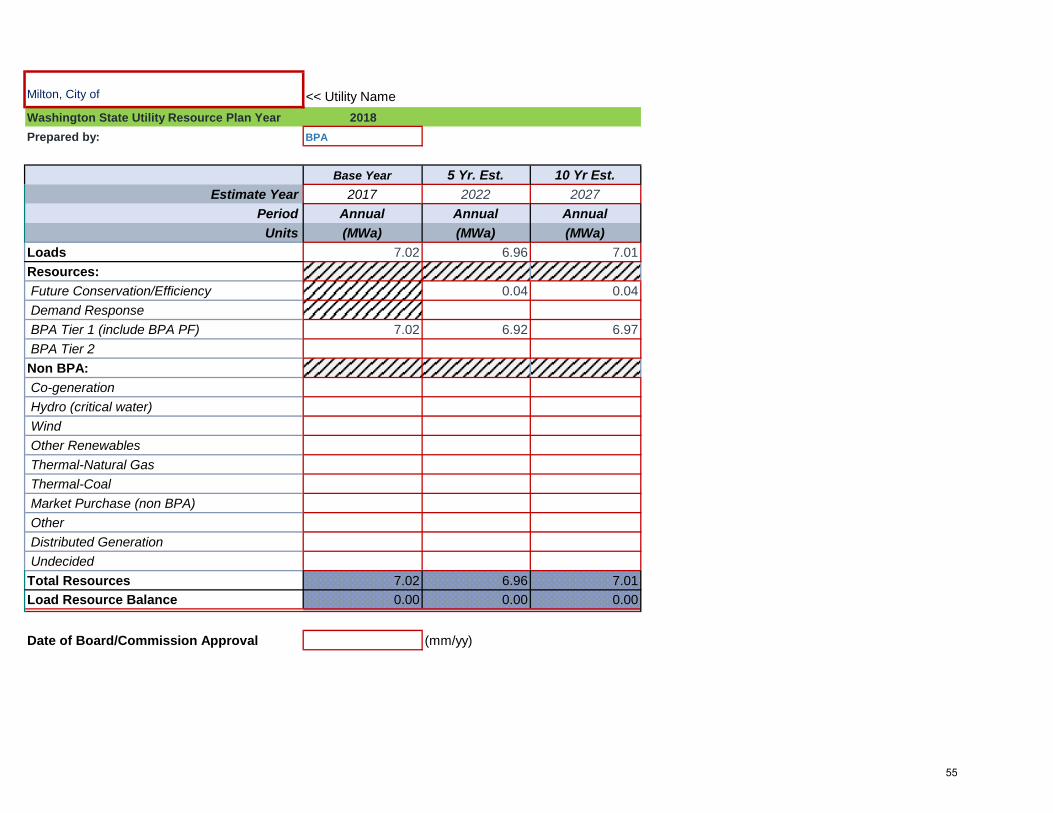
Milton, City of << Utility Name
Washington State Utility Resource Plan Year 2018
Prepared by: BPA
Base Year 5 Yr. Est. 10 Yr Est.
Estimate Year 2017 2022 2027
Period Annual Annual Annual
Units (MWa) (MWa) (MWa)
Loads 7.02 6.96 7.01
Resources:
Future Conservation/Efficiency 0.04 0.04
Demand Response
BPA Tier 1 (include BPA PF) 7.02 6.92 6.97
BPA Tier 2
Non BPA:
Co-generation
Hydro (critical water)
Wind
Other Renewables
Thermal-Natural Gas
Thermal-Coal
Market Purchase (non BPA)
Other
Distributed Generation
Undecided
Total Resources 7.02 6.96 7.01
Load Resource Balance 0.00 0.00 0.00
Date of Board/Commission Approval (mm/yy)
55
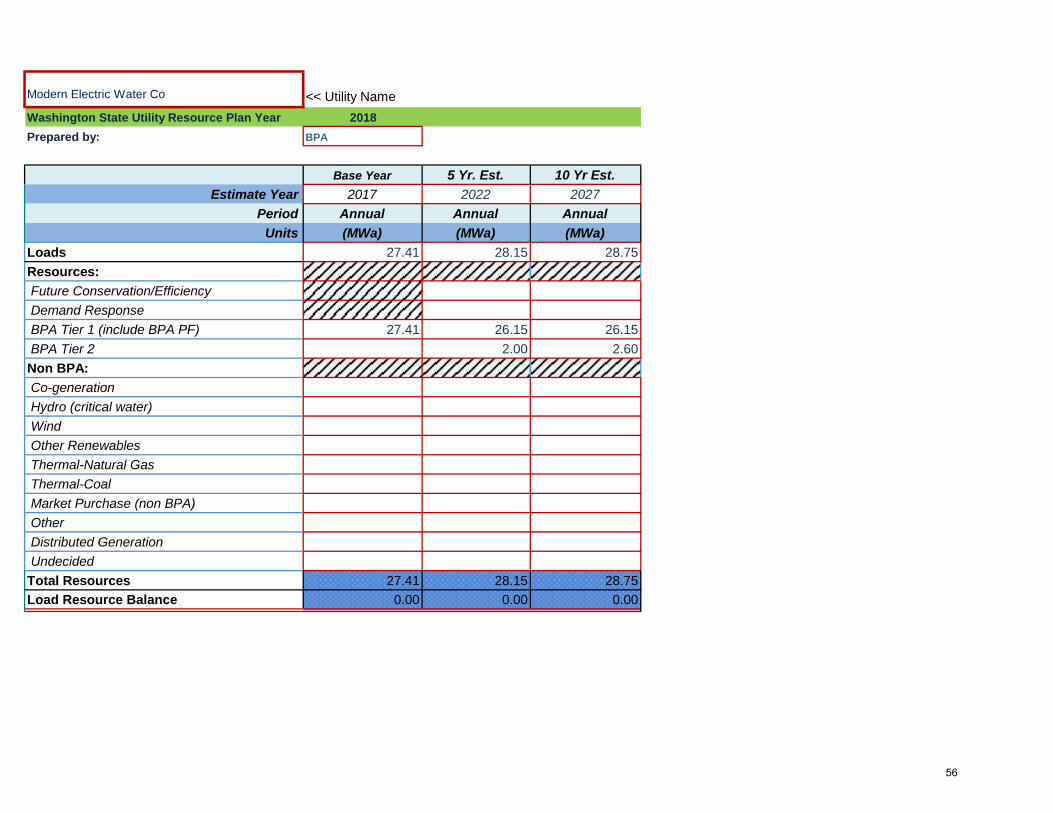
Modern Electric Water Co << Utility Name
Washington State Utility Resource Plan Year 2018
Prepared by: BPA
Base Year 5 Yr. Est. 10 Yr Est.
Estimate Year 2017 2022 2027
Period Annual Annual Annual
Units (MWa) (MWa) (MWa)
Loads 27.41 28.15 28.75
Resources:
Future Conservation/Efficiency
Demand Response
BPA Tier 1 (include BPA PF) 27.41 26.15 26.15
BPA Tier 2 2.00 2.60
Non BPA:
Co-generation
Hydro (critical water)
Wind
Other Renewables
Thermal-Natural Gas
Thermal-Coal
Market Purchase (non BPA)
Other
Distributed Generation
Undecided
Total Resources 27.41 28.15 28.75
Load Resource Balance 0.00 0.00 0.00
56
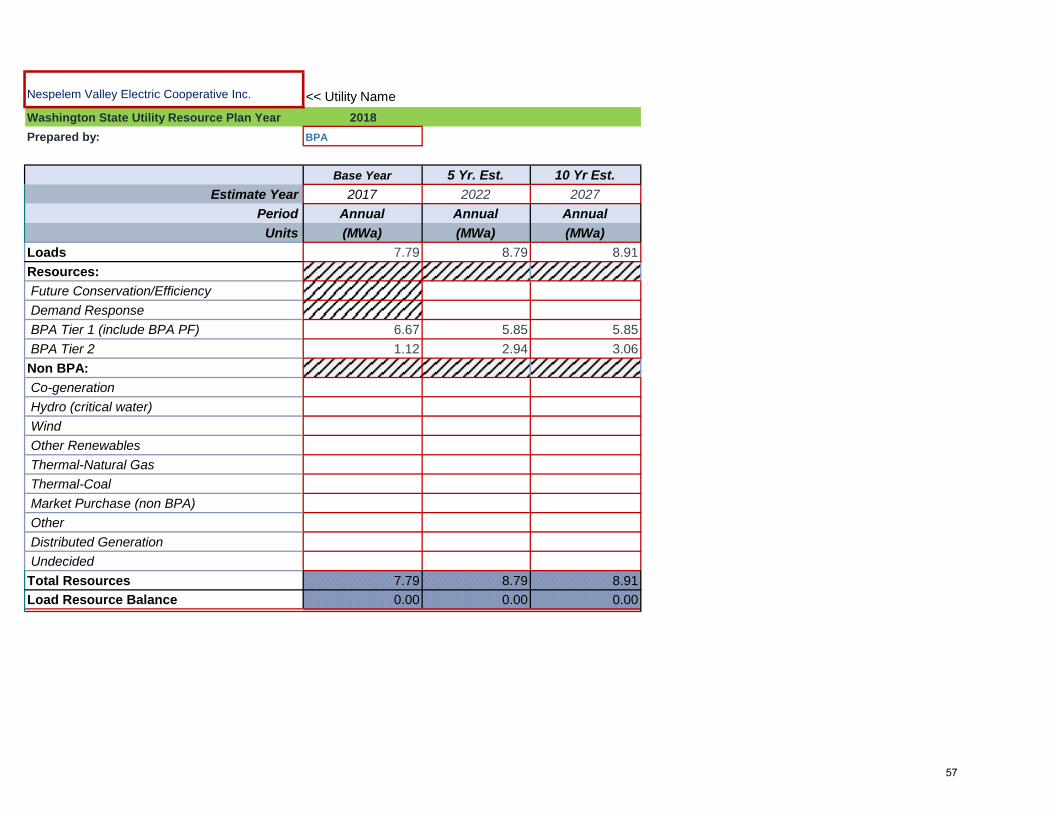
Nespelem Valley Electric Cooperative Inc. << Utility Name
Washington State Utility Resource Plan Year 2018
Prepared by: BPA
Base Year 5 Yr. Est. 10 Yr Est.
Estimate Year 2017 2022 2027
Period Annual Annual Annual
Units (MWa) (MWa) (MWa)
Loads 7.79 8.79 8.91
Resources:
Future Conservation/Efficiency
Demand Response
BPA Tier 1 (include BPA PF) 6.67 5.85 5.85
BPA Tier 2 1.12 2.94 3.06
Non BPA:
Co-generation
Hydro (critical water)
Wind
Other Renewables
Thermal-Natural Gas
Thermal-Coal
Market Purchase (non BPA)
Other
Distributed Generation
Undecided
Total Resources 7.79 8.79 8.91
Load Resource Balance 0.00 0.00 0.00
57

Ohop Mutual Light Co. << Utility Name
Washington State Utility Resource Plan Year 2018
Prepared by: BPA
Base Year 5 Yr. Est. 10 Yr Est.
Estimate Year 2017 2022 2027
Period Annual Annual Annual
Units (MWa) (MWa) (MWa)
Loads 10.45 9.90 9.99
Resources:
Future Conservation/Efficiency 0.04 0.04
Demand Response
BPA Tier 1 (include BPA PF) 10.45 9.86 9.95
BPA Tier 2
Non BPA:
Co-generation
Hydro (critical water)
Wind
Other Renewables
Thermal-Natural Gas
Thermal-Coal
Market Purchase (non BPA)
Other
Distributed Generation
Undecided
Total Resources 10.45 9.90 9.99
Load Resource Balance 0.00 0.00 0.00
58
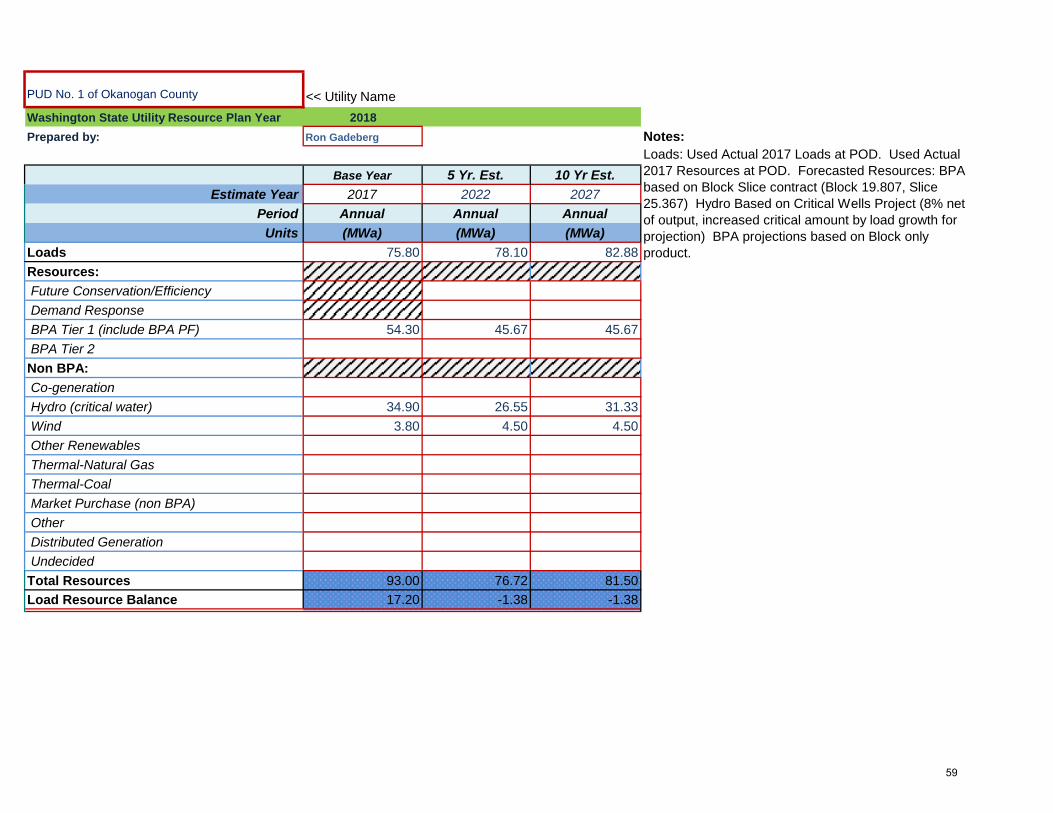
PUD No. 1 of Okanogan County << Utility Name
Washington State Utility Resource Plan Year 2018
Prepared by: Ron Gadeberg Notes:
Base Year 5 Yr. Est. 10 Yr Est.
Estimate Year 2017 2022 2027
Period Annual Annual Annual
Units (MWa) (MWa) (MWa)
Loads 75.80 78.10 82.88
Resources:
Future Conservation/Efficiency
Demand Response
BPA Tier 1 (include BPA PF) 54.30 45.67 45.67
BPA Tier 2
Non BPA:
Co-generation
Hydro (critical water) 34.90 26.55 31.33
Wind 3.80 4.50 4.50
Other Renewables
Thermal-Natural Gas
Thermal-Coal
Market Purchase (non BPA)
Other
Distributed Generation
Undecided
Total Resources 93.00 76.72 81.50
Load Resource Balance 17.20 -1.38 -1.38
Loads: Used Actual 2017 Loads at POD. Used Actual 2017 Resources at POD. Forecasted Resources: BPA based on Block Slice contract (Block 19.807, Slice 25.367) Hydro Based on Critical Wells Project (8% net of output, increased critical amount by load growth for projection) BPA projections based on Block only product.
59

Orcas Power and Light Cooperative << Utility Name
Washington State Utility Resource Plan Year 2018
Prepared by: Russell Guerry, P.E.
Base Year 5 Yr. Est. 10 Yr Est.
Estimate Year 2017 2022 2027
Period Annual Annual Annual
Units (MWa) (MWa) (MWa)
Loads 24.84 25.57 26.30
Resources:
Future Conservation/Efficiency 0.15 0.15
Demand Response
BPA Tier 1 (include BPA PF) 24.61 25.08 25.76
BPA Tier 2
Non BPA:
Co-generation
Hydro (critical water) 0.10 0.10 0.10
Wind
Other Renewables 0.13 0.24 0.29
Thermal-Natural Gas
Thermal-Coal
Market Purchase (non BPA)
Other
Distributed Generation
Undecided
Total Resources 24.84 25.57 26.30
Load Resource Balance 0.00 0.00 0.00
Date of Board/Commission Approval August-17 (mm/yy)
Notes:Other Renewables will be used for solar resources.
60

PacifiCorp <<< Utility Name
Washington State Utility Integrated Resource Plan Year 2018
Base Year 5 Year Estimate 10 Year Estimate
Estimate Year 2018 2023 2028
Period Winter Summer Annual Winter Summer Annual Winter Summer Annual
Units (MW) (MW) (MWa) (MW) (MW) (MWa) (MW) (MW) (MWa)
Loads 738.40 714.57 521.99 766.70 779.72 532.06 792.24 812.84 547.62
Exports 28.09 61.87 24.79 23.73 21.61 15.75 12.34 11.17 12.18
Resources:
Future Conservation/Efficiency 32.41 41.28 31.08 55.00 65.72 48.61
Demand Response 24.48 0.08 24.79 0.08
Cogeneration
Hydro 87.37 78.95 42.90 71.66 56.88 31.50 72.20 57.75 30.60
Wind 28.15 25.26 55.44 46.57 42.51 67.01 45.47 41.86 64.71
Other Renewables 63.27 53.61 30.03 61.92 56.94 71.21 57.95 53.32 68.23
Thermal - Natural Gas 244.83 206.81 163.92 241.50 207.46 159.27 243.78 210.01 125.66
Thermal - Coal 501.83 450.42 219.99 436.23 401.97 205.62 369.74 338.45 237.90
Net Long Term Contracts 41.95 2.08 6.73 0.00 0.00 0.00 0.00 0.00 0.00
Net Short Term Contracts 27.42 25.49 2.32 27.29 33.62 2.66 31.73 101.37 5.87
BPA
Other 13.21 11.85 -5.77 13.05 11.91 -5.68 13.17 12.06 -5.70
Imports 19.83 16.80 3.63 19.58 16.88 6.00 10.29 9.42 0.10
Distributed Generation 0.00 1.19 0.50 0.04 2.21 0.95 0.07 4.84 2.07
Undecided
Total Resources 1,027.85 872.47 519.69 950.24 896.14 569.70 899.41 919.57 578.14
Load Resource Balance 261.37 96.03 -27.09 159.81 94.81 21.89 94.83 95.57 18.33
Notes/Explanation for category choices:
- Information is based on the 2017 Integrated Resource Plan Update filed with the Washington Utilities and Transportation Commission on May 1, 2018. - 2017 IRP Acknowledgement Letter was issued on June 11, 2018.- The Load Resource Balance in Capacity primarily reflects the 13% Planning Reserve Margin not included in Resources or Loads.
61

Public Utility District No.2 of Pacific County << Utility Name
Washington State Utility Resource Plan Year 2018
Prepared by: Jason Dunsmoor
Base Year 5 Yr. Est. 10 Yr Est.
Estimate Year 2017 2022 2027
Period Annual Annual Annual
Units (MWa) (MWa) (MWa)
Loads 35.44 37.62 38.05
Resources:
Future Conservation/Efficiency 0.75 1.18
Demand Response
BPA Tier 1 (include BPA PF) 35.97 36.87 36.87
BPA Tier 2
Non BPA:
Co-generation
Hydro (critical water)
Wind
Other Renewables
Thermal-Natural Gas
Thermal-Coal
Market Purchase (non BPA) 2.90
Other
Distributed Generation
Undecided
Total Resources 38.87 37.62 38.05
Load Resource Balance 3.43 0.00 0.00
Date of Board/Commission Approval September-18 (mm/yy)
62
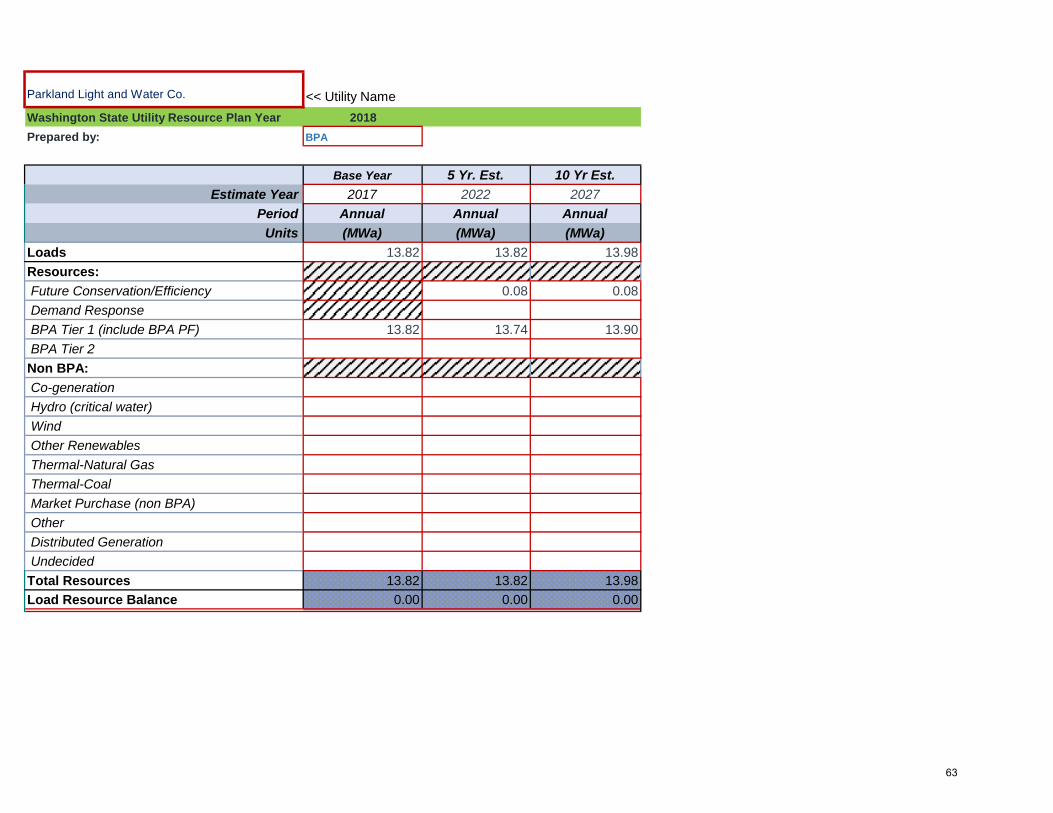
Parkland Light and Water Co. << Utility Name
Washington State Utility Resource Plan Year 2018
Prepared by: BPA
Base Year 5 Yr. Est. 10 Yr Est.
Estimate Year 2017 2022 2027
Period Annual Annual Annual
Units (MWa) (MWa) (MWa)
Loads 13.82 13.82 13.98
Resources:
Future Conservation/Efficiency 0.08 0.08
Demand Response
BPA Tier 1 (include BPA PF) 13.82 13.74 13.90
BPA Tier 2
Non BPA:
Co-generation
Hydro (critical water)
Wind
Other Renewables
Thermal-Natural Gas
Thermal-Coal
Market Purchase (non BPA)
Other
Distributed Generation
Undecided
Total Resources 13.82 13.82 13.98
Load Resource Balance 0.00 0.00 0.00
63
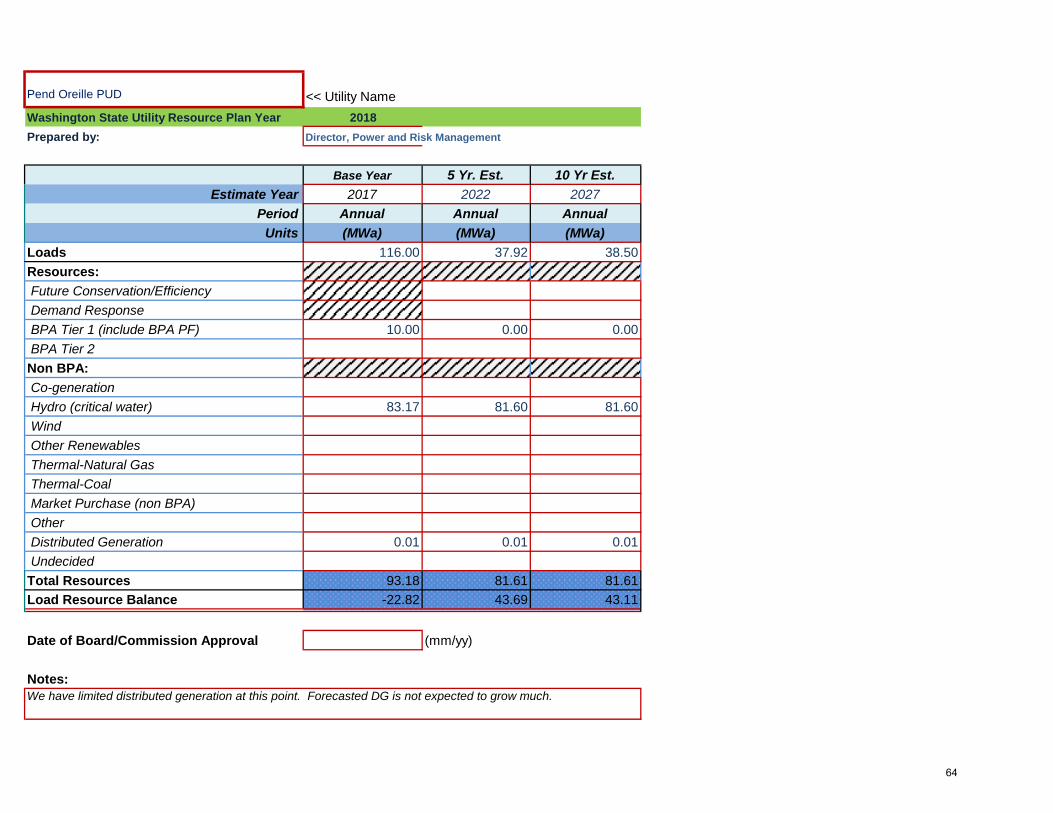
Pend Oreille PUD << Utility Name
Washington State Utility Resource Plan Year 2018
Prepared by: Director, Power and Risk Management
Base Year 5 Yr. Est. 10 Yr Est.
Estimate Year 2017 2022 2027
Period Annual Annual Annual
Units (MWa) (MWa) (MWa)
Loads 116.00 37.92 38.50
Resources:
Future Conservation/Efficiency
Demand Response
BPA Tier 1 (include BPA PF) 10.00 0.00 0.00
BPA Tier 2
Non BPA:
Co-generation
Hydro (critical water) 83.17 81.60 81.60
Wind
Other Renewables
Thermal-Natural Gas
Thermal-Coal
Market Purchase (non BPA)
Other
Distributed Generation 0.01 0.01 0.01
Undecided
Total Resources 93.18 81.61 81.61
Load Resource Balance -22.82 43.69 43.11
Date of Board/Commission Approval (mm/yy)
Notes: We have limited distributed generation at this point. Forecasted DG is not expected to grow much.
64

Peninsula Light << Utility Name
Washington State Utility Resource Plan Year 2018
Prepared by: Sharon Silver
Base Year 5 Yr. Est. 10 Yr Est.
Estimate Year 2016 2021 2026
Period Annual Annual Annual
Units (MWa) (MWa) (MWa)
Loads 67.38 68.00 68.85
Resources:
Future Conservation/Efficiency 0.50 1.00
Demand Response
BPA Tier 1 (include BPA PF) 67.38 67.50 67.85
BPA Tier 2
Non BPA:
Co-generation
Hydro (critical water)
Wind
Other Renewables
Thermal-Natural Gas
Thermal-Coal
Market Purchase (non BPA)
Other
Distributed Generation
Undecided
Total Resources 67.38 68.00 68.85
Load Resource Balance 0.00 0.00 0.00
Date of Board/Commission Approval August-18 (mm/yy)
65

Port Angeles, City of << Utility Name
Washington State Utility Resource Plan Year 2018
Prepared by: BPA
Base Year 5 Yr. Est. 10 Yr Est.
Estimate Year 2017 2022 2027
Period Annual Annual Annual
Units (MWa) (MWa) (MWa)
Loads 32.63 49.18 55.66
Resources:
Future Conservation/Efficiency 0.27 0.27
Demand Response
BPA Tier 1 (include BPA PF) 32.63 48.91 55.39
BPA Tier 2
Non BPA:
Co-generation
Hydro (critical water)
Wind
Other Renewables
Thermal-Natural Gas
Thermal-Coal
Market Purchase (non BPA)
Other
Distributed Generation
Undecided
Total Resources 32.63 49.18 55.66
Load Resource Balance 0.00 0.00 0.00
Date of Board/Commission Approval August-18 (mm/yy)
Notes:Resources: BPA Tier 1 (includes BPA-PF) - The City of Port Angeles is a full resource customer of the Bonneville
Power Administration (BPA). BPA will provide all power to the City through 2028.
66

Seattle, Port of << Utility Name
Washington State Utility Resource Plan Year 2018
Prepared by: BPA
Base Year 5 Yr. Est. 10 Yr Est.
Estimate Year 2017 2022 2025
Period Annual Annual Annual
Units (MWa) (MWa) (MWa)
Loads 16.37 21.90 24.92
Resources:
Future Conservation/Efficiency
Demand Response
BPA Tier 1 (include BPA PF) 16.37 17.11 17.11
BPA Tier 2 4.79 7.81
Non BPA:
Co-generation
Hydro (critical water)
Wind
Other Renewables
Thermal-Natural Gas
Thermal-Coal
Market Purchase (non BPA)
Other
Distributed Generation
Undecided
Total Resources 16.37 21.90 24.92
Load Resource Balance 0.00 0.00 0.00
67

Puget Sound Energy <<< Utility Name
Washington State Utility Integrated Resource Plan Year 2018
Prepared by: Chris Schaefer
Base Year 5 Year Estimate 10 Year Estimate
Estimate Year 1/1/2018 2023 2028
Period Winter Summer Annual Winter Summer Annual Winter Summer Annual
Units (MW) (MW) (MWa) (MW) (MW) (MWa) (MW) (MW) (MWa)
Loads 5,021.00 3,224.00 2,681.00 5,359.00 3,498.00 2,864.00 5,662.00 3,801.00 3,036.00
Exports 14.00 320.00 66.00 11.00 311.00 63.00 0.00 300.00 48.00
Resources:
Future Conservation/Efficiency 374.00 257.00 239.00 549.00 376.00 355.00
Demand Response 79.00 107.00
Cogeneration
Hydro 853.00 762.00 505.00 814.00 768.00 473.00 685.00 743.00 433.00
Wind 143.00 90.00 242.00 143.00 143.00 275.00 137.00 137.00 261.00
Other Renewables
Thermal - Natural Gas 2,061.00 1,841.00 1,146.00 2,061.00 1,841.00 1,146.00 2,061.00 1,841.00 1,146.00
Thermal - Coal 658.00 658.00 608.00 360.00 360.00 334.00 360.00 360.00 334.00
Net Long Term Contracts 401.00 386.00 410.00 387.00 376.00 394.00 15.00 4.00 5.00
Net Short Term Contracts 1,722.00 1,695.00 1,752.00 1,670.00 1,863.00 1,677.00
BPA
Imports 308.00 8.00 50.00 308.00 8.00 50.00 308.00 8.00 50.00
Distributed Generation
Total Resources 6,146.00 5,440.00 2,961.00 6,278.00 5,423.00 2,911.00 6,085.00 5,146.00 2,584.00
Load Resource Balance 1,111.00 1,896.00 214.00 908.00 1,614.00 -16.00 423.00 1,045.00 -500.00
Notes: PSE's Integrated Resource Plan includes the least cost combination of conservation and supply-side resources to meet requirements, per WAC 480-100-238. This information is also available in PSE's 2017 Integrated Resource Plan, page B-17, filed with the Washington Utilities and Transportation Commission, Dockets UE-160918 and UG-160919.
68
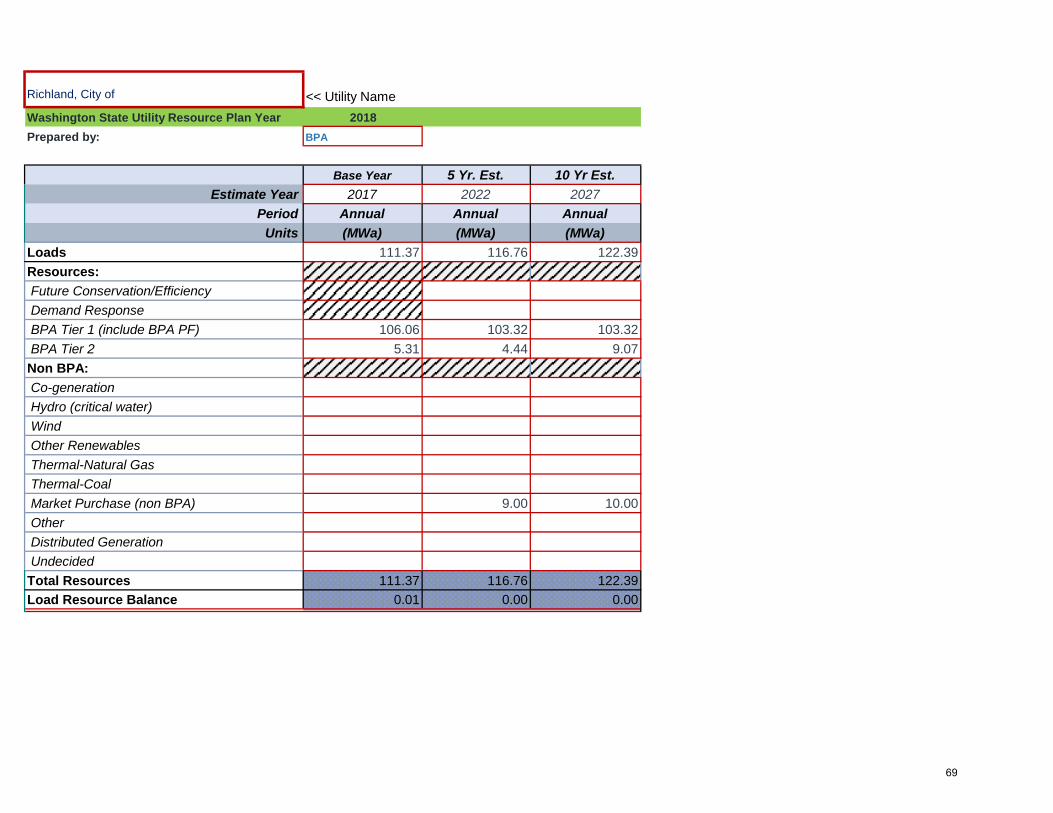
Richland, City of << Utility Name
Washington State Utility Resource Plan Year 2018
Prepared by: BPA
Base Year 5 Yr. Est. 10 Yr Est.
Estimate Year 2017 2022 2027
Period Annual Annual Annual
Units (MWa) (MWa) (MWa)
Loads 111.37 116.76 122.39
Resources:
Future Conservation/Efficiency
Demand Response
BPA Tier 1 (include BPA PF) 106.06 103.32 103.32
BPA Tier 2 5.31 4.44 9.07
Non BPA:
Co-generation
Hydro (critical water)
Wind
Other Renewables
Thermal-Natural Gas
Thermal-Coal
Market Purchase (non BPA) 9.00 10.00
Other
Distributed Generation
Undecided
Total Resources 111.37 116.76 122.39
Load Resource Balance 0.01 0.00 0.00
69
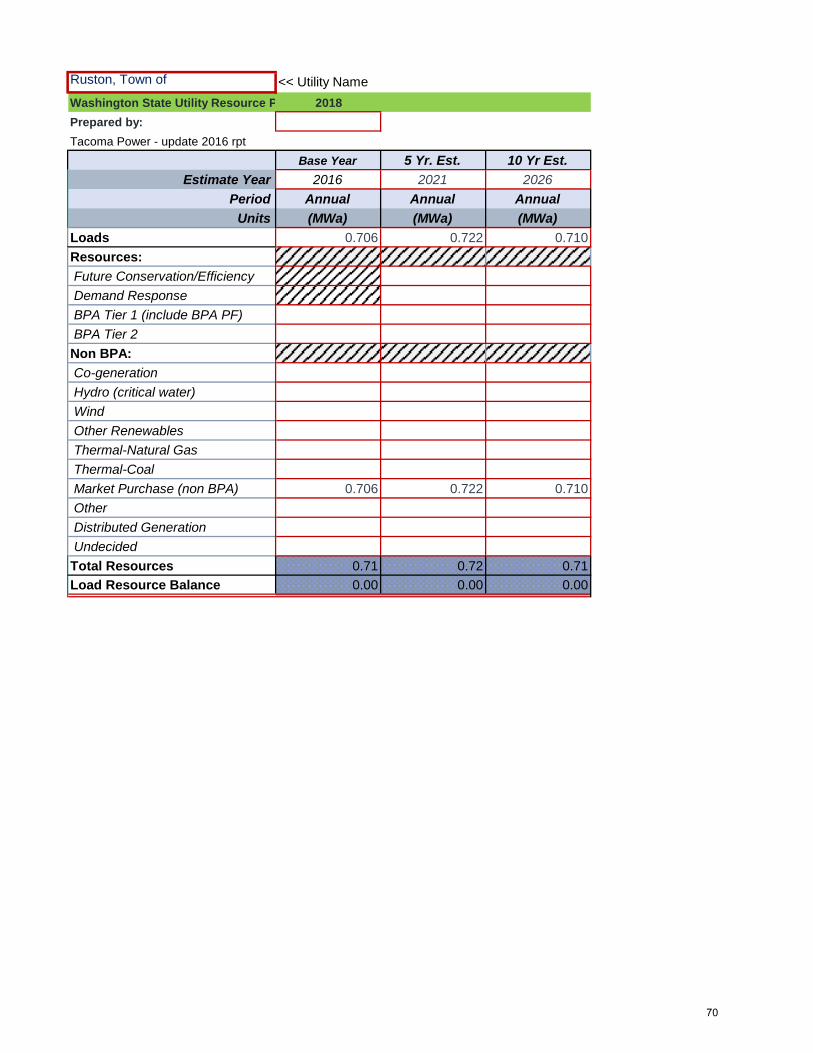
Ruston, Town of << Utility Name
Washington State Utility Resource Plan Year2018
Prepared by:
Tacoma Power - update 2016 rpt
Base Year 5 Yr. Est. 10 Yr Est.
Estimate Year 2016 2021 2026
Period Annual Annual Annual
Units (MWa) (MWa) (MWa)
Loads 0.706 0.722 0.710
Resources:
Future Conservation/Efficiency
Demand Response
BPA Tier 1 (include BPA PF)
BPA Tier 2
Non BPA:
Co-generation
Hydro (critical water)
Wind
Other Renewables
Thermal-Natural Gas
Thermal-Coal
Market Purchase (non BPA) 0.706 0.722 0.710
Other
Distributed Generation
Undecided
Total Resources 0.71 0.72 0.71
Load Resource Balance 0.00 0.00 0.00
70
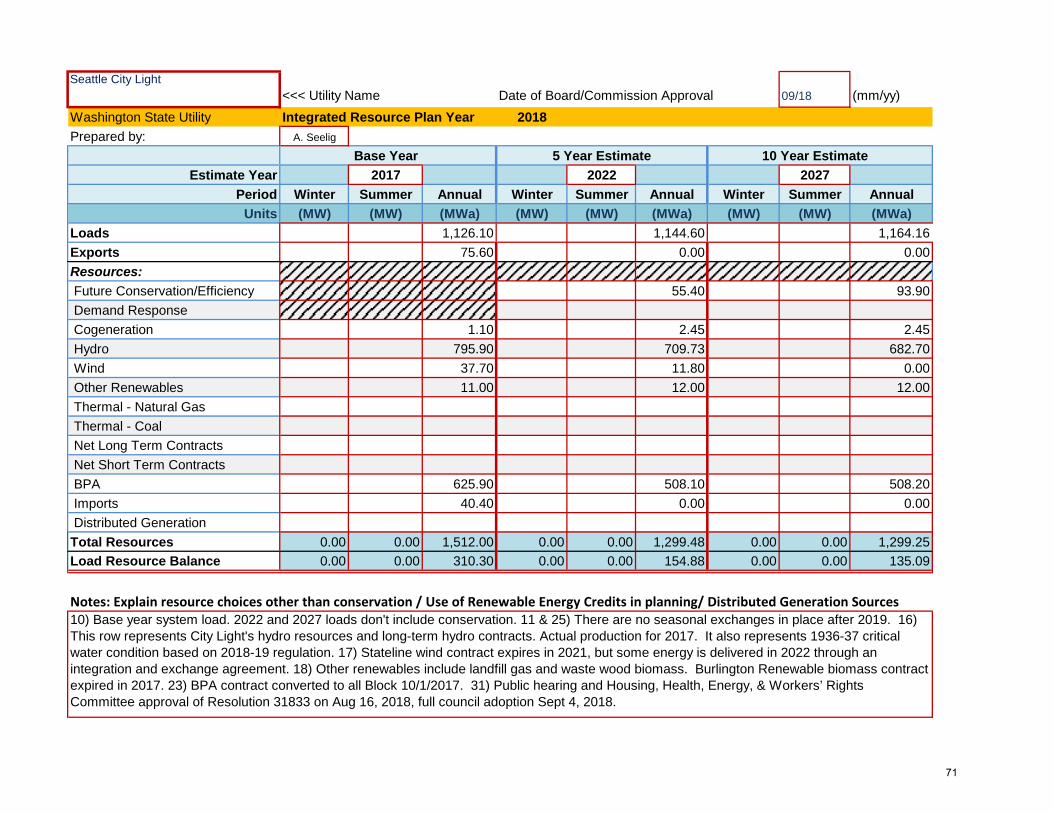
Seattle City Light
<<< Utility Name Date of Board/Commission Approval 09/18 (mm/yy)
Washington State Utility Integrated Resource Plan Year 2018
Prepared by: A. Seelig
Base Year 5 Year Estimate 10 Year Estimate
Estimate Year 2017 2022 2027
Period Winter Summer Annual Winter Summer Annual Winter Summer Annual
Units (MW) (MW) (MWa) (MW) (MW) (MWa) (MW) (MW) (MWa)
Loads 1,126.10 1,144.60 1,164.16
Exports 75.60 0.00 0.00
Resources:
Future Conservation/Efficiency 55.40 93.90
Demand Response
Cogeneration 1.10 2.45 2.45
Hydro 795.90 709.73 682.70
Wind 37.70 11.80 0.00
Other Renewables 11.00 12.00 12.00
Thermal - Natural Gas
Thermal - Coal
Net Long Term Contracts
Net Short Term Contracts
BPA 625.90 508.10 508.20
Imports 40.40 0.00 0.00
Distributed Generation
Total Resources 0.00 0.00 1,512.00 0.00 0.00 1,299.48 0.00 0.00 1,299.25
Load Resource Balance 0.00 0.00 310.30 0.00 0.00 154.88 0.00 0.00 135.09
Notes: Explain resource choices other than conservation / Use of Renewable Energy Credits in planning/ Distributed Generation Sources 10) Base year system load. 2022 and 2027 loads don't include conservation. 11 & 25) There are no seasonal exchanges in place after 2019. 16) This row represents City Light's hydro resources and long-term hydro contracts. Actual production for 2017. It also represents 1936-37 critical water condition based on 2018-19 regulation. 17) Stateline wind contract expires in 2021, but some energy is delivered in 2022 through an integration and exchange agreement. 18) Other renewables include landfill gas and waste wood biomass. Burlington Renewable biomass contract expired in 2017. 23) BPA contract converted to all Block 10/1/2017. 31) Public hearing and Housing, Health, Energy, & Workers’ Rights Committee approval of Resolution 31833 on Aug 16, 2018, full council adoption Sept 4, 2018.
71

PUD1 of Skamania County << Utility Name
Washington State Utility Resource Plan Year 2018
Prepared by: BPA
Base Year 5 Yr. Est. 10 Yr Est.
Estimate Year 2017 2022 2027
Period Annual Annual Annual
Units (MWa) (MWa) (MWa)
Loads 16.38 15.38 15.53
Resources:
Future Conservation/Efficiency
Demand Response
BPA Tier 1 (include BPA PF) 16.38 15.38 15.53
BPA Tier 2
Non BPA:
Co-generation
Hydro (critical water)
Wind
Other Renewables
Thermal-Natural Gas
Thermal-Coal
Market Purchase (non BPA)
Other
Distributed Generation
Undecided
Total Resources 16.38 15.38 15.53
Load Resource Balance 0.00 0.00 0.00
72
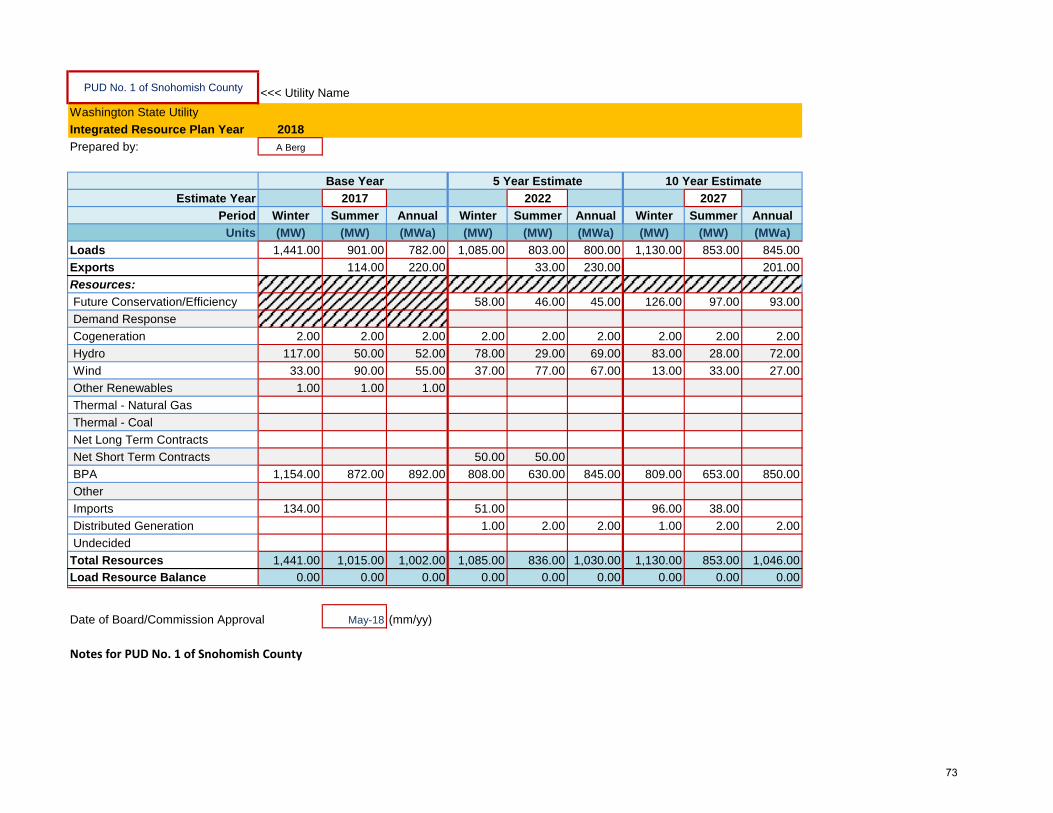
PUD No. 1 of Snohomish County <<< Utility Name
Washington State Utility
Integrated Resource Plan Year 2018
Prepared by: A Berg
Base Year 5 Year Estimate 10 Year Estimate
Estimate Year 2017 2022 2027
Period Winter Summer Annual Winter Summer Annual Winter Summer Annual
Units (MW) (MW) (MWa) (MW) (MW) (MWa) (MW) (MW) (MWa)
Loads 1,441.00 901.00 782.00 1,085.00 803.00 800.00 1,130.00 853.00 845.00
Exports 114.00 220.00 33.00 230.00 201.00
Resources:
Future Conservation/Efficiency 58.00 46.00 45.00 126.00 97.00 93.00
Demand Response
Cogeneration 2.00 2.00 2.00 2.00 2.00 2.00 2.00 2.00 2.00
Hydro 117.00 50.00 52.00 78.00 29.00 69.00 83.00 28.00 72.00
Wind 33.00 90.00 55.00 37.00 77.00 67.00 13.00 33.00 27.00
Other Renewables 1.00 1.00 1.00
Thermal - Natural Gas
Thermal - Coal
Net Long Term Contracts
Net Short Term Contracts 50.00 50.00
BPA 1,154.00 872.00 892.00 808.00 630.00 845.00 809.00 653.00 850.00
Other
Imports 134.00 51.00 96.00 38.00
Distributed Generation 1.00 2.00 2.00 1.00 2.00 2.00
Undecided
Total Resources 1,441.00 1,015.00 1,002.00 1,085.00 836.00 1,030.00 1,130.00 853.00 1,046.00
Load Resource Balance 0.00 0.00 0.00 0.00 0.00 0.00 0.00 0.00 0.00
Date of Board/Commission Approval May-18 (mm/yy)
Notes for PUD No. 1 of Snohomish County
73
12) "Imports" reflect short term balancing purchases from the wholesale energy market to balance
the PUD's loads and resources.
13) "Exports" reflect short term balancing sales to the wholesale energy market to balance the PUD's
loads and resources.
14) Rooftop solar facilities that are behind the meter (residential, commercial installations) are
reflected as a reduction to Load forecast for Years 5 and 10.
The 2017 IRP concluded with its probabilistic approach to existing and committed resources and BPA contract assumptions that the PUD is in an annual energy surplus position in the near term, and conservation is the single largest resource to be acquired over the 2018-2037 IRP study period. In addition, the lowest cost approach to meet the increasing Energy Independence Act (I-937) annual renewables compliance targets is to acquire additional unbundled renewable energy credits to supplement the PUD's existing power supply portfolio.
5) "Future Conservation/Efficiency" reflects new cumulative acquisition of Conservation as described in the 2017
Integrated Resource Plan.
6) Cogeneration consists of output from the Hampton Lumber Mill's Darrington, WA wood waste generator.
7) "Hydro" includes PUD's hydro resources: Jackson, Woods Creek, Youngs Creek, Packwood, Hancock & Calligan.
8) "Wind" includes PUD's long term power purchase agreements for 10% White Creek, 100% Wheat
Field and 100% Hay Canyon wind projects and uses a probabilistic forecast based on historical actuals.
9) "Distributed Generation" for the 5 and 10 Year estimates reflects assumption for Customer-Owned
Generation assumed in 2017 IRP. 10) "Net Short Term Contracts" for the 5 and 10 Year estimates reflect the 2017 IRP procurement of a
50 MW short term capacity product that can be called on to serve peak winter and summer demand
1) Base year reflects 2017 data with Winter Peak occurring in January 2017 and Summer Peak occurring in August 2017.
2) 5 and 10 Year reflect 2017 IRP Long Term Resource Strategy, adopted by the Snohomish PUD Board of
Commissioners on May 8, 2018.
3) 5 and 10 Year for Winter reflects monthly average for December on peak period, Summer reflects monthly
average for August on peak period.
4) "Loads" for the 5 and 10 Year Estimates are before new conservation and are at the total system level (i.e.,
retail sales + distribution line losses).
11) "BPA" for the 5 and 17 Year reflects forecast of Snohomish PUD's long-term power contract with
BPA for the Block/Slice product.
74

Steilacoom, Town of << Utility Name
Washington State Utility Resource Plan Year 2018
Prepared by: BPA
Base Year 5 Yr. Est. 10 Yr Est.
Estimate Year 2017 2022 2027
Period Annual Annual Annual
Units (MWa) (MWa) (MWa)
Loads 4.69 4.80 4.92
Resources:
Future Conservation/Efficiency 0.01 0.01
Demand Response
BPA Tier 1 (include BPA PF) 4.69 4.79 4.91
BPA Tier 2
Non BPA:
Co-generation
Hydro (critical water)
Wind
Other Renewables
Thermal-Natural Gas
Thermal-Coal
Market Purchase (non BPA)
Other
Distributed Generation
Undecided
Total Resources 4.69 4.80 4.92
Load Resource Balance 0.00 0.00 0.00
75

Sumas, City of << Utility Name
Washington State Utility Resource Plan Year 2018
Prepared by: BPA
Base Year 5 Yr. Est. 10 Yr Est.
Estimate Year 2017 2022 2027
Period Annual Annual Annual
Units (MWa) (MWa) (MWa)
Loads 3.84 3.76 3.81
Resources:
Future Conservation/Efficiency
Demand Response
BPA Tier 1 (include BPA PF) 3.84 3.76 3.81
BPA Tier 2
Non BPA:
Co-generation
Hydro (critical water)
Wind
Other Renewables
Thermal-Natural Gas
Thermal-Coal
Market Purchase (non BPA)
Other
Distributed Generation
Undecided
Total Resources 3.84 3.76 3.81
Load Resource Balance 0.00 0.00 0.00
76
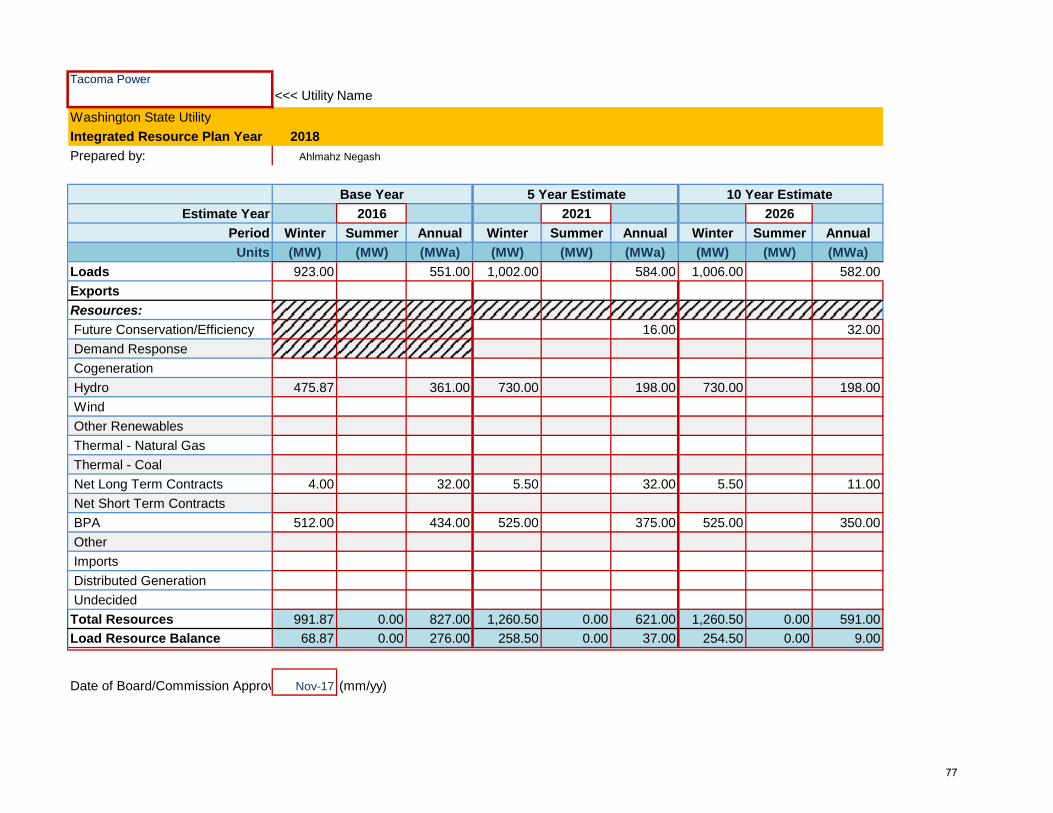
Tacoma Power
<<< Utility Name
Washington State Utility
Integrated Resource Plan Year 2018
Prepared by:
Base Year 5 Year Estimate 10 Year Estimate
Estimate Year 2016 2021 2026
Period Winter Summer Annual Winter Summer Annual Winter Summer Annual
Units (MW) (MW) (MWa) (MW) (MW) (MWa) (MW) (MW) (MWa)
Loads 923.00 551.00 1,002.00 584.00 1,006.00 582.00
Exports
Resources:
Future Conservation/Efficiency 16.00 32.00
Demand Response
Cogeneration
Hydro 475.87 361.00 730.00 198.00 730.00 198.00
Wind
Other Renewables
Thermal - Natural Gas
Thermal - Coal
Net Long Term Contracts 4.00 32.00 5.50 32.00 5.50 11.00
Net Short Term Contracts
BPA 512.00 434.00 525.00 375.00 525.00 350.00
Other
Imports
Distributed Generation
Undecided
Total Resources 991.87 0.00 827.00 1,260.50 0.00 621.00 1,260.50 0.00 591.00
Load Resource Balance 68.87 0.00 276.00 258.50 0.00 37.00 254.50 0.00 9.00
Date of Board/Commission Approval Nov-17 (mm/yy)
Ahlmahz Negash
77

Tanner Electric Cooperative << Utility Name
Washington State Utility Resource Plan Year 2018
Prepared by: BPA
Base Year 5 Yr. Est. 10 Yr Est.
Estimate Year 2017 2022 2027
Period Annual Annual Annual
Units (MWa) (MWa) (MWa)
Loads 11.30 12.05 12.76
Resources:
Future Conservation/Efficiency 0.08 0.08
Demand Response
BPA Tier 1 (include BPA PF) 10.32 10.98 10.98
BPA Tier 2 0.97 0.99 0.71
Non BPA:
Co-generation
Hydro (critical water)
Wind
Other Renewables
Thermal-Natural Gas
Thermal-Coal
Market Purchase (non BPA) 1.00
Other
Distributed Generation
Undecided
Total Resources 11.29 12.05 12.76
Load Resource Balance 0.00 -0.01 0.00
78
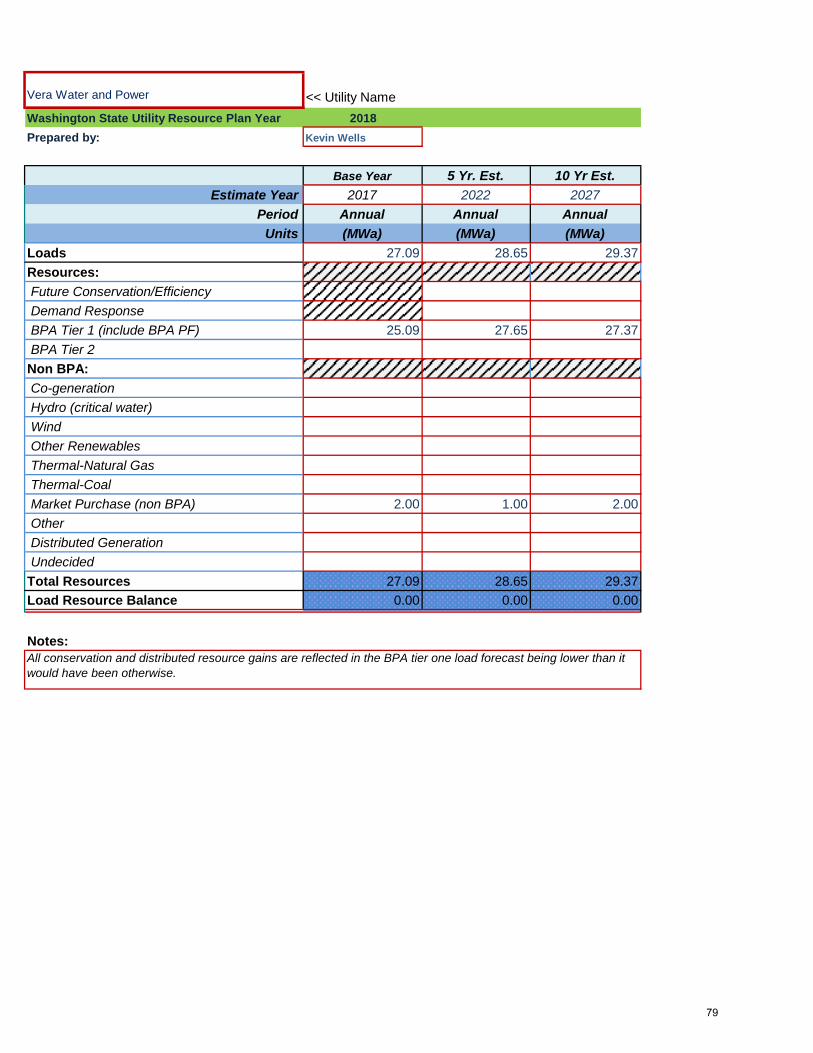
Vera Water and Power << Utility Name
Washington State Utility Resource Plan Year 2018
Prepared by: Kevin Wells
Base Year 5 Yr. Est. 10 Yr Est.
Estimate Year 2017 2022 2027
Period Annual Annual Annual
Units (MWa) (MWa) (MWa)
Loads 27.09 28.65 29.37
Resources:
Future Conservation/Efficiency
Demand Response
BPA Tier 1 (include BPA PF) 25.09 27.65 27.37
BPA Tier 2
Non BPA:
Co-generation
Hydro (critical water)
Wind
Other Renewables
Thermal-Natural Gas
Thermal-Coal
Market Purchase (non BPA) 2.00 1.00 2.00
Other
Distributed Generation
Undecided
Total Resources 27.09 28.65 29.37
Load Resource Balance 0.00 0.00 0.00
Notes: All conservation and distributed resource gains are reflected in the BPA tier one load forecast being lower than it
would have been otherwise.
79
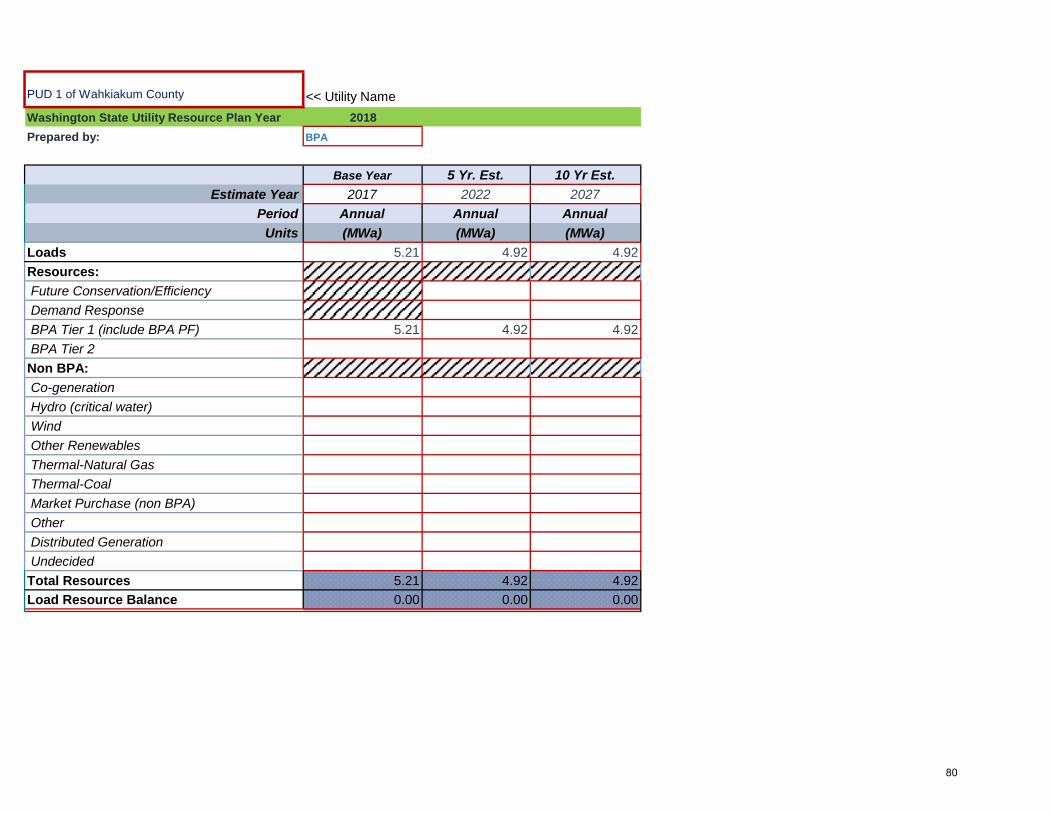
PUD 1 of Wahkiakum County << Utility Name
Washington State Utility Resource Plan Year 2018
Prepared by: BPA
Base Year 5 Yr. Est. 10 Yr Est.
Estimate Year 2017 2022 2027
Period Annual Annual Annual
Units (MWa) (MWa) (MWa)
Loads 5.21 4.92 4.92
Resources:
Future Conservation/Efficiency
Demand Response
BPA Tier 1 (include BPA PF) 5.21 4.92 4.92
BPA Tier 2
Non BPA:
Co-generation
Hydro (critical water)
Wind
Other Renewables
Thermal-Natural Gas
Thermal-Coal
Market Purchase (non BPA)
Other
Distributed Generation
Undecided
Total Resources 5.21 4.92 4.92
Load Resource Balance 0.00 0.00 0.00
80

PUD 1 of Whatcom County << Utility Name
Washington State Utility Resource Plan Year 2018
Prepared by: Whatcom PUD
Base Year 5 Yr. Est. 10 Yr Est.
Estimate Year 2017 2022 2027
Period Annual Annual Annual
Units (MWa) (MWa) (MWa)
Loads 23.81 26.65 26.35
Resources:
Future Conservation/Efficiency 0.30 0.00
Demand Response
BPA Tier 1 (include BPA PF) 23.81 26.35 26.35
BPA Tier 2
Non BPA:
Co-generation
Hydro (critical water)
Wind
Other Renewables
Thermal-Natural Gas
Thermal-Coal
Market Purchase (non BPA)
Other
Distributed Generation
Undecided
Total Resources 23.81 26.65 26.35
Load Resource Balance 0.00 0.00 0.00
Date of Board/Commission Approval August-18 (mm/yy)
Notes:Line 13: Whatcom PUD has a full requirements contract with BPA for resources through 2027.
81

Yakama Power << Utility Name
Washington State Utility Resource Plan Year 2018
Prepared by: BPA
Base Year 5 Yr. Est. 10 Yr Est.
Estimate Year 2017 2022 2027
Period Annual Annual Annual
Units (MWa) (MWa) (MWa)
Loads 16.63 19.01 19.21
Resources:
Future Conservation/Efficiency
Demand Response
BPA Tier 1 (include BPA PF) 16.63 19.01 19.21
BPA Tier 2
Non BPA:
Co-generation
Hydro (critical water)
Wind
Other Renewables
Thermal-Natural Gas
Thermal-Coal
Market Purchase (non BPA)
Other
Distributed Generation
Undecided
Total Resources 16.63 19.01 19.21
Load Resource Balance 0.00 0.00 0.00
82
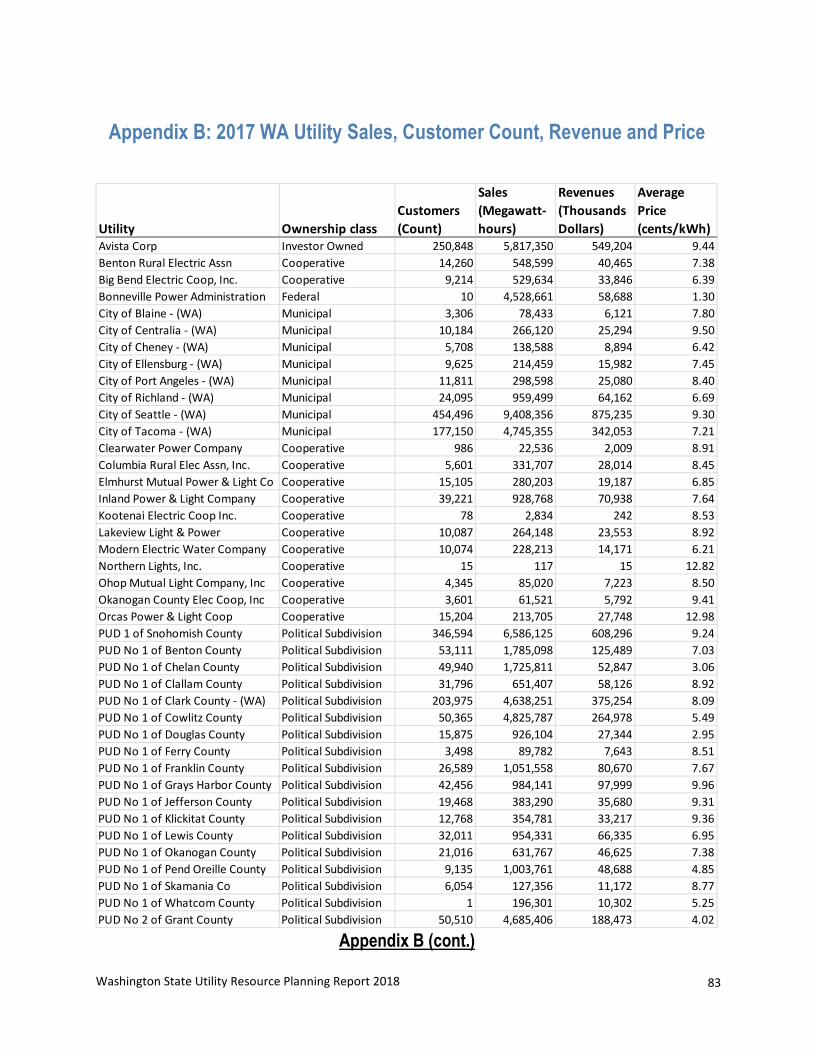
Washington State Utility Resource Planning Report 2018 83
Appendix B: 2017 WA Utility Sales, Customer Count, Revenue and Price
Appendix B (cont.)
Utility Ownership classCustomers (Count)
Sales (Megawatt-hours)
Revenues (Thousands Dollars)
Average Price (cents/kWh)
Avista Corp Investor Owned 250,848 5,817,350 549,204 9.44Benton Rural Electric Assn Cooperative 14,260 548,599 40,465 7.38Big Bend Electric Coop, Inc. Cooperative 9,214 529,634 33,846 6.39Bonneville Power Administration Federal 10 4,528,661 58,688 1.30City of Blaine - (WA) Municipal 3,306 78,433 6,121 7.80City of Centralia - (WA) Municipal 10,184 266,120 25,294 9.50City of Cheney - (WA) Municipal 5,708 138,588 8,894 6.42City of Ellensburg - (WA) Municipal 9,625 214,459 15,982 7.45City of Port Angeles - (WA) Municipal 11,811 298,598 25,080 8.40City of Richland - (WA) Municipal 24,095 959,499 64,162 6.69City of Seattle - (WA) Municipal 454,496 9,408,356 875,235 9.30City of Tacoma - (WA) Municipal 177,150 4,745,355 342,053 7.21Clearwater Power Company Cooperative 986 22,536 2,009 8.91Columbia Rural Elec Assn, Inc. Cooperative 5,601 331,707 28,014 8.45Elmhurst Mutual Power & Light Co Cooperative 15,105 280,203 19,187 6.85Inland Power & Light Company Cooperative 39,221 928,768 70,938 7.64Kootenai Electric Coop Inc. Cooperative 78 2,834 242 8.53Lakeview Light & Power Cooperative 10,087 264,148 23,553 8.92Modern Electric Water Company Cooperative 10,074 228,213 14,171 6.21Northern Lights, Inc. Cooperative 15 117 15 12.82Ohop Mutual Light Company, Inc Cooperative 4,345 85,020 7,223 8.50Okanogan County Elec Coop, Inc Cooperative 3,601 61,521 5,792 9.41Orcas Power & Light Coop Cooperative 15,204 213,705 27,748 12.98PUD 1 of Snohomish County Political Subdivision 346,594 6,586,125 608,296 9.24PUD No 1 of Benton County Political Subdivision 53,111 1,785,098 125,489 7.03PUD No 1 of Chelan County Political Subdivision 49,940 1,725,811 52,847 3.06PUD No 1 of Clallam County Political Subdivision 31,796 651,407 58,126 8.92PUD No 1 of Clark County - (WA) Political Subdivision 203,975 4,638,251 375,254 8.09PUD No 1 of Cowlitz County Political Subdivision 50,365 4,825,787 264,978 5.49PUD No 1 of Douglas County Political Subdivision 15,875 926,104 27,344 2.95PUD No 1 of Ferry County Political Subdivision 3,498 89,782 7,643 8.51PUD No 1 of Franklin County Political Subdivision 26,589 1,051,558 80,670 7.67PUD No 1 of Grays Harbor County Political Subdivision 42,456 984,141 97,999 9.96PUD No 1 of Jefferson County Political Subdivision 19,468 383,290 35,680 9.31PUD No 1 of Klickitat County Political Subdivision 12,768 354,781 33,217 9.36PUD No 1 of Lewis County Political Subdivision 32,011 954,331 66,335 6.95PUD No 1 of Okanogan County Political Subdivision 21,016 631,767 46,625 7.38PUD No 1 of Pend Oreille County Political Subdivision 9,135 1,003,761 48,688 4.85PUD No 1 of Skamania Co Political Subdivision 6,054 127,356 11,172 8.77PUD No 1 of Whatcom County Political Subdivision 1 196,301 10,302 5.25PUD No 2 of Grant County Political Subdivision 50,510 4,685,406 188,473 4.02

Washington State Utility Resource Planning Report 2018 84
Utility Ownership classCustomers (Count)
Sales (Megawatt-hours)
Revenues (Thousands Dollars)
Average Price (cents/kWh)
PUD No 2 of Pacific County Political Subdivision 17,360 314,671 25,276 8.03PUD No 3 of Mason County Political Subdivision 33,512 649,498 64,715 9.96PacifiCorp Investor Owned 130,570 4,221,298 356,529 8.45Parkland Light & Water Company Cooperative 4,559 118,429 8,473 7.15Peninsula Light Company Cooperative 32,842 606,390 57,071 9.41Puget Sound Energy Inc Investor Owned 1,135,020 21,316,397 2,256,627 10.59SolarCity Corporation Behind the Meter 99 601 76 12.61Tanner Electric Coop Cooperative 4,807 94,298 10,859 11.52Town of Steilacoom Municipal 2,945 38,696 2,934 7.58Vera Irrigation District #15 Political Subdivision 11,623 230,996 17,032 7.37Adjustment 2017 Other 22,993 494,455 42,450 0.00