washington, d.c. trendlines 2017 presentation
TRANSCRIPT


•
•
•
•
•


N o t e : D a t a a r e s e a s o n a l l y a d j u s t e d
S o u r c e : B L S , D e l t a A s s o c i a t e s ; F e b r u a r y 2 0 1 6
NE
T J
OB
CH
AN
GE
(T
HO
US
AN
DS
)
-1,000
-800
-600
-400
-200
0
200
400
600
2007 2008 2009 2010 2011 2012 2013 2014 2015 2016
Payroll Job GrowthUnited States | Month-to-Month
14.5 MILLION JOBS ADDED SINCE THE RECESSION
75 CONSECUTIVE MONTHS OF POSITIVE JOB GROWTH
5
-1,000
-800
-600
-400
-200
0
200
400
600
2007 2008 2009 2010 2011 2012 2013 2014 2015 2016
14.5 MILLION JOBS ADDED SINCE THE RECESSION
75 CONSECUTIVE MONTHS OF POSITIVE JOB GROWTH
NE
T J
OB
CH
AN
GE
(T
HO
US
AN
DS
)

-20%
-15%
-10%
-5%
0%
5%
10%
15%
2008 2009 2010 2011 2012 2013 2014 2015 2016
CH
AN
GE
IN
ME
DIA
N P
RIC
E,
SIN
GL
E-F
AM
ILY
HO
ME
S

0%
1%
2%
3%
4%
5%
6%
7%Effective Federal Funds Rate
10-Year Treasury
30-Year Treasury

0.24%0.54%
2.15%
2.45%
2.98%3.03%
0.0%
0.5%
1.0%
1.5%
2.0%
2.5%
3.0%
3.5%
2015 2016 2017
Effective Federal Funds Rate
10-Year Treasury
30-Year Treasury
December 16, 2015 December 14, 2016

0%
1%
2%
3%
4%
5%
2007 2008 2009 2010 2011 2012 2013 2014 2015 2016
2.6%
Average 2016
12
-MO
NT
H C
HA
NG
E
3.1%
Average 2007 – 20092.0%
Average 2010 – 2015

-10%
-8%
-6%
-4%
-2%
0%
2%
4%
6%
Q107
Q307
Q108
Q308
Q109
Q309
Q110
Q310
Q111
Q311
Q112
Q312
Q113
Q313
Q114
Q314
Q115
Q315
Q116
Q316
Q117
Q317
AN
NU
AL
CH
AN
GE
F O R E C A S T
2.2%
2017 Average2.1%
Post-Recession Average

0
20
40
60
80
100
120
140LA
Bas
in NY
DFW
SF B
ay Atl
Was
Sou
th F
L
Den
ver
Bo
s
Ch
i
Ph
x
Ho
u
NE
W J
OB
S (
TH
OU
SA
ND
S)
67K

-5,000 0 5,000 10,000 15,000 20,000 25,000 30,000
Information
Financial Activities
Transportation/Utilities
Manufacturing
Construction/Mining
Wholesale Trade
Other Services
State and Local Government
Retail Trade
Federal Government
Leisure/Hospitality
Education/Health
Professional/Business Services
71,300
- 4,700
J O B C H A N G E
23,900

0%
1%
2%
3%
4%
5%
6%B
os
Den
DFW SF Bay
Was
Ph
x
NY
LAB
asin Atl
S Fl
a
Ho
u
Ch
i
November 2015 November 2016
-50 -50-40-170 -10 +10-80 -20-90 -10-40 -10
13
National Rate
4.8%
Basis Point Change
4.5%

NE
W J
OB
S (
TH
OU
SA
ND
S)
-60
-40
-20
0
20
40
60
80
100
120
1402
00
0
20
01
20
02
20
03
20
04
20
05
20
06
20
07
20
08
20
09
20
10
20
11
20
12
20
13
20
14
20
15
20
16
20
17
20
18
20
19
20
20
District Suburban MD Northern VA
F O R E C A S T
48,600
4-Year Average43,400
20-Year Average


0%
2%
4%
6%
8%
10%
12%
14%
20 Years 10 Years 1 Year
STOCKSS&P 500
REAL ESTATENCREIF Property Index
T-BILLS(90 day)
TO
TA
L A
NN
UA
L A
VE
RA
GE
RE
TU
RN

0%
2%
4%
6%
8%
10%
12%
14%
Retail Industrial Apartment Office
TO
TA
L A
NN
UA
L R
ET
UR
N
Washington
US

$0
$5
$10
$15
$20
$25
$30
2004 2005 2006 2007 2008 2009 2010 2011 2012 2013 2014 2015 2016
TOTA
L V
OLU
ME
(BIL
LIO
NS)
Office Multifamily Retail Flex/Industrial

4%
5%
6%
7%
8%
9%
6.3% 5.8% 5.4%5.6%
Office Flex/Industrial
Grocery-Anchored
Apartments


0%
10%
20%
30%
40%
50%
Very Negative SomewhatNegative
Neutral Somewhat Positive Very Positive Unclear/Don'tKnow
SH
AR
E O
F R
ES
PO
ND
EN
TS

Stimulus + Higher Deficits
Higher Inflation
Higher Interest Rates

Immigration
Wall: $15B? $40B $285B?
Infrastructure: $1T over 10 years?

Warehouse/Distribution
Ports of Entry
Export-intensive Metro Areas

FINANCIAL INSTITUTIONS
Eased regulations
Home mortgage underwriting
Fannie Mae, Freddie Mac?
LOW INCOME HOUSING
TAX CREDITS
Lower tax rates
↓Fewer affordable
units
WASHINGTON METRO AREA
Federal hiring freeze
Defense spendingvs.
Other spending
Federal agencies moved out of region?

TOTAL FEDERAL
39.8%60.2%NON-FEDERAL
10.7%
10.0%
19.1%
TOTAL FEDERAL
27.2%72.8%NON-FEDERAL
7.7%
6.7%
12.8%
2010 2020
OTHER FEDERAL FEDERAL WAGES & SALARIES PROCUREMENT

0%
5%
10%
15%
20%
25%
30%
35%
40%
45%
1950 1960 1970 1980 1990 2000 2010 2016
38%
11%

45
46
47
48
49
50
51
52
53
54
2010 2011 2012 2013 2014 2015 2016
SQ
UA
RE
FE
ET
(M
ILL
ION
S)
47


Aviation D
Bridges C+
Dams D
Drinking Water D
Energy D+
Hazardous Waste D
Inland Waterways D-
Levees D-
Public Parks and Recreation C-
Rail C+
Roads D
Schools D
Solid Waste B-
Transit D
Wastewater D
Ports C
Overall grade:

27.2
23.3
20.1
24.4
28.4
16
18
20
22
24
26
28
30
1999 2001 2003 2005 2007 2009 2011 2013 2015
Health Care Educational Transportation Power Plants, Lines Highways and Streets
YE
AR
S

SH
AR
E O
F G
DP
0.50%
0.0%
0.5%
1.0%
1.5%
2.0%
2.5%
1970 1975 1980 1985 1990 1995 2000 2005 2010 2015

$1.72
$0.74
$0.39
$0.79
$0.0
$0.5
$1.0
$1.5
$2.0
Surface Transportation Electricity Schools Other
Identified Funding Funding Gap
20
10
TR
ILL
ION
S
Total Funding Required: $3.6 trillionTotal Funding Gap: $1.6 trillion

Surface Transportation
Electricity
Inland Waterways & Marine Ports
Water/Wastewater
Airports

Public Transportation
Storm Water
Drinking & Waste Water
Public Buildings
Roads
Electric
Bridges
Gas


450,000
500,000
550,000
600,000
650,000
700,000
750,000
800,000
1996 1998 2000 2002 2004 2006 2008 2010 2012 2014 2016

-4%
-2%
0%
2%
4%
6%
8%
2010 2011 2012 2013 2014 2015
Washington Metro New York Chicago San Francisco

54.3
19.7
31.2
0
10
20
30
40
50
60
District Northern Virginia Suburban Maryland
SQ
UA
RE
FE
ET
(M
ILL
ION
S)
Office Development Under Construction Within ½ Mile
of a Metro Station:93% of Total in Region

$2.3
$0.5$0.4
$0.0
$0.5
$1.0
$1.5
$2.0
$2.5
DC Virginia Maryland
BIL
LIO
NS
Within 1/4 Mile Within 1/2 MileDistance from Metrorail station:
28% of Total Area Tax Base


State & Local Funds Fares & Parking Federal Debt Other
Compared to FY 2017: $2.8B (+11%)
FY18 BUDGET GAP
FTA Grants $60M
Management/Labor $50M
Riders $50M
District of Columbia $47M
Maryland $44M
Virginia $39M
TOTAL $290M

MetroForward$5 billion over 2014-2020 for
safety and reliability improvements
SafeTrackIntensive program to
improve safety and reliability
3 years of work in 12 months (completion June 2017)
Back2Good
Safety
Reliability
Financial management
Customer experience
Federal Transit Administration
Safety oversight (October 2015)

Proposals
Overhaul the governance structure
Fix the funding problem Improve the Board’s
capabilities Put the Federal
Government in charge
Funding Needed
$1 billion for regular life cycle maintenance and replacement
$600 million per year for capacity improvements
Annual operating deficits


0%
2%
4%
6%
8%
10%
12%
14%
16%
18%
SF Bay Phil NY Bos LA Basin Was DFW Hou Atl Chi
OV
ER
AL
L V
AC
AN
CY
RA
TE
14.1%
9.8%
National Rate

0
2
4
6
8
10
12
14
16
18
20
NY SF Bay Was DFW LA Basin Phil Bos Chi Hou Atl
CO
NS
TR
UC
TIO
N (
MIL
LIO
NS
OF
SF
)
11.3

-10%
-5%
0%
5%
10%
15%
20%
25%
30%
2001 to 2009 2010 to 2016
CH
AN
GE
IN
SF
LE
AS
ED
U
PO
N R
EL
OC
AT
ION

OV
ER
AL
L V
AC
AN
CY
RA
TE
0%
2%
4%
6%
8%
10%
12%
14%
16%
18%
14.8%
14.1%

-5%
0%
5%
10%
15%
20%
Change in Asking Rent
Overall Vacancy Rate
Natural Vacancy Rate
F O R E C A S T

The amenities game: what tenants want.
Older product: consider renovation or conversion.
Tenants to target: which industries are leasing space?
Target submarkets: select submarkets will turn to landlord.

0%
2%
4%
6%
8%
10%
12%
LA Basin Det SF Bay NY Phi Hou Chi DFW Was/Bal Atl Bos
OV
ER
AL
L V
AC
AN
CY
RA
TE
7.6%
5.3%5.3%
National Rate

-4
-2
0
2
4
6
8
10
2000 2001 2002 2003 2004 2005 2006 2007 2008 2009 2010 2011 2012 2013 2014 2015 2016
NE
T A
BS
OR
PT
ION
(M
ILL
ION
S O
F S
F)
Long-Term Average3.6 MSF
6.3

Retail
Services
Agri/Mining/Utilities
Manufacturing
Business Services
Transportation
Other Sectors

49%
23%
14%
12% 2%
FLEX/INDUSTRIAL
RETAIL SELF STORAGE
MULTIFAMILY
OFFICE

OV
ER
AL
L V
AC
AN
CY
RA
TE
0%
2%
4%
6%
8%
10%
12%
2000 2001 2002 2003 2004 2005 2006 2007 2008 2009 2010 2011 2012 2013 2014 2015 2016 2017
7.0%
7.6%

-6%
-4%
-2%
0%
2%
4%
6%
8%
10%
12%
Change in Asking Rent
Overall Vacancy Rate
Natural Vacancy Rate
F O R E C A S T

Submarkets to outperform?
Product types to outperform: data centers, retail distribution, biotech, and self-storage.
Undersupply of new inventory.


VA
CA
NC
Y R
AT
E (
AL
L C
LA
SS
ES
)
0%
1%
2%
3%
4%
5%
6%
7%
NY LA Wash DFW Atl SF Bay Chi Phi Phx South FL Balt Hou
3.8%
4.2%
National Rate

UN
ITS
0
2,000
4,000
6,000
8,000
10,000
12,000
14,000
16,000
18,000
2005 2006 2007 2008 2009 2010 2011 2012 2013 2014 2015 2016 2017 2018 2019
F O R E C A S T
6,806
Long-Term Average
8,063
Average Since 2008

0
2
4
6
8
10
12
14
16
No VA Sub MD The District
MA
RK
ET
-R
AT
E U
NIT
S (
TH
OU
SA
ND
S)
PROJECTED STABILIZED VACANCY AT DEC. 2019
Projected Stabilized Vacancy Rate at Dec. 2019: 3.9% Metro-Wide
DEMAND
27,100 units
SUPPLY*
33,649 units
Planned
Under Construction
3.5%
3.7%4.7%

-4%
-2%
0%
2%
4%
6%
8%
10%
2003 2004 2005 2006 2007 2008 2009 2010 2011 2012 2013 2014 2015 2016 2017 2018 2019
EF
FE
CT
IVE
RE
NT
CH
AN
GE
F O R E C A S T
4.0%
Long-Term Average


Consider developing smaller-scale buildings in the District.
Differentiate from the competition.
Convert obsolete office buildings to apartments.
There are pockets of undersupply around the region.


NU
MB
ER
OF
UN
ITS
0
500
1,000
1,500
2,000
2,500
3,000
3,500
4,000
2007 2008 2009 2010 2011 2012 2013 2014 2015 2016 2017
Suburbs
District
1,900
F O R E C A S T

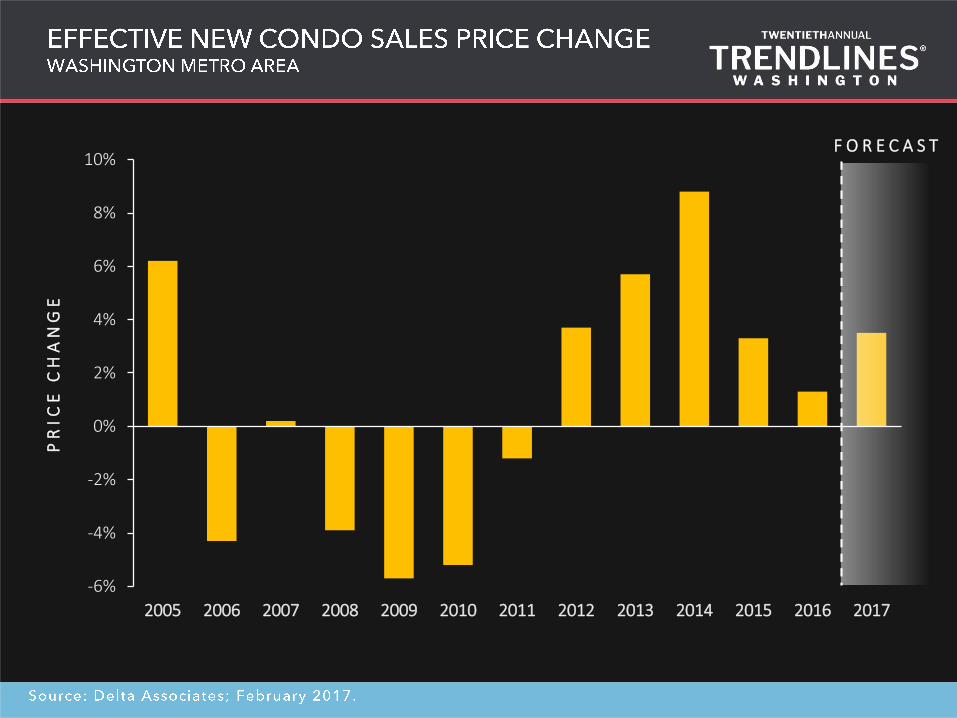
-6%
-4%
-2%
0%
2%
4%
6%
8%
10%
2005 2006 2007 2008 2009 2010 2011 2012 2013 2014 2015 2016 2017
PR
ICE
CH
AN
GE
F O R E C A S T

AV
ER
AG
E P
RIC
E P
ER
SF
$2,799 $1,275 $1,213 $1,204 $1,150 $920 $802 $731 $678 $665 $638 $411 $0
$400
$800
$1,200
$1,600
$2,000
$2,400
$2,800

0
2,000
4,000
6,000
8,000
10,000
12,000
14,000
16,000
18,000
20,000
22,000
24,000
2006 2007 2008 2009 2010 2011 2012 2013 2014 2015 2016
NU
MB
ER
OF
UN
ITS
2,566


MA
RK
ET
-R
AT
E U
NIT
S
0
500
1,000
1,500
2,000
2,500
3,000
3,500
4,000
The District No VA Sub MD
DEMAND
6,225 units
SUPPLY*
5,016 units
Planned
Under Construction

Be mindful of design and amenities depending on the buyer.
Build boutique or medium-sized condo projects.
Consider converting obsolete office buildings to condos.
Many development opportunities exist in the right locations.

