washington central supervisory union school report
TRANSCRIPT

for Calais Elementary School and U-32February, 2018
School ReportWashington Central Supervisory Union
Inside ...William Kimball, Superintendent page 2CalaisElementary pgs. 3-10U-32 Middle/High School pgs. 11-18Student Learning Outcomes page 19
Sinta O’Riordan, grade 2

page 2
A Letter from the Superintendent
Dear Parents and Community Members William Kimball, Superintendent of Schools
Each year Washington Central Supervisory Union prepares this report for families and community members in each of our towns to highlight areas of focus across our PreK-12 educational system. We also report information about our students’ progress and performance across many indicators. I hope that this report pro-vides information to you about the work we are doing across all of our schools to ensure success for each and every student.
I value the great leadership all of our boards have provided in estab-lishing a unified mission and Student Learning Outcomes (SLO) for our PreK-12 school system. Over the past two years many of you and your com-munities have given input to your school board about their individual mission and student learning outcomes and determining the best direction forward for our governance system. I am continually impressed by the amount of support the school system receives from our community members. This is an indicator of the value we all have for education and our belief that investing in the future for our kids is the best way to ensure a suc-cessful Vermont.
The WCSU mission is: WCSU exists to nurture and inspire in all students the pas-sion, creativity, and power to contribute to their local and global communities.
The SLO are articulated further in this report. The SLO are divided into two ma-jor categories, Core Knowl-edge and Transferable Skills.
In order to ensure that all of our students achieve the SLO, our WCSU teachers have been working hard to articulate exactly what students need to know and be able to do in order to demonstrate proficiency at all levels of our school system. Indeed, over half of our teachers engaged in
curriculum, instruction, and assessment work related to the SLO this past summer!
Relatedly, the Washington Central Leadership Team has articulated its theory of action in order to en-
sure that all students achieve proficien-cy in our Student Learning Outcomes: If we provide high quality instruction and interventions that are responsive to learners’ needs and interests, based on clear learning targets, and measured by a comprehensive and balanced as-sessment system, then we will close achievement gaps and ensure that all students achieve proficiency in our WCSU student learning outcomes.
There are three pillars to the theory of action: Clear Learning Targets,
High Quality Instruction and Interventions, and a Comprehensive and Balanced Assessment System. In 2017-18, we have increased our focus on proficiency based learning for students along with adjusting our scoring and reporting systems to be in alignment with our SLO. Please see the Central Office administrators’ report for more information about this work.
In addition to providing information about how our students perform on state and local assessments, this report includes highlights from our schools, including a number of ways in which students are engaged in learning ex-periences both in and out of the classroom.
Please do take some time to review the material con-tained in this report. I invite all families and community members to be involved with our schools and the educa-tion of our children. Truly, they are our most valuable resource.
On behalf of the students and staff of Washington Central Supervisory Union, thank you for your contin-ued support.
Elementary students explore Vermont’s outdoors during hikes each fall.

page 3
Calais Elementary School Report
continued on page 5
I feel very for-tunate to be able to report out as principal of Calais Elementary for the third year! We have continued our work as a supervisory union (SU) on our mission and theory of action. As we shared with you last year, we are work-ing together on our
Implementation Plan, which builds on the three focal areas including Clear Learning Targets, A Comprehen-sive and Balanced Assessment System, and Providing High Quality Instruction and Interventions. In the fall, we shared a parent/community brochure of this report with our families during conferences.
This year, Calais has worked closely with our colleagues around the SU on important aspects of the Implementation Plan, specifically in the area of scor-ing and reporting student work, which relates to the Comprehensive and Balanced Assessment System. At our August in-service we participated in profes-sional development on our Student Learning Outcomes (SLOs) and Performance Indicators (PIs). We also began our work with the tool we will be using to share this information with families, Infinite Campus. Pro-fessional development and support in Infinite Campus use was also provided by a Supervisory Union team of teachers and administrators. At our October in-service we refined our work by developing family-friendly language for our report cards, which were rolled-out for the first time in January.
As the diversity of student needs continues to grow across Vermont, we developed our professional capacity in addressing these needs together. In our January in-service we were fortunate to have one of the foremost regional experts in the area of trauma, David Melnick, LCSW, provide us with additional information as we work to support students. So many of our students have issues around trauma (poverty,
neglect, abuse, ill-ness, family crisis, grief, disability, etc.) that impact the way their brain develops and the way they learn. This has huge implications for the way our students interact with oth-ers socially, emotionally, and behaviorally, so our staff is invested in developing skills and tools to support students in the way they need.
As part of WCSU, Calais staff contributes to the good work from across the union focusing on instruc-tional practices that not only align with the Common Core State Standards (CCSS), but also working to-wards truly being a part of a PreK-graduation system that supports ALL our students in achieving high standards in education. This work is accomplished by Calais staff participating weekly in professional learn-ing and colleagueship with folks in Calais as well as across the supervisory union in the areas of: literacy, math, and school climate. This hard work and our accountability for it is reflected in our annual Continu-ous Improvement Plan (CIP), highlights of which are summarized below. We are still working with the AOE around changes to the goal setting process for continu-ous improvement planning. In the interim, our staff committees on math, literacy, and climate are digging into some of the data around standardized testing, local assessments, report cards, PBiS/Behavior, and climate surveys with a focus on improving our instructional practice. Having the data is only helpful if it drives how we respond to students and help them achieve the student learning outcomes. This analysis is an important first step in setting goals for our continuous improvement. Our full plan can be viewed at: https://docs.google.com/document/d/11zV47NpqxNrWHHifYyer7NOhXaHVoL4TPmWgk1dmu5g/edit Please note this document will be revised for 2017-2018 as we receive direction for changes from the state.
LiteracyOver the last few years we have worked towards
Principal Catherine Fair.
Principal’s MessageBy Catherine Fair

School InformationStudent Enrollment:
Student Services:
◆ 27% of students are eligible for free or reduced lunch. ◆ An average of 16% of students eat school breakfast and 53% of students eat school lunch. ◆ 16% of students receive Special Education services. ◆ 6% of students have 504 plans. ◆ 6% of students have Educational Support Team (EST) plans. ◆ Between 8/28/17 – 12/21/17 there were 497 visits to the school nurse or designee for illness or injury. ◆ We offer 10 hours/week of prekindergarten and serve 12 three- and four-year-olds. ◆ 45% of teachers have masters degrees and 75% of teachers have Level II licenses.
Calais Facts for the 2017-18 school year: ◆ Average student daily attendance: 96% percent. ◆ Average class size is 15, with a range between 7 and 24. ◆ Students in grades K-6 receive 90 minutes of literacy instruction daily.
The following is a snapshot of our school’s PreK-6 population over the past five years:
page 4
2013-14 2014-15 2015-16 2016-17 current students 133 138 128 122 126
0
20
40
60
80
100
120
140 students
◆ Students in grades 1-6 receive 60 minutes of math instruction daily. ◆ Every student in K-6 receives instruction in art, music, library, and physical activity at least weekly. Students participate in programs in Art (1 time per week), Health & Guidance (1 time per week for half the year each), Library (1 time per week), Music (2 times per week), and Physical Education (4 times per week). ◆ Many of our students participate in basketball, soccer and drama activities after school through our school recreation program. ◆ In grades 3-6, students have a variety of music choices available in addition to classroom instruction, including chorus, strings and group instrument lessons.
Source: Student Census, November, 2017
Community Connections ◆ 67 students participated in Calais Community Connections in the 2016 -2017 school year. ◆ 28 students started the day off right at before-school care, 35 stayed with us after school and 4 students participated in Community Connections summer camps. ◆ 8 Calais preschool students participated in Community Connections’ Preschool program.
First day of school.
page 5
building teaching teams that allow teachers to special-ize in one content area (grade-alike math or literacy) rather than every teacher teaching to combined groups of both math and literacy. We have further developed this team approach to include grades 1-6. These changes support our ongoing work to align what we teach to the Common Core State Standards (CCSS). We assess students in grades K-3 in literacy using the Fountas and Pinnell (F&P), in grades 4-6 in lit-eracy using the Developmental Reading Assessment (DRA2), in grades 1-6 in math using the STAR 360, and new this year, we have added to our local compre-hensive assessment plan in grades 3-6 in literacy using the STAR 360 in reading. These assessments are an integral source of information used collectively with a teacher’s scoring and standardized tests like the SBAC we get a holistic picture of where each student is at in their learning with more accurate indicators of what they need to move forward in achieving our student learning outcomes.
Math In math we are engaged in our first of two residen-
cies with WCSU coach, Ellen Dorsey. Ellen, along with Jennifer Miller-Arsenault (Director of Curricu-lum, Instruction, and Assessment) and our partners at East Montpelier Elementary are engaging in profes-sional development with our Calais staff around dig-ging deeper into the data (both literacy and math) from the assessments in our local comprehensive assessment plan. It is so important that we take the time to analyze the data and what it tells us about where our students are and to have the evidence to inform our instruction that will move our students towards achievement of our learning outcomes.
Principal’s Message cont. from page 3
School ClimateOur climate committee meets regularly to explore
the behavior data we track through PBiS (Positive Behavior Intervention System.) While we see trends in terms of time of day, day of the week, and type of challenging behavior, we have not yet fully captured the “why” behind some of these trends and intend to continue digging. Ultimately, we want the “why” to be attached to the most meaningful interventions so our Calais students can truly work towards Being Safe, Be-ing Kind, and Working Hard.
School Climate DataLast spring each school disseminated a school
climate survey to students, parents and staff mem-bers. The school climate survey contained questions about issues such as school safety, communication, expectations, meeting students’ and families’ needs, and relationships between students, staff, administra-tors, and families. Continued improvement in student perception of:
◆ When I am at school I feel safe. ◆ My teacher cares about me. ◆ I am recognized for doing my best work. ◆ My principal cares about the students at school.
New areas of growth: ◆ My parents think that school is important.
Areas to work on ◆ I feel I am safe on the bus. ◆ The work my teacher gives me is challenging.
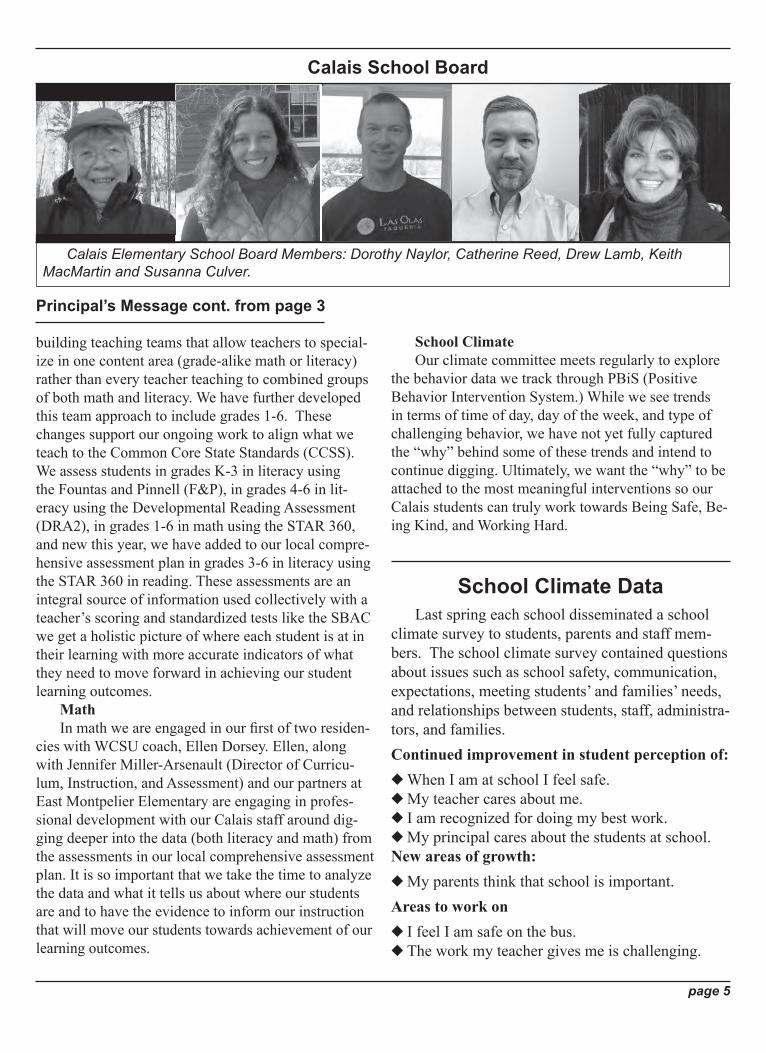
Calais School Board
Calais Elementary School Board Members: Dorothy Naylor, Catherine Reed, Drew Lamb, Keith MacMartin and Susanna Culver.

page 6
ELAProficient MathProficientCalais 67% 39%WCSU 59% 37%Vermont 53% 45%
0%
10%
20%
30%
40%
50%
60%
70%
80%
Percen
tofstude
ntsa
tora
boveth
estan
dard
What percentage of our students met or exceeded the standards on state English Language Arts and Math assessments?
This graph compares the percent of Calais students to the percent of WCSU and Vermont students in 2017 meeting the standards in English Language Arts (ELA) and Math. At Calais, 67 (97.1%) students were tested in reading and math. 422 WCSU students were tested in ELA and 421 in math.
Calais SBAC ELA, Math, Grades 3-6, Spring 2017
Vermont State Assessment ProgramVermont is a member of the Smarter Balanced
Assessment Consortium (SBAC). As such, Vermont students in Grades 3-8 and 11 participated in SBAC testing for the third time in the spring of 2017. The Smarter Balanced Assessment replaced Vermont’s previous assessment test, the NECAP (New England Common Assessment Program), in 2015. The SBAC is a test that has higher standards than our former standardized test, the NECAP. This assessment of English Language Arts and Mathematics asks students to demonstrate and apply their knowledge and skills in areas such as critical thinking, analytical writing, and problem solving.
The SBAC is administered via computer, is aligned with the Common Core State Standards, and assesses student performance in literacy and mathematics. Because our school system receives federal funds, we are required by statute to administer the SBAC and report our SBAC scores.
Additionally, Washington Central Supervisory Union has created a local comprehensive assessment system for students in Grades PreK-Graduation. The local comprehensive assessment system provides a coherent, balanced approach to assessment across the supervisory union, and the results of the assessments provide data which drive instruction at the individual student and systems levels.
Also included in this section of the annual school report are results from the Spring 2017
administration of the science NECAP. The science NECAP is administered in Grades 4, 8, and 11. The science NECAP assessment is designed to measure students’ scientific knowledge and skills. This assessment combines scores from multiple choice and short answer questions with results from an inquiry task that requires students to analyze and interpret findings from an actual science experiment.
We are also including data from two literacy assessments, the Fountas and Pinnell Benchmark Assessment System that was administered to students in Grades 1-3 in the Fall of 2017 as well as data from the Developmental Reading Assessment 2 (DRA 2) that was administered to students in Grades 4-6 also in the Fall of 2017 as part of our local comprehensive assessment system. Finally, we are including the results of the most recent administration of the National Assessment of Educational Progress (NAEP).
In order to respond to changes in federal education legislation--specifically the end of No Child Left Behind and the implementation of the Every Student Succeeds Act--the State of Vermont has created a new statewide assessment plan. A few of the changes for Spring 2018 include the administration of the SBAC at Grade 9 instead of Grade 11 and the administration of a new science assessment at Grades 5, 8, and 11; the new science assessment will replace the NECAP science test.

page 7
SBAC English Language Arts (ELA), Grades 3-6, 2017
Grade3 Grade4 Grade5 Grade6Calais 53% 67% 80% 67%WCSU 54% 57% 59% 64%VT 49% 49% 55% 52%
0%
10%
20%
30%
40%
50%
60%
70%
80%
90%
Percen
tofstude
ntsa
tora
boveth
estan
dard
17 grade 3, 15 grade 4, 20 grade 5 and 15 grade 6 Calais students took the SBAC tests in English Language Arts and Math in the spring of 2017. 112 grade 3, 104 grade 4, 96 grade 5, and 110 grade 6 Washington Central Supervisory Union students took the SBAC tests in ELA and Math. 98.1% of students in grades 3-6 participated in the SBAC. The graphs to the right and below compare the percent of Calais, Washington Central and Vermont students meeting the standards in academic areas.
SBAC ELA, Grades 3-6, 2017
ELAProficient MathProficient2016 74% 55%2017 67% 39%
0%
10%
20%
30%
40%
50%
60%
70%
80%
Percen
tofstude
ntsa
tora
boveth
estan
dard
The graph to the left compares the percent of Calais students meeting the standards in English Language Arts and Math in 2016 and 2017.
Calais SBAC ELA, Math, Grades 3-6, Spring 2016, 2017
Grade3 Grade4 Grade5 Grade6Calais 35% 47% 40% 33%WCSU 41% 42% 35% 28%VT 52% 47% 42% 39%
0%
10%
20%
30%
40%
50%
60%
Percen
tofstude
ntsa
tora
boveth
estan
dard SBAC Math, Grades 3-6, 2017
What percentage of our students met or exceeded the standards on the state math assessment?
Team building.
Learning to code.

page 8
female male studentswithIEP noIEP economicallydisadvantaged
noteconomicallydisadvantaged
Calais 81% 52% 33% 75% 53% 72%WCSU 67% 50% 16% 69% 38% 69%Vermont 57% 46% 13% 58% 36% 62%
0%
20%
40%
60%
80%
100%
Percen
tofstude
ntsa
tora
bovestan
dard
SBAC Disaggregated Results, English Language Arts, Math Grades 3-6, 2017In the spring of 2017, 422 (98.1%) WCSU grade 3-6 students took the SBAC tests in English Language
Arts and Math. 202 were female and 220 were male. 86 students had an IEP (Individualized Educational Plan). 138 were identified as economically disadvantaged students. The number of ELL (English Language Learners) and migrant students was too small to report on as was the number of students disaggregated by race/ethnicity.
female male studentswithIEP noIEP economicallydisadvantaged
noteconomicallydisadvantaged
Calais 39% 39% 8% 38% 50% 40%WCSU 41% 38% 3% 35% 20% 45%Vermont 45% 47% 12% 53% 33% 54%
0%
20%
40%
60%
80%
100%
Percen
tofstude
ntsa
tora
bovestan
dard
SBAC Disaggregated Results, English Language Arts, Grades 3-6, 2017
SBAC Disaggregated Results, Math, Grades 3-6, 2017
36 Calais students were female and 31 were male. 12 Calais students had an IEP and 17 were identified as economically disadvantaged students.
36 Calais students were female and 31 were male. 12 Calais students had an IEP and 17 were identified as economically disadvantaged students.
page 9
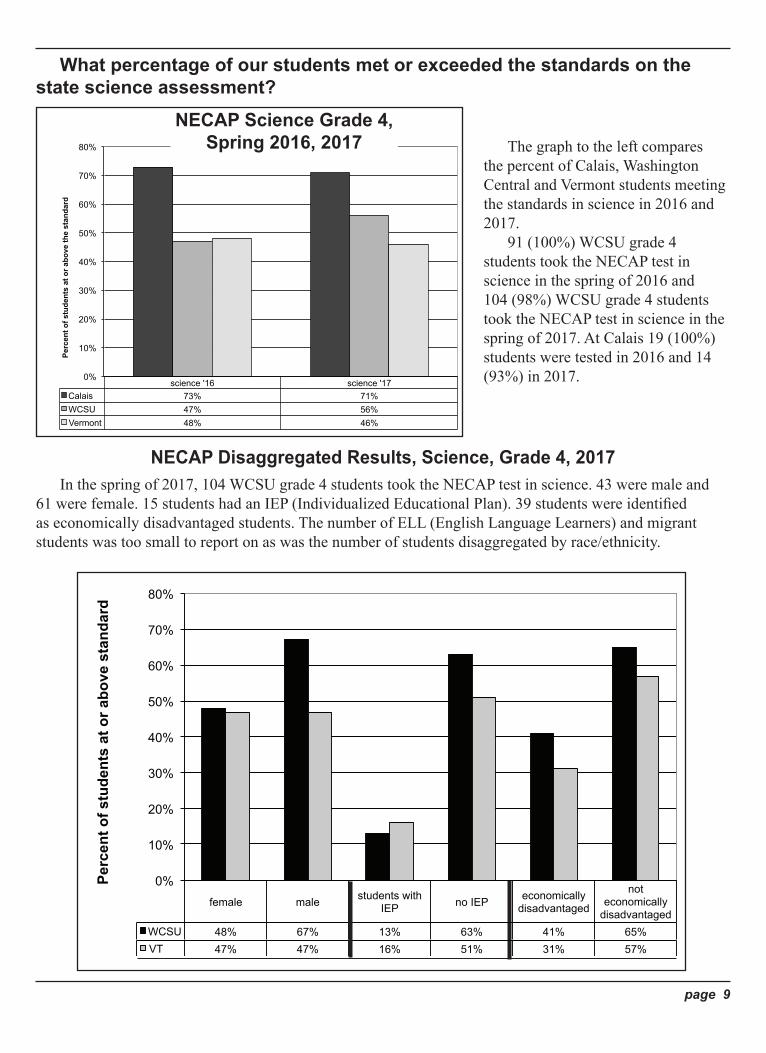
What percentage of our students met or exceeded the standards on the state science assessment?
science '16 science '17 Calais 73% 71% WCSU 47% 56% Vermont 48% 46%
0%
10%
20%
30%
40%
50%
60%
70%
80%
Perc
ent o
f stu
dent
s at
or a
bove
the
stan
dard
NECAP Science Grade 4, Spring 2016, 2017 The graph to the left compares
the percent of Calais, Washington Central and Vermont students meeting the standards in science in 2016 and 2017.
91 (100%) WCSU grade 4 students took the NECAP test in science in the spring of 2016 and 104 (98%) WCSU grade 4 students took the NECAP test in science in the spring of 2017. At Calais 19 (100%)students were tested in 2016 and 14 (93%) in 2017.
NECAP Disaggregated Results, Science, Grade 4, 2017In the spring of 2017, 104 WCSU grade 4 students took the NECAP test in science. 43 were male and
61 were female. 15 students had an IEP (Individualized Educational Plan). 39 students were identified as economically disadvantaged students. The number of ELL (English Language Learners) and migrant students was too small to report on as was the number of students disaggregated by race/ethnicity.
female male students with IEP no IEP economically
disadvantaged
not economically
disadvantaged WCSU 48% 67% 13% 63% 41% 65% VT 47% 47% 16% 51% 31% 57%
0%
10%
20%
30%
40%
50%
60%
70%
80%
Perc
ent o
f stu
dent
s at
or a
bove
sta
ndar
d
page 10
Known as “the Nation’s Report Card,” NAEP is the only nationally representative and continuing as-sessment of what America’s students know and can do in various subject areas. Testing is done in read-ing, mathematics, and science in grades 4 and 8. NAEP does not provide scores for individual stu-dents or schools; instead, it offers results regarding subject-matter achievement for populations of students (e.g., fourth-graders) in a State and groups within those populations (e.g., female stu-dents, Hispanic students). National and state NAEP results are based on a sample of such student popula-tions.
The most recent NAEP data for Vermont is from
National Assessment of Educational Progress (NAEP)
testing in 2015. In that year, 44% of 4th graders and 44% of 8th graders were proficient or advanced in reading; and 44% of 4th graders and 42% of 8th graders were proficient or advanced in mathematics.
48% of fourth graders and 44% of 8th graders were proficient or advanced in science.
Vermont students continued to perform among the top 10 states in the nation. In eighth-grade reading, no other state scored significantly higher than Vermont. The only state to
score higher than Vermont in fourth-grade reading was Massachusetts. Vermont showed a significant increase in scores from the previous years for fourth-grade reading.
This fall we administered the Fountas and Pinnell Benchmark Reading Assessment to students in Grades 1-3. This assessment is administered in a one-to-one setting. Students read portions of a text aloud to the teacher and then they answer oral questions to gauge their comprehension of the text. The assessment measures students’ accuracy, fluency, comprehension, and current level of performance.
In grades 4-6, students participated in the Developmental Reading Assessment 2. Like the Fountas and Pinnell, students read portions of a text aloud to the teacher; however, in the DRA2 students write their answers to demonstrate their comprehension. Writing about their comprehension is a more cognitively demanding task than conveying it orally, and it more closely aligns with our expectations for our older read-ers. Washington Central has set standards for grade level performance on both assessments.
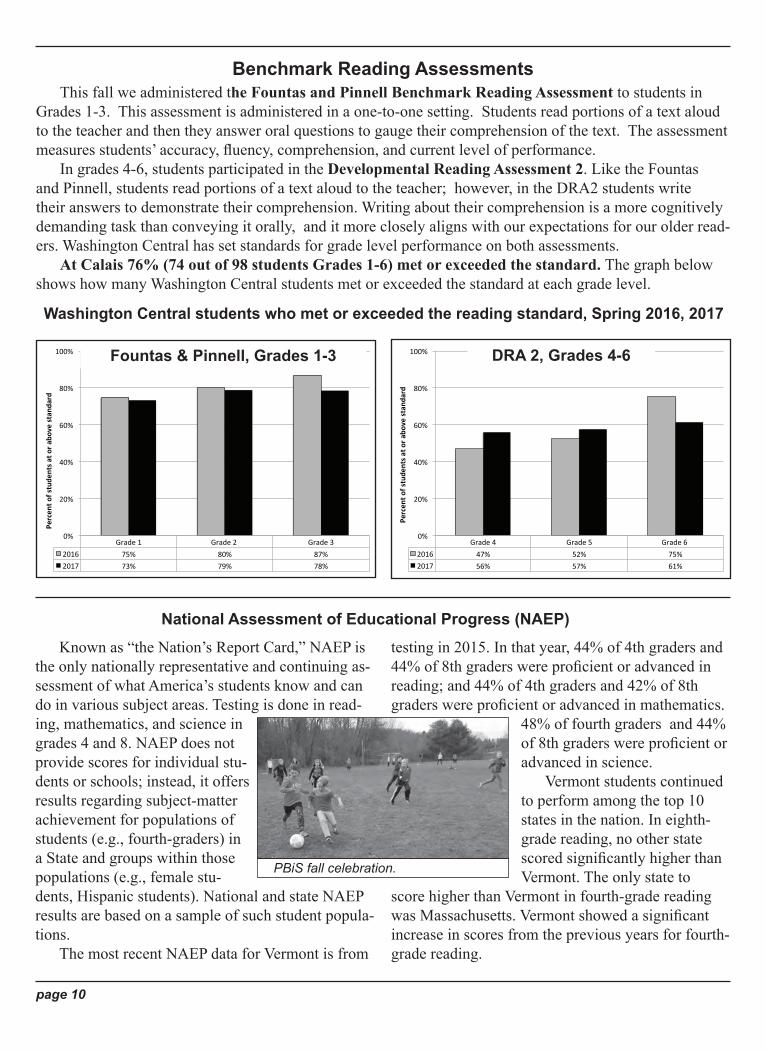
At Calais 76% (74 out of 98 students Grades 1-6) met or exceeded the standard. The graph below shows how many Washington Central students met or exceeded the standard at each grade level.
Benchmark Reading Assessments
PBiS fall celebration.
Washington Central students who met or exceeded the reading standard, Spring 2016, 2017
Grade4 Grade5 Grade62016 47% 52% 75%2017 56% 57% 61%
0%
20%
40%
60%
80%
100%
Percen
tofstude
ntsa
tora
bovestan
dard
Grade1 Grade2 Grade32016 75% 80% 87%2017 73% 79% 78%
0%
20%
40%
60%
80%
100%
Percen
tofstude
ntsa
tora
bovestan
dard
Fountas & Pinnell, Grades 1-3 DRA 2, Grades 4-6

School Report
Principal’s Message By Steven Dellinger-Pate, Principal
A public school community dedicated to excellence in teaching and learning.
page 11
continued on page 13
The 2016-2017 school year was another wonder-ful year, and I want to start by saying, “Thank you,” to the members of our five towns that make up the U-32 community. Thanks for your sup-port, through budgets, mentoring, and attendance at our school events. Our vision to cultivate passionate, creative and empowered learners who contrib-ute to their local and global community really exemplifies the values of our towns. Education tends to dominate a large part of the news and we hear the debates about spending, enrollment, and what kids need to know. Our vision, “to cultivate,” keeps us focused as a school community on what we know to be important. All our students are the responsibility of the entire community, and the long-term economic health of central Vermont depends on the students who graduate from U-32. We work to develop a growth mindset, which means we are open
to change while at the same time valuing the things that have helped us become what we are today. The support for the budget and the programs of U-32
ensures that every student can fulfill our collective vision.
During the past year, U-32 staff continued their work to implement a Proficiency-Based graduation system by focusing on three objectives: developing clear learning targets, providing high quality instruction and interventions, and measuring student progress with a comprehensive and balanced assessment system. Proficiency-based learning requires students to advance based on demonstration of skills and knowledge,
rather than on time spent in the classroom. Professional time has been devoted to these three objectives and our students and teachers continue

Student Information
U-32 Facts ◆ 27% of students are eligible for free or reduced lunch; ◆ In November 2016, 35 student musicians participated in the Winooski Valley Music Festival that was hosted by U-32; ◆ In February 2017, 16 students participated in the Winooski Valley Jazz Festival; ◆ In March 2017, 15 students participated in the VTAJE Jazz Festival; ◆ In March 2017, 8 students participated in the New England Music Festival; ◆ In April 2017, 35 students participated in the Middle School Winooski Valley Music Festival; ◆ In May 2017, 17 students participated in the All State Music & All State Jazz Festival; ◆ 66% of teachers have masters degrees and 75% of teachers have Level II licenses.
page 12
2012-13 2013-14 2014-15 2015-16 2016-17 current students 800 800 793 789 768 766
500
550
600
650
700
750
800
850
Health Services for the 2016-17 Year: ◆ There were 7,087 unscheduled student and staff visits to the school nurse for illness or injury. ◆ There were 1,436 total visits to the office for prescription medications and/or treatments. ◆ The Health Office conducted 250 vision screenings resulting in 26 vision referrals. ◆ There were 21 student and 11 staff incident reports generated out of the Health Office. ◆ The health office supported 52 off-campus field trips.
Source: Student Census, November, 2017
Life after High School2012 2013 2014 2015 2016 2017
# of Graduates 136 124 127 118 125 123% Attending College 68.38% 77% 54.3% 68.7% 66.4% 65% 2-Year % 16.18% 11% 7.1% 12.7% 13.6% 15.4% 4-Year % 52.21% 66% 47.2% 56% 52.8% 49.6%% Apprenticeship/Career Ed/Prep 2.94% 1.6% 4.7% .8% .8% 6.3%
% Employed 22.79% 12.1% 27.6% 19.5% 24% 24.2%% Military 1.47% .8% 2.4% 1.7% 3.2% 0.8%% Gap Year/Undeclared 4.41% 8.5% 11% 9.3% 5.6% 3.7%
Student Enrollment
Student Discipline:As reflected in our “Safe and Healthy Schools Data Collection” for 2016-2017, there were:
◆ 17 disciplinary actions for violations of the Drug & Alcohol Policy, and/or for violations of the Weapons Policy, and/or for threats/intimidation, fighting, or assault; ◆ 14 disciplinary actions for student conduct/policy violations; ◆ 16 incidents of harassment and/or bullying.
Cricket Liebermann, gr. 12
The Spitfire Grill production.

Principal’s Message from page 11
page 13
to grow in their understanding and implementation of a proficiency-based system. The change to a proficiency-based system has not come without struggle, and we continue to refine and enhance our work. Our belief in a growth mindset means that we will continue to work hard, develop good strategies and learn from the input we receive from others in order to provide the best education in Vermont. All in all, U-32 is committed to improving curriculum, instruction and assessment so our students can achieve at the highest levels and be prepared for the next stage of learning in their life.
Advanced Placement (AP) Test Results:76 students: 43 seniors, 29 juniors, 3 sophomores and 1 freshman took a total of 147 Advanced Placement (AP) tests in 10 different subject areas including English Lit/Comp, U.S. History, Calculus, Comp Science, Statistics, Biology, Chemistry, Physics C, French and Spanish. AP tests are scored on a scale of 1-5 with 5 being the highest possible score. A total of 22 students scored 5, 29 scored 4, 39 scored 3, 41 scored 2 and 16 scored 1.
The number of Student Dropouts: 2016-17 is too small to report. (10 or fewer)
2016-17: 90%*2015-16: 88%2014-15: 88%2013-14: 87%2012-13: 90%2011-12: 95% 2010-11: 94%
Four-Year Graduation Rate:
*preliminary
In early November, Stage 32 presented the acclaimed musical The Spitfire Grill, by James Valcz and Fred Alley, based on the movie filmed in the Northeast Kingdom of Vermont in 1996.
Inc. students sold all of the beautiful cutting boards they made!
U-32 School Board Members: Scott Thompson, Jonathan Goddard, Kari Bradley, Karen Bradley, Adrienne Magida. Not pictured: Carl Witke and George Gross.
Engineering Design Class students build robots that use pneumatics.

page 14
SBAC English Language Arts and Math, Grades 7, 8, & 11; 2016, 2017
U-32Gr.7 VTGr.7 U-32Gr.8 VTGr.8 U-32Gr.11 VTGr.112016 73% 58% 64% 59% 50% 57%2017 70% 55% 65% 55% 45% 58%
0%
10%
20%
30%
40%
50%
60%
70%
80%
90%
100%
Percen
tofstude
ntsa
tora
boveth
estan
dard
Assessments
The Smarter Balanced Assessment Consortium (SBAC) tests replaced Vermont’s previous assessment test, the NECAP (New England Common Assessment Program), in 2015. Vermont students in Grades 3-8 and 11 participated in SBAC testing for the third time in the spring of 2017. For more info, see page 6.
Reading and math are assessed in grades 3-8 and 11.
The graphs to the right compare the percent of U-32 students to the percent of students in Vermont meeting the standards in academic areas in 2016 and 2017. At U-32, 115 seventh grade students and 124 eighth grade students were tested in reading and math, 130 eleventh grade students were tested in reading, and 129 eleventh grade students were tested in math.
SBAC English Language Arts, Grades 7, 8, & 11, 2016, 2017
Female Male studentswithIEP noIEP economicallydisadvantaged
noteconomicallydisadvantaged
Grade7 80% 59% 77% 66% 72%
VT 62% 49% 11% 65% 40% 66%
0%
10%
20%
30%
40%
50%
60%
70%
80%
90%
100%
Percen
tofstude
ntsa
tora
bovestan
dard
SBAC Disaggregated Results, ELA, Grade 7, 2017
In the spring of 2017, 115 (97%)U-32 grade seven students took the SBAC test in ELA. 59 were female and 56 were male. 33 were identified as economically disadvantaged students. *The number of students with an IEP was too small to report on as was the number of ELL (English Language Learners), migrant students and the number of students disaggregated by race/ethnicity.
U-32Gr.7 VTGr.7 U-32Gr.8 VTGr.8 U-32Gr.11 VTGr.112016 35% 46% 36% 44% 34% 38%2017 43% 44% 33% 41% 28% 37%
0%
10%
20%
30%
40%
50%
60%
70%
80%
90%
100%
Percen
tofstude
ntsa
tora
boveth
estan
dard SBAC Math,
Grades 7, 8, & 11, 2016, 2017
*
Dakota Dunham, gr. 12

page 15
Female Male studentswithIEP noIEP economicallydisadvantaged
noteconomicallydisadvantaged
Grade7 42% 45% 48% 28% 50%
VT 43% 44% 8% 51% 29% 53%
0%
10%
20%
30%
40%
50%
60%
70%
80%
Percen
tofstude
ntsa
tora
bovestan
dard
SBAC Disaggregated Results, Math, Grade 7, 2017In the spring of 2017, 115 (97%) U-32 grade seven students took the SBAC test in Math. 59 were female and 56 were male. 33 were identified as economically disadvantaged students. *The number of students with an IEP was too small to report on as was the number of ELL (English Language Learners) and migrant students was too small to report on as was the number of students disaggregated by race/ethnicity.
Female Male studentswithIEP noIEP economicallydisadvantaged
noteconomicallydisadvantaged
Grade8 75% 55% 13% 77% 44% 71%
VT 65% 45% 12% 65% 39% 66%
0%
10%
20%
30%
40%
50%
60%
70%
80%
Percen
tofstude
ntsa
tora
bovestan
dard
SBAC Disaggregated Results, ELA, Grade 8, 2017 In the spring of 2017, 124 (98%) U-32 grade eight students took the SBAC test in ELA. 62 were female and 62 were male. 24 of the students had an IEP and 28 were identified as economically disadvantaged students. The number of ELL (English Language Learners) and migrant students was too small to report on as was the number of students disaggregated by race/ethnicity.
Female Male studentswithIEP noIEP economicallydisadvantaged
noteconomicallydisadvantaged
Grade8 30% 37% 41% 15% 39%
VT 45% 38% 6% 50% 28% 50%
0%
10%
20%
30%
40%
50%
60%
70%
80%
Percen
tofstude
ntsa
tora
bovestan
dard
SBAC Disaggregated Results, Math, Grade 8, 2017In the spring of 2017, 124 (98%) U-32 grade eight students took the SBAC test in Math. 62 were female and 62 were male. 28 were identified as economically disadvantaged students. *The number of students with an IEP was too small to report on as was the number of ELL (English Language Learners), migrant students and the number of students disaggregated by race/ethnicity.
*
*

U-32 Gr. 8 VT Gr. 8 U-32 Gr. 11 VT Gr. 11 2016 27% 22% 25% 30% 2017 31% 25% 29% 33%
0%
20%
40%
60%
80%
Per
cent
of s
tude
nts
at o
r abo
ve th
e st
anda
rd NECAP Science Grade 8,
Spring 2016, 2017
The graph to the left compares the percent of U-32 grade 8 and grade 11 students and Vermont students meeting the standards in science in 2016 and 2017.
110 (100%) grade 8 students took the NECAP test in science in the spring of 2016 and 122 (98%) grade 8 students took the NECAP test in science in the spring of 2017.
123 (98%) grade 11 students took the NECAP test in science in the spring of 2016 and 131 (98%) grade 11 students took the NECAP test in science in the spring of 2016.
The NECAP (New England Common Assessment Program) science test measures students’ academic knowledge and skills relative to Grade Expectations. Science is assessed in grades 8 and 11.
Female Male studentswithIEP noIEP economicallydisadvantaged
noteconomicallydisadvantaged
Grade11 49% 42% 6% 51% 34% 49%
VT 65% 53% 11% 66% 41% 64%
0%
10%
20%
30%
40%
50%
60%
70%
80%
Percen
tofstude
ntsa
tora
bovestan
dard
SBAC Disaggregated Results, ELA, Grade 11, 2017
Female Male studentswithIEP noIEP economically
disadvantaged
noteconomicallydisadvantaged
Grade11 33% 24% 32% 16% 32%VT 38% 36% 2% 43% 19% 43%
0%
10%
20%
30%
40%
50%
60%
70%
80%
Percen
tofstude
ntsa
tora
bovestan
dard
SBAC Disaggregated Results, Math, Grade 11, 2017
In the spring of 2017, 130 (94%) U-32 grade eleven students took the SBAC test in ELA. 57 were female and 73 were male. 16 of the students had an IEP and 32 were identified as economically disadvantaged students. The number of ELL (English Language Learners) and migrant students was too small to report on as was the number of students disaggregated by race/ethnicity.
In the spring of 2017, 129 (93%) U-32 grade eleven students took the SBAC test in Math. 57 were female and 72 were male. 32 were identified as economically disadvantaged students. *The number of students with an IEP was too small to report on as was the number of ELL (English Language Learners), migrant students and the number of students disaggregated by race/ethnicity.
page 16
NECAP Science, Grades 8, & 11; 2016, 2017
*

page 17
In the spring of 2017, 122 U-32 grade eight students took the NECAP test in science. 62 were female and 60 were male. 24 of the students had an IEP and 28 were identified as economically disadvantaged students. *The number of students with an IEP was too small to report on as was the number of ELL (English Language Learners), migrant students and the number of students disaggregated by race/ethnicity.
female male students with IEP no IEP economically
disadvantaged
not economically
disadvantaged 8th grade 28% 34% 39% 11% 37% VT 27% 23% 1% 29% 11% 32%
0%
20%
40%
60%
80%
Perc
ent o
f stu
dent
s at
or a
bove
sta
ndar
d NECAP Disaggregated Results, Science, Grade 8, 2017
female male students with IEP no IEP economically
disadvantaged
not economically
disadvantaged gr. 11 28% 29% 7% 31% 14% 32% VT 34% 31% 2% 37% 15% 40%
0%
10%
20%
30%
40%
50%
60%
70%
80%
Perc
ent o
f stu
dent
s at
or a
bove
sta
ndar
d
NECAP Disaggregated Results, Science, Grade 11, 2017 In the spring of 2017, 131
eleventh graders took the NECAP test in science. 57 were female and 75 were male. 15 of the students had an IEP and 28 of the students who took the science test were identified as economically disadvantaged students. The number of ELL (English Language Learners) and migrant students was too small to report on as was the number of students disaggregated by race/ethnicity.
Last spring each school dis-seminated a school climate survey to students, parents and staff members. The school climate survey contained
questions about issues such as school safety, communication,
expectations, meeting students’ and families’ needs, and relationships between students, staff, adminis-trators and families. Below are some of the results from U-32 Student Climate Survey.
School Climate DataWe celebrated growth in student perception on:
◆ 79% of students feel quality work is expected of them.
◆ 81% of students feel their TA cares about them
◆ Over 95% of all students believe that their families want them to do well and believe that they can.
◆ 86% of parents respect the school’s teachers.
◆ 97% of teachers believe that student achievement can increase through close personal relationships.
Forrest Spencer, gr. 12
*

page 18
Scholastic Aptitude Test (SAT)
■ U-32 students continue to score significantly higher than both the Vermont and national averages on the 3 SAT tests. ■ 62 members of the senior class took the SAT’s.
SAT Math U-32 Males
U-32 Females
U-32 Average All
Students
Vermont Average All
Students
National Average All
Students2015 548 541 544 524 511
2016 572 545 556 520 508
2017 573 586 579 551 533
SAT Critical Reading
U-32 Males
U-32 Females
U-32 Average All
Students
Vermont Average All
Students
National Average All
Students2015 546 566 557 523 4952016 572 552 560 520 4942017 578 598 588 562 538
SAT Writing
U-32 Males
U-32 Females
U-32 Average All
Students
Vermont Average All
Students
National Average All
Students2015 508 538 525 507 4842016 545 540 542 501 482*2017 28 29 29 28 27
ACT Information(Composite)
U-32 Vermont2015 22.5 23.52016 24.1 23.42017 24.8 23.6
Waylon Kurts, gr. 10
Branching Out Branching Out is a community based mentor-
ing program that complements a student’s regular course work at U-32. In this program, students explore learning by following their passion, design-ing their own curriculum and process which is then approved by a credit granting faculty committee. Branching Out staff then find mentors to support each stu-dent’s endeavor. Last year 27 stu-dents participated in this innovative standards-based program. Studies included: American Sign Language, Blacksmithing, Calligraphy, Equine Studies, Game Design, Graphic Novel, Grow Your Own Food, Gui-tar, Herbalism, The Human Body & Biotechnology, Industrial Design, Japanese, Latin, Mechanics, Medical Field, Music Composition, Photog-raphy, Plant Geography, Radiology, Sport Marketing, WWI Historical Fiction Novel.Branching Out Middle School, Community-Based Learning, and and Pilot Programs
Last year 31 students pursued studies in Branching Out Middle School, 39 students
participated in Community-Based Learning, and 19 students were in the Pilot Program.Vocational/Technical Education Programs
Last year 36 students attended Central Vermont Career Center. Their program areas included: Auto-motive Technology, Building Trades, Cosmetology,
Culinary, Digital Media, Electrical, Emergency Services, Exploratory Tech, Human Services, Natural Re-sources, Plumbing/HVAC. Last year 1 student attended Randolph Tech Center and studied LNA.Vermont Virtual Learning Cooperative (online courses)
Last year, 39 students completed and received U-32 graduation credit for their online courses. The subjects taken include: Algebra I, Algebra II, AP Art History, Beatles in Literature, Chemistry, Creative Writing, Earth
Space, English I, Forensic Science, Founda-tions of American Literature, Geometry, German I, Intro to Entrepreneurship, Literature & Language of Rulers, Personal Finance, Personal Fitness, Physics Honors, Poetry in American Literature, Psychology, Spanish I, Spanish II, US Government Honors.
Complementary Academic Programs
*score report changed

page 19
WCSU Student Learning Outcomes UpdateBy Kelly Bushey, Director of Special Services, Candy Chevalier, Technology Coordinator and
Jen Miller-Arsenault, Director of Curriculum, Instruction & AssessmentIn May 2016 the WCSU full school board adopted our Student Learning Outcomes. Student Learning
Outcomes articulate broadly what students need to know and be able to do in order to earn a U-32 diploma. Specifically:
Core knowledge of essential academic subjects, including:
✔Literacy ✔Mathematical Content and Practices ✔Scientific Inquiry and Content Knowledge ✔Global Citizenship ✔Physical Education and Health ✔Artistic Expression ✔Financial Literacy
Transferable skills and behaviors that prepare them for lifelong learning and success, including:
✔Creative and Practical Problem Solving ✔Effective and Expressive Communication ✔Engaged Citizenship ✔Working Independently and Collaboratively ✔ Informed, Integrated, and Critical Thinking ✔Self-Awareness and Self-Direction
In order to ensure that all students achieve proficiency in our Student Learning Outcomes, the Washington Central Leadership Team has articulated and is implementing a theory of action.
The Washington Central Leadership Team continues to collaborate in order to implement strategies focused on the three bedrocks of the theory of action--Clear Learning Targets, High Quality Instruction and Interventions, and a Com-prehensive and Balanced Assessment System--in a proficiency-based learning system.
The five components of a proficiency-based
learning system include curriculum, instruction, assessment, scoring, and reporting. We have articu-lated what our students need to know and be able to do from pre-kindergarten through high school gradu-ation in alignment with our WCSU Student Learning Outcomes, and we continue to assess their progress toward those expectations.
Most recently we have been focusing on our scoring and reporting practices. Families will notice that our reports are aligned with our Student Learn-ing Outcomes. We have also been working hard to ensure that our general education and special educa-
tion practices related to proficiency-based learn-ing are aligned with each other.
Each of us has a role to play in ensuring that all of our students achieve proficiency in our Student Learning Outcomes. Creating a coherent framework across the school sys-tem allows us to do our work as effectively and efficiently as possible in service to our students.
If we provide high quality instruction and interventions that are responsive to learners’ needs and interests, based on clear learning targets, and measured by a comprehensive and balanced assessment system, then we will close achievement gaps and ensure that all students achieve proficiency in our WCSU student learning outcomes.
WCSU students will meet or exceed rigorous standards for:
Doty Pre-K teacher Christina Strobridge and U-32 English teacher Jenn Ingersoll were named U-32 Teachers of the Year at a ceremony at the 37th Annual UVM Outstanding Teachers Day, October 12.

Check out our website at www.u32.org. It has links to our elementary schools and central office.
Please look inside for the U-32 Annual Budget Reportand your School Report
Budget VoteTuesday, March 6, 2018
By Australian Ballot in each town’s polling place
Budget Informational Meeting:
Monday, March 5, 6:00 pm
U-32 Room 131
930 Gallison Hill RoadMontpelier, VT 05602802-229-0321
Non-Profit OrganizationU.S. Postage Paid
Permit No. 61Montpelier, VT 05602