warm-mix asphalt study: test track construction and first
TRANSCRIPT
Stage 4 Distribution, June 19, 2009
PREPARED FOR: California Department of Transportation Division of Research and Innovation Office of Roadway Research
PREPARED BY:
University of California Pavement Research Center
UC Davis, UC Berkeley
July 2008Draft Report: UCPRC-RR-2008-11
WWWaaarrrmmm---MMMiiixxx AAAsssppphhhaaalllttt SSStttuuudddyyy::: TTTeeesssttt TTTrrraaaccckkk CCCooonnnssstttrrruuuccctttiiiooonnn aaannnddd FFFiiirrrsssttt---LLLeeevvveeelll AAAnnnaaalllyyysssiiisss ooofff PPPhhhaaassseee 111 HHHVVVSSS aaannnddd
LLLaaabbbooorrraaatttooorrryyy TTTeeessstttiiinnnggg
Authors:David Jones, Rongzong Wu, Bor-Wen Tsai,
Qing Lu, and John T. Harvey
Partnered Pavement Research Program (PPRC) Contract Strategic Plan Element 4:18: Warm-Mix Asphalt


Stage 4 Distribution, June 19, 2009
UCPRC-RR-2008-11 i
DOCUMENT RETRIEVAL PAGE Research Report: UCPRC-RR-2008-11
Title: Warm-Mix Asphalt Study: Test Track Construction and First-Level Analysis of Phase 1 HVS and Laboratory Testing
Authors: David Jones, Rongzong Wu, Bor-Wen Tsai, Qing Lu, and John T. Harvey
Prepared for: Caltrans
FHWA No:
Work submitted: December 18, 2008
DateJuly 2008
Strategic Plan Element No: 4.18
Status: Stage 4 Caltrans review draft
Version No.: 1
Abstract: This first-level report describes the first phase of a warm-mix asphalt study, which compares the performance of a control mix, produced and constructed at conventional hot-mix asphalt temperatures, with three mixes produced with warm-mix additives, produced and compacted at approximately 35°C (60°F) lower than the control. The additives tested included Advera WMA®, EvothermTM, and Sasobit®. The test track layout and design, mix design and production, and test track construction are discussed, as well as the results of Heavy Vehicle Simulator (HVS) and laboratory testing. Key findings from the study include: Adequate compaction can be achieved on warm-mixes at lower temperatures. Optimal compaction temperatures are likely to differ between the different warm-mix technologies. However, a
temperature reduction of at least 35°C (60°F) is possible. Based on the results of HVS testing, it is concluded that the use of any of the three warm-mix asphalt
technologies used in this experiment will not significantly influence the rutting performance of the mix. Laboratory moisture sensitivity testing indicated that all the mixes tested were potentially susceptible to moisture
damage. There was, however, no difference in the level of moisture sensitivity between the control mix and mixes with the additives assessed in this study.
Laboratory fatigue testing indicated that the warm-mix technologies used in this study will not influence the fatigue performance of a mix.
Quality control checks on the mix immediately after production revealed that lower specific gravities and higher air-void contents were recorded on the warm mixes.
The cost benefits of using the warm-mix technologies could not be assessed in this study due to the very small quantities produced.
The HVS and laboratory testing completed in this phase have provided no results to suggest that warm-mix technologies should not be used in California. Final recommendations on the use of this technology will only be made after further research and monitoring of full-scale pilot studies on in-service pavements is completed. Interim recommendations include: The use of warm-mix technologies should continue in full-scale pilot studies on in-service pavements. HVS testing to assess moisture sensitivity should continue to confirm the laboratory findings. Laboratory testing on laboratory-mixed, laboratory-compacted specimens should proceed to determine whether
representative mixes can be produced in the laboratory and to determine how and whether test results differ from field-mixed, field-compacted specimens.
Keywords: Warm-mix asphalt, WMA, accelerated pavement testing, Heavy Vehicle Simulator
Proposals for implementation: Continue with Phase 2 moisture sensitivity testing. Continue with implementation in pilot studies.
Related documents: Work plan, UCPRC-WP-2007-01.
Signatures:
D. Jones 1st Author
J. Harvey Technical Review
D. Spinner Editor
J. Harvey Principal Investigator
T.J. Holland Caltrans Contract Manager

Stage 4 Distribution, June 19, 2009
ii UCPRC-RR-2008-11

Stage 4 Distribution, June 19, 2009
UCPRC-RR-2008-11 iii
DISCLAIMER
The contents of this report reflect the views of the authors who are responsible for the facts and accuracy
of the data presented herein. The contents do not necessarily reflect the official views or policies of the
State of California or the Federal Highway Administration. This report does not constitute a standard,
specification, or regulation.
PROJECT OBJECTIVES
The objective of this project is to determine whether the use of additives to reduce the production and
construction temperatures of hot-mix asphalt influences performance of the mix. This will be achieved
through the following tasks:
1. Preparation of a workplan to guide the research;
2. Monitoring the construction of Heavy Vehicle Simulator (HVS) and in-service test sections;
3. Sampling of mix and mix components during asphalt concrete production and construction;
4. Trafficking of demarcated sections with the HVS in a series of tests to assess performance;
5. Conducting laboratory tests to identify comparable laboratory performance measures;
6. Monitoring the performance of in-service pilot sections; and
7. Preparation of first- and second-level analysis reports and a summary report detailing the
experiment and the findings.
This report covers Tasks 2, 3, 4, 5, and 7.

Stage 4 Distribution, June 19, 2009
iv UCPRC-RR-2008-11
ACKNOWLEDGEMENTS
The University of California Pavement Research Center acknowledges the following individuals and
organizations who contributed to the project:
Ms. Terrie Bressette, Ms. Cathrina Barros, Mr. Glenn Johnson, and Dr. Joe Holland, Caltrans
Mr. Mike Cook and Dr. Hongbin Xie, Graniterock Company
The management and staff, Graniterock Company and Pavex Construction
Ms. Annette Smith, PQ Corporation
Dr. Everett Crews, Meadwestvaco
Mr. John Shaw and Mr. Larry Michael, Sasol Wax Americas
Mr. Matthew Corrigan and Mr. Satish Bellaguti, Federal Highway Administration Turner Fairbanks
Highway Research Center

Stage 4 Distribution, June 19, 2009
UCPRC-RR-2008-11 v
EXECUTIVE SUMMARY
The first phase of a comprehensive study into the use of warm-mix asphalt has been completed for the
California Department of Transportation (Caltrans) by the University of California Pavement Research
Center (UCPRC). The study, based on a work plan approved by Caltrans, included the identification of an
appropriate site for the experiment, the design and construction of a test track, an accelerated loading test
using the Heavy Vehicle Simulator (HVS) to assess rutting behavior, and a series of laboratory tests on
specimens sampled from the test track. The objective of the study is to determine whether the use of
additives to reduce the production and construction temperatures of asphalt concrete influences
performance of the mix. The study compared the performance of a control mix, produced and constructed
at conventional hot-mix asphalt temperatures, with three warm-mixes, produced and compacted at
approximately 35°C (60°F) lower than the control. The additives tested included Advera WMA®,
Evotherm C5TM, and Sasobit®.
The test track is located at the Graniterock Company's A.R. Wilson Quarry and Asphalt Plant near
Aromas, California. The design and construction of the test track was a cooperative effort between
Caltrans, the UCPRC, Graniterock, and the three warm-mix technology suppliers. The test track is 80 m
by 8.0 m (262 ft by 26 ft) divided into four test sections (Control, Advera, Evotherm, and Sasobit). The
pavement structure consists of the existing subgrade/subbase material overlying bedrock, with 300 mm
(12 in.) of imported aggregate base, and two 60 mm (2.4 in.) lifts of asphalt concrete. A standard mix
design was used and no adjustments were made to accommodate the additives. Target production
temperatures for the Control mix were set at 155°C (310°F) and at 120°C (250°F) for the warm-mixes.
The test track was constructed in September 2007, using asphalt from the commercial asphalt mix plant at
the quarry. Specimens were removed from the test track for laboratory testing.
The first phase of Heavy Vehicle Simulator (HVS) testing commenced in October 2007 after a six-week
curing period and was completed in April 2008. This testing compared early rutting performance at
elevated temperatures (pavement temperature of 50°C at 50 mm [122°F at 2.0 in.]), using a 40 kN
(9,000 lb) load on a standard dual wheel configuration and a unidirectional trafficking mode. Laboratory
testing commenced in December 2007 and was completed in July 2008. The test program included shear
testing, wet and dry fatigue testing, Hamburg Wheel-Track testing, and determination of the wet-to-dry
tensile strength ratio. The results of this testing will be used to identify subsequent research needs.

Stage 4 Distribution, June 19, 2009
vi UCPRC-RR-2008-11
Key findings from the study include:
A Hveem mix design that met Caltrans requirements for Type A 19 mm maximum dense-graded
asphalt concrete was used in the study. The target gradation met Caltrans requirements for both the
Coarse and Medium gradations. The recommended bitumen content was 5.1 to 5.4 percent by mass
of aggregate, which was based on the minimum air-void content under standard kneading
compaction. The mix design had very high Hveem stabilities.
A consistent base-course was constructed on the test track using material produced at the nearby
quarry. Some overwatering occurred in the early stages of construction resulting in some moist
areas in the pavement, which influenced measured densities and deflections. These areas are
unlikely to effect later performance of the test track. The very stiff base is likely to complicate any
planned fatigue cracking experiments in that a very high number of HVS repetitions will likely be
required before any distress occurs.
Minimal asphalt plant modifications were required to accommodate the warm-mix additives.
No problems were noted with producing the asphalt mixes at the lower temperatures. The target
mix production temperatures (i.e., 155°C and 120°C [310°F and 250°F]) were achieved.
Although a PG 64-16 asphalt binder was specified in the work plan, subsequent tests by the Federal
Highway Administration indicated that the binder was rated as PG 64-22. This should not affect the
outcome of the experiment. After mixing Advera and Sasobit to the binder, the PG grading changed
from PG 64-22 to PG 70-22. The addition of Evotherm did not alter the PG grade.
The Control, Advera, and Evotherm mixes met the project mix design requirements. The binder
content of the Sasobit was 0.72 percent below the target binder content and 0.62 percent below the
lowest permissible binder content. This probably influenced performance and was taken into
consideration when interpreting the HVS and laboratory test results presented in this report.
Graniterock Company did not perform Hveem compaction or stability tests for quality control
purposes as there is no protocol for adjusting the standard kneading compaction temperature for
mixes with warm-mix additives. Instead, Marshall and Superpave Gyratory compaction were
performed in the Graniterock laboratory next to the asphalt plant on mix taken from the silo.
Laboratory quality control tests on the Control mix (specimens compacted with Marshall and
Superpave Gyratory compaction) had a higher specific gravity and lower air-void content,
compared to the mixes with additives. It is not clear whether this was a testing inconsistency or is
linked to the lower production and specimen preparation temperatures. This will need to be
investigated during Phase 2 laboratory investigations.
Moisture contents of the mixes with additives were notably higher than in the Control mix,
indicating that potentially less moisture will evaporate from the aggregate at lower production
temperatures. All mixes were, however, well within the minimum Caltrans-specified moisture

Stage 4 Distribution, June 19, 2009
UCPRC-RR-2008-11 vii
content level. Aggregate moisture contents will need to be controlled in the stockpiles and
maximum moisture contents may need to be set prior to mix production when using warm-mix
technologies.
Construction procedures and final pavement quality did not appear to be influenced by the lower
construction temperatures. The Advera mix showed no evidence of tenderness, and acceptable
compaction was achieved. Some tenderness was noted on the Evotherm and Sasobit sections
resulting in shearing under the rollers at various stages of breakdown and/or rubber-tired rolling,
indicating that the compaction temperatures were still higher than optimal. No problems were
observed after final rolling at lower temperatures.
Interviews with the paving crew after construction revealed that no problems were experienced
with construction at the lower temperatures. Improved working conditions were identified as an
advantage. Tenderness on the Evotherm and Sasobit sections was not considered as being
significantly different from that experienced with conventional mixes during normal construction
activities.
Although temperatures at the beginning of compaction on the warm-mix sections were
considerably lower than the Caltrans-specified limits, the temperatures recorded on completion of
compaction were within limits, indicating that the rate of temperature loss in the mixes with
additives was lower than that on the Control mix, as expected.
Some haze/smoke was evident on the Control mix during transfer of the mix from the truck to the
paver. No haze or smoke was observed on the mixes with additives.
Average air-void contents on the Control and Advera sections were 5.6 percent and 5.4 percent
respectively. Those on the Evotherm and Sasobit sections, which showed signs of tenderness
during rolling, were approximately 7.0 percent, with the caveat that the Sasobit mix binder content
was lower than the target while that for the Evotherm sections was not. Based on these
observations, it was concluded that adequate compaction can be achieved on warm-mixes at the
lower temperatures. Optimal compaction temperatures are likely to differ between the different
warm-mix technologies.
Skid resistance measurements indicated that the warm-mix additives tested do not influence the
skid resistance of an asphalt mix.
HVS trafficking on each of the four sections revealed that the duration of the embedment phases
(high early-rutting phase of typical two-phase rutting processes) on the Advera and Evotherm
sections were similar to the Control. However, the rut depths at the end of the embedment phases
on these two sections was slightly higher than the Control, which was attributed to less oxidation of
the binder during mix production at lower temperatures. Rutting behavior on the warm-mix
sections followed similar trends to the Control after the embedment phase. The performance of the

Stage 4 Distribution, June 19, 2009
viii UCPRC-RR-2008-11
Sasobit section could not be directly compared with the other three sections given that the binder
content of the mix was significantly lower.
Laboratory test results indicate that use of the warm-mix technologies assessed in this study does
not significantly influence the performance of the asphalt concrete when compared to control
specimens produced and compacted at conventional hot-mix asphalt temperatures. However,
moisture sensitivity testing indicated that all the mixes tested were potentially susceptible to
moisture damage. There was, however, no difference in the level of moisture sensitivity between
the Control mix and mixes with warm-mix additives.
The HVS and laboratory testing completed in this phase have provided no results to suggest that warm-
mix technologies should not be used in California. Final recommendations on the use of this technology
will only be made after further research and monitoring of full-scale pilot studies on in-service pavements
is completed. Interim recommendations include the following:
The use of warm-mix technologies should continue in full-scale pilot studies on in-service
pavements.
Although laboratory testing indicated that the warm-mix technologies assessed in this study did not
increase the moisture sensitivity of the mix, HVS testing to assess moisture sensitivity should
continue as recommended in the work plan to confirm these findings. Subsequent laboratory testing
of moisture sensitivity should assess a range of different aggregates given that all of the mixes
tested in this study where considered to be moisture sensitive.
Phase 2 laboratory testing on laboratory-mixed, laboratory-compacted specimens should proceed to
determine whether representative mixes can be produced in the laboratory and to determine how
and whether laboratory test results on these specimens differ from those on field-mixed, field-
compacted specimens.
As part of the Phase 2 laboratory study, protocols need to be developed for adjusting laboratory
specimen-preparation compaction temperatures for mixes with warm-mix additives. It is unlikely
that any national studies will develop these protocols for Hveem mix designs, which are still used
in California.
Stage 4 Distribution, June 19, 2009
UCPRC-RR-2008-11 ix
TABLE OF CONTENTS
EXECUTIVE SUMMARY .........................................................................................................................v LIST OF TABLES ................................................................................................................................... xiii LIST OF FIGURES ...................................................................................................................................xv LIST OF ABBREVIATIONS ............................................................................................................... xviii LIST OF TEST METHODS AND SPECIFICATIONS........................................................................xix CONVERSION FACTORS ......................................................................................................................xx 1. INTRODUCTION .............................................................................................................................1
1.1 Background ...............................................................................................................................1 1.2 Project Objectives......................................................................................................................1 1.3 Overall Project Organization.....................................................................................................2
1.3.1 Deliverables ..................................................................................................................4 1.4 Structure and Content of this Report .........................................................................................4 1.5 Measurement Units....................................................................................................................4 1.6 Terminology ..............................................................................................................................5
2. TEST TRACK LOCATION, DESIGN, AND CONSTRUCTION ...............................................7 2.1 Experiment Location .................................................................................................................7 2.2 Pavement Design.....................................................................................................................10
2.2.1 Layer Thickness ..........................................................................................................10 2.2.2 Mix Design..................................................................................................................11 2.2.3 Production and Construction Temperatures................................................................12
2.3 Test Track Layout ...................................................................................................................12 2.4 Test Track Preparation ............................................................................................................12 2.5 Base-Course Construction.......................................................................................................14
2.5.1 Equipment ...................................................................................................................14 2.5.2 Construction ................................................................................................................14 2.5.3 Instrumentation ...........................................................................................................15 2.5.4 Construction Quality Control......................................................................................16
2.6 Asphalt Concrete Production...................................................................................................25 2.6.1 Plant Modifications .....................................................................................................25 2.6.2 Mix Production ...........................................................................................................25 2.6.3 Quality Control ...........................................................................................................27
2.7 Asphalt Concrete Placement ...................................................................................................31 2.7.1 Placement ....................................................................................................................31 2.7.2 Instrumentation ...........................................................................................................38 2.7.3 Quality Control ...........................................................................................................39
2.8 Sampling..................................................................................................................................53 2.8.1 Samples for Laboratory-Mixed, Laboratory-Compacted Specimen Testing ..............53 2.8.2 Samples for Field-Mixed, Laboratory-Compacted Specimen Testing........................53 2.8.3 Field-Mixed, Field-Compacted Samples ....................................................................55
2.9 Construction Summary............................................................................................................55 3. TEST TRACK LAYOUT AND HVS TEST CRITERIA.............................................................59
3.1 Protocols..................................................................................................................................59 3.2 Test Track Layout ...................................................................................................................59 3.3 HVS Test Section Layout........................................................................................................59 3.4 Pavement Instrumentation and Monitoring Methods ..............................................................59 3.5 HVS Test Criteria ....................................................................................................................62
3.5.1 Test Section Failure Criteria .......................................................................................62 3.5.2 Environmental Conditions ..........................................................................................62 3.5.3 Test Duration...............................................................................................................62 3.5.4 Loading Program.........................................................................................................62

Stage 4 Distribution, June 19, 2009
x UCPRC-RR-2008-11
4. PHASE 1 HVS TEST DATA SUMMARY....................................................................................65 4.1 Introduction .............................................................................................................................65 4.2 Rainfall ....................................................................................................................................66 4.3 Section 600FD: Control..........................................................................................................67
4.3.1 Test Summary .............................................................................................................67 4.3.2 Outside Air Temperatures ...........................................................................................67 4.3.3 Air Temperatures in the Temperature Control Unit....................................................68 4.3.4 Temperatures in the Asphalt Concrete Layers ............................................................68 4.3.5 Permanent Surface Deformation (Rutting) .................................................................70 4.3.6 Visual Inspection.........................................................................................................72
4.4 Section 601FD: Advera ..........................................................................................................73 4.4.1 Test Summary .............................................................................................................73 4.4.2 Outside Air Temperatures ...........................................................................................74 4.4.3 Air Temperatures in the Temperature Control Unit....................................................74 4.4.4 Temperatures in the Asphalt Concrete Layers ............................................................75 4.4.5 Permanent Surface Deformation (Rutting) .................................................................76 4.4.6 Visual Inspection.........................................................................................................78
4.5 Section 602FD: Evotherm ......................................................................................................79 4.5.1 Test Summary .............................................................................................................79 4.5.2 Outside Air Temperatures ...........................................................................................79 4.5.3 Air Temperatures in the Temperature Control Unit....................................................80 4.5.4 Temperatures in the Asphalt Concrete Layers ............................................................80 4.5.5 Permanent Surface Deformation (Rutting) .................................................................82 4.5.6 Visual Inspection.........................................................................................................85
4.6 Section 603FD: Sasobit ..........................................................................................................85 4.6.1 Test Summary .............................................................................................................85 4.6.2 Outside Air Temperatures ...........................................................................................86 4.6.3 Air Temperatures in the Temperature Control Unit....................................................86 4.6.4 Temperatures in the Asphalt Concrete Layers ............................................................88 4.6.5 Permanent Surface Deformation (Rutting) .................................................................89 4.6.6 Visual Inspection.........................................................................................................89
4.7 Test Summary..........................................................................................................................92 5. PHASE 1 LABORATORY TEST DATA SUMMARY................................................................95
5.1 Experiment Design ..................................................................................................................95 5.1.1 Shear Testing...............................................................................................................95 5.1.2 Fatigue Testing............................................................................................................96 5.1.3 Moisture Sensitivity Testing .......................................................................................97
5.2 Test Results .............................................................................................................................97 5.2.1 Shear Tests ..................................................................................................................97 5.2.2 Resilient Shear Modulus (G).......................................................................................98 5.2.3 Fatigue Beam Tests ...................................................................................................102 5.2.4 Moisture Sensitivity: Hamburg Wheel-Track Test ..................................................112 5.2.5 Moisture Sensitivity: Tensile Strength Retained (TSR)...........................................119
5.3 Summary of Laboratory Testing Results...............................................................................121 6. CONCLUSIONS AND RECOMMENDATIONS.......................................................................123
6.1 Conclusions ...........................................................................................................................123 6.1.1 Comparative Energy Usage.......................................................................................125 6.1.2 Achieving Compaction Density at Lower Temperatures ..........................................125 6.1.3 Optimal Temperature Ranges for Warm-Mixes........................................................125 6.1.4 Cost Implications ......................................................................................................125 6.1.5 Rutting Performance .................................................................................................126 6.1.6 Moisture Sensitivity ..................................................................................................126 6.1.7 Fatigue Performance .................................................................................................126

Stage 4 Distribution, June 19, 2009
UCPRC-RR-2008-11 xi
6.1.8 Other Effects .............................................................................................................126 6.1.9 Rubberized and Open-Graded Mixes........................................................................126
6.2 Recommendations .................................................................................................................126 7. REFERENCES ..............................................................................................................................129 APPENDIX A: MIX DESIGN EXAMPLES .................................................................................131 APPENDIX B: BINDER COMPLIANCE CERTIFICATE........................................................137 APPENDIX C: FATIGUE BEAM SOAKING PROCEDURE ...................................................139

Stage 4 Distribution, June 19, 2009
xii UCPRC-RR-2008-11

Stage 4 Distribution, June 19, 2009
UCPRC-RR-2008-11 xiii
LIST OF TABLES
Table 2.1: Summary of Centerline DCP Survey........................................................................................ 10 Table 2.2: Key Mix Design Parameters ..................................................................................................... 12 Table 2.3: Summary of Base-Course Density Measurements after 7-day Dry Back................................. 19 Table 2.4: Summary of Base-Course Moisture Content Measurements after 7-day Dry Back ................. 19 Table 2.5: Summary of Base-Course LWD Measurements....................................................................... 22 Table 2.6: Summary of FWD Measurements on the Base-Course ............................................................ 23 Table 2.7: Summary of Mix Production Observations .............................................................................. 27 Table 2.8: Summary of Binder Performance-Grade Test Results.............................................................. 28 Table 2.9: Quality Control of Mix After Production ................................................................................. 29 Table 2.10: Strain Gauge Position Detail................................................................................................... 39 Table 2.11: Summary of Temperature Measurements............................................................................... 41 Table 2.12: Summary of Asphalt Concrete Density Measurements .......................................................... 47 Table 2.13: Summary of FWD Measurements .......................................................................................... 48 Table 2.14: Results of Skid Resistance Testing ......................................................................................... 52 Table 3.1: Test Duration for Phase 1 HVS Rutting Tests .......................................................................... 62 Table 3.2: Summary of HVS Loading Program ........................................................................................ 63 Table 4.1: 600FD: Temperature Summary for Air and Pavement............................................................ 69 Table 4.2: 601FD: Temperature Summary for Air and Pavement............................................................ 75 Table 4.3: 602FD: Temperature Summary for Air and Pavement............................................................ 81 Table 4.4: 603FD: Temperature Summary for Air and Pavement............................................................ 88 Table 5.1: Summary of Air-Void Contents of Shear Test Specimens ....................................................... 97 Table 5.2: Summary of Ln(G*) Master Curves ....................................................................................... 100 Table 5.3: Summary of Phase Angle Master Curves ............................................................................... 101 Table 5.4: Summary of Air-Void Contents of Fatigue Beam Specimens................................................ 103 Table 5.5: Summary of Air-Void Contents of Flexural Frequency Sweep Specimens ........................... 103 Table 5.6: Air-Void Content Comparison of Top and Bottom Lifts........................................................ 105 Table 5.7: Summary of Master Curves and Time-Temperature Relationships........................................ 109 Table 5.8: Air-Void Content of Hamburg Wheel-Track Test Specimens................................................ 113 Table 5.9: Test Result Summary of Average Rut Progression Curves .................................................... 118 Table 5.10: Test Result Summary of Maximum Rut Progression Curves ............................................... 118 Table 5.11: Air-Void Content of TSR Test Specimens ........................................................................... 119 Table 5.12: Summary of TSR Test Results.............................................................................................. 120

Stage 4 Distribution, June 19, 2009
xiv UCPRC-RR-2008-11

Stage 4 Distribution, June 19, 2009
UCPRC-RR-2008-11 xv
LIST OF FIGURES
Figure 2.1: General location of test track site............................................................................................... 7 Figure 2.2: Location of the test track site at the A.R. Wilson Quarry. ......................................................... 8 Figure 2.3: Site layout. ................................................................................................................................. 9 Figure 2.4: Site prior to construction............................................................................................................ 9 Figure 2.5: Pavement structure for warm-mix asphalt test sections........................................................... 11 Figure 2.6: Test track layout....................................................................................................................... 13 Figure 2.7: K-rail placement and subgrade/subbase preparation. .............................................................. 13 Figure 2.8: Base-course construction. ........................................................................................................ 14 Figure 2.9: Overwatering during base-course construction........................................................................ 15 Figure 2.10: Installation of moisture sensors. ............................................................................................ 16 Figure 2.11: Completed base-course showing tightly bound surface......................................................... 16 Figure 2.12: Isolated areas of distress on the base-course.......................................................................... 17 Figure 2.13: Base-course density and deflection measurement plan.......................................................... 18 Figure 2.14: Summary of average dry density (backscatter)...................................................................... 20 Figure 2.15: Summary of average dry density at various depths (probe)................................................... 20 Figure 2.16: Summary of moisture content at different depths (probe). .................................................... 21 Figure 2.17: Summary of average LWD deflection by section.................................................................. 22 Figure 2.18: Summary of LWD base-course deflection measurements (D1 geophone). ........................... 23 Figure 2.19: Summary of average FWD deflection by section. ................................................................. 24 Figure 2.20: Summary of FWD base-course deflection measurements (D1 geophone). ........................... 24 Figure 2.21: Summary of FWD subgrade deflection measurements (D6 geophone)................................. 25 Figure 2.22: Plant modifications for admixtures. ....................................................................................... 26 Figure 2.23: Advera supply system. ........................................................................................................... 26 Figure 2.24: Evotherm supply system. ....................................................................................................... 26 Figure 2.25: Sasobit mixing. ...................................................................................................................... 26 Figure 2.26: Water spray prior to priming.................................................................................................. 32 Figure 2.27: Prime application. .................................................................................................................. 32 Figure 2.28: Damage to prime by vehicle and foot traffic. ........................................................................ 32 Figure 2.29: Control: Placement of first lift of asphalt concrete. .............................................................. 33 Figure 2.30: Control: Pick up during rubber-tire rolling. .......................................................................... 34 Figure 2.31: Advera: Mix delivery, no haze.............................................................................................. 35 Figure 2.32: Advera: Surface after final rolling. ....................................................................................... 35 Figure 2.33: Evotherm: Damage behind paver.......................................................................................... 35 Figure 2.34: Evotherm: Damage repair. .................................................................................................... 35 Figure 2.35: Evotherm: Shear after rubber-tired roller.............................................................................. 36 Figure 2.36: Evotherm: Surface after final rolling. ................................................................................... 36 Figure 2.37: Sasobit: Shearing during breakdown rolling......................................................................... 36 Figure 2.38: Sasobit: Pick up during rubber-tire rolling. .......................................................................... 36 Figure 2.39: Sasobit: Surface after final rolling. ....................................................................................... 37 Figure 2.40: Sasobit: Shearing during final rolling. .................................................................................. 37 Figure 2.41: Tack coat application (Control). ............................................................................................ 37 Figure 2.42: Tack coat application (Sasobit).............................................................................................. 37 Figure 2.43: Strain gauge layout. ............................................................................................................... 39 Figure 2.44: Strain gauge covered with mix. ............................................................................................. 39 Figure 2.45: Summary of temperature measurements (first lift). ............................................................... 42 Figure 2.46: Summary of temperature measurements (second lift). .......................................................... 42 Figure 2.47: Thermal images of test track during construction.................................................................. 43 Figure 2.48: Asphalt concrete density measurement plan.......................................................................... 47 Figure 2.49: Summary of average deflection by section. ........................................................................... 48

Stage 4 Distribution, June 19, 2009
xvi UCPRC-RR-2008-11
Figure 2.50: Summary of Sensor-1 deflection measurements on asphalt concrete surface. ...................... 49 Figure 2.51: Summary of subbase/subgrade deflection measurements (D6 geophone)............................. 49 Figure 2.52: Caltrans Portable Skid Tester................................................................................................. 50 Figure 2.53: Dynamic Friction Tester. ....................................................................................................... 50 Figure 2.54: Circular Track Meter. ............................................................................................................ 50 Figure 2.55: Preparation of field-mixed, laboratory-compacted specimens. ............................................. 54 Figure 2.56: Test track sampling plan and sample removal. ...................................................................... 56 Figure 3.1: Layout of test track and HVS test sections. ............................................................................. 60 Figure 3.2: Phase 1 test section layout and location of thermocouples. ..................................................... 61 Figure 4.1: Illustration of maximum rut depth and average deformation of a leveled profile. .................. 65 Figure 4.2: Measured rainfall during Phase 1 HVS testing........................................................................ 66 Figure 4.3: 600FD: Load history. .............................................................................................................. 67 Figure 4.4: 600FD: Daily average outside air temperatures...................................................................... 68 Figure 4.5: 600FD: Daily average inside air temperatures........................................................................ 69 Figure 4.6: 600FD: Daily average temperatures at pavement surface and various depths........................ 70 Figure 4.7: 600FD: Profilometer cross section at various load repetitions. .............................................. 71 Figure 4.8: 600FD: Average maximum rut. .............................................................................................. 71 Figure 4.9: 600FD: Average deformation. ................................................................................................ 72 Figure 4.10: 600FD: Contour plot of permanent surface deformation at end of test. ............................... 72 Figure 4.11: 600FD: Section photograph at test completion..................................................................... 73 Figure 4.12: 601FD: Load history. ............................................................................................................ 73 Figure 4.13: 601FD: Daily average outside air temperatures.................................................................... 74 Figure 4.14: 601FD: Daily average inside air temperatures...................................................................... 75 Figure 4.15: 601FD: Daily average temperatures at pavement surface and various depths...................... 76 Figure 4.16: 601FD: Profilometer cross section at various load repetitions. ............................................ 77 Figure 4.17: 601FD: Average maximum rut. ............................................................................................ 77 Figure 4.18: 601FD: Average deformation. .............................................................................................. 78 Figure 4.19: 601FD: Contour plot of permanent surface deformation at end of test. ............................... 78 Figure 4.20 602FD: Load history. ............................................................................................................. 79 Figure 4.21: 602FD: Daily average outside air temperatures.................................................................... 80 Figure 4.22: 602FD: Daily average inside air temperatures...................................................................... 81 Figure 4.23: 602FD: Daily average temperatures at pavement surface and various depths...................... 82 Figure 4.24: 602FD: Profilometer cross section at various load repetitions. ............................................ 83 Figure 4.25: 602FD: Average maximum rut. ............................................................................................ 83 Figure 4.26: 602FD: Average deformation. .............................................................................................. 84 Figure 4.27: 602FD: Contour plot of permanent surface deformation at end of test. ............................... 84 Figure 4.28: 602FD: Section photographs at test completion. .................................................................. 85 Figure 4.29: 603FD: Load history. ............................................................................................................ 86 Figure 4.30: 603FD: Daily average outside air temperatures.................................................................... 87 Figure 4.31: 603FD: Daily average inside air temperatures...................................................................... 87 Figure 4.32: 603FD: Daily average temperatures at pavement surface and various depths...................... 88 Figure 4.33: 603FD: Profilometer cross section at various load repetitions. ............................................ 90 Figure 4.34: 603FD: Average maximum rut. ............................................................................................ 90 Figure 4.35: 603FD: Average deformation. .............................................................................................. 91 Figure 4.36: 603FD: Contour plot of permanent surface deformation at end of test. ............................... 91 Figure 4.37: Comparison of average maximum rut.................................................................................... 92 Figure 4.38: Comparison of average deformation...................................................................................... 93 Figure 5.1: Air-void contents of shear specimens. ..................................................................................... 98 Figure 5.2: Summary boxplots of resilient shear modulus......................................................................... 98 Figure 5.3: Summary boxplots of cycles to 5% permanent shear strain. ................................................... 99 Figure 5.4: Summary of shear complex modulus master curves.............................................................. 102 Figure 5.5: Summary of shear phase angle master curves. ...................................................................... 102 Figure 5.6: Summary boxplots of cumulative permanent shear strain at 5,000 cycles. ........................... 103

Stage 4 Distribution, June 19, 2009
UCPRC-RR-2008-11 xvii
Figure 5.7: Air-void contents of fatigue beam specimens (dry and wet). ................................................ 104 Figure 5.8: Air-void contents of flexural frequency sweep specimens (dry and wet).............................. 104 Figure 5.9: Summary boxplots of initial stiffness. ................................................................................... 105 Figure 5.10: Summary boxplots of initial phase angle............................................................................. 106 Figure 5.11: Summary boxplots of fatigue life. ....................................................................................... 107 Figure 5.12: Complex modulus (E*) master curves (dry). ....................................................................... 110 Figure 5.13: Temperature-shifting relationship (dry)............................................................................... 110 Figure 5.14: Complex modulus (E*) master curves (wet)........................................................................ 111 Figure 5.15: Temperature-shifting relationship (wet). ............................................................................. 111 Figure 5.16: Comparison of dry and wet complex modulus master curves. ............................................ 112 Figure 5.17: Maximum and average rut progression curves for Control and Advera specimens. ........... 114 Figure 5.18: Maximum and average rut progression curves for Evotherm and Sasobit specimens......... 115 Figure 5.19: Control mix specimens after Hamburg Wheel-Track Test. ................................................. 116 Figure 5.20: Advera specimens after Hamburg Wheel-Track Test.......................................................... 116 Figure 5.21: Evotherm specimens after Hamburg Wheel-Track Test...................................................... 117 Figure 5.22: Sasobit specimens after Hamburg Wheel-Track Test.......................................................... 117 Figure 5.23: Air-void content versus indirect tensile strength. ................................................................ 121

Stage 4 Distribution, June 19, 2009
xviii UCPRC-RR-2008-11
LIST OF ABBREVIATIONS
AASHTO American Association of State Highway and Transport Officials
ASTM American Society for Testing and Materials
Caltrans California Department of Transportation
CTM Circular Track Meter
DCP Dynamic Cone Penetrometer
DFT Dynamic Friction Tester
DGAC Dense-graded asphalt concrete
ESAL Equivalent standard axle load
FHWA Federal Highway Administration
FMFC Field-mixed, field-compacted
FMLC Field-mixed, laboratory-compacted
FWD Falling Weight Deflectometer
HMA Hot-mix asphalt
HVS Heavy Vehicle Simulator
IFI International Friction Index
LMLC Laboratory-mixed, laboratory-compacted
LWD Light Weight Deflectometer
MDD Multi-Depth Deflectometer
MPD Mean profile depth
PIARC International Association of Road Congresses
PPRC Partnered Pavement Research Center
RHMA-G Gap-graded rubberized hot-mix asphalt
RSD Road Surface Deflectometer
SN Skid number
SPE Strategic Plan Element
TSR Tensile strength retained
UCPRC University of California Pavement Research Center
WMA Warm-mix asphalt

Stage 4 Distribution, June 19, 2009
UCPRC-RR-2008-11 xix
LIST OF TEST METHODS AND SPECIFICATIONS
AASHTO M-320 Standard Specification for Performance Graded Asphalt Binder
AASHTO T-166 Bulk Specific Gravity of Compacted Asphalt Mixtures
AASHTO T-209 Theoretical Maximum Specific Gravity and Density of Bituminous Paving Mixtures
AASHTO T-245 Standard Method of Test for Resistance to Plastic Flow of Bituminous Mixtures
Using Marshall Apparatus
AASHTO T-275 Standard Method of Test for Bulk Specific Gravity of Compacted Bituminous
Mixtures Using Paraffin-Coated Specimens
AASHTO T-308 Standard Method of Test for Determining the Asphalt Binder Content of Hot Mix
Asphalt (HMA) by the Ignition Method
AASHTO T-320 Standard Method of Test for Determining the Permanent Shear Strain and Stiffness
of Asphalt Mixtures using the Superpave Shear Tester
AASHTO T-321 Flexural Controlled-Deformation Fatigue Test
AASHTO T-324 Standard Method of Test for Hamburg Wheel-Track Testing of Compacted Hot-Mix
Asphalt (HMA)
ASTM E 274-97 Standard Test Method for Skid Resistance of Paved Surfaces Using a Full-Scale Tire
ASTM E 1845-96 Standard Test Practice for Calculating Pavement Macrotexture Mean Profile Depth
ASTM E 1911-02 Standard Test Method for Measuring Paved Surface Frictional Properties Using the
Dynamic Friction Tester
ASTM E 1960-03 Standard Practice for Calculating International Friction Index of a Pavement Surface
ASTM E 2157-01 Standard Test Method for Measuring Pavement Macrotexture Properties Using the
Circular Track Meter
CT 342 Method of Test for Surface Skid Resistance with the California Portable Skid Tester
CT 366 Method of Test for Stabilometer Value
CT 371 Method of Test for Resistance of Compacted Bituminous Mixture to Moisture
Induced Damage

Stage 4 Distribution, June 19, 2009
xx UCPRC-RR-2008-11
CONVERSION FACTORS
SI* (MODERN METRIC) CONVERSION FACTORS
Symbol Convert From Convert To Symbol Conversion
LENGTH
mm millimeters inches in mm x 0.039
m meters feet ft m x 3.28
km kilometers mile mile km x 1.609
AREA
mm2 square millimeters square inches in2 mm2 x 0.0016
m2 square meters square feet ft2 m2 x 10.764
VOLUME
m3 cubic meters cubic feet ft3 m3 x 35.314
kg/m3 kilograms/cubic meter pounds/cubic feet lb/ft3 kg/m3 x 0.062
L liters gallons gal L x 0.264
L/m2 liters/square meter gallons/square yard gal/yd2 L/m2 x 0.221
MASS
kg kilograms pounds lb kg x 2.202
TEMPERATURE (exact degrees)
C Celsius Fahrenheit F °C x 1.8 + 32
FORCE and PRESSURE or STRESS
N newtons poundforce lbf N x 0.225
kPa kilopascals poundforce/square inch lbf/in2 kPa x 0.145
*SI is the symbol for the International System of Units. Appropriate rounding should be made to comply with Section 4 of ASTM E380.
(Revised March 2003)
Stage 4 Distribution, June 19, 2009
UCPRC-RR-2008-11 1
1. INTRODUCTION
1.1 Background
Warm-mix asphalt is a relatively new technology. It has been developed in response to needs for reduced
energy consumption and stack emissions during the production of asphalt concrete, lower placement
temperatures, improved workability, and better working conditions for plant and paving crews. Studies in
the United States and Europe indicate that significant reductions in production and placement
temperatures are possible (1,2).
Research initiatives on warm-mix asphalt are currently being conducted in a number of states, as well as
by the Federal Highway Administration and the National Center for Asphalt Technology. Accelerated
pavement testing experiments are being carried out on warm-mix asphalt in Ohio and Alabama.
The California Department of Transportation (Caltrans) has expressed interest in warm-mix asphalt with a
view to reducing stack emissions at plants, to allow longer haul distances between asphalt plants and
construction projects, to improve construction quality (especially during nighttime closures), and to extend
the annual period for paving. However, the use of warm-mix asphalt technology requires the addition of
an additive into the mix, and/or changes in production and construction procedures, specifically related to
temperature, which could influence the short- and long-term performance of the pavement. Therefore,
research is required to address a range of concerns related to these changes before statewide
implementation of the technology is approved.
1.2 Project Objectives
The research presented in this report is part of Partnered Pavement Research Center Strategic Plan
Element 4.18 (PPRC SPE 4.18), titled “Warm-Mix Asphalt Study,” undertaken for Caltrans by the
University of California Pavement Research Center (UCPRC). The objective of this project is to
determine whether the use of additives intended to reduce the production and construction temperatures of
asphalt concrete influence mix production processes, construction procedures, and the short-, medium-,
and/or long-term performance of hot-mix asphalt. The potential benefits of using the additives will also be
quantified. This is to be achieved through the following tasks:
Develop a detailed work plan (3) for Heavy Vehicle Simulator (HVS) and laboratory testing
(Completed in September 2007).

Stage 4 Distribution, June 19, 2009
2 UCPRC-RR-2008-11
Construct a test track (subgrade preparation, aggregate base-course, tack coat, and asphalt wearing
course) at the Graniterock A.R. Wilson quarry near Aromas, California, with four sections as
follows (Completed in September 2007):
1. Conventional dense-graded asphalt concrete (DGAC) mix. This will serve as the control
section.
2. DGAC warm-mix asphalt with Advera WMA® additive (referred to as Advera in this report).
3. DGAC warm-mix asphalt with Evotherm C5™ additive (referred to as Evotherm in this report).
4. DGAC warm-mix asphalt with Sasobit® additive (referred to as Sasobit in the report).
Identify and demarcate three HVS test sections on each section (Completed in September 2007).
Test each section with the HVS in separate phases, with later phases dependent on the outcome of
earlier phases and laboratory tests (Phase 1 completed in April 2008).
Carry out a series of laboratory tests to assess rutting and fatigue behavior (Phase 1 completed in
August 2008).
Prepare a series of reports describing the research.
Prepare recommendations for implementation.
If agreed upon by the stakeholders (Caltrans, Graniterock, warm-mix technology suppliers), the sequence
listed above or a subset of the sequence will be repeated for gap-graded rubberized asphalt concrete
(RHMA-G), and again for open-graded mixes.
Pilot studies with the technology on in-service pavements will also be supported as part of the study.
1.3 Overall Project Organization
This UCPRC project has been planned as a comprehensive study to be carried out in a series of phases,
with later phases dependent on the results of the initial phase. The planned testing phases include (3):
Phase 1 compares early rutting potential at elevated temperatures (pavement temperature of 50°C at
50 mm [122°F at 2.0 in]). HVS trafficking would begin approximately 30 days after construction. Cores
and beams sawn from the sections immediately after construction would be subjected to shear, fatigue,
and moisture sensitivity testing in the laboratory. If the warm-mix asphalt concrete mixes perform
differently to the conventional mixes, moisture sensitivity, additional rutting, and fatigue testing with the
HVS would be considered (Phases 2, 3 and 4).
Depending on the outcome of laboratory testing for moisture sensitivity, a testing phase, if deemed
necessary, would assess general performance under dry and wet conditions with special emphasis
on moisture sensitivity.

Stage 4 Distribution, June 19, 2009
UCPRC-RR-2008-11 3
Depending on the outcome of laboratory testing for rutting, a testing phase, if deemed necessary,
would assess rutting performance on artificially aged test sections at elevated temperatures (50°C at
50 mm [122°F at 2.0 in.]). The actual process used to artificially age the sections has not been
finalized, but it would probably follow a protocol developed by the Florida Department of
Transport Accelerated Pavement Testing program, which uses a combination of infrared and
ultraviolet radiation.
Depending on the outcome of the laboratory study for fatigue, a testing phase, if deemed necessary,
would assess fatigue performance at low temperatures (15°C at 50 mm [59°F at 2.0 in.]).
Depending on the outcome of the above testing phases and if agreed upon by the stakeholders
(Caltrans, Graniterock, warm-mix technology suppliers), the sequence listed above or a subset of
the sequence would be repeated for gap-graded rubberized asphalt concrete (RHMA-G), and again
for open-graded mixes.
This test plan is designed to evaluate short-, medium-, and long-term performance of the mixes.
Short-term performance is defined as failure by rutting of the asphalt-bound materials.
Medium-term performance is defined as failure caused by moisture and/or construction-related
issues.
Long-term performance is defined as failure from fatigue cracking, reflective cracking, or rutting of
the asphalt-bound and/or unbound pavement layers.
The questions that will be answered during the evaluation include (3):
What is the approximate comparative energy usage during mix preparation? This will be
determined from the asphalt plant records/observations.
Can satisfactory density be achieved at lower temperatures? This will be established from
construction monitoring and subsequent laboratory tests.
What is the optimal temperature range for achieving compaction requirements? This will be
established from construction monitoring and subsequent laboratory tests.
What are the cost implications? These will be determined with a basic cost analysis.
Does the use of the additive influence rutting performance of the mix? This will be determined from
Phase 1 HVS and laboratory tests.
Is the treated mix more susceptible to moisture sensitivity given that the aggregate is heated to
lower temperatures? This will be determined from Phase 1 laboratory tests and possible additional
laboratory and HVS testing.
Does the use of the additive influence fatigue performance? This will be determined from Phase 1
laboratory tests and potential additional laboratory and HVS testing.

Stage 4 Distribution, June 19, 2009
4 UCPRC-RR-2008-11
Does the use of the additive influence the performance of the mix in any other way? This will be
determined from HVS and laboratory tests (all phases).
If the experiment is extended to rubberized and open-graded mixes, are the benefits of using the
additives in these mixes the same as for conventional mixes?
1.3.1 Deliverables
Deliverables from the study will include:
A detailed work plan for the entire study;
A report detailing construction, first level-data analysis of the Phase 1 HVS testing, first-level data
analysis of the Phase 1 laboratory testing, and preliminary recommendations (this report);
Reports detailing the first-level data analyses of subsequent HVS and laboratory testing phases;
A detailed 2nd level analysis report for the entire study; and
A summary report for the entire study.
A series of conference and journal papers documenting various components of the study will also be
prepared.
1.4 Structure and Content of this Report
This report presents an overview of the work carried out in Phase 1 to begin meeting the objectives of the
study, and is organized as follows:
Chapter 2 summarizes the HVS test track location, design, and construction.
Chapter 3 details the HVS test section layout and HVS test criteria.
Chapter 4 provides a summary of the Phase 1 HVS test data collected from each test.
Chapter 5 discusses the Phase 1 laboratory testing on field-mixed, field-compacted (FMFC)
specimens sampled from the test track.
Chapter 6 provides conclusions and preliminary recommendations.
1.5 Measurement Units
Although Caltrans has recently returned to the use of U.S. standard measurement units, metric units have
always been used by the UCPRC in the design and layout of HVS test tracks, and for laboratory and field
measurements and data storage. In this report, metric and English units (provided in parentheses after the
metric units) are provided in general discussion. In keeping with convention, only metric units are used in
HVS and laboratory data analyses and reporting. A conversion table is provided on Page xxi at the
beginning of this report.

Stage 4 Distribution, June 19, 2009
UCPRC-RR-2008-11 5
1.6 Terminology
The term “asphalt concrete” is used in this report as a general descriptor for the surfacing on the test track.
The terms “hot-mix asphalt (HMA)” and “warm-mix asphalt (WMA)” are used as descriptors to
differentiate between the two technologies discussed in this study.

Stage 4 Distribution, June 19, 2009
6 UCPRC-RR-2008-11

Stage 4 Distribution, June 19, 2009
UCPRC-RR-2008-11 7
2. TEST TRACK LOCATION, DESIGN, AND CONSTRUCTION
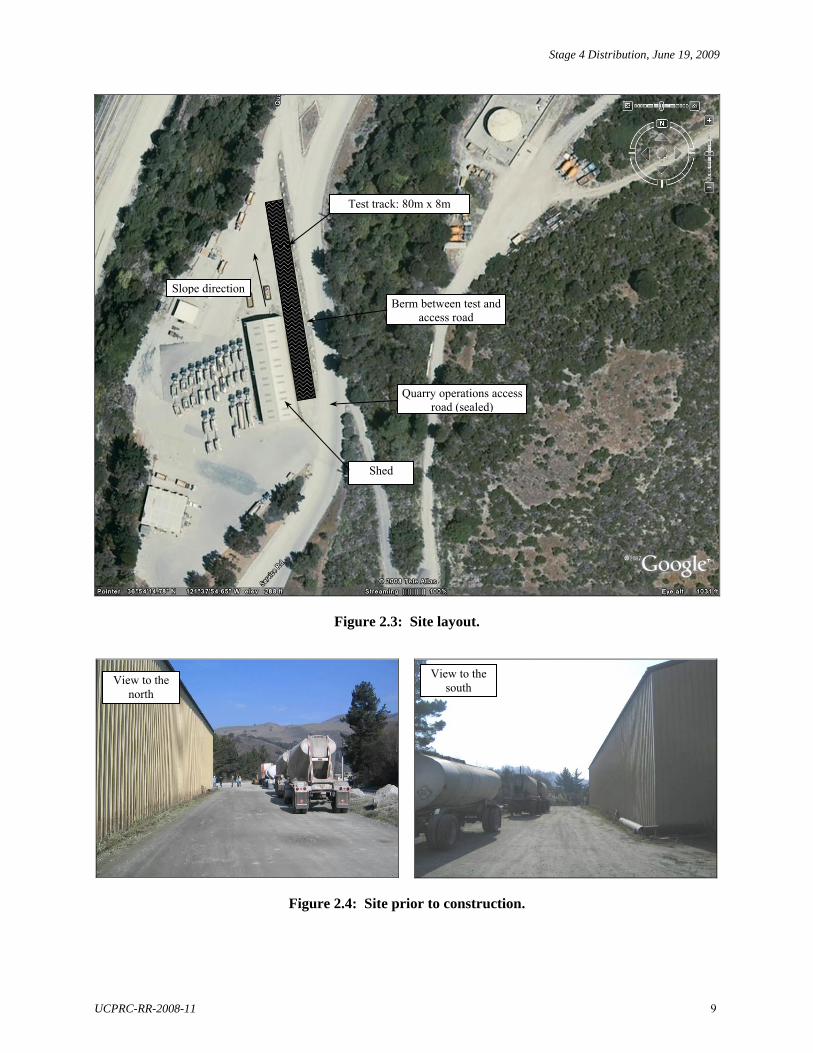
2.1 Experiment Location
The experiment is located on a service road at the Graniterock Company’s A.R. Wilson Quarry near
Aromas, California. Images of the site are shown in Figure 2.1 through Figure 2.4.
Figure 2.1: General location of test track site.
Graniterock AR Wilson Quarry and AC plant

Stage 4 Distribution, June 19, 2009
8 UCPRC-RR-2008-11
Figure 2.2: Location of the test track site at the A.R. Wilson Quarry.
Test track site
Quarry operations
AC plant
Quarry pit
Access road
Stage 4 Distribution, June 19, 2009
UCPRC-RR-2008-11 9
Figure 2.3: Site layout.
Figure 2.4: Site prior to construction.
View to the north
View to the south
Test track: 80m x 8m
Shed
Quarry operations access road (sealed)
Berm between test and access road
Slope direction

Stage 4 Distribution, June 19, 2009
10 UCPRC-RR-2008-11
2.2 Pavement Design
2.2.1 Layer Thickness
Dynamic Cone Penetrometer (DCP) tests were performed over the length and width of the proposed test
section location prior to construction to obtain an indication of the subgrade thickness and strength.
Results of the centerline measurements are summarized in Table 2.1. The results indicate an irregular
thickness of imported material and overburden over bedrock. DCP penetration to 800 mm (32 in.) was
achieved at the southern end of the section, indicating a relatively thick cover over the bedrock. This
decreased comparatively uniformly northwards along the length of the section, with a penetration of only
200 mm at the northern end of the section. The DCP-determined strength of the upper layer of material
was similar at the various points tested along the length of the section.
Table 2.1: Summary of Centerline DCP Survey
Test Location1 (m)
Penetration Depth (mm)
Penetration Rate in Top 250 mm (mm/blow)
10 20 30 40 50 60 70 80
800 680 590 490 380 300 240 200
2.5 2.5 2.7 2.6 2.4 2.4 2.3 2.4
1 Measured from southern end of section.
A sensitivity analysis of potential pavement designs using layer elastic theory models was carried out
using the DCP results obtained during the site investigation and estimates, based on previous experience,
of the moduli of an aggregate base-course and asphalt concrete surfacing. Components of the sensitivity
analysis included the following 24 cells:
Three asphalt concrete thicknesses (100 mm, 125 mm, and 150 mm)
Three asphalt concrete moduli (600 MPa, 1,000 MPa, and 3,000 MPa)
Two base-course thicknesses (300 mm and 450 mm)
Two base-course moduli (150 MPa and 300 MPa)
One subbase (existing layer, 250 mm with modulus of 400 MPa)
One subgrade (existing bedrock with modulus of >3,000 MPa).
A test pavement design was selected to maximize the information that would be collected about the
performance of warm-mix asphalt, taking into consideration that a very strong pavement would lengthen
the testing time before results (and an understanding of the behavior) could be obtained, while a very
weak pavement could fail before any useful data was collected. The pavement design shown in Figure 2.5
was considered appropriate for the study.

Stage 4 Distribution, June 19, 2009
UCPRC-RR-2008-11 11
Layer: DGAC Thickness: 2 x 60 mm = 120 mm (4.7 in) Modulus: 1,000 MPa
Layer: Imported Class 2 Aggregate Base-Course Thickness: 300 mm (12 in) Modulus: 150 MPa
Layer: Existing Subbase Thickness: 250 mm (10 in) Modulus: 400 MPa
Layer: Bedrock Thickness: Semi-infinite Modulus: >3,000 MPa
Figure 2.5: Pavement structure for warm-mix asphalt test sections.
2.2.2 Mix Design
A standard Graniterock Company mix design that meets specifications for “Type-A Asphalt Concrete
19 mm Coarse requirements” (similar to the example shown in Appendix A) was used in this study. This
mix design differs slightly from the example mix designs provided by Caltrans (example also shown in
Appendix A) that were included in the study work plan (3). The Graniterock mix design has been
extensively used on projects in the vicinity of the asphalt plant. Although these mix designs list PG 64-10
binder, the Valero Asphalt Plant in Benicia, California, from which the binder was sourced, generally only
supplies PG 64-16. This binder, however, also satisfies the requirements for the PG 64-10 grading. The
Hveem-type mix design was not adjusted for accommodation of the warm-mix additives. Key parameters
for the mix design are summarized in Table 2.2.
Aggregates
Aggregates for the base and asphalt concrete were sourced from the Graniterock Company’s nearby
A.R Wilson Quarry. This granitic aggregate is classified as a hornblende gabbro of the Cretaceous Age
and is composed of feldspar, quartz, small quantities of mica or hornblende, minor accessory minerals and
lesser amounts of dark ferromagnesium materials. It is quarried from a narrowly exposed mass of plutonic
rock close to the test track. Key aggregate parameters are provided in Table 2.2.
Warm-Mix Additive Application Rates
The warm-mix additive application rates were determined by the additive suppliers and were as follows:
Advera: 0.25 percent by mass of mix (equates to 4.8 percent by mass of binder)
Evotherm: 0.5 percent by mass of binder
Sasobit: 1.5 percent by mass of binder
Stage 4 Distribution, June 19, 2009
12 UCPRC-RR-2008-11
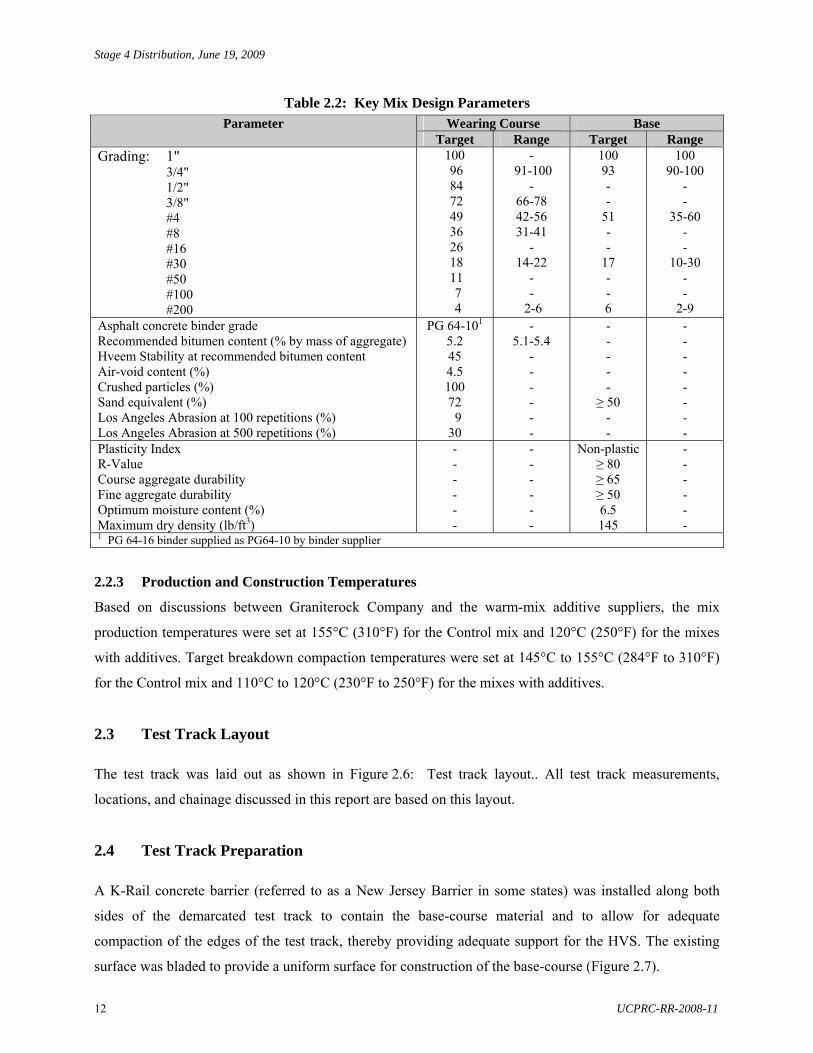
Table 2.2: Key Mix Design Parameters Wearing Course Base Parameter
Target Range Target Range Grading: 1" 3/4" 1/2" 3/8" #4 #8 #16 #30 #50 #100 #200
100 96 84 72 49 36 26 18 11 7 4
- 91-100
- 66-78 42-56 31-41
- 14-22
- -
2-6
100 93 - -
51 - -
17 - - 6
100 90-100
- -
35-60 - -
10-30 - -
2-9 Asphalt concrete binder grade Recommended bitumen content (% by mass of aggregate) Hveem Stability at recommended bitumen content Air-void content (%) Crushed particles (%) Sand equivalent (%) Los Angeles Abrasion at 100 repetitions (%) Los Angeles Abrasion at 500 repetitions (%)
PG 64-101
5.2 45 4.5 100 72 9 30
- 5.1-5.4
- - - - - -
- - - - -
≥ 50 - -
- - - - - - - -
Plasticity Index R-Value Course aggregate durability Fine aggregate durability Optimum moisture content (%) Maximum dry density (lb/ft3)
- - - - - -
- - - - - -
Non-plastic ≥ 80 ≥ 65 ≥ 50 6.5 145
- - - - - -
1 PG 64-16 binder supplied as PG64-10 by binder supplier
2.2.3 Production and Construction Temperatures
Based on discussions between Graniterock Company and the warm-mix additive suppliers, the mix
production temperatures were set at 155°C (310°F) for the Control mix and 120°C (250°F) for the mixes
with additives. Target breakdown compaction temperatures were set at 145°C to 155°C (284°F to 310°F)
for the Control mix and 110°C to 120°C (230°F to 250°F) for the mixes with additives.
2.3 Test Track Layout
The test track was laid out as shown in Figure 2.6: Test track layout.. All test track measurements,
locations, and chainage discussed in this report are based on this layout.
2.4 Test Track Preparation
A K-Rail concrete barrier (referred to as a New Jersey Barrier in some states) was installed along both
sides of the demarcated test track to contain the base-course material and to allow for adequate
compaction of the edges of the test track, thereby providing adequate support for the HVS. The existing
surface was bladed to provide a uniform surface for construction of the base-course (Figure 2.7).

Stage 4 Distribution, June 19, 2009
UCPRC-RR-2008-11 13
0m (y=0) 2m (y=2) 4m (y=4) 6m (y=6) 8m 0m
Evotherm
Control
10m
20m
30m
Sh
ed
40m
50m
60m
70m
Sasobit
Advera
80m 0m (y=0) 2m (y=2) 4m (y=4) 6m (y=6) 8m
Figure 2.6: Test track layout.
Figure 2.7: K-rail placement and subgrade/subbase preparation.

Stage 4 Distribution, June 19, 2009
14 UCPRC-RR-2008-11
2.5 Base-Course Construction
2.5.1 Equipment
The following equipment was used during the construction of the base-course:
Caterpillar 140H grader
Ingersoll Rand SD100-D steel-wheel vibrating roller
Sakai SW320 steel-wheel vibrating roller
15,000 L water tanker
Dump trucks with trailers (bottom dump)
John Deere 210 LE skip loader
2.5.2 Construction
The test track base-course was constructed on August 17, 2007. Crushed base-course material (granitic)
meeting Caltrans Class-2 aggregate base-course specifications was imported from a nearby quarry
stockpile with a fleet of bottom-dump trucks and trailers. Material was dumped in windrows, spread with
the grader, watered, and compacted (steel-wheel roller with vibration) in a series of lifts until the desired
300 mm (12 in.) thickness was achieved (Figure 2.8). A total of 23 loads were dumped. Some early
overwatering was observed, which influenced compaction procedures (Figure 2.9). Thereafter, the water
tanker was more strictly controlled to prevent further occurrences. Dry material was placed over the
affected areas to absorb excess moisture.
Final levels were checked with a rod-and-level survey to ensure that a consistent base-course thickness
had been achieved.
Figure 2.8: Base-course construction.

Stage 4 Distribution, June 19, 2009
UCPRC-RR-2008-11 15
Figure 2.8: Base-course construction (continued).
Figure 2.9: Overwatering during base-course construction.
2.5.3 Instrumentation
Instrumentation in the base-course was limited to four moisture sensors (ESI Gro-PointTM) for monitoring
its moisture contents during the experiment. Given the proximity of the bedrock, Multi-depth
Deflectometers (MDD) were not considered. Two transverse trenches were excavated into the base-course
at 20 m and 60 m (66 ft and 197 ft) respectively along the test track to accommodate the four moisture
sensors (Figure 2.10). The excavated material was replaced after installation and compacted to the level of
the finished base-course surface.

Stage 4 Distribution, June 19, 2009
16 UCPRC-RR-2008-11
Figure 2.10: Installation of moisture sensors.
2.5.4 Construction Quality Control
The base-course was inspected on August 22, 2007 after a seven-day dry back period. The surface was
generally acceptable (Figure 2.11), but some isolated areas of loose material, segregated material,
shearing, and delamination were observed (Figure 2.12). Some settlement was also noted in the immediate
proximity of the backfilled moisture sensor trenches.
Figure 2.11: Completed base-course showing tightly bound surface.

Stage 4 Distribution, June 19, 2009
UCPRC-RR-2008-11 17
Loose surface/raveling
Segregation/raveling
Figure 2.12: Isolated areas of distress on the base-course.
These localized problems were corrected by spraying the surface with water and then rolling with a
smooth drum roller (no vibration) to seal it.
After final rolling, density and deflection measurements were taken on the prepared surface to assess
compaction levels, uniformity, and structural integrity. Density was determined with a nuclear density
gauge, while deflection was measured with a Light Weight Deflectometer (LWD) and Falling Weight
Deflectometer (FWD). The plans shown in Figure 2.13 were followed for these measurements.
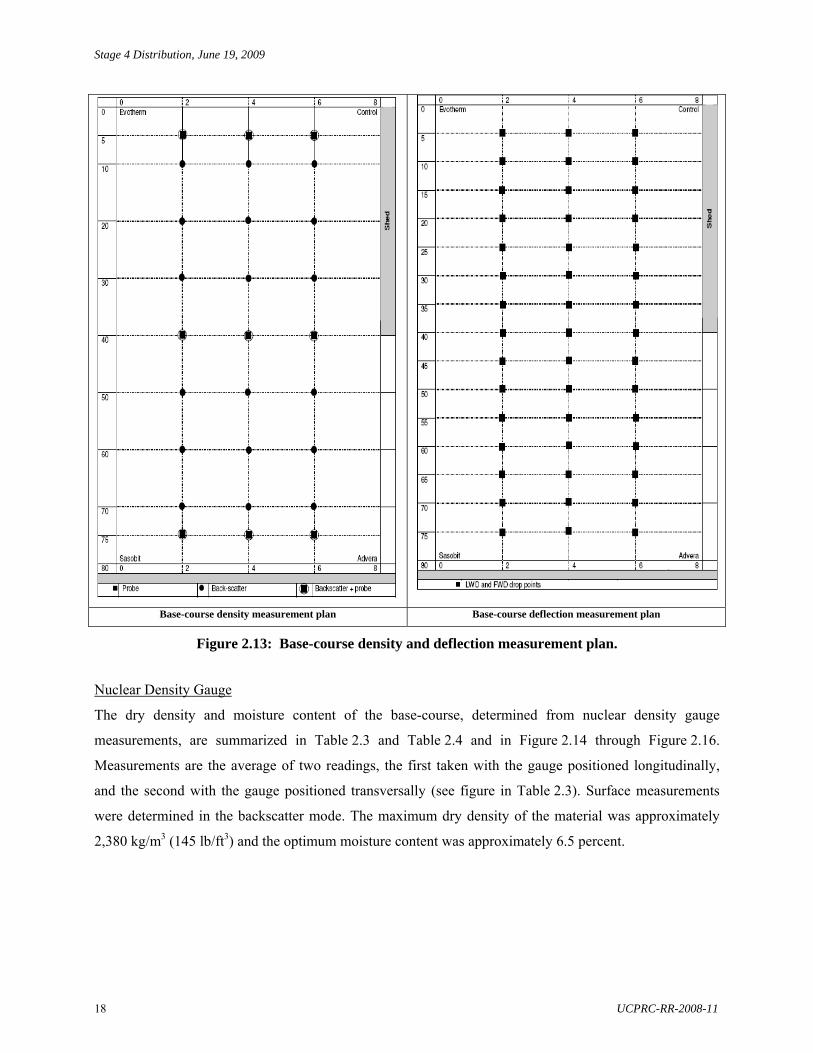
Stage 4 Distribution, June 19, 2009
18 UCPRC-RR-2008-11
Base-course density measurement plan Base-course deflection measurement plan
Figure 2.13: Base-course density and deflection measurement plan.
Nuclear Density Gauge
The dry density and moisture content of the base-course, determined from nuclear density gauge
measurements, are summarized in Table 2.3 and Table 2.4 and in Figure 2.14 through Figure 2.16.
Measurements are the average of two readings, the first taken with the gauge positioned longitudinally,
and the second with the gauge positioned transversally (see figure in Table 2.3). Surface measurements
were determined in the backscatter mode. The maximum dry density of the material was approximately
2,380 kg/m3 (145 lb/ft3) and the optimum moisture content was approximately 6.5 percent.

Stage 4 Distribution, June 19, 2009
UCPRC-RR-2008-11 19
Table 2.3: Summary of Base-Course Density Measurements after 7-day Dry Back Dry Density (kg/m3)* Along Test Track Location Depth
(mm) 5 m 10 m 20 m 30 m 40 m 50 m 60 m 70 m 75 m y=2 Surface
50 100 150 200
2,318 2,325 2,310 2,313 2,311
2,273 - - - -
2,318 - - - -
2,349 - - - -
2,428 2,377 2,376 2,268 2,443
2,386 - - - -
2,192 - - - -
2,369 - - - -
2,155 2,260 2,268 2,288 2,336
y=4 Surface 50
100 150 200
2,217 2,289 2,288 2,303 2,291
2,308 - -- -- --
2,232 - - - -
2,420 - - - -
2,371 2,294 2,375 2,354 2,373
2,322 - - - -
2,294 - - - -
2,390 - - - --
2,276 2,300 2,299 2,345 2,378
y=6 Surface 50
100 150 200
2,346 2,287 2,294 2,328 2,348
2,262 - - - -
2,165 - - - -
2,371 - - - -
2,289 2,289 2,323 2,396 2,383
2,225 - - - -
2,174 - - - -
2,295 - - - -
2,289 2,275 2,292 2,355 2,336
* Measurements are an average of two measurements taken from two gauge positions (orientations), A and B, as shown in figure.
Table 2.4: Summary of Base-Course Moisture Content Measurements after 7-day Dry Back
Moisture Content (%) Location Depth (mm) 5 m 40 m 75 m
y=2 50 100 150 200
4.2 4.4 4.2 4.4
4.2 4.3 4.1 4.5
4.6 4.7 4.5 4.3
y=4 50 100 150 200
4.9 5.2 5.0 4.8
5.7 5.4 5.5 5.4
6.3 6.2 6.1 6.1
y=6 50 100 150 200
4.3 4.2 4.4 4.2
4.3 4.1 4.1 3.9
4.3 4.2 4.0 4.3
y
B
A

Stage 4 Distribution, June 19, 2009
20 UCPRC-RR-2008-11
2000
2050
2100
2150
2200
2250
2300
2350
2400
2450
5 10 20 30 40 50 60 70 75
Chainage (m)
Dry
Den
sity
(kg
/m3
)
y=2 y=4 y=6
Figure 2.14: Summary of average dry density (backscatter).
2150
2200
2250
2300
2350
2400
2450
2500
5 40 75
Chainage (m)
Dry
De
ns
ity
(k
g/m
3)
y=2 50mm y=2 100mm y=2 150mm y=2 200mmy=4 50mm y=4 100mm y=4 150mm y=4 200mmy=6 50mm y=6 100mm y=6 150mm y=6 200mm
Figure 2.15: Summary of average dry density at various depths (probe).

Stage 4 Distribution, June 19, 2009
UCPRC-RR-2008-11 21
0.0
1.0
2.0
3.0
4.0
5.0
6.0
7.0
5 40 75
Chainage (m)
Mo
istu
re C
on
ten
t (%
)
y=2 50mm y=2 100mm y=2 150mm y=2 200mmy=4 50mm y=4 100mm y=4 150mm y=4 200mmy=6 50mm y=6 100mm y=6 150mm y=6 200mm
y=2 y=4 y=2y=2 y=4y=4y=6 y=6y=6
Figure 2.16: Summary of moisture content at different depths (probe).
The following observations were made:
Dry density measured on the surface showed some variation along the length of the section. The
average density measured was 2,297 kg/m3 or 97 percent of the maximum dry density relative to
California Test Method 216 (standard deviation of 77 kg/m3 [143 lb/ft3 and 5 lb/ft3]). The Caltrans
specification requires 95 percent relative density measured as wet density.
The dry density increased with increasing depth. This was attributed to the construction method
followed (compaction of multiple thin lifts). The average densities for the four depths were:
- 50 mm (2 in.): 2,299 kg/m3 (standard deviation of 34 kg/m3 [143.5 lb/ft3, SD 2.1 lb/ft3])
- 100 mm (4 in.): 2,314 kg/m3 (standard deviation of 38 kg/m3 [144.5 lb/ft3, SD 2.4 lb/ft3])
- 150 mm (6 in.): 2,328 kg/m3 (standard deviation of 39 kg/m3 [145.3 lb/ft3, SD 2.4 lb/ft3])
- 200 mm (8 in.): 2,355 kg/m3 (standard deviation of 45 kg/m3 [147.0 lb/ft3, SD 2.8 lb/ft3])
Some variation in density was evident along the length and width of the section.
The moisture content measured at three locations immediately after construction (sampled from the
trenches excavated for the moisture sensors) varied between 7.0 percent and 10.8 percent, with
moisture content increasing with increasing depth. Some areas were considerably above the
optimum moisture content of the material, which was attributed to the overwatering in the early
stages of construction.
Considerable drying occurred in the seven-day period between construction and measurements with
the nuclear gauge. The average gauge-determined moisture content was 4.7 percent (standard
deviation of 0.7 percent). The lowest recording was 3.9 percent and the highest was 6.3 percent.

Stage 4 Distribution, June 19, 2009
22 UCPRC-RR-2008-11
Light Weight Deflectometer
Measurements were taken at 1.0 m intervals (start point at 5.0 m and end point at 75 m in Figure 2.13)
along the centerline of each section (i.e., y = 2 m and y = 6.0 m in Figure 2.13) and at 5.0 m intervals
along the centerline of the test track (i.e., y = 4.0 m). Only one set of measurements was taken as the base
material was not expected to be temperature sensitive. Average results of the 6.0 kN load drop are
summarized in Table 2.5 and Figure 2.17 and Figure 2.18. There was some difference in the deflections
measured in the base-course on the four sections, as well as some variation along the length of each
section. This was attributed to overwatering during construction, which probably resulted in inconsistent
drying of the base-course material. Deflections on the Control and Evotherm sections were higher than
those recorded on the Advera and Sasobit sections. This was attributed to slower drying of the former two
sections due to shading by the shed for a portion of each day. Deflections in the subgrade were very small
and consistent, as expected, due to the proximity of the bedrock.
Table 2.5: Summary of Base-Course LWD Measurements
Deflection @ D11
(micron) Deflection @ D2
(micron) Deflection @ D3
(micron) Section
AM PM AM PM AM PM Control Advera Evotherm Sasobit
184.0 71.6
135.7 91.7
- - - -
19.5 12.0 15.4 18.1
- - - -
9.6 6.8 9.7 9.7
- - - -
Average Std deviation (mm) CoV2 (%)
120.7 50.0 41.4
- - -
16.2 3.3 20.4
- - -
8.9 1.4 16.0
- - -
1 Geophone D1, offset 0mm 2 CoV: Coefficient of variance
Geophone D2, offset 300mm Geophone D3, offset 600mm
0
20
40
60
80
100
120
140
160
180
200
Control Advera Evotherm Sasobit
De
fle
ctio
n (
mic
ron
)
D1 - AM D2 - AM D3 - AM
Figure 2.17: Summary of average LWD deflection by section.

Stage 4 Distribution, June 19, 2009
UCPRC-RR-2008-11 23
0
50
100
150
200
250
0 10 20 30 40 50 60 70 80
Chainage (m)
De
flec
tio
n u
nd
er
6kN
Lo
ad
(m
icro
n)
Line 2m Line 4m Line 6m
Figure 2.18: Summary of LWD base-course deflection measurements (D1 geophone).
Falling Weight Deflectometer
FWD measurements were taken at the same positions as those taken with the LWD. Only one set of
measurements was taken. Average results of the second 40 kN load drop are summarized in Table 2.6 and
in Figure 2.19 through Figure 2.21. Similar trends to those of the LWD measurements were observed with
similar variation along the length of each section. Higher deflections were again noted on the Control and
Evotherm sections. Deflections in the out sensors, which are influenced by the subgrade, were also very
small and consistent due to the presence of bedrock.
Table 2.6: Summary of FWD Measurements on the Base-Course Deflection @ D11
(mm) Deflection @ D62
(mm) Deflection @ D33
(mm) Deflection @ D54
(mm) Section
AM PM AM PM AM PM AM PM Control Advera Evotherm Sasobit
0.666 0.552 0.390 0.479
- - - -
0.053 0.056 0.043 0.061
- - - -
0.201 0.152 0.101 0.167
- - - -
0.078 0.075 0.055 0.087
- - - -
Average Std deviation (mm) CoV (%)
0.522 0.117
22
- - -
0.053 0.007 0.140
- - -
0.155 0.042 0.268
- - -
0.074 0.013 0.181
- - -
Average Temperatures AM (°C) PM (°C) AM (°F) PM (°F)
Section
Air Surface Air Surface Air Surface Air Surface Control Advera
16.4 19.8 - - 61 34 - -
Evotherm Sasobit
15.2 18.4 - - 59 65 - - 1 Geophone D1, 0 mm offset 3 Geophone D3, 315 mm offset
2 Geophone D6, 925 mm offset 4 Geophone D5, 630 mm offset

Stage 4 Distribution, June 19, 2009
24 UCPRC-RR-2008-11
0.000
0.100
0.200
0.300
0.400
0.500
0.600
0.700
D1 - AM D3 - AM D5 - AM D6 - AM
De
flec
tio
n (
mm
)
Control Evotherm Advera Sasobit
Figure 2.19: Summary of average FWD deflection by section.
0
0.2
0.4
0.6
0.8
1
1.2
0 10 20 30 40 50 60 70 80
Chainage (m)
Su
rfac
e D
efl
ect
ion
un
de
r 4
0kN
Lo
ad (
mm
)
D1 along Y=2m D1 along Y=6m D1 along Y=4m
Figure 2.20: Summary of FWD base-course deflection measurements (D1 geophone).

Stage 4 Distribution, June 19, 2009
UCPRC-RR-2008-11 25
0
0.01
0.02
0.03
0.04
0.05
0.06
0.07
0.08
0.09
0 10 20 30 40 50 60 70 80
Chainage (m)
Su
rfac
e D
efl
ect
ion
un
de
r 4
0kN
Lo
ad (
mm
)
D6 along Y=2m D6 along Y=6m D6 along Y=4m
Figure 2.21: Summary of FWD subgrade deflection measurements (D6 geophone).
2.6 Asphalt Concrete Production
Technical representatives from each of the additive suppliers were on site before and during mix
production, and worked with Graniterock Company staff to modify the plant and monitor mix production
with their additives.
2.6.1 Plant Modifications
Modifications were made to the asphalt binder feedline on the asphalt plant to accommodate the addition
of Advera and Evotherm (Figure 2.22). Customized, calibrated additive delivery systems were provided
by the two manufacturers (Figure 2.23 and Figure 2.24), who oversaw all necessary installations. It was
originally intended that the Sasobit be blended at the refinery and delivered with the binder. However, the
refinery could not complete the terminal blend and the additive was instead added to the binder tanker on
site prior to mix production (Figure 2.25). The tanker was later connected directly to the asphalt plant
feedline. The asphalt binder, sourced from the Valero Asphalt Plant in Benicia, California, was delivered
on the day of production.
2.6.2 Mix Production
Asphalt production started at 07:40 AM on August 24, 2007. Production began with the Control mix,
followed by Advera, Evotherm, and Sasobit (i.e., alphabetical order). Approximately 150 tonnes of each
mix were produced and then stored in insulated silos. The first approximately 20 tonnes of each mix was
“wasted” to ensure that a consistent mix was used on the test track. This material was used to pave a

Stage 4 Distribution, June 19, 2009
26 UCPRC-RR-2008-11
parking area close to the test track, providing the paving crew with an opportunity to familiarize
themselves with each mix.
Figure 2.22: Plant modifications for admixtures. Figure 2.23: Advera supply system.
Figure 2.24: Evotherm supply system. Figure 2.25: Sasobit mixing.
Initial planning required that production of all four mixes be completed before construction was started.
However, problems with the feedline from the Sasobit binder tanker during the production run with that
additive required a halting of mix production to correct the problem, empty the silo, mix Sasobit in a new
binder tanker, and then restart mix production. Consequently, paving of the parking areas with the
“wasted” material started prior to completion of the second Sasobit mix production run to allow sufficient
time for all paving to be completed and to use the discarded initial mix.
Although considered in the work plan, plant emissions were not monitored due to the small volume of
each mix produced.
Evotherm feed
Advera feed
Asphalt feed
Advera supply system

Stage 4 Distribution, June 19, 2009
UCPRC-RR-2008-11 27
A summary of the mix production observations is provided in Table 2.7. Actual mix production
temperatures were at or close to the planned temperatures. The mix rates of the Evotherm and Sasobit
were as planned (monitored by additive suppliers). The Advera was added at a slightly lower rate than
planned due to a feed-rate problem on their equipment. However, the rate was still within the range
usually used for the additive.
Table 2.7: Summary of Mix Production Observations
Mix Start Time End Time Mix Temperature
(°C [°F])
Baghouse Temperature
(°C [°F])
Production Rate
(tonnes/hour) Control Advera Evotherm Sasobit 1* Sasobit 2
07:45 08:20 08:47 09:15 12:25
08:00 08:35 09:12 09:26 12:45
153 (308) 120 (248) 122 (252) 121 (251) 120 (248)
118 (245) 118 (245) 116 (240) 116 (240) 112 (235)
254 268 256 252 244
* Sasobit 1 mix rejected due to binder feed problems Additive Application Rates
(% by mass of binder) Mix Target Actual
Control Advera Evotherm Sasobit
- 4.8 0.5 1.5
- 4.45 0.5 1.5
2.6.3 Quality Control
Asphalt Binder
A certificate of compliance was provided by the binder supplier with the delivery. A copy of this
certificate is provided in Appendix B.
Performance-grade testing of the asphalt binder was undertaken by the Mobile Asphalt Binder Testing
Laboratory (MABTL) Program within the Federal Highway Administration (FHWA) Office of Pavement
Technology. Testing followed the AASHTO M-320 Table 1 (M-320) and AASHTO M-320 Table 2
(M320-T2) requirements. The M320-Continuous grading is based on the Table 1 testing requirements.
Tests were undertaken on the base binder, on laboratory-blended base binder plus warm-mix additives,
and on field-blended base binder plus Sasobit. Field-blended samples of the Advera and Evotherm could
not be collected due to the nature of the asphalt plant modifications. Samples of the binder and warm-mix
additives were collected at the asphalt plant on the day of production and then shipped to the MABTL in
five-liter metal paint can style containers with friction lids. These containers were heated in order to
further split the material into one-liter containers. The warm-mix additives were blended in the laboratory
using a low shear mixer and heating mantel at the same rates as those used on the day of production. The
binder was heated to 138°C for a minimum time to allow the binder to be fluid enough to blend the WMA
technology with the base binder in the low shear mixer.

Stage 4 Distribution, June 19, 2009
28 UCPRC-RR-2008-11
Key results of the binder testing are listed in Table 2.8. Test results were considered by the FHWA as
acceptable. The base binder was graded as PG 64-22, slightly better (in terms of low-temperature
cracking) than the performance grade of PG 64-16 specified in the work plan and shown on the supplier’s
certificate of compliance. The addition of Advera and Sasobit changed the performance grading from
PG 64-22 to PG 70-22 and increased the critical cracking temperature by approximately 1.0°C, implying
both have much better high-temperature rutting performance, but slightly worse (1.0°C and 0.9°C
respectively) low-temperature cracking performance than the base binder. The addition of Evotherm did
not alter the performance grading of the base binder.
An increase in the high temperature grade PG 64 to PG 70 due to the addition of Sasobit was expected due
to the stiffening effect of the wax additive. A change in the high and low temperature grade achieved with
the addition of Sasobit is dependant on the specific base binder. The increase in the high temperature
grade due to the addition of the Advera was not expected based on the zeolite’s material properties and
previous FHWA testing experience with Advera modified binders; which typically do not significantly
impact the performance grade. As shown in the M320-Continuous data column in Table 2.8, both the
Base-plus-Advera and the Base-plus-Evotherm high temperature performance grades were borderline on
the 70°C cutoff between a PG 64 and PG 70 designation. The Base-plus-Advera high temperature
continuous performance grade exceeded the 70°C limit by 0.2°C while the Base-plus-Evotherm
continuous grade was below the cutoff by 0.6°C. The difference in high temperature performance grade is
an effect of having the test results for this specific binder closely border this 70°C temperature. This
borderline difference in the Advera and Evotherm technologies with respect to the 70°C limiting value is
due to various factors including the reheating of the base binder in the laboratory for splitting and
blending, the inherent variability in the test procedures, the ageing criteria specified in the test procedures,
and the base binder’s sensitivity to ageing. An additional Base-plus-Advera sample was tested and graded
in the laboratory to confirm the test results. The original test results were confirmed, although one
additional re-heating cycle was required which further increased the M320 continuous grade temperatures.
Table 2.8: Summary of Binder Performance-Grade Test Results
Asphalt Binder M320 M320-T2 M320-Continuous Critical Crack Temp.
(°C)
Base Base + Advera Base + Evotherm Base + Sasobit (lab) Base + Sasobit (field)
PG 64-22 PG 70-22 PG 64-22 PG 70-22 PG 70-22
PG 64-22 PG 70-22 PG 64-22 PG 70-22 PG 70-22
67.0-26.7 70.2-26.0 69.4-26.8 72.8-26.0 71.7-24.2
-24.0 -23.0 -23.9 -23.1 -22.0

Stage 4 Distribution, June 19, 2009
UCPRC-RR-2008-11 29
Asphalt Mix
The actual mix design properties were not assessed by Caltrans since numerous tests have been
undertaken in the past on the mix design used.
Quality control of the mixes produced for the test track was undertaken by Graniterock Company on mix
sampled from the trucks at the silos. Hveem tests and kneading compaction were not used for this testing
because no research or protocols are available for determining a kneading compaction temperature for
warm-mix asphalt. Graniterock instead undertook Marshall and Superpave Gyratory compaction and
Marshall Stability tests to compare the four mixes. The results are summarized in Table 2.9.
Table 2.9: Quality Control of Mix After Production Parameter Target Range Control Advera Evotherm Sasobit
Grading 1" 3/4" 1/2" 3/8" #4 #8 #16 #30 #50 #100 #200
100 96 84 72 49 36 26 18 11 7 4
-
91-100 -
66-78 42-56 31-41
- 14-22
- -
2-6
100.0 96.0 85.2 72.8 48.0 36.0 25.3 17.8 11.2 6.4 3.7
100.0 95.8 86.0 74.9 51.7 39.9 28.0 19.2 11.4 6.7 4.2
100.0 97.3 88.2 75.9 50.2 39.4 28.2 19.3 11.3 6.6 4.1
100.0 96.5 86.2 75.1 50.5 38.1 26.3 17.9 10.7 6.1 3.8
AC Binder Content (%)1 5.2 5.1 - 5.4 5.29 5.14 5.23 4.48 Max. Specific Gravity2 - - 2.567 2.581 2.596 2.606 Marshall Compaction3
Compaction Temperature (°C) Blows per face Bulk Specific Gravity Air-void Content (%)
- - - -
- - - -
139 75
2.511 2.18
115 75
2.474 4.15
112 75
2.493 3.97
124 75
2.464 5.45
Gyratory Compaction3
Compaction Temperature (°C) Number of Gyrations Bulk Specific Gravity Air-void Content (%)
- - - -
- - - -
139 100
2.526 1.60
115 100
2.522 2.29
112 100
2.528 2.62
124 100
2.510 3.68
Marshall Stability (lbs)4
Marshall Flow (0.01 in.) 1,800 min
- - -
4,267 11.8
3,030 10.8
3,320 10.2
3,307 12.1
Moisture (before plant) (%) Moisture (after silo) (%)
- <1.0
- -
0.24 0.09
0.41 0.25
0.37 0.32
0.31 0.25
1 AASHTO T-308 2 AASHTO T-209 3 AASHTO T-166 4 AASHTO T-245
The following observations were made:
The aggregate gradations of the four mixes were similar, generally met the targets, and were within
the required ranges.
The binder contents of the Control, Advera, and Evotherm mixes were similar and all close to the
target. The binder content of the Sasobit mix was 0.72 percent below the target and 0.62 percent
below the lowest permissible content. This discrepancy is likely to influence behavior of the mix

Stage 4 Distribution, June 19, 2009
30 UCPRC-RR-2008-11
and will be taken into consideration in performance discussions in Chapter 4. The problem was
attributed to the asphalt plant operation and binder feed rate from the tanker during mix production.
The maximum specific gravities of the four mixes were within a relatively close range, but showed
an increase of between 0.010 and 0.015 with each subsequent mix produced.
The bulk specific gravities of the four mixes, determined from Marshall-compacted specimens,
were within a relatively close range (difference of 0.047 between highest and lowest). The Control
mix had the highest bulk specific gravity of the four mixes and Sasobit the lowest.
The air-void contents of the four mixes, determined from Marshall-compacted specimens, were
notably different, with the Control mix having a significantly lower air-void content than the mixes
with additives. The Control mix had the lowest air-void content (2.18 percent) and the Sasobit the
highest air-void content (5.45 percent). It is not clear whether this was a testing inconsistency, or a
result of the warm-mix production process. This will be assessed in the proposed Phase 2 laboratory
testing program (3). (Laboratory mix-design testing procedures are also currently being investigated
as part of a National Cooperative Highway Research Project [NCHRP 9-43].)
The bulk specific gravities of the four mixes, determined from gyratory-compacted specimens, were
within a closer range compared to the Marshall-compacted specimens (difference of 0.018 between
highest and lowest). The Control, Advera, and Evotherm mixes essentially had the same bulk
specific gravity, with the Sasobit mix having a slightly lower value.
The air-void contents of the four mixes, determined from gyratory-compacted specimens, were also
notably different, with the Control mix again having a significantly lower air-void content than the
mixes with additives. The Control mix had the lowest air-void content (1.60 percent) and the
Sasobit the highest (3.68 percent).
The Marshall stability of the Control mix was significantly higher than the mixes with additives
(approximately 1,000 lb higher). However, the stabilities of all the mixes were well above the
minimum limit.
The Marshall flows did not follow similar trends. The Evotherm and Advera mixes had the lowest
Marshall flows (10.2 and 10.8 respectively) followed by the Control mix (11.8) and the Sasobit mix
(12.1). The Sasobit mix was expected to have the lowest flow, given that it had the lowest binder
content.
There was some variability in the moisture contents of the aggregate just prior to it entering the
drum, with the material used in the Control mix having the lowest moisture content (0.24 percent)
and that used in the Advera mix the highest moisture content (0.41 percent). The moisture contents
of all four aggregate runs prior to entering the drum were still lower than the Caltrans end-of-drum
moisture content specification of 1.0 percent (4).

Stage 4 Distribution, June 19, 2009
UCPRC-RR-2008-11 31
The moisture contents of the mix samples collected at the silos showed a more interesting trend.
The moisture content of the Control mix was just 0.09 percent, considerably lower than those of the
mixes with additives, which had moisture contents of 0.25 percent (Advera and Sasobit) and
0.32 percent (Evotherm). Although moisture contents in all mixes were well below the minimum
specified limit, the higher moisture content of the modified mixes indicates that potentially less
moisture evaporates from the aggregate at the lower production temperatures.
2.7 Asphalt Concrete Placement
Asphalt concrete lay-down and compaction were monitored and documented by UCPRC staff. The
proceedings were also observed by Caltrans staff and representatives from Graniterock Company and the
additive suppliers.
2.7.1 Placement
Introduction
Construction started with the ramps to the test track, thereby ensuring easier and more level access for the
paver and compaction equipment. The first “wasted” tonnage from the Control mix was used for this
application. After completion of the ramps, test strips were constructed in an adjacent parking lot. This
consumed the first “wasted” tonnage of each mix, as well the rejected first production run of the Sasobit
mix. It also provided an opportunity for the paving crew to familiarize themselves with the warm-mix
asphalt. Initially the test strip was planned to serve as an early-opening experiment under quarry truck
traffic to assess the potential for early rutting immediately after construction. However, this did not
materialize as there was no through-traffic in the area. The test strips and test track sections were
constructed in the same order as asphalt production (i.e., Control, followed by warm-mix sections in
alphabetical order).
Equipment
The following equipment was used during placement of the asphalt concrete layers.
Caterpillar 1000D paver
Sakai SW850 steel-wheel vibrating roller (breakdown compaction)
Sakai SW850 steel-wheel vibrating roller (final rolling)
Sakai GW750 rubber-tired roller
Sakai SW320 steel-wheel vibrating roller (ramps)
Binder distributor (tack coat application)
Dump trucks

Stage 4 Distribution, June 19, 2009
32 UCPRC-RR-2008-11
John Deere 1483 skip loader
Prime Coat
After a final visual inspection of the base, the test track was lightly sprayed with water to bind any surface
fines (Figure 2.26, approximately 7:55 AM). Once the water had penetrated, prime coat (SS-1 asphalt
emulsion) was applied with a hand-held lance over the entire test track (Figure 2.27, approximately
8:10 AM to 8:25 AM). The application rate was estimated at 1.0 L/m2 (0.25 gal/yd2), but due to the
method of application it could not be accurately determined or controlled. The prime was allowed to break
during the construction of the test strip. Some areas of poor adhesion were noted, and some damage was
caused by foot and vehicular traffic (Figure 2.28). Weather conditions at the time of priming were as
follows:
Air temperature: 16°C (61°F)
Surface temperature: 13°C (56°F)
Relative humidity: 83 percent
Dew point: 13°C (55°F)
Figure 2.26: Water spray prior to priming. Figure 2.27: Prime application.
Figure 2.28: Damage to prime by vehicle and foot traffic.

Stage 4 Distribution, June 19, 2009
UCPRC-RR-2008-11 33
First Lift: Control Section
Placement of the asphalt concrete on the Control section started at 12:15 PM with the positioning of the
paver at the start of the Control section. The first truck load was tipped into the paver at 12:25 PM. Three
loads were used and the paver reached the end of the section eight minutes after starting. Some haze was
noted during tipping. Breakdown rolling started as soon as the paver was moved off of the section.
Density and temperature measurements were taken throughout (see Section 0). Six passes were made with
the breakdown roller (approximately six minutes). This was followed by the rubber-tired roller, which
applied ten passes in an 11-minute period. Final rolling was completed with the steel-wheel roller (with
vibration) in three passes at 12:57 PM. Paver spillage was removed from the end of the section to ensure a
clean and regular surface and join for the Advera section. The second part of the final rolling with the
steel-wheel roller (three passes, no vibration) was completed when the section had cooled. This took place
between 1:45 PM and 1:50 PM. The construction process is illustrated in Figure 2..
Mix delivery (note haze) Paver train
Breakdown rolling Density check
Figure 2.29: Control: Placement of first lift of asphalt concrete.
Haze
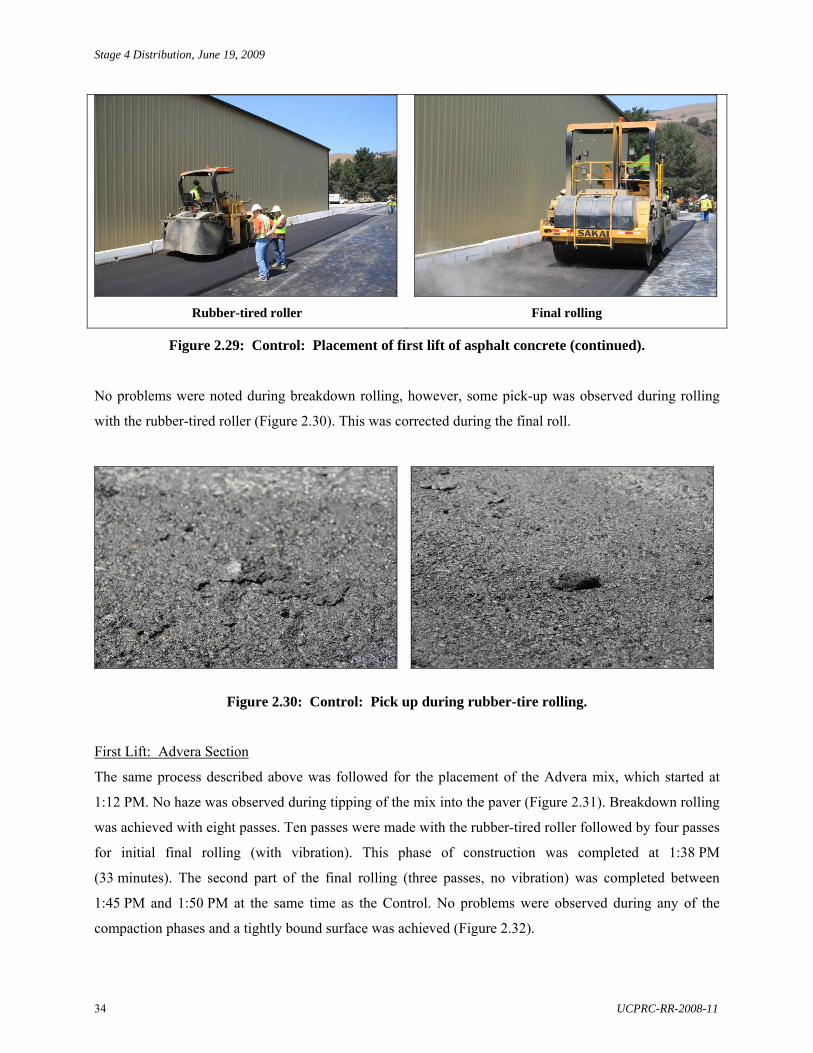
Stage 4 Distribution, June 19, 2009
34 UCPRC-RR-2008-11
Rubber-tired roller Final rolling
Figure 2.29: Control: Placement of first lift of asphalt concrete (continued).
No problems were noted during breakdown rolling, however, some pick-up was observed during rolling
with the rubber-tired roller (Figure 2.30). This was corrected during the final roll.
Figure 2.30: Control: Pick up during rubber-tire rolling.
First Lift: Advera Section
The same process described above was followed for the placement of the Advera mix, which started at
1:12 PM. No haze was observed during tipping of the mix into the paver (Figure 2.31). Breakdown rolling
was achieved with eight passes. Ten passes were made with the rubber-tired roller followed by four passes
for initial final rolling (with vibration). This phase of construction was completed at 1:38 PM
(33 minutes). The second part of the final rolling (three passes, no vibration) was completed between
1:45 PM and 1:50 PM at the same time as the Control. No problems were observed during any of the
compaction phases and a tightly bound surface was achieved (Figure 2.32).

Stage 4 Distribution, June 19, 2009
UCPRC-RR-2008-11 35
Figure 2.31: Advera: Mix delivery, no haze. Figure 2.32: Advera: Surface after final rolling.
First Lift: Evotherm Section
The same process followed for the previous two sections was also followed for the Evotherm mix.
Construction started at 1:50 PM. No haze was observed during tipping of the mix into the paver. A rag
was accidentally dropped in the paver, leaving an indentation on the mat that was repaired by hand
(Figure 2.33 and Figure 2.34). Six passes were made with the breakdown roller and twelve with the
rubber-tired roller. Initial final rolling was achieved in four passes (with vibration). This phase of
construction was completed at 2:15 PM and took 25 minutes. The second part of the final rolling (three
passes, no vibration) was completed between 2:45 PM and 2:50 PM. No problems were observed during
the breakdown rolling, but some shearing was noted under the rubber-tired roller (Figure 2.35). Final
rolling provided a smooth, tightly bound surface (Figure 2.36).
Figure 2.33: Evotherm: Damage behind paver. Figure 2.34: Evotherm: Damage repair.
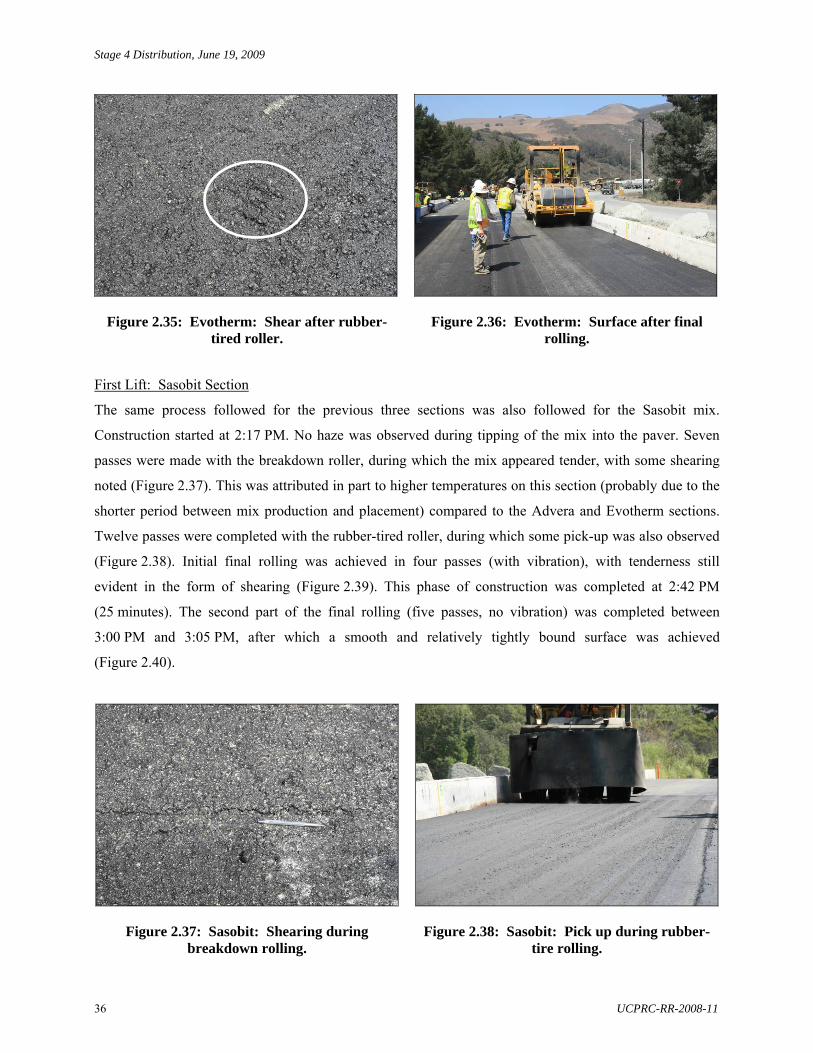
Stage 4 Distribution, June 19, 2009
36 UCPRC-RR-2008-11
Figure 2.35: Evotherm: Shear after rubber-tired roller.
Figure 2.36: Evotherm: Surface after final rolling.
First Lift: Sasobit Section
The same process followed for the previous three sections was also followed for the Sasobit mix.
Construction started at 2:17 PM. No haze was observed during tipping of the mix into the paver. Seven
passes were made with the breakdown roller, during which the mix appeared tender, with some shearing
noted (Figure 2.37). This was attributed in part to higher temperatures on this section (probably due to the
shorter period between mix production and placement) compared to the Advera and Evotherm sections.
Twelve passes were completed with the rubber-tired roller, during which some pick-up was also observed
(Figure 2.38). Initial final rolling was achieved in four passes (with vibration), with tenderness still
evident in the form of shearing (Figure 2.39). This phase of construction was completed at 2:42 PM
(25 minutes). The second part of the final rolling (five passes, no vibration) was completed between
3:00 PM and 3:05 PM, after which a smooth and relatively tightly bound surface was achieved
(Figure 2.40).
Figure 2.37: Sasobit: Shearing during breakdown rolling.
Figure 2.38: Sasobit: Pick up during rubber-tire rolling.

Stage 4 Distribution, June 19, 2009
UCPRC-RR-2008-11 37
Figure 2.39: Sasobit: Surface after final rolling. Figure 2.40: Sasobit: Shearing during final rolling.
Tack Coat Between Lifts
Tack coat was applied in two separate passes, the first on the Control and Advera sections at 3:00 PM
(Figure 2.41), and the second on the Evotherm and Sasobit sections at 3:50 PM. An SS-1 emulsion was
applied with a distributor at an application rate of approximately 0.5 L/m2 (0.1 gal/yd2). Some steam was
observed when applying over the Sasobit section (Figure 2.42), probably due to the shorter cooling time
since the placement of the first lift compared to the other sections.
Figure 2.41: Tack coat application (Control). Figure 2.42: Tack coat application (Sasobit).
Second Lift: Control Section
The same placement and compaction process was followed for the second lift of the Control mix, which
started at 3:03 PM, with the section completely shaded by the adjacent shed. Some haze was again
observed during tipping of the mix into the paver. Breakdown rolling was achieved with six passes, with
some tenderness observed. Twelve passes were made with the rubber-tired roller followed by three passes
for the first phase of final rolling (with vibration). This phase of construction was completed at 3:26 PM

Stage 4 Distribution, June 19, 2009
38 UCPRC-RR-2008-11
(23 minutes). The second part of the final rolling (three passes, no vibration) was completed between
4:08 PM and 4:12 PM. No problems were observed during rubber-tired and final rolling.
Second Lift: Advera Section
The same placement and compaction process was followed for the second lift of the Advera mix, which
started at 3:28 PM. No haze was observed during tipping of the mix into the paver. Breakdown rolling was
achieved with eight passes, followed by twelve passes with the rubber-tired roller and three passes with
the steel-wheel roller for the first phase of final rolling (with vibration). This phase of construction was
completed at 3:47 PM (19 minutes). The second part of the final rolling (three passes, no vibration) was
completed between 4:08 PM and 4:12 PM at the same time as final rolling on the Control section. The
layer appeared very stable during all stages of compaction and no tenderness or shearing was observed.
Second Lift: Evotherm Section
The same placement and compaction process was followed for the second lift of the Evotherm mix, which
started at 3:48 PM. The section was shaded by the adjacent shed for the duration of work. No haze was
observed during tipping of the mix into the paver. Breakdown rolling was achieved with six passes,
followed by twelve passes with the rubber-tired roller and three passes with the steel-wheel roller for the
first phase of final rolling (with vibration). This phase of construction was completed at 4:20 PM
(30 minutes). The second part of the final rolling (three passes, no vibration) was completed between
5:00 PM and 5:12 PM. Some tenderness was observed during the breakdown rolling and rolling with the
rubber-tired roller. No problems were observed during final rolling.
Second Lift: Sasobit Section
The same placement and compaction process was followed for the second lift of the Sasobit mix, which
started at 4:20 PM. No haze was observed during tipping of the mix into the paver. Breakdown rolling was
achieved with six passes. Some tenderness was noted, similar to that observed during compaction of the
first lift. Twelve passes with the rubber-tired roller were applied in the next stage of compaction, with
pick-up again noted. The first phase of final rolling totalled six passes (with vibration), during which the
layer appeared more stable. This phase of construction was completed at 4:40 PM (30 minutes). The
second part of final rolling (three passes, no vibration) was completed between 5:00 PM and 5:12 PM at
the same time as final rolling on the Evotherm section.
2.7.2 Instrumentation
Two strain gauges were placed on top of the primed base on each section. One gauge (Tokyo-Sokki
KM-100HAS) was placed in the transverse position, with the midpoint 1,800 mm (70.9 in.) from the

Stage 4 Distribution, June 19, 2009
UCPRC-RR-2008-11 39
outside edge (K-rail) of the pavement. The second gauge (CTL ASG-152) was placed in the longitudinal
position, with the midpoint 2,000 mm (78.7 in.) from the outside edge of the pavement (Figure 2.43).
Actual positions on each section together with the gauge identifier are listed in Table 2.10.
Table 2.10: Strain Gauge Position Detail
Section Gauge Position*
(m) CTL Label Tokyo Sokki Label
Control Advera
Evotherm Sasobit
29.82 69.25 30.96 70.50
R-45 R-46 R-47 R-48
EKZ 04392 EKZ 04393 EKZ 04394 EKZ 04395
* Measured from x – y = 0 position on southern end of the section (see Figure 2.6).
Figure 2.43: Strain gauge layout.
Asphalt concrete was removed from the first truck of each mix with a shovel and placed over the strain
gauges and wires to prevent damage by the trucks and the paver (Figure 2.44).
Figure 2.44: Strain gauge covered with mix.
2.7.3 Quality Control
Quality control, both during and after construction, was undertaken jointly by Graniterock Company and
the UCPRC. This included:

Stage 4 Distribution, June 19, 2009
40 UCPRC-RR-2008-11
Placement and compaction temperatures
Thickness
Density
Deflection
Skid resistance
Placement and Compaction Temperatures
Temperatures were systematically measured throughout the placement of the asphalt concrete using
infrared temperature guns, thermocouples, and an infrared camera. Measurements included:
Temperature of the mix as it was tipped into the paver
Temperature of the mix behind the paver
Temperature of the mat before compaction
Temperature of the surface during compaction
Temperature after priming
Temperature of the surface prior to placing the second lift
Temperature at the above locations during the second lift
A summary of the measurements is provided in Table 2.11 and in Figure 2.45 and Figure 2.46. The
following observations were made:
Average temperatures of the Control mix measured in the trucks as it was tipped into the paver were
about 10°C (18°F) below the target compaction temperature. This was attributed to cooling in the
silo (placing of the first lift of the Control mix started approximately four hours after mix
production) and during transport from the asphalt plant. The temperature was, however, still within
Caltrans-specified limits (4). The temperature of the Advera was within the target for the first lift,
but slightly below the target for the second lift. The temperature of the Evotherm was the same for
both lifts, but slightly below the target, while the Sasobit was slightly above the target for the first
lift and within the target range for the second lift. The Sasobit had the shortest wait in the silo
(approximately two hours).
There was very little temperature difference between the material being tipped into the paver and
the mat behind the paver before compaction. The Advera, Evotherm, and Sasobit mixes lost less
heat than the Control mix.
Temperatures on the Control section dropped by 13°C and 18°C (23°F and 32°F) on the first and
second lift respectively between placement with the paver and start of compaction with the
breakdown roller. The drop on the Advera and Sasobit sections was 9°C and 12°C (16°F and 22°F)
for the two lifts, while the drop on the Evotherm section was 13°C and 16°C (23°F and 29°F).

Stage 4 Distribution, June 19, 2009
UCPRC-RR-2008-11 41
Table 2.11: Summary of Temperature Measurements Temperature (°C) Lift Measuring Point
Control Advera Evotherm Sasobit 1st Truck
Paver Mat Surface: begin compaction Surface: average during compaction Surface: end of compaction Mid-depth: average during compaction
137 135 135 122 106 94 113
112 110 105 96 81 72 94
107 106 106 93 90 76 92
121 120 117 108 91 74 87
Surface before prime Surface after prime Surface before second lift
50 51 50
- -
53
- -
51
- -
54
2nd
Truck Paver Mat Surface: begin compaction Surface: average during compaction Surface: end of compaction Mid-depth: average during compaction
134 128 127 109 93 68 122
109 109 109 97 82 73 100
107 107 107 91 80 72 105
115 113 113 101 84 74 91
Temperature (°F) Lift Measuring Point Control Advera Evotherm Sasobit
1st Truck Paver Mat Surface: begin compaction Surface: average during compaction Surface: end of compaction Mid depth: average during compaction
279 275 275 252 223 201 235
234 230 221 205 178 162 201
225 223 223 199 194 169 198
250 248 243 226 196 165 189
Surface before prime Surface after prime Surface before second lift
122 124 122
- -
127
- -
124
- -
129
2nd
Truck Paver Mat Surface: begin compaction Surface: average during compaction Surface: end compaction Mid-depth: average during compaction
273 262 261 228 199 154 252
228 228 228 207 180 163 212
226 226 226 196 176 162 221
239 235 235 214 183 165 196
The average temperature difference between the start of breakdown compaction and final rolling on
the Control section was 28°C (50°F) for the first lift and 41°C (74°F) for the second lift. The
difference for the Advera section was 24°C (43°F) for both lifts. On the Evotherm section, the
difference was 17°C and 19°C (31°F and 34°F) respectively, and on the Sasobit section the
difference was 34°C and 27°C (61°F and 49°F) respectively.
Average start- and end-compaction temperatures on the Control section were within the Caltrans
specification limits (4). The average start-compaction temperatures on the Advera, Evotherm, and
Sasobit sections were below the specification limits (as required in the experimental design [3]), but
end-of-compaction temperatures were within limits (4).

Stage 4 Distribution, June 19, 2009
42 UCPRC-RR-2008-11
0
20
40
60
80
100
120
140
160
Control Advera Evotherm Sasobit
Tem
pe
ratu
re (
C)
Mat Surface: begin compaction Surface: average during compaction Surface: end compaction
Figure 2.45: Summary of temperature measurements (first lift).
0
20
40
60
80
100
120
140
160
Control Advera Evotherm Sasobit
Tem
pe
ratu
re (
C)
Mat Surface: begin compaction Surface: average during compaction Surface: end compaction
Figure 2.46: Summary of temperature measurements (second lift).
The rate of temperature loss between initial placement and completion of compaction on the
Control section was significantly higher than on the warm-mix sections.
Temperature drop on the Control and Evotherm sections did not appear to be influenced by the
shade during placement of the second lift. The differences between the start and end of compaction
on the shaded sections were less than the differences on the Advera and Sasobit sections, which
were placed and compacted in direct sunlight.

Stage 4 Distribution, June 19, 2009
UCPRC-RR-2008-11 43
Thermal camera images (FLIR Systems ThermaCAM PM290, recorded by T.J. Holland of Caltrans) of
the mat behind the paver and after compaction with the rubber-tired roller are shown in Figure 2.47. The
images clearly show the lower temperatures of the warm-mix sections and the uniformity in temperature
over the mat. (Note that temperature scales on the right side of the photographs differ between images.)
Control: First lift behind paver Control: First lift after rubber-tired roller
Advera: First lift behind paver Advera: First lift after rubber-tired roller
Figure 2.47: Thermal images of test track during construction.
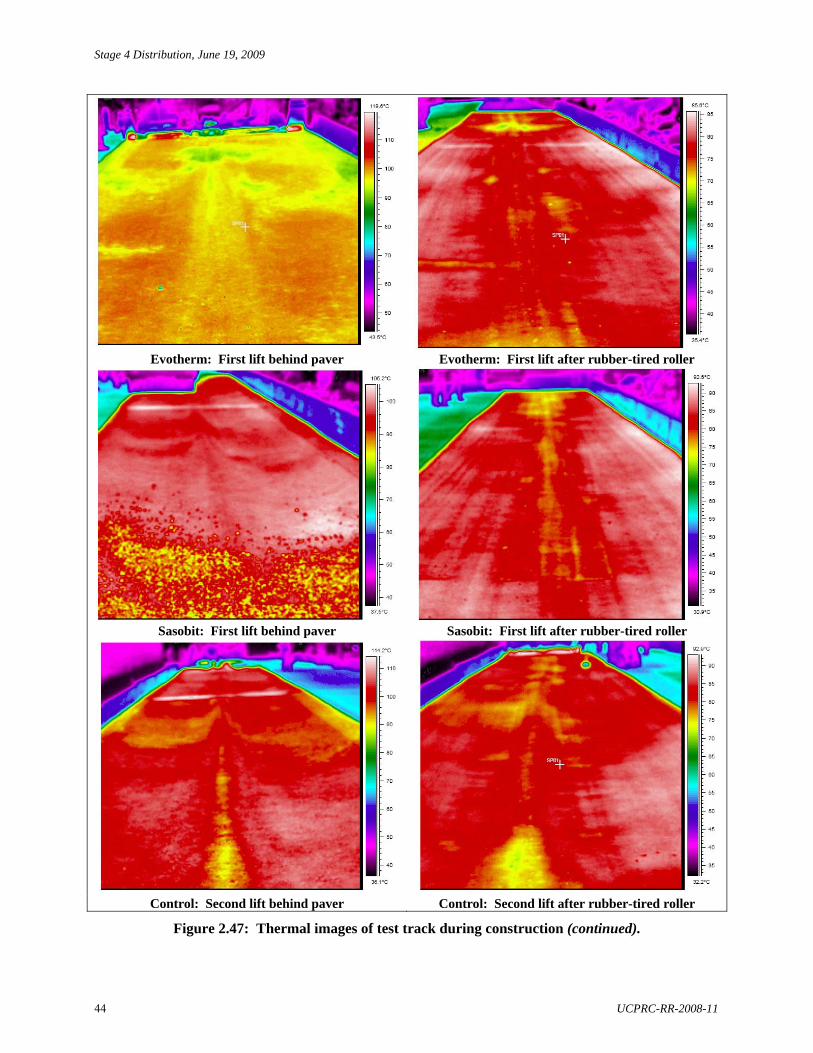
Stage 4 Distribution, June 19, 2009
44 UCPRC-RR-2008-11
Evotherm: First lift behind paver Evotherm: First lift after rubber-tired roller
Sasobit: First lift behind paver Sasobit: First lift after rubber-tired roller
Control: Second lift behind paver Control: Second lift after rubber-tired roller
Figure 2.47: Thermal images of test track during construction (continued).

Stage 4 Distribution, June 19, 2009
UCPRC-RR-2008-11 45
Advera: Second lift behind paver Advera: Second lift after rubber-tired roller
Evotherm: Second lift behind paver Evotherm: Second lift after rubber-tired roller
Sasobit: Second lift behind paver Sasobit: Second lift after rubber-tired roller
Figure 2.47: Thermal images of test track during construction (continued).

Stage 4 Distribution, June 19, 2009
46 UCPRC-RR-2008-11
Thickness
Thickness was monitored with probes throughout the construction process. The thickness of the slabs
removed for laboratory testing after construction (see Section 0) was also measured. The average
thickness of the combined two layers was 112 mm (4.4 in.), 8.0 mm (0.3 in.) thinner than the design
thickness of 120 mm (4.7 in.). The thinnest measurement recorded was 98 mm (3.9 in.) and the thickest
124 mm (4.9 in.). This range of thicknesses was considered acceptable and representative of typical
construction projects. Actual thicknesses of the asphalt concrete layers adjacent to the HVS test sections
will be determined from cores taken during the planned forensic investigation after all HVS testing has
been completed.
Density
Compaction was monitored using nuclear and non-nuclear gauges throughout the construction process.
The results were used to manage the number of rolling passes, roller selection, and roller settings. These
densities were monitored but not recorded.
Final density measurements were taken on August 26, 2007 by Graniterock Company, using a calibrated
nuclear gauge. Measurements were taken according to the plan shown in Figure 2.48. A summary of the
results is provided in Table 2.12. The results show some variability among the four sections as well as
within each section. Air-void contents determined from these measurements correspond to observations
made during construction (see Section 2.7). The Control and Advera sections, which appeared to compact
without problems on the day with little or no evidence of tenderness, had the lowest air-void contents (5.6
and 5.4 percent respectively). The Evotherm and Sasobit sections, which showed signs of tenderness at
various stages of the compaction process, had higher air-void contents (7.1 and 7.0 percent respectively).
Density increased with increasing distance from the outside edge (i.e., K-rail) on the Advera, Evotherm
and Sasobit sections. Density was highest along the middle of the section for the Control.
Falling Weight Deflectometer
FWD measurements were taken on September 5, 2007 at 1.0 m intervals (start point 5.0 m and end point
75 m) along the centerline of each section (i.e., y =2.0 m and y =6.0 m) Average results of the second
40 kN load drop are summarized in Table 2.13 and in Figure 2.49 through Figure 2.51. There was no
significant difference in the deflections measured on the four sections and relatively little variation along
the length of each section, indicating consistent construction. Sensor 1 deflections on the asphalt concrete
decreased slightly with increasing chainage (south to north), consistent with the changing depth of the
bedrock. The Advera section had the lowest average deflections, followed by the Sasobit, Control, and
Evotherm sections. The asphalt concrete layer exhibited some temperature sensitivity, as expected.
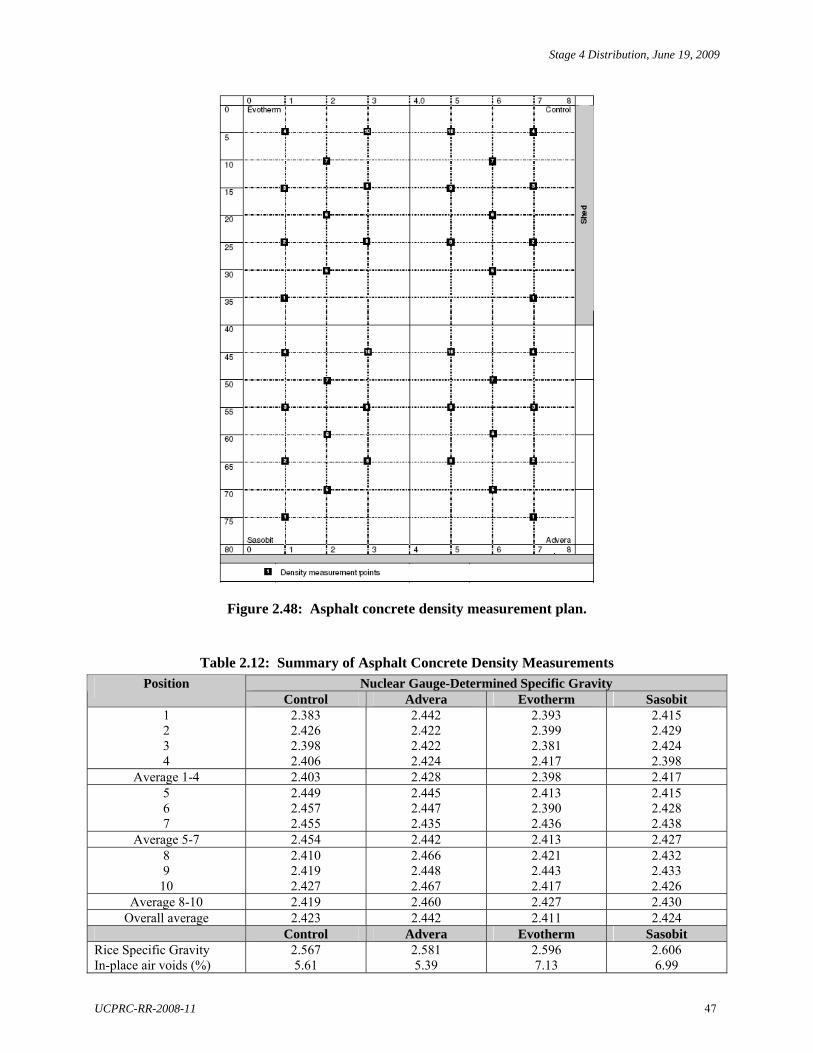
Stage 4 Distribution, June 19, 2009
UCPRC-RR-2008-11 47
Figure 2.48: Asphalt concrete density measurement plan.
Table 2.12: Summary of Asphalt Concrete Density Measurements
Nuclear Gauge-Determined Specific Gravity Position Control Advera Evotherm Sasobit
1 2 3 4
2.383 2.426 2.398 2.406
2.442 2.422 2.422 2.424
2.393 2.399 2.381 2.417
2.415 2.429 2.424 2.398
Average 1-4 2.403 2.428 2.398 2.417 5 6 7
2.449 2.457 2.455
2.445 2.447 2.435
2.413 2.390 2.436
2.415 2.428 2.438
Average 5-7 2.454 2.442 2.413 2.427 8 9
10
2.410 2.419 2.427
2.466 2.448 2.467
2.421 2.443 2.417
2.432 2.433 2.426
Average 8-10 2.419 2.460 2.427 2.430 Overall average 2.423 2.442 2.411 2.424
Control Advera Evotherm Sasobit Rice Specific Gravity In-place air voids (%)
2.567 5.61
2.581 5.39
2.596 7.13
2.606 6.99

Stage 4 Distribution, June 19, 2009
48 UCPRC-RR-2008-11
Table 2.13: Summary of FWD Measurements Deflection @ D11
(mm) Deflection @ D62
(mm) Deflection @ D33
(mm) Deflection @ D54
(mm) Section
AM PM AM PM AM PM AM PM Control Advera Evotherm Sasobit
0.243 0.186 0.260 0.208
0.360 0.263 0.402 0.322
0.047 0.034 0.045 0.048
0.047 0.038 0.046 0.053
0.149 0.090 0.154 0.125
0.168 0.091 0.162 0.141
0.075 0.045 0.074 0.068
0.069 0.048 0.062 0.073
Average Std deviation (mm) CoV (%)
0.22 0.03 15
0.34 0.06 18
0.04 0.01 15
0.05 0.01 13
0.13 0.03 23
0.14 0.04 25
0.07 0.01 22
0.06 0.01 18
Average Temperatures AM (°C) PM (°C) AM (°F) PM (°F)
Section
Air Surface Air Surface Air Surface Air Surface Control Advera
14.0 18.9 26.6 42.9 57 59 80 109
Evotherm Sasobit
19.3 23.9 26.4 40.6 67 75 80 105
1 Geophone D1, 0 mm offset 3 Geophone D3, 315 mm offset
2 Geophone D6, 925 mm offset 4 Geophone D5, 630 mm offset
0.000
0.050
0.100
0.150
0.200
0.250
0.300
0.350
0.400
0.450
D1 - AM D1 - PM D3 - AM D3 - PM D5 - AM D5 - PM D6 - AM D6 - PM
De
flec
tio
n (
mm
)
Control Advera Evotherm Sasobit
Figure 2.49: Summary of average deflection by section.

Stage 4 Distribution, June 19, 2009
UCPRC-RR-2008-11 49
0
0.1
0.2
0.3
0.4
0.5
0.6
0 10 20 30 40 50 60 70 80
Chainage (m)
De
fle
cti
on
un
de
r 40
kN
Lo
ad
(m
m)
Y=2m, 9/4/07, 7:11, Surface Temp = 18.9C Y=6m, 9/4/07, 8:48, Surface Temp = 23.9C
Y=2m, 9/4/07, 14:41, Surface Temp = 42.9C Y=6m, 9/4/07, 13:27, Surface Temp = 40.6C
Figure 2.50: Summary of Sensor-1 deflection measurements on asphalt concrete surface.
0
0.01
0.02
0.03
0.04
0.05
0.06
0.07
0.08
0.09
0 10 20 30 40 50 60 70 80
Chainage (m)
De
fle
cti
on
un
de
r 40
kN
Lo
ad
(m
m)
Y=2m, 9/4/07, 7:11, Surface Temp = 18.9C Y=6m, 9/4/07, 8:48, Surface Temp = 23.9C
Y=2m, 9/4/07, 14:41, Surface Temp = 42.9C Y=6m, 9/4/07, 13:27, Surface Temp = 40.6C
Figure 2.51: Summary of subbase/subgrade deflection measurements (D6 geophone).
Skid Resistance
The potential influence that warm-mix asphalt additives might have on the skid resistance of a newly
constructed surface was identified by practitioners during the preparation of the work plan. Plans were
therefore made to measure this attribute soon after construction. Two devices were used for these
measurements; namely a Caltrans Portable Skid Tester (Figure 2.52) and a Dynamic Friction Tester
(Figure 2.53). Texture measurements for the Dynamic Friction Tester were determined with a Circular

Stage 4 Distribution, June 19, 2009
50 UCPRC-RR-2008-11
Track Meter (Figure 2.54). Measurements were taken at 10 m intervals along the centerline of each
section (i.e., y = 2.0 m and y = 6.0 m).
Figure 2.52: Caltrans Portable Skid Tester. Figure 2.53: Dynamic Friction Tester.
Figure 2.54: Circular Track Meter.
Methodology: Caltrans Portable Skid Tester
Skid resistance testing with the Caltrans Portable Skid Tester followed the standard CT-342 test
method. A coefficient of friction value is calculated from the measured data.
Methodology: Dynamic Friction Tester
Data collected from the Dynamic Friction Tester (DFT) and Circular Track Meter (CTM) were used
to calculate an International Friction Index (IFI), developed by the International Association of
Road Congresses (PIARC), for harmonizing of friction measurements taken with different
equipment and/or at different slip speeds to a common calibrated index. The IFI includes
measurements of:
Stage 4 Distribution, June 19, 2009
UCPRC-RR-2008-11 51
- Macrotexture and friction on wet pavements;
- A speed constant derived from the macrotexture measurement that indicates the speed-
dependence of the friction, and
- A friction number corresponding to a slip speed of 60 km/h (38 mph).
The IFI is based on the assumption that friction is a function of speed and macrotexture and that for
a given level of macrotexture, the effect of speed causes an exponential decay in the value of
friction as the speed increases. The equation for this relationship is (Equation 2.1):
60
p
S
SFR60 FRS e
(2.1)
where: FR60 is the calculated friction of a device at 60 km/h
FRS is the measured friction at a slip speed of S km/h
Sp is the speed constant of the IFI, which accounts for the pavement macrotexture.
The calculated friction at 60 km/h for a specific device is then transformed using a linear function
of the form (Equation 2.2):
F60 A B FR60 C Tx (2.2)
where: F60 is the calculated Friction Number of the IFI
A, B, and C are device-specific constants
Tx is the surface texture measured in accordance with ASTM E 1845-01.
The values of the constants for measurements taken with the Dynamic Friction Tester
(ASTM E 1911-02) are A = 0.081, B =0.732, and C =0.
The mean profile depth (MPD) was measured with the Circular Track Meter and converted into a
speed constant (Sp) using the following equation from ASTM E 2157-03 (Equation 2.3):
3.76 107.6p CTMS MPD (2.3)
Results
The results from the DFT are summarized in Table 2.14. Results from the Caltrans Portable Skid
Tester were unavailable to the UCPRC at the time this report was prepared. A direct comparison of
results from the DFT and the Caltrans Skid Tester is also not possible given the differences in
which measurements are taken.

Stage 4 Distribution, June 19, 2009
52 UCPRC-RR-2008-11
The IFI values recorded with the DFT on each of the four sections are considered somewhat low
compared to measurements on in-service pavements, which typically have values higher than 0.35.
This was attributed to testing being carried out immediately after construction and before any
trafficking, when the surface was still likely to have residues from rolling. These residues, together
with the coating of asphalt on the exposed aggregate surfaces, are typically polished off by traffic
soon after opening. Skid number values at 64 km/h (SN64 [40 mph]) for a Locked-Wheel Skid
Trailer (ASTM E 274-97) were backcalculated from the IFI and texture values. These were above
the Caltrans minimum value of 0.30 on the Control, Evotherm, and Sasobit sections, and slightly
below the minimum value of 0.30 on the Advera section. The lower value on the Advera section is
not attributed to the use of the Advera process. The skid number values would be expected to
increase once the surface had been subjected to environmental aging and traffic wear.
Table 2.14: Results of Skid Resistance Testing
Dynamic Friction Tester (DFT) Section Chainage Sp
1 FR602 IFI3 Backcalc SN644
Caltrans Skid Tester
15 20 25 30 35
52.2 51.1 60.8 45.7 54.3
0.24 0.23 0.31 0.19 0.26
0.26 0.25 0.31 0.22 0.27
0.37 0.36 0.43 0.32 0.38
Control
Average Std Dev
52.8 5.5
0.25 0.04
0.26 0.03
0.37 0.04
55 60 65 70 75
49.0 41.4 42.5 43.6 36.1
0.23 0.16 0.17 0.18 0.12
0.24 0.20 0.20 0.21 0.17
0.34 0.29 0.29 0.30 0.25
Advera
Average Std Dev
42.5 4.6
0.17 0.03
0.20 0.03
0.29 0.03
15 20 25 30 35
50.0 53.3 47.9 39.3 49.0
0.25 0.24 0.23 0.20 0.24
0.26 0.26 0.25 0.23 0.25
0.38 0.36 0.36 0.33 0.36
Evotherm
Average Std Dev
47.9 5.2
0.23 0.02
0.25 0.01
0.36 0.02
55 60 65 70 75
42.5 51.1 64.0 49.0 50.0
0.23 0.26 0.32 0.26 0.24
0.25 0.27 0.31 0.27 0.25
0.36 0.39 0.43 0.38 0.36
Sasobit
Average Std Dev
51.3 7.8
0.26 0.03
0.27 0.03
0.39 0.03
Data was unavailable to the
UCPRC at the time this report was prepared
1 Speed Constant 2 Calculated friction 3 International Friction Index 4 Backcalculated skid number

Stage 4 Distribution, June 19, 2009
UCPRC-RR-2008-11 53
2.8 Sampling
2.8.1 Samples for Laboratory-Mixed, Laboratory-Compacted Specimen Testing
Laboratory-mixed, laboratory-compacted specimen testing was tentatively planned for the Phase 2
laboratory testing program (3). Mix constituents therefore needed to be collected and stored for later
testing if required. A truckload of aggregate sample was collected from a feed from the aggregate
conveyor into the asphalt plant drum. Asphalt binder samples were collected from the delivery tanker. All
samples were transported to and stored at the UCPRC Richmond Field Station.
2.8.2 Samples for Field-Mixed, Laboratory-Compacted Specimen Testing
In most experiments, field-mixed samples are collected from the paver, stored in buckets, transported to
the laboratory, and then reheated and compacted into molds at a later date. Communication with the
additive suppliers indicated that although Sasobit would retain its properties and could be reheated and
compacted at the original construction temperature (i.e., 120°C [250°F]), the Advera and Evotherm mix
samples would need to be reheated and compacted at normal hot-mix asphalt temperatures (i.e.,
temperatures of 155°C [310°F] used for the Control mix). Compaction at these higher temperatures could
result in the production of specimens that did not have the same characteristics as those compacted at the
lower temperatures used in the experiment. This could lead to inaccurate assumptions with regard to
expected performance.
Field-mixed, laboratory-compacted (FMLC) specimens were therefore prepared on site adjacent to the test
track using jigs, molds, and a rolling-wheel compactor brought from the UCPRC laboratory. Loose mix
was taken from the trucks with a skip loader immediately prior to it being tipped into the paver and then
dumped next to the preparation area. The required volume of material, based on the densities determined
earlier in the Graniterock laboratory, was weighed and then compacted into molds at the same
temperatures as those recorded on the test track. Sufficient specimens were produced to satisfy the needs
of the Phase 2 experimental design for comparing shear and fatigue beam test results on field-mixed, field-
compacted; field-mixed, laboratory-compacted; and laboratory-mixed, laboratory-compacted
specimens (3). The remaining loose mix was placed in buckets for possible later testing. The specimen
preparation process is illustrated in Figure 2.55.
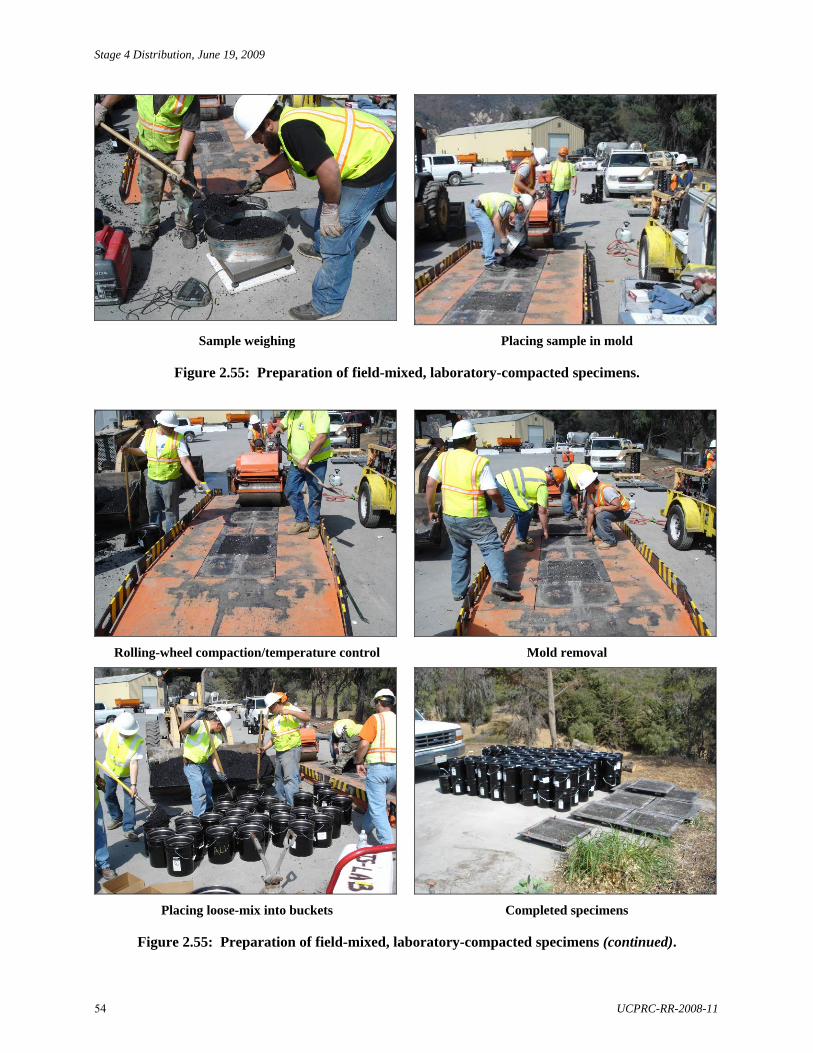
Stage 4 Distribution, June 19, 2009
54 UCPRC-RR-2008-11
Sample weighing Placing sample in mold
Figure 2.55: Preparation of field-mixed, laboratory-compacted specimens.
Rolling-wheel compaction/temperature control Mold removal
Placing loose-mix into buckets Completed specimens
Figure 2.55: Preparation of field-mixed, laboratory-compacted specimens (continued).

Stage 4 Distribution, June 19, 2009
UCPRC-RR-2008-11 55
2.8.3 Field-Mixed, Field-Compacted Samples
Field-mixed, field-compacted (FMFC) specimens in the form of slabs 500 mm by 500 mm (20 in.) for
Phase 1 laboratory testing were sawn from an area 20 m by 0.5 m (66 ft by 1.6 ft) along the edge of each
panel in the test track as shown in Figure 2.56. Slabs were sawn to the bottom of the asphalt concrete
layers, extracted, stored on pallets, and then transported to the UCPRC Richmond Field Station laboratory.
Inspection of the slabs indicated that the asphalt concrete was well bonded to the top of the base-course
material, and that the two asphalt layers were well bonded to each other.
2.9 Construction Summary
Key observations from the mix production and construction process include:
Overwatering during the early stages of base-course construction resulted in some weak areas.
Moisture contents were highest in the area shaded by the shed.
Average dry density on the base-course was 97 percent of the laboratory-determined maximum dry
density. The final surface was tightly bound and free of loose material.
Deflection measurements indicated that a relatively stiff and uniform base-course was constructed
over a very stiff subgrade (bedrock). The deflections on the Control and Evotherm sections (shaded
by the shed) were slightly lower than the Advera and Sasobit sections. A very stiff pavement
structure will complicate any planned fatigue cracking experiments in that a very high number of
HVS repetitions will be required before the pavement cracks.
Minimal asphalt plant modifications were required to accommodate the warm-mix additives.
No problems were noted with producing the asphalt mixes at the lower temperatures. Target mix
production temperatures (i.e., 155°C and 120°C [310°F and 250°F]) were achieved.
Although a PG 64-16 asphalt binder was specified in the work plan, subsequent tests by the FHWA
indicated that the binder was rated as PG64-22. This should not affect the outcome of the
experiment. After mixing Advera and Sasobit with the binder, the PG grading changed from PG 64-
22 to PG 70-22. The addition of Evotherm did not alter the PG grade.
The Control, Advera, and Evotherm mixes met the project mix design requirements. The binder
content of the Sasobit was 0.72 percent below the target binder content and 0.22 percent below the
lowest permissible binder content. This will probably influence performance and will need to be
taken into consideration when interpreting HVS and laboratory test results.
The Control mix had a higher specific gravity and Marshall stability, and a lower air-void content
than the mixes with additives. It is not clear whether this was a testing inconsistency or linked to the
lower production and specimen preparation temperatures. This will need to be investigated in the
planned Phase 2 laboratory study.

Stage 4 Distribution, June 19, 2009
56 UCPRC-RR-2008-11
Figure 2.56: Test track sampling plan and sample removal.
Moisture contents of the mixes with additives were notably higher than that of the Control mix,
indicating that potentially less moisture evaporates from the aggregate at lower production
temperatures. All mixes were, however, well within the minimum Caltrans-specified moisture
content level. Aggregate moisture contents will need to be strictly controlled in the stockpiles and

Stage 4 Distribution, June 19, 2009
UCPRC-RR-2008-11 57
maximum moisture contents prior to mix production may need to be set if warm-mix technologies
are routinely used.
Construction procedures and final pavement quality did not appear to be influenced by the lower
construction temperatures. The Advera mix showed no evidence of tenderness, and acceptable
compaction was achieved. Some tenderness resulting in shearing under the rollers was noted at
various stages of breakdown and/or rubber-tired rolling on the Evotherm and Sasobit sections,
indicating that the compaction temperatures were still higher than optimal. No problems were
observed after final rolling at lower temperatures.
Interviews with the paving crew after construction revealed that no problems were experienced with
construction at the lower temperatures. Improved working conditions were identified as an
advantage. Tenderness on the Evotherm and Sasobit sections was not considered as being
significantly different than that experienced with conventional mixes.
Although temperatures at the beginning of compaction on the warm-mix sections were considerably
lower than the Caltrans-specified limits, the temperatures recorded on completion of compaction
were within limits, indicating that the rate of temperature loss in the mixes with additives was lower
than that on the Control section.
Some haze/smoke was evident on the Control mix during transfer of the mix from the truck to the
paver. No haze or smoke was observed on the mixes with additives.
Average thickness of the two layers was 112 mm (4.4 in.). Minimal variation was observed, but
cannot be fully quantified until cores are taken.
Average air-void contents on the Control and Advera sections were 5.6 percent and 5.4 percent,
respectively. Those on the Evotherm and Sasobit sections, which showed signs of tenderness during
rolling, were approximately 7.0 percent. Based on these observations, it was concluded that
adequate compaction can be achieved on warm-mixes at the lower temperatures. Optimal
compaction temperatures are likely to differ between the different warm-mix technologies.
Deflection measurements showed that relatively consistent construction was achieved on the test
track. Lower deflection was recorded on the Advera and Sasobit sections, which was attributed to
slightly better support (drier) conditions in the base.
Skid resistance measurements indicated that the warm-mix additives tested do not influence the skid
resistance of an asphalt mix.

Stage 4 Distribution, June 19, 2009
58 UCPRC-RR-2008-11

Stage 4 Distribution, June 19, 2009
UCPRC-RR-2008-11 59
3. TEST TRACK LAYOUT AND HVS TEST CRITERIA
3.1 Protocols
Heavy Vehicle Simulator (HVS) test section layout, test setup, trafficking, and measurements followed
standard University of California Pavement Research Center (UCPRC) protocols (5).
3.2 Test Track Layout
The Warm-Mix Asphalt Study test track layout is shown in Figure 3.1. Four HVS Test Sections were
demarcated for the first phase of HVS testing for early-age rutting at high temperatures, which was carried
out in the same order as construction (i.e., Control followed by warm-mixes in alphabetical order). The
section numbers allocated were as follows:
Section 600FD: Control
Section 601FD: Advera
Section 602FD: Evotherm
Section 603FD: Sasobit
3.3 HVS Test Section Layout
The general test section layout for each of the rutting sections is shown in Figure 3.2. Station numbers
(0 to 16) refer to fixed points on the test section and are used for measurements and as a reference for
discussing performance.
3.4 Pavement Instrumentation and Monitoring Methods
Measurements were taken with the instruments listed below. Instrument positions are shown in Figure 3.2.
Detailed descriptions of the instrumentation and measuring equipment are included in Reference 6.
Intervals between measurements, in terms of load repetitions, were selected to enable adequate
characterization of the pavement as damage developed.
Laser profilometer, measuring surface profile. Measurements are taken at each station.
Thermocouples, measuring pavement temperature (at Stations 4 and 12) and ambient temperature at
one-hour intervals during HVS operation.
Air temperatures were measured at a weather station approximately 150 m (500 ft) from the test section
and recorded at the same intervals as the thermocouples.

Stage 4 Distribution, June 19, 2009
60 UCPRC-RR-2008-11
Shed
Control
Evotherm
Advera
Sasobit
0m 40m 80m6 – 14m 46 – 54m
40m 60m 80m
4m
0m46 – 54m
0 16
600mm
0m
8m
Caravan
Traffic Cab
600FD
602FD
601FD
603FD
Test sequence1. Control2. Advera3. Evotherm4. Sasobit
604FD
606FD
605FD
607FD
N
Shed
Control
Evotherm
Advera
Sasobit
0m 40m 80m6 – 14m6 – 14m 46 – 54m
40m 60m 80m
4m
0m46 – 54m
0 16
600mm
0m
8m
Caravan
Traffic Cab
600FD
602FD
601FD
603FD
Test sequence1. Control2. Advera3. Evotherm4. Sasobit
604FD
606FD
605FD
607FD
N
Figure 3.1: Layout of test track and HVS test sections.

Stage 4 Distribution, June 19, 2009
UCPRC-RR-2008-11 61
60 mm DGAC
0 mm25 mm50 mm90 mm
120 mm
Thermocouple Thermocouple
60 mm DGAC
300 mm Aggregate Base
0 1 2 3 4 5 6 7 8 9 10 11 12 13 14 15 16
y
x
Station Number (unit: 0.5 m)
1 m
Subgrade
N
LEGENDThermocouple TS Traffic Side CL Central Line CS Caravan Side
8.0 m
60 mm DGAC
0 mm25 mm50 mm90 mm
120 mm
0 mm25 mm50 mm90 mm
120 mm
Thermocouple Thermocouple
60 mm DGAC
300 mm Aggregate Base
0 1 2 3 4 5 6 7 8 9 10 11 12 13 14 15 16
y
x
Station Number (unit: 0.5 m)
1 m
Subgrade
N
LEGENDThermocouple TS Traffic SideTS Traffic Side CL Central LineCL Central Line CS Caravan SideCS Caravan Side
8.0 m8.0 m
Figure 3.2: Phase 1 test section layout and location of thermocouples.

Stage 4 Distribution, June 19, 2009
62 UCPRC-RR-2008-11
Surface and in-depth deflections were not measured. Surface deflection cannot be measured with the Road
Surface Deflectometer (RSD) on rutted pavements. In-depth deflection measured with Multi-Depth
Deflectometers (MDD) was not possible due to difficulties with installing and anchoring the instruments
in the bedrock.
3.5 HVS Test Criteria
3.5.1 Test Section Failure Criteria
An average maximum rut of 12.5 mm (0.5 in.) over the full monitored section (Station 3 to Station 13)
was set as the failure criteria for the experiment.
3.5.2 Environmental Conditions
The pavement temperature at 50 mm (2.0 in.) was maintained at 50°C4°C (122°F7°F) to assess rutting
potential under typical pavement conditions. Infrared heaters inside a temperature control chamber (7)
were used to maintain the pavement temperature. The pavement surface received no direct rainfall as it
was protected by the temperature control chamber. The sections were tested predominantly during the wet
season (October through March), however, it is unlikely that any water entered the pavement structure due
to the confinement on both sides of the test track.
3.5.3 Test Duration
HVS trafficking on each section was initiated and completed as shown in Table 3.1.
Table 3.1: Test Duration for Phase 1 HVS Rutting Tests
Section Overlay Start Date Finish Date Repetitions 600FD 601FD 602FD 603FD
Control Advera
Evotherm Sasobit
10/17/2007 12/02/2007 12/29/2007 01/28/2008
11/21/2007 12/19/2007 01/22/2008 03/08/2008
195,000 170,000 185,000 285,000
3.5.4 Loading Program
The HVS loading program for each section is summarized in Table 3.2. Equivalent Standard Axle Loads
(ESALs) were determined using the following Caltrans conversion (Equation 3.1):
ESALS = (axle load/18000)4.2 (3.1)
All trafficking was carried out with a dual-wheel configuration, using radial truck tires (Goodyear G159 -
11R22.5- steel belt radial) inflated to a pressure of 720 kPa (104 psi), in a channelized, unidirectional
loading mode.

Stage 4 Distribution, June 19, 2009
UCPRC-RR-2008-11 63
Load was checked with a portable weigh-in-motion pad at the beginning of each test and after each load
change.
Table 3.2: Summary of HVS Loading Program
Section Overlay Wheel Load1
(kN) Repetitions ESALs2
600FD Control 40 60
185,000 10,000
239,900
601FD Advera 40 170,000 170,000 602FD Evotherm 40 185,000 185,000 603FD Sasobit 40
60 185,000 100,000
734,014
Total 835,000 1,328,914 1 40 kN = 9,000 lb. 60 kN = 13,500 lb 2 ESAL: Equivalent Standard Axle Load

Stage 4 Distribution, June 19, 2009
64 UCPRC-RR-2008-11

Stage 4 Distribution, June 19, 2009
UCPRC-RR-2008-11 65
4. PHASE 1 HVS TEST DATA SUMMARY
4.1 Introduction
This chapter provides a summary of the data collected from the four HVS tests (Sections 600FD through
603FD) and a brief discussion of the first-level analysis. Data collected included rainfall, air temperatures
inside and outside the temperature control chamber, pavement temperatures, and surface permanent
deformation.
Pavement temperatures were controlled using the temperature control chamber. Both air (inside and
outside the temperature box) and pavement temperatures were monitored and recorded hourly during the
entire loading period. In assessing rutting performance, the temperature at the bottom of the asphalt
concrete and the temperature gradient are two important controlling temperature parameters influencing
the stiffness of the asphalt concrete and are used to compute plastic strain. Permanent deformation at the
pavement surface (rutting) was monitored with the Laser Profilometer. In-depth permanent deformation at
various depths within the pavement was not monitored due to the presence of bedrock and associated
difficulties with the installation of Multi-Depth Deflectometers. The following rut parameters were
determined from these measurements, as illustrated in Figure 4.1:
Average maximum rut depth,
Average deformation,
Location and magnitude of the maximum rut depth, and
Rate of rut development.
-4
-3
-2
-1
0
1
2
3
4
0 0.5 1 1.5 2 2.5
Transverse Distance (m)
De
form
ati
on
(m
m)
Maximum Rut Depth
Average Deformation
Figure 4.1: Illustration of maximum rut depth and average deformation of a leveled profile.

Stage 4 Distribution, June 19, 2009
66 UCPRC-RR-2008-11
The Laser Profilometer provides sufficient information to evaluate the evolution of permanent surface
deformation of the entire test section at various loading stages. The rut depth figures in this report show
the average values over the entire section (Stations 3 through 13) as well as values for half sections
between Stations 3 and 8 and Stations 9 and 13. These two additional data series were plotted to illustrate
any differences along the length of the section. The precise nature of the permanent deformation will only
be determined after a forensic investigation (test pits and cores) on each section when all testing on the
test track has been completed.
The data from each HVS test is presented separately, with the presentation of each test following the same
format. Data plots are presented on the same scale to facilitate comparisons of performance. Interpretation
of the data in terms of pavement performance will be discussed in a separate second-level analysis report.
4.2 Rainfall
Figure 4.2 shows the monthly rainfall data from August 2007 through March 2008 as measured at the
weather station close to the test track. Rainfall was measured during all four Phase 1 HVS tests, with one
significant rainfall event of 120.4 mm (4.7 in.) in a 24 hour period recorded during testing on
Section 602FD. Rainfall in excess of 25 mm (1.0 in.) was recorded on three days during testing on
Sections 601FD (one day) and 602FD (two days).
0
20
40
60
80
100
120
140
8/16/07 9/27/07 10/27/07 11/26/07 12/26/07 1/25/08 2/24/08 3/25/08
Date
Dai
ly R
ain
fall
(m
m)
600FD(Control)
601FD(Advera)
602FD(Evotherm)
603FD(Sasobit)
Figure 4.2: Measured rainfall during Phase 1 HVS testing.

Stage 4 Distribution, June 19, 2009
UCPRC-RR-2008-11 67
4.3 Section 600FD: Control
4.3.1 Test Summary
Loading commenced on October 17, 2007, and ended on November 21, 2007. A total of 195,000 load
repetitions were applied and 47 datasets were collected. Testing was interrupted for eight days
(November 2, 2008 through November 10, 2008) due to a carriage computer malfunction caused by the
high testing temperatures. Modifications were made to the equipment to prevent a recurrence; however,
intermittent problems were experienced for the remainder of the test. Trafficking was also stopped at
155,000 repetitions in order to increase the pavement temperature to 55°C (131°F). The HVS loading
history for Section 600FD is shown in Figure 4.3.
0
25
50
75
100
125
150
175
200
225
250
10/13/07 10/20/07 10/27/07 11/3/07 11/10/07 11/17/07 11/24/07
Date
Lo
ad R
ep
eti
tio
ns
(x
1,0
00)
Number of Load Repetitions
Breakdown
40kN50C
40kN55C
60kN55C
Figure 4.3: 600FD: Load history.
4.3.2 Outside Air Temperatures
Outside air temperatures are summarized in Figure 4.4. Vertical error bars on each point on the graph
show daily temperature range. Temperatures ranged from 4.5°C to 36.6°C (40°F to 98°F) during the
course of HVS testing, with a daily average of 14.2°C (58°F), an average minimum of 9.3°C (49°F), and
an average maximum of 22.7°C (73°F).
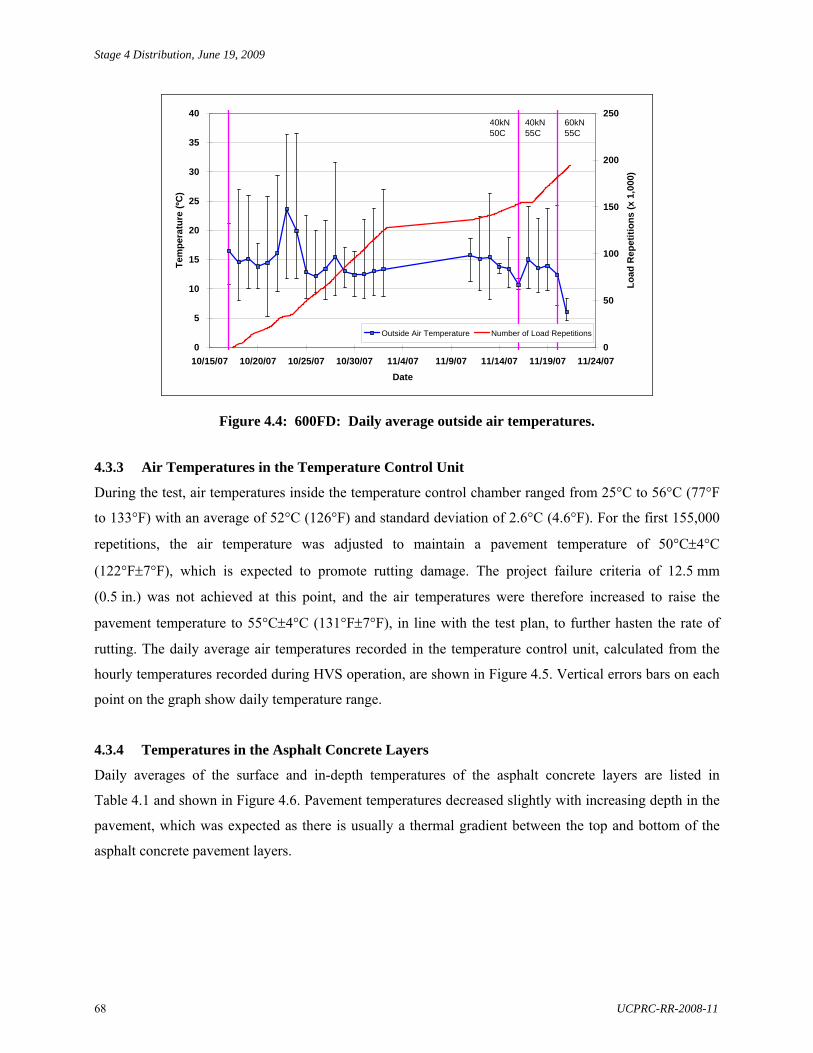
Stage 4 Distribution, June 19, 2009
68 UCPRC-RR-2008-11
0
5
10
15
20
25
30
35
40
10/15/07 10/20/07 10/25/07 10/30/07 11/4/07 11/9/07 11/14/07 11/19/07 11/24/07
Date
Tem
per
atu
re (
ºC)
0
50
100
150
200
250
Lo
ad
Re
pet
itio
ns
(x 1
,000
)
Outside Air Temperature Number of Load Repetitions
40kN50C
40kN55C
60kN55C
Figure 4.4: 600FD: Daily average outside air temperatures.
4.3.3 Air Temperatures in the Temperature Control Unit
During the test, air temperatures inside the temperature control chamber ranged from 25°C to 56°C (77°F
to 133°F) with an average of 52°C (126°F) and standard deviation of 2.6°C (4.6°F). For the first 155,000
repetitions, the air temperature was adjusted to maintain a pavement temperature of 50°C4°C
(122°F7°F), which is expected to promote rutting damage. The project failure criteria of 12.5 mm
(0.5 in.) was not achieved at this point, and the air temperatures were therefore increased to raise the
pavement temperature to 55°C4°C (131°F7°F), in line with the test plan, to further hasten the rate of
rutting. The daily average air temperatures recorded in the temperature control unit, calculated from the
hourly temperatures recorded during HVS operation, are shown in Figure 4.5. Vertical errors bars on each
point on the graph show daily temperature range.
4.3.4 Temperatures in the Asphalt Concrete Layers
Daily averages of the surface and in-depth temperatures of the asphalt concrete layers are listed in
Table 4.1 and shown in Figure 4.6. Pavement temperatures decreased slightly with increasing depth in the
pavement, which was expected as there is usually a thermal gradient between the top and bottom of the
asphalt concrete pavement layers.

Stage 4 Distribution, June 19, 2009
UCPRC-RR-2008-11 69
15
20
25
30
35
40
45
50
55
60
65
10/15/07 10/20/07 10/25/07 10/30/07 11/4/07 11/9/07 11/14/07 11/19/07 11/24/07
Date
Te
mp
era
ture
(ºC
)
0
50
100
150
200
250
Lo
ad R
epet
itio
ns
(x 1
,00
0)
Inside Air TemperatureNumber of Load Repetitions
40kN50C
40kN55C
60kN55C
Figure 4.5: 600FD: Daily average inside air temperatures.
Table 4.1: 600FD: Temperature Summary for Air and Pavement
Temperature Average (°C) Std Dev (°C) Average (°F) Std Dev (°F) 0 to 155,000 Repetitions
Outside air Inside air Pavement surface - 25 mm below surface - 50 mm below surface - 90 mm below surface - 120 mm below surface
14.6 51.5 50.8 49.8 49.0 47.4 42.2
2.7 2.6 2.0 1.9 2.0 2.2 2.3
58.3 124.7 123.4 121.6 120.2 117.3 108.0
4.9 4.7 3.6 3.4 3.6 4.0 4.1
155,000 to 195,000 Repetitions Outside air Inside air Pavement surface - 25 mm below surface - 50 mm below surface - 90 mm below surface - 120 mm below surface
11.5 54.2 56.0 55.4 54.9 53.5 52.4
3.7 1.6 0.9 0.2 0.1 0.1 0.3
52.7 129.6 132.8 131.7 130.8 128.3 126.3
6.7 2.9 1.6 0.4 0.2 0.2 0.5

Stage 4 Distribution, June 19, 2009
70 UCPRC-RR-2008-11
15
20
25
30
35
40
45
50
55
60
65
10/15/07 10/20/07 10/25/07 10/30/07 11/4/07 11/9/07 11/14/07 11/19/07 11/24/07
Date
Tem
per
atu
re (
ºC)
0
50
100
150
200
250
Lo
ad R
epe
titi
on
s (x
1,0
00)
Surface 25-mm Below Surface
50-mm Below Surface 90-mm Below Surface
120-mm Below Surface Number of Load Repetitions
40kN50C
40kN55C
60kN55C
Figure 4.6: 600FD: Daily average temperatures at pavement surface and various depths.
4.3.5 Permanent Surface Deformation (Rutting)
Figure 4.7 shows the average transverse cross section measured with the Laser Profilometer at various
stages of the test. This plot clearly shows the increase in rutting and deformation over the duration of the
test.
During HVS testing, rutting usually occurs at a high rate initially, and then it typically diminishes as
trafficking progresses until reaching a steady state. This initial phase is referred to as the “embedment”
phase. Figure 4.8 and Figure 4.9 show the development of permanent deformation (average maximum rut
and average deformation, respectively) with load repetitions as measured with the Laser Profilometer for
the test section, with an embedment phase only apparent at the beginning of the experiment (i.e., first
25,000 repetitions). Error bars on the average reading indicate that there was very little variation along the
length of the section. Figure 4.10 shows a contour plot of the pavement surface at the end of the test
(195,000 repetitions), also indicating minimal variation along the section. A slightly deeper rut was
recorded in one of the wheel tracks, which was attributed to the positioning of the HVS on the crossfall on
the section. After completion of trafficking, the average maximum rut depth and the average deformation
were 12.4 mm (0.49 in.) and 6.3 mm (0.25 in.), respectively. The maximum rut depth measured on the
section was 14.0 mm (0.55 in.), recorded at Station 9.

Stage 4 Distribution, June 19, 2009
UCPRC-RR-2008-11 71
-10
-8
-6
-4
-2
0
2
4
6
8
10
-1,000 -500 0 500 1,000 1,500
Transverse Position (mm)
Ru
t D
ep
th (
mm
)
500 5,000 22,171 52,700 155,000 195,000
Wheelpath Width
x= -350 x=950
Figure 4.7: 600FD: Profilometer cross section at various load repetitions.
0
2
4
6
8
10
12
14
16
0 50 100 150 200 250 300
Load Repetitions (x 1,000)
Max
imu
m T
ota
l R
ut
(mm
)
Overall AverageAverage for Stations 3 to 7Average for Stations 8 to 13
40kN50C
40kN55C
60kN55C
Figure 4.8: 600FD: Average maximum rut.

Stage 4 Distribution, June 19, 2009
72 UCPRC-RR-2008-11
0
1
2
3
4
5
6
7
8
9
0 50 100 150 200 250 300
Load Repetitions (x 1,000)
Ave
rag
e R
ut
(mm
)
Overall AverageAverage for Stations 3 to 7Average for Stations 8 to 13
40kN50C
40kN55C
60kN55C
Figure 4.9: 600FD: Average deformation.
Color Map for Profilometer Reading (mm)-10.3 -8.2 -6.0 -3.9 -1.7 0.4 2.6 4.7
0 2 4 6 8 10 12 14 16
-500
0
500
1000
Stations
Tra
nsve
rse
Dis
tan
ce (
mm
)
Figure 4.10: 600FD: Contour plot of permanent surface deformation at end of test.
4.3.6 Visual Inspection
Apart from rutting, no other distress was recorded on the section. Figure 4.11 is a photograph taken of the
surface at the end of the test.

Stage 4 Distribution, June 19, 2009
UCPRC-RR-2008-11 73
Figure 4.11: 600FD: Section photograph at test completion.
4.4 Section 601FD: Advera
4.4.1 Test Summary
Loading commenced on December 2, 2007, and ended on December 19, 2007. A total of 170,000 load
repetitions were applied and 27 datasets were collected. Fewer load repetitions (25,000 less) were applied
compared to the Control. The HVS loading history for Section 601FD is shown in Figure 4.12. No
breakdowns occurred during this test.
0
25
50
75
100
125
150
175
200
225
250
12/1/07 12/8/07 12/15/07 12/22/07
Date
Lo
ad R
ep
etit
ion
s (x
1,0
00)
Number of Load Repetitions
40kN50C
Figure 4.12: 601FD: Load history.

Stage 4 Distribution, June 19, 2009
74 UCPRC-RR-2008-11
4.4.2 Outside Air Temperatures
Outside air temperatures are summarized in Figure 4.13. Vertical error bars on each point on the graph
show daily temperature range. Temperatures ranged from -0.3°C to 25.5°C (32°F to 78°F) during the
course of HVS testing, with a daily average of 9.4°C (49°F), an average minimum of 4.4°C (39°F), and an
average maximum of 17.4°C (63°F). Outside air temperatures were considerably cooler during testing on
Section 601FD compared to Section 600FD (daily average 5°C [9°F] cooler).
0
5
10
15
20
25
30
35
40
12/1/07 12/8/07 12/15/07 12/22/07
Date
Tem
per
atu
re (
ºC)
0
50
100
150
200
250
Lo
ad R
ep
etit
ion
s (x
1,0
00)
Outside Air Temperature Number of Load Repetitions40kN50C
Figure 4.13: 601FD: Daily average outside air temperatures.
4.4.3 Air Temperatures in the Temperature Control Unit
During the test, the measured air temperatures inside the temperature control chamber ranged from 25°C
to 56°C (77°F to 133°F) with an average of 36°C (97°F) and standard deviation of 6.2°C (11.2°F). The
daily average air temperatures recorded in the temperature control unit, calculated from the hourly
temperatures recorded during HVS operation, are shown in Figure 4.14. Vertical errors bars on each point
on the graph show daily temperature range. These inside air temperatures do not correspond with the
outside air temperatures and pavement temperatures or to the inside air temperatures measured on the
other tests. This anomaly was attributed to air leaks next to the sensors. The recorded pavement
temperatures discussed in Section 4.4.4 indicate that the inside air temperatures were adjusted
appropriately to maintain a pavement temperature of 50°C4°C (122°F7°F) for the entire test. The
temperature was not raised to 55°C4°C (131°F7°F) after 155,000 repetitions due the average maximum
rut depth being close to the failure criteria at this point.

Stage 4 Distribution, June 19, 2009
UCPRC-RR-2008-11 75
15
20
25
30
35
40
45
50
55
60
65
12/1/07 12/8/07 12/15/07 12/22/07
Date
Tem
per
atu
re (
ºC)
0
50
100
150
200
250
Lo
ad R
epet
itio
ns
(x 1
,000
)
Inside Air TemperatureNumber of Load Repetitions
40kN50C
Figure 4.14: 601FD: Daily average inside air temperatures. (This data is potentially incorrect due to sensor malfunction or temperature chamber air leak close to the sensor.)
4.4.4 Temperatures in the Asphalt Concrete Layers
Daily averages of the surface and in-depth temperatures of the asphalt concrete layers are listed in
Table 4.2 and shown in Figure 4.15. Pavement temperatures decreased slightly with increasing depth in
the pavement, as expected. Average pavement temperatures at all depths of Section 601FD were similar to
those recorded on the Control, despite lower outside temperatures.
Table 4.2: 601FD: Temperature Summary for Air and Pavement
601FD 600FD Temperature Average (°C) Std Dev (°C) Average (°F) Average (°C)
0 to 170,000 Repetitions Outside air Inside air Pavement surface - 25 mm below surface - 50 mm below surface - 90 mm below surface - 120 mm below surface
9.4 35.5 50.8 50.7 50.1 48.6 47.6
3.0 6.2 2.1 2.0 1.9 1.7 1.6
48.9 95.9 123.4 123.3 122.2 119.5 117.7
14.6 51.5 50.8 49.8 49.0 47.4 42.2

Stage 4 Distribution, June 19, 2009
76 UCPRC-RR-2008-11
15
20
25
30
35
40
45
50
55
60
65
12/1/07 12/8/07 12/15/07 12/22/07
Date
Te
mp
erat
ure
(ºC
)
0
50
100
150
200
250
Lo
ad R
epet
itio
ns
(x 1
,000
)
Surface 25-mm Below Surface50-mm Below Surface 90-mm Below Surface120-mm Below Surface Number of Load Repetitions
40kN50C
Figure 4.15: 601FD: Daily average temperatures at pavement surface and various depths.
4.4.5 Permanent Surface Deformation (Rutting)
Figure 4.16 shows the average transverse cross section measured with the Laser Profilometer at various
stages of the test. This plot clearly shows the increase in rutting and deformation over the duration of the
test.
Figure 4.17 and Figure 4.18 show the development of permanent deformation (average maximum rut and
average deformation, respectively) with load repetitions as measured with the Laser Profilometer for the
test section. Results for the Control section (Section 600FD) are also shown for comparative purposes.
Although the embedment phase was of similar duration for both sections, a slightly deeper average
maximum rut was recorded on Section 601FD at the end of the embedment phase (6.5 mm [0.26 in.])
compared to the control (4.3 mm [0.17 in.]). This was attributed to less oxidation of the binder, and
consequent lower stiffness of the asphalt, because of the lower production and construction temperatures.
The slightly higher moisture content of the Advera mix, compared to that of the Control, may also have
had an influence. Thereafter a similar rutting behavior trend was recorded, although the average
deformation (down rut) on Section 601FD was lower than that recorded on the Control. Error bars on the
average reading indicate that there was very little variation along the length of the section. Figure 4.19
shows a contour plot of the pavement surface at the end of the test (170,000 repetitions), also indicating
minimal variation along the section. After completion of trafficking, the average maximum rut depth and
the average deformation were 12.4 mm (0.49 in.) and 5.0 mm (0.20 in.), respectively. The maximum rut
depth measured on the section was 13.3 mm (0.52 in.) recorded at Station 10.

Stage 4 Distribution, June 19, 2009
UCPRC-RR-2008-11 77
-10
-8
-6
-4
-2
0
2
4
6
8
10
-1,000 -500 0 500 1,000 1,500
Transverse Position (mm)
Ru
t D
epth
(m
m)
500 2,000 9,500 25,000 78,225 170,000
Wheelpath Width
x= -350 x=950
Figure 4.16: 601FD: Profilometer cross section at various load repetitions.
0
2
4
6
8
10
12
14
16
0 50 100 150 200 250 300
Load Repetitions (x 1,000)
Max
imu
m T
ota
l R
ut
(mm
)
Overall Average Average for Stations 3 to 7Average for Stations 8 to 13 Overall Average for Control
40kN50C
Figure 4.17: 601FD: Average maximum rut.

Stage 4 Distribution, June 19, 2009
78 UCPRC-RR-2008-11
0
1
2
3
4
5
6
7
8
9
0 50 100 150 200 250 300
Load Repetitions (x 1,000)
Ave
rag
e R
ut
(mm
)
Overall Average Average for Stations 3 to 7
Average for Stations 8 to 13 Overall Average for Control
40kN50C
Figure 4.18: 601FD: Average deformation.
Color Map for Profilometer Reading (mm)-7.9 -5.9 -4.0 -2.1 -0.1 1.8 3.7 5.7
0 2 4 6 8 10 12 14 16
-500
0
500
1000
Stations
Tra
nsve
rse
Dis
tan
ce (
mm
)
Figure 4.19: 601FD: Contour plot of permanent surface deformation at end of test.
4.4.6 Visual Inspection
Apart from rutting, no other distress was recorded on the section, which was similar in appearance to the
Control (Figure 4.11) at the end of testing.

Stage 4 Distribution, June 19, 2009
UCPRC-RR-2008-11 79
4.5 Section 602FD: Evotherm
4.5.1 Test Summary
Loading commenced on December 29, 2007, and ended on January 22, 2008. A total of 185,000 load
repetitions were applied and 35 datasets were collected. Fewer load repetitions (10,000 less) were applied
compared to the Control. The HVS loading history for Section 602FD is shown in Figure 4.20. A three-
day carriage computer breakdown occurred during the first week of testing. Trafficking was also stopped
at 155,000 repetitions while the pavement temperature was raised.
0
25
50
75
100
125
150
175
200
225
250
12/22/07 12/29/07 1/5/08 1/12/08 1/19/08 1/26/08
Date
Lo
ad R
ep
etit
ion
s (x
1,0
00)
Number of Load Repetitions
40kN50C
40kN55C
Breakdown
Figure 4.20 602FD: Load history.
4.5.2 Outside Air Temperatures
Outside air temperatures are summarized in Figure 4.21. Vertical error bars on each point on the graph
show daily temperature range. Temperatures ranged from 0.2°C to 19.5°C (32°F to 67°F) during the
course of HVS testing, with a daily average of 8.6°C (47°F), an average minimum of 4.5°C (39°F), and an
average maximum of 14.0°C (57°F). Outside air temperatures were considerably cooler during testing on
Section 602FD compared to those during testing of Section 600FD (daily average 5.6°C [10°F] cooler).

Stage 4 Distribution, June 19, 2009
80 UCPRC-RR-2008-11
0
5
10
15
20
25
30
35
40
12/22/07 12/29/07 1/5/08 1/12/08 1/19/08 1/26/08
Date
Te
mp
erat
ure
(ºC
)
0
50
100
150
200
250
Lo
ad R
epe
titi
on
s (x
1,0
00)
Outside Air Temperature Number of Load Repetitions 40kN50C
40kN55C
Figure 4.21: 602FD: Daily average outside air temperatures.
4.5.3 Air Temperatures in the Temperature Control Unit
During the test, air temperatures inside the temperature control chamber ranged from 28°C to 56°C (82°F
to 133°F) with an average of 48°C (118°F) and standard deviation of 2.5°C (4.5°F). The air temperature
was adjusted to maintain a pavement temperature of 50°C4°C (122°F7°F) for the first 155,000
repetitions, and 55°C4°C (131°F7°F) thereafter. The daily average air temperatures recorded in the
temperature control unit, calculated from the hourly temperatures recorded during HVS operation, are
shown in Figure 4.22. Vertical errors bars on each point on the graph show daily temperature range.
4.5.4 Temperatures in the Asphalt Concrete Layers
Daily averages of the surface and in-depth temperatures of the asphalt concrete layers are listed in
Table 4.3 and shown in Figure 4.23. Pavement temperatures decreased slightly with increasing depth in
the pavement, as expected. Average pavement temperatures at all depths of Section 602FD were similar to
those recorded on the Control, despite lower outside temperatures.
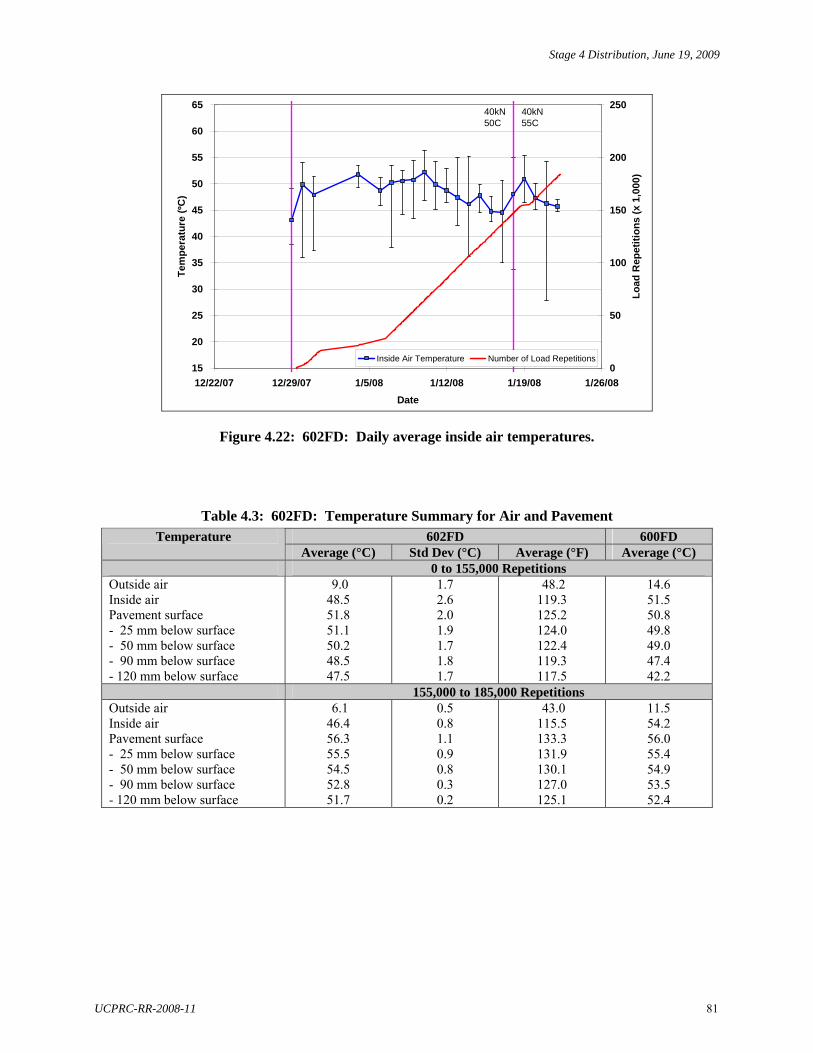
Stage 4 Distribution, June 19, 2009
UCPRC-RR-2008-11 81
15
20
25
30
35
40
45
50
55
60
65
12/22/07 12/29/07 1/5/08 1/12/08 1/19/08 1/26/08
Date
Tem
per
atu
re (
ºC)
0
50
100
150
200
250
Lo
ad R
epet
itio
ns
(x 1
,000
)
Inside Air Temperature Number of Load Repetitions
40kN50C
40kN55C
Figure 4.22: 602FD: Daily average inside air temperatures.
Table 4.3: 602FD: Temperature Summary for Air and Pavement
602FD 600FD Temperature Average (°C) Std Dev (°C) Average (°F) Average (°C)
0 to 155,000 Repetitions Outside air Inside air Pavement surface - 25 mm below surface - 50 mm below surface - 90 mm below surface - 120 mm below surface
9.0 48.5 51.8 51.1 50.2 48.5 47.5
1.7 2.6 2.0 1.9 1.7 1.8 1.7
48.2 119.3 125.2 124.0 122.4 119.3 117.5
14.6 51.5 50.8 49.8 49.0 47.4 42.2
155,000 to 185,000 Repetitions Outside air Inside air Pavement surface - 25 mm below surface - 50 mm below surface - 90 mm below surface - 120 mm below surface
6.1 46.4 56.3 55.5 54.5 52.8 51.7
0.5 0.8 1.1 0.9 0.8 0.3 0.2
43.0 115.5 133.3 131.9 130.1 127.0 125.1
11.5 54.2 56.0 55.4 54.9 53.5 52.4

Stage 4 Distribution, June 19, 2009
82 UCPRC-RR-2008-11
15
20
25
30
35
40
45
50
55
60
65
12/27/07 1/3/08 1/10/08 1/17/08 1/24/08
Date
Tem
per
atu
re (
ºC)
0
50
100
150
200
250
Lo
ad R
ep
etit
ion
s (
x 1
,000
)
Surface 25-mm Below Surface
50-mm Below Surface 90-mm Below Surface
120-mm Below Surface Number of Load Repetitions
40kN50C
40kN55C
Figure 4.23: 602FD: Daily average temperatures at pavement surface and various depths.
4.5.5 Permanent Surface Deformation (Rutting)
Figure 4.24 shows the average transverse cross section measured with the Laser Profilometer at various
stages of the test. This plot clearly shows the increase in rutting and deformation over the duration of the
test.
Figure 4.25 and Figure 4.26 show the development of permanent deformation (average maximum rut and
average deformation, respectively) with load repetitions as measured with the Laser Profilometer for the
test section. Results for the Control section (Section 600FD) are also shown for comparative purposes.
Although the embedment phase was of comparable duration for the both sections, a slightly deeper
average maximum rut was recorded on Section 602FD at the end of the embedment phase (6.1 mm
[0.24 in.]) compared to the control (4.3 mm [0.17 in.]), similar to that recorded on Section 601FD. This
was again attributed to less oxidation of the binder, and consequent lower stiffness of the asphalt, because
of the lower production and construction temperatures. The slightly higher moisture content of the
Evotherm mix, compared to that of the Control, may also have had an influence. Thereafter similar rutting
behavior trends were recorded. Error bars on the average reading indicate that there was some variation
along the length of the section. Figure 4.27 shows a contour plot of the pavement surface at the end of the
test (185,000 repetitions), also indicating a slightly deeper average maximum rut on one half of the
section. After completion of trafficking, the average maximum rut depth and the average deformation
were 12.5 mm (0.5 in.) and 7.0 mm (0.28 in.), respectively. The maximum rut depth measured on the
section was 14.1 mm (0.56 in.) recorded at Station 11.

Stage 4 Distribution, June 19, 2009
UCPRC-RR-2008-11 83
-10
-8
-6
-4
-2
0
2
4
6
8
10
-1,000 -500 0 500 1,000 1,500
Transverse Position (mm)
Ru
t D
epth
(m
m)
500 2,000 9,100 20,000 155,000 185,000
Wheelpath Width
x= -350 x=950
Figure 4.24: 602FD: Profilometer cross section at various load repetitions.
0
2
4
6
8
10
12
14
16
0 50 100 150 200 250 300
Load Repetitions (x 1,000)
Ma
xim
um
To
tal R
ut
(mm
)
Overall Average Average for Stations 3 to 7
Average for Stations 8 to 13 Overall Average for Control
40kN50C
40kN55C
Figure 4.25: 602FD: Average maximum rut.
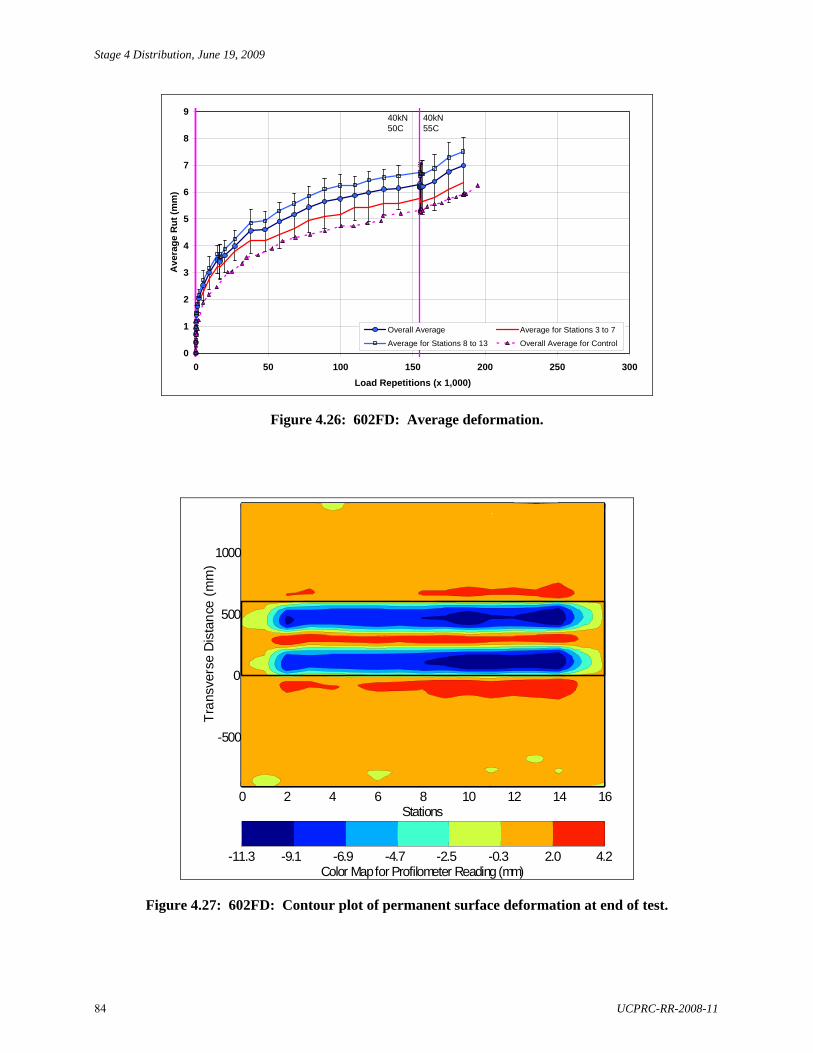
Stage 4 Distribution, June 19, 2009
84 UCPRC-RR-2008-11
0
1
2
3
4
5
6
7
8
9
0 50 100 150 200 250 300
Load Repetitions (x 1,000)
Ave
rag
e R
ut
(mm
)
Overall Average Average for Stations 3 to 7
Average for Stations 8 to 13 Overall Average for Control
40kN50C
40kN55C
Figure 4.26: 602FD: Average deformation.
Color Map for Profilometer Reading (mm)-11.3 -9.1 -6.9 -4.7 -2.5 -0.3 2.0 4.2
0 2 4 6 8 10 12 14 16
-500
0
500
1000
Stations
Tra
nsve
rse
Dis
tan
ce (
mm
)
Figure 4.27: 602FD: Contour plot of permanent surface deformation at end of test.

Stage 4 Distribution, June 19, 2009
UCPRC-RR-2008-11 85
4.5.6 Visual Inspection
Apart from rutting, no other distress was recorded on the section. Figure 4.28 shows photograph taken of
the surface at the end of the test. It is interesting to note that the elevated pavement temperatures kept the
section dry for a number of days during light rainfall after the environmental chamber was removed.
Dry area from retained heat.
Test section after trafficking
Close up of trafficked area
Figure 4.28: 602FD: Section photographs at test completion.
4.6 Section 603FD: Sasobit
4.6.1 Test Summary
Loading commenced on January 28, 2008, and ended on March 28, 2008. A total of 285,000 load
repetitions were applied and 53 datasets were collected. Considerably more load repetitions (90,000) were
applied to Section 603FD compared to the Control; however, the failure criteria of 12.5 mm (0.5 in.) was
not reached and testing was halted in the interest of completing the study. The high rut resistance was
probably attributed to the lower binder content of the mix used on this test section (see Section 2.6) and

Stage 4 Distribution, June 19, 2009
86 UCPRC-RR-2008-11
therefore direct performance comparisons between the Control and this test section are not possible. The
HVS loading history for Section 603FD is shown in Figure 4.29. A five-day carriage computer breakdown
occurred during the first week of testing. Trafficking was also stopped at 155,000 repetitions while the
pavement temperature was raised, per the requirements of the test plan.
0
25
50
75
100
125
150
175
200
225
250
275
300
1/26/08 2/2/08 2/9/08 2/16/08 2/23/08 3/1/08 3/8/08 3/15/08
Date
Lo
ad R
ep
etit
ion
s (x
1,0
00)
Number of Load Repetitions
40kN50C
40kN55C
60kN55C
Breakdown
Figure 4.29: 603FD: Load history.
HVS trafficking on the section was continued for a further 100,000 repetitions (i.e., to 385,000 repetitions)
to collect additional data for calibration of mechanistic-empirical design models. Results from this
additional testing are not discussed in this report.
4.6.2 Outside Air Temperatures
Outside air temperatures are summarized in Figure 4.30. Vertical error bars on each point on the graph
show daily temperature range. Temperatures ranged from 0°C to 33.9°C (32°F to 93°F) during the course
of HVS testing, with a daily average of 10.5°C (51°F), an average minimum of 5.2°C (41°F), and an
average maximum of 19.5°C (67°F). Average outside air temperatures were somewhat warmer during
testing on Section 603FD compared to those during testing on Section 600FD (daily average of 5.63°C
[10°F] warmer).
4.6.3 Air Temperatures in the Temperature Control Unit
During the test, air temperatures inside the temperature control chamber ranged from 18.1°C to 64.7°C
(65°F to 148°F) with an average of 50°C (122°F) and standard deviation of 3.7°C (6.7°F). The air
temperature was adjusted to maintain a pavement temperature of 50°C4°C (122°F7°F) for the first
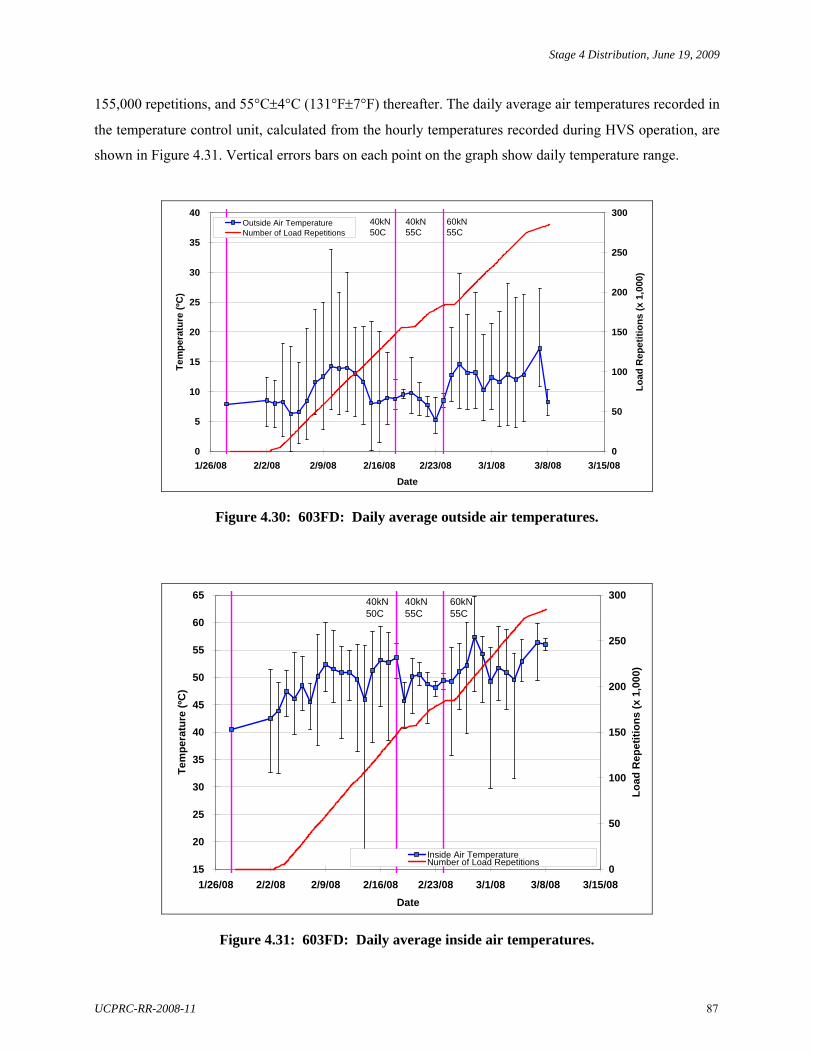
Stage 4 Distribution, June 19, 2009
UCPRC-RR-2008-11 87
155,000 repetitions, and 55°C4°C (131°F7°F) thereafter. The daily average air temperatures recorded in
the temperature control unit, calculated from the hourly temperatures recorded during HVS operation, are
shown in Figure 4.31. Vertical errors bars on each point on the graph show daily temperature range.
0
5
10
15
20
25
30
35
40
1/26/08 2/2/08 2/9/08 2/16/08 2/23/08 3/1/08 3/8/08 3/15/08
Date
Te
mp
era
ture
(ºC
)
0
50
100
150
200
250
300
Lo
ad
Re
pe
titi
on
s (
x 1,
000
)
Outside Air TemperatureNumber of Load Repetitions
40kN50C
40kN55C
60kN55C
Figure 4.30: 603FD: Daily average outside air temperatures.
15
20
25
30
35
40
45
50
55
60
65
1/26/08 2/2/08 2/9/08 2/16/08 2/23/08 3/1/08 3/8/08 3/15/08
Date
Tem
per
atu
re (
ºC)
0
50
100
150
200
250
300
Lo
ad R
epet
itio
ns
(x 1
,000
)
Inside Air TemperatureNumber of Load Repetitions
40kN50C
40kN55C
60kN55C
Figure 4.31: 603FD: Daily average inside air temperatures.

Stage 4 Distribution, June 19, 2009
88 UCPRC-RR-2008-11
4.6.4 Temperatures in the Asphalt Concrete Layers
Daily averages of the surface and in-depth temperatures of the asphalt concrete layers are listed in
Table 4.4 and shown in Figure 4.32. Pavement temperatures decreased slightly with increasing depth in
the pavement, as expected. Average pavement temperatures at all depths on Section 603FD were similar
to those recorded on the Control, despite lower outside temperatures during the first 155,000 repetitions.
Table 4.4: 603FD: Temperature Summary for Air and Pavement
603FD 600FD Average (°C) Std Dev (°C) Average (°F) Average (°C)
Temperature
0 to 155,000 Repetitions Outside air Inside air Pavement surface - 25 mm below surface - 50 mm below surface - 90 mm below surface - 120 mm below surface
9.9 48.7 50.9 49.9 49.8 48.4 47.6
2.7 3.9 2.5 2.2 2.3 2.1 2.2
49.8 119.7 123.6 121.8 121.6 119.1 117.7
14.6 51.5 50.8 49.8 49.0 47.4 42.2
155,000 to 285,000 Repetitions Outside air Inside air Pavement surface - 25 mm below surface - 50 mm below surface - 90 mm below surface - 120 mm below surface
11.9 51.3 55.5 54.5 54.5 53.2 52.4
2.9 3.1 1.5 1.3 1.3 1.1 1.1
53.4 124.3 131.9 130.1 130.1 127.8 126.3
11.5 54.2 56.0 55.4 54.9 53.5 52.4
15
20
25
30
35
40
45
50
55
60
65
1/26/08 2/2/08 2/9/08 2/16/08 2/23/08 3/1/08 3/8/08 3/15/08
Date
Tem
per
atu
re (
ºC)
0
50
100
150
200
250
300
Lo
ad R
epet
itio
ns
(x 1
,000
)
Surface 25-mm Below Surface
50-mm Below Surface 90-mm Below Surface
120-mm Below Surface Number of Load Repetitions
40kN50C
40kN55C
60kN55C
Figure 4.32: 603FD: Daily average temperatures at pavement surface and various depths.

Stage 4 Distribution, June 19, 2009
UCPRC-RR-2008-11 89
4.6.5 Permanent Surface Deformation (Rutting)
Figure 4.33 shows the average transverse cross section measured with the Laser Profilometer at various
stages of the test. This plot clearly shows the increase in rutting and deformation over the duration of the
test.
Figure 4.34 and Figure 4.35 show the development of permanent deformation (average maximum rut and
average deformation, respectively) with load repetitions as measured with the Laser Profilometer for the
test section. Results for the Control section (Section 600FD) are also shown for general comparative
purposes, although no direct comparisons can be made given the difference in binder content between the
two sections. The embedment phase was of shorter duration on Section 603FD compared to
Section 600FD, and the average maximum rut was shallower (2.0 mm [0.1 in.]) compared to the Control
(4.3 mm [0.17 in.]). After the embedment phase, the rate of increase in average maximum rut depth was
significantly slower than that recorded on the Control. Error bars on the average reading indicate that there
was very little variation along the length of the section. Figure 4.36 shows a contour plot of the pavement
surface at the end of the test (285,000 repetitions) that indicates a slightly deeper average maximum rut
under one of the tires. This was attributed to the crossfall on the test track. At the time that trafficking was
halted, the average maximum rut depth and the average deformation were 7.8 mm (0.31 in.) and 4.6 mm
(0.18 in.), respectively. The maximum rut depth measured on the section was 8.8 mm (0.35 in.), recorded
at Station 13.
4.6.6 Visual Inspection
Apart from rutting, no other distress was recorded on the section. Appearance was similar to that shown in
Figure 4.11 and Figure 4.28.

Stage 4 Distribution, June 19, 2009
90 UCPRC-RR-2008-11
-10
-8
-6
-4
-2
0
2
4
6
8
10
-1,000 -500 0 500 1,000 1,500
Transverse Position (mm)
Ru
t D
epth
(m
m)
500 2,000 25,000 155,000 185,000 285,000
Wheelpath Width
x= -500 x=950
Figure 4.33: 603FD: Profilometer cross section at various load repetitions.
0
2
4
6
8
10
12
14
16
0 50 100 150 200 250 300
Load Repetitions (x 1,000)
Max
imu
m T
ota
l R
ut
(mm
)
Overall Average Average for Stations 3 to 7
Average for Stations 8 to 13 Overall Average for Control
40kN50C
40kN55C
60kN55C
Figure 4.34: 603FD: Average maximum rut.

Stage 4 Distribution, June 19, 2009
UCPRC-RR-2008-11 91
0
1
2
3
4
5
6
7
8
9
0 50 100 150 200 250 300
Load Repetitions (x 1,000)
Ave
rag
e R
ut
(mm
)
Overall Average Average for Stations 3 to 7
Average for Stations 8 to 13 Overall Average for Control
40kN50C
40kN55C
60kN55C
Figure 4.35: 603FD: Average deformation.
Color Map for Profilometer Reading (mm)-7.4 -6.1 -4.7 -3.3 -2.0 -0.6 0.7 2.1
0 2 4 6 8 10 12 14 16
-500
0
500
1000
Stations
Tra
nsve
rse
Dis
tan
ce (
mm
)
Figure 4.36: 603FD: Contour plot of permanent surface deformation at end of test.

Stage 4 Distribution, June 19, 2009
92 UCPRC-RR-2008-11
4.7 Test Summary
Testing on the four sections was started in the fall of 2007 and ended in the spring of 2008. The duration
of the tests on the four sections varied from 170,000 load repetitions (Section 602FD) to 285,000 load
repetitions (Section 603FD). A range of daily average temperatures was therefore experienced; however,
the pavement temperatures remained constant throughout HVS trafficking.
Rutting behavior for the four sections is compared in Figure 4.37 (average maximum rut) and Figure 4.38
(average deformation). The duration of the embedment phases on Sections 601FD and 602FD (Advera
and Evotherm) were similar to that of Section 600FD (Control), however, the depth of the ruts at the end
of the embedment phases on these two sections was slightly higher than the Control. In both instances, this
was attributed to less oxidation of the binder during mix production because of the lower plant
temperatures. The slightly higher moisture contents of these mixes may also have had an influence.
Rutting behavior on the warm-mix sections followed trends similar to that of the Control in terms of rut
rate (rutting per load repetition) after the embedment phase. The performance of Section 603FD cannot be
compared with the other three sections given that the binder content of its mix was significantly lower.
Based on these results, it can be concluded that the use of any of the three warm-mix asphalt additives
tested in this experiment and subsequent compaction of the mix at lower temperatures will not
significantly influence the rutting performance of the mix.
0
2
4
6
8
10
12
14
16
0 50 100 150 200 250 300
Load Repetitions (x 1,000)
Ma
xim
um
To
tal
Ru
t (m
m)
600FD (Control) 601FD (Advera)
602FD (Evotherm) 603FD (Sasobit)
40kN50C
40kN55C
60kN55C
Figure 4.37: Comparison of average maximum rut.

Stage 4 Distribution, June 19, 2009
UCPRC-RR-2008-11 93
0
1
2
3
4
5
6
7
8
9
0 50 100 150 200 250 300
Load Repetitions (x 1,000)
Ave
rag
e R
ut
(mm
)
600FD (Control) 601FD (Advera)
602FD (Evotherm) 603FD (Sasobit)
40kN50C
40kN55C
60kN55C
Figure 4.38: Comparison of average deformation.

Stage 4 Distribution, June 19, 2009
94 UCPRC-RR-2008-11

Stage 4 Distribution, June 19, 2009
UCPRC-RR-2008-11 95
5. PHASE 1 LABORATORY TEST DATA SUMMARY
5.1 Experiment Design
Phase 1 laboratory testing included shear, fatigue, and moisture sensitivity tests. Tests on mix properties
were carried out on beams and cores cut from slabs removed from the test track after construction (see
Section 2.8). Typical experimental designs used in previous studies were adopted for this warm-mix
asphalt study to facilitate later comparison of results.
5.1.1 Shear Testing
Test Method
The AASHTO T-320 Permanent Shear Strain and Stiffness Test was used for shear testing in this study. In
the standard test methodology, cylindrical test specimens 150 mm in diameter and 50 mm thick (6.0 in. by
2.0 in.) are subjected to repeated loading in shear using a 0.1-second haversine waveform followed by a
0.6-second rest period. Three different shear stresses are applied while the permanent (unrecoverable) and
recoverable shear strains are measured. The permanent shear strain versus applied repetitions is normally
recorded up to a value of five percent although 5,000 repetitions are called for in the AASHTO procedure.
A constant temperature is maintained during the test (termed the critical temperature), representative of
the local environment. Shear Frequency Sweep Tests were used to establish the relationship between
complex modulus and load frequency. The same loading was used at frequencies of 15, 10, 5, 2, 1, 0.5,
0.2, 0.1, 0.05, 0.02, and 0.01 Hz.
Number of Tests
A total of 18 shear tests and six frequency sweep tests were carried out on each mix (total of 96 tests for
the four mixes) as follows:
Standard test
- Two temperatures, namely 45°C and 55°C (113°F and 131°F)
- Three stresses, namely 70 kPa, 100 kPa, and 130 kPa (10.2, 14.5, and 18.9 psi)
- Three replicates.
Frequency sweep test:
- Two temperatures, namely 45°C and 55°C (113°F and 131°F)
- One strain, namely 100 microstrain
- Three replicates.

Stage 4 Distribution, June 19, 2009
96 UCPRC-RR-2008-11
5.1.2 Fatigue Testing
Test Method
The AASHTO T-321 Flexural Controlled-Deformation Fatigue Test method was followed. In this test,
three replicate beam test specimens, 50 mm thick by 63 mm wide by 380 mm long (2.0 x 2.5 x 15 in.),
were subjected to four-point bending using a sinusoidal waveform at a loading frequency of 10 Hz.
Testing was performed in both dry and wet condition at two different strain levels and at three different
temperatures. Flexural Controlled-Deformation Frequency Sweep Tests were used to establish the
relationship between complex modulus and load frequency. The same sinusoidal waveform was used in a
controlled deformation mode and at frequencies of 15, 10, 5, 2, 1, 0.5, 0.2, 0.1, 0.05, 0.02, and 0.01 Hz.
The upper limit of 15 Hz is a constraint imposed by the capabilities of the test machine. To ensure that the
specimen was tested in a nondestructive manner, the frequency sweep test was conducted at a small strain
amplitude level, proceeding from the highest frequency to the lowest in the sequence noted above.
The wet specimens used in the fatigue and frequency sweep tests were conditioned following the beam-
soaking procedure described in Appendix C. The beam was first vacuum-saturated to ensure a saturation
level greater than 70 percent, and then placed in a water bath at 60°C for 24 hours, followed by a second
water bath at 20°C for 2 hours. The beams were then wrapped with ParafilmTM and tested within 24 hours
after soaking.
Number of Tests
A total of 36 fatigue beam tests and 12 flexural fatigue frequency sweep tests were carried out on each
mix (total of 192 tests for the four mixes) as follows:
Standard test:
- Two conditions (wet and dry)
- Three temperatures, namely 10°C, 20°C, and 30°C (50°F, 68°F, and 86°F)
- Two strains, namely 200 microstrain and 400 microstrain
- Three replicates.
Frequency sweep test:
- Two conditions (wet and dry)
- Three temperatures, namely 10°C, 20°C, and 30°C (50°F, 68°F, and 86°F)
- One strain, namely 100 microstrain
- Two replicates.

Stage 4 Distribution, June 19, 2009
UCPRC-RR-2008-11 97
5.1.3 Moisture Sensitivity Testing
Test Methods
Two additional moisture sensitivity tests were conducted, namely the Hamburg Wheel-Track Test and the
Tensile Strength Retained (TSR) Test.
The AASHTO T-324 test method was followed for Hamburg Wheel-Track testing on slab
specimens cut from the field-mixed, field-compacted sample slabs to the dimensions 320 mm long,
260 mm wide, and 120 mm thick (12.6 x 10.2 x 4.7 in.). All testing was carried out at 50°C (122°F).
The Caltrans CT-371 test method was followed for the Tensile Strength Retained Test on
cylindrical specimens 100 mm in diameter and 63 mm thick (4.0 x 2.5 in.) cored from the field-
mixed, field-compacted sample slabs. This test method is similar to the AASHTO T-283 test,
however, it has some modifications specific for California conditions.
Number of Tests
Four replicates of the Hamburg Wheel-Track test and four replicates of the Tensile Strength Retained Test
were carried out for each mix (16 tests per method).
5.2 Test Results
5.2.1 Shear Tests
Air-Void Content
Shear specimens were cored from the top lift of the field-mixed, field-compacted (FMFC) slabs. Air-void
contents were measured using the modified Parafilm method (AASHTO T-275A). Table 5.1 summarizes
the air-void distribution categorized by mix type, test temperature, and test shear stress level. Figure 5.1
presents the summary boxplots of air-void content based on additive type. The differences in air-void
content distributions between the mixes with various additives are clearly apparent. The mean difference
for the highest mean air-void content (Evotherm) and the smallest mean air-void content (Control) could
be as high as 2.0 percent.
Table 5.1: Summary of Air-Void Contents of Shear Test Specimens Temperature Control Advera Evotherm Sasobit
°C °F Stress Level
(kPa) Mean SD1 Mean SD Mean SD Mean SD 45 113 70
100 130
6.5 6.5 6.4
0.6 0.6 0.3
8.7 8.7 8.2
1.0 0.6 0.9
9.2 8.7 9.2
1.0 1.0 0.7
8.3 8.1 8.0
0.7 0.8 0.4
55 131 70 100 130
6.7 6.8 7.7
0.6 0.6 0.9
8.5 8.0 8.0
0.9 0.7 0.2
8.3 8.3 9.1
0.5 0.3 0.7
7.7 8.3 8.1
0.6 0.3 0.8
Overall 6.8 0.7 8.4 0.7 8.8 0.7 8.1 0.6 Frequency Sweep 7.1 0.7 8.6 0.9 8.7 0.8 7.8 0.4 1 SD: Standard deviation.

Stage 4 Distribution, June 19, 2009
98 UCPRC-RR-2008-11
67
89
10
CONTROL ADVERA EVOTHERM SASOBIT
Air
-Vo
id C
on
ten
t (%
)6
78
91
0
CONTROL ADVERA EVOTHERM SASOBIT
Air
-Vo
id C
on
ten
t (%
)
Figure 5.1: Air-void contents of shear specimens.
5.2.2 Resilient Shear Modulus (G)
The resilient shear modulus results for the four mixes are summarized in Figure 5.2. The resilient shear
modulus was influenced by temperature, with the modulus increasing with decreasing temperature.
Resilient shear modulus was not influenced by stress. The variation of resilient shear moduli at 45°C was
considerable compared to the results at 55°C. The Sasobit specimens had the highest resilient shear
modulus, as expected, due to the lower binder content. The Control, Evotherm, and Advera specimens had
essentially the same shear modulus indicating that the use of the additive and lower production and
compaction temperatures did not significantly influence the performance of the mix in this test.
050
100
150
200
250
300
CONTROL ADVERA EVOTHERM SASOBIT
45C
s70 s100
s130
55C
45C
55C
45C
55C
45C
55C
s70s100s130
s70
s100s130
s70
s100s130
s70
s100s130
s70 s100s130
s70 s100
s130
s70 s100s130
G (
MP
a)0
5010
015
020
025
030
0
CONTROL ADVERA EVOTHERM SASOBIT
45C45C
s70 s100
s130
55C55C
45C45C
55C55C
45C45C
55C55C
45C45C
55C55C
s70s100s130
s70
s100s130
s70
s100s130
s70
s100s130
s70 s100s130
s70 s100
s130
s70 s100s130
G (
MP
a)
Figure 5.2: Summary boxplots of resilient shear modulus.
Key
Highest
Lowest
Mean

Stage 4 Distribution, June 19, 2009
UCPRC-RR-2008-11 99
Cycles to Five Percent Permanent Shear Strain
The number of cycles to five percent permanent shear strain provides an indication of the rut-resistance of
an asphalt mix, with higher numbers of cycles implying better rut-resistance. Figure 5.3 summarizes the
shear test results in terms of the natural logarithm of this parameter. As expected, the rut-resistance
capacity decreased with increasing temperature and stress level. The Sasobit had the highest number of
cycles to five percent permanent shear strain, as expected. With the exception of Evotherm at 45°C and
70 kPa stress level, no significant difference was noted between the Control, Advera, and Evotherm
mixes, despite the Advera and Evotherm specimens having higher air-void contents than the Control (±
2.0 percent). This indicates that the use of the additive and lower production and compaction temperatures
did not significantly influence the performance of the mix in this test.
510
1520
25
CONTROL ADVERA EVOTHERM SASOBIT
45C
s70s100
s130
55C
45C
55C
45C
55C
45C
55C
s70
s100
s130
s70 s100s130
s70 s100
s130
s70
s100
s130
s70
s100
s130
s70
s100
s130
s70
s100
s130
Ln
(cyc
les
to 5
% P
SS
)5
1015
2025
CONTROL ADVERA EVOTHERM SASOBIT
45C45C
s70s100
s130
55C55C
45C45C
55C55C
45C45C
55C55C
45C45C
55C55C
s70
s100
s130
s70 s100s130
s70 s100
s130
s70
s100
s130
s70
s100
s130
s70
s100
s130
s70
s100
s130
Ln
(cyc
les
to 5
% P
SS
)
Figure 5.3: Summary boxplots of cycles to 5% permanent shear strain.
Permanent Shear Strain at 5,000 Cycles
The measurement of permanent shear strain (PSS) accumulated after 5,000 cycles provides an alternative
indication of the rut-resistance capacity of an asphalt mix. The smaller the permanent shear strain the
better the mixture’s rut-resistance capacity. Figure 5.6 summarizes the rutting performance of the four
mixes in terms of the natural logarithm of this parameter (i.e., increasingly negative values represent
smaller cumulative permanent shear strain). The results indicate that:
The effect of shear stress level is more significant at higher temperatures.
The higher the temperature and stress level the larger the cumulative permanent shear strain.
In general, Sasobit accumulated the least permanent shear strain when compared with the other
mixes at the same stress level and temperature, as expected.
Evotherm was the most stress-sensitive mix.
There was no significant difference between the Control and Advera mixes.

Stage 4 Distribution, June 19, 2009
100 UCPRC-RR-2008-11
Shear Frequency Sweep
The average shear complex moduli (G*) and average phase angle (pa) of three replicates tested at the two
temperatures were used to develop the G* and pa master curves respectively. The reference temperature
of the master curves was set at 55°C. The shifted master curves with minimized residual-sum-of-squares
derived using a genetic algorithm approach was fitted with the following modified Gamma functions
(Equations 5.1 and 5.2):
1
!exp1*)(
n
mm
m
mB
Cx
B
CxADGLn (5.1)
1
!exp1
n
mm
m
mB
Cx
B
CxADpa (5.2)
where: G* is the flexural complex modulus (MPa), pa is the phase angle (degree), x is the loading frequency in Hz, and
A, B, C, D, and n are the experimentally-determined parameters, and ln is the natural logarithm.
Note that the experimentally-determined parameters, A, B, C, and D, are different for Equations 5.1 and
5.2. The experimentally-determined parameters of the modified Gamma function for each mix type are
listed in Table 5.2 and Table 5.3 respectively for shear complex modulus and phase angle master curves.
Table 5.2: Summary of Ln(G*) Master Curves Master Curve Mix
n A B C D Control Advera
Evotherm Sasobit
3 3 3 3
7.566435 9.979300 8.852759 7.549157
3.344699 4.148430 3.694575 3.693620
-3.784501 -3.922014 -3.757068 -5.013536
1.606332 1.591510 1.516829 1.757530
Notes: 1. The reference temperature is 55°C. 2. Master curve Gamma-fitted equations:
If n = 3,
2
2
21exp1*)(
B
Cx
B
Cx
B
CxADGLn ,
If n = 4,
3
3
2
2
621exp1*)(
B
Cx
B
Cx
B
Cx
B
CxADGLn ,
where aTfreqx lnln

Stage 4 Distribution, June 19, 2009
UCPRC-RR-2008-11 101
Table 5.3: Summary of Phase Angle Master Curves
Master Curve Mix n A B C D
Control Advera
Evotherm Sasobit
3 3 3 3
32.20464 32.68695 29.29483 23.98185
1.177630 1.222088 1.204523 1.025020
-3.953715 -3.887848 -3.855373 -4.790558
26.14898 26.17297 30.66809 30.78790
Notes: 1. The reference temperature is 55°C. 2. Master curve Gamma-fitted equations:
If n = 3,
2
2
21exp1
B
Cx
B
Cx
B
CxADpa ,
If n = 4,
3
3
2
2
621exp1
B
Cx
B
Cx
B
Cx
B
CxADpa ,
where aTfreqx lnln ; phase angle in degree.
Figure 5.4 and Figure 5.5 show the shifted master curves with Gamma-fitted lines, respectively, for shear
complex modulus and phase angle for the 55°C testing. The following observations were made from the
shear frequency sweep test results:
There was no apparent difference between the complex modulus master curves of the Control,
Advera, and Evotherm mixes although the modulus of the Control mix was slightly higher than the
other two mixes. The master curve of the Sasobit mix was above those of the other three mixes, as
expected.
On the phase angle master curve, phase angle increased with increasing loading frequency for all
mixes.
There was no apparent difference in the phase angle master curves for the Control, Advera, and
Evotherm mixes. The master curve of the Sasobit mix crossed the other three master curves
approximately between 2.0 Hz and 5.0 Hz; hence, at higher loading frequencies the Sasobit appears
to have smaller phase angles than the other three mixes and higher phase angles at lower loading
frequencies. This is probably a function of the lower binder content.

Stage 4 Distribution, June 19, 2009
102 UCPRC-RR-2008-11
0
1
2
3
4
5
6
-6 -4 -2 0 2 4 6
Reduced Ln(freq) (freq: Hz)
Ln
(G*)
(G
*: M
Pa
)
Control Advera Evotherm Sasobit Gamma fitted lines
Figure 5.4: Summary of shear complex modulus master curves.
15
20
25
30
35
40
45
50
55
60
65
-6 -4 -2 0 2 4 6
Reduced Ln(freq) (freq: Hz)
Ph
ase
An
gle
(d
egre
e)
Control Advera Evotherm Sasobit Gamma fitted lines
Figure 5.5: Summary of shear phase angle master curves.
5.2.3 Fatigue Beam Tests
Air-Void Content
Fatigue beams were saw-cut from the bottom lift of the FMFC slabs. Air-void contents were measured
using the modified Parafilm method (AASHTO T-275A). Table 5.4 and Table 5.5 summarize the air-void
distribution categorized by mix type, test temperature, and test tensile strain level for the fatigue beam and
frequency sweep specimens, respectively. Figure 5.7 and Figure 5.8 present the summary boxplots of air-

Stage 4 Distribution, June 19, 2009
UCPRC-RR-2008-11 103
void content for the wet and dry fatigue beam and flexural frequency sweep specimens, respectively.
There was no significant difference in air-void content between the dry and wet specimens, but some
difference between the four mixes.
-4-3
-2-1
CONTROL ADVERA EVOTHERM SASOBIT
45C
Ln
(PS
S@
500
0 c
ycle
s)
s70
s100
s130
55C
45C
55C
45C
55C
45C
55C
s70
s100
s130
s70s100
s130s70
s100
s130
s70
s100
s130s70
s100
s130
s70
s100
s130
s70
s100
s130
-4-3
-2-1
CONTROL ADVERA EVOTHERM SASOBIT
45C45C
Ln
(PS
S@
500
0 c
ycle
s)
s70
s100
s130
55C55C
45C45C
55C55C
45C45C
55C55C
45C45C
55C55C
s70
s100
s130
s70s100
s130s70
s100
s130
s70
s100
s130s70
s100
s130
s70
s100
s130
s70
s100
s130
Figure 5.6: Summary boxplots of cumulative permanent shear strain at 5,000 cycles.
Table 5.4: Summary of Air-Void Contents of Fatigue Beam Specimens
Temp. Control Advera Evotherm Sasobit Condition Strain (µstrain) °C °F Mean SD1 Mean SD Mean SD Mean SD
200 10 20 30
50 68 86
7.3 6.9 7.3
1.0 0.6 0.7
8.8 7.2 6.6
0.7 0.6 0.3
8.2 7.5 8.8
1.5 0.7 0.8
6.6 6.3 7.5
0.3 0.2 0.6
400 10 20 30
50 68 86
7.0 7.4 6.7
0.6 0.8 0.4
6.8 8.7 7.7
0.6 1.4 0.8
9.0 7.7 7.7
0.8 0.7 0.6
6.9 7.4 6.7
0.4 0.8 0.3
Dry
Overall 7.1 0.6 7.6 1.1 8.1 1.0 6.9 0.6 200 10
20 30
50 68 86
8.0 6.8 6.9
0.5 0.4 1.2
7.5 7.4 7.4
1.0 0.9 0.8
9.5 8.8 7.6
0.6 1.3 0.9
6.9 6.6 6.9
0.2 0.7 0.4
400 10 20 30
50 68 86
6.9 7.0 7.2
0.5 0.3 0.4
8.3 6.9 7.7
1.2 1.5 0.3
8.9 8.2 8.3
0.3 0.3 0.5
6.6 6.9 6.6
0.5 0.2 0.3
Wet
Overall 7.1 0.7 7.5 0.9 8.6 0.7 6.7 0.4 1 SD: Standard deviation.
Table 5.5: Summary of Air-Void Contents of Flexural Frequency Sweep Specimens
Control Advera Evotherm Sasobit Condition Mean SD1 Mean SD Mean SD Mean SD
Dry Wet
6.7 6.7
0.5 0.4
7.5 7.9
0.9 0.8
8.4 8.8
1.0 0.7
7.0 6.8
0.5 0.7
1 SD: Standard deviation.

Stage 4 Distribution, June 19, 2009
104 UCPRC-RR-2008-11
67
89
106
78
910
EVOTHERM SASOBIT
Air
-Vo
id C
on
ten
t (%
)
ADVERACONTROL
DRY WET
67
89
106
78
910
EVOTHERM SASOBIT
Air
-Vo
id C
on
ten
t (%
)
ADVERACONTROL
DRY WETDRY WET
Figure 5.7: Air-void contents of fatigue beam specimens (dry and wet).
EVOTHERM SASOBIT
Air
-Vo
id C
on
ten
t (%
)
ADVERACONTROL
DRY WET
67
89
106
78
910
EVOTHERM SASOBIT
Air
-Vo
id C
on
ten
t (%
)
ADVERACONTROL
DRY WETDRY WET
67
89
106
78
910
Figure 5.8: Air-void contents of flexural frequency sweep specimens (dry and wet).
Table 5.6 compares air-void contents (or degree of compaction) of the top and bottom lifts for the
different mixes. With the exception of the Control mix, air-void contents were higher in the top lift
compared to the bottom lift, indicating poorer compaction in the top lift. This is expected in multi-lift
construction because the bottom lift is reheated during placement of the next lift, and receives additional
compaction while the next lift is being compacted.

Stage 4 Distribution, June 19, 2009
UCPRC-RR-2008-11 105
Table 5.6: Air-Void Content Comparison of Top and Bottom Lifts
Control Advera Evotherm Sasobit Location Condition Mean SD1 Mean SD Mean SD Mean SD
Top Lift (Shear Cores)
Dry 6.7 0.7 8.4 0.7 8.8 0.7 8.1 0.6
Bottom Lift (Fatigue Beams)
Dry Wet
7.1 7.1
0.6 0.7
7.6 7.5
1.1 0.9
8.1 8.6
1.0 0.9
6.9 6.7
0.6 0.4
Initial Stiffness
Figure 5.9 illustrates the initial stiffness comparison at various strain levels, temperatures, and
conditioning for the different mix types. The following observations were made:
Initial stiffness was generally strain-independent for both the dry and wet tests.
Temperature had a significant effect on both the dry and wet tests.
A reduction of initial stiffness due to soaking was apparent for each mix type, with the reduction
most prominent for the 10°C test. The difference in stiffness at 30°C indicates a potential reduction
in rut-resistance at higher temperatures due to moisture damage. The difference in stiffness at all
temperatures indicates a loss of structural capacity due to moisture damage.
Moisture sensitivity was not influenced by any of the additives (i.e., the Control mix was not less
moisture sensitive than the mixes with additives, compacted at lower temperatures).
There was no significant difference between the four mixes in terms of initial stiffness indicating
that the use of the additives and lower production and compaction temperatures did not significantly
influence the performance of the mix in this test.
020
0040
0060
0080
0010
000
1200
0
10C
20C
30C
10C
20C
30C
10C
20C
30C
10C
20C
30C
10C
20C
30C
10C
20C
30C
10C
20C
30C
10C
20C
30C
EVOTHERM SASOBIT
Sti
ffn
ess
(MP
a)
ADVERACONTROL
stn200
stn400
stn200 stn400
stn200stn400
stn200
stn400
DRY WET
020
0040
0060
0080
0010
000
1200
0
10C
20C
30C
10C
20C
30C
10C
20C
30C
10C
20C
30C
10C
20C
30C
10C
20C
30C
10C
20C
30C
10C
20C
30C
EVOTHERM SASOBIT
Sti
ffn
ess
(MP
a)
ADVERACONTROL
stn200
stn400
stn200 stn400
stn200stn400
stn200
stn400
020
0040
0060
0080
0010
000
1200
00
2000
4000
6000
8000
1000
012
000
10C
20C
30C
10C
20C
30C
10C
20C
30C
10C
20C
30C
10C
20C
30C
10C
20C
30C
10C
20C
30C
10C
20C
30C
EVOTHERM SASOBIT
Sti
ffn
ess
(MP
a)
ADVERACONTROL
stn200stn200
stn400stn400
stn200stn200 stn400stn400
stn200stn200stn400stn400
stn200stn200
stn400stn400
DRY WETDRY WET
Figure 5.9: Summary boxplots of initial stiffness.

Stage 4 Distribution, June 19, 2009
106 UCPRC-RR-2008-11
Initial Phase Angle
The initial phase angle can be used as an index of mix viscosity properties, with higher phase angles
corresponding to more viscous and less elastic properties. Figure 5.10 illustrates the side-by-side phase
angle comparison of dry and wet tests for the four mixes. The following observations were made:
The initial phase angle increased with increasing temperature.
The initial phase angle appeared to be strain-independent.
Soaking appeared to increase the phase angle slightly and introduce larger dispersion of the phase
angle.
The initial phase angle was highly negative-correlated with the initial stiffness.
There was no significant difference between the four mixes in terms of initial phase angle indicating
that the addition of the additives and lower production and compaction temperatures did not
significantly influence the performance of the mix in this test.
1020
3040
50
10C
20C
30C
10C
20C
30C
stn200
EVOTHERM SASOBIT
Ph
ase
An
gle
(D
egre
e)
10C
20C
30C
10C
20C
30C
10C
20C
30C
10C
20C
30C
10C
20C
30C
10C
20C
30C
stn400 stn200stn400
stn200
stn400
stn200 stn400
ADVERACONTROL
DRY WET
1020
3040
50
10C
20C
30C
10C
20C
30C
stn200
EVOTHERM SASOBIT
Ph
ase
An
gle
(D
egre
e)
10C
20C
30C
10C
20C
30C
10C
20C
30C
10C
20C
30C
10C
20C
30C
10C
20C
30C
stn400 stn200stn400
stn200
stn400
stn200 stn400
ADVERACONTROL
1020
3040
5010
2030
4050
10C
20C
30C
10C
20C
30C
stn200stn200
EVOTHERM SASOBIT
Ph
ase
An
gle
(D
egre
e)
10C
20C
30C
10C
20C
30C
10C
20C
30C
10C
20C
30C
10C
20C
30C
10C
20C
30C
stn400stn400 stn200stn200stn400stn400
stn200stn200
stn400stn400
stn200stn200 stn400stn400
ADVERACONTROL
DRY WETDRY WET
Figure 5.10: Summary boxplots of initial phase angle.
Fatigue Life at 50 Percent Stiffness Reduction
Mix stiffness decreases with increasing test-load repetitions. Conventional fatigue life is defined as the
number of load repetitions when 50 percent stiffness reduction has been reached. A high fatigue life
implies a slow fatigue damage rate and consequently higher fatigue-resistance. The side-by-side fatigue
life comparison of dry and wet tests is plotted in Figure 5.11. The following observations were made:
Fatigue life was both strain- and temperature-dependent. In general, lower strains and higher
temperatures will result in higher fatigue life and vice versa.

Stage 4 Distribution, June 19, 2009
UCPRC-RR-2008-11 107
Soaking generally resulted in a lower fatigue life compared to the unsoaked specimens. Inconsistent
results were obtained across the mixes at the higher temperatures (i.e., 200 microstrain and 30°C). It
is not clear why this occurred.
There was no significant difference between the four mixes in terms of fatigue life at 50 percent
stiffness reduction indicating that the addition of the additives and lower production and
compaction temperatures did not significantly influence the performance of the mix in this test.
1015
20
10C
20C
30C
ADVERACONTROL EVOTHERM SASOBIT
Ln
(Nf)
10C20C
30C
10C20C
30C
10C
20C
30C
10C
20C
30C
10C20C
30C
10C
20C
30C
10C20C
30C
stn200
stn400
stn200
stn400
stn200
stn400
stn200
stn400
DRY WET
1015
20
10C
20C
30C
ADVERACONTROL EVOTHERM SASOBIT
Ln
(Nf)
10C20C
30C
10C20C
30C
10C
20C
30C
10C
20C
30C
10C20C
30C
10C
20C
30C
10C20C
30C
stn200
stn400
stn200
stn400
stn200
stn400
stn200
stn400
1015
20
10C
20C
30C
ADVERACONTROL EVOTHERM SASOBIT
Ln
(Nf)
10C20C
30C
10C20C
30C
10C
20C
30C
10C
20C
30C
10C20C
30C
10C
20C
30C
10C20C
30C
stn200stn200
stn400stn400
stn200stn200
stn400stn400
stn200stn200
stn400stn400
stn200stn200
stn400stn400
DRY WETDRY WET
Figure 5.11: Summary boxplots of fatigue life.
Flexural Frequency Sweep
The average stiffness values of the two replicates tested at the three temperatures were used to develop the
flexural complex modulus (E*) master curve. This is considered a useful tool for characterizing the effects
of loading frequency (or vehicle speed) and temperature on the initial stiffness of an asphalt mix (i.e.,
before any fatigue damage has occurred). The shifted master curve with minimized residual-sum-of-
squares derived using a genetic algorithm approach can be appropriately fitted with the following
modified Gamma function (Equation 5.3):
1
!exp1*
n
mm
m
mB
Cx
B
CxADE (5.3)
where: E* = flexural complex modulus (MPa); aTfreqx lnln = is the loading frequency in Hz and lnaT can be obtained from the
temperature-shifting relationship (Equation 5.4); A, B, C, D, and n are the experimentally-determined parameters.

Stage 4 Distribution, June 19, 2009
108 UCPRC-RR-2008-11
B
TrefTAaT exp1ln (5.4)
where: lnaT = is a horizontal shift to correct the temperature effect with the same unit as ln freq, T = is the temperature in °C, Tref = is the reference temperature, in this case, Tref = 20°C A and B are the experimentally-determined parameters.
The experimentally-determined parameters of the modified Gamma function for each mix type are listed
in Table 5.7, together with the parameters in the temperature-shifting relationship.
Figure 5.12 and Figure 5.13 show the shifted master curves with Gamma-fitted lines and the temperature-
shifting relationships, respectively, for the dry frequency sweep tests. The temperature-shifting
relationships were obtained during the construction of the complex modulus master curve and can be used
to correct the temperature effect on initial stiffness. Note that a positive lnaT value needs to be applied
when the temperature is lower than the reference temperature, while a negative lnaT value needs to be
used when the temperature is higher than the reference temperature.
The following observations were made from the dry frequency sweep test results:
There was no apparent difference between the complex modulus master curves of the Control,
Advera, and Sasobit mixes. The curve for the Evotherm mix was below those of the other three
mixes, possibly due to the higher air-void contents of the tested beams.
The temperature-shifting relationships indicate that the Advera mix was the most temperature-
sensitive in extreme temperatures and that the Control mix was the least temperature-sensitive on
average. Higher temperature-sensitivity implies that a per unit change of temperature will cause a
larger change of stiffness (i.e., larger change of lnaT).
Figure 5.14 and Figure 5.15 respectively show the shifted master curves with Gamma-fitted lines and the
temperature-shifting relationships for the wet frequency sweep tests. The comparison of dry and wet
complex modulus master curves is shown in Figure 5.16 for each mix type. The following observations
were made with regard to the wet frequency sweep tests results:
The complex modulus curves of the Control and Sasobit mixes were essentially the same, while the
curves for the Evotherm and Advera showed lower stiffness.
There were no apparent temperature-sensitivity differences between the four mixes at higher
temperatures (i.e., higher than 20°C). At lower temperatures (i.e., lower than 20°C), there was no
significant difference in temperature-sensitivity between the Control and Advera mixes, but some
temperature sensitivity in the Evotherm and the Sasobit mixes.
A loss of stiffness attributed to moisture damage was apparent in all four mixes.

Stage 4 Distribution, June 19, 2009
UCPRC-RR-2008-11 109
Table 5.7: Summary of Master Curves and Time-Temperature Relationships Master Curve Time-Temperature
Relationship Mix Conditioning
N A B C D A B Control Advera
Evotherm Sasobit
Dry 3 3 3 3
36709.04 31589.35 31725.88 30895.62
6.776351 6.44247 7.069325 6.686322
-6.193638 -6.192128 -6.228655 -6.75525
287.7218 266.6365 193.6026 315.8828
-2.59871 -7.9213 -18.8202 -3.71373
13.9774 30.462 92.144
15.2257 Control Advera
Evotherm Sasobit
Wet 3 3 3 4
91682.18 140552.3 40602.73 1951606
11.87393 15.84893 8.365664 26.46189
-6.408145 -5.936551 -5.920522 -11.3173
174.7554 144.9951 174.3914 65.28481
-3.97313 -5.13173 -15.1651 -93.0313
14.3648 18.8505 53.6384 377.234
Notes:
1. The reference temperature is 20°C. 2. The wet test specimens were soaked at 60°C. 3. Master curve Gamma-fitted equations:
If n = 3,
2
2
21exp1*
B
Cx
B
Cx
B
CxADE ,
If n = 4,
3
3
2
2
621exp1*
B
Cx
B
Cx
B
Cx
B
CxADE ,
where aTfreqx lnln
4. Time-temperature relationship:
B
TrefTAaT exp1ln

Stage 4 Distribution, June 19, 2009
110 UCPRC-RR-2008-11
0
1000
2000
3000
4000
5000
6000
7000
8000
9000
10000
-8 -6 -4 -2 0 2 4 6 8
Reduced Ln(freq) (freq: Hz)
E*
(MP
a)
CONTROLADVERAEVOTHERMSASOBITGamma Fitted Lines
WMA FMFC (DRY)
Tref = 20C
Figure 5.12: Complex modulus (E*) master curves (dry).
-3
-2
-1
0
1
2
3
4
-15 -10 -5 0 5 10 15
T - Tref (20C)
Ln
(aT
)
CONTROL
ADVERA
EVOTHERM
SASOBIT
Tref = 20C
WMA FMFC (DRY)
Figure 5.13: Temperature-shifting relationship (dry).

Stage 4 Distribution, June 19, 2009
UCPRC-RR-2008-11 111
0
1000
2000
3000
4000
5000
6000
7000
8000
9000
10000
-8 -6 -4 -2 0 2 4 6 8
Reduced Ln(freq) (freq: Hz)
E*
(MP
a)
CONTROLADVERAEVOTHERMSASOBITGamma Fitted Lines
WMA FMFC (WET)
Tref = 20C
Figure 5.14: Complex modulus (E*) master curves (wet).
-3
-2
-1
0
1
2
3
4
5
-15 -10 -5 0 5 10 15
T - Tref (20C)
Ln
(aT
)
CONTROL
ADVERA
EVOTHERM
SASOBIT
Tref = 20C
WMA FMFC (WET)
Figure 5.15: Temperature-shifting relationship (wet).
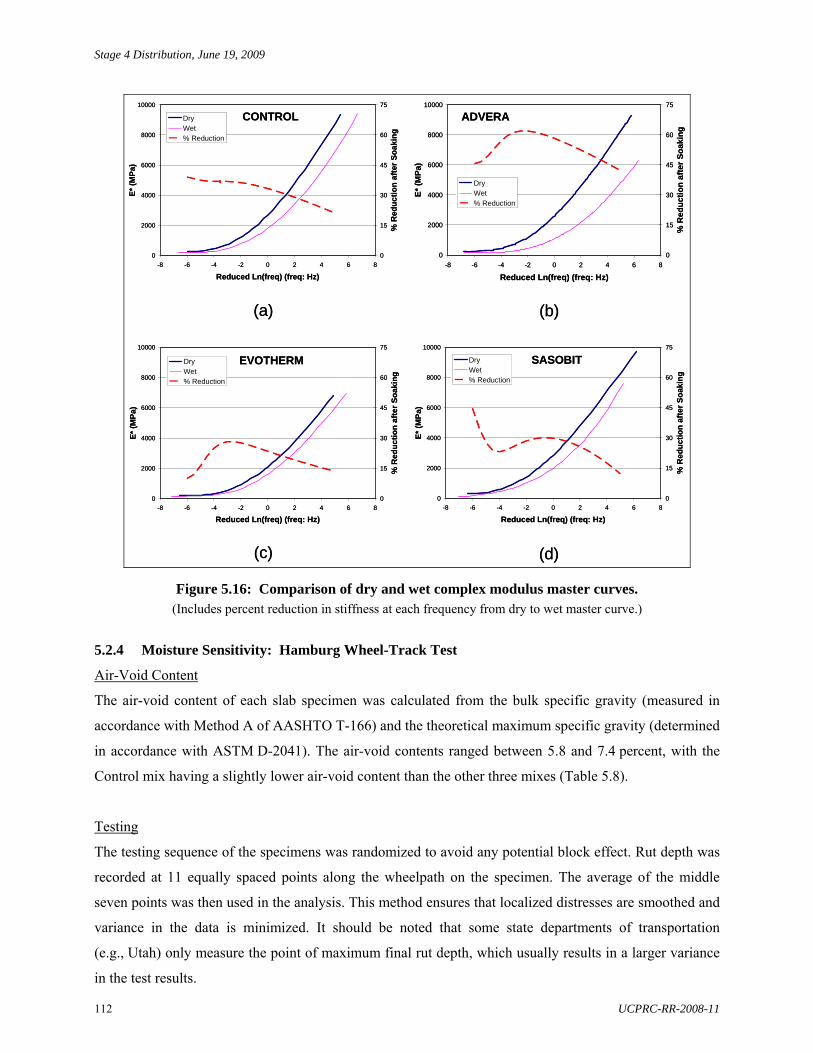
Stage 4 Distribution, June 19, 2009
112 UCPRC-RR-2008-11
0
2000
4000
6000
8000
10000
-8 -6 -4 -2 0 2 4 6 8
Reduced Ln(freq) (freq: Hz)
E*
(MP
a)
0
15
30
45
60
75
% R
edu
cti
on
aft
er S
oak
ing
DryWet% Reduction
CONTROL
0
2000
4000
6000
8000
10000
-8 -6 -4 -2 0 2 4 6 8
Reduced Ln(freq) (freq: Hz)
E*
(MP
a)
0
15
30
45
60
75
% R
ed
uct
ion
aft
er S
oak
ing
DryWet% Reduction
ADVERA
0
2000
4000
6000
8000
10000
-8 -6 -4 -2 0 2 4 6 8
Reduced Ln(freq) (freq: Hz)
E*
(MP
a)
0
15
30
45
60
75
% R
edu
ctio
n a
fter
So
akin
g
DryWet% Reduction
EVOTHERM
0
2000
4000
6000
8000
10000
-8 -6 -4 -2 0 2 4 6 8
Reduced Ln(freq) (freq: Hz)
E*
(MP
a)
0
15
30
45
60
75
% R
edu
ctio
n a
fter
So
akin
g
DryWet% Reduction
SASOBIT
(a) (b)
(c) (d)
0
2000
4000
6000
8000
10000
-8 -6 -4 -2 0 2 4 6 8
Reduced Ln(freq) (freq: Hz)
E*
(MP
a)
0
15
30
45
60
75
% R
edu
cti
on
aft
er S
oak
ing
DryWet% Reduction
CONTROL
0
2000
4000
6000
8000
10000
-8 -6 -4 -2 0 2 4 6 8
Reduced Ln(freq) (freq: Hz)
E*
(MP
a)
0
15
30
45
60
75
% R
ed
uct
ion
aft
er S
oak
ing
DryWet% Reduction
ADVERA
0
2000
4000
6000
8000
10000
-8 -6 -4 -2 0 2 4 6 8
Reduced Ln(freq) (freq: Hz)
E*
(MP
a)
0
15
30
45
60
75
% R
edu
ctio
n a
fter
So
akin
g
DryWet% Reduction
EVOTHERM
0
2000
4000
6000
8000
10000
-8 -6 -4 -2 0 2 4 6 8
Reduced Ln(freq) (freq: Hz)
E*
(MP
a)
0
15
30
45
60
75
% R
edu
ctio
n a
fter
So
akin
g
DryWet% Reduction
SASOBIT
(a) (b)
(c) (d)
Figure 5.16: Comparison of dry and wet complex modulus master curves. (Includes percent reduction in stiffness at each frequency from dry to wet master curve.)
5.2.4 Moisture Sensitivity: Hamburg Wheel-Track Test
Air-Void Content
The air-void content of each slab specimen was calculated from the bulk specific gravity (measured in
accordance with Method A of AASHTO T-166) and the theoretical maximum specific gravity (determined
in accordance with ASTM D-2041). The air-void contents ranged between 5.8 and 7.4 percent, with the
Control mix having a slightly lower air-void content than the other three mixes (Table 5.8).
Testing
The testing sequence of the specimens was randomized to avoid any potential block effect. Rut depth was
recorded at 11 equally spaced points along the wheelpath on the specimen. The average of the middle
seven points was then used in the analysis. This method ensures that localized distresses are smoothed and
variance in the data is minimized. It should be noted that some state departments of transportation
(e.g., Utah) only measure the point of maximum final rut depth, which usually results in a larger variance
in the test results.

Stage 4 Distribution, June 19, 2009
UCPRC-RR-2008-11 113
Table 5.8: Air-Void Content of Hamburg Wheel-Track Test Specimens Specimen ID Bulk Specific Gravity
(g/cm3) Max Specific Gravity
(g/cm3) Air-Void Content
(%)
Control
D35-A D35-B D 3-A D 3-B
2.420 2.420 2.425 2.424
2.574 2.574 2.574 2.574
6.0 6.0 5.8 5.8
Advera
A19-A A19-B A20-A A20-B
2.419 2.418 2.420 2.429
2.601 2.601 2.601 2.601
7.0 7.0 7.0 6.6
Evotherm
E22-A E22-B E24-A E24-B
2.399 2.399 2.395 2.404
2.585 2.585 2.585 2.585
7.2 7.2 7.4 7.0
Sasobit
S 1-A S 1-B S 2-A S 2-B
2.423 2.435 2.420 2.420
2.597 2.597 2.597 2.597
6.7 6.3 6.8 6.8
Figure 5.17 and Figure 5.18 show the rut progression curves of all specimens, in terms of both the
maximum rut depth and average rut depth. The curve for the Control mix is included in the plots of the
mixes with additives. As expected, the progression curves of the maximum rut depths had a larger
variation. Figure 5.19 through Figure 5.22 show the condition of each slab specimen after the Hamburg
Wheel-Track test. The creep slope, stripping slope, stripping inflection point, and rut depths at 10,000 and
20,000 passes were calculated from the average and maximum rut progression curves, and are
summarized in Table 5.9 and
Table 5.10, respectively. Rut depths at 20,000 passes were linearly extrapolated for tests terminated before
the number of wheel passes reached this point.
The mixes all show similar trends, with air-void content appearing to have the biggest influence on
performance. The results in Table 5.9 indicate that there is no significant difference between the Control
mix and the mixes with Advera and Evotherm. The Sasobit appeared less moisture sensitive than the
Control mix, however these results were probably influenced by the lower binder content in the Sasobit
mix, which would be expected to increase the rut resistance while also increasing the moisture sensitivity.
The tests will be repeated on laboratory-mixed, laboratory-compacted specimens in Phase 2 of the
UCPRC study to obtain a better indication of performance at the same binder content.
A one-way analysis of variance, using the stripping slope, stripping inflection point, and rut depth at
10,000 and 20,000 passes as the response variable, revealed no significant difference between the
performances of the four mixes. This implies that the use of the additives in this mix design, and
compaction to the densities recorded, did not influence the moisture sensitivity of the mix.

Stage 4 Distribution, June 19, 2009
114 UCPRC-RR-2008-11
-30
-25
-20
-15
-10
-5
0
0 2,000 4,000 6,000 8,000 10,000 12,000 14,000 16,000 18,000 20,000
No. of Passes
Ma
xim
um
Imp
res
sio
n (
mm
)
D3A D3B D35B
-30
-25
-20
-15
-10
-5
0
0 2,000 4,000 6,000 8,000 10,000 12,000 14,000 16,000 18,000 20,000
No. of Passes
Av
era
ge
Im
pre
ss
ion
(m
m)
D3A D3B D35B
Control: Maximum Rut Control: Average Rut
-30
-25
-20
-15
-10
-5
0
0 2,000 4,000 6,000 8,000 10,000 12,000 14,000 16,000 18,000 20,000
No. of Passes
Ma
xim
um
Imp
res
sio
n (
mm
)
A19A A19B A20A A20B D3A D3B D35B
-30
-25
-20
-15
-10
-5
0
0 2,000 4,000 6,000 8,000 10,000 12,000 14,000 16,000 18,000 20,000
No. of Passes
Av
era
ge
Im
pre
ss
ion
(m
m)
A19A A19B A20A A20B D3A D3B D35B
Advera: Maximum Rut Advera: Average Rut
Figure 5.17: Maximum and average rut progression curves for Control and Advera specimens.

Stage 4 Distribution, June 19, 2009
UCPRC-RR-2008-11 115
-30
-25
-20
-15
-10
-5
0
0 2,000 4,000 6,000 8,000 10,000 12,000 14,000 16,000 18,000 20,000
No. of Passes
Ma
xim
um
Imp
res
sio
n (
mm
)
E22A E22B E24A E24B D3A D3B D35B -30
-25
-20
-15
-10
-5
0
0 2,000 4,000 6,000 8,000 10,000 12,000 14,000 16,000 18,000 20,000
No. of Passes
Av
era
ge
Im
pre
ss
ion
(m
m)
E22A E22B E24A E24B D3A D3B D35B
Evotherm: Maximum Rut Evotherm: Average Rut
-30
-25
-20
-15
-10
-5
0
0 2,000 4,000 6,000 8,000 10,000 12,000 14,000 16,000 18,000 20,000
No. of Passes
Ma
xim
um
Im
pre
ssio
n (
mm
)
S1A S1B S2A S2B D3A D3B D35B
-30
-25
-20
-15
-10
-5
0
0 2,000 4,000 6,000 8,000 10,000 12,000 14,000 16,000 18,000 20,000
No. of Passes
Av
era
ge
Imp
res
sio
n (
mm
)
S1A S1B S2A S2B D3A D3B D35B
Sasobit: Maximum Rut Sasobit: Average Rut
Figure 5.18: Maximum and average rut progression curves for Evotherm and Sasobit specimens.

Stage 4 Distribution, June 19, 2009
116 UCPRC-RR-2008-11
Figure 5.19: Control mix specimens after Hamburg Wheel-Track Test.
Figure 5.20: Advera specimens after Hamburg Wheel-Track Test.
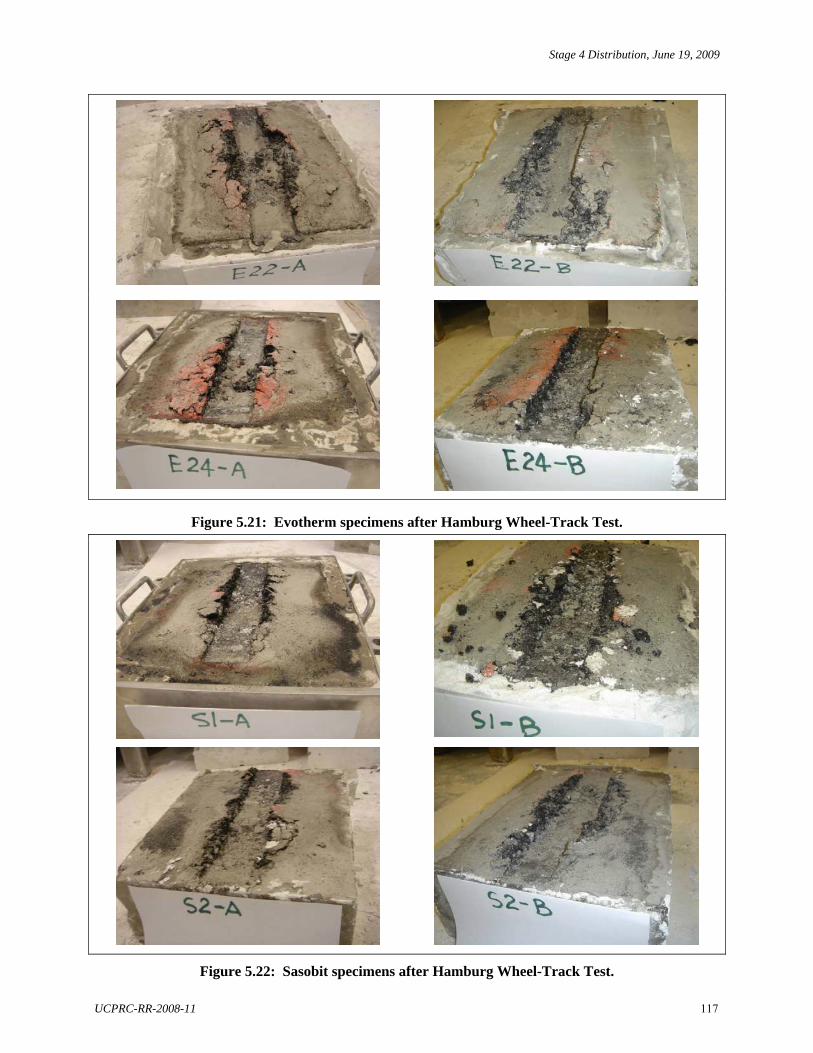
Stage 4 Distribution, June 19, 2009
UCPRC-RR-2008-11 117
Figure 5.21: Evotherm specimens after Hamburg Wheel-Track Test.
Figure 5.22: Sasobit specimens after Hamburg Wheel-Track Test.

Stage 4 Distribution, June 19, 2009
118 UCPRC-RR-2008-11
Table 5.9: Test Result Summary of Average Rut Progression Curves Specimen Creep Slope
(mm/pass)
Stripping Slope
(mm/pass)
Inflection Point
Rut Depth @ 10,000 passes
(mm)
Rut Depth @ 20,000 passes
(mm) D35A*
D35B D 3A D 3B
-0.0007 -0.0010 -0.0011 -0.0007
-0.0014 -0.0013 -0.0018 -0.0023
7,858 8,804 6,889 8,837
8.2 12.4 15.1 11.0
22.5 25.5 33.1 34.0
Control
Average -0.0009 -0.0017 8,177 12.9 30.9 A19A A19B A20A A20B
-0.0012 -0.0011 -0.0002 -0.0010
-0.0018 -0.0026 -0.0006 -0.0025
7,098 5,896 10,217 6,738
15.0 17.7 11.2 16.4
33.3 45.4 11.8 41.5
Advera
Average -0.0009 -0.0019 7,487 15.1 33.0 E22A E22B E24A E24B
-0.0010 -0.0015 -0.0008 -0.0007
-0.0032 -0.0027 -0.0017 -0.0016
6,132 7,215 6,013 8,804
20.4 18.7 13.7 12.4
52.3 45.4 30.7 25.5
Evotherm
Average -0.0010 -0.0023 7,041 16.3 38.5 S 1A S 1B S 2A S 2B
-0.0005 -0.0005 -0.0009 -0.0004
-0.0012 -0.0010 -0.0017 -0.0021
12,423 8,804 10,013 6,934
5.6 12.4 6.0 12.2
16.7 25.5 27.9 33.6
Sasobit
Average -0.0006 -0.0015 9,543 9.1 25.9 * Outlier, not used in analysis.
Table 5.10: Test Result Summary of Maximum Rut Progression Curves
Specimen Creep Slope
(mm/pass)
Stripping Slope
(mm/pass)
Inflection Point
Rut Depth @ 10,000 passes
(mm)
Rut Depth @ 20,000 passes
(mm) D35A* D35B D 3A D 3B
-0.0005 -0.0010 -0.0010 -0.0013
-0.0011 -0.0026 -0.0021 -0.0034
10,132 6,574 5,488 8,686
7.8 16.1 17.8 15.9
19.0 42.6 39.1 49.8
Control
Average -0.0010 -0.0023 7,720 14.4 37.6 A19A A19B A20A A20B
-0.0008 -0.0010 -0.0013 -0.0012
-0.0037 -0.0035 -0.0016 -0.0022
6,804 5,936 5,936 3,828
19.4 21.1 15.7 19.9
57.1 58.2 32.0 41.0
Advera
Average -0.0011 -0.0028 5,626 19.0 47.1 E22A E22B E24A E24B
-0.0010 -0.0012 -0.0006 -0.0009
-0.0037 -0.0022 -0.0042 -0.0021
6,421 303 5,794 7,758
22.4 20.5 23.6 15.1
59.7 45.5 65.6 36.7
Evotherm
Average -0.0009 -0.0031 5,069 20.4 51.9 S 1A S 1B S 2A S 2B
-0.0007 -0.0007 -0.0001 -0.0003
-0.0027 -0.0017 -0.0015 -0.0038
12,225 7,862 11,555 7,412
6.8 9.8 6.0 15.9
30.9 20.9 18.5 54.0
Sasobit
Average -0.0004 -0.0024 9,764 9.6 31.1 * Outlier, not used in analysis.
Caltrans currently does not specify acceptance criteria for the Hamburg Wheel-Track Test, and the results
can therefore not be interpreted in terms of Caltrans requirements. The current Texas Department of

Stage 4 Distribution, June 19, 2009
UCPRC-RR-2008-11 119
Transportation specifications specify the minimum number of wheel passes at 12.5 mm (0.5 in.) maximum
rut depth. To accept a mix using a PG64-16 binder, a minimum of 10,000 passes before the maximum rut
depth reaches 12.5 mm is required. Based on the results listed in Table 5.10, the Control, Advera, and
Evotherm mixes did not meet this requirement, while the Sasobit barely met the criteria. The finding does
not change if the average maximum rut depth is used instead of the maximum rut depth; however, the
Control mix is closer to the acceptance point, and the Sasobit exceeds the requirement by a greater margin.
As discussed previously, the Sasobit result cannot be compared directly with the Control and the other
additives given the differences in its asphalt binder content.
5.2.5 Moisture Sensitivity: Tensile Strength Retained (TSR)
Air-Void Content
The air-void content of each Tensile Strength Retained (TSR) specimen was calculated from the bulk
specific gravity (Method A of AASHTO T-166) and the theoretical maximum specific gravity (ASTM D-
2041). Results are shown in Table 5.11 and can be summarized as follows:
• Control: 5.5 to 6.6 percent
• Advera: 6.3 to 6.9 percent
• Evotherm: 6.3 to 8.1 percent
• Sasobit: 5.8 to 7.7 percent.
Table 5.11: Air-Void Content of TSR Test Specimens
Specimen ID Bulk Specific Gravity (g/cm3)
Max Specific Gravity (g/cm3)
Air-Void Content (%)
Dry Wet Dry Wet Dry Wet Dry Wet
Control
33-20C 33-08C 33-17C 33-07C 33-09C 33-11C
33-15C 33-13C 33-02C 33-06C 33-10C 33-01C
2.433 2.424 2.422 2.419 2.412 2.409
2.428 2.424 2.424 2.412 2.408 2.405
2.576 2.576 2.576 2.576 2.576 2.576
2.576 2.576 2.576 2.576 2.576 2.576
5.5 5.9 6.0 6.1 6.4 6.5
5.7 5.9 5.9 6.4 6.5 6.6
Average 6.1 6.2
Advera
34-06T 28-08T 28-01B 28-03B 28-10T 28-06T 34-05T
28-08B 28-07T 34-03T 28-02B 28-10B 28-01T
-
2.427 2.423 2.422 2.422 2.420 2.417 2.416
2.431 2.419 2.423 2.425 2.420 2.419
-
2.596 2.596 2.596 2.596 2.596 2.596 2.596
2.596 2.596 2.596 2.596 2.596 2.596
-
6.5 6.7 6.7 6.7 6.8 6.9 6.9
6.3 6.8 6.6 6.6 6.8 6.8 -
Average 6.7 6.7
Evotherm
16-13C 16-19C 16-02C 13-01B 16-10C 16-11C
16-09C 16-03C 13-02B 16-04C 16-07C 16-01C
2.424 2.408 2.405 2.391 2.386 2.381
2.425 2.406 2.396 2.383 2.381 2.379
2.589 2.589 2.589 2.589 2.589 2.589
2.589 2.589 2.589 2.589 2.589 2.589
6.4 7.0 7.1 7.7 7.9 8.0
6.3 7.1 7.5 8.0 8.0 8.2
Average 7.5 7.4
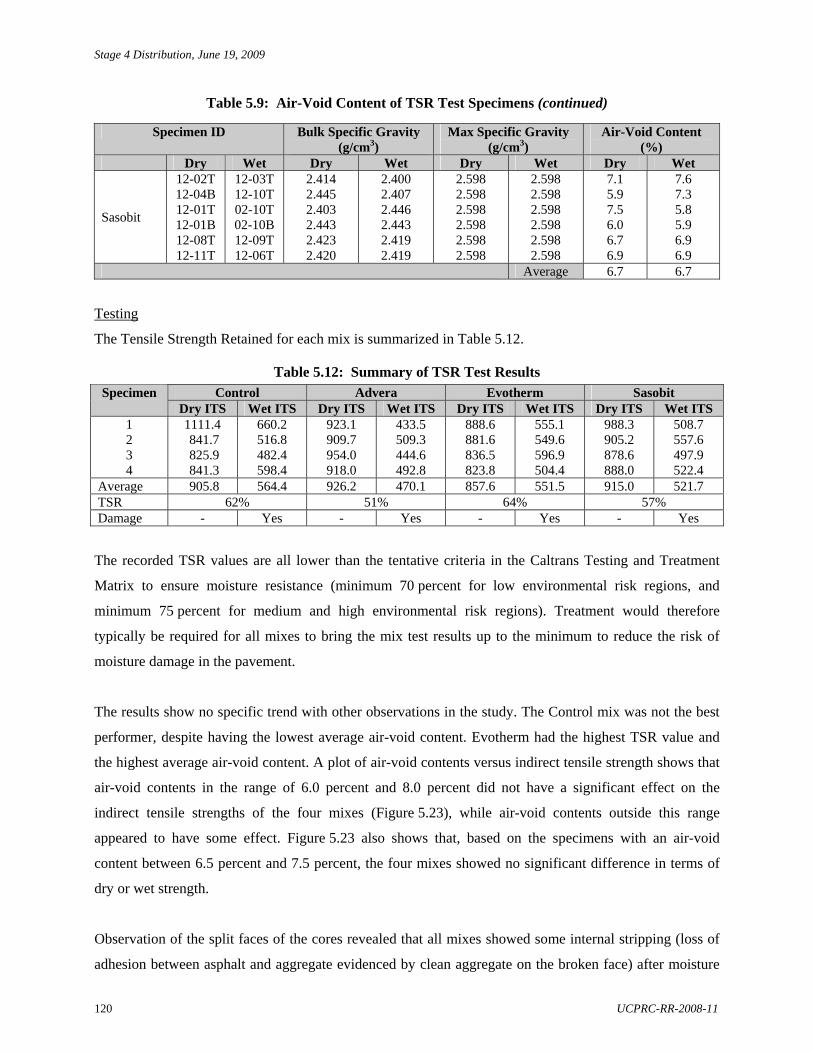
Stage 4 Distribution, June 19, 2009
120 UCPRC-RR-2008-11
Table 5.9: Air-Void Content of TSR Test Specimens (continued)
Specimen ID Bulk Specific Gravity (g/cm3)
Max Specific Gravity (g/cm3)
Air-Void Content (%)
Dry Wet Dry Wet Dry Wet Dry Wet
Sasobit
12-02T 12-04B 12-01T 12-01B 12-08T 12-11T
12-03T 12-10T 02-10T 02-10B 12-09T 12-06T
2.414 2.445 2.403 2.443 2.423 2.420
2.400 2.407 2.446 2.443 2.419 2.419
2.598 2.598 2.598 2.598 2.598 2.598
2.598 2.598 2.598 2.598 2.598 2.598
7.1 5.9 7.5 6.0 6.7 6.9
7.6 7.3 5.8 5.9 6.9 6.9
Average 6.7 6.7
Testing
The Tensile Strength Retained for each mix is summarized in Table 5.12.
Table 5.12: Summary of TSR Test Results
Control Advera Evotherm Sasobit Specimen Dry ITS Wet ITS Dry ITS Wet ITS Dry ITS Wet ITS Dry ITS Wet ITS
1 2 3 4
1111.4 841.7 825.9 841.3
660.2 516.8 482.4 598.4
923.1 909.7 954.0 918.0
433.5 509.3 444.6 492.8
888.6 881.6 836.5 823.8
555.1 549.6 596.9 504.4
988.3 905.2 878.6 888.0
508.7 557.6 497.9 522.4
Average 905.8 564.4 926.2 470.1 857.6 551.5 915.0 521.7 TSR 62% 51% 64% 57% Damage - Yes - Yes - Yes - Yes
The recorded TSR values are all lower than the tentative criteria in the Caltrans Testing and Treatment
Matrix to ensure moisture resistance (minimum 70 percent for low environmental risk regions, and
minimum 75 percent for medium and high environmental risk regions). Treatment would therefore
typically be required for all mixes to bring the mix test results up to the minimum to reduce the risk of
moisture damage in the pavement.
The results show no specific trend with other observations in the study. The Control mix was not the best
performer, despite having the lowest average air-void content. Evotherm had the highest TSR value and
the highest average air-void content. A plot of air-void contents versus indirect tensile strength shows that
air-void contents in the range of 6.0 percent and 8.0 percent did not have a significant effect on the
indirect tensile strengths of the four mixes (Figure 5.23), while air-void contents outside this range
appeared to have some effect. Figure 5.23 also shows that, based on the specimens with an air-void
content between 6.5 percent and 7.5 percent, the four mixes showed no significant difference in terms of
dry or wet strength.
Observation of the split faces of the cores revealed that all mixes showed some internal stripping (loss of
adhesion between asphalt and aggregate evidenced by clean aggregate on the broken face) after moisture

Stage 4 Distribution, June 19, 2009
UCPRC-RR-2008-11 121
conditioning. There was no significant difference between the four mixes in terms of observed moisture
resistance.
0
200
400
600
800
1,000
1,200
1,400
5.0 5.5 6.0 6.5 7.0 7.5 8.0 8.5
Air-void Content (%)
Ind
irect
Ten
sile
Str
engt
h (k
Pa
)
Control: Dry Control: Wet Advera: Dry Advera: WetEvotherm: Dry Evotherm: Wet Sasobit: Dry Sasobit: Wet
Figure 5.23: Air-void content versus indirect tensile strength.
5.3 Summary of Laboratory Testing Results
The laboratory test results indicate that use of the warm-mix additives assessed in this study, produced and
compacted at lower temperatures, does not significantly influence the performance of the asphalt concrete
when compared to control specimens produced and compacted at conventional hot-mix asphalt
temperatures.
Moisture sensitivity testing indicated that all the mixes tested were potentially susceptible to moisture
damage. There was no difference in the level of moisture sensitivity between the Control mix and mixes
with warm-mix additives.

Stage 4 Distribution, June 19, 2009
122 UCPRC-RR-2008-11

Stage 4 Distribution, June 19, 2009
UCPRC-RR-2008-11 123
6. CONCLUSIONS AND RECOMMENDATIONS
6.1 Conclusions
This first-level report describes the first phase of a warm-mix asphalt study, which compares the
performance of a control mix, produced and constructed at conventional hot-mix asphalt temperatures,
with three mixes produced with warm-mix additives, produced and compacted at approximately 35°C
(60°F) lower than the control. The additives tested included Advera WMA®, EvothermTM, and Sasobit®.
The test track layout and design, mix design and production, and test track construction are discussed, as
well are results of Heavy Vehicle Simulator (HVS) and laboratory testing.
Key findings from the study include:
A consistent base-course was constructed on the test track using material produced at the nearby
quarry. Some overwatering occurred in the early stages of construction resulting in some moist
areas in the pavement, which influenced deflection and density measurements. These areas were
unlikely to effect later performance of the test track. The very stiff base is likely to complicate any
planned fatigue cracking experiments in that a very high number of HVS repetitions will likely be
required before any distress occurs.
Minimal asphalt plant modifications were required to accommodate the warm-mix additives.
No problems were noted with producing the asphalt mixes at the lower temperatures. The target mix
production temperatures (i.e., 155°C and 120°C [310°F and 250°F]) were achieved.
Although a PG 64-16 asphalt binder was specified in the work plan, subsequent tests by the Federal
Highway Administration indicated that the binder should be graded as PG64-22. This should not
affect the outcome of the experiment. After mixing Advera and Sasobit with the binder, the PG
grading changed from PG 64-22 to PG 70-22. The addition of Evotherm did not alter the PG grade.
The Control, Advera, and Evotherm mixes met the project mix design requirements. The binder
content of the Sasobit was 0.72 percent below the target binder content and 0.62 percent below the
lowest recommended binder content (by mass of aggregate) from the Hveem mix design
(Appendix A). This probably influenced performance and was taken into consideration when
interpreting HVS and laboratory test results.
The Control mix had a higher specific gravity, higher Marshall stability, and lower air-void content,
compared to the mixes with additives. It is not clear whether this was a testing inconsistency or is
linked to the lower production and specimen preparation temperatures. This will need to be
investigated during Phase 2 laboratory investigations.

Stage 4 Distribution, June 19, 2009
124 UCPRC-RR-2008-11
Moisture contents of the mixes with additives were notably higher than in the Control mix,
indicating that potentially less moisture evaporates from the aggregate at lower production
temperatures. All mixes were, however, well within the minimum Caltrans-specified moisture
content level. Aggregate moisture contents will need to be controlled in the stockpiles, and
maximum moisture contents prior to mix production may need to be set if warm-mix technologies
are routinely used.
Construction procedures and final pavement quality did not appear to be influenced by the lower
construction temperatures. The Advera mix showed no evidence of tenderness, and acceptable
compaction was achieved. Some tenderness resulting in shearing under the rollers was noted at
various stages of breakdown and/or rubber-tired rolling on the Evotherm and Sasobit sections,
indicating that the compaction temperatures were still higher than optimal. No problems were
observed after final rolling at lower temperatures.
Interviews with the paving crew after construction revealed that no problems were experienced with
construction at the lower temperatures. Improved working conditions were identified as an
advantage. Tenderness on the Evotherm and Sasobit sections was not considered as being
significantly different from that experienced with conventional mixes during normal construction
activities.
Although temperatures at the beginning of compaction on the warm-mix sections were considerably
lower than the Caltrans-specified limits, the temperatures recorded on completion of compaction
were within limits, indicating that the rate of temperature loss in the mixes with additives was lower
than that on the Control mix.
Some haze/smoke was evident on the Control mix during transfer of the mix from the truck to the
paver. No haze or smoke was observed on the mixes with additives.
Average air-void contents on the Control and Advera sections were 5.6 percent and 5.4 percent
respectively. Those on the Evotherm and Sasobit sections, which showed signs of tenderness during
rolling, were approximately 7.0 percent. Based on these observations, it was concluded that
adequate compaction can be achieved on warm-mixes at the lower temperatures. Optimal
compaction temperatures are likely to differ between the different warm-mix technologies.
Skid resistance measurements indicated that the warm-mix additives tested do not influence the skid
resistance of an asphalt mix.
HVS trafficking on each of the four sections revealed that the duration of the embedment phases on
the Advera and Evotherm sections were similar to the Control. However, the depth of the ruts at the
end of the embedment phases on these two sections was slightly higher than the Control, which was
attributed to less oxidation of the binder and possibly also to the retention of somewhat higher water
contents in the aggregate during mix production at lower temperatures. Rutting behavior on the

Stage 4 Distribution, June 19, 2009
UCPRC-RR-2008-11 125
warm-mix sections followed similar trends to the control after the embedment phase. The
performance of the Sasobit section could not be compared with the other three sections given that
the binder content of the mix was significantly lower.
Laboratory test results indicate that use of the warm-mix technologies assessed in this study to
produce and compact mixes at lower temperatures does not significantly influence the performance
of the asphalt concrete when compared to control specimens produced and compacted at
conventional hot-mix asphalt temperatures. However, moisture sensitivity testing indicated that all
the mixes tested were potentially susceptible to moisture damage. There was, however, no
difference in the level of moisture sensitivity between the Control mix and mixes with warm-mix
additives.
The findings of the study are also summarized below in the form of answers to the questions identified in
Section 1.3.
6.1.1 Comparative Energy Usage
Comparative energy usage could not be assessed in this study due to the very small quantities produced.
These studies will need to be carried out during larger full-scale pilot studies on in-service pavements
when large quantities of mix are produced (i.e., more than 5,000 tonnes).
6.1.2 Achieving Compaction Density at Lower Temperatures
Compaction measurements during construction indicated that average air-void contents on the Control and
warm-mix sections were typical of full-scale construction projects, and based on these observations it is
concluded that adequate compaction can be achieved on warm-mixes at the lower temperatures.
6.1.3 Optimal Temperature Ranges for Warm-Mixes
Optimal compaction temperatures are likely to differ between the different warm-mix technologies. This
study has shown that temperatures of at least 35°C (60°F) lower than conventional temperatures are
appropriate for producing and compacting the modified mixes.
6.1.4 Cost Implications
The cost benefits of using the warm-mix technologies could not be assessed in this study due to the very
small quantities produced.

Stage 4 Distribution, June 19, 2009
126 UCPRC-RR-2008-11
6.1.5 Rutting Performance
Based on the results of HVS testing, it is concluded that the use of any of the three warm-mix asphalt
technologies used in this experiment will not significantly influence the rutting performance of the mix.
6.1.6 Moisture Sensitivity
Laboratory moisture sensitivity testing indicated that all the mixes tested were potentially susceptible to
moisture damage. There was, however, no difference in the level of moisture sensitivity between the
Control mix and mixes with additives. It is recommended that Phase 2 HVS testing be carried out to
confirm these findings under full-scale loading conditions.
6.1.7 Fatigue Performance
Laboratory fatigue testing indicated that the warm-mix technologies used in this study will not influence
the fatigue performance of a mix. Given the very strong pavement structure on the test track, it is unlikely
that fatigue cracking will occur under HVS testing. An assessment of fatigue performance is therefore not
recommended using these test sections.
6.1.8 Other Effects
Quality control checks carried out by Graniterock Company on the mix immediately after production
revealed that lower specific gravities and higher air-void contents were recorded on the mixes produced
with warm-mix additives. This anomaly should be assessed in more detail during Phase 2 laboratory
testing, when performance will be assessed on laboratory-mixed, laboratory-compacted specimens.
6.1.9 Rubberized and Open-Graded Mixes
At the time of preparing this report, no decision had been made on extending the study to assess
rubberized and open-graded mixes.
6.2 Recommendations
The HVS and laboratory testing completed in this phase have provided no results to suggest that warm-
mix technologies should not be used in California. However, the testing discussed in this report is part of a
larger study on warm-mix asphalt and final recommendations towards the use of this technology will only
be made after further research and monitoring of full-scale pilot studies on in-service pavements is
completed. Interim recommendations include the following:
The use of warm-mix technologies should continue in full-scale pilot studies on in-service
pavements.

Stage 4 Distribution, June 19, 2009
UCPRC-RR-2008-11 127
Although laboratory testing indicated that the warm-mix technologies assessed in this study did not
increase the moisture sensitivity of the mix, HVS testing to assess moisture sensitivity should
continue as recommended in the work plan to confirm these findings. Subsequent laboratory testing
of moisture sensitivity should assess a range of different aggregates given that all of the mixes
tested in this study where considered to be moisture sensitive.
Laboratory testing on laboratory-mixed, laboratory-compacted specimens should proceed as
recommended in the test plan to determine whether representative mixes can be produced in the
laboratory.

Stage 4 Distribution, June 19, 2009
128 UCPRC-RR-2008-11

Stage 4 Distribution, June 19, 2009
UCPRC-RR-2008-11 129
7. REFERENCES
1. Warm-Mix Asphalt: European Practice. 2008. Washington, D.C.: Federal Highway
Administration. (FHWA-PL-08-007).
2. HURLEY, G.C. and Prowell, B.D. 2006. Evaluation of Potential Processes for use in Warm-Mix
Asphalt. Journal of the Association of Asphalt Paving Technologists, Vol. 75. (pp 41-85).
3. JONES, D. and Harvey, J. 2007. Warm-Mix Asphalt Study: Workplan for Comparison of
Conventional and Warm-Mix Asphalt Performance using HVS and Laboratory Testing.
Davis and Berkeley, CA: University of California Pavement Research Center. (WP-2007-01).
4. Standard Specifications. 2006. Sacramento, CA: State of California Department of
Transportation.
5. JONES, D. 2005. Quality Management System for Site Establishment, Daily Operations,
Instrumentation, Data Collection and Data Storage for APT Experiments. Pretoria, South
Africa: CSIR Transportek. (Contract Report CR-2004/67-v2).
6. HARVEY, J., Du Plessis, L., Long, F., Deacon, J., Guada, I., Hung, D. and Scheffy, C. 1997.
CAL/APT Program: Test Results from Accelerated Pavement Test on Pavement Structure
Containing Asphalt-Treated Permeable Base (ATPB) – Section 500RF. Davis and Berkeley,
CA: University of California Pavement Research Center. (Report Numbers UCPRC-RR-1999-02
and RTA-65W4845-3).
7. HARVEY, J., Du Plessis, L., Long, F., Deacon, J., Guada, I., Hung, D. and Scheffy, C. 1997.
CAL/APT Program: Test Results from Accelerated Pavement Test on Pavement Structure
Containing Untreated Base – Section 501RF. Davis and Berkeley, CA: University of California
Pavement Research Center. (Report Numbers UCPRC-RR-1997-03 and RTA-65W4845-3).

Stage 4 Distribution, June 19, 2009
130 UCPRC-RR-2008-11

Stage 4 Distribution, June 19, 2009
UCPRC-RR-2008-11 131
APPENDIX A: MIX DESIGN EXAMPLES
A.1 Mix Design
Examples of Graniterock Company and Caltrans mix designs used for the production of asphalt concrete
at the Graniterock Company's A.R. Wilson Asphalt Plant for earlier Caltrans projects are provided in
Figure A.1 and Figure A.2. A Graniterock Company mix design was used in this study.

Stage 4 Distribution, June 19, 2009
132 UCPRC-RR-2008-11
Project:
Plant: Aromas Drum PlantMix Type: 19 mm Coarse, Type A
Asphalt Binder: PG 64-10 (Valero Benecia)
Design Completed:
MIX PROPERTIES
A 4.5% 6.5 42
B 5.0% 5.2 45
C 5.5% 3.8 42
D 6.0% 2.8 38
Asphalt binder Specific Gravity = 1.027 Target Asphalt Content =
AGGREGATE PROPERTIES
CTM # ValuePercentage crushed particles 205 100 90/70Los Angeles Rattler 100 rev 211 9 10 max.
500 rev 30 45 max.
Sand Equivalent 217 72 47 min.KC/KF Factor 303 1.0/1.1 1.7 maxFine Aggregate App. SG 208 2.81Fine Aggregate Bulk SG 207 2.63 ---Coarse Aggregate Bulk SG 206 2.80 ---Combined Bulk SG 2.71 --- Combined Effective SG (Gse) = 2.78Swell 305 0.2 0.76 max
JOB MIX FORMULA and COLD FEED PERCENTAGES
3/4x1/2 1/2x #4 1/4x #10 Sand DustBIN % 18 35 10 37 0
SIEVE SIZE
25mm 100 100 100 100 100 100 100 10019mm 75 100 100 100 100 96 90-100 96 91-100
12.5mm 23 95 100 100 100 849.5mm 12 65 99 100 100 72 60-75 72 66-78
4.75mm 9 12 65 100 100 49 45-50 49 42-562.36mm 7 7 14 88 100 38 32-36 36 31-411130um 6 5 7 61 100 26600um 5 5 5 38 100 17 15-18 18 14-22300um 4 4 4 19 100 9150um 3 3 3 10 100 575um 1 2 2 6 95 3.5 3-7 4 2--6
5.4%
COMBINED GRADING
SPEC LIMITS CALTRANS
TARGET "X" Values
OPERATING RANGE
AGGREGATE BIN GRADATIONS CTM 202
Caltrans Test MethodSpec
Type A
2.596
2.574
2.553
14.4
14.4
2.466
14.2
14.32.536
SpecimenBinder
Content
Bulk Specific Gravity CT 308C
(g/cm3)
Maximum Theoretical Density
CT 309 (g/cm3)
% Air Voids CT 309
STABILITY S-value CT 366
Voids in Mineral Aggregate % (VMA)
2.427
2.439
2.456
Figure A.1: Example Graniterock Company mix design.

Stage 4 Distribution, June 19, 2009
UCPRC-RR-2008-11 133
Project:
Plant: Aromas Drum PlantMix Type: 19 mm Coarse, Type A
Asphalt Binder: PG 64-10 (Valero Benecia)
Design Completed: January 0, 1900
Asphalt Content vs UNIT WEIGHT
2.4002.4102.4202.4302.4402.4502.4602.4702.4802.4902.500
4.5 5.0 5.5 6.0
ASPHALT CONTENT, %
UN
IT W
EIG
HT
, p
cf
Asphalt Content vs STABILITY
30
32
34
36
38
40
42
44
46
48
50
4.5 5.0 5.5 6.0
ASPHALT CONTENT, %
ST
AB
ILIT
Y
Asphalt Content vs RICE DENSITY
2.530
2.540
2.550
2.560
2.570
2.580
2.590
2.600
4.5 5.0 5.5 6.0
ASPHALT CONTENT, %
RIC
E D
EN
SIT
Y
Asphalt Content vs AIR VOIDS (RICE)
1.0
2.0
3.0
4.0
5.0
6.0
7.0
4.5 5.0 5.5 6.0
ASPHALT CONTENT, %
AIR
VO
IDS
(R
ICE
)
Asphalt Content vs VMA
13.5
13.9
14.3
14.7
4.5 5.0 5.5 6.0
ASPHALT CONTENT, %
VM
A
Figure A.1: Example Graniterock Company mix design (continued).

Stage 4 Distribution, June 19, 2009
134 UCPRC-RR-2008-11
19mm Max Coarse, Type AJOB MIX FORMULA
PERCENT PASSING
SIEVE SIZE (mm, um) 25 19 12.5 9.5 4.75 2.36 1130 600 300 150 75UPPER SPECIFIED LIMIT 100 100 90 78 56 41 30 22 15 8.0 6.0LOWER SPECIFIED LIMIT 100 91 78 66 42 31 22 14 7.0 4.0 2.0
JOB MIX FORMULA 100 96 84 72 49 36 24 18 10 6.0 4.0
0
10
20
30
40
50
60
70
80
90
100
SIEVE SIZE (um,mm)
PERCENT PASSING
75 150 300 600 1130 2.36 4.75 9.5 12.5 19 25
Figure A.1: Example Graniterock Company mix design (continued).

Stage 4 Distribution, June 19, 2009
UCPRC-RR-2008-11 135
Figure A.2: Example Caltrans mix design.

Stage 4 Distribution, June 19, 2009
136 UCPRC-RR-2008-11
Figure A.2: Example Caltrans mix design (continued).

Stage 4 Distribution, June 19, 2009
UCPRC-RR-2008-11 137
APPENDIX B: BINDER COMPLIANCE CERTIFICATE
Figure B.1: Binder compliance certificate.

Stage 4 Distribution, June 19, 2009
138 UCPRC-RR-2008-11
Figure B.1: Binder compliance certificate (continued).

Stage 4 Distribution, June 19, 2009
UCPRC-RR-2008-11 139
APPENDIX C: FATIGUE BEAM SOAKING PROCEDURE
C.1 Preparation of Specimens
Specimens are prepared as follows:
1. The bulk specific gravity, width, and height of each beam shall first be measured and recorded.
2. Each beam is dried at room temperature (around 30C) in a forced draft oven or in a concrete
conditioning room to constant mass (defined as the mass at which further drying does not alter the
mass by more than 0.05 percent at two-hour drying intervals). The final dry mass should be
recorded. Note: Beams should be placed on a rigid and flat surface during drying.
3. A nut used for supporting the LVDT is bonded to the beam using epoxy resin. The mass of the
beam with the nut should be recorded.
C.2 Conditioning of Specimens
1. Place the beam in the vacuum container supported above the container bottom by a spacer. Fill the
container with water so that the beam is totally submerged in the water. Apply a vacuum of
635 mm (25 in.) of mercury for 30 minutes. Remove the vacuum and determine the saturated
surface dry mass according to AASHTO T-166. Calculate the volume of absorbed water and
determine the degree of saturation. If the saturation level is less than 70 percent, vacuum saturate
the beam for a longer time and determine the saturated surface dry mass again.
2. Place the vacuum-saturated beam in a water bath with the water temperature pre-set at 60C. The
beam should be supported on a rigid, flat (steel or wood) plate to prevent deformation of the beam
during conditioning. The top surface of the beam should be about 25 mm below the water surface.
3. After 24 hours, drain the water bath and refill it with cold tap water. Set the water bath
temperature to 20C. Wait for 2 hours for temperature equilibrium.
4. Remove the beam from the water bath, and determine its saturated surface dry mass.
5. Wrap the beam with Parafilm to ensure no water leakage.
6. Check the bonded nut. If it becomes loose, remove it and rebond it with epoxy resin.
7. Apply a layer of scotch tape to the areas where the beam contacts the clamps of the fatigue
machine. This will prevent adhesion between the Parafilm and the clamps.
8. Start the fatigue test of the conditioned beam within 24 hours.

Stage 4 Distribution, June 19, 2009
140 UCPRC-RR-2008-11