wall chart for latin american countries mauricio holz un-celade/eclac
TRANSCRIPT

Wall chart for Latin American Wall chart for Latin American CountriesCountries
Mauricio HolzMauricio HolzUN-CELADE/ECLACUN-CELADE/ECLAC

Will be the best Wall chart in the Will be the best Wall chart in the history of Wall charts!history of Wall charts!
(The first Wall chart in human history)(The first Wall chart in human history)Altamira cave, prehistoric Anonymous manAltamira cave, prehistoric Anonymous man

StructureStructure
Two kinds of informationTwo kinds of information
– Demographic and Economic measures for 30 Demographic and Economic measures for 30 Latin American and Caribbean CountriesLatin American and Caribbean Countries
– Comparison between NTA Latin American Comparison between NTA Latin American Countries and other NTA regions using National Countries and other NTA regions using National Transfers Accounts. Transfers Accounts.

Demographic and economic measures for Demographic and economic measures for 30 Latin American and Caribbean Countries30 Latin American and Caribbean Countries
Life Expectancy, TFR, percentage of population Life Expectancy, TFR, percentage of population 65+ and below 15, in 2010 and 2040 65+ and below 15, in 2010 and 2040
Year in which old consumption is higher relative to Year in which old consumption is higher relative to young consumption.young consumption.
Intergenerational (Tax) Reallocation Rate for Intergenerational (Tax) Reallocation Rate for young dependency group and for old dependency young dependency group and for old dependency group.group.
Five statistics of the first Demographic Dividend.Five statistics of the first Demographic Dividend. Economic dependency measures by social Economic dependency measures by social
sectors.sectors.

Percentage of population 65+.Percentage of population 65+.2010 and 20402010 and 2040

Year in which old consumption is higher Year in which old consumption is higher
compare to young consumptioncompare to young consumption..
CUBA
0,0
0,1
0,2
0,3
0,4
0,5
0,6
Su
pp
ort
Rati
o
HONDURAS
0
0,1
0,2
0,3
0,4
0,5
0,6
0,7
0,8
Using support ratios we calculated the year in Using support ratios we calculated the year in which 65+ relative effective consumers are which 65+ relative effective consumers are higher than <15 relative effective consumers for higher than <15 relative effective consumers for 30 LAC30 LAC
2006 2049

Intergenerational (Tax) Reallocation Intergenerational (Tax) Reallocation RateRate
0,0%5,0%
10,0%15,0%20,0%25,0%30,0%35,0%40,0%45,0%50,0% Old IRR 2010
Youth IRR 2010
Is the sum of the LCD of the dependency age group of Is the sum of the LCD of the dependency age group of young people as fraction of GDP, plus the LCD of the young people as fraction of GDP, plus the LCD of the dependency age group of old people as a fraction of dependency age group of old people as a fraction of GDPGDP
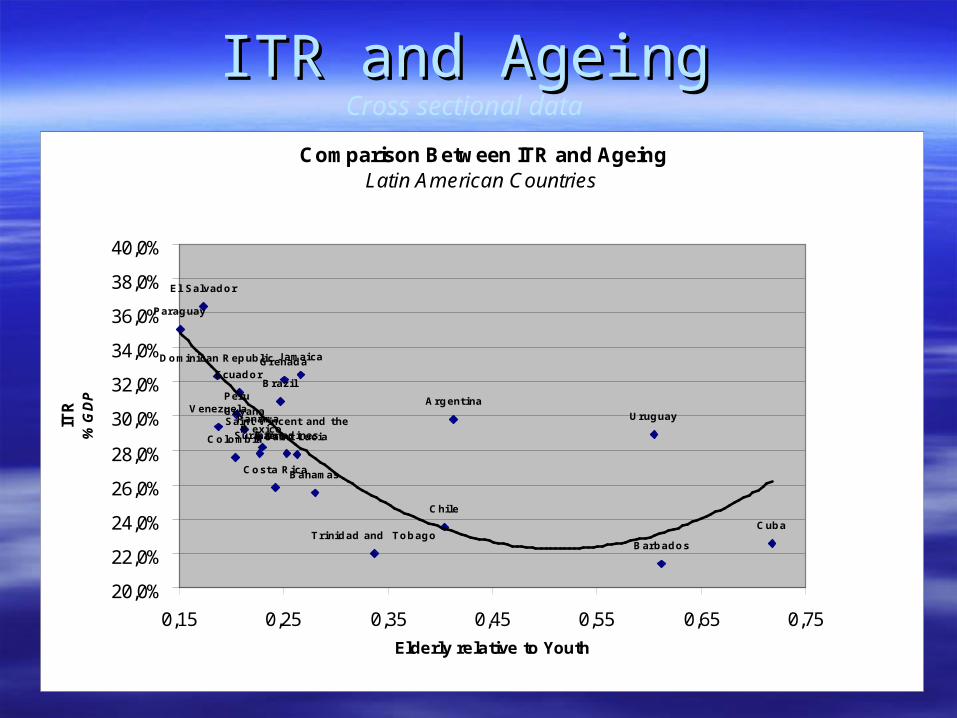
ITR and AgeingITR and AgeingCross sectional data
Comparison Between ITR and AgeingLatin American Countries
Argentina
Bahamas
Barbados
Brazil
Chile
Colombia
Costa Rica
Cuba
Dominican Republic
El Salvador
Ecuador
MexicoPanama
Paraguay
Peru
UruguayVenezuela
GrenadaJ amaica
Saint Lucia
Saint Vincent and the Grenadines
Trinidad and Tobago
Guyana
Suriname
20,0%
22,0%
24,0%
26,0%
28,0%
30,0%
32,0%
34,0%
36,0%
38,0%
40,0%
0,15 0,25 0,35 0,45 0,55 0,65 0,75
Elderly relative to Youth
ITR
%
GD
P

ITR and AgeingITR and AgeingCross sectional dataCross sectional data
Cross sectional data seems to replicate the demographic Cross sectional data seems to replicate the demographic dividend pattern of one country.dividend pattern of one country.
– A sign of Heterogeneity in the ageing process between LAC. A sign of Heterogeneity in the ageing process between LAC. (Different stages in the process)(Different stages in the process)
– How much of this cross sectional data can be explained by How much of this cross sectional data can be explained by demographic factors and by the LCD per-capita ages demographic factors and by the LCD per-capita ages profiles?profiles?
- How this graph will change when we include the NTA data How this graph will change when we include the NTA data for other Latin American countries. Maybe not much?for other Latin American countries. Maybe not much?
- Is there some causality between the ageing process and the Is there some causality between the ageing process and the per-capita age profiles of LCD?per-capita age profiles of LCD?

Statistics of the first demographic Statistics of the first demographic dividenddividend
Min: The lowest value of the support ratio during the Min: The lowest value of the support ratio during the demographic dividend.demographic dividend.
Year of Min: The year when the SR reach is lowest value. Year of Min: The year when the SR reach is lowest value. Represent the starting point of the first demographic Represent the starting point of the first demographic dividend.dividend.
Max: The highest value of the support ratio during the Max: The highest value of the support ratio during the demographic dividend.demographic dividend.
Year of Max: The year when the SR reach is highest value. Year of Max: The year when the SR reach is highest value. Represent the ending point of the first demographic Represent the ending point of the first demographic dividend.dividend.
Duration of the demographic bond: The number of years Duration of the demographic bond: The number of years between the lowest value and the highest value.between the lowest value and the highest value.

Economic dependency measure by Economic dependency measure by social sectors, Health (Miller, Mason social sectors, Health (Miller, Mason
and Holz).and Holz). Country Aggregate
Spending (% GDP)
BenefitGenerosity
Ratio(% of GDP per working-age adult)
Dependency Ratio(% of
working-age population)
Cuba 7.4 66 11
Colombia 6.2 62 10
Costa Rica 5.9 83 7
Argentina 4.5 32 14
Nicaragua 3.4 33 10
Uruguay 3.4 20 17
Brazil 3.1 28 11
Mexico 3.0 35 9
Chile 2.8 31 9
Peru 1.5 15 10
Median, Latin America 3.4 34 10
Mean, Latin America 4.1 38 11
Mean, OECD 6.9 46 15

Comparison between NTA Latin American Countries and Comparison between NTA Latin American Countries and
other NTA regions using NTA data.other NTA regions using NTA data.
Support RatioSupport Ratio Old consumption (65+) relative to young Old consumption (65+) relative to young
(<15) consumption(<15) consumption Old consumption (LCD age group) relative Old consumption (LCD age group) relative
to young consumption (LCD age group)to young consumption (LCD age group) Young age group of dependencyYoung age group of dependency Old age group of dependencyOld age group of dependency

Comparison between NTA Latin American Countries and Comparison between NTA Latin American Countries and
other NTA regions using NTA data.other NTA regions using NTA data.
0,00% 10,00% 20,00% 30,00% 40,00% 50,00% 60,00% 70,00%
Education
Health
Pesnions
Other in Kind
Uruguay
Mexico
Costa Rica
Chile
Brazil
Distribution of public transfers in young age dependent group between:Distribution of public transfers in young age dependent group between:
– EducationEducation
– HealthHealth
– PensionsPensions
– Other in KindOther in Kind

0,00% 10,00% 20,00% 30,00% 40,00% 50,00% 60,00% 70,00% 80,00% 90,00%
Education
Health
Pesnions
Other
URUGUAY
MEXICO
COSTA RICA
CHILE
BRAZIL
Comparison between NTA Latin American Countries and Comparison between NTA Latin American Countries and
other NTA regions using NTA data.other NTA regions using NTA data. Distribution of public transfers in old age dependent group between:Distribution of public transfers in old age dependent group between:
– EducationEducation
– HealthHealth
– PensionsPensions
– Other in KindOther in Kind

Comparison between NTA Latin American Countries and Comparison between NTA Latin American Countries and
other NTA regions using NTA data.other NTA regions using NTA data.
Intergenerational Reallocation Rate for young Intergenerational Reallocation Rate for young dependents, disaggregated in:dependents, disaggregated in:
-10,00%
-5,00%
0,00%
5,00%
10,00%
15,00%
20,00%
25,00%
Public Transfers Private Transfers Asset Based Reallocation
CHILE
COSTA RICA
MEXICO
URUGUAY

Intergenerational Reallocation Rate for old Intergenerational Reallocation Rate for old dependents, disaggregated in:dependents, disaggregated in:
-6,00%
-4,00%
-2,00%
0,00%
2,00%
4,00%
6,00%
8,00%
10,00%
Public Transfers Private Transfers Asset BasedReallocations
Chile
Costa Rica
Mexico
Uruguay
Comparison between NTA Latin American Countries and Comparison between NTA Latin American Countries and
other NTA regions using NTA data.other NTA regions using NTA data.

Average Life Cycle Deficit for Latin Average Life Cycle Deficit for Latin American CountriesAmerican Countries
Life Cycle Deficit Latin American CountriesAverage of 5 selected countries
0,00
0,20
0,40
0,60
0,80
1,00
1,20
Age
Rel
ativ
e to
Ave
rage
La
bor
Inco
me
(30-
49)
Labor Income
Consumption

Average Finance of Consumption Average Finance of Consumption for LACfor LAC
Finance of Consumption of Latin American Countries
Average of 5 selected countries
0%
99%
20%81%
-20% -7%
26%
-14%
47%
-8%
35%40%
-80%
-40%
0%
40%
80%
120%
160%
0-14 15-64 65 y más
Age
Asset Based Reallocations
Public Transfers
Private Transfers
Labor Income

Average Intergenerational Average Intergenerational Reallocation RateReallocation Rate
Intergenerational Reallocation Rate for Latin American Countries
Average of 5 selected countries
3,77% 3,55% 7,32%
18,38%
-3,08%
15,30%
-0,21%
6,70%
6,49%
-5,00%0,00%5,00%
10,00%15,00%20,00%25,00%30,00%35,00%
Young DependencyGroup
Old DependencyGroup
All DependencyGroups
Per
cen
tag
e o
f G
DP
ABR
TF
TG

WORK IN PROGRESS!!!!WORK IN PROGRESS!!!!
