waistlines of the world - milken...
TRANSCRIPT

Waistlines of the WorldThe Effect of Information
and Communications Technology on Obesity
Anusuya Chatterjee and
Ross C. DeVol

Waistlines of the WorldThe Effect of Information and
Communications Technology on Obesity
Anusuya Chatterjee and Ross C. DeVol
August 2012

Acknowledgments
We thank our Milken Institute colleagues for their invaluable contributions to the report: editors Melissa Bauman and Karen Rogers, and researchers Neesha Joseph, Jaque King, and Yu Xiang. We also thank participants at the 2012 European Conference on Health Economics for their suggestions and feedback.
About the Milken Institute
A nonprofit, nonpartisan economic think tank, the Milken Institute believes in the power of finance to shape the future. The Milken Institute produces rigorous, independent economic research—and maximizes its impact by convening global leaders from the worlds of business, finance, policy, academia, and philanthropy. By fostering collaboration between the public and private sectors, we transform great ideas into action.
© 2012 Milken Institute

Table of ContentsExecutive Summary ....................................................................................................................... 1
Introduction ................................................................................................................................... 5
Methodology ..................................................................................................................................11
Policy Recommendations and Best Practices .......................................................................19
Appendix ....................................................................................................................................... 27
About the Authors ...................................................................................................................... 32


Executive SummaryThe growth of technology has created a great conundrum: Information and communication technologies have vastly improved income and living standards, increased productivity, and enhanced economic growth. But at the same time, technology threatens to widen the world’s waistlines, undermining some of the very economic advances it has fostered.
More than 200 million men and nearly 300 million women are obese worldwide. Roughly 1.4 billion more adults are overweight and at risk of becoming obese. Obesity acts as a trigger for disability and many chronic diseases. In fact, it is the fifth leading cause of death—and may soon be first after all comorbidities are included.
In addition to the human suffering, a key concern is the price tag. In the U.S., the medical burden of obesity climbed to 9.1 percent of annual medical spending in 2006 from 6.5 percent in 1998.1 Today, it is probably 12 percent and rising.
All member nations of the Organisation for Economic Co-operation and Development (OECD) have witnessed greater prevalence of obesity in their populations over the past two decades, but the United States tops the list. In America, about 1 in 3 adults (33.8 percent) is obese, followed by Mexico (30 percent), New Zealand (26.5 percent), Australia (24.6 percent), and Canada (24.2 percent).
NATIONS WITH THE HIGHEST OBESITY RATES Recent years, measured
24.0
26.0
28.0
30.0
32.0
34.0
United States(2008)
33.8
30
26.5
24.6 24.2
Mexico(2006)
New Zealand(2007)
Australia(2007)
Canada(2008)
Percent
Source: OECD.
1. http://www.cdc.gov/media/pressrel/2009/r090727.htm?s_cid=mediarel_r090727.
If the country (U.S.) could reverse the growth rate of obesity
and return to 1998 levels in 2023, then this would translate to a
reduction in health-care spending of $60 billion and an increase
in productivity of $254 billion.
—An Unhealthy America, Milken Institute
1
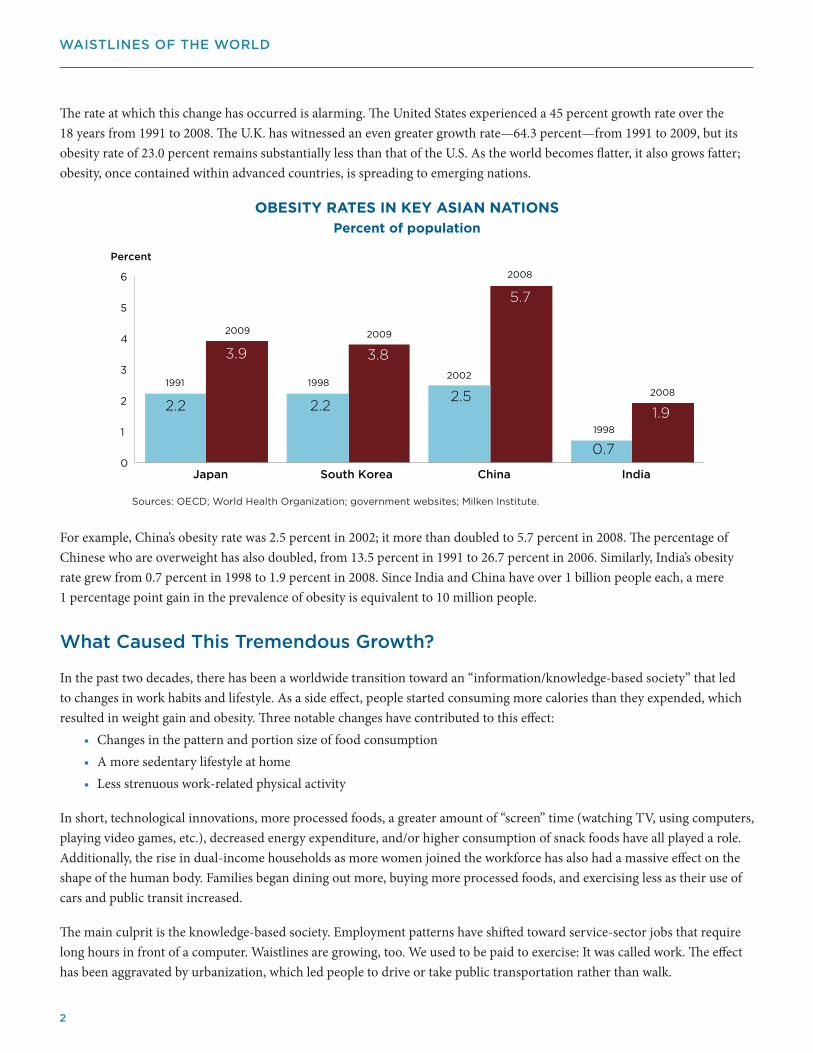
The rate at which this change has occurred is alarming. The United States experienced a 45 percent growth rate over the 18 years from 1991 to 2008. The U.K. has witnessed an even greater growth rate—64.3 percent—from 1991 to 2009, but its obesity rate of 23.0 percent remains substantially less than that of the U.S. As the world becomes flatter, it also grows fatter; obesity, once contained within advanced countries, is spreading to emerging nations.
OBESITY RATES IN KEY ASIAN NATIONS
Percent of population
1998
1991
2009
1998
2009
2002
2008
2008
Sources: OECD; World Health Organization; government websites; Milken Institute.
0
1
2
3
4
5
6
Japan South Korea China India
Percent
2.2
3.9
2.2
3.8
2.5
5.7
0.7
1.9
For example, China’s obesity rate was 2.5 percent in 2002; it more than doubled to 5.7 percent in 2008. The percentage of Chinese who are overweight has also doubled, from 13.5 percent in 1991 to 26.7 percent in 2006. Similarly, India’s obesity rate grew from 0.7 percent in 1998 to 1.9 percent in 2008. Since India and China have over 1 billion people each, a mere 1 percentage point gain in the prevalence of obesity is equivalent to 10 million people.
What Caused This Tremendous Growth?
In the past two decades, there has been a worldwide transition toward an “information/knowledge-based society” that led to changes in work habits and lifestyle. As a side effect, people started consuming more calories than they expended, which resulted in weight gain and obesity. Three notable changes have contributed to this effect:
• Changes in the pattern and portion size of food consumption • A more sedentary lifestyle at home• Less strenuous work-related physical activity
In short, technological innovations, more processed foods, a greater amount of “screen” time (watching TV, using computers, playing video games, etc.), decreased energy expenditure, and/or higher consumption of snack foods have all played a role. Additionally, the rise in dual-income households as more women joined the workforce has also had a massive effect on the shape of the human body. Families began dining out more, buying more processed foods, and exercising less as their use of cars and public transit increased.
The main culprit is the knowledge-based society. Employment patterns have shifted toward service-sector jobs that require long hours in front of a computer. Waistlines are growing, too. We used to be paid to exercise: It was called work. The effect has been aggravated by urbanization, which led people to drive or take public transportation rather than walk.
WAISTLINES OF THE WORLD
2

Main Findings
This report quantifies the effect of knowledge-based technology on the prevalence of obesity rates for 27 OECD countries in the period 1988–2009. One way to measure the size of the knowledge-based economy is by studying the level of investment in information and communications technology (ICT) for every country. We established causality between ICT investment and the prevalence of obesity. The main findings of the report are the following:
1. For every 10 percentage point increase in ICT investment as a share of gross capital formation, the obesity rate climbs 1.4 percentage point on average—or roughly 4.2 million people in a nation the size of the United States. To reach that conclusion, we used the direct effect of less strenuous work and more sedentary home behaviors (1.0 percent), and the indirect effect of higher caloric consumption during screen-time activities (0.4 percent).
ExAmPlE Of A SImulATEd EcONOmY
Initial adult obesity rate: 5 percent; Initial IcT investment: 0 percent
0 2 4 6 8
10 12 14 16 18 20
10 20 30 40 50 60 70 80 90 100
% Obesity
% ICT
The above simulated economy starts with a 5 percent obesity rate and no ICT investment.
Other things being constant, the obesity rate is expected to rise by an increment of
1.4 percentage point for every 10 percentage point increase in ICT investment. When ICT
investment is at 100 percent, obesity rates are expected to be at 18 percent to 20 percent.
2. For countries with high ICT investment rates (more than 30 percent of gross capital formation), a 1 percentage point increase in physically active people can prevent a 0.2 percentage point rise in obesity.
It is no coincidence that the four countries with the highest shares of ICT investment have four of the five highest obesity rates among OECD countries.
3
ExECuTIvE SuMMARy

Recommendations for Strategic Solutions
Obesity is often preventable. This report suggests that behavioral modifications and lifestyle changes can have a significant effect on obesity rates. To plan successful strategies—a single tactic won’t have a long-lasting effect—people from all corners of society must work together. The following are a few recommendations to induce/motivate/incentivize people to be more physically active:
• Employers must realize that they have a vested interest in providing behavioral modification counseling and offering financial and other incentives to workers.
• Governments must invest in infrastructure to induce biking.
• Policymakers must create policies and programs that encourage walking and physical activity overall.
• Governments and health advocates must advance health literacy through promotions, media campaigns, and advocacy.
• Communities must build innovative programs at the local level.
• A strong network must be developed among health-care providers, health informatics, and the community.
There are different ways to improve physical activities. However, a comprehensive strategy that controls food consumption, enhances physical activities, and engages behavioral counseling is the ideal long-term solution. We reject a one-size-fits-all approach and recommend a multilevel, multicomponent intervention: diet and physical activity programs in schools and workplaces to change individual behavior; modifications to schools, work environments, and policies; and the involvement of family, friends, and the wider community. Consequently, as more countries grow their knowledge base, they must blend individual, educational, and environmental strategies to produce greater effects and reach the most vulnerable populations.
Much is at stake. Adoption of ICT in emerging economies should be vigorously pursued because it is critical for boosting growth and incomes. A Luddite strategy is in nobody’s best interest. However, if the world is going to avoid a huge increase in obesity, a devastating rise in chronic disease, and the associated human and economic costs, pre-emptive strikes are necessary. Increased prevalence of obesity in emerging countries with large populations such as China and India could dwarf the rise in associated diseases and medical costs witnessed in the United States and other parts of the developed world.
WAISTLINES OF THE WORLD
4

IntroductionToday’s technology-based society has created a great conundrum: Information and communication technologies have increased productivity, enhanced economic growth, and improved income and living standards around the world, but at the same time technology has triggered conditions that threaten to make humans more obese and undermine the very economic advances that technology has fostered.
Obesity is an epidemic. More than 200 million men and nearly 300 million women worldwide are obese, according to the World Health Organization (WHO), which defines obesity as a body mass index (BMI) greater than 30. Roughly 1.4 billion more adults are overweight or pre-obese, defined as a BMI between 25.0 and 29.9. This represents the pool of individuals who are at high risk of becoming obese in the future.
Unlike many other chronic diseases, obesity is often preventable with behavioral and lifestyle modifications. However, before implementing prevention strategies, it is helpful to know what factors contributed to obesity growth as it will provide guidance on the relative costs of alternative interventions.
In the past two decades, the world has been transitioning to a knowledge-based society, which has led to changes in work habits and lifestyles. A side effect of this societal change is that people started consuming more calories than they expended, resulting in weight gain and obesity. This report studies the effect of technology, controlling for other factors, on the prevalence of obesity in 27 countries that are members of the Organisation for Economic Co-operation and Development (OECD) and suggests appropriate policy recommendations.
Many factors—technology innovations, urbanization, less manual labor, the increase in dual-income families—have led to more sedentary lifestyles. In other words, the rise of the knowledge-based economy has led to less strenuous activity in the workplace and ushered in more sedentary behavior in the home. The size of the knowledge-based economy may be measured by a country’s investment in information and communications technology (ICT).2 This study hypothesizes that as spending on ICT increases, the prevalence of obesity grows, holding other causal factors constant.
2. Information and communications technology (ICT) includes information technology (IT), unified communications, telecommunications (telephone lines and wireless signals), broadcast media, all types of audio and video processing and transmission, and network-based control and monitoring functions.
A Trigger for chronic disease
Obesity can have dire consequences:
• Overweight and obesity together are the fifth leading cause of death worldwide. At least 2.8 million adults die each year as a result of those two conditions.
• Experts attribute 44 percent of the diabetes burden, 23 percent of the ischemic heart disease burden, and 7 percent to 41 percent
of certain cancer burdens to overweight and obesity.
—World Health Organization, Obesity and Overweight Fact Sheet
5

Main Findings
The two important findings of the report are:
1. For every 10 percentage point increase in the share of ICT spending, obesity rates will significantly rise by 1 percentage point directly and 0.4 percentage point indirectly based on the impact of additional consumption of calories during leisure “screen” time.
fIGuRE 1: ExAmPlE Of A SImulATEd EcONOmY Initial adult obesity rate: 5 percent; Initial IcT investment: 0 percent
0 2 4 6 8
10 12 14 16 18 20
10 20 30 40 50 60 70 80 90 100
% Obesity
% ICT
The above simulated economy starts with a 5 percent obesity rate and no ICT investment.
Other things being constant, the obesity rate is expected to rise by an increment of
1.4 percentage point for every 10 percentage point increase in ICT investment. When ICT
investment is at 100 percent, obesity rates are expected to be at 18 percent to 20 percent.
In a hypothetical example of a country with 300 million people, if the share of ICT investment relative to gross fixed capital formation increases by 10 percentage points, with other things remaining constant, it may lead to an additional 4.2 million obese people—3 million directly and an additional 1.2 million attributable to increased “screen” time leisure activities and the associated higher caloric intake.3 However, it is important to note that since our sample consisted of many countries with different economic backgrounds, this finding is a ballpark average number. See the appendix for details of the regression results.
Overall, the independent variables can explain over 50 percent of the variation in obesity among countries across time. Other significant positive contributions to obesity are the amount of calorie intake and percent of urban population. It is not surprising that these two factors significantly affect obesity rates. As mentioned earlier, the increase in portion size has a significant effect on obesity rates. Higher ICT spending seems to be associated with higher caloric intake as well. Therefore, ICT spending has a greater impact on obesity than just its direct impact. Urbanization, in general, leads to a more sedentary lifestyle and hence weight gain.
The only negatively significant variable in our model is smoking; as the percent of smokers increases, it has a dampening effect on obesity rates. Although smoking is related to cancer, COPD, and other chronic diseases, it also aids in weight loss, at least for new and early-stage smokers.
3. For regression results for the indirect effect, please refer to table 13 in the appendix.
WAISTLINES OF THE WORLD
6

The percent of adult women employed wasn’t significant in the equation when entered directly; however, in a separate equation with caloric intake as the dependent variable, it was shown to be a significant explanatory variable. Therefore, the share of women employed indirectly affects obesity through its impact on caloric intake.4 Additionally, the physical activities variable wasn’t significant in this specification as the apparent inconsistent nature of measurement confounded the within-nation findings where it is statistically significant.
2. Countries that have a higher level of ICT investment can significantly lower obesity rates if they encourage/induce people to participate in more physical activities. A spin-off of the original econometric model was the introduction of an interaction term (between ICT investment measure and percent of people engaged in moderate physical activity). The main conclusion from this extended model was that, in nations with higher levels of ICT investment, obesity rates can be lowered significantly through an increase in the population’s physical activity. In other words, when ICT investment rates are high (at least 30 percent of gross capital formation), a 1 percentage point increase in moderately active people5 will lower the obesity rate by 0.2 percentage point.
Conclusion
Obesity rates are rising in most countries due to changes in portion size and food consumption, an increase in sedentary lifestyle in the home, and less physically demanding requirements at work. The main finding of this report is that as countries invest more in technology, their obesity rates rise significantly, holding other factors constant.
Luckily, obesity is often preventable, and lifestyle changes can have a significant effect. Policymakers, business leaders, and community members need to develop a comprehensive strategy for long-term outcomes. Studies have shown that increasing physical activity prevents weight gain in the short term, but the one-two punch of improved diet and more physical activity is a long-term solution. For a comprehensive strategy, add extensive behavioral counseling to the mix. Progress will require involving the school and the workplace to effect individual behavioral changes, modifying school and work environments and policies, and engaging the wider community.
4. Please refer to table 13 in the appendix for details.5. Moderate exercise of 30 minutes or more at least five times a week.
7
INTRODuCTION

Background
Obesity has been rising in all OECD countries over the past two decades. In 1991, the U.S. already had the highest prevalence of obesity among the OECD nations at 23.3 percent; by 2008, that figure had leaped to 33.8 percent—an increase of 45 percent. Although the U.K. has substantially less obesity than the U.S., the obesity growth rate there was much higher: an alarming 64.3 percent from 1991 to 2009. Australia, New Zealand, Spain, and Mexico have witnessed similar gains over the period. This has resulted in a widening gap in absolute levels of obesity rates among advanced countries over time.
However, countries with less obesity have still experienced tremendous growth in the condition. For example, obesity in Japan spiked 77 percent over a 19-year period (from 2.2 percent in 1991 to 3.9 percent in 2009), and in South Korea it jumped 73 percent over a 12-year period (from 2.2 percent in 1998 to 3.8 percent in 2009). Pre-obesity rates in these countries are also rising faster, signaling adverse outcomes in the future. Furthermore, evidence is mounting that lower thresholds for obesity should be used for Asian populations because chronic disease rates are higher than obesity levels would predict.6
fIGuRE 2: OBESITY RATES IN KEY ASIAN NATIONS Percent of population
1998
1991
2009
1998
2009
2002
2008
2008
Sources: OECD; World Health Organization; government websites; Milken Institute.
0
1
2
3
4
5
6
Japan South Korea China India
Percent
2.2
3.9
2.2
3.8
2.5
5.7
0.7
1.9
This trend is spreading in emerging countries as well. For example, China had an obesity rate of 2.5 percent in 2002; by 2008, the rate had more than doubled to 5.7 percent. Similarly, India’s obesity rate grew from 0.7 percent in 1998 to 1.9 percent in 2008. More alarming is that in China, where dietary habits and lifestyle are rapidly changing, the population that is overweight—as opposed to obese—doubled from 13.5 percent in 1991 to 26.7 percent in 2006.7 Of course, India and China each have a population of more than 1 billion, so 1 percent of the population is about 10 million people. As a result, a modest rise in obesity in these nations dwarfs the absolute increase in chronic disease cases in the United States.
6. World Health Organization Consultation, “Appropriate Body-Mass Index for Asian Populations and Its Implications for Policy and Interventions Strategies,” The Lancet, (2004), Vol. 363, p. 157-163.
7. K. Baillie, “Health Implications of Transition from a Planned to a Free-market Economy – An Overview,” Obesity Reviews, (2008) Vol. 9, Suppl. 1, p. 146-150.
WAISTLINES OF THE WORLD
8

About one in three American adults (33.8 percent) is obese. Not far behind: Mexico (30 percent), New Zealand (26.5 percent), Australia (24.6 percent), and Canada (24.2 percent).
fIGuRE 3: NATIONS WITH THE HIGHEST OBESITY RATES Recent years, measured
24.0
26.0
28.0
30.0
32.0
34.0
United States(2008)
33.8
30
26.5
24.6 24.2
Mexico(2006)
New Zealand(2007)
Australia(2007)
Canada(2008)
Percent
Source: OECD.
The rates are not quite as high in various European nations, but they are based on self-reported data for adults, a method that usually under-reports obesity. The condition affects 18.1 percent of Greeks, 18.0 percent of Estonians, 17.4 percent of Czechs, 16.0 percent of Spaniards, and 15.4 percent of Portuguese.8
fIGuRE 4: OBESITY RATES IN SElEcTEd EuROPEAN NATIONS Recent years, self-reported
15.0
15.5
16.0
16.5
17.0
17.5
18.0
18.5
Greece(2008)
Estonia(2008)
Czech Republic(2008)
Spain(2009)
Portugal(2006)
Percent
Source: OECD.
18.1 18.0
17.4
16.0
15.4
8. Measured values would probably have reported a higher prevalence. For example, in the United States, the obesity rate using measured data is 33.8 percent, but it is 27.7 percent using self-reported data. The Behavioral Risk Factor Surveillance System (BRFSS), a self-reported survey conducted by the Centers for Disease Control and Prevention (CDC), is widely used for data related to obesity and other health indicators.
9
INTRODuCTION

What Caused Growth in Obesity?
In the past two decades, technological innovations, work habits, and lifestyle changes have resulted in many people consuming more calories than burned. Three notable contributors are:
• Changes in the pattern/portion size of food consumption
• A more sedentary lifestyle at home
• Less strenuous physical activity at work
Technology innovations, falling food prices (partly attributable to technological advances in food processing and preparation),9 and the rise in dual-income families have resulted in people consuming more processed foods and larger portions. Because employed people have fewer hours available for food preparation, fewer meals are made from scratch, and more processed food is consumed. This changing dynamic has also led to more meals at restaurants, where the caloric content is likely to be higher and the portions larger.
In addition, the introduction of ICT in the home has resulted in more hours spent watching TV, surfing the Internet, and playing video games. Consumers have been inundated with products catering to more sedentary lifestyles. This shift has come at the expense of sports and more strenuous activities,10 and it has increased the propensity to consume snack foods. While children and adolescents are disproportionately affected, the trend has long-tail liabilities because weight is rarely shed as adults.
Shifting employment patterns toward knowledge-based occupations that involve long hours in front of computers has contributed as well. Further exacerbating the problem is the dramatic decline in the intensity of physically demanding occupations after World War II as machinery was substituted for raw labor in the production of goods and services.
Supporting this contention, a study by Lakdawalla and Philipson concluded that a woman in a more sedentary occupation would gain more than three body mass index (BMI) units over her career compared to a woman in a highly active occupation.11 To maintain the same level of energy expenditure, workers needed to devote more leisure hours to exercise. However, exercise was competing against screen time with increasingly sophisticated electronic gadgets in the home. The “last hour” rule basically states that when the enjoyment associated with technological advances increases in sedentary leisure, people will devote more time to sedentary entertainment at the margin.12
The circumstances were aggravated by growing urbanization as people moved to cities from rural areas and by suburbanization, which led people to drive or take public transportation rather than walk.
9. Darius Lakdawalla and Tomas Philipson, “The Growth of Obesity and Technology Change: A Theoretical and Empirical Examination,” NBER Working Paper 8946 (May, 2002) p.1-26, http://www.nber.org/papers/w8946 (accessed April 8, 2012).
10. S. Gortmaker, A. Must, et al., “Social and Economic Consequences of Overweight in Adolescence and Young Adulthood,” New England Journal of Medicine, 329 (1996), p. 1008-1012.
11. Darius Lakdawalla and Tomas Philipson, “The Growth of Obesity and Technology Change: A Theoretical and Empirical Examination,” NBER Working Paper 8946 (May 2002) p.1-26, http://www.nber.org/papers/w8946 (accessed April 8, 2012)
12. Roland Sturm, “The Economics of Physical Activity: Societal Trends and Rationales for Interventions,” American Journal of Preventive Medicine, 27(3S), (2004) p. 126-135.
An Australian study shows
that the majority of time
spent at work is sedentary –
77 percent. More broadly, 70
percent of the entire workday
(before, during, and after
work) is spent sedentary
compared to a non-work day
in which the proportion is
lower at 62 percent.
—Alicia Thorp, David Dunstan et al., “Stand up Australia: Sedentary behavior in workers,” Medibank Private, August 2009
WAISTLINES OF THE WORLD
10

MethodologyMany countries have increased ICT13 spending considerably in recent years. Those at the high end of ICT investment have experienced greater growth in output and labor productivity,14 including Australia, Sweden, Finland, Ireland, South Korea, Malaysia, Thailand, the Czech Republic, Poland, Russia, Slovakia, and many others.15 As a result, ICT can be considered a profitable and growth-enhancing investment. However, higher ICT investment also contributes to sedentary lifestyles.
This report studies 27 countries for the period 1988–200916: Australia, Austria, Belgium, Canada, the Czech Republic, Denmark, Estonia, Finland, France, Germany, Greece, Ireland, Israel, Italy, Japan, South Korea, Mexico, the Netherlands, New Zealand, Norway, Poland, Portugal, Spain, Sweden, Switzerland, United Kingdom, and the United States.
The dependent variable whose movement we are trying to explain is obesity across the 27 countries. The data on obesity were mainly collected from the Organisation for Economic Co-operation and Development. Table 1 shows the obesity rate (percentage of adult population that is obese) in each country. Since data are not available uniformly for all countries, the following table includes the latest available data. This data set was among the most current and comprehensive compiled at the time of data collection.
13. Information and communications technology (ICT) includes information technology, unified communications, telecommunications (telephone lines and wireless signals), broadcast media, all types of audio and video processing and transmission, and network-based control and monitoring functions.
14. OECD, “The Sources of Economic Growth in OECD Countries,” (2003), http://www.oecd.org/dac/ictcd/docs/otherdocs/OtherOECD_eco_growth.pdf (accessed Feb 2, 2012).
15. Marcin Piatkowski, “Does ICT Matter for Growth and Labor Productivity in Transition Economies?” Transformation, Integration and Globalization Economic Research, (2003), http://www.tiger.edu.pl/publikacje/TWPNo47.pdf (accessed September 22, 2011).
16. Originally there were 34 countries: Australia, Austria, Belgium, Canada, Chile, the Czech Republic, Denmark, Estonia, Finland, France, Germany, Greece, Hungary, Iceland, Ireland, Israel, Italy, Japan, South Korea, Luxembourg, Mexico, the Netherlands, New Zealand, Norway, Poland, Portugal, Slovak Republic, Slovenia, Spain, Sweden, Switzerland, Turkey, United Kingdom, and United States. Because of data limitations, we finally selected countries that had at least two non-missing data points.
CountryObesity rate
(% adult population)Latest year reported
united States 33.8* 2008
Mexico 30.0* 2006
New Zealand 26.5* 2007
Australia 24.6* 2007
Canada 24.2* 2008
united Kingdom 23.0* 2009
Greece 18.1 2008
Estonia 18.0 2008
Czech Republic 17.4 2008
Spain 16.0 2009
Portugal 15.4 2006
Ireland 15.0 2007
Finland 14.9 2009
Germany 14.7 2009
CountryObesity rate
(% adult population)Latest year reported
Switzerland 14.7 2009
Belgium 13.8 2008
Israel 13.8 2008
Poland 12.5 2004
Austria 12.4 2006
Netherlands 11.8 2009
Denmark 11.4 2005
France 11.2 2008
Sweden 11.2 2009
Italy 10.3 2009
Norway 10.0 2008
Japan 3.9* 2009
South Korea 3.8* 2009
TABlE 1: PREvAlENcE Of OBESITY IN 27 OEcd cOuNTRIESSelf-reported and measured values
*Measured. Source: OECD.
11

There were two main issues with data on the prevalence of obesity:
» Information about the prevalence of obesity was not available for all time periods for most countries. The final sample included countries that have obesity rates for at least two time periods (not necessarily consecutive).
» Data on obesity rates were collected in two ways:
i. Measured (observed): Height and weight of individuals are actually measured so that there is very little chance of measurement error.
ii. Self-reported (individuals reported their height and weight, and BMI were calculated from their responses): Self-reported data are often biased because there is a tendency of under-reporting weight and over-reporting height. Nevertheless, self-reported data are the only sources available for many countries and provide a rough measurement of obesity rates. In the United States, the obesity rate was 34 percent in 2008 using measured data, but it was 28 percent using self-reported data from the Behavioral Risk Factor Surveillance System (BRFSS), a survey conducted by the Centers for Disease Control and Prevention (CDC). Nevertheless, BRFSS is a widely used and acceptable dataset.
We controlled for the discrepancies in data collection in our analysis.17
In our sample, 21 countries had only self-reported data, six countries had only measured data, and seven had both measured and self-reported values. We generally used self-reported data if available but also used measured data for countries that reported only measured values.18 We used self-reported data from BRFSS for the United States because more data points were available.
The first of the independent variables, ICT, consists of information technology (IT), telecommunication, broadcast media, audio and video processing and transmission, and network-based control and monitoring functions. Investment in ICT is considered beneficial for the economy in terms of economic growth, job creation, and productivity. However, increased investment in ICT also leads to a sedentary lifestyle: watching more TV, working long hours at a computer, playing video games, etc. So as screen-time hours increase, the chance of weight gain increases. This study hypothesizes that the rise of the knowledge-based economy (higher spending on ICT as a percent of non-residential gross fixed capital formation) translates into more people becoming obese, holding other factors constant.
Figure 5 shows a positive relationship between obesity rate and share of ICT investment.
The United States’ ICT share of fixed gross capital formation increased from 23.4 percent in 1988 to 26.6 percent in 2009—the highest percentage among the most obese countries. Other countries have experienced similar increases as technology has been substituted for structures and traditional equipment. It is no coincidence that the four countries with the highest shares of ICT investment rank in the top five for highest obesity rates among OECD countries.
Many factors contribute to obesity. In our research, we controlled for several independent variables: physical activity, caloric intake and type of diet, growth of urban population, carbon-dioxide emissions, women in the labor force, alcohol consumption, and smoking.
17. Any measurement issue in using both self-reported and measured data is resolved by using an indicator (dummy variable) in the above regression (equation 1). It is to be noted here that this is not going to create much difference in the regression results as long as we are consistent with the type of dataset we use for each country.
18. Japan, South Korea, Mexico, Luxembourg, New Zealand, and the United Kingdom.
WAISTLINES OF THE WORLD
12

Sources: OECD, World Bank, government websites, Milken Institute.
Most Obese Countries
CountriesLatest year reported
Obesity rate (% )
Moderate physical activity
(% )
United States 2008 33.8 22.5
Mexico 2006 30.0 20.6
New Zealand 2007 26.5 48.2
Australia 2007 24.6 21.8
Least Obese Countries
CountriesLatest year reported
Obesity rate (% )
Moderate physical activity
(% )
Italy 2009 10.3 27.4
Norway 2008 10.0 37.0
Japan 2009 3.9 19.6
South Korea 2009 3.8 38.9
Table 2: Physical acTiviTy in The mosT and leasT obese counTriesPercent of adult population
Percent of population that is physically active:
Inactivity is one of the leading underlying causes of death. Physical activity reduces the risk of developing obesity and is an effective strategy for maintaining weight loss. In the United States, “moderate physical activity” is defined as light-to-moderate activity for at least 30 minutes five times per week.19
One challenge of data collection was the lack of a consistent definition of “physical activity” across countries. The data for different countries was collected from different sources that include the World Bank, the OECD, and government websites.
Except for New Zealand, countries with the most obesity had less than 25 percent of adults engaged in moderate physical activity. In contrast, except for Japan, countries with the lowest obesity rates had at least 25 percent of population engaged in moderate physical activities.
19. http://www.fitness.gov/resources_factsheet.htm.
0
5
10
15
20
25
30
35
5 10 15 20 25 30 35
% Obesity
% ICT
FiGure 5: eFFecT oF icT invesTmenT on adulT obesiTy in 27 oecd counTries
Sources: OECD, World Bank, Milken Institute.
13
MethOdOLOgy

Caloric intake and type of diet
Over the past decade or two, the pattern of food consumption has changed considerably in most countries. Soda and other sugar-sweetened beverages have become substitutes for water, and people are indulging in more processed products and fast food. In part due to larger portions, caloric intake has swelled.
The average consumption of calories over the past 10 to 15 years has increased by almost 300 calories per day in the U.S. This seemingly inconsequential gain, combined with reduced energy expenditure at work and at home, has caused a dramatic increase in the weight of the world. Over the past 15 years, many other OECD countries have witnessed gains in the range of 150-250 calories per day.
TABlE 3: dAIlY fOOd cONSumPTION, PER cAPITA(caloric intake per day)20
Most Obese Countries
Countries 1988 2007 Difference
united States 3,460 3,748 288
Mexico 3,102 3,266 164
New Zealand 3,129 3,159 30
Australia 3,122 3,227 105
Least Obese Countries
Italy 3,524 3,646 122
Norway 3,169 3,464 295
Japan 2,919 2,812 -107
South Korea 3,086 3,074 -12
Sources: United Nations Food and Agricultural Organization, Milken Institute.
Now consider the French: They eat more fats than Americans but are much leaner. A recent study21 concluded that the French simply eat smaller portions. This suggests that a balanced diet with smaller portions might be a key to containing obesity.
TABlE 4: THE fRENcH PARAdOx
Obesity Caloric intakeFat intake
(grams per capita)Sugar consumption (kilos per capita)
Fruits and vegetables (kilos per capita)
united States 33.8* 3,730 160 66 247
France 11.2 3,523 166 37 221
*measured.Sources: United Nations Food and Agricultural Organization, OECD, Milken Institute.
20. This includes all forms of “post-retail” losses, notably household waste, retailing losses, and pet food. As a result, the data represent the national “assumed” consumption rather than the actual consumption and are not a perfect measure. Nevertheless, this is the only available data with consistent methodology over time and across countries. Mario Mazzocchi and W. Bruce Traill, “Calories, Obesity and Health in OECD Countries,” Applied Economics 43, no. 26 (2011), pp. 3919-3929.
21. Paul Rozin et al., “The Ecology of Eating: Smaller Portion Sizes in France Than in the United States Help Explain the French Paradox,” American Psychological Society, 14, no. 5 (2003), pp. 450-454.
WAISTLINES OF THE WORLD
14

Percent of population in urban areas
Urbanization leads to a more sedentary lifestyle, greater consumption of processed foods, and less physical activity. Our data suggest that Portugal, the Netherlands, South Korea, Mexico, and the United States had the most growth in urbanization in the past two decades or so.
TABlE 5: cOuNTRIES WITH THE mOST uRBAN POPulATION GROWTH(1988–2009)
Countries urban population (%)
Growth rate (1988-2009)
1988 2009
Portugal 46.9 60.1 28%
Netherlands 67.9 82.4 21%
South Korea 70.2 81.7 16%
Mexico 70.4 77.5 10%
united States 75.0 82.0 9%
Ireland 56.7 61.6 9%
Norway 71.7 77.5 8%
Japan 62.1 66.6 7%
Canada 76.5 80.5 5%
France 73.9 77.6 5%
Sources: OECD, World Bank, Milken Institute.
Carbon-dioxide emissions
A person’s choice of transportation—driving or riding public transit instead of walking or biking—can contribute to a sedentary lifestyle. Although the urbanization rate will account for this effect to some extent, “carbon-dioxide emission” was used as a proxy for “miles driven” to be more precise in controlling for the effect of mode of transportation on obesity. This is based on the assumption that increased use of cars/buses results in more carbon-dioxide emissions. On average, carbon-dioxide emissions for 1988–2009 were high in the United States (20 metric tons per capita), Australia (17 metric tons per capita), Canada (16 metric tons per capita), and Estonia (13 metric tons per capita). Countries with lower emissions are Mexico (4 metric tons per capita), Portugal (5 metric tons/capita), Sweden, and Switzerland (each with 6 metric tons per capita).
TABlE 6: cARBON-dIOxIdE EmISSIONS(metric tons per capita, average for 1988-2009)
Countries Top 4 Countries Bottom 4
united States 20 Mexico 4
Australia 17 Portugal 5
Canada 16 Switzerland 6
Estonia 13 Sweden 6
Sources: OECD, World Bank, Milken Institute.
15
METHODOLOGy

Percent of women in labor force/employed
One important economic change in recent decades has been the increase of dual-income and single-parent households, which we measured by the increase in the percent of women employed. 22 In 1988, 29.4 percent of women in Spain were employed, compared to 53.5 percent in 2009. Similarly, about 33 percent of women were employed in Ireland in 1988 vs. 57.8 percent in 2009. Many other countries also saw an overall increase in the proportion of working women. Many studies23 have found that maternal employment has a significant positive effect on childhood obesity. The children of working adults are likely to watch more TV and eat processed foods, and the adults themselves tend to have more sedentary lifestyles and less healthful eating habits.
TABlE 7: PERcENT Of EmPlOYEd WOmEN(Selected countries)
Countries 1988 2009 Growth rate (%)
Spain 29.4 53.5 82.1
Ireland 33.7 57.8 71.7
Netherlands 44.3 69.6 57.0
Belgium 38.4 56.0 45.7
Israel 42.0 55.9 33.3
Italy 34.9 46.4 32.9
Greece 37.2 48.9 31.7
Germany 49.9 65.2 30.5
Australia 54.2 66.3 22.3
France 50.2 60.0 19.4
Sources: OECD, World Bank, Milken Institute.
Alcohol consumption
Alcohol slows down the metabolism. Usually, frequent drinking and binge drinking influence weight gain. However, extreme alcohol abuse is associated with low body weight, confounding the relationship. On average, in the period 1988–2009, French and Austrians consumed the most alcohol of our sample countries at 14 liters per capita, followed by Estonia and Portugal (both 13 liters). Alcohol consumption in the United States was much less at 9 liters per capita. Sweden (6 liters), Norway (6 liters), Mexico (5 liters), and Israel (2 liters) were at the bottom of the list.
TABlE 8: AlcOHOl cONSumPTION(liters per capita, average for the period 1988–2009)
Countries Top 4 Countries Bottom 4
France 14 Israel 2
Austria 14 Mexico 5
Estonia 13 Norway 6
Portugal 13 Sweden 6
Sources: OECD, World Bank, Milken Institute.
22. “Employment” is a proxy for labor force. 23. The Oxford Handbook of the Social Science of Obesity, ed. John Cawley (New York: Oxford University Press, 2011), pp. 313-328.
WAISTLINES OF THE WORLD
16

Current smokers
While tobacco use is bad for your health, smoking initiation can contribute to weight loss. Hence, there is an assumed inverse relationship between a higher rate of smoking and a lower obesity rate. In 2009, the Netherlands had the highest prevalence of smoking at 28 percent, followed by Poland (27 percent), Spain (26.2 percent), South Korea (25.6 percent), and Japan (24.9 percent). The high rate of smoking in South Korea and Japan is a major factor in explaining their low obesity rate.
TABlE 9: TOBAccO cONSumPTION(Percent of adult population)
CountriesTobacco consumption
(2009)Obesity rate
(Latest years)*
Netherlands 28.0 11.8
Poland 27.0 12.5
Spain 26.2 16.0
South Korea 25.6 3.8
Japan 24.9 3.9
Italy 23.3 10.3
Germany 21.9 14.7
Switzerland 21.9 14.7
*Table 1. Sources: OECD, World Bank, Milken Institute.
17
METHODOLOGy


Policy Recommendations and Best PracticesIf the world is going to avoid a huge increase in obesity, a devastating rise in chronic disease, and the associated human and economic costs, preemptive interventions are necessary. The increased prevalence of obesity in emerging countries with large populations such as China and India could dwarf the rise in associated diseases and medical costs witnessed in the United States over the past several decades. Considerable research is under way to develop strategies to lower obesity rates. It is always cost-effective to invest more on prevention rather than treatment. The two main prevention strategies are controlling food intake and increasing metabolism through more active living. However, a successful long-term strategy should involve a network of policies regarding food intake, physical activities, and behavior-modification counseling. Given the link between high levels of ICT investment and obesity, we recommend that countries devise effective strategies to prevent obesity growth as they increase their share of technology investments.
Many countries are already taking innovative approaches to minimize the risks of obesity. Below is a summary of some of these approaches.
Employers must realize that they have a vested interest in providing behavior-
modification counseling and offering financial and other incentives to workers:
Most employers provide health-care benefits to their workers. Employers can
significantly reduce their medical costs by promoting employee health and wellness.
• SAfEWAY has been an innovator in employee health and wellness programs. Its Healthy Measures program was implemented in 2005 after CEO Steven Burd recognized that rising health-care costs were impairing Safeway’s bottom line and the wellness of its employees. Burd realized that “70 percent of all health-care costs are the direct result of behavior,” he wrote in the Wall Street Journal. The program is voluntary, and employees are tested on four measures: use of tobacco, healthy body weight, blood pressure, and cholesterol levels. Safeway implemented a large insurance premium incentive for employees who met goals. Additionally, cash and products were offered as further incentive. Safeway’s obesity rate is 70 percent of the national average. In 2010 Safeway started its JumpStart Challenge—a voluntary wellness competition designed to instill positive lifestyle changes. Results included:• 1,262 employees registered• 4,701 pounds shed, an average of 4 pounds per participant• An overall obesity reduction of 7 percent
Read more: Wall Street Journal: http://online.wsj.com/article/SB124476804026308603.html Safeway: http://csrsite.safeway.com/people/employees/
• dOW cHEmIcAl is a leader in providing health coaching for its employees and their families. Its Weight Management Program provides face-to-face counseling along the following lines:
• Individual consultation with a registered dietitian• Group consultation with a registered dietitian• Support group• Membership programs (e.g., Weight Watchers, Jenny Craig)
19

It pays 100 percent of the expenses for weight-loss counseling for workers and their families (unlimited visits for those ages 0-22 and 26 visits per calendar year for those 22 and older), of which 10 visits can be used for healthy diet counseling. Additional sessions are covered if medically indicated. Dow also provides recognition awards such as Making a Difference as a soft incentive to encourage healthy behaviors.
Read more: http://www.dow.com/news/corporate/2009/20090227b.htm
• GENERAl mIllS, in 2004, developed the General Mills Health Number screening tool. This personalized assessment helps employees identify health risks, make healthy lifestyle changes, and learn about health and wellness resources. Fitness centers are provided at the company’s headquarters and in many processing facilities. At their manufacturing locations around the U.S., programs such as walk/run fitness competitions and nutrition classes are held regularly. Another innovation is the introduction of “nutrition centers” at its research and development facilities that offer free healthy food.
Read more: http://www.generalmills.com/Responsibility/health_and_wellness/Workplace%20wellness.aspx and http://www.generalmills.com/Media/NewsReleases/Library/2011/June/NationalBusinessGrouponHealth.aspx
• ENERGY cORPORATION Of AmERIcA Energy Corporation of America (ECA), a natural gas and oil company with 300 employees, has gained recognition for instituting a comprehensive wellness program, which is still rare for smaller companies. ECA follows up on every health risk assessment, regardless of the results, with an in-person health coaching session to discuss each employee’s health risks and opportunities for a healthy lifestyle.
Read more: http://www.energycorporationofamerica.com/eca-news/eca-honored-by-the-house-of-representatives-for-its-platinum-well-workplace-award.html
Investing in infrastructure to induce
biking: Encouraging biking is a cost-
effective way to not only improve
physical activities but also reduce traffic
congestion and pollution. Studies have
shown that countries where people
frequently walk or bike have relatively
lower obesity rates.24
• THE NETHERlANdS invested heavily in an infrastructure network for bicycling. That includes bike lanes, separated paths, and specialized signals and traffic signs for bicyclists. Although we could not find evidence proving that the program is successful, experts believe it would have contributed to a 30 percent to 50 percent increase in biking in many Dutch cities.
Read more: http://policy.rutgers.edu/faculty/pucher/irresistible.pdf
24. David R. Bassett et al., “Walking, Cycling, and Obesity Rates in Europe, North America, and Australia,” Journal of Physical Activity and Health 5 (2008), pp. 795-814, http://policy.rutgers.edu/faculty/pucher/jpah08.pdf (accessed June 6, 2012).
WAISTLINES OF THE WORLD
20

• SEvIllE, SPAIN, added 87 miles of new cycling infrastructure in 2007–2009. The improvements increased the percentage of all trips taken by bicycle from 0.4 percent to 7 percent.
Read more: http://peoplepoweredmovement.org/site/images/uploads/2012%20Benchmarking%20Report%20%20-%20Final%20Draft%20-%20WEB.pdf
• cOPENHAGEN created a plan to increase the proportion of people who cycle to work to 40 percent from 34 percent. The Copenhagen Roads and Parks Department is implementing a number of related projects, such as setting up 300 new bicycle parking spaces in selected districts and repairing all cycle track surfaces to ensure safe and comfortable biking.
Read more: http://www.euro.who.int/__data/assets/pdf_file/0013/111028/E90669.pdf
Policies and programs that encourage
walking: Walking, the easiest form of
exercise, can go a long way toward
obesity prevention for all ages. One U.S.
study concluded that each additional
kilometer walked per day was
associated with a 4.8 percent reduction
in the likelihood of obesity.25
• WAlK fRIENdlY cOmmuNITIES (U.S.) started in 2010 supports a safer walking environment. WFC- designated communities are provided with resources for a pedestrian safety action plan. Thirty-two cities currently have the WFC designation.
Read more: http://www.walkfriendly.org/index.cfm
• WAlK dENvER (U.S.) is a nonprofit organization that advocates benefits of walking as a more economical and healthy form of transportation.
Read more: http://www.walkdenver.org/
• WAlKING ScHOOl BuS PROGRAmS (Australia) were funded by the Victorian Health Promotion Foundation in 60 local councils in Victoria. From 2001 to 2010, $4.5 million was committed to the program, which encourages children to walk to school in groups.
Read more: http://www.pcal.nsw.gov.au/__data/assets/file/0007/27682/travelsmart.pdf
25. Lawrence D. Frank, Martin A. Andresen, and Thomas L. Schmid, “Obesity relationships with community design, physical activity, and time spent in cars,” American Journal of Preventive Medicine 27, no. 2 (2004), pp. 87-96, http://www.sciencedirect.com/science/article/pii/S074937970400087X (accessed June 6, 2012).
21
POLICy RECOMMENDATIONS AND BEST PRACTICES

• cHIldREN WAlKING TO ScHOOl PROJEcT (Italy) was launched in 2002 to reduce traffic and pollution near schools, promote self-reliance and a sense of safety among children, and encourage active transport in urban settings. (www.comune.udine.it).
Read more: http://www.euro.who.int/__data/assets/pdf_file/0013/111028/E90669.pdf
Encouraging overall physical activity:
A study concluded that 60 to 90
minutes a day of moderate-intensity
physical activity is required to maintain
a significant weight loss.26 Many
countries and communities have created
innovative solutions to make their
citizens more active.
• lET’S mOvE (U.S.) is an initiative started in 2010 and spearheaded by First Lady Michelle Obama with the mission of “solving the challenge of childhood obesity within a generation so children will grow up healthier and able to pursue their dreams.” This program provides parents with resources that support healthy choices, provide access to healthy and affordable food, and help kids become more physically active. For funding of the initiative, President Obama proposed an additional $10 billion over 10 years to improve the National School Lunch and Breakfast program.
Read more: http://www.letsmove.gov/learn-facts/epidemic-childhood-obesity http://www.whitehouse.gov/the-press-office/first-lady-michelle-obama-launches-lets-move-americas-move-raise-a- healthier-genera
• AcTIvE AfTER-ScHOOl cOmmuNITIES (Australia) provides children with access to free sporting and other structured physical activities. The Australian Sports Commission manages the AASC program nationally through a network of locally based regional coordinators.
Read more: http://www.ausport.gov.au/participating/aasc/about http://www.healthykids.nsw.gov.au/campaigns-programs/active-after-school-communities-program.aspx
• JumP ROPE fOR HEART (New Zealand) is a nationwide, primary school-based program promoting physical fitness through a range of curriculum-based skills and activities.
Read more: http://www.arphs.govt.nz/Portals/0/About%20us/Publications%20and%20Reports/List%20of%20publications%20and%20reports/Publication%20archive/Childhood_Obesity.pdf http://www.euro.who.int/__data/assets/pdf_file/0013/111028/E90669.pdf
26. James O. Hill and Holly R. Wyatt, “Role of physical activity in preventing and treating obesity,” Journal of Applied Physiology 99, no. 2 (2005), pp. 765-770, http://www.jappl.org/content/99/2/765.short (accessed June 6, 2012).
Jump Rope for Heart (New Zealand)
WAISTLINES OF THE WORLD
22

Health literacy/promotion, media campaigning, and advocacy: Raising awareness
about the dangers of obesity and how active lifestyle can improve overall well-
being is a great strategy. Methods include media campaigns that disseminate
information and build awareness as well as advocacy by groups that promote
health education and lifestyle changes.
• AGITA SÃO PAulO (Brazil), launched in 1996, encourages people to adopt an active lifestyle. Its three main target groups: students, workers, and the elderly. It targets different age groups and organizes large events as outreach efforts. Intervention studies have found that the program has positive impacts through changes in behavior and increasing awareness.
Read more: http://www.ncbi.nlm.nih.gov/pubmed/14662077
• RIdE YOuR BIKE! (Germany) is a national cycling plan begun in 2002 to promote cycling in Germany and relevant activities and programs. The health campaign Germany Is Becoming Fit, which started in 2005, promotes walking 3,000 steps each day and distributes free pedometers. The program is also endorsed by several celebrities.
Read more: http://www.bicyclinginfo.org/library/details.cfm?id=3344
• NORWAY NATIONAl cYclING STRATEGY (Norway) was developed in 2003 to raise awareness about the positive health effects of biking. Read more: http://www.vegvesen.no/_attachment/60913/binary/13273 and http://www.vegvesen.no/en/Professional/Environment/National+cycling+strategy
Shape up Somerville (u.S.)
Building innovative programs at
the local level: Prevention strategies
are most successful when all aspects of
a community and its resources
are involved.
• EvER-AcTIvE ScHOOlS (Canada) encourages and recognizes schools that promote positive health behaviors and practices and physical activity. The program provides a framework that identifies strategies in four areas and the resources to assist in implementation.
Read more: http://66.240.150.14/intervention/239/view-eng.html
23
POLICy RECOMMENDATIONS AND BEST PRACTICES

• fIT fOR lIfE (Finland) was intended to increase the number of regularly active middle-aged people by 10 percent in five years (double the long-term trend). The program supported more than 400 local projects throughout Finland, averaging $1,500 to $3,000 per project. It is now actively involved in creating a permanent network of services supporting engagement in various types of physical activities.
• SuISSE BAlANcE (Switzerland) was launched in 2002 as a joint program of the Swiss Federal Office of Public Health and the foundation Health Promotion Switzerland. Two main objectives of the program are:
• Increasing the proportion of the population at a healthy weight.
• Creating by 2010 the structural conditions needed to allow the stable development of healthy body weight in the population. The program encourages and supports the development of local, regional, and national projects that reinforce healthy behavior through nutrition and physical activity.
Read more: www.suissebalance.ch and http://www.euro.who.int/__data/assets/pdf_file/0013/111028/E90669.pdf
• SHAPE uP SOmERvIllE (U.S.) targets the before, during, and after-school environments in Somerville, Mass. It promotes community awareness though community events, newspaper columns, and an approved restaurant campaign.
Read more: http://www.somervillema.gov/departments/health/sus
Walk with a Doc
Building a strong network between
health-care providers, health
informatics, and community:
Health-care providers have a greater
role to play since many people listen
to their doctors. But a systematic
approach to keeping track of biometric
data/information is necessary for
future strategies.
• THE HEAlTH EcONOmIc ASSESSmENT TOOl was developed by the World Health Organization as a tool for estimating the economic value of cycling to help policymakers make informed decisions.
Read more: http://peoplepoweredmovement.org/site/images/uploads/2012%20Benchmarking%20Report%20%20-%20Final%20Draft%20-%20WEB.pdf
• NEW lANd-uSE PlANNING PROcEduRES ANd TOOlS are being developed by Norwegian authorities to better address health aspects and physical activity. This includes integrating a health impact assessment into ordinary planning procedures. The Planning and Building Act, now being revised, is considered crucial to creating surroundings that are more conducive to physical activity. The Working Environment Act of 2007 requires employers to consider physical activity as part of a company’s systematic strategy on health and safety.
WAISTLINES OF THE WORLD
24

• WAlK WITH A dOc was started in 2005 by Ohio physician David Sabgir. It has spread to several states in the U.S., as well as parts of Europe and South America, and currently is running in 35 communities.
Read more: http://www.walkwithadoc.org/
• JuST WAlK is a nonprofit group that hosts walking events to promote a healthy lifestyle and community engagement. Physicians, specialists, and other health-care professionals participate in the walks and answer health-related questions.
Read more: http://www.cleveland.com/healthfit/index.ssf/2011/06/walk_with_a_doc_program_has_oh.html
• AllEZ HOP (Switzerland), started in 1999, aims to increase physical activity through sports and in-depth medical and technical training of physical education teachers. It also offers courses on endurance sports, basic knowledge about physical activity, and the pleasures associated with being physically active. Low fees make these courses accessible to all income levels.
Read more: www.allezhop.ch
• mOvEmENT PREScRIPTION PROJEcT (Finland) is based on an idea that has proven successful in New Zealand. Its aim is to encourage physicians to prescribe physical activity to their patients using the same principles and practices used for prescribing medications.
Read more: http://www.ncbi.nlm.nih.gov/pmc/articles/PMC1497635/pdf/15158112.pdf
25
POLICy RECOMMENDATIONS AND BEST PRACTICES


Appendix The unbalanced panel data model as specified earlier is the following: Yit = Xit β + Uit, i = 1,…,N; t = 1, …, Ti (1)
i represents countries, and t specifies the time period. In our framework, Yit is the obesity rate of the ith country in the t th period. Xit are all independent variables and Uit is the disturbance term. This model is unbalanced in the sense that there are N countries observed over varying time-period lengths.
An ordinary least squares regression (OLS) for the above model might produce biased results since there exist unobserved country-specific differences, such as tax structure/public policies, culture, political environment, weather, etc. In effect, the disturbance term looks like: Uit = µi + εit,
where µi captures all country-specific factors that are not accounted for by Xit. Usually there can be two types of estimates for this unbalanced panel: the fixed-effects model and the random-effects model:27
• Econometric theory specifies that the fixed-effects model is usually consistent but the random-effects model is efficient if Xit are independent of µi and εit for all i and t. However, if Xit is not independent of µi and εit, then the random-effects model is not consistent and should not be used. Usually, a Hausman test28 can determine whether the random-effects model should be used or not. If the Hausman test is not significant, it is advisable to use random- effects model.
• The random-effects model also helps in avoiding loss of degrees of freedom due to too many parameters. The following table shows the estimates from different regression models for equation (1). The final equation chosen is the random-effects model in column four.
27. Badi Baltagi, Econometric Analysis of Panel Data (Chichester: John Wiley and Sons, 2008), pp. 187-212.28. Test H0: E(Uit/Xit) = 0
HA: E(Uit/Xit) ≠ 0
χ2 (K) = (βFE – βRE)´ [ var(βFE)- var(βRE)] -1 (βFE – βRE)
27

TABlE 11: ESTImATES fOR EquATION (1)dependent variable: Obesity rate
variablePooled coefficient (standard error)
Fixed-effects coefficient (standard error)
Random-effects coefficient (standard error)
Random-effects coefficient (standard error#)
ICT investment (%) 0.15 (0.06) * 0.08 (0.04) * 0.09 (0.03) * 0.09 (0.04) *
Physical activities (%) 0.02 (0.04) 0.01 (0.03) -0.002 (0.03) -0.002 (0.03)
Urban population (%) 0.14 (0.04) * 0.36 (0.10) * 0.21 (0.07) * 0.21 (0.09) *
Log (alcohol consumption), liters/capita 3.77 (1.23) * -1.74 (2.00) -0.35 (1.61) -0.35 (1.76)
Log (smoking prevalence) -10.26 (1.47) * -9.97 (1.28) * -11.10 (1.19) * -11.10 (1.33) *
Log (calorie intake) 39.34 (9.20) * 44.03 (7.36) * 43.31 (6.94) * 43.31 (7.57) *
Log (fruit and vegetable consumption), kilo/capita
-3.7 (1.83) * 0.93 (1.60) 0.03 (1.50) 0.03 (1.43)
Log (sugar consumption), kilo/capita -0.18 (1.71) -1.7 (1.9) -1.57 (1.71) -1.57 (1.69)
Log (fat intake), kilo/capita -6.93 (3.1) * -4.01 (4.07) -5.03 (3.48) -5.03 (3.90)
Log (CO2 emissions), metric tons/capita 3.55 (0.90) * 0.86 (1.14) 0.66 (1.08) 0.66 (1.31)
Log (% employed women) -0.97 (2.30) -0.67 (2.52) 2.05 (2.11) 2.05 (2.11)
Constant -246.17 (58.54) * -316.68 (46.87) * -299.81 (44.43) * -299.81 (48.11) *
Total observations 218 218 218 218
Number of countries 27 27 27 27
R2 0.61 0.46 0.52 0.52
F-Statistic 28.98 44.92 481.98 a 356.83 a
Probability > F 0.0000 0.0000 0.0000 b 0.0000 b
* Significant at 5% level. # Corrected for heteroskedasticity. a x2 value. b Probability. > x2. Source: Milken Institute.
Test H0: E(Uit/Xit) = 0 HA: E(Uit/Xit) ≠ 0
χ2 = (βFE – βRE)´ [ var(βFE)- var(βRE)]-1 (βFE – βRE) = 14.52
P > χ2 = 0.21
The above Hausman test shows that the null hypothesis is accepted at the 5 percent level. This implies that the estimate from the random-effects model is efficient. Hence, we use the random-effects model. The last column in the above table shows the final random-effects estimates after correcting for heteroskedasticity.
Now, it is logical that a lag exists between the time the ICT investment takes place (which leads to a sedentary lifestyle) and an increase in obesity rates. Since our sample size is not large, to minimize the loss in degrees of freedom, we used a one-period lag for a few variables of interest. Due to insufficient data, we further had to drop five more countries29 from our sample.
Table 12 shows results for the modified (including lag) model on the following page.
29. The Czech Republic, Israel, Norway, Poland, Portugal. So our sample consists of 22 countries.
WAISTLINES OF THE WORLD
28

TABlE 12: ESTImATES fROm THE mOdEl uSING ONE-PERIOd lAG vAluESdependent variable: Obesity rate
variablePooled coefficient (standard error)
Fixed-effects coefficient (standard error)
Random-effects coefficient (standard error)
Random-effects coefficient (standard error#)
One-period lag (ICT Investment) 0.15 (0.09)** 0.08 (0.04)* 0.09 (0.04)* 0.09 (0.04)*
One-period lag (physical activities) 0.03 (0.04) 0.01 (0.03) -0.0003 (0.03) -0.0003 (0.03)
Urban population (%) 0.19 (0.05)* 0.41 (0.11)* 0.31 (0.09)* 0.31 (0.10)*
Log (alcohol consumption), liters/capita -1.28 (2.33) 5.45 (2.19)* 4.13 (2.02)* 4.13 (2.35)**
Log (smoking prevalence) -4.73 (1.96)* -10.54 (1.44)* -11.49 (1.34)* -11.49 (1.34)*
One-period lag (log calorie intake) 56.88 (13.1)* 59.21 (8.50)* 62.09 (8.04)* 62.09 (9.1)*
One-period lag (log fruit and vegetable consumption)
-4.8 (2.25)* -3.38 (1.77)** -3.66 (1.66)* -3.66 (1.65)*
One-period lag (log sugar consumption) -4.24 (2.06)* 1.48 (2.21) 0.02 (2.01) 0.02 (2.14)
One-period lag (log fat intake) -6.45 (4.06) -2.43 (4.28) -5.06 (3.81) -5.06 (3.83)
Log (CO2 emissions), metric tons/capita 4.58 (1.15)* -1.26 (1.14) -1.52 (1.08) -1.52 (1.09)
Log (% employed women) 6.35 (3.81)** -1.85 (2.96) -0.77 (2.63) -0.77 (2.97)
Constant -412.77 (87.75)* -443.94 (48.69)* -437.89 (47.57)* -437.89 (55.59)*
Total observations 160 160 160 160
Number of countries 22 22 22 22
R2 0.69 0.55 0.56 0.56
F-Statistic 30.03 61.98 671.11a 472.73a
Probability > F 0 0.0000 0.0000b 0.0000b
* Significant at 5% level. ** Significant at 10% level. # Corrected for heteroskedasticity. a x2 value. b Probability > x2. Source: Milken Institute.
Test H0: E(Uit/Xit) = 0 HA: E(Uit/Xit) ≠ 0
χ2 = (βFE – βRE) ́ [ var(βFE)- var(βRE)]-1 (βFE – βRE) = 7.19
P > χ2 = 0.7833
The above Hausman test shows that the null hypothesis is accepted at 5 percent level. This implies that the estimate from the random-effects model is efficient. Hence we use the random-effects model. The last column in the above table shows the final random-effects estimates after correcting for heteroskedasticity.
Since the estimates for the percent ICT investment are almost the same in both the first model (contemporaneous variables) and with the one-period lag, it does not matter which model specification we finally choose. So to minimize the loss of sample size, we only reported the estimates from the contemporaneous model as our final results.
29
APPENDIx

The following table estimates the effect of different variables on caloric intake. ICT investment has a significant positive effect on caloric intake, which supports our assumption that ICT investment has an indirect effect on obesity through increased screen time and snacking.
The table also shows that the increase in employed women corresponds to rising obesity rates. In this regression, we are showing the fixed-effects result since it is consistent. Another approach to studying both direct and indirect effects would be to use a simultaneous equation specification.
TABlE 13: INdIREcT EffEcTSdependent variable: log (caloric intake)
variableFixed-effects coefficient (standard error)
ICT investment (%) 0.0007 (0.0003)*#
Log (fruit and vegetable consumption), kilos/capita 0.06 (0.01)*
Log (sugar consumption), kilos/capita 0.14 (0.01)*
Log (fat intake), kilo/capita 0.19 (0.02)*
Log (% employed women) 0.06 (0.01)*
Urban population (%) -0.0005 (0.0008)#
Log (CO2 emissions), metric tons/capita -0.04 (0.01)*
Log (alcohol consumption), liters/capita 0.04 (0.01)*#
Constant 6.13 (0.12)*
Total observations 462
Number of countries 28
R2 0.47
F-Statistic 54.97
Probability > F 0.000
* Significant at 5% level. **Significant at 10% level. # Not significant when corrected for heteroskedasticity. Source: Milken Institute.
A spin-off of the original econometric model was an introduction of an interaction term (between ICT investment measure and percent of people engaged in moderate physical activity). Hence, we introduced a variable, ICT investment (≥ 30 percent) = 1, if the country’s investment in ICT is at least 30 percent, zero otherwise. Please refer to the following table for the results:
WAISTLINES OF THE WORLD
30

TABlE 14: REGRESSION ESTImATES uSING THE INTERAcTION TERmdependent variable: Obesity rate
variable Fixed-effects coefficient (standard error)
Random-effects coefficient (standard error)
Fixed-effects coefficient (standard error#)
ICT Investment (≥ 30%) 5.97 (2.57)* 5.05 (2.55)* 5.97 (2.60)*
Physical activities (%) 0.05 (0.033) 0.02 (0.032) 0.05 (0.05)
(ICT investment≥ 30%) X (physical activity)
-0.19 (0.092)* -0.16 (0.09)** -0.19 (0.08)*
Urban population (%) 0.44 (0.103)* 0.26 (0.073)* 0.44 (0.21)*
Log (alcohol consumption), liters/capita -0.78 (2.03) 0.15 (1.63) -0.78 (3.21)
Log (smoking prevalence) -9.67 (1.31)* -11.2 (1.20)* -9.67 (2.32)*
Log (calorie intake) 40.64 (7.54)* 41.67 (7.06)* 40.64 (13.71)*
Log (fruit and vegetable consumption), kilos/capita
1.08 (1.60) 0.03 (1.51) 1.08 (1.62)
Log (sugar consumption), kilo/capita -0.99 (1.97) -1.45 (1.74) -0.99 (2.09)
Log (fat intake), kilo/capita -2.61 (4.18) -4.51 (3.53) -2.61 (8.23)
Log (CO2 emissions), metric tons/capita 1.01 (1.15) 0.86 (1.08) 1.01 (1.08)
Log (% employed women) -1.86 (2.54) 1.44 (2.13) -1.86 (4.86)
Constant -303.78 (47.33)* -290.49 (45.00)* -303.78 (99.16)*
Total observations 218 218 218
Number of countries 27 27 27
R2 0.45 0.51 0.45
F-Statistic 41.32 472.35a 11.62a
Probability > F 0.0000b 0.0000b 0.0000b
* Significant at 5% level. ** Significant at 10% level. # Corrected for heteroskedasticity. a x2 value. b Probability > x2. Source: Milken Institute.
Test H0: E(Uit/Xit) = 0 HA: E(Uit/Xit) ≠ 0
χ2 = (βFE – βRE)´ [ var(βFE)- var(βRE)]-1 (βFE – βRE) = 34.98
P > χ2 = 0.0005
The above Hausman test shows that the null hypothesis is rejected at 5 percent level. This implies that the estimate from the random-effects model is not consistent, hence we use the fixed-effects model. The last column in the above table shows the final fixed-effects estimates after correcting for heteroskedasticity.
The main conclusion from this extended model is that, for nations with higher levels of ICT investment, the obesity rate can be lowered significantly with an increase in more physically active people. Specifically, when ICT investment rates are 30 percent and above, a 1 percentage point increase in moderately active people will lower the obesity rate by 0.2 percentage point.
31
APPENDIx

About the AuthorsAnusuya Chatterjee is an economist specializing in econometric modeling and health- and productivity-related issues, including studies related to chronic disease and aging, and the life sciences industry. Her recent focus has been supervising projects related to the economics of aging and obesity. She recently published Best Cities for Successful Aging, which has been well-received by both academics and the media. She has also co-authored impactful Milken Institute publications such as Film Flight: Lost Production and Its Economic Impact on California, Jobs for America: Investments and Policies for Economic Growth and Competitiveness, The Greater Philadelphia Life Sciences Cluster 2009, and An Unhealthy America. Chatterjee has written opinion articles for mainstream media and is frequently quoted as an expert. Previously she held a tenure track academic position at the University of Southern Indiana; worked in partnership with the New York State Office of Alcoholism and Substance Abuse Services to estimate the cost of providing chemical dependency treatment services in New York State; and helped the Cancer Foundation of India with data collection strategies. Her dissertation was an econometric analysis of the benefits of Head Start. Chatterjee received a Ph.D. in economics from the State University of New York, Albany, a master’s degree from the Delhi School of Economics, and a bachelor’s degree from Jadavpur University in India.
Ross C. DeVol is chief research officer at the Milken Institute. He oversees research on international, national, and comparative regional growth performance; technology and its impact on regional and national economies; access to capital and its role in economic growth and job creation; and health-related topics. Since joining the Institute, DeVol has put his group in the national limelight with groundbreaking research on technology and its impact on regional and national economies. He is an expert on the new intangible economy and how regions can prepare themselves to compete in it. He examines the effects of technology, research and development activities, international trade, human capital and labor-force skills training, entrepreneurship, early stage financing, capital access, and quality-of-place issues on the geographic distribution of economic activity. DeVol is ranked among the “Super Stars” of Think Tank Scholars by International Economy magazine. DeVol appears on national television and radio programs, including CNN’s “Moneyline,” “Wall Street Journal Report with Maria Bartiromo,” Fox Business News, and CNBC. He is frequently quoted in print media, including the Wall Street Journal, the Financial Times, Investor’s Business Daily, Forbes, The Economist, Time, and Bloomberg Businessweek. DeVol earned his master’s degree in economics at Ohio University and received advanced training in economics at Carnegie Mellon University.
32

1250 Fourth StreetSanta Monica, CA 90401Phone: 310-570-4600
E-mail: [email protected] • www.milkeninstitute.org
Cove
r illu
stra
tion:
Eric
Pal
ma
Ver. 8/2012
Washington office:1101 New York Avenue NW, Suite 620Washington, DC 20005Phone: 202-336-8930