waikato river water quality monitoring programme: data ... · waikato regional council technical...
TRANSCRIPT

Waikato Regional Council Technical Report 2017/14
Waikato River water quality monitoring programme: data report 2016 www.waikatoregion.govt.nz ISSN 2230-4355 (Print) ISSN 2230-4363 (Online)

Prepared by: Asaeli Tulagi For: Waikato Regional Council Private Bag 3038 Waikato Mail Centre HAMILTON 3240 July 2017 Document #: 10492663

Doc # 10492663
Peer reviewed by: Date July 2017 Dr Eloise Ryan
Approved for release by: Date August 2017 Dr Edmund Brown
Disclaimer
This technical report has been prepared for the use of Waikato Regional Council as a reference document and as such does not constitute Council’s policy. Council requests that if excerpts or inferences are drawn from this document for further use by individuals or organisations, due care should be taken to ensure that the appropriate context has been preserved, and is accurately reflected and referenced in any subsequent spoken or written communication. While Waikato Regional Council has exercised all reasonable skill and care in controlling the contents of this report, Council accepts no liability in contract, tort or otherwise, for any loss, damage, injury or expense (whether direct, indirect or consequential) arising out of the provision of this information or its use by you or any other party.

Doc # 10492663

Doc # 10492663 Page i
Acknowledgement Thanks to Chris McKinnon, Ian Weir, Kane Lynn, Alicia Catlin, Mark Hamer, Jessie Loft, Trent Stokes, Stephen Scothern, Aaron Pedraza and Debbie Eastwood for their commitment and reliability in undertaking field measurements and sample collection.
Hydrological flow data were provided by Mercury Energy (Hydro Lakes, Waiotapu stream and Waikato River at Reids Farm), Contact Energy (Ohaaki Bridge) and Genesis Power (Huntly) through agents Opus and NIWA. The Environmental Monitoring Programme, Waikato Regional Council, Hamilton provided hydrological flow data for two sites.

Page ii Doc # 10492663

Doc # 10492663 Page iii
Table of contents 1 Introduction 1
1.1 Background 1
1.2 Report content 1
1.3 Water quality guidelines and standards 2
2 The Waikato River monitoring programme design 3
2.1 Sampling collection 3
2.2 Sample locations 3
2.3 Water quality parameters 4
2.4 Quality control, data storage and analysis 5
2.5 Reports 5
3 Results 6
3.1 Waikato River monitoring programme 6
Routine water quality monitoring 6 Summary statistics 6 Five yearly major ion statistics 6 Key parameter graphs 6 Comparison with water quality standards 6 Raw data 6
3.2 Waikato River monitoring programme 28
Bathing season microbiological survey 28 Summary statistics 28 Comparison with water quality standards 28 Parameter graph 28 Raw data 28
References 32
Appendix I: 33
Flow information 33
Appendix II 35
Datasonde deployments 35
Diurnal variation of selected water quality parameters 35
Appendix III: 47
Water quality parameters 47
Guidelines and standards 47
Analytical methods 47

Page iv Doc # 10492663
Tables Table 1: Guidelines and standards for physicochemical water quality for ecological health and
for human uses of water 2 Table 2: Routine sampling and bathing water monitoring locations 4 Table 3: Number of samples (year 2016) complying with the ‘satisfactory’ water quality
guidelines and standards. n = 12 (except * where n = 11 & ^ where n=10). 20 Table 4: Number of samples (year 2016) complying with the ‘excellent’ water quality guidelines
and standards. n = 12 (except * where n = 11 & ^ where n=10). 20 Table 5: Bathing season median E. coli bacteria. 29 Table 6: Year 2016/17 bathing season E. coli survey results complying with the “Satisfactory”
and “Excellent” water quality guidelines. n = 12 (except * where n = 13). 29
Figures Figure 1: Waikato River water quality monitoring locations 3 Figure 2: E. coli - five years of bathing season data 30

Doc # 10492663 Page 1
1 Introduction
1.1 Background This report covers the calendar year of 2016 and follows the format of the previous data report (Tulagi, 2016). To effectively manage water quality, the Waikato River monitoring programme addresses the following questions:
1. What is the quality of the water now? 2. Why is the water of the observed level of quality? 3. Is water quality getting better or worse? If so - what makes it change? 4. How can we improve the quality, ecological health and integrity of the Waikato River?
The monitoring information allows the Council to:
determine compliance with classification standards
define the suitability of the resource for various beneficial uses and values of the water
monitor the impact of major discrete point source discharges on water quality
monitor the impacts of diffuse discharges on water quality
provide a basis for evaluating the effectiveness of resource management measures. This dataset is invaluable for the evaluation of the Waikato River: its state, the pressures on it and its response to these pressures. We need to continue to gather comprehensive, reliable, and good quality data on the Waikato River to protect and enhance its values into the future. This report is the 26th since the re-design of the Waikato River Monitoring Programme (WARIMP) implemented in 1989. Copies of reports can be obtained via the Waikato Regional Council Internet site http://www.waikatoregion.govt.nz/Publications/ or by contacting Waikato Regional Council (the Library) on 0800 800 401 and filling out the request for service form at: www.waikatoregion.govt.nz/request.
1.2 Report content The report provides information on: 1. Routine monthly monitoring of water quality at 10 sites:
Year 2016 summary data tabulated by parameter for each location and reported with the median of the previous 5 years.
Key parameter graphs showing the average water quality for 2016 at each location, compared to results of the previous 5 years.
Summary tables identifying the number of samples meeting ‘satisfactory’ and ‘excellent’ water quality standards and guidelines.
Raw data for 2016. 2. Additional information is provided in the appendices on:
Flow (Appendix I).
The effect of flow is important to assessing water quality and making comparisons between years. Appendix I provides information on annual median flow at some locations for the previous 10 years.
Datasonde deployments
Plots of deployments undertaken during 2016 showing the level of diurnal and seasonal variation at five Waikato River sites (Appendix II).

Page 2 Doc # 10492663
1.3 Water quality guidelines and standards Table 1 lists the physical and chemical water quality standards and guidelines used to assess the condition of the Waikato River in 2016. The standards mainly relate to either the protection of ecological health of rivers and streams or to whether they are suitable for water-based recreation, especially swimming. Some water quality guidelines and standards are relevant to the use of the Waikato River for both general water supply (industrial/cooling water, irrigation, stock water etc.) and as a source of municipal drinking water. In most cases two criteria are shown. The less stringent criteria define water that is “satisfactory” for the desired use; these are mostly based on existing national and other guidelines and standards (Appendix III). The more stringent criteria identify “excellent” water, and reflect expert opinion. Samples gathered in 2016 whose results do not comply with the “satisfactory” criteria (Table 1) are underlined in raw data summaries. Table 1: Guidelines and standards for physicochemical water quality for ecological health and for
human uses of water
Water Quality Measure Relevance1 Satisfactory Excellent
Ecological health
Dissolved oxygen (% saturation) aquatic life (breathing) >80 >90
pH aquatic life (acidity) 6.5–9 7–8
Turbidity (NTU) plant growth (clarity) <5 <2
Ammoniacal-N (g/m3) aquatic life (toxicity) <0.88 <0.1
Temperature (°C) (May-Sep) (Oct-Apr)
fish (spawning) <12 <20
<10 <16
Total phosphorus (g/m3) nuisance plant growth <0.04 <0.01
Total nitrogen (g/m3) nuisance plant growth <0.5 <0.1
Human uses - recreation
Baseflow water clarity (m) visibility >1.6 >4
Escherichia coli (no./100 mL) human health <550 <55
Median Escherichia coli (no./100 mL) human health <126 <23
Human uses - water supply
Phytoplankton chlorophyll a (g/m3) filter blockage <0.02 <0.005
Human uses - drinking water
Arsenic (g/m3) human health (toxicity) <0.01 –
Boron (g/m3) human health (toxicity) <1.4 –
1 Refer to Appendix III for description of guideline and standards values used. These guidelines and standards are also defined on the Waikato Regional Council Internet site; www.waikatoregion.govt.nz

Doc # 10492663 Page 3
2 The Waikato River monitoring programme design
2.1 Sampling collection Sample collection occurs monthly, as two sampling runs. Locations in the upper catchment from Taupo to Waipapa are visited as part of the first run, and locations in the middle and lower catchments from Hamilton (at the Narrows) to Tuakau are visited on the next. Each location is sampled at a similar time on each occasion (coefficient of variation ≈2–6%) to minimise the effect of diurnal variation on the measurement of water quality parameters. Sample times are recorded in New Zealand Standard Time (NZST). Because of the controlled nature of the river, our daytime samples are generally collected at higher than median flows.
2.2 Sample locations Routine water quality monitoring locations of the Waikato River Monitoring Programme and additional locations used during the summer microbiological surveys are illustrated in Figure 1 and summarised in Table 2.
Figure 1: Waikato River water quality monitoring locations
Page 4 Doc # 10492663
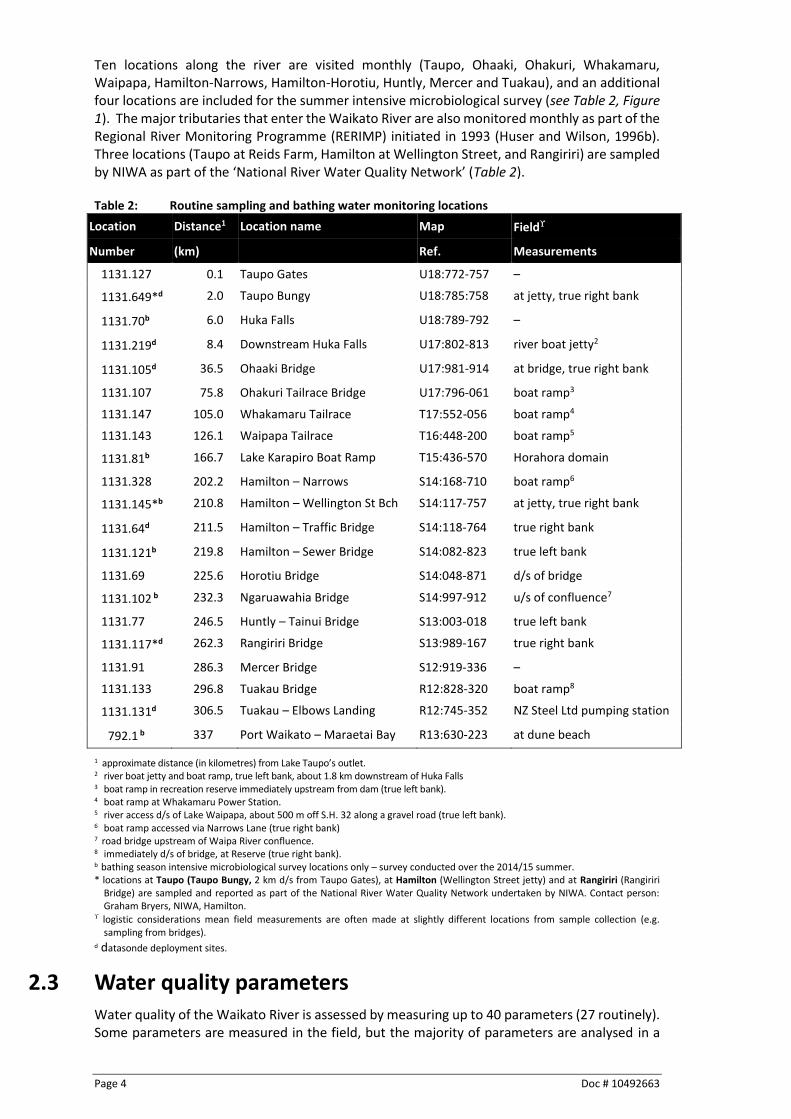
Ten locations along the river are visited monthly (Taupo, Ohaaki, Ohakuri, Whakamaru, Waipapa, Hamilton-Narrows, Hamilton-Horotiu, Huntly, Mercer and Tuakau), and an additional four locations are included for the summer intensive microbiological survey (see Table 2, Figure 1). The major tributaries that enter the Waikato River are also monitored monthly as part of the Regional River Monitoring Programme (RERIMP) initiated in 1993 (Huser and Wilson, 1996b). Three locations (Taupo at Reids Farm, Hamilton at Wellington Street, and Rangiriri) are sampled by NIWA as part of the ‘National River Water Quality Network’ (Table 2). Table 2: Routine sampling and bathing water monitoring locations
Location Distance1 Location name Map Field
Number (km) Ref. Measurements
1131.127 0.1 Taupo Gates U18:772-757 –
1131.649*d 2.0 Taupo Bungy U18:785:758 at jetty, true right bank
1131.70b 6.0 Huka Falls U18:789-792 –
1131.219d 8.4 Downstream Huka Falls U17:802-813 river boat jetty2
1131.105d 36.5 Ohaaki Bridge U17:981-914 at bridge, true right bank
1131.107 75.8 Ohakuri Tailrace Bridge U17:796-061 boat ramp3
1131.147 105.0 Whakamaru Tailrace T17:552-056 boat ramp4
1131.143 126.1 Waipapa Tailrace T16:448-200 boat ramp5
1131.81b 166.7 Lake Karapiro Boat Ramp T15:436-570 Horahora domain
1131.328 202.2 Hamilton – Narrows S14:168-710 boat ramp6
1131.145*b 210.8 Hamilton – Wellington St Bch S14:117-757 at jetty, true right bank
1131.64d 211.5 Hamilton – Traffic Bridge S14:118-764 true right bank
1131.121b 219.8 Hamilton – Sewer Bridge S14:082-823 true left bank
1131.69 225.6 Horotiu Bridge S14:048-871 d/s of bridge
1131.102 b 232.3 Ngaruawahia Bridge S14:997-912 u/s of confluence7
1131.77 246.5 Huntly – Tainui Bridge S13:003-018 true left bank
1131.117*d 262.3 Rangiriri Bridge S13:989-167 true right bank
1131.91 286.3 Mercer Bridge S12:919-336 –
1131.133 296.8 Tuakau Bridge R12:828-320 boat ramp8
1131.131d 306.5 Tuakau – Elbows Landing R12:745-352 NZ Steel Ltd pumping station
792.1 b 337 Port Waikato – Maraetai Bay R13:630-223 at dune beach
1 approximate distance (in kilometres) from Lake Taupo’s outlet. 2 river boat jetty and boat ramp, true left bank, about 1.8 km downstream of Huka Falls 3 boat ramp in recreation reserve immediately upstream from dam (true left bank). 4 boat ramp at Whakamaru Power Station. 5 river access d/s of Lake Waipapa, about 500 m off S.H. 32 along a gravel road (true left bank). 6 boat ramp accessed via Narrows Lane (true right bank) 7 road bridge upstream of Waipa River confluence. 8 immediately d/s of bridge, at Reserve (true right bank). b bathing season intensive microbiological survey locations only – survey conducted over the 2014/15 summer. * locations at Taupo (Taupo Bungy, 2 km d/s from Taupo Gates), at Hamilton (Wellington Street jetty) and at Rangiriri (Rangiriri
Bridge) are sampled and reported as part of the National River Water Quality Network undertaken by NIWA. Contact person: Graham Bryers, NIWA, Hamilton.
logistic considerations mean field measurements are often made at slightly different locations from sample collection (e.g. sampling from bridges).
d datasonde deployment sites.
2.3 Water quality parameters Water quality of the Waikato River is assessed by measuring up to 40 parameters (27 routinely). Some parameters are measured in the field, but the majority of parameters are analysed in a

Doc # 10492663 Page 5
laboratory using standard analytical methods. Details of field measurements and analytical methods used are appended (Appendix III).
2.4 Quality control, data storage and analysis Quality control measures are undertaken in accordance with Waikato Regional Council’s standards including procedures for the collection, transport, storage of samples, and methods for data verification and quality assurance to ensure the consistency of data across the programme. Samples are sent to IANZ registered laboratories for analysis. Back-up samples are held for two months until results have been verified by routine quality assurance procedures. All data from field measurements and laboratory analyses are stored in Waikato Regional Council’s database called WISKI. Data analysis was performed using Statistica (version 13.0) and DataDesk (version 6.0.1). For the purpose of data analysis, non-detect results (i.e. results with “less than” values) were assumed to be equal to half the corresponding limit of detection (i.e. <x = x/2), and results greater than the value reported were taken as equal to the value reported (i.e. >x = x).
2.5 Reports Waikato Regional Council’s State of the Environment Report summarises the state of the Waikato River, other rivers in the region, and common pressures (Environment Waikato, 1999). Waikato Regional Council Technical Report 2013/20, Trends in River Water Quality in the Waikato Region, 1993–2012 (Vant, 2013) outlines the trends in the Waikato River and other rivers in the region. Copies are available in electronic format from the publications page of the Waikato Regional Council website: http://www.waikatoregion.govt.nz/Publications/Technical-Reports
The data contained in these Waikato River reports is updated to the Waikato Regional Council “Waikato River” Internet page:
http://www.waikatoregion.govt.nz/Fresh-water-quality
The “How healthy are our rivers?” link provides details of the guidelines and standards used to assess the condition of the Waikato River and other rivers in the region. A link to water quality at other regional river monitoring sites is also available from this page. This data is also supplied to the LAWA website https://www.lawa.org.nz/explore-data/waikato-region

Page 6 Doc # 10492663
3 Results
3.1 Waikato River monitoring programme
Routine water quality monitoring
Summary statistics
Five yearly major ion statistics
Key parameter graphs
Comparison with water quality standards
Raw data

Doc # 10492663 Page 7
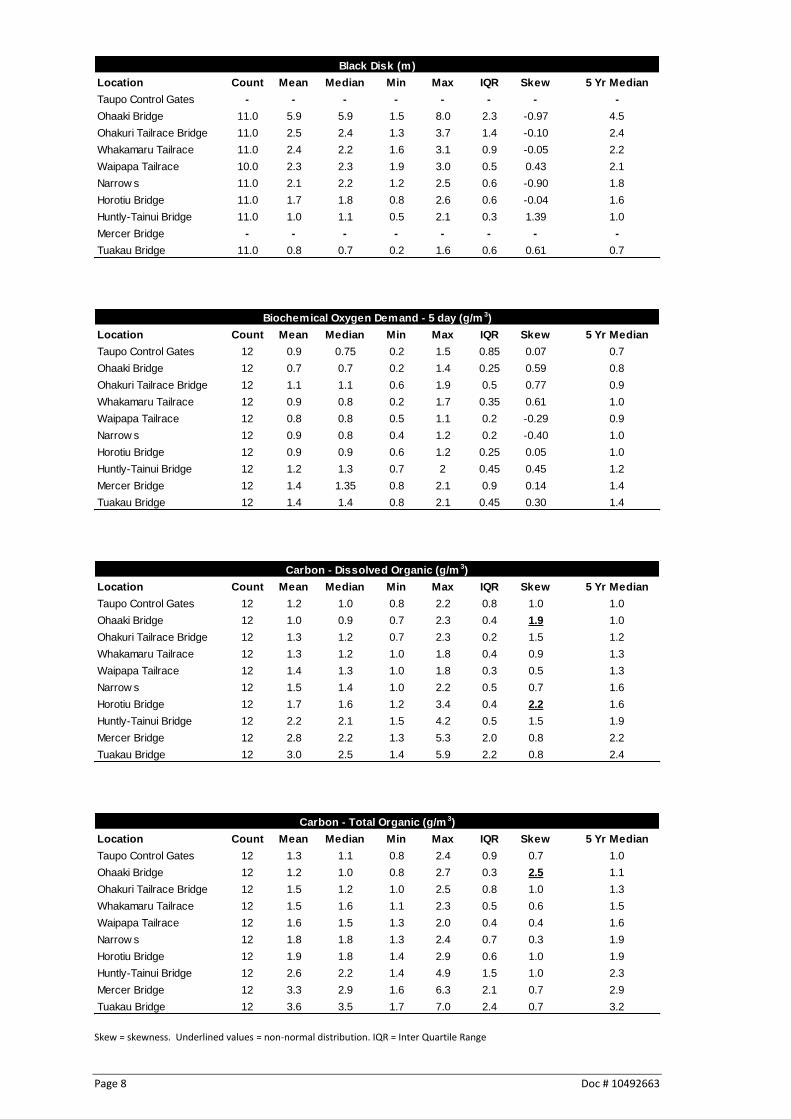
Skew = skewness. Underlined values = non-normal distribution. IQR = Inter Quartile Range
Location Count Mean Median Min Max IQR Skew 5 Yr Median
Taupo Control Gates 12 0.001 0.001 0.001 0.001 0.000 -1.00 0.001
Ohaaki Bridge 12 0.004 0.004 0.002 0.007 0.001 1.28 0.003
Ohakuri Tailrace Bridge 12 0.007 0.006 0.005 0.011 0.001 1.44 0.005
Whakamaru Tailrace 12 0.009 0.007 0.006 0.015 0.002 1.47 0.007
Waipapa Tailrace 12 0.011 0.010 0.008 0.017 0.003 1.20 0.010
Narrow s 12 0.015 0.012 0.010 0.026 0.004 1.30 0.012
Horotiu Bridge 12 0.014 0.012 0.010 0.026 0.005 1.44 0.012
Huntly-Tainui Bridge 12 0.022 0.019 0.014 0.050 0.008 1.59 0.019
Mercer Bridge 12 0.029 0.023 0.014 0.068 0.017 1.29 0.021
Tuakau Bridge 12 0.032 0.026 0.005 0.077 0.029 0.83 0.024
Absorbance of filtered sample at 340 nm (units: /cm)
Location Count Mean Median Min Max IQR Skew 5 Yr Median
Taupo Control Gates 12 0.001 0.001 0.001 0.001 0.000 -1.00 0.001
Ohaaki Bridge 12 0.001 0.001 0.001 0.003 0.000 3.02 0.001
Ohakuri Tailrace Bridge 12 0.001 0.001 0.001 0.002 0.000 3.02 0.001
Whakamaru Tailrace 12 0.001 0.001 0.001 0.003 0.001 1.43 0.001
Waipapa Tailrace 12 0.002 0.002 0.001 0.004 0.001 0.94 0.001
Narrow s 12 0.003 0.002 0.002 0.005 0.001 1.34 0.002
Horotiu Bridge 12 0.003 0.002 0.001 0.005 0.002 0.69 0.002
Huntly-Tainui Bridge 12 0.004 0.004 0.003 0.009 0.002 1.57 0.003
Mercer Bridge 12 0.005 0.005 0.001 0.012 0.003 1.04 0.004
Tuakau Bridge 12 0.006 0.005 0.001 0.014 0.005 0.76 0.004
Absorbance of filtered sample at 440 nm (units: /cm)
Location Count Mean Median Min Max IQR Skew 5 Yr Median
Taupo Control Gates 12 0.012 0.012 0.011 0.013 0.001 -0.15 0.012
Ohaaki Bridge 12 0.023 0.024 0.019 0.031 0.005 0.82 0.025
Ohakuri Tailrace Bridge 12 0.029 0.030 0.023 0.035 0.004 -0.16 0.030
Whakamaru Tailrace 12 0.028 0.030 0.022 0.031 0.005 -0.78 0.029
Waipapa Tailrace 12 0.023 0.024 0.020 0.027 0.005 -0.18 0.025
Narrow s 12 0.021 0.022 0.016 0.026 0.005 -0.11 0.022
Horotiu Bridge 12 0.021 0.022 0.016 0.027 0.005 -0.06 0.022
Huntly-Tainui Bridge 12 0.016 0.016 0.008 0.023 0.009 -0.28 0.017
Mercer Bridge 12 0.015 0.015 0.009 0.021 0.009 -0.05 0.016
Tuakau Bridge 12 0.015 0.016 0.008 0.021 0.008 -0.24 0.016
Arsenic - Total (g/m 3)
Location Count Mean Median Min Max IQR Skew 5 Yr Median
Taupo Control Gates 12 0.17 0.17 0.15 0.19 0.02 0.09 0.17
Ohaaki Bridge 12 0.29 0.28 0.24 0.37 0.07 0.75 0.28
Ohakuri Tailrace Bridge 12 0.32 0.32 0.25 0.37 0.03 -0.05 0.32
Whakamaru Tailrace 12 0.30 0.32 0.24 0.37 0.05 -0.10 0.32
Waipapa Tailrace 12 0.26 0.26 0.21 0.29 0.03 -0.52 0.28
Narrow s 12 0.22 0.22 0.19 0.28 0.05 0.56 0.25
Horotiu Bridge 12 0.23 0.24 0.18 0.28 0.05 -0.37 0.25
Huntly-Tainui Bridge 12 0.19 0.18 0.11 0.26 0.07 0.03 0.19
Mercer Bridge 12 0.18 0.19 0.12 0.24 0.06 -0.02 0.19
Tuakau Bridge 12 0.18 0.18 0.11 0.25 0.07 0.13 0.20
Boron (g/m 3)
Page 8 Doc # 10492663
Skew = skewness. Underlined values = non-normal distribution. IQR = Inter Quartile Range
Location Count Mean Median Min Max IQR Skew 5 Yr Median
Taupo Control Gates - - - - - - - -
Ohaaki Bridge 11.0 5.9 5.9 1.5 8.0 2.3 -0.97 4.5
Ohakuri Tailrace Bridge 11.0 2.5 2.4 1.3 3.7 1.4 -0.10 2.4
Whakamaru Tailrace 11.0 2.4 2.2 1.6 3.1 0.9 -0.05 2.2
Waipapa Tailrace 10.0 2.3 2.3 1.9 3.0 0.5 0.43 2.1
Narrow s 11.0 2.1 2.2 1.2 2.5 0.6 -0.90 1.8
Horotiu Bridge 11.0 1.7 1.8 0.8 2.6 0.6 -0.04 1.6
Huntly-Tainui Bridge 11.0 1.0 1.1 0.5 2.1 0.3 1.39 1.0
Mercer Bridge - - - - - - - -
Tuakau Bridge 11.0 0.8 0.7 0.2 1.6 0.6 0.61 0.7
Black Disk (m)
Location Count Mean Median Min Max IQR Skew 5 Yr Median
Taupo Control Gates 12 0.9 0.75 0.2 1.5 0.85 0.07 0.7
Ohaaki Bridge 12 0.7 0.7 0.2 1.4 0.25 0.59 0.8
Ohakuri Tailrace Bridge 12 1.1 1.1 0.6 1.9 0.5 0.77 0.9
Whakamaru Tailrace 12 0.9 0.8 0.2 1.7 0.35 0.61 1.0
Waipapa Tailrace 12 0.8 0.8 0.5 1.1 0.2 -0.29 0.9
Narrow s 12 0.9 0.8 0.4 1.2 0.2 -0.40 1.0
Horotiu Bridge 12 0.9 0.9 0.6 1.2 0.25 0.05 1.0
Huntly-Tainui Bridge 12 1.2 1.3 0.7 2 0.45 0.45 1.2
Mercer Bridge 12 1.4 1.35 0.8 2.1 0.9 0.14 1.4
Tuakau Bridge 12 1.4 1.4 0.8 2.1 0.45 0.30 1.4
Biochemical Oxygen Demand - 5 day (g/m 3)
Location Count Mean Median Min Max IQR Skew 5 Yr Median
Taupo Control Gates 12 1.2 1.0 0.8 2.2 0.8 1.0 1.0
Ohaaki Bridge 12 1.0 0.9 0.7 2.3 0.4 1.9 1.0
Ohakuri Tailrace Bridge 12 1.3 1.2 0.7 2.3 0.2 1.5 1.2
Whakamaru Tailrace 12 1.3 1.2 1.0 1.8 0.4 0.9 1.3
Waipapa Tailrace 12 1.4 1.3 1.0 1.8 0.3 0.5 1.3
Narrow s 12 1.5 1.4 1.0 2.2 0.5 0.7 1.6
Horotiu Bridge 12 1.7 1.6 1.2 3.4 0.4 2.2 1.6
Huntly-Tainui Bridge 12 2.2 2.1 1.5 4.2 0.5 1.5 1.9
Mercer Bridge 12 2.8 2.2 1.3 5.3 2.0 0.8 2.2
Tuakau Bridge 12 3.0 2.5 1.4 5.9 2.2 0.8 2.4
Carbon - Dissolved Organic (g/m 3)
Location Count Mean Median Min Max IQR Skew 5 Yr Median
Taupo Control Gates 12 1.3 1.1 0.8 2.4 0.9 0.7 1.0
Ohaaki Bridge 12 1.2 1.0 0.8 2.7 0.3 2.5 1.1
Ohakuri Tailrace Bridge 12 1.5 1.2 1.0 2.5 0.8 1.0 1.3
Whakamaru Tailrace 12 1.5 1.6 1.1 2.3 0.5 0.6 1.5
Waipapa Tailrace 12 1.6 1.5 1.3 2.0 0.4 0.4 1.6
Narrow s 12 1.8 1.8 1.3 2.4 0.7 0.3 1.9
Horotiu Bridge 12 1.9 1.8 1.4 2.9 0.6 1.0 1.9
Huntly-Tainui Bridge 12 2.6 2.2 1.4 4.9 1.5 1.0 2.3
Mercer Bridge 12 3.3 2.9 1.6 6.3 2.1 0.7 2.9
Tuakau Bridge 12 3.6 3.5 1.7 7.0 2.4 0.7 3.2
Carbon - Total Organic (g/m 3)

Doc # 10492663 Page 9
Skew = skewness. Underlined values = non-normal distribution. IQR = Inter Quartile Range
Location Count Mean Median Min Max IQR Skew 5 Yr Median
Taupo Control Gates 12 8.1 8.2 7.7 8.6 0.3 0.08 8.2
Ohaaki Bridge 12 15.4 14.2 12.2 21.0 3.4 0.84 15.3
Ohakuri Tailrace Bridge 12 18.1 18.3 13.3 21.0 2.5 -0.67 18.7
Whakamaru Tailrace 12 17.9 17.5 14.1 21.0 3.4 -0.09 18.9
Waipapa Tailrace 12 16.6 16.4 14.0 18.8 2.6 -0.07 18.2
Narrow s 12 16.2 16.6 12.9 18.6 2.3 -0.48 17.0
Horotiu Bridge 12 16.4 16.7 13.1 18.8 2.5 -0.43 17.1
Huntly-Tainui Bridge 12 15.4 16.0 12.8 18.1 2.3 -0.27 15.8
Mercer Bridge 12 16.0 16.3 13.3 17.9 1.9 -0.54 16.6
Tuakau Bridge 12 16.2 16.8 13.5 18.0 1.6 -0.84 16.9
Chloride (g/m 3)
Location Count Mean Median Min Max IQR Skew 5 Yr Median
Taupo Control Gates 12 0.002 0.002 0.002 0.002 0.000 1.00 0.002
Ohaaki Bridge 12 0.002 0.002 0.002 0.002 0.000 1.00 0.002
Ohakuri Tailrace Bridge 12 0.006 0.006 0.002 0.020 0.005 1.75 0.004
Whakamaru Tailrace 12 0.010 0.008 0.002 0.023 0.010 0.74 0.006
Waipapa Tailrace 12 0.007 0.004 0.002 0.018 0.010 0.73 0.005
Narrow s 12 0.008 0.006 0.002 0.026 0.006 1.66 0.005
Horotiu Bridge 12 0.009 0.008 0.003 0.017 0.009 0.41 0.006
Huntly-Tainui Bridge 12 0.008 0.009 0.002 0.017 0.007 0.32 0.006
Mercer Bridge 12 0.014 0.013 0.002 0.037 0.015 0.76 0.009
Tuakau Bridge 12 0.016 0.015 0.002 0.045 0.017 0.90 0.010
Chlorophyll a (g/m 3)
Location Count Mean Median Min Max IQR Skew 5 Yr Median
Taupo Control Gates - - - - - - - -
Ohaaki Bridge 11 51.4 55.0 40.0 65.0 10.0 0.17 50.0
Ohakuri Tailrace Bridge 11 38.2 37.5 32.5 45.0 4.4 0.25 40.0
Whakamaru Tailrace 10 36.3 37.5 32.5 40.0 5.0 -0.21 40.0
Waipapa Tailrace 11 35.0 35.0 32.5 40.0 4.4 0.63 37.5
Narrow s 11 34.3 35.0 30.0 40.0 2.5 0.18 37.5
Horotiu Bridge 11 33.4 32.5 30.0 37.5 2.5 0.02 35.0
Huntly-Tainui Bridge 11 30.5 30.0 25.0 40.0 5.0 0.77 32.5
Mercer Bridge - - - - - - - -
Tuakau Bridge 11 27.9 25.0 25.0 34.0 5.0 0.54 30.0
Colour (Munsell Colour Units)
Location Count Mean Median Min Max IQR Skew 5 Yr Median
Taupo Control Gates 12 12.1 12.1 12.0 12.6 0.2 1.45 12.0
Ohaaki Bridge 12 15.1 14.8 13.8 17.3 1.2 0.86 14.9
Ohakuri Tailrace Bridge 12 16.7 16.7 14.5 17.9 1.1 -0.77 16.6
Whakamaru Tailrace 12 16.5 16.4 14.8 18.0 1.4 -0.02 16.7
Waipapa Tailrace 12 15.7 15.6 14.7 17.0 1.0 0.50 16.2
Narrow s 12 15.6 16.0 14.2 16.9 1.5 -0.19 15.9
Horotiu Bridge 12 15.6 15.7 14.3 16.9 1.3 0.06 16.0
Huntly-Tainui Bridge 12 15.0 14.8 12.8 16.8 1.6 -0.10 14.9
Mercer Bridge 12 15.5 15.4 14.0 16.9 1.4 0.05 15.6
Tuakau Bridge 12 15.6 15.7 14.1 16.9 1.4 -0.18 15.8
Conductivity at 25 oC (ms/m)

Page 10 Doc # 10492663
Skew = skewness. Underlined values = non-normal distribution. IQR = Inter Quartile Range
Location Count Mean Median Min Max IQR Skew 5 Yr Median
Taupo Control Gates 12 10.1 10.2 8.9 11.1 0.9 -0.32 9.9
Ohaaki Bridge 12 10.0 10.2 8.2 11.8 1.4 -0.10 9.8
Ohakuri Tailrace Bridge 12 10.0 9.7 8.9 11.5 1.9 0.34 9.7
Whakamaru Tailrace 12 10.1 9.8 8.7 11.8 1.6 0.27 9.9
Waipapa Tailrace 12 10.1 10.0 9.0 11.3 1.3 0.18 9.9
Narrow s 12 9.7 9.6 8.1 11.7 1.6 0.17 9.9
Horotiu Bridge 12 9.6 9.7 8.1 11.2 2.0 0.00 9.8
Huntly-Tainui Bridge 12 9.4 9.7 8.2 10.5 1.1 -0.29 9.6
Mercer Bridge 12 9.4 9.4 8.5 10.2 0.8 -0.10 9.5
Tuakau Bridge 12 9.3 9.2 8.6 11.0 0.8 1.42 9.5
Dissolved Oxygen (g/m 3)
Location Count Mean Median Min Max IQR Skew 5 Yr Median
Taupo Control Gates 12 103.5 103.7 95.5 110.6 8.4 -0.04 102.0
Ohaaki Bridge 12 104.2 103.9 96.6 110.8 3.8 -0.37 102.6
Ohakuri Tailrace Bridge 12 105.0 103.8 91.4 122.8 11.4 0.28 101.3
Whakamaru Tailrace 12 105.1 105.1 89.2 118.5 13.6 -0.17 103.6
Waipapa Tailrace 12 103.9 104.9 88.4 116.1 15.4 -0.22 101.4
Narrow s 12 98.2 97.3 91.0 114.7 7.4 1.25 97.5
Horotiu Bridge 12 97.2 95.7 91.2 110.3 9.9 0.88 96.7
Huntly-Tainui Bridge 12 96.2 95.6 91.2 105.4 5.9 0.80 95.7
Mercer Bridge 12 96.7 96.0 88.0 112.0 8.2 0.87 95.9
Tuakau Bridge 12 97.3 96.9 79.9 122.6 12.6 0.77 97.6
Dissolved Oxygen (% Saturation)
Location Count Mean Median Min Max IQR Skew 5 Yr Median
Taupo Control Gates 12 2 1 1 7 3 1.1 1
Ohaaki Bridge 12 19 6 1 59 38 0.8 7
Ohakuri Tailrace Bridge 12 6 3 1 25 8 1.9 2
Whakamaru Tailrace 12 79 10 1 590 77 2.7 5
Waipapa Tailrace 12 33 7 1 320 8 3.0 4
Narrow s 12 82 54 21 400 60 2.6 34
Horotiu Bridge 12 56 39 18 150 48 1.2 43
Huntly-Tainui Bridge 12 64 51 21 250 43 2.3 40
Mercer Bridge 12 37 33 7 120 39 1.5 24
Tuakau Bridge 12 46 40 7 160 27 1.6 22
Enterococci (cfu/100 mL)
Location Count Mean Median Min Max IQR Skew 5 Yr Median
Taupo Control Gates 12 4 3 1 10 5 0.8 2
Ohaaki Bridge 12 23 15 4 70 21 1.4 14
Ohakuri Tailrace Bridge 12 6 4 1 21 8 1.3 2
Whakamaru Tailrace 12 29 10 4 120 44 1.5 8
Waipapa Tailrace 12 11 9 1 25 15 0.6 5
Narrow s 12 67 50 19 200 62 1.5 38
Horotiu Bridge 12 105 80 19 250 80 1.0 80
Huntly-Tainui Bridge 12 258 95 30 1300 260 2.2 110
Mercer Bridge 12 218 65 50 1400 126 2.7 70
Tuakau Bridge 12 135 60 34 500 80 1.7 70
Escherichia coli (cfu/100 mL)

Doc # 10492663 Page 11
Skew = skewness. Underlined values = non-normal distribution. IQR = Inter Quartile Range
Location Count Mean Median Min Max IQR Skew 5 Yr Median
Taupo Control Gates 12 4 3 1 14 6 1.0 2
Ohaaki Bridge 12 30 18 4 80 28 1.0 14
Ohakuri Tailrace Bridge 12 7 5 1 21 9 1.1 3
Whakamaru Tailrace 12 35 11 4 130 61 1.1 8
Waipapa Tailrace 12 14 10 1 43 17 1.1 7
Narrow s 12 89 55 21 230 97 1.0 48
Horotiu Bridge 12 144 125 25 330 157 0.7 100
Huntly-Tainui Bridge 12 283 110 40 1300 310 2.0 120
Mercer Bridge 12 248 100 50 1600 125 2.8 90
Tuakau Bridge 12 156 75 40 600 115 1.8 80
Faecal Coliforms (cfu/100 mL)
Location Count Mean Median Min Max IQR Skew 5 Yr Median
Taupo Control Gates 12 0.04 0.04 0.04 0.05 0.00 1.34 0.040
Ohaaki Bridge 12 0.08 0.08 0.06 0.11 0.02 0.96 0.083
Ohakuri Tailrace Bridge 12 0.10 0.10 0.07 0.12 0.02 -0.56 0.107
Whakamaru Tailrace 12 0.10 0.11 0.08 0.12 0.02 -0.26 0.110
Waipapa Tailrace 12 0.09 0.09 0.07 0.10 0.02 -0.05 0.095
Narrow s 12 0.08 0.07 0.06 0.10 0.02 0.26 0.086
Horotiu Bridge 12 0.08 0.08 0.06 0.10 0.02 -0.16 0.086
Huntly-Tainui Bridge 12 0.06 0.06 0.03 0.09 0.03 -0.07 0.062
Mercer Bridge 11 0.06 0.05 0.04 0.08 0.03 0.19 0.064
Tuakau Bridge 11 0.06 0.05 0.03 0.08 0.03 0.12 0.064
Lithium (g/m 3)
Location Count Mean Median Min Max IQR Skew 5 Yr Median
Taupo Control Gates 12 0.001 0.001 0.001 0.003 0.001 1.329 0.001
Ohaaki Bridge 12 0.034 0.034 0.022 0.051 0.015 0.336 0.036
Ohakuri Tailrace Bridge 12 0.087 0.090 0.005 0.240 0.113 0.625 0.083
Whakamaru Tailrace 12 0.122 0.103 0.028 0.330 0.127 1.000 0.095
Waipapa Tailrace 12 0.210 0.186 0.077 0.380 0.161 0.510 0.175
Narrow s 12 0.311 0.300 0.103 0.600 0.204 0.553 0.265
Horotiu Bridge 12 0.323 0.300 0.111 0.660 0.207 0.717 0.275
Huntly-Tainui Bridge 12 0.511 0.400 0.179 1.070 0.500 0.648 0.405
Mercer Bridge 12 0.499 0.385 0.156 1.140 0.485 0.712 0.375
Tuakau Bridge 12 0.493 0.370 0.094 1.120 0.495 0.625 0.355
Nitrate/Nitrite Nitrogen (g/m 3)
Location Count Mean Median Min Max IQR Skew 5 Yr Median
Taupo Control Gates 12 0.004 0.003 0.003 0.007 0.003 0.76 0.005
Ohaaki Bridge 12 0.008 0.008 0.003 0.018 0.005 1.08 0.005
Ohakuri Tailrace Bridge 12 0.010 0.007 0.003 0.036 0.010 1.92 0.005
Whakamaru Tailrace 12 0.009 0.003 0.003 0.041 0.010 1.97 0.005
Waipapa Tailrace 12 0.014 0.014 0.003 0.030 0.014 0.29 0.015
Narrow s 12 0.015 0.013 0.005 0.028 0.007 0.66 0.015
Horotiu Bridge 12 0.009 0.005 0.005 0.022 0.008 1.10 0.008
Huntly-Tainui Bridge 12 0.016 0.014 0.005 0.041 0.020 0.73 0.011
Mercer Bridge 12 0.014 0.005 0.005 0.061 0.017 1.89 0.005
Tuakau Bridge 12 0.013 0.005 0.005 0.048 0.018 1.47 0.005
Nitrogen - Ammoniacal (g/m 3)

Page 12 Doc # 10492663
Skew = skewness. Underlined values = non-normal distribution. IQR = Inter Quartile Range
Location Count Mean Median Min Max IQR Skew 5 Yr Median
Taupo Control Gates 12 0.11 0.08 0.05 0.31 0.05 1.66 0.06
Ohaaki Bridge 12 0.09 0.09 0.07 0.11 0.02 0.00 0.09
Ohakuri Tailrace Bridge 12 0.15 0.14 0.10 0.30 0.07 1.62 0.10
Whakamaru Tailrace 12 0.16 0.16 0.10 0.27 0.04 1.22 0.13
Waipapa Tailrace 12 0.16 0.15 0.12 0.25 0.03 1.66 0.14
Narrow s 12 0.18 0.17 0.11 0.27 0.09 0.50 0.16
Horotiu Bridge 12 0.19 0.16 0.14 0.27 0.11 0.43 0.18
Huntly-Tainui Bridge 12 0.29 0.24 0.18 0.59 0.16 1.31 0.22
Mercer Bridge 12 0.33 0.32 0.15 0.57 0.17 0.27 0.28
Tuakau Bridge 12 0.38 0.38 0.16 0.59 0.30 -0.09 0.29
Nitrogen - Total Kjeldahl (g/m 3)
Location Count Mean Median Min Max IQR Skew 5 Yr Median
Taupo Control Gates 12 0.11 0.08 0.05 0.31 0.05 1.7 0.06
Ohaaki Bridge 12 0.12 0.12 0.10 0.16 0.03 0.7 0.12
Ohakuri Tailrace Bridge 12 0.24 0.22 0.14 0.39 0.12 0.5 0.20
Whakamaru Tailrace 12 0.28 0.25 0.20 0.50 0.10 1.4 0.25
Waipapa Tailrace 12 0.37 0.35 0.26 0.52 0.16 0.4 0.33
Narrow s 12 0.49 0.52 0.25 0.83 0.22 0.4 0.43
Horotiu Bridge 12 0.51 0.53 0.31 0.91 0.24 0.8 0.46
Huntly-Tainui Bridge 12 0.80 0.68 0.41 1.66 0.47 1.1 0.60
Mercer Bridge 12 0.83 0.68 0.40 1.54 0.70 0.5 0.62
Tuakau Bridge 12 0.87 0.79 0.41 1.71 0.74 0.5 0.62
Nitrogen - Total (g/m 3)
Location Count Mean Median Min Max IQR Skew 5 Yr Median
Taupo Control Gates 12 7.7 7.8 7.5 7.9 0.3 -0.31 7.7
Ohaaki Bridge 12 7.4 7.4 7.0 7.6 0.3 -0.48 7.3
Ohakuri Tailrace Bridge 12 7.5 7.5 7.2 7.6 0.3 -0.47 7.4
Whakamaru Tailrace 12 7.5 7.5 7.1 7.7 0.2 -0.70 7.5
Waipapa Tailrace 12 7.5 7.5 7.3 7.7 0.2 0.13 7.4
Narrow s 12 7.5 7.4 7.2 7.7 0.4 0.17 7.4
Horotiu Bridge 12 7.5 7.5 7.2 7.7 0.3 -0.09 7.5
Huntly-Tainui Bridge 12 7.5 7.5 7.1 7.7 0.3 -0.51 7.4
Mercer Bridge 12 7.5 7.5 7.1 7.8 0.4 -0.22 7.5
Tuakau Bridge 12 7.5 7.6 7.0 8.0 0.5 -0.15 7.5
pH (pH Units)
Location Count Mean Median Min Max IQR Skew 5 Yr Median
Taupo Control Gates 12 0.002 0.002 0.001 0.003 0.001 -0.34 0.002
Ohaaki Bridge 12 0.007 0.007 0.003 0.010 0.002 -0.23 0.006
Ohakuri Tailrace Bridge 12 0.010 0.010 0.004 0.020 0.006 0.51 0.010
Whakamaru Tailrace 12 0.011 0.010 0.004 0.021 0.006 0.69 0.009
Waipapa Tailrace 12 0.017 0.017 0.006 0.025 0.007 -0.42 0.017
Narrow s 12 0.016 0.016 0.005 0.029 0.009 0.11 0.016
Horotiu Bridge 12 0.020 0.019 0.012 0.038 0.009 1.16 0.020
Huntly-Tainui Bridge 12 0.022 0.022 0.012 0.033 0.007 0.05 0.021
Mercer Bridge 12 0.018 0.018 0.007 0.033 0.012 0.22 0.016
Tuakau Bridge 12 0.016 0.016 0.005 0.029 0.009 0.13 0.014
Phosphorus - Dissolved Reactive (g/m 3)

Doc # 10492663 Page 13
Skew = skewness. Underlined values = non-normal distribution. IQR = Inter Quartile Range
Location Count Mean Median Min Max IQR Skew 5 Yr Median
Taupo Control Gates 12 0.006 0.004 0.002 0.026 0.004 2.5 0.004
Ohaaki Bridge 12 0.011 0.010 0.007 0.016 0.006 0.4 0.010
Ohakuri Tailrace Bridge 12 0.022 0.022 0.014 0.031 0.008 0.2 0.019
Whakamaru Tailrace 12 0.029 0.025 0.011 0.060 0.015 0.9 0.021
Waipapa Tailrace 12 0.027 0.028 0.014 0.037 0.007 -0.3 0.026
Narrow s 12 0.029 0.029 0.022 0.038 0.006 0.2 0.029
Horotiu Bridge 12 0.034 0.033 0.025 0.054 0.006 1.5 0.034
Huntly-Tainui Bridge 12 0.052 0.043 0.033 0.130 0.011 2.1 0.042
Mercer Bridge 12 0.053 0.049 0.035 0.096 0.019 1.3 0.046
Tuakau Bridge 12 0.056 0.052 0.034 0.100 0.029 0.8 0.050
Phosphorus - Total (g/m 3)
Location Count Mean Median Min Max IQR Skew 5 Yr Median
Taupo Control Gates 12 15.0 14.5 10.3 21.3 6.0 0.33 14.6
Ohaaki Bridge 12 16.4 15.8 11.0 23.2 6.4 0.28 16.2
Ohakuri Tailrace Bridge 12 16.6 16.5 11.3 23.3 7.6 0.17 16.5
Whakamaru Tailrace 12 16.9 16.7 11.5 23.3 7.0 0.21 16.6
Waipapa Tailrace 12 16.6 16.6 11.4 23.0 7.1 0.18 16.3
Narrow s 12 16.3 16.4 11.2 22.9 6.6 0.26 16.0
Horotiu Bridge 12 16.6 16.4 11.3 23.1 7.3 0.14 16.2
Huntly-Tainui Bridge 12 16.8 16.6 10.8 24.4 8.0 0.16 16.3
Mercer Bridge 12 17.2 17.0 11.1 25.6 7.7 0.27 16.6
Tuakau Bridge 12 17.6 17.4 11.1 25.7 8.2 0.15 17.2
Temperature (oC)
Location Count Mean Median Min Max IQR Skew 5 Yr Median
Taupo Control Gates 12 88 87 75 100 8 -0.07 88
Ohaaki Bridge 12 108 111 87 125 14 -0.41 110
Ohakuri Tailrace Bridge 12 121 121 99 140 15 0.02 122
Whakamaru Tailrace 12 123 122 104 137 11 -0.30 126
Waipapa Tailrace 12 119 119 107 134 11 0.24 123
Narrow s 12 119 121 93 131 14 -1.06 124
Horotiu Bridge 12 119 118 106 132 15 -0.04 122
Huntly-Tainui Bridge 12 115 116 102 129 13 -0.05 116
Mercer Bridge 12 120 121 105 136 14 -0.06 122
Tuakau Bridge 12 120 120 108 130 17 -0.01 121
Dissolved Solids - Total (g/m 3)
Location Count Mean Median Min Max IQR Skew 5 Yr Median
Taupo Control Gates 12 0.5 0.5 0.2 1.2 0.2 1.8 0.5
Ohaaki Bridge 12 0.8 0.7 0.4 1.3 0.4 0.4 0.7
Ohakuri Tailrace Bridge 12 1.3 1.3 0.7 2.6 0.4 1.3 1.0
Whakamaru Tailrace 12 1.5 1.4 0.7 3.3 0.9 1.2 1.2
Waipapa Tailrace 12 1.2 1.2 0.9 1.6 0.4 0.3 1.3
Narrow s 12 2.2 1.6 1.2 4.2 1.6 1.0 1.8
Horotiu Bridge 12 2.5 2.2 1.4 5.3 1.3 1.2 2.4
Huntly-Tainui Bridge 12 7.0 5.0 2.5 19.5 4.9 1.4 5.3
Mercer Bridge 12 9.5 8.5 2.4 20.0 8.4 0.6 8.2
Tuakau Bridge 12 10.4 9.1 2.2 22.0 9.7 0.5 8.8
Turbidity (NTU)

Page 14 Doc # 10492663
5-Yearly major ion summary statistics
Skew = skewness. Underlined values = non-normal distribution. IQR = Inter Quartile Range
Location Count Mean Median Min Max IQR Skew
Taupo Control Gates 12 6.76 6.80 6.40 7.00 0.10 -0.93
Ohaaki Bridge 12 6.95 6.95 6.60 7.20 0.25 -0.34
Ohakuri Tailrace Bridge 12 6.91 6.90 6.70 7.30 0.20 0.83
Whakamaru Tailrace 12 6.68 6.65 6.30 7.10 0.20 0.44
Waipapa Tailrace 12 6.50 6.50 6.10 6.90 0.45 0.10
Narrow s 12 6.56 6.50 6.20 7.00 0.25 0.46
Horotiu Bridge 12 6.51 6.50 6.10 6.90 0.25 -0.06
Huntly-Tainui Bridge 12 7.54 7.60 6.50 8.40 0.75 -0.39
Mercer Bridge 12 8.12 8.35 6.90 9.10 1.35 -0.14
Tuakau Bridge 12 8.26 8.25 7.00 9.90 1.70 0.24
Location Count Mean Median Min Max IQR Skew
Taupo Control Gates 12 2.89 2.85 2.80 3.10 0.15 0.89
Ohaaki Bridge 12 2.99 3.00 2.80 3.10 0.20 -0.41
Ohakuri Tailrace Bridge 12 2.93 2.90 2.80 3.20 0.20 0.64
Whakamaru Tailrace 12 2.83 2.85 2.70 3.10 0.20 0.55
Waipapa Tailrace 12 2.66 2.65 2.40 2.90 0.10 -0.05
Narrow s 12 2.79 2.80 2.50 3.30 0.30 0.61
Horotiu Bridge 12 2.76 2.80 2.40 3.10 0.25 -0.25
Huntly-Tainui Bridge 12 2.63 2.60 2.30 3.10 0.30 0.37
Mercer Bridge 12 2.78 2.80 2.40 3.20 0.20 -0.02
Tuakau Bridge 12 2.83 2.80 2.40 3.20 0.15 -0.16
Location Count Mean Median Min Max IQR Skew
Taupo Control Gates 12 2.01 2.00 1.80 2.20 0.17 -0.08
Ohaaki Bridge 12 2.63 2.60 2.40 3.00 0.25 0.57
Ohakuri Tailrace Bridge 12 3.10 3.10 2.70 3.40 0.40 -0.09
Whakamaru Tailrace 12 3.15 3.20 2.70 3.80 0.40 0.40
Waipapa Tailrace 12 3.09 3.10 2.70 3.40 0.30 -0.21
Narrow s 12 3.28 3.30 3.00 3.70 0.35 0.22
Horotiu Bridge 12 3.27 3.30 2.90 3.60 0.35 -0.32
Huntly-Tainui Bridge 12 3.16 3.20 2.70 3.50 0.35 -0.52
Mercer Bridge 12 3.25 3.35 2.80 3.50 0.35 -0.76
Tuakau Bridge 12 3.28 3.30 2.80 3.60 0.30 -0.70
Location Count Mean Median Min Max IQR Skew
Taupo Control Gates 12 12.9 12.8 12.4 13.8 0.6 0.80
Ohaaki Bridge 12 17.8 17.3 15.9 21.0 2.2 0.74
Ohakuri Tailrace Bridge 12 21.2 21.5 17.4 24.0 2.6 -0.47
Whakamaru Tailrace 12 20.6 20.5 18.7 23.0 2.8 0.04
Waipapa Tailrace 12 19.8 19.7 17.3 22.0 2.3 0.03
Narrow s 12 19.2 19.2 14.8 23.0 3.1 -0.24
Horotiu Bridge 12 19.5 19.7 15.0 25.0 3.4 0.29
Huntly-Tainui Bridge 12 17.1 16.4 11.9 22.0 4.7 -0.07
Mercer Bridge 12 16.9 16.6 11.5 21.0 3.8 -0.17
Tuakau Bridge 12 17.1 16.7 11.4 22.0 3.4 -0.08
Calcium - dissolved (g/m3)
Magnesium - dissolved (g/m3)
Potassium - dissolved (g/m3)
Sodium - dissolved (g/m3)

Doc # 10492663 Page 15
Skew = skewness. Underlined values = non-normal distribution. IQR = Inter Quartile Range
Location Count Mean Median Min Max IQR Skew
Taupo Control Gates 12 39 39 38 40 1 0.08
Ohaaki Bridge 12 41 40 39 44 2 1.00
Ohakuri Tailrace Bridge 12 42 43 40 44 2 -0.32
Whakamaru Tailrace 12 42 42 39 44 3 -0.34
Waipapa Tailrace 12 40 40 37 42 3 -0.43
Narrow s 12 39 39 34 42 5 -0.40
Horotiu Bridge 12 39 39 34 43 5 -0.27
Huntly-Tainui Bridge 12 37 37 28 43 8 -0.47
Mercer Bridge 12 37 38 28 44 8 -0.32
Tuakau Bridge 12 37 38 27 43 9 -0.40
Location Count Mean Median Min Max IQR Skew
Taupo Control Gates 12 47 47 46 48 1 0.05
Ohaaki Bridge 12 50 49 48 53 2 0.92
Ohakuri Tailrace Bridge 12 51 52 48 53 3 -0.73
Whakamaru Tailrace 12 51 51 48 53 3 -0.24
Waipapa Tailrace 12 48 49 45 51 3 -0.35
Narrow s 12 48 48 42 52 5 -0.20
Horotiu Bridge 12 48 47 41 52 6 -0.35
Huntly-Tainui Bridge 12 45 45 35 52 9 -0.43
Mercer Bridge 12 45 46 34 53 10 -0.35
Tuakau Bridge 12 45 46 33 52 11 -0.48
Location Count Mean Median Min Max IQR Skew
Taupo Control Gates 12 7.2 7.2 7.0 7.5 0.4 0.52
Ohaaki Bridge 12 8.2 8.2 7.6 9.1 0.4 0.90
Ohakuri Tailrace Bridge 12 9.6 9.3 8.9 11.0 1.2 0.74
Whakamaru Tailrace 12 8.9 8.7 8.0 11.2 0.7 1.92
Waipapa Tailrace 12 8.6 8.7 7.5 9.2 0.9 -0.54
Narrow s 12 9.1 8.6 7.5 13.0 1.1 1.78
Horotiu Bridge 12 8.9 8.9 7.7 9.9 0.7 -0.03
Huntly-Tainui Bridge 12 8.6 8.4 7.0 11.1 1.2 0.86
Mercer Bridge 12 9.8 9.3 7.7 12.6 2.2 0.54
Tuakau Bridge 12 10.2 9.5 7.7 14.4 2.4 0.78
Location Count Mean Median Min Max IQR Skew
Taupo Control Gates 12 24.4 25.0 23.0 25.0 1.0 -0.86
Ohaaki Bridge 12 28.6 28.5 26.0 33.0 1.5 1.07
Ohakuri Tailrace Bridge 12 33.6 34.0 30.0 36.0 2.0 -0.75
Whakamaru Tailrace 12 35.8 36.5 32.0 38.0 3.5 -0.59
Waipapa Tailrace 12 36.3 36.5 33.0 39.0 2.5 -0.29
Narrow s 12 37.6 37.0 32.0 45.0 4.5 0.40
Horotiu Bridge 12 36.5 37.0 31.0 39.0 4.0 -0.85
Huntly-Tainui Bridge 12 33.3 33.5 27.0 37.0 5.0 -0.49
Mercer Bridge 12 32.2 31.5 27.0 38.0 4.0 0.37
Tuakau Bridge 12 31.5 31.5 25.0 38.0 5.5 0.20
Sulphate (g/m3)
Silica - dissolved reactive (units: (g/m3) SiO2)
Alkalinity (units: (g/m3) CaCO3)
Bicarbonate (units: (g/m3) HCO3)

Page 16 Doc # 10492663

Doc # 10492663 Page 17
Total Nitrogen, 2012-2016 Data
Taupo Ohaaki Ohakuri Whaka Waipapa Narrows Horotiu Huntly Mercer Tuakau
0.0
0.2
0.4
0.6
0.8
1.0
1.2
1.4
1.6
1.8
2.0
T
ota
l Nitr
ogen (
g/m
3 N
)
Total Phosphorus, 2012-2016 Data
Taupo Ohaaki Ohakuri Whaka Waipapa Narrows Horotiu Huntly Mercer Tuakau
0.00
0.03
0.06
0.09
0.12
0.15
0.18
Tota
l Phosphoru
s (
g/m
3)
E.coli, 2012-2016 Data
Taupo Ohaaki Ohakuri Whaka Waipapa Narrows Horotiu Huntly Mercer Tuakau
5
50
500
5000
E.c
oli
(cfu
/100m
l)
2016 median
2012-2016 median
2016 median
2012-2016 median
2016 median
2012-2016 median

Page 18 Doc # 10492663
Ammoniacal Nitrogen, 2012-2016 Data
Taupo Ohaaki Ohakuri Whaka Waipapa Narrows Horotiu Huntly Mercer Tuakau
0.00
0.02
0.04
0.06
0.08
0.10
0.12
A
mm
onia
cal N
itrogen (
g/m
3 N
)
pH, 2012-2016 Data
Taupo Ohaaki Ohakuri Whaka Waipapa Narrows Horotiu Huntly Mercer Tuakau
6.5
7.0
7.5
8.0
8.5
9.0
pH
Temperature, 2012-2016 Data
Taupo Ohaaki Ohakuri Whaka Waipapa Narrows Horotiu Huntly Mercer Tuakau
5
10
15
20
25
30
Tem
pera
ture
(oC
) 2016 median
2012-2016 median
2016 median
2012-2016 median
20016 median
2012-2016 median

Doc # 10492663 Page 19
Total Arsenic, 2012-2016 Data
Taupo Ohaaki Ohakuri Whaka Waipapa Narrows Horotiu Huntly Mercer Tuakau
0.000
0.005
0.010
0.015
0.020
0.025
0.030
0.035
0.040
0.045
0.050
Tota
l Ars
enic
(g/m
3)
Boron, 2012-2016 Data
Taupo Ohaaki Ohakuri Whaka Waipapa Narrows Horotiu Huntly Mercer Tuakau
0.0
0.1
0.2
0.3
0.4
0.5
0.6
Boro
n (
g/m
3)
Dissolved Oxygen, 2012-2016 Data
Taupo Ohaaki Ohakuri Whaka Waipapa Narrows Horotiu Huntly Mercer Tuakau
70
80
90
100
110
120
130
140
Dis
solv
ed O
xygen (
% s
atu
ratio
n)
2016 median
2012-2016 median
2016 median
2012-2016 median
2016 median
2012-2016 median

Page 20 Doc # 10492663
Comparison with water quality standards Table 3: Number of samples (year 2016) complying with the ‘satisfactory’ water quality
guidelines and standards. n = 12 (except * where n = 11 & ^ where n=10).
ECOLOGICAL HEALTH HUMAN USES
Recreation water supply
drinking water
Location DO pH Turb NH4N Temp TP TN Bk1 Disk E coli Median E coli
CHLa As B
Taupo Gates 12 12 12 12 8 12 12 - 12 Y 12 0 12
Ohaaki Bridge 12 12 12 12 6 12 12
10/11* 12 Y 12 0 12
Ohakuri Tailrace Br 12 12 12 12 5 12 12 8/10* 12 Y 11 0 12
Whakamaru Tailrace 12 12 12 12 5 10 11 8/9* 12 Y 10 0 12
Waipapa Tailrace 12 12 12 12 5 12 10 9/9^ 12 Y 12 0 12
Hamilton – Narrows 12 12 12 12 6 12 5 8/10* 12 Y 11 0 12
Horotiu Bridge 12 12 11 12 6 10 5 7/11* 12 Y 12 0 12
Huntly – Tainui Br 12 12 6 12 6 3 3 1/9* 11 Y 12 2 12
Mercer Bridge 12 12 2 12 5 3 4 - 11 Y 9 2 12
Tuakau Bridge 11 12 3 12 5 4 4 0/10* 12 Y 8 3 12
1samples complying with the baseflow water clarity guideline from the number of samples measured when flow was below the upper decile of all flows
Table 4: Number of samples (year 2016) complying with the ‘excellent’ water quality guidelines
and standards. n = 12 (except * where n = 11 & ^ where n=10).
ECOLOGICAL HEALTH HUMAN USES
Recreation water supply
Drinking water
Location DO pH Turb NH4N Temp TP TN Bk1 Disk E coli Median E coli
CHLa As B
Taupo Gates 12 12 12 12 2 11 7 - 12 Y 12 n/a n/a
Ohaaki Bridge 12 12 12 12 2 4 0 9/11* 11 Y 12 n/a n/a
Ohakuri Tailrace Br 12 12 11 12 2 0 0 0/10* 12 Y 5 n/a n/a
Whakamaru Tailrace 11 12 10 12 2 0 0 0/9 * 10 Y 3 n/a n/a
Waipapa Tailrace 11 12 12 12 1 0 0 0/9^ 12 Y 7 n/a n/a
Hamilton – Narrows 12 12 8 12 2 0 0 0/10* 7 N 4 n/a n/a
Horotiu Bridge 12 12 4 12 1 0 0 0/11* 3 N 4 n/a n/a
Huntly – Tainui Br 12 12 0 12 1 0 0 0/9* 4 N 3 n/a n/a
Mercer Bridge 9 12 0 12 1 0 0 - 3 N 2 n/a n/a
Tuakau Bridge 8 12 0 12 1 0 0 0/10* 2 N 2 n/a n/a
1samples complying with the baseflow water clarity guideline from the number of samples measured when flow was below the upper decile of all flows

Doc # 10492663 Page 21
Raw data summary
Note: < = less than the value stated
UD = upper decile flow (long-term record 1997-2016 inclusive)
Underlined values don't comply with the "satisfactory" water quality Guidelines and Standards - Table 1
*New Zealand Standard Time () black disk measurements taken in flows above upper decile values – don’t assess for compliance
DATE TIME* FLOW BDISK COLOR COND pH TEMP DO PCDO BOD5 TURB TDS NNN NO3-N
dd/mm/yy hh:mm m 3/s m units mS/m units 'C g/m 3 %Sat g/m 3 NTU g/m 3 g/m 3 g/m 3
Satisfactory Water Quality >1.6 - - 6.5-9 <12 (May-Sep) >80 - <5 - - -
Guideline/Standard <20 (Oct-Apr)
1131-127 UD = 259 m3/s (Flows from "Reids Farm")
Waikato River at Taupo Control Gates
05/01/16 8:47 a.m. 100 - - 12.0 7.8 16.9 10.3 109.9 1.5 0.45 85 < 0.002 < 0.002
02/02/16 8:00 a.m. 105 - - 12.0 7.8 21.3 9.5 110.6 0.7 0.22 92 < 0.002 < 0.002
01/03/16 8:30 a.m. 199 - - 12.2 7.9 20.7 8.9 102.5 1.4 0.54 85 0.003 0.002
05/04/16 9:15 a.m. 78 - - 12.6 7.8 17.9 9.9 107.7 1.3 0.55 100 0.002 0.003
03/05/16 9:40 a.m. 112 - - 12.2 7.9 17.3 9.5 101.6 1.4 0.49 85 < 0.002 < 0.002
07/06/16 9:15 a.m. 244 - - 12.3 7.8 12.5 10.0 95.5 0.4 0.47 93 < 0.002 < 0.002
05/07/16 9:28 a.m. 205 - - 12.0 7.7 11.1 10.5 98.9 0.6 0.28 83 < 0.002 < 0.002
02/08/16 9:19 a.m. 256 - - 12.1 7.5 10.3 10.6 99.5 0.7 0.43 90 < 0.002 < 0.002
06/09/16 8:52 a.m. 198 - - 12.2 7.5 11.3 10.4 98.5 1.1 0.54 84 < 0.002 < 0.002
04/10/16 8:05 a.m. 199 - - 12.0 7.5 11.9 11.1 107.4 0.4 0.56 75 < 0.002 < 0.002
01/11/16 8:17 a.m. 205 - - 12.0 7.6 12.6 10.8 105.2 0.8 1.16 93 < 0.002 < 0.002
06/12/16 8:18 a.m. 204 - - 12.1 7.7 16.4 9.9 104.8 < 0.4 0.32 89 < 0.002 < 0.002
1131-105 UD = 248 m3/s (Flows from Ohaaki Bridge Recorder, +/- 20%)
Waikato River at Ohaaki Br
05/01/16 10:01 a.m. 100 1.5 65.0 15.5 7.3 19.0 9.4 104.0 1.4 1.22 112 0.041 0.040
02/02/16 8:58 a.m. 116 4.5 57.5 14.5 7.6 23.2 8.5 102.7 0.8 0.59 110 0.024 0.024
01/03/16 9:15 a.m. 139 5.0 45.0 14.2 7.4 22.0 8.2 96.6 0.6 0.53 99 0.033 0.034
05/04/16 10:15 a.m. 139 5.5 55.0 14.7 7.5 19.3 9.5 105.8 0.7 0.38 114 0.030 0.032
03/05/16 10:25 a.m. 176 5.5 45.0 14.2 7.4 17.5 10.0 106.8 0.7 0.56 87 0.023 0.022
07/06/16 10:05 a.m. 94 5.9 55.0 17.3 7.5 13.7 10.3 99.6 0.5 0.91 125 0.050 0.049
05/07/16 10:19 a.m. 146 6.1 40.0 14.5 7.3 12.1 11.2 106.9 0.5 0.46 115 0.039 0.041
02/08/16 9:51 a.m. 211 - - 13.8 7.3 11.0 11.8 110.8 1.1 1.04 97 0.022 0.022
06/09/16 9:27 a.m. 137 7.0 55.0 14.8 7.5 12.3 11.1 106.5 0.7 0.84 105 0.033 0.035
04/10/16 8:43 a.m. 205 8.0 47.5 15.5 7.2 13.3 10.5 103.8 < 0.4 1.33 103 0.025 0.027
01/11/16 8:50 a.m. 143 8.0 55.0 16.4 7.0 14.1 10.3 103.1 0.7 0.91 120 0.036 0.036
06/12/16 9:15 a.m. 147 7.5 45.0 15.6 7.2 18.8 9.4 103.6 < 0.4 0.59 112 0.051 0.051
1131-107 UD = 319 m3/s (Flows from Ohakuri Dam - Total)
Waikato River at Ohakuri Tailrace Br
05/01/16 10:50 a.m. 263 1.5 40.0 17.0 7.5 20.4 9.1 103.7 1.2 1.09 117 0.029 0.029
02/02/16 9:43 a.m. 264 2.3 40.0 16.4 7.6 23.3 8.9 107.2 1.1 2.60 124 0.018 0.017
01/03/16 10:15 a.m. 266 2.4 40.0 16.6 7.5 21.7 9.3 108.6 1.9 1.09 112 0.011 0.011
05/04/16 11:15 a.m. 164 2.2 35.0 17.8 7.6 19.8 9.1 102.5 0.8 1.18 140 0.103 0.104
03/05/16 11:10 a.m. 198 3.4 40.0 17.8 7.4 17.7 9.1 97.7 1.4 0.88 122 0.098 0.097
07/06/16 11:05 a.m. 275 3.1 37.5 17.9 7.6 12.5 9.7 91.4 0.8 0.70 139 0.151 0.150
05/07/16 11:10 a.m. 328 (2.9) 37.5 16.9 7.3 12.4 9.6 91.6 1.9 1.57 133 0.240 0.240
02/08/16 10:41 a.m. 312 - - 16.1 7.3 11.3 10.7 101.0 0.9 1.36 114 0.146 0.145
06/09/16 10:20 a.m. 271 3.3 37.5 16.3 7.6 12.6 10.8 103.8 0.8 1.04 114 0.121 0.119
04/10/16 9:27 a.m. 313 3.7 45.0 14.5 7.2 13.0 11.5 112.9 0.6 1.32 99 0.082 0.084
01/11/16 9:38 a.m. 298 1.3 32.5 16.7 7.2 15.3 11.4 116.9 1.2 1.90 124 0.034 0.031
06/12/16 10:07 a.m. 278 1.8 35.0 16.4 7.6 19.2 11.1 122.8 1.1 1.36 119 0.005 0.004
1131-147 UD = 298 m3/s (Flows from Whakamaru Dam - Total)
Waikato River at Whakamaru Tailrace
05/01/16 11:44 a.m. 170 3.0 37.5 17.2 7.6 20.7 9.5 107.4 0.7 1.0 127 0.035 0.034
02/02/16 10:27 a.m. 251 1.8 35.0 16.7 7.6 23.3 8.7 104.1 0.8 0.7 127 0.051 0.051
01/03/16 10:55 a.m. 225 2.1 37.5 16.2 7.6 22.4 8.8 103.0 1.2 0.9 121 0.028 0.027
05/04/16 11:50 a.m. 226 2.0 16.6 7.6 19.6 9.9 109.8 1.6 3.3 131 0.053 0.055
03/05/16 11:50 a.m. 238 2.7 40.0 17.3 7.6 17.6 9.6 101.3 0.9 1.1 122 0.120 0.119
07/06/16 11:40 a.m. 298 (3.1) 37.5 18.0 7.4 13.4 9.7 92.2 0.7 0.9 137 0.220 0.220
05/07/16 12:00 p.m. 304 (3.0) 32.5 17.5 7.2 12.7 9.3 89.2 0.7 1.4 135 0.330 0.340
02/08/16 11:15 a.m. 282 - - 15.6 7.4 11.5 10.4 97.5 0.5 1.4 118 0.196 0.195
06/09/16 10:51 a.m. 265 2.9 32.5 16.0 7.7 12.9 11.0 106.0 1.7 2.3 118 0.145 0.152
04/10/16 10:08 a.m. 258 2.2 37.5 14.8 7.4 13.7 11.8 116.3 0.8 1.8 104 0.124 0.126
01/11/16 10:19 a.m. 260 1.6 32.5 15.8 7.1 15.8 11.3 116.2 < 0.4 1.9 121 0.084 0.085
06/12/16 10:38 a.m. 230 2.1 40.0 15.9 7.4 18.9 10.9 118.5 0.9 1.4 112 0.064 0.063

Page 22 Doc # 10492663
Note: < = less than the value stated
UD = upper decile flow (long-term record 1997-2016 inclusive)
Underlined values don't comply with the "satisfactory" water quality Guidelines and Standards - Table 1
*New Zealand Standard Time
NH4-N TKN TN DRP TP CL AS B LI A340F A440F ENT FC E coli CHLA DOC TOC
g/m 3 g/m 3 g/m 3 g/m 3 g/m 3 g/m 3 g/m 3 g/m 3 g/m 3 /cm /cm g/m 3 g/m 3 g/m 3
<0.88 - <0.5 - <0.04 - <0.01 <0.3 - - - <77 - <550 <0.02
< 0.01 0.05 0.05 < 0.004 0.005 8.4 0.011 0.15 0.039 < 0.002 < 0.002 7 11 8 < 0.003 1.7 1.8
< 0.01 0.08 0.08 < 0.004 0.005 7.7 0.011 0.17 0.039 < 0.002 < 0.002 7 14 10 < 0.003 0.8 0.9
< 0.01 0.31 0.31 < 0.004 < 0.004 8.2 0.011 0.17 0.042 < 0.002 < 0.002 4 4 3 < 0.003 2.2 2.4
< 0.01 0.10 0.10 < 0.004 0.006 8.6 0.012 0.19 0.047 < 0.002 < 0.002 4 2 2 < 0.003 1.4 1.7
< 0.01 0.26 0.26 < 0.004 < 0.004 8.0 0.012 0.16 0.040 < 0.002 < 0.002 1 1 1 < 0.003 1.8 1.6
< 0.01 0.06 0.06 < 0.004 < 0.004 8.1 0.012 0.18 0.040 < 0.002 < 0.002 < 1 3 3 < 0.003 0.8 0.8
< 0.01 0.07 0.07 < 0.004 < 0.004 8.0 0.012 0.18 0.040 < 0.002 < 0.002 1 < 1 < 1 < 0.003 0.9 0.9
< 0.01 0.06 0.06 < 0.004 0.026 8.0 0.012 0.19 0.038 < 0.002 < 0.002 1 < 1 < 1 < 0.003 1.2 1.0
< 0.01 0.06 0.06 < 0.004 0.005 8.2 0.012 0.17 0.042 < 0.002 < 0.002 1 < 1 < 1 < 0.003 0.8 0.8
< 0.01 0.10 0.10 < 0.004 0.008 8.4 0.012 0.18 0.041 < 0.002 < 0.002 1 2 2 < 0.003 0.8 0.8
< 0.01 0.11 0.11 < 0.004 < 0.004 8.2 0.013 0.15 0.037 < 0.002 < 0.002 1 6 6 < 0.003 1.0 1.1
< 0.01 0.08 0.08 < 0.004 < 0.004 7.8 0.011 0.16 0.038 < 0.002 < 0.002 1 8 6 < 0.003 0.9 2.2
0.01 0.10 0.14 0.010 0.010 16.6 0.026 0.30 0.087 0.005 < 0.002 7 18 15 < 0.003 2.3 2.7
< 0.01 0.10 0.12 0.007 0.015 12.9 0.019 0.27 0.070 0.003 < 0.002 35 80 40 < 0.003 1.0 1.2
< 0.01 0.08 0.11 0.007 0.010 13.2 0.020 0.25 0.069 0.004 < 0.002 55 43 28 < 0.003 0.8 0.9
< 0.01 0.09 0.12 0.006 0.009 14.1 0.024 0.28 0.083 0.004 < 0.002 59 40 27 < 0.003 0.7 0.8
< 0.01 0.09 0.11 0.004 0.007 13.3 0.022 0.24 0.068 0.002 < 0.002 47 70 70 < 0.003 1.5 1.3
0.02 0.09 0.14 0.008 0.016 21.0 0.031 0.37 0.111 0.004 < 0.002 5 4 4 < 0.003 0.9 0.9
< 0.01 0.07 0.11 0.006 0.009 14.1 0.023 0.28 0.075 0.003 < 0.002 1 11 7 < 0.003 0.7 1.1
< 0.01 0.08 0.10 0.005 0.014 12.2 0.020 0.25 0.062 0.003 < 0.002 3 17 14 < 0.003 0.9 0.9
< 0.01 0.07 0.11 0.007 0.011 14.2 0.021 0.27 0.074 0.003 < 0.002 4 17 14 < 0.003 0.7 1.0
< 0.01 0.09 0.12 0.006 0.016 16.6 0.024 0.36 0.085 0.003 < 0.002 3 17 14 < 0.003 0.8 0.8
0.01 0.11 0.15 0.007 0.007 19.4 0.025 0.35 0.087 0.007 0.003 1 10 7 < 0.003 1.2 1.0
< 0.01 0.11 0.16 0.008 0.010 16.7 0.025 0.28 0.085 0.004 < 0.002 13 35 35 < 0.003 1.0 1.2
< 0.01 0.12 0.15 0.013 0.031 19.2 0.031 0.32 0.105 0.007 < 0.002 2 5 4 0.005 1.2 2.5
< 0.01 0.14 0.15 0.009 0.021 17.5 0.030 0.31 0.103 0.006 < 0.002 9 10 8 0.008 1.3 1.1
< 0.01 0.30 0.31 0.005 0.016 17.9 0.029 0.32 0.103 0.006 < 0.002 6 1 < 1 0.007 1.7 1.9
< 0.01 0.11 0.22 0.010 0.018 19.7 0.031 0.37 0.118 0.007 < 0.002 1 5 3 0.006 1.1 1.2
0.02 0.18 0.28 0.013 0.017 21.0 0.035 0.33 0.112 0.006 < 0.002 < 1 1 1 0.003 2.3 2.0
0.02 0.10 0.25 0.014 0.022 21.0 0.031 0.37 0.118 0.006 < 0.002 25 5 5 < 0.003 1.1 1.0
0.03 0.15 0.39 0.021 0.027 18.6 0.028 0.32 0.113 0.011 0.002 9 15 15 < 0.003 1.2 1.2
0.01 0.17 0.33 0.013 0.027 16.8 0.027 0.32 0.090 0.007 < 0.002 2 10 10 < 0.003 1.2 1.2
< 0.01 0.10 0.22 0.008 0.014 16.5 0.025 0.30 0.094 0.005 < 0.002 1 1 1 0.006 0.7 1.0
< 0.01 0.11 0.19 0.008 0.020 13.3 0.023 0.25 0.074 0.006 < 0.002 8 21 21 0.003 1.1 1.1
< 0.01 0.19 0.22 < 0.004 0.024 19.0 0.032 0.30 0.098 0.006 < 0.002 1 3 3 0.020 1.1 1.4
< 0.01 0.13 0.14 0.004 0.024 17.2 0.027 0.28 0.092 0.010 < 0.002 4 1 1 0.009 1.0 1.8
0.02 0.16 0.20 0.010 0.020 20.0 0.030 0.32 0.110 0.007 < 0.002 23 7 4 0.005 1.1 2.3
< 0.01 0.15 0.20 0.012 0.025 18.7 0.031 0.32 0.111 0.007 < 0.002 590 90 50 0.008 1.0 1.1
< 0.01 0.17 0.20 0.005 0.014 17.0 0.029 0.29 0.101 0.007 < 0.002 80 63 46 0.007 1.4 1.4
0.01 0.27 0.33 0.008 0.036 17.6 0.030 0.32 0.110 0.010 0.002 80 130 120 0.018 1.3 1.6
< 0.01 0.13 0.25 0.010 0.021 19.6 0.031 0.32 0.112 0.006 < 0.002 140 4 4 0.008 1.3 1.6
< 0.01 0.10 0.32 0.016 0.025 21.0 0.030 0.37 0.119 0.008 < 0.002 4 5 5 0.004 1.1 1.1
0.04 0.17 0.50 0.022 0.030 20.0 0.029 0.34 0.111 0.015 0.003 5 10 10 < 0.003 1.8 1.8
< 0.01 0.13 0.34 0.014 0.060 16.2 0.025 0.31 0.091 0.013 0.003 8 17 17 < 0.003 1.1 1.1
< 0.01 0.11 0.26 0.007 0.025 16.3 0.022 0.28 0.091 0.007 < 0.002 < 1 4 4 0.023 1.0 1.3
< 0.01 0.13 0.26 0.008 0.035 14.1 0.024 0.24 0.079 0.008 < 0.002 12 70 70 0.011 1.0 1.6
< 0.01 0.17 0.25 0.004 0.011 17.3 0.030 0.25 0.085 0.007 < 0.002 2 7 6 0.021 1.4 1.6
< 0.01 0.19 0.25 0.008 0.046 16.5 0.025 0.27 0.086 0.007 < 0.002 3 12 10 0.008 1.8 1.7
cfu/100mL

Doc # 10492663 Page 23
Note: < = less than the value stated
UD = upper decile flow (long-term record 1997-2016 inclusive)
Underlined values don't comply with the "satisfactory" water quality Guidelines and Standards - Table 1
*New Zealand Standard Time
DATE TIME* FLOW BDISK COLOR COND PH TEMP DO PCDO BOD5 TURB TDS NNN NO3-N NH4-N
dd/mm/yy hh:mm m 3/s m units mS/m units 'C g/m 3 %Sat g/m 3 NTU g/m 3 g/m 3 g/m 3 g/m 3
Satisfactory Water Quality >1.6 - - 6.5-9 <12 (May-Sep) >80 - <5 - - - <0.88
Guideline/Standard <20 (Oct-Apr)
1131-143 UD = 361 m3/s (Flows from Waipapa Dam - Total)
Waikato River at Waipapa Tailrace
05/01/16 12:27 p.m. 237 2.2 35.0 16.3 7.6 20.2 9.7 108.2 0.9 1.4 126 0.117 0.113 0.01
02/02/16 11:05 a.m. 195 - 37.5 16.0 7.6 23.0 9.6 113.2 1.1 1.1 119 0.080 0.078 < 0.01
01/03/16 11:30 a.m. 223 2.5 35.0 15.3 7.5 21.8 10.1 116.1 0.9 0.9 114 0.120 0.118 0.02
05/04/16 12:35 p.m. 242 2.9 35.0 15.7 7.5 19.6 9.0 98.8 0.5 1.0 129 0.166 0.167 0.03
03/05/16 12:35 p.m. 220 2.5 35.0 17.0 7.5 17.2 9.0 93.9 0.8 0.9 122 0.220 0.220 0.02
07/06/16 12:10 p.m. 316 2.4 32.5 16.8 7.4 13.1 9.4 88.4 0.7 1.2 134 0.330 0.330 0.02
05/07/16 1:01 p.m. 258 2.2 32.5 15.5 7.3 12.2 10.3 96.1 0.9 1.2 107 0.380 0.390 0.02
02/08/16 11:57 a.m. 298 - - 14.8 7.3 11.4 10.5 97.8 0.8 1.6 119 0.310 0.310 < 0.01
06/09/16 11:48 a.m. 300 2.0 32.5 15.1 7.7 12.5 11.1 104.5 0.8 1.3 116 0.240 0.240 < 0.01
04/10/16 10:48 a.m. 375 (1.9) 40.0 15.4 7.4 14.0 11.3 111.4 0.7 1.4 108 0.200 0.200 < 0.01
01/11/16 11:04 a.m. 255 1.9 32.5 15.6 7.3 16.0 11.1 113.5 1.0 1.5 121 0.134 0.134 0.01
06/12/16 11:10 a.m. 257 3.0 37.5 14.7 7.5 18.3 9.9 105.3 0.5 1.0 112 0.174 0.169 0.02
1131-328 UD = 358 m3/s (Flows from Karapiro Dam - Total)
Waikato River at Narrows Boat Ramp
06/01/16 7:35 a.m. 145 2.5 35.0 16.0 7.7 20.4 8.6 96.3 0.8 1.8 121 0.139 0.131 < 0.01
03/02/16 7:45 a.m. 210 1.7 35.0 16.8 7.7 22.9 8.2 99.4 0.8 1.6 130 0.103 0.099 0.02
03/03/16 7:25 a.m. 238 2.4 35.0 16.0 7.3 22.2 8.1 91.2 0.8 1.2 120 0.183 0.174 0.03
06/04/16 8:32 a.m. 194 2.1 40.0 16.3 7.4 18.0 9.4 97.8 1.0 1.5 131 0.198 0.194 0.01
04/05/16 8:00 a.m. 183 2.4 37.5 16.9 7.5 16.9 9.2 93.3 0.8 1.4 130 0.300 0.300 0.03
08/06/16 8:10 a.m. 222 2.4 35.0 15.9 7.7 13.1 9.7 91.0 0.4 1.6 116 0.400 0.400 0.01
07/07/16 8:19 a.m. 209 2.2 35.0 16.4 7.4 12.1 10.1 93.2 0.8 2.5 125 0.570 0.560 0.01
03/08/16 8:45 a.m. 312 - - 14.9 7.2 11.2 10.6 96.7 0.6 3.7 122 0.650 0.640 0.02
07/09/16 8:25 a.m. 247 2.0 32.5 14.8 7.3 11.3 11.1 101.8 0.9 1.6 111 0.380 0.380 0.01
05/10/16 7:39 a.m. 331 1.2 32.5 14.3 7.4 13.9 11.7 114.7 1.1 3.7 109 0.310 0.300 < 0.01
02/11/16 7:30 a.m. 265 1.5 30.0 14.2 7.7 15.8 10.3 103.8 1.2 4.2 93 0.280 0.280 0.02
07/12/16 7:10 a.m. 196 2.4 30.0 14.9 7.2 17.9 9.5 99.2 1.0 1.3 119 0.300 0.300 0.02
1131-69 UD = 357 m3/s (Flows from Hamilton - Bridge Street Bridge)
Waikato River at Horotiu Br
06/01/16 8:16 a.m. 159 1.8 35.0 16.2 7.7 20.4 8.2 91.2 0.8 2.3 118 0.167 0.162 < 0.01
03/02/16 8:35 a.m. 234 1.4 32.5 16.9 7.6 23.1 8.2 95.8 1.0 2.2 132 0.111 0.108 < 0.01
03/03/16 8:20 a.m. 180 1.8 32.5 16.3 7.4 22.0 8.1 91.5 0.8 1.4 126 0.183 0.181 0.01
06/04/16 9:20 a.m. 174 1.9 35.0 16.1 7.5 19.8 8.9 95.5 1.0 1.8 126 0.193 0.190 < 0.01
04/05/16 9:05 a.m. 176 2.6 35.0 16.9 7.6 16.8 9.1 92.7 0.7 1.4 122 0.300 0.300 < 0.01
08/06/16 9:00 a.m. 238 2.0 32.5 15.9 7.7 13.3 9.7 91.2 0.6 1.7 118 0.410 0.410 0.01
07/07/16 9:20 a.m. 242 2.0 35.0 15.4 7.4 11.5 10.5 95.3 1.0 2.1 118 0.530 0.530 0.02
03/08/16 9:44 a.m. 338 - - 15.0 7.2 11.3 10.5 96.4 0.6 4.1 129 0.660 0.650 0.02
07/09/16 9:15 a.m. 270 1.4 32.5 15.0 7.4 12.4 11.1 102.8 0.8 2.4 109 0.380 0.380 < 0.01
05/10/16 8:20 a.m. 350 0.8 30.0 14.6 7.3 14.2 11.2 110.3 1.2 5.3 109 0.340 0.330 < 0.01
02/11/16 8:26 a.m. 248 1.4 30.0 14.3 7.6 16.0 10.0 101.3 1.2 3.6 106 0.300 0.290 0.02
07/12/16 8:31 a.m. 195 1.7 37.5 15.0 7.3 18.9 9.6 102.6 1.0 2.2 114 0.300 0.290 < 0.01
1131-77 UD = 533 m3/s (Flows from Huntly Power Station Recorder)
Waikato River at Huntly-Tainui Br
06/01/16 8:52 a.m. 210 1.1 25.0 15.6 7.7 21.0 8.2 92.8 1.4 5.3 120 0.260 0.250 < 0.01
03/02/16 9:15 a.m. 222 0.8 30.0 16.6 7.6 24.4 8.4 100.5 1.6 3.1 121 0.179 0.177 < 0.01
03/03/16 8:55 a.m. 235 1.3 32.5 16.0 7.6 21.5 8.7 96.9 2.0 3.5 122 0.200 0.200 0.02
06/04/16 10:00 a.m. 238 1.1 40.0 15.8 7.6 19.4 8.9 95.6 1.3 3.0 129 0.240 0.240 0.01
04/05/16 9:45 a.m. 200 2.1 32.5 16.8 7.6 16.7 9.3 92.9 1.3 2.5 126 0.370 0.370 0.03
08/06/16 9:30 a.m. 314 1.1 27.5 15.1 7.4 12.6 9.9 91.5 0.7 4.0 112 0.590 0.580 0.02
07/07/16 9:55 a.m. 448 0.9 27.5 14.5 7.4 10.8 10.5 94.0 0.9 6.2 109 0.890 0.880 0.02
03/08/16 10:19 a.m. 708 - - 14.4 7.1 11.5 9.9 91.2 0.8 19.5 120 1.070 1.060 0.04
07/09/16 9:45 a.m. 390 0.7 27.5 14.2 7.3 12.3 10.4 97.4 1.1 10.1 108 0.610 0.610 < 0.01
05/10/16 8:50 a.m. 596 (0.5) 25.0 12.8 7.2 14.5 9.6 95.5 1.0 15.9 103 0.950 0.940 0.03
02/11/16 9:10 a.m. 341 0.8 30.0 13.8 7.5 16.4 9.8 100.1 1.4 5.9 102 0.430 0.430 < 0.01
07/12/16 9:25 a.m. 294 1.1 37.5 14.4 7.4 19.9 9.7 105.4 1.3 4.6 111 0.340 0.340 < 0.01

Page 24 Doc # 10492663
Note: < = less than the value stated
UD = upper decile flow (long-term record 1997-2016 inclusive)
Underlined values don't comply with the "satisfactory" water quality Guidelines and Standards - Table 1
*New Zealand Standard Time
() black disk measurements taken in flows above upper decile values – don’t assess for compliance
DATE TIME* FLOW BDISK COLOR COND PH TEMP DO PCDO BOD5 TURB TDS NNN NO3-N NH4-N
dd/mm/yy hh:mm m 3/s m units mS/m units 'C g/m 3 %Sat g/m 3 NTU g/m 3 g/m 3 g/m 3 g/m 3
Satisfactory Water Quality >1.6 - - 6.5-9 <12 (May-Sep) >80 - <5 - - - <0.88
Guideline/Standard <20 (Oct-Apr)
1131-143 UD = 361 m3/s (Flows from Waipapa Dam - Total)
Waikato River at Waipapa Tailrace
05/01/16 12:27 p.m. 237 2.2 35.0 16.3 7.6 20.2 9.7 108.2 0.9 1.4 126 0.117 0.113 0.01
02/02/16 11:05 a.m. 195 - 37.5 16.0 7.6 23.0 9.6 113.2 1.1 1.1 119 0.080 0.078 < 0.01
01/03/16 11:30 a.m. 223 2.5 35.0 15.3 7.5 21.8 10.1 116.1 0.9 0.9 114 0.120 0.118 0.02
05/04/16 12:35 p.m. 242 2.9 35.0 15.7 7.5 19.6 9.0 98.8 0.5 1.0 129 0.166 0.167 0.03
03/05/16 12:35 p.m. 220 2.5 35.0 17.0 7.5 17.2 9.0 93.9 0.8 0.9 122 0.220 0.220 0.02
07/06/16 12:10 p.m. 316 2.4 32.5 16.8 7.4 13.1 9.4 88.4 0.7 1.2 134 0.330 0.330 0.02
05/07/16 1:01 p.m. 258 2.2 32.5 15.5 7.3 12.2 10.3 96.1 0.9 1.2 107 0.380 0.390 0.02
02/08/16 11:57 a.m. 298 - - 14.8 7.3 11.4 10.5 97.8 0.8 1.6 119 0.310 0.310 < 0.01
06/09/16 11:48 a.m. 300 2.0 32.5 15.1 7.7 12.5 11.1 104.5 0.8 1.3 116 0.240 0.240 < 0.01
04/10/16 10:48 a.m. 375 (1.9) 40.0 15.4 7.4 14.0 11.3 111.4 0.7 1.4 108 0.200 0.200 < 0.01
01/11/16 11:04 a.m. 255 1.9 32.5 15.6 7.3 16.0 11.1 113.5 1.0 1.5 121 0.134 0.134 0.01
06/12/16 11:10 a.m. 257 3.0 37.5 14.7 7.5 18.3 9.9 105.3 0.5 1.0 112 0.174 0.169 0.02
1131-328 UD = 358 m3/s (Flows from Karapiro Dam - Total)
Waikato River at Narrows Boat Ramp
06/01/16 7:35 a.m. 145 2.5 35.0 16.0 7.7 20.4 8.6 96.3 0.8 1.8 121 0.139 0.131 < 0.01
03/02/16 7:45 a.m. 210 1.7 35.0 16.8 7.7 22.9 8.2 99.4 0.8 1.6 130 0.103 0.099 0.02
03/03/16 7:25 a.m. 238 2.4 35.0 16.0 7.3 22.2 8.1 91.2 0.8 1.2 120 0.183 0.174 0.03
06/04/16 8:32 a.m. 194 2.1 40.0 16.3 7.4 18.0 9.4 97.8 1.0 1.5 131 0.198 0.194 0.01
04/05/16 8:00 a.m. 183 2.4 37.5 16.9 7.5 16.9 9.2 93.3 0.8 1.4 130 0.300 0.300 0.03
08/06/16 8:10 a.m. 222 2.4 35.0 15.9 7.7 13.1 9.7 91.0 0.4 1.6 116 0.400 0.400 0.01
07/07/16 8:19 a.m. 209 2.2 35.0 16.4 7.4 12.1 10.1 93.2 0.8 2.5 125 0.570 0.560 0.01
03/08/16 8:45 a.m. 312 - - 14.9 7.2 11.2 10.6 96.7 0.6 3.7 122 0.650 0.640 0.02
07/09/16 8:25 a.m. 247 2.0 32.5 14.8 7.3 11.3 11.1 101.8 0.9 1.6 111 0.380 0.380 0.01
05/10/16 7:39 a.m. 331 1.2 32.5 14.3 7.4 13.9 11.7 114.7 1.1 3.7 109 0.310 0.300 < 0.01
02/11/16 7:30 a.m. 265 1.5 30.0 14.2 7.7 15.8 10.3 103.8 1.2 4.2 93 0.280 0.280 0.02
07/12/16 7:10 a.m. 196 2.4 30.0 14.9 7.2 17.9 9.5 99.2 1.0 1.3 119 0.300 0.300 0.02
1131-69 UD = 357 m3/s (Flows from Hamilton - Bridge Street Bridge)
Waikato River at Horotiu Br
06/01/16 8:16 a.m. 159 1.8 35.0 16.2 7.7 20.4 8.2 91.2 0.8 2.3 118 0.167 0.162 < 0.01
03/02/16 8:35 a.m. 234 1.4 32.5 16.9 7.6 23.1 8.2 95.8 1.0 2.2 132 0.111 0.108 < 0.01
03/03/16 8:20 a.m. 180 1.8 32.5 16.3 7.4 22.0 8.1 91.5 0.8 1.4 126 0.183 0.181 0.01
06/04/16 9:20 a.m. 174 1.9 35.0 16.1 7.5 19.8 8.9 95.5 1.0 1.8 126 0.193 0.190 < 0.01
04/05/16 9:05 a.m. 176 2.6 35.0 16.9 7.6 16.8 9.1 92.7 0.7 1.4 122 0.300 0.300 < 0.01
08/06/16 9:00 a.m. 238 2.0 32.5 15.9 7.7 13.3 9.7 91.2 0.6 1.7 118 0.410 0.410 0.01
07/07/16 9:20 a.m. 242 2.0 35.0 15.4 7.4 11.5 10.5 95.3 1.0 2.1 118 0.530 0.530 0.02
03/08/16 9:44 a.m. 338 - - 15.0 7.2 11.3 10.5 96.4 0.6 4.1 129 0.660 0.650 0.02
07/09/16 9:15 a.m. 270 1.4 32.5 15.0 7.4 12.4 11.1 102.8 0.8 2.4 109 0.380 0.380 < 0.01
05/10/16 8:20 a.m. 350 0.8 30.0 14.6 7.3 14.2 11.2 110.3 1.2 5.3 109 0.340 0.330 < 0.01
02/11/16 8:26 a.m. 248 1.4 30.0 14.3 7.6 16.0 10.0 101.3 1.2 3.6 106 0.300 0.290 0.02
07/12/16 8:31 a.m. 195 1.7 37.5 15.0 7.3 18.9 9.6 102.6 1.0 2.2 114 0.300 0.290 < 0.01
1131-77 UD = 533 m3/s (Flows from Huntly Power Station Recorder)
Waikato River at Huntly-Tainui Br
06/01/16 8:52 a.m. 210 1.1 25.0 15.6 7.7 21.0 8.2 92.8 1.4 5.3 120 0.260 0.250 < 0.01
03/02/16 9:15 a.m. 222 0.8 30.0 16.6 7.6 24.4 8.4 100.5 1.6 3.1 121 0.179 0.177 < 0.01
03/03/16 8:55 a.m. 235 1.3 32.5 16.0 7.6 21.5 8.7 96.9 2.0 3.5 122 0.200 0.200 0.02
06/04/16 10:00 a.m. 238 1.1 40.0 15.8 7.6 19.4 8.9 95.6 1.3 3.0 129 0.240 0.240 0.01
04/05/16 9:45 a.m. 200 2.1 32.5 16.8 7.6 16.7 9.3 92.9 1.3 2.5 126 0.370 0.370 0.03
08/06/16 9:30 a.m. 314 1.1 27.5 15.1 7.4 12.6 9.9 91.5 0.7 4.0 112 0.590 0.580 0.02
07/07/16 9:55 a.m. 448 0.9 27.5 14.5 7.4 10.8 10.5 94.0 0.9 6.2 109 0.890 0.880 0.02
03/08/16 10:19 a.m. 708 - - 14.4 7.1 11.5 9.9 91.2 0.8 19.5 120 1.070 1.060 0.04
07/09/16 9:45 a.m. 390 0.7 27.5 14.2 7.3 12.3 10.4 97.4 1.1 10.1 108 0.610 0.610 < 0.01
05/10/16 8:50 a.m. 596 (0.5) 25.0 12.8 7.2 14.5 9.6 95.5 1.0 15.9 103 0.950 0.940 0.03
02/11/16 9:10 a.m. 341 0.8 30.0 13.8 7.5 16.4 9.8 100.1 1.4 5.9 102 0.430 0.430 < 0.01
07/12/16 9:25 a.m. 294 1.1 37.5 14.4 7.4 19.9 9.7 105.4 1.3 4.6 111 0.340 0.340 < 0.01

Doc # 10492663 Page 25
Note: < = less than the value stated
UD = upper decile flow (long-term record 1997-2016 inclusive)
Underlined values don't comply with the "satisfactory" water quality Guidelines and Standards - Table 1
*New Zealand Standard Time
TKN TN DRP TP CL AS B LI A340F A440F ENT FC E coli CHLA DOC TOC
g/m 3 g/m 3 g/m 3 g/m 3 g/m 3 g/m 3 g/m 3 g/m 3 /cm /cm g/m 3 g/m 3 g/m 3
- <0.5 - <0.04 - <0.01 <0.3 - - - <77 - <550 <0.02
0.15 0.27 0.016 0.030 18.4 0.025 0.25 0.089 0.011 0.002 4 15 13 0.012 1.4 2.0
0.18 0.26 0.010 0.024 17.8 0.026 0.28 0.097 0.008 < 0.002 320 43 25 0.011 1.3 1.5
0.16 0.28 0.016 0.020 15.7 0.026 0.25 0.084 0.010 0.002 14 8 8 < 0.003 1.2 1.3
0.12 0.29 0.020 0.027 15.8 0.023 0.26 0.086 0.011 0.002 3 6 5 0.004 1.3 1.4
0.14 0.36 0.021 0.025 18.6 0.027 0.29 0.099 0.009 0.002 7 3 3 0.004 1.6 1.5
0.14 0.48 0.036 0.034 18.8 0.024 0.28 0.095 0.013 0.003 13 11 9 < 0.003 1.8 1.8
0.14 0.52 0.023 0.030 17.4 0.021 0.27 0.090 0.017 0.004 7 14 14 < 0.003 1.6 1.9
0.16 0.50 0.019 0.037 15.4 0.020 0.26 0.077 0.013 0.002 9 27 25 < 0.003 1.3 1.4
0.18 0.42 0.014 0.022 14.4 0.020 0.24 0.077 0.009 < 0.002 3 5 5 0.011 1.2 1.4
0.13 0.33 0.010 0.028 16.3 0.023 0.26 0.084 0.010 0.002 9 31 25 0.009 1.3 1.4
0.25 0.39 < 0.004 0.014 16.4 0.025 0.21 0.077 0.010 < 0.002 < 1 4 4 0.018 1.4 1.8
0.15 0.32 0.012 0.028 14.0 0.021 0.22 0.070 0.008 < 0.002 1 < 1 < 1 0.004 1.0 1.8
0.13 0.25 0.012 0.022 17.9 0.023 0.26 0.091 0.010 0.002 46 220 80 0.009 1.4 1.6
0.17 0.27 0.015 0.027 18.6 0.026 0.28 0.098 0.010 0.002 110 230 200 0.009 1 1.4
0.14 0.32 0.019 0.032 16.6 0.025 0.22 0.081 0.012 0.002 59 48 48 0.005 1.4 1.8
0.16 0.36 0.014 0.026 16.5 0.022 0.22 0.076 0.012 0.002 49 50 50 0.005 1.2 1.4
0.15 0.45 0.020 0.029 17.0 0.022 0.25 0.086 0.012 0.002 400 110 100 0.004 1.6 1.3
0.11 0.51 0.025 0.032 17.2 0.022 0.25 0.088 0.013 0.002 24 27 22 < 0.003 1.4 1.4
0.17 0.74 0.020 0.035 17.0 0.016 0.21 0.072 0.026 0.005 21 21 19 < 0.003 2 2.1
0.23 0.83 0.031 0.038 15.9 0.016 0.20 0.070 0.023 0.004 27 30 30 0.004 2.2 2.4
0.16 0.54 0.013 0.028 14.8 0.017 0.20 0.066 0.012 0.002 22 26 26 0.010 1.3 1.9
0.26 0.56 0.005 0.030 14.9 0.019 0.22 0.073 0.019 0.004 70 140 120 0.026 1.9 2.4
0.27 0.55 0.008 0.029 12.9 0.021 0.19 0.059 0.013 0.002 100 60 60 0.014 1.4 1.7
0.23 0.53 0.012 0.023 14.7 0.020 0.20 0.067 0.012 0.002 60 100 50 0.006 1.1 2.1
0.14 0.31 0.020 0.030 18.2 0.023 0.26 0.092 0.011 0.002 19 280 80 0.009 1.3 1.4
0.24 0.35 0.016 0.025 18.8 0.027 0.28 0.097 0.010 < 0.002 150 290 230 0.012 1.6 1.5
0.14 0.32 0.021 0.033 17.0 0.026 0.23 0.083 0.012 0.003 80 80 80 0.006 1.4 1.5
0.14 0.33 0.018 0.034 16.6 0.024 0.24 0.082 0.011 0.002 47 120 110 0.005 1.3 1.5
0.15 0.45 0.021 0.030 17.1 0.023 0.26 0.090 0.011 0.002 70 150 80 0.003 1.4 1.4
0.14 0.55 0.027 0.036 17.9 0.023 0.26 0.087 0.012 0.002 39 60 44 0.004 1.6 1.7
0.15 0.68 0.026 0.036 16.7 0.019 0.25 0.082 0.018 0.004 18 25 19 0.004 1.9 2.0
0.25 0.91 0.038 0.054 16.3 0.016 0.21 0.069 0.026 0.005 38 150 130 0.004 3.4 2.9
0.16 0.54 0.016 0.033 15.0 0.017 0.21 0.065 0.013 0.003 24 56 56 0.011 1.6 1.8
0.26 0.60 0.013 0.042 15.1 0.018 0.23 0.073 0.022 0.004 120 330 250 0.017 2.0 2.6
0.27 0.57 0.012 0.031 13.1 0.021 0.18 0.059 0.012 0.002 36 56 45 0.016 1.6 2.1
0.22 0.52 0.014 0.029 14.8 0.021 0.20 0.065 0.012 0.002 30 130 130 0.013 1.2 1.9
0.20 0.46 0.026 0.048 16.7 0.019 0.22 0.075 0.019 0.004 21 60 50 0.012 1.7 2.2
0.23 0.41 0.019 0.033 18.1 0.023 0.26 0.088 0.014 0.003 60 280 230 0.010 2.0 1.8
0.36 0.56 0.021 0.037 16.3 0.020 0.20 0.069 0.016 0.003 32 100 90 0.009 1.6 1.9
0.19 0.43 0.022 0.040 16.2 0.021 0.22 0.072 0.014 0.003 65 120 100 0.005 1.5 1.4
0.21 0.58 0.026 0.036 17.0 0.021 0.24 0.080 0.014 0.003 45 80 70 0.004 1.8 1.7
0.18 0.77 0.028 0.043 16.3 0.016 0.20 0.066 0.015 0.003 70 40 30 < 0.003 1.7 1.7
0.18 1.07 0.022 0.040 15.7 0.012 0.17 0.057 0.022 0.004 27 50 50 0.005 2.1 2.4
0.59 1.66 0.033 0.083 14.9 0.010 0.13 0.040 0.043 0.007 250 460 370 0.004 3.8 4.9
0.27 0.88 0.020 0.050 14.0 0.012 0.15 0.046 0.023 0.005 23 600 500 0.009 2.1 2.5
0.44 1.39 0.023 0.130 12.9 0.008 0.11 0.032 0.050 0.009 100 1300 1300 0.010 4.2 4.5
0.34 0.77 0.016 0.042 12.8 0.017 0.15 0.048 0.019 0.004 22 60 50 0.015 2.2 2.2
0.25 0.59 0.012 0.043 14.4 0.016 0.17 0.053 0.019 0.004 56 250 250 0.017 2.2 3.9
cfu/100mL

Page 26 Doc # 10492663
Note: < = less than the value stated
UD = upper decile flow (long-term record 1997-2016 inclusive)
Underlined values don't comply with the "satisfactory" water quality Guidelines and Standards - Table 1
*New Zealand Standard Time
() black disk measurements taken in flows above upper decile values – don’t assess for compliance
DATE TIME* FLOW BDISK COLOR COND PH TEMP DO PCDO BOD5 TURB TDS NNN NO3-N NH4-N
dd/mm/yy hh:mm m 3/s m units mS/m units 'C g/m 3 %Sat g/m 3 NTU g/m 3 g/m 3 g/m 3 g/m 3
Satisfactory Water Quality >1.6 - - 6.5-9 <12 (May-Sep) >80 - <5 - - - <0.88
Guideline/Standard <20 (Oct-Apr)
1131-91 UD = 621 m3/s (Flows from Mercer Bridge Recorder)
Waikato River at M ercer Br
06/01/16 9:43 a.m. 230 - - 15.2 7.8 21.1 8.5 96.2 1.2 5.9 107 0.220 0.220 < 0.01
03/02/16 10:25 a.m. 213 - - 16.9 7.8 25.6 8.8 107.7 1.9 5.2 129 0.156 0.154 < 0.01
03/03/16 9:45 a.m. 253 - - 16.5 7.6 21.6 8.9 98.9 1.9 7.7 126 0.198 0.195 < 0.01
06/04/16 10:45 a.m. 271 - - 16.0 7.7 19.1 9.2 98.3 1.0 4.0 126 0.250 0.240 < 0.01
04/05/16 10:45 a.m. 269 - - 16.7 7.6 17.2 9.3 95.7 1.8 2.4 125 0.330 0.330 < 0.01
08/06/16 10:35 a.m. 309 - - 16.0 7.3 12.8 9.6 89.6 1.5 9.2 115 0.610 0.610 0.06
07/07/16 10:42 a.m. 545 - - 15.6 7.3 11.1 9.8 88.0 0.9 9.4 115 0.930 0.930 0.02
03/08/16 11:07 a.m. 781 - - 14.8 7.1 11.8 9.7 89.9 0.8 15.9 136 1.140 1.140 0.03
07/09/16 11:00 a.m. 410 - - 14.9 7.4 13.2 10.0 94.6 1.3 14.3 116 0.640 0.640 < 0.01
05/10/16 9:30 a.m. 709 - - 14.0 7.1 15.2 9.1 90.9 1.4 20.0 112 0.800 0.790 0.02
02/11/16 10:02 a.m. 344 - - 14.4 7.5 16.8 9.5 98.1 0.8 13.5 105 0.440 0.440 < 0.01
07/12/16 10:12 a.m. 297 - - 14.9 7.5 20.3 10.2 112.0 2.1 7.0 129 0.270 0.260 < 0.01
1131-133 UD = 621 m3/s (Flows from Mercer Bridge Recorder)
Waikato River at Tuakau Br
06/01/16 10:08 a.m. 231 1.0 25.0 15.3 7.8 21.6 8.9 101.4 1.4 4.9 111 0.250 0.240 < 0.01
03/02/16 10:56 a.m. 211 0.7 30.0 16.9 8.0 25.7 9.7 119.0 2.0 6.2 130 0.094 0.092 < 0.01
03/03/16 10:20 a.m. 253 0.9 30.0 16.4 7.6 22.6 8.8 100.2 1.3 5.5 130 0.199 0.197 < 0.01
06/04/16 11:10 a.m. 279 1.4 32.5 16.1 7.9 19.9 9.0 97.9 1.2 2.5 130 0.250 0.250 < 0.01
04/05/16 11:05 a.m. 267 1.6 30.0 16.8 7.7 17.8 9.4 97.1 0.9 2.2 127 0.330 0.330 < 0.01
08/06/16 11:00 a.m. 309 0.7 34.0 16.3 7.3 12.9 9.6 89.1 1.0 9.4 116 0.690 0.690 0.03
07/07/16 11:15 a.m. 543 0.7 25.0 16.2 7.2 11.1 8.9 79.9 1.4 13.0 125 0.970 0.960 0.05
03/08/16 11:32 a.m. 782 - - 15.0 7.0 11.8 9.0 83.6 0.8 14.1 124 1.120 1.110 0.02
07/09/16 11:25 a.m. 410 0.2 25.0 15.2 7.3 13.6 9.7 92.4 1.5 22.0 110 0.610 0.610 < 0.01
05/10/16 10:48 a.m. 707 (0.4) 25.0 14.1 7.0 15.7 8.6 87.4 1.5 21.0 114 0.770 0.760 0.02
02/11/16 10:38 a.m. 345 0.3 25.0 14.4 7.5 16.9 9.4 96.7 1.6 15.6 108 0.410 0.400 < 0.01
07/12/16 11:32 a.m. 297 0.5 25.0 14.9 7.7 21.2 11.0 122.6 2.1 8.7 112 0.220 0.220 < 0.01

Doc # 10492663 Page 27
Note: < = less than the value stated
UD = upper decile flow (long-term record 1996-2015 inclusive)
Underlined values don't comply with the "satisfactory" water quality Guidelines and Standards - Table 1
*New Zealand Standard Time
TKN TN DRP TP CL AS B LI A340F A440F ENT FC E coli CHLA DOC TOC
g/m 3 g/m 3 g/m 3 g/m 3 g/m 3 g/m 3 g/m 3 g/m 3 /cm /cm g/m 3 g/m 3 g/m 3
- <0.5 - <0.04 - <0.01 <0.3 - - - <77 - <550 <0.02
0.18 0.40 0.016 0.040 16.3 0.015 0.19 0.064 0.021 0.004 7 80 70 0.019 1.7 2.2
0.28 0.44 0.008 0.035 17.9 0.020 0.24 0.079 0.014 < 0.002 40 60 60 0.024 2.2 2.1
0.41 0.61 0.018 0.044 16.9 0.019 0.20 0.066 0.021 0.004 60 100 80 0.014 2.2 2.7
0.19 0.44 0.022 0.046 16.5 0.020 0.22 0.072 0.014 0.003 33 120 110 0.005 1.3 1.6
0.15 0.48 0.026 0.037 17.3 0.021 0.24 0.082 0.014 0.003 52 120 50 0.005 1.7 1.8
0.48 1.09 0.007 0.052 17.4 0.014 0.18 0.054 0.034 0.006 33 50 50 0.009 3.9 4.4
0.30 1.23 0.021 0.039 16.2 0.011 0.17 0.052 0.035 0.006 22 60 60 0.004 3.8 4.0
0.40 1.54 0.033 0.077 15.5 0.009 0.12 0.038 0.047 0.008 47 250 250 < 0.003 4.3 4.8
0.37 1.01 0.018 0.060 15.3 0.011 0.15 0.042 0.032 0.006 12 380 380 0.012 2.7 3.7
0.57 1.37 0.022 0.096 13.8 0.009 0.13 0.037 0.068 0.012 120 1600 1400 0.018 5.3 6.3
0.31 0.75 0.012 0.057 13.3 0.015 0.15 0.044 0.025 0.005 8 58 58 0.021 2.1 2.9
0.33 0.60 0.007 0.052 15.1 0.016 0.19 0.054 0.021 0.004 9 100 50 0.037 2.0 2.9
0.23 0.48 0.018 0.040 16.8 0.016 0.19 0.062 0.021 0.004 8 40 34 0.017 1.6 2.6
0.34 0.43 0.006 0.034 18.0 0.019 0.24 0.078 0.005 < 0.002 40 60 60 0.029 2.4 2.1
0.21 0.41 0.018 0.038 17.2 0.018 0.20 0.068 0.022 0.004 39 80 60 0.013 2.3 2.4
0.16 0.41 0.022 0.039 16.7 0.020 0.23 0.075 0.013 0.002 41 60 60 0.006 1.4 2.0
0.19 0.52 0.022 0.034 17.0 0.021 0.25 0.082 0.013 0.003 160 180 150 < 0.003 1.8 1.7
0.34 1.03 0.012 0.052 17.1 0.013 0.17 0.049 0.028 0.005 46 57 53 0.007 3.1 3.7
0.49 1.46 0.013 0.064 17.0 0.010 0.15 0.045 0.060 0.012 22 60 60 0.007 5.0 5.9
0.59 1.71 0.029 0.070 16.0 0.008 0.11 0.036 0.055 0.010 44 170 130 0.004 4.9 5.4
0.47 1.08 0.013 0.081 15.7 0.012 0.14 0.042 0.036 0.007 7 380 380 0.018 3.1 3.9
0.54 1.31 0.020 0.100 13.9 0.008 0.11 0.031 0.077 0.014 110 600 500 0.021 5.9 7.0
0.54 0.95 0.012 0.064 13.5 0.016 0.14 0.045 0.031 0.006 20 70 70 0.026 2.5 3.5
0.41 0.63 0.005 0.052 15.3 0.016 0.18 0.054 0.024 0.005 16 110 60 0.045 1.8 3.4
cfu/100mL

Page 28 Doc # 10492663
3.2 Waikato River monitoring programme
Bathing season microbiological survey
Summary statistics
Comparison with water quality standards
Parameter graph
Raw data

Doc # 10492663 Page 29
Table 5: Bathing season median E. coli bacteria.
Table 6: Year 2016/17 bathing season E. coli survey results complying with the “Satisfactory” and
“Excellent” water quality guidelines. n = 12 (except * where n = 13).
BATHING SEASON MEDIAN 5 Season
Location Name 06/07 08/09 10/11 12/13 16/17 Median
Taupo Gates 2 3 8 6 6 6
Huka Falls 8 13 15 9 16 13
Ohaaki Bridge 16 41 19 18 32 19
Ohakuri Tailrace Br 2 3 3 3 3 3
Whakamaru Tailrace 6 10 18 8 8 8
Waipapa Tailrace 6 6 7 6 7 6
Lake Karapiro Boatramp 8 25 45 30 125 30
Narrows Br 55 83 60 34 60 60
Wellington Street Beach 84 80 80 43 70 80
Sewer Br Alandale 100 120 130 70 130 120
Horotiu Br 150 120 110 64 90 110
Ngaruawahia Br 140 120 240 65 110 120
Huntly-Tainui Br 150 160 160 75 140 150
Mercer Br 85 115 160 48 80 85
Tuakau Br 50 105 80 41 60 60
Maraetai Bay - - 20 22 27 22
Waipa River (Ngaruawahia Br) 90 130 100 52 105 100
E. coli E. coli E. coli E. coli
Location Name Samples < 550 Median <126 Samples < 55 Median <23
Taupo Gates 13* Y* 13* Y*
Huka Falls 12 Y 12 Y
Ohaaki Bridge 13* Y* 9* N*
Ohakuri Tailrace Br 13* Y* 13* Y*
Whakamaru Tailrace 13* Y* 13* Y*
Waipapa Tailrace 13* Y* 13* Y*
Lake Karapiro Boatramp 12 Y 4 N
Narrows Br 13* Y* 6* N*
Wellington Street Beach 12 Y 3 N
Sewer Br Alandale 12 N 2 N
Horotiu Br 12 Y 1 N
Ngaruawahia Br 12 Y 1 N
Huntly-Tainui Br 12 N 2 N
Mercer Br 12 Y 3 N
Tuakau Br 12 Y 4 N
Maraetai Bay 12 Y 11 N
Waipa River (Ngaruawahia Br) 12 Y 3 N
HUMAN USES - RECREATION
SATISFACTORY EXCELLENT

Page 30 Doc # 10492663
Figure 2: E. coli - five years of bathing season data
Taupo
Huka F
alls
Ohaaki
Ohakuri
Whakam
aru
Waip
apa
L.K
ara
piro
Narr
ow
s B
r
Welli
ngto
n S
tr B
ch
Sew
er
Bridge
Horo
tiu B
r
Ngaru
aw
ahia
Br
Huntly
Br
Merc
er
Br
Tuakau B
r
0.9
5.0
10.0
90.0
500.0
1000.0
9000.0
Bacte
rial c
ount (n
/100m
l)
upper limit guideline value (550) for direct contact recreation use (based on MfE 2003)
guideline median (126) for direct contact recreation use (MfE 1999)
16/17 summer survey median
5 bathing season median

Doc # 10492663 Page 31
Bathing season raw data
DATE EColi ENT FC DATE EColi ENT FC DATE EColi ENT FC
c/100ml c/100ml c/100ml c/100ml c/100ml c/100ml c/100ml c/100ml c/100ml
Taupo Control Gates Lake Karapiro Boatramp Huntly-Tainui Bridge
6/12/16 6 1 8 6/12/16 230 52 270 7/12/16 250 56 250
12/12/16 14 6 16 12/12/16 150 170 160 13/12/16 50 24 70
19/12/16 6 2 6 19/12/16 310 480 470 20/12/16 140 67 140
4/01/17 12 12 17 4/01/17 90 44 100 5/01/17 140 40 140
9/01/17 2 3 3 9/01/17 160 80 160 10/01/17 40 90 50
16/01/17 3 2 3 16/01/17 230 220 230 17/01/17 190 90 190
23/01/17 7 2 7 23/01/17 32 9 34 24/01/17 90 40 100
31/01/17 3 9 3 31/01/17 100 18 100 1/02/17 70 32 110
7/02/17 4 1 4 7/02/17 16 40 20 8/02/17 200 70 200
13/02/17 1 2 1 13/02/17 25 100 29 14/02/17 100 38 100
20/02/17 1 18 1 20/02/17 270 130 270 21/02/17 150 46 170
27/02/17 6 3 7 27/02/17 5 2 6 1/03/17 260 140 270
7/03/17 17 9 22
Median 125 66 130 Median 140 51 140
Median 6 3 6
Narrows Boat Ramp Mercer Bridge
Huka Falls 7/12/16 50 60 100 7/12/16 50 9 100
6/12/16 5 7 7 12/12/16 80 45 100 13/12/16 60 4 70
12/12/16 6 6 7 19/12/16 170 16 190 20/12/16 110 12 130
19/12/16 12 13 18 5/01/17 40 47 75 5/01/17 70 15 80
4/01/17 15 14 18 9/01/17 50 45 80 10/01/17 40 17 40
9/01/17 7 4 12 16/01/17 130 210 170 17/01/17 150 40 170
16/01/17 20 20 24 23/01/17 110 90 130 24/01/17 30 12 30
23/01/17 16 3 20 1/02/17 60 39 80 1/02/17 90 39 90
31/01/17 40 15 48 7/02/17 100 48 110 8/02/17 200 6 200
7/02/17 16 14 27 13/02/17 20 35 30 14/02/17 100 110 130
13/02/17 17 13 21 20/02/17 130 56 160 21/02/17 200 34 200
20/02/17 22 30 25 27/02/17 36 39 36 1/03/17 50 24 60
27/02/17 41 39 43 1/03/17 50 40 70
Median 80 16 95
Median 16 14 21 Median 60 45 100
Tuakau Bridge
Ohaaki Bridge Wellington Street Beach 7/12/16 60 16 110
6/12/16 35 13 35 7/12/16 50 22 80 13/12/16 21 13 27
12/12/16 9 7 11 13/12/16 100 70 100 20/12/16 50 10 50
19/12/16 70 24 90 20/12/16 90 47 90 5/01/17 120 17 120
4/01/17 60 34 80 5/01/17 70 31 100 10/01/17 60 260 60
9/01/17 12 8 16 10/01/17 70 32 70 17/01/17 40 10 60
16/01/17 16 22 18 17/01/17 60 90 80 24/01/17 42 24 44
23/01/17 9 16 15 24/01/17 90 55 90 1/02/17 60 9 80
31/01/17 80 80 100 1/02/17 50 30 90 8/02/17 130 51 170
7/02/17 70 120 80 8/02/17 60 36 70 14/02/17 90 45 100
13/02/17 40 56 41 14/02/17 50 42 340 21/02/17 90 34 100
20/02/17 20 61 30 21/02/17 160 73 200 1/03/17 100 40 100
27/02/17 17 90 17 1/03/17 70 110 70
7/03/17 32 150 37 Median 60 21 90
Median 70 45 90
Median 32 34 35
Sewer Bridge Alandale
Ohakuri Tailrace Bridge 7/12/16 150 38 200
6/12/16 1 4 1 13/12/16 50 49 130
12/12/16 3 3 4 20/12/16 80 66 100
19/12/16 4 1 4 5/01/17 130 100 130
4/01/17 3 1 3 10/01/17 140 70 150
9/01/17 7 5 10 17/01/17 160 50 160
16/01/17 6 6 6 24/01/17 130 45 140
23/01/17 2 9 2 1/02/17 30 50 80
31/01/17 2 1 2 8/02/17 100 49 110
7/02/17 3 1 3 14/02/17 70 41 120
13/02/17 5 5 7 21/02/17 250 150 260
20/02/17 9 11 10 1/03/17 190 220 190
27/02/17 10 5 11
7/03/17 1 3 3 Median 130 50 135
Median 3 4 4 Horotiu Bridge Port Waikato @ Maraetai Bay
7/12/16 130 30 130 7/12/16 35 9 35
Whakamaru Tailrace 13/12/16 100 53 150 13/12/16 15 13 15
6/12/16 10 3 12 20/12/16 160 70 200 20/12/16 10 < 1 10
12/12/16 5 1 5 5/01/17 80 230 150 5/01/17 25 6 25
19/12/16 13 7 14 10/01/17 70 37 90 10/01/17 5 5 5
4/01/17 35 48 35 17/01/17 170 80 170 17/01/17 30 30 50
9/01/17 2 4 2 24/01/17 50 49 60 24/01/17 29 4 31
16/01/17 5 4 5 1/02/17 60 43 110 1/02/17 18 13 30
23/01/17 8 13 10 8/02/17 80 51 110 8/02/17 13 80 16
42766.4 2 4 2 14/02/17 60 36 110 14/02/17 30 630 30
42773.5 13 28 13 21/02/17 240 100 240 21/02/17 50 32 60
13/02/17 5 42 6 1/03/17 160 270 170 1/03/17 200 22 200
20/02/17 40 39 50
27/02/17 6 26 6 Median 90 52 140 Median 27 13 30
7/03/17 12 20 13
Ngaruawahia Bridge Waipa River @ Ngaruawahia
Median 8 13 10 7/12/16 170 130 170 7/12/16 220 23 220
13/12/16 100 60 120 13/12/16 380 34 430
Waipapa Tailrace 20/12/16 140 110 160 20/12/16 50 22 70
6/12/16 < 1 1 < 1 5/01/17 350 80 350 5/01/17 100 50 150
12/12/16 6 6 6 10/01/17 110 31 140 10/01/17 40 25 40
19/12/16 3 3 3 17/01/17 120 110 150 17/01/17 130 100 150
4/01/17 15 6 20 24/01/17 40 38 50 24/01/17 150 63 220
9/01/17 5 2 5 1/02/17 60 41 130 1/02/17 90 27 90
16/01/17 22 3 22 8/02/17 110 41 130 8/02/17 60 70 80
23/01/17 40 22 50 14/02/17 110 51 190 14/02/17 38 47 52
31/01/17 5 43 6 21/02/17 220 100 220 21/02/17 110 28 150
7/02/17 3 11 3 1/03/17 110 150 130 1/03/17 120 330 140
13/02/17 3 19 3
20/02/17 30 70 50 Median 110 70 145 Median 105 41 145
27/02/17 10 8 12
7/03/17 7 9 10
Median 7 8 8

Page 32 Doc # 10492663
References Smith P 2006. Waikato River water quality monitoring programme data report 2005.
Environment Waikato Technical Report 2006/34. Hamilton, Waikato Regional Council (Environment Waikato)
Tulagi A 2016. Waikato River water quality monitoring programme data report 2015. Waikato
Regional Council Technical Report 2016/33. Hamilton, Waikato Regional Council Tulagi A 2013. Waikato River water quality monitoring programme data report 2012. Waikato
Regional Council Technical Report 2013/12. Hamilton, Waikato Regional Council Tulagi A 2012. Waikato River water quality monitoring programme data report 2011. Waikato
Regional Council Technical Report 2012/22R. Hamilton, Waikato Regional Council Vant B 2013. Trends in river water quality in the Waikato region, 1993-2012. Waikato Regional
Council Technical Report 2013/20, Hamilton, Waikato Regional Council
Doc # 10492663 Page 33
Appendix I:
Flow information

Page 34 Doc # 10492663
Median Flows of the Waikato River and Main Tributaries
DISTANCE 10 YEAR
Location km 2007 2008 2009 2010 2011 2012 2013 2014 2015 2016 Median
Taupo 4.2 130 129 134 104 185 194 93 99 104 117 123
Ohakuri 75.8 157 163 162 192 225 229 163 163 184 190 174
Whakamaru 105.0 178 186 196 209 242 232 168 167 189 206 192
Waipapa 126.1 190 211 194 198 250 245 175 171 186 205 196
Hamilton 211.5 219 220 224 205 241 261 177 195 201 228 220
Huntly 246.5 278 273 301 296 339 346 263 260 281 285 283
Mercer 286.3 313 302 334 304 341 358 286 280 302 314 308
Waiotapu Stm 46.6 2.8 3.0 2.7 3.3 3.8 3.5 2.5 2.4 2.6 2.8 3
Waipa River 232.7 34 43 53 41 61 62 47 55 53 59 53
+Rating curve errors mean estimates of flow are ± 8%
+Historical f low data updated due to rating changes from updated data received
FLOW RATE+ (m 3/s)
Flow
Taupo Ohaaki Ohakuri Whakamaru Waipapa Hamilton Huntly Mercer0
100
200
300
400
500
Flo
w (
m3/s
)
Yearly Flow Record (Median) at Taupo, Hamilton and Mercer
20
07
20
08
20
09
20
10
20
11
20
12
20
13
20
14
20
15
20
16
Year
0
100
200
300
400
500
600
Flo
w (
m3/s
)
2007-2016 median
2016 median
Taupo
Hamilton
Mercer

Doc # 10492663 Page 35
Appendix II
Datasonde deployments
Diurnal variation of selected water quality parameters

Page 36 Doc # 10492663
15
16
17
18
19
20
21
22
23
24
25
1/0
3/1
6
5/0
3/1
6
10/0
3/1
6
15/0
3/1
6
20/0
3/1
6
24/0
3/1
6
29/0
3/1
6
3/0
4/1
6
8/0
4/1
6
13/0
4/1
6
17/0
4/1
6
22/0
4/1
6
27/0
4/1
6
2/0
5/1
6
6/0
5/1
6
11/0
5/1
6
16/0
5/1
6
21/0
5/1
6
26/0
5/1
6
30/0
5/1
6
Tem
pera
ture
(0C
)
Date
Temperature: Upper Waikato (March - May)
Ohaakid/s Huka Falls
Standard <20oC (Oct-Apr)
Standard <12oC (May-Sept)

Doc # 10492663 Page 37
6.5
7
7.5
8
8.5
9
1/0
3/2
01
6
5/0
3/2
01
6
10/0
3/2
01
6
15/0
3/2
01
6
20/0
3/2
01
6
24/0
3/2
01
6
29/0
3/2
01
6
3/0
4/2
01
6
8/0
4/2
01
6
13/0
4/2
01
6
17/0
4/2
01
6
22/0
4/2
01
6
27/0
4/2
01
6
2/0
5/2
01
6
6/0
5/2
01
6
11/0
5/2
01
6
16/0
5/2
01
6
21/0
5/2
01
6
26/0
5/2
01
6
30/0
5/2
01
6
pH
Date
pH: Upper Waikato (March - May)
Ohaaki
d/s Huka Falls
Standard <9.0
Standard >6.5

Page 38 Doc # 10492663
80
85
90
95
100
105
110
115
120
125
130
1/0
3/1
6
5/0
3/1
6
10/0
3/1
6
15/0
3/1
6
20/0
3/1
6
24/0
3/1
6
29/0
3/1
6
3/0
4/1
6
8/0
4/1
6
13/0
4/1
6
17/0
4/1
6
22/0
4/1
6
27/0
4/1
6
2/0
5/1
6
6/0
5/1
6
11/0
5/1
6
16/0
5/1
6
21/0
5/1
6
26/0
5/1
6
30/0
5/1
6
Dis
so
lved
Oxyg
en
(%
satu
rati
on
)
Date
Dissolved Oxygen, % saturation: Upper Waikato (March - May)
d/s Huka Falls
Standard >80%
Ohaaki

Doc # 10492663 Page 39
10
12
14
16
18
20
22
24
26
28
1/0
1/1
6
11/0
1/1
6
21/0
1/1
6
31/0
1/1
6
10/0
2/1
6
20/0
2/1
6
1/0
3/1
6
11/0
3/1
6
21/0
3/1
6
31/0
3/1
6
10/0
4/1
6
20/0
4/1
6
30/0
4/1
6
10/0
5/1
6
20/0
5/1
6
30/0
5/1
6
9/0
6/1
6
19/0
6/1
6
29/0
6/1
6
Tem
pera
ture
(oC
)
Date
Temperature: Lower Waikato (January - June)
Standard <20oC (Oct-Apr)
Standard <12oC (May-Sep)
Hamilton
Tuakau

Page 40 Doc # 10492663
5.5
6.0
6.5
7.0
7.5
8.0
8.5
9.0
9.5
1/0
1/2
01
6
11/0
1/2
01
6
21/0
1/2
01
6
31/0
1/2
01
6
10/0
2/2
01
6
20/0
2/2
01
6
1/0
3/2
01
6
11/0
3/2
01
6
21/0
3/2
01
6
31/0
3/2
01
6
10/0
4/2
01
6
20/0
4/2
01
6
30/0
4/2
01
6
10/0
5/2
01
6
20/0
5/2
01
6
30/0
5/2
01
6
9/0
6/2
01
6
19/0
6/2
01
6
29/0
6/2
01
6
pH
Date
pH: Lower Waikato (January - June)
Standard >6.5
Standard <9.0
Tuakau
Hamilton

Doc # 10492663 Page 41
50
70
90
110
130
150
170
1900
1/0
1/1
6
11/0
1/1
6
21/0
1/1
6
31/0
1/1
6
10/0
2/1
6
20/0
2/1
6
01/0
3/1
6
11/0
3/1
6
21/0
3/1
6
31/0
3/1
6
10/0
4/1
6
20/0
4/1
6
30/0
4/1
6
10/0
5/1
6
20/0
5/1
6
30/0
5/1
6
09/0
6/1
6
19/0
6/1
6
29/0
6/1
6
Dis
so
lved
Oxyg
en
(%
satu
rati
on
)
Date
Dissolved Oxygen (% saturation): Lower Waikato (January - June)
Standard >80%
Tuakau
Hamilton

Page 42 Doc # 10492663
0.00
0.01
0.02
0.03
0.04
0.05
0.06
0.07
0.080
1/0
1/1
6
11/0
1/1
6
21/0
1/1
6
31/0
1/1
6
10/0
2/1
6
20/0
2/1
6
01/0
3/1
6
11/0
3/1
6
21/0
3/1
6
31/0
3/1
6
10/0
4/1
6
20/0
4/1
6
30/0
4/1
6
10/0
5/1
6
20/0
5/1
6
30/0
5/1
6
09/0
6/1
6
19/0
6/1
6
29/0
6/1
6
Ch
loro
ph
yll a
(g
/m3)
Date
Chlorophyll a: Lower Waikato (January - June)
Standard <0.02
Hamilton
Tuakau

Doc # 10492663 Page 43
7
9
11
13
15
17
19
21
23
25
1/0
7/1
6
11/0
7/1
6
21/0
7/1
6
31/0
7/1
6
10/0
8/1
6
20/0
8/1
6
30/0
8/1
6
9/0
9/1
6
19/0
9/1
6
29/0
9/1
6
9/1
0/1
6
19/1
0/1
6
29/1
0/1
6
8/1
1/1
6
18/1
1/1
6
28/1
1/1
6
8/1
2/1
6
18/1
2/1
6
28/1
2/1
6
Tem
pera
ture
(oC
)
Date
Temperature: Lower Waikato (July - December)
Standard <20oC (Oct-Apr)
Standard <12oC (May-Sep)
Hamilton
Tuakau

Page 44 Doc # 10492663
6.0
6.5
7.0
7.5
8.0
8.5
9.0
9.5
01/0
7/1
6
11/0
7/1
6
21/0
7/1
6
31/0
7/1
6
10/0
8/1
6
20/0
8/1
6
30/0
8/1
6
09/0
9/1
6
19/0
9/1
6
29/0
9/1
6
09/1
0/1
6
19/1
0/1
6
29/1
0/1
6
08/1
1/1
6
18/1
1/1
6
28/1
1/1
6
08/1
2/1
6
18/1
2/1
6
28/1
2/1
6
pH
Date
pH: Lower Waikato (July - December)
Hamilton
Standard >6.5
Standard <9.0
Tuakau

Doc # 10492663 Page 45
60
70
80
90
100
110
120
130
140
150
01/0
7/1
6
11/0
7/1
6
21/0
7/1
6
31/0
7/1
6
10/0
8/1
6
20/0
8/1
6
30/0
8/1
6
09/0
9/1
6
19/0
9/1
6
29/0
9/1
6
09/1
0/1
6
19/1
0/1
6
29/1
0/1
6
08/1
1/1
6
18/1
1/1
6
28/1
1/1
6
08/1
2/1
6
18/1
2/1
6
28/1
2/1
6
Dis
so
lved
Oxyg
en
(%
satu
rati
on
)
Date
Dissolved Oxygen (% saturation): Lower Waikato (July - December)
Standard >80%
Tuakau
Hamilton

Page 46 Doc # 10492663
0.00
0.01
0.02
0.03
0.04
0.05
0.060
1/0
7/1
6
11/0
7/1
6
21/0
7/1
6
31/0
7/1
6
10/0
8/1
6
20/0
8/1
6
30/0
8/1
6
09/0
9/1
6
19/0
9/1
6
29/0
9/1
6
09/1
0/1
6
19/1
0/1
6
29/1
0/1
6
08/1
1/1
6
18/1
1/1
6
28/1
1/1
6
08/1
2/1
6
18/1
2/1
6
28/1
2/1
6
Ch
loro
ph
yll a
(g
/m3)
Date
Chlorophyll a: Lower Waikato (July - December)
Standard <0.02
Hamilton
Tuakau
Doc # 10492663 Page 47
Appendix III:
Water quality parameters
Guidelines and standards
Analytical methods

Page 48 Doc # 10492663
Waikato River water quality monitoring programme parameters
Water quality parameter
Reason for monitoring Parameter monitored1
Comments2
Dissolved oxygen - requirement for aquatic life
- indicator of organic pollution
- indicator of photosynthesis (plant growth)
DO (conc.)
DO (%sat.)
routine (field)
routine (field)
Temperature - indicator of biological activity
- requirement for aquatic life
- mixing processes
- modelling studies (e.g. nutrient uptake)
Temperature routine (field)
Conductivity - indicator of total salts dissolved in water
- indicator for geothermal input
Conductivity
TDS
routine
routine
pH - aquatic life protection
- indicator of industrial discharges, mining
pH routine
Clarity
- turbidity
- black disk
(visual clarity)
- aesthetic appearance
- light availability for excessive plant growth
- aquatic life protection
- indicator of catchment condition, land use
Turbidity
Black disk
routine
routine (field)
Colour
- light absorption - aesthetic appearance
- light availability for excessive plant growth
- indicator of presence of organic matter
Munsell colour
Absorbance at:
340,440,780nm
routine (field)
routine
Nutrients (N and P)
chlorophyll a
- enrichment, excessive plant growth
- nutrient limitation for plant/algal growth
NO3-N+NO2-N
NH4-N,TKN
DRP, TP, Chl a
routine
Geothermal contaminants
- indicators of geothermal inflows
- aquatic life protection (ecotoxicity)
- drinking water (human health aspects)
Cl, Li, B, As
routine
Organic carbon - indicator of organic pollution
- catchment characteristics
BOD5
TOC/DOC
routine
routine
Faecal bacteria
- E. coli
- enterococci
- faecal coliforms
- indicator of pollution with faecal matter
- disease risk for swimming etc.
E. Coli
ENT
FC
routine
routine
routine
1 see the page 49 for the meaning of the abbreviations. 2 routine means sampled monthly.

Doc # 10492663 Page 49
Details of water quality standards and guidelines for “satisfactory” water quality
Parameter Critical value(s) Source
Dissolved oxygen >80% of saturation concentration
RMA Third Schedule, Classes AE, F, and FS.
pH 6.5–9 ANZECC (1992) and Canadian guidelines for freshwater aquatic life (1987).
Turbidity <5 NTU Studies of adverse effects on underwater light—and thus on plant and invertebrate production—in certain South Island streams (Davies-Colley 1991).
Ammoniacal-nitrogen
<0.88 g/m3 USEPA (1998) value for 1-hour exposure at pH 9.
Temperature <12°C (May – Sep) <20°C (Oct – Apr)
Waikato Regional Council Proposed Regional Plan standards for trout fisheries and trout spawning (1998).
Total phosphorus <0.04 g/m3 From upper quartile values for 77 New Zealand rivers in NIWA’s National Water Quality Network (after Smith & Maasdam 1994)—note that the guidelines for “excellent” conditions are the lower quartile concentrations for these rivers.
Total nitrogen <0.5 g/m3 From upper quartile values for 77 New Zealand rivers in NIWA’s National Water Quality Network (after Smith & Maasdam 1994)—note that the guidelines for “excellent” conditions are the lower quartile concentrations for these rivers.
Water clarity at baseflow
>1.6 m “Baseflow” defined as flows less than the upper decile flow. Guideline from Ministry for the Environment (1994).
Escherichia coli <550/100 mL Ministry for the Environment (2003) guidelines for the management of recreational and marine shellfish-gathering waters.
Median Escherichia coli
<126/100 mL Ministry for the Environment (1999) guidelines for the management of recreational and marine shellfish-gathering waters.
Enterococci <77/100 mL Department of Health (1992) guidelines for “moderate” level of recreational use.
Chlorophyll a <0.02 g/m3 Ministry for the Environment (1992).
Arsenic <0.01 g/m3 Ministry of Health (2001).
Boron <1.4 g/m3 Ministry of Health (2001).

Page 50 Doc # 10492663
Waikato River monitoring programme - water quality parameters and analytical methods
Id1 Parameter Method
A340F Absorbance @ 340 nm filtered
Spectrophotometer, 1 cm path length, APHA method 5910B
A440F Absorbance @ 440 nm filtered
Spectrophotometer, 1 cm path length, APHA method 5910B
A780F Absorbance @ 780 nm filtered
Spectrophotometer, 1 cm path length, APHA method 5910B
As Arsenic total Nitric acid digestion, ICP-MS, APHA method 3125 B / USEPA 200B
B Boron ICP-MS, APHA method 3125 B
BDISK Black disk Field measurement, horizontal water transparency (20mm, 60mm, 100mm, 200mm disk) in river
BOD5 Biochemical oxygen Demand (5 day)
Incubation 5 days at 20C , DO-meter, No nitrification inhibitor added, unseeded, APHA method 5210 B
CHLA Chlorophyll a Acetone extraction. Spectroscopy. APHA method 10200 H (modified)
Cl Chloride Filtered sample. Ferric thiocyanate colorimetry, Discrete analyser. APHA method 4500 ClˉE (modified)
COLOUR Colour Field measurement, Munsell colour patches
COND Conductivity Lab Meter @ 25oC. APHA method 2510B
DO Dissolved oxygen Field measurement (Hach DO meter, model HQ 30d)
DO (% Sat) Dissolved oxygen (percent saturation)
Field measurement (Hach DO meter, model HQ 30d)
DOC Dissolved organic Carbon Filtration, acidification, purging to remove inorganic C, persulphate oxidation, IR detection. APHA method 5310 C (modified)
DRP Dissolved reactive Phosphorus
Filtration, Molybdenum Blue Colorimetry. Discrete analyser. APHA 4500 PE (modified)
E. coli Escherichia coli Membrane Filtration (mFC Agar) confirmation by MUG Agar. APHA method 9222 G
ENT Enterococci bacteria Membrane Filtration (mE Agar) confirmation by EIA Agar. APHA method 9230 C
FC Faecal coliforms Membrane Filtration (mFC Agar). APHA method 9222 D
Flow Flow – instantaneous Calculated from rating curve ± 8%
Li Lithium ICP-MS, method APHA 3125 B
NH4-N Ammoniacal Nitrogen (Total)
Filtration, Phenol/Hypochlorite Colorimetry. Discrete analyser. APHA method 4500-NH3 F (modified).
NNN Nitrite/Nitrate Nitrogen Automated Cadmium reduction. Flow injection analyser. APHA method 4500 – NO3ˉ I (modified)
NO3-N Nitrate nitrogen Calculation: (Nitrate-N + Nitrite –N) – Nitrite - N
pH pH Lab Meter @ 25oC. APHA method 4500-H+ B
TDS Total dissolved solids Filtration, gravimetric. APHA 2540 C (modified)
TEMP Temperature Field measurement (Hach DO meter, model HQ 30d)
TKN Total Kjeldahl-Nitrogen Acid digestion. Phenol/Hypochlorite colorimetry. Discrete analyser. APHA method 4500-Norg D (modified), 4500 NH3 F (modified)
TOC Total Organic Carbon Acidification, purging to remove inorganic C, persulphate oxidation, IR detection. APHA method 5310 C (modified)
TN Total Nitrogen Calculated from NNN + TKN (Nitrite/Nitrate Nitrogen + Total Kjeldahl-Nitrogen)
TP Total Phosphorus Acid persulphate digestion, Colorimetry. Discrete Analyser. APHA method 4500-P B & E (modified), corrected values to take into account possible interference from arsenic present in the sample.
TURB Turbidity Turbidity Meter Hach 2100N. APHA method 2130 B 1 Water quality parameter identification code refers to Waikato Regional Council’s water quality database (WISKI) parameter short name.
APHA = Standards Methods for the Examination of Water and Wastewater, 22nd Edition, 2012, APHA, AWWA, WEF
ICP-MS = Inductively Coupled Plasma – Mass Spectroscopy