wages, employment and incentives in the public … · wages, employment and incentives in the...
TRANSCRIPT

Wages, Employment and Incentivesin the Public Sector in Hungary
GÁBOR KÉZDI
Budapest Working Papers on the Labour Market
BWP. 1998/3
March 1998
Budapest Working Papers No.3Labour Research Department, Institute of Economics, Hungarian Academy of SciencesDepartment of Human Resources, Budapest University of Economics
Wages, Employment and Incentives in the Public Sector in Hungary
Author: Gábor KÉZDI, research fellow of Labour Research DepartmentInstitute of Economics, Hungarian Academy of SciencesAddress: Budaörsi út 45. Budapest, H–1112 Hungary. Phone:(36-1) 319-3158 Fax: (36-1) 319-3136 E-mail address:[email protected]
Published by the Institute of Economics, Hungarian Academy of Sciences. Budapest, 1998.With financial support from the Hungarian Economic Foundation

WAGES, EMPLOYMENT AND INCENTIVESIN THE PUBLIC SECTOR IN HUNGARY*
GÁBOR KÉZDI
The paper analyzes the changes in the relative labor marketposition of the public sector employees, using both macro-levelemployment statistics and large wage surveys. While competitiveemployment decreased by more than 30 per cent during thetransition, number of public employees have not change a lot, so avery large public employment ratio was reached in 1995. Due toobvious budget reasons, these trends led to dramatic decreases inrelative public sector salaries, within comparable groups. For someoccupation groups, unmeasured but not illegal differences cancompensate for earnings losses, but the ratio of these employeesdoes not seem to be significant. The widening of private-publicsalary gap could have than two major effects: increasing ratio ofless qualified employees in public institutions and/or major role ofillegal benefits in workers’ compensation. As none of these resultsare favorable from social perspective, public sector reform shouldconsider significant changes in public employment incentives.
The study analyses observable trends of employment and salaries in thepublic sector in Hungary. Instead of investigating the situation ofemployees in institutions having ‘public’ functions (providing publicgoods, regulating social activity, etc.) or financed from public sources, wefocus our analysis on some definite branches: public administration, healthand education. It is worth noting that a part of public employment areinvolved in other areas, such as research or cultural activities. Functionaldistinction cannot be made between private and public institutions in these
* The original version of the paper is planned to be published in: L. Bokros and J-J.
Dethier (eds.): Public sector reform in Hungary. World Bank, Washington, 1998.(forthcoming)

2
branches, so data concerning them are not reliable enough. In the 1990s,the uncovered branches contain around 10 percent of total publicemployment. Another problem arises about employees in justice,prosecution, police and armed forces, because published Hungarianstatistics and wage surveys do not provide appropriate data concerningthese branches. Employees in justice and prosecution are included in‘public administration’ in the following analysis. Employees in police andarmed forces are also included in ‘public administration’ in aggregatestatistics (consisting at least a half of employment in it), but the absolutelack of data prevents us from investigating their salary position.
In the following analysis, the adjective ‘private’ or ‘competitive’ indicatesthe non-public sector of the economy. It is clear, however, that at thebeginning of the transition private firms did not play a major role in theeconomy. Also the magnitude of monopoly structures questions theappropriate use of word ‘competitive’. In the socialist system, the labourdemand of the whole economy was much more similar to that of the currentpublic sector than to patterns of capitalist input demand. From labourmarket point of view, transition itself means the evolution of labor demandpatterns of profit-oriented firms. For the sake of simplicity, however wewill denote ‘private’ or ‘competitive’ sector the rest of the economy(without public administration, helath and education), in the socialistsystem as well.
The study consists of two major parts. The first part reveals the trends inpublic employment in Hungary, and tries to provide some comparisonswith other Central European transition economies. The second part consistsof a description and an analysis of salary changes in the public sector. Atthe end we try to draw some important conclusions concerning incentiveissues.
Employment in public sector in Hungary
The following data provide information on public sector employment inHungary: changes in the absolute numbers and ratios, and someinternational comparisons. The published statistics are sometimesinconsistent. This way a careful approach is needed. We have found EC[1992] and EC [1995] the most reliable and appropriate sources for ourpurposes. The major problems are the followings. First, police, armedforces, prosecution and justice employment is included into ‘public
3
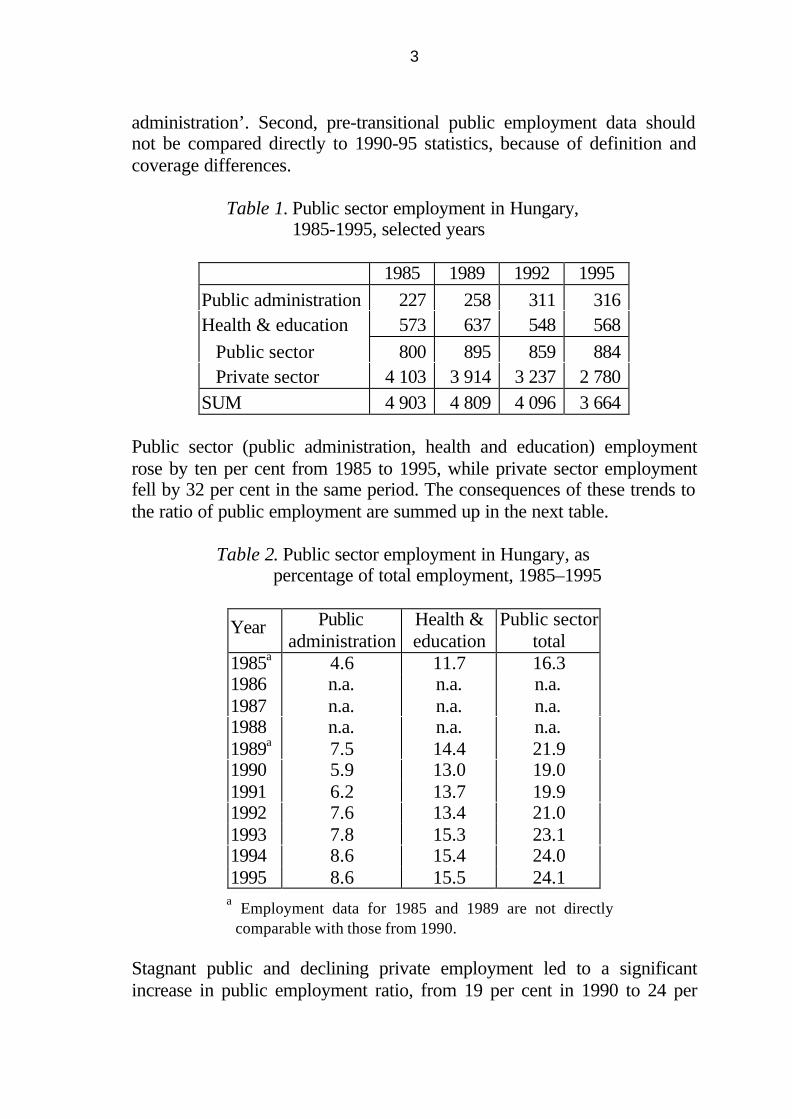
administration’. Second, pre-transitional public employment data shouldnot be compared directly to 1990-95 statistics, because of definition andcoverage differences.
Table 1. Public sector employment in Hungary,1985-1995, selected years
1985 1989 1992 1995
Public administration 227 258 311 316Health & education 573 637 548 568
Public sector 800 895 859 884 Private sector 4 103 3 914 3 237 2 780SUM 4 903 4 809 4 096 3 664
Public sector (public administration, health and education) employmentrose by ten per cent from 1985 to 1995, while private sector employmentfell by 32 per cent in the same period. The consequences of these trends tothe ratio of public employment are summed up in the next table.
Table 2. Public sector employment in Hungary, aspercentage of total employment, 1985–1995
Year Publicadministration
Health &education
Public sectortotal
1985a 4.6 11.7 16.31986 n.a. n.a. n.a.1987 n.a. n.a. n.a.1988 n.a. n.a. n.a.1989a 7.5 14.4 21.91990 5.9 13.0 19.01991 6.2 13.7 19.91992 7.6 13.4 21.01993 7.8 15.3 23.11994 8.6 15.4 24.01995 8.6 15.5 24.1
a Employment data for 1985 and 1989 are not directlycomparable with those from 1990.
Stagnant public and declining private employment led to a significantincrease in public employment ratio, from 19 per cent in 1990 to 24 per

4
cent in 1995. The increase between 1985 and 1989 is of the samemagnitude (from 16 to 22 per cent), but can be attributed to an increase inpublic, and a decrease in private employment. The end of the 1980sexperienced the start of the transition in private labour demand (see Köllõ ,[1997]) and in the same time, an increase in the role of public sectors. Aswe will see, the same strengthening public position can be observed inrelative salaries in the last years of socialist system.
Next table provides international comparison for the rates of employmentin public sectors focusing on Central and Eastern Europe. Fortunately,comparable data are available for most of the relevant countries (i.e. forthose in more or less similar to Hungary, concerning the state of transition).Unfortunately, comparison can be made only for the middle-1990s, thisway the roots of differences can not be evaluated directly. Two type ofindicators are considered: the ratio of public employment to the totalpopulation of the country can be viewed as a rough approximation to theoutput of the branch (how many people are seved by civil servants); whilethe ratio to the total employment cen be viewed as a rough approximationto the input of the branch (how many private employees finance the civilservants’ work).
Table 3. Public sector employment in Central and Eastern Europe, 1995
Public employment / Population Public employment/Country Public
administrationHealth &education
Public sector total
Total employment
Hungary 3.1 5.5 8.6 24.1Slovakia 2.5 5.9 8.4 21.1Czech R. 2.6 5.7 8.3 17.6Poland 1.8 5.0 6.8 17.6Romania 2.5 3.4 5.9 12.1
Employment data: 2nd quarter of 1995. Population data: 1994.Source: EC, [1995]
Among Central and Eastern European countries, Hungary has the largestpublic sector, from both output and input viewpoints. The size ofHungarian public administration is by far the largest, and that of health andeducation is also among the largests. However, the picture from the“output” viewpoint is more homogenous, as Hungary, the Czech Republicand Slovakia have very close ratios. Concerning input (financial) issues,Hungary seems to face a much more serious problem than the others.

5
(Differences in the two types of indicators can be attributed to differencesin total employment deterioration, so industry restructuring can move thestates of the former Czechoslovakia closer to the Hungarian trouble.)
Ratio of public sector to total employment is close to one fourth inHungary, (only Slovakia follows it with more than 20 per cent), whilerelative public employment is more than one-fourth less in the CzechRepublic and Poland. While appropriate data are not available for thepreceding years, incomplete and distorted information show that at the endof the 1980s, relative positions could not be significantly different to thoseobserved in 1995 (EC [1992]).
The cross-country figures and the end of our time series represent the 1995second quarter positions, the last ‘minutes’ before the introduction ofHungarian public sector reform measures. However, these measures did notresult in significant changes in the number of employees during 1995, andonly health and education experienced a major (ten per cent) employmentloss in 1996 (see World Bank, [1997]).
Public sector earnings in Hungary
In the second part, we investigate the trends of salaries in public sector.Like in the first part, we restrict our analysis to public administration,health and education. We treat public (that is, primary and secondary)education and higher education as distinct branches because of thedifferences in their observed trends. While the most important changes arecommon, large differences can be found at several points in the story ofthese four branches.Data of large cross-sectional surveys on employees’ wage, other salarycomponents, gender, age, education level and occupation are used in ouranalysis. Six databases (‘wage tariff surveys’) are available, between 1986and 1996. The data were collected by National Labour Center (OrszágosMunkaügyi Központ) and contain 150–600 thousand individualobservations from middle and large firms and institutions (employing tenor more people). Detailed description of these databases, correctionprocedures for sampling distortions, and statistics for the whole samples arepublished by Kertesi and Köllõ [1995].
During our investigations, we concentrate on total salaries rather thanmonthly wages to explore the trends in total work compensation. Of course,
6
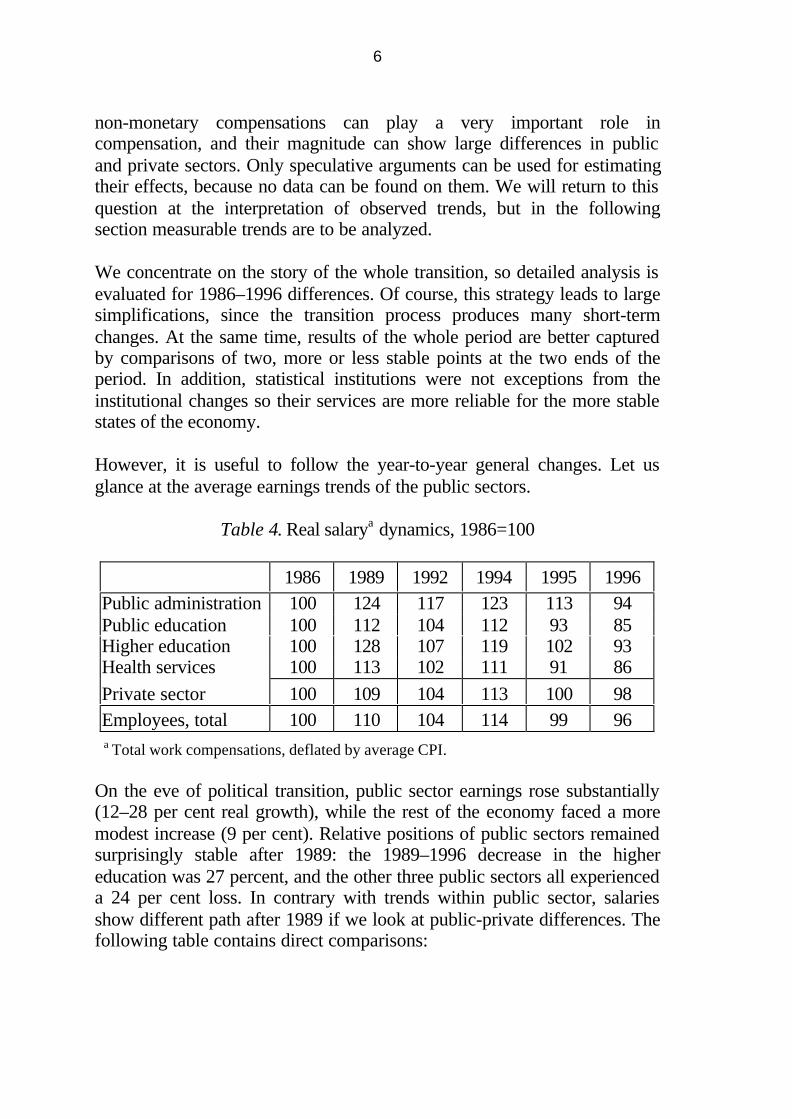
non-monetary compensations can play a very important role incompensation, and their magnitude can show large differences in publicand private sectors. Only speculative arguments can be used for estimatingtheir effects, because no data can be found on them. We will return to thisquestion at the interpretation of observed trends, but in the followingsection measurable trends are to be analyzed.
We concentrate on the story of the whole transition, so detailed analysis isevaluated for 1986–1996 differences. Of course, this strategy leads to largesimplifications, since the transition process produces many short-termchanges. At the same time, results of the whole period are better capturedby comparisons of two, more or less stable points at the two ends of theperiod. In addition, statistical institutions were not exceptions from theinstitutional changes so their services are more reliable for the more stablestates of the economy.
However, it is useful to follow the year-to-year general changes. Let usglance at the average earnings trends of the public sectors.
Table 4. Real salarya dynamics, 1986=100
1986 1989 1992 1994 1995 1996Public administration 100 124 117 123 113 94Public education 100 112 104 112 93 85Higher education 100 128 107 119 102 93Health services 100 113 102 111 91 86
Private sector 100 109 104 113 100 98Employees, total 100 110 104 114 99 96a Total work compensations, deflated by average CPI.
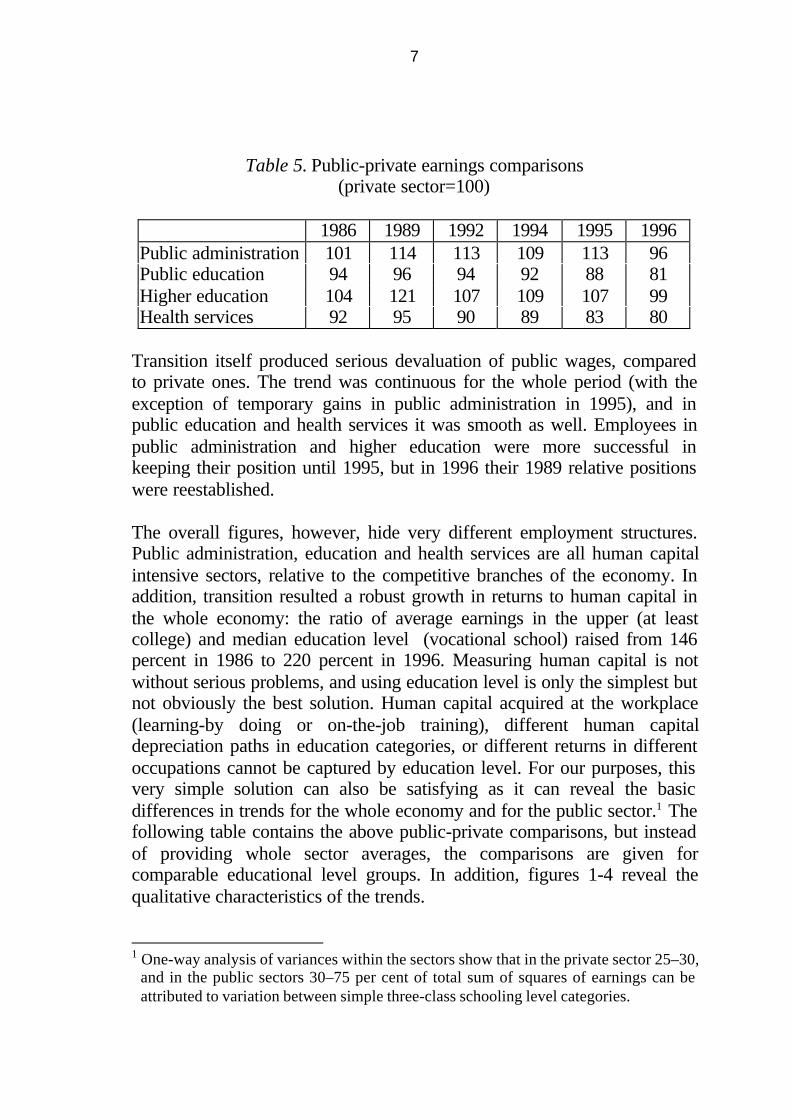
On the eve of political transition, public sector earnings rose substantially(12–28 per cent real growth), while the rest of the economy faced a moremodest increase (9 per cent). Relative positions of public sectors remainedsurprisingly stable after 1989: the 1989–1996 decrease in the highereducation was 27 percent, and the other three public sectors all experienceda 24 per cent loss. In contrary with trends within public sector, salariesshow different path after 1989 if we look at public-private differences. Thefollowing table contains direct comparisons:
7
Table 5. Public-private earnings comparisons(private sector=100)
1986 1989 1992 1994 1995 1996Public administration 101 114 113 109 113 96Public education 94 96 94 92 88 81Higher education 104 121 107 109 107 99Health services 92 95 90 89 83 80
Transition itself produced serious devaluation of public wages, comparedto private ones. The trend was continuous for the whole period (with theexception of temporary gains in public administration in 1995), and inpublic education and health services it was smooth as well. Employees inpublic administration and higher education were more successful inkeeping their position until 1995, but in 1996 their 1989 relative positionswere reestablished.
The overall figures, however, hide very different employment structures.Public administration, education and health services are all human capitalintensive sectors, relative to the competitive branches of the economy. Inaddition, transition resulted a robust growth in returns to human capital inthe whole economy: the ratio of average earnings in the upper (at leastcollege) and median education level (vocational school) raised from 146percent in 1986 to 220 percent in 1996. Measuring human capital is notwithout serious problems, and using education level is only the simplest butnot obviously the best solution. Human capital acquired at the workplace(learning-by doing or on-the-job training), different human capitaldepreciation paths in education categories, or different returns in differentoccupations cannot be captured by education level. For our purposes, thisvery simple solution can also be satisfying as it can reveal the basicdifferences in trends for the whole economy and for the public sector.1 Thefollowing table contains the above public-private comparisons, but insteadof providing whole sector averages, the comparisons are given forcomparable educational level groups. In addition, figures 1-4 reveal thequalitative characteristics of the trends.
1 One-way analysis of variances within the sectors show that in the private sector 25–30,
and in the public sectors 30–75 per cent of total sum of squares of earnings can beattributed to variation between simple three-class schooling level categories.

8
Table 6. Public-private earnings comparisons, by education level(private sector=100)
1986 1996Sector 0-11
classessecon-dary
higher 0-11classes
secon-dary
higher
Public administration 73 88 90 76 84 63Public education 70 84 75 65 63 42Higher education 80 87 77 71 61 53Health services 80 80 98 78 70 55
Figures 1-4: Time series of public/private earnings ratios,by schooling level categories
0
10
20
30
40
50
60
70
80
90
100
1986 1988 1990 1992 1994 1996
0-11secondary
higher
0
10
20
30
40
50
60
70
80
90
100
1986 1988 1990 1992 1994 1996
0-11secondary
higher
Figure 1: Public administration Figure 2: Public education
0
10
20
30
40
50
60
70
80
90
100
1986 1988 1990 1992 1994 1996
0-11secondary
higher
0
10
20
30
40
50
60
70
80
90
100
1986 1988 1990 1992 1994 1996
0-11secondary
higher
Figure 3: Higher education Figure 4: Health servides

9
The processes that led to the observed changes in sector averages were theresults of trends in returns to human capital and of education levelcomposition changes. The serious depreciation of public sector-relatedhuman capital, relative to the competitive sector (see Table 6 and Figures1-4) should have resulted in larger decline of public sector average earningsthan the observed one. The trends that interfered with the effects of theabove mentionned processes have to be a subject of a more detailedanalysis.
The effect of changes in human capital composition and earnings can beseparated by a simple decomposition model (see Annex). The change inpublic-private average wage difference can be attributed to four distinctcomponents, each measuring ‘ceteris paribus’ effects of structural andrelative changes in earnings2. First, the overall growth in returns to humancapital would have raised the average earnings in public sectors relative tothe rest of the economy since public employment is far more human capitalintensive. Second, only overall changes in human capital stock in theeconomy (that is, changes in the composition of the employees resulted bydemographic trends and massive unemployment of less educated in thecompetitive sector), would have moderate effect on inter-sector earningsdifferences, because these trends have not changed significantly the humancapital stock of the economy in comparison to the inter-sector differences.Third, public-private differences in returns to human capital would have,ceteris paribus, widen far more the observed average earnings gap. Andfourth, changes in human capital composition differences, alone, wouldhave raised the public administration-private sector difference, because ofthe shift towards less educated categories in the administration, but
2 Traditionally, regression models are evaluated for ceteris paribus economic investiga-
tions. However, Kertesi and Köllõ [1995] estimated earnings functions with largenumbers of significant right-hand-side variables, and even their extensivespecifications failed at the reset test of omitted variables. In addition, theirspecifications robustly faile at parameter-stability tests. For example, separating thesamples (or the sector-specific subsamples) into categories by gender gives Wald'sChi2 = 30911 for 1986 and 5591 for 1996. Structural problems indicate that a largenumber of cross-product right-hand side variables should be added to the basicspecifications to deal with interaction effects. It is clear, that our simple methodsuffers from even larger hidden composition ant interaction effects, but it does notseem to be possible to get rid of these effects and avoid complications ininterpretation. As indicated in footnote 4 and by the following results as well, oursimple methode provides robust results for our purposes and gives a clear backgroundfor incentive conclusions.

10
somewhat lower the gap for the other three public sectors, because ofreverse trends.
Table 7. Results of the simple decomposition model: Ceteris paribushuman capital related changes in public-private realearnings differences (measured in pctage of 1986competitive earnings), between 1986 and 1996
Average effects, in the percentage ofrelative total earnings difference changesa
Relativetotal
earningsPublic sector Overall
changes in HCreturns
Overallchangesin HCstock
Sectorspecific
changes inHC returns
Sectorspecific
changes inHC stock
diffe-rence
changesa
Public administration 24 0 -19 -11 -6Public education 29 -6 -45 6 -16Higher education 28 -1 -29 -2 -4Health services 10 -2 -24 -1 -16a Measured as the ratio of total real earnings difference change and 1986 compe-
titive average earnings.
Human capital produced the lowest returns in public education in 1986, andit has suffered the largest depreciation as well. The 45 per cent lossdecreased the public education - private sector salary rates from 75 to 42per cent among the most educated from 1986 to 1996, but this trend wasbalanced in two thirds by the overall rise in returns to human capital. Inother words, while most educated employees in private branches earned 1.6times more than the economy average in 1986 and 2.5 in 1996, primary andsecondary school teachers experienced a decline from 1.2 to 1.04. Theeffects of human capital stock changes indicate that the composition inpublic education has changed just like the average, so the observed 16 percent point widening of private sectors-public education earnings gap can beattributed fully to relative devaluation of teachers’ human capital.
The same is true for health services. Physicians earned 56 per cent morethan the average in 1986, and this difference declined to 38 per cent in1996, while lower educated medical employees earned 85 per cent of theaverage in 1986 and 80 per cent in 1996. The gap widened significantly,from 8 to 20 per cent between health services and competitive sectors, andthis mainly resulted from the devaluation of physicians’ activity.

11
Processes in higher education are different. The least observed decrease ofrelative average earnings among public sectors can be attributed to the factthat college and university teachers’ salaries fell behind the most educatedemployees in private sector, but did not fell behind the economy average:they earned 1.2 times more than the average Hungarian employee in 1986,while this ratio was 1.3 in 1996.
The story is almost the same for public administration where changes inreturns to education level would have somewhat decrease the averagepublic-private earnings gap. But, interestingly enough, significant shifts canbe observed in human capital composition of the sector: ratio of highereducated employees fell from 31 to 26 per cent, with a similar decrease inhigh school-level educated employment. This change led to the 6 per centwidening of average earnings gap.
Teachers in higher education and educated employees in publicadministration are closer substitutes for private sector employment thanpublic school teachers or physicians. In competitive environment, this factwould result in narrower earnings gap for the former – and our findings arepartly consistent width this prediction. Public-private salary differenceswere three times bigger for primary and secondary school teachers and forphysicians, in absolute value, compared to educated employees in publicadministration or higher education. While higher educated public sectoremployees suffered a huge loss in their earnings position, the same is nottrue for less educated groups (or, for public and higher education, their losswas less significant), see Table 6. This fact also supports our interpretation,since sector-specific human capital can play a minor role in the case lesseducated employees’ (e.g. administrative or maintenance occupations)productivity. If we think that transition led to a closer relationship betweenproductivity and earnings in the private sector, the above mentioned trendscan be interpreted as the revelation of substitution relations amongoccupations. The immediate consequence of this interpretation is that thatthese processes resulting in public sector salaries are not completelyresistant to labor demand structural changes despite the lack of ownershipand output competition.
But how close substitutes are public and private employees? Earningscomparisons in Table 6. show that less educated public sector employeesearned 65-85 per cent, and most educated earned 40-65 per cent less thencomparable group of employees in private sector, in 1996. These large
12
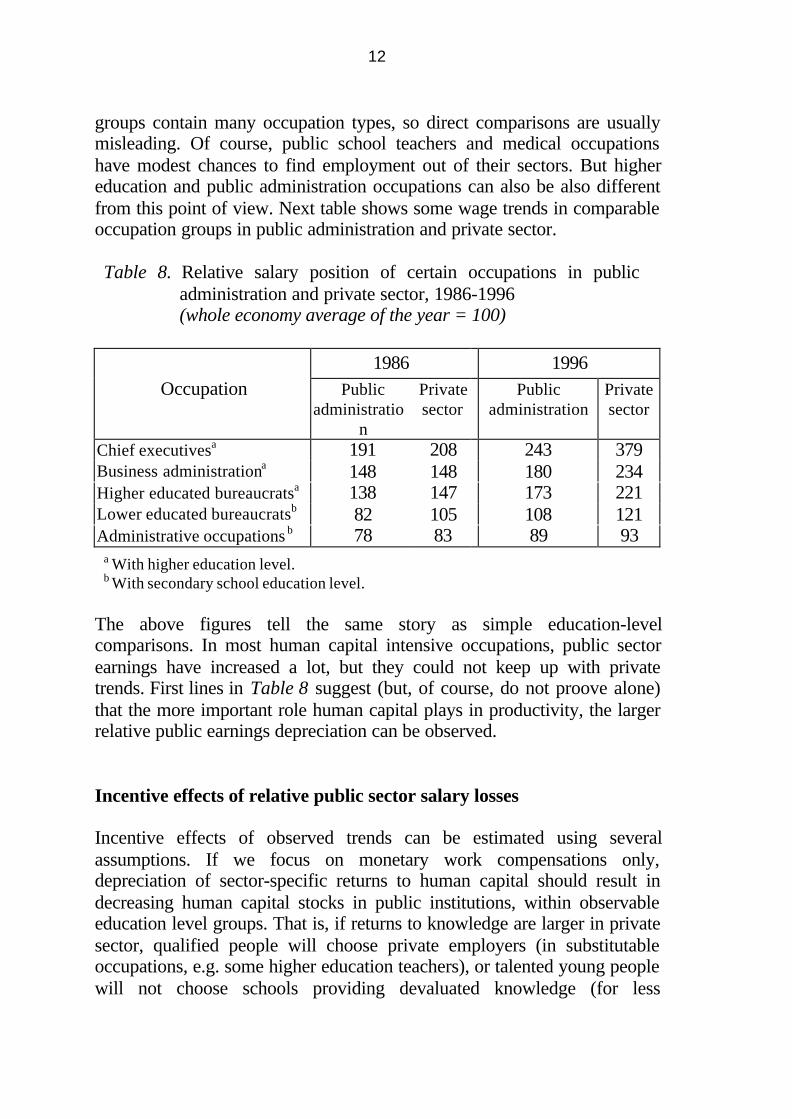
groups contain many occupation types, so direct comparisons are usuallymisleading. Of course, public school teachers and medical occupationshave modest chances to find employment out of their sectors. But highereducation and public administration occupations can also be also differentfrom this point of view. Next table shows some wage trends in comparableoccupation groups in public administration and private sector.
Table 8. Relative salary position of certain occupations in publicadministration and private sector, 1986-1996(whole economy average of the year = 100)
1986 1996Occupation Public
administration
Privatesector
Publicadministration
Privatesector
Chief executivesa 191 208 243 379Business administrationa 148 148 180 234Higher educated bureaucratsa 138 147 173 221Lower educated bureaucratsb 82 105 108 121Administrative occupations b 78 83 89 93
a With higher education level.b With secondary school education level.
The above figures tell the same story as simple education-levelcomparisons. In most human capital intensive occupations, public sectorearnings have increased a lot, but they could not keep up with privatetrends. First lines in Table 8 suggest (but, of course, do not proove alone)that the more important role human capital plays in productivity, the largerrelative public earnings depreciation can be observed.
Incentive effects of relative public sector salary losses
Incentive effects of observed trends can be estimated using severalassumptions. If we focus on monetary work compensations only,depreciation of sector-specific returns to human capital should result indecreasing human capital stocks in public institutions, within observableeducation level groups. That is, if returns to knowledge are larger in privatesector, qualified people will choose private employers (in substitutableoccupations, e.g. some higher education teachers), or talented young peoplewill not choose schools providing devaluated knowledge (for less

13
substitutable occupations, e.g. public school teachers). These processes willobviously result (in the short run for the first, or in the long run for thesecond group) in a less qualified (less qualified in terms of unobservedhuman capital) public sector employment.
It is clear however, that not only present salary conditions matter but futureprospects also. But if we glance at figures 1 to 4, we face a more or lesscontinuous decline in relative public/private returns to human capital. If weadd that it is not a well grounded belief that a deep public sectorrestructuring and this way a reversing of the above trends would take place,anticipation of significant higher future public/private earnings ratio is nota likely background for the above described decisions.
But if we turn to non-monetary (or non observable monetary) componentsof workers’ compensation, other effects should also be considered. Let ustake the example of educated health employment. We have seen thatphysicians experienced a significant devaluation of their salaries, whiletheir occupation is one of the most knowledge-based ones. In addition, out-of-public sector employment possibilities are not open to these employees,or at least, not in a large number. At the same time, no significant decreasecan be observed in the popularity of medical schools or in the students’human capital stock (measured e.g. by entrance exam scores required byschools).3 These facts indicate that anticipated returns to physicians’ humancapital could not decrease much, so observed salary decline was balancedby other benefits. While massive privatisation of health services is not verylikely at least for the following years, it is not impossible in the long run.However, better founded beliefs can also play a major role in the decisions:illegal and thus unobserved direct patient-doctor payments are very wellknown attributes of Hungarian medical system. Moreover, the same kind ofarguments can be developed for other public services as well.Compensating differences like the above can narrow the above observedearnings public-private differences, and speculative arguments can revealimportant possibilities. In the following arguments we try to find out ifthere are such differences and evaluate their possible consequences.
First, let us consider the in-kind or simply hidden employer-to-employeebenefits. We have no reason to suppose that public sector non-salarybenefits given by employers (e.g. official cars or welfare expenditures) 3The application/admission ratio has remained around 500 per cent, and the required
examination scores are still among the highest, around 108/120 pts. See Ministry ofEducation [1997].

14
exceed private ones, because these compensation techniques are the bestways to avoid taxes and other public charges, so profit maximizingemployers will use these cheaper compensating possibilities until theiroptimal ratio.
Three other factors can comensate for salary differences: workingconditions, work possibilities besides major job and illegal benefits. It isclear, that a part of public institutions require less efforts and/or less time(e.g. school holidays), but these attributes are not the products of the lastten years, so they could compensate for the gap of the 1980s but not for itswidening. Civil servants’ and public servants’ special employmentconditions guaranteed by 1992 acts aimed at providing compensatingdifferences to balance the depreciation of relative earnings. But thesignificant results of these regulations were either irrelevant (firingobstacles) or discouraging (strict seniority rules) for the best qualifiedemployees, so they could not narrowed the gap.
Work revenues besides major job can be relevant compensation only forseveral occupations. While a major part of higher education professors andalso some physicians are obviously involved in research programmes or inbusiness activities, these opportunities do not exist for primary andsecondary school teachers or for the most of the physicians. Employees inpublic administration are serously constrained in their activities by law.
Excepted for higher education professors and some physicians, significantrise in illegal benefits is then the only unmeasured factor that could providecompensations for relative salary losses. These benefits has twocharacteristics: they result from employee-client relation, not from theemployer, and are not covered by taxes. Whether these transfers lead todirect efficiency losses by distorting competitive market outcomes (e.g. inregulation, public investment or public purchasing decisions) or not (e.g. inpatient-physician payments), the above mentionned characteristics result inat least central budget revenue losses and serious moral problems.Obviously, we cannot estimate the effect of these compensations, andwithout empirical evidence it is not possible to judge whether they canbalance the effects of salary depreciation. In public educaion, however,illegal benefits cannot play as important role as in health services, and asignificant part of employess in public administration do not have an accessto these benefits.

15
Conclusions
While competitive employment decreased by more than 30 per cent duringthe transition, number of public employees have not change a lot, so a verylarge (24 per cent) public employment ratio was reached in 1995. Thesetrends c led to decreases in public sector salaries, so after temporary gainsat the last years of socialist system, public sector employees’ hasexperienced serious losses in their relative positions. While most educatedpublic employees’ earnings has increased, public-private salary gap haswidened from 2-25 per cent to 37-58 per cent (occupations that were closersubstitutes for private sector, has suffered from less serious relative losses).For some occupation groups, unmeasured but not illegal differences cancompensate for earnings losses, but the ratio of these employees is notsignificant. The widening of private-public salary gap could have than twomajor effects: increasing ratio of less qualified employees in publicinstitutions and/or major role of illegal benefits in workers’ compensation.As none of these results are favorable from social perspective, public sectorreform should consider significant changes in public employmentincentives. Of course, employment reduction and regulation changes arenecessary conditions of increases in salary incentives.
References
EC [1992]: Employment Observatory. Central & Eastern Europe, 1.European Community, 1992, Bruxelles
EC [1995]: Employment Observatory. Central & Eastern Europe, 8.European Community, 1995, Bruxelles
Kertesi and Köllõ [1995]: Kereseti egyenlõtlenségek Magyarországon,1986-1994. (Earnings Differentials in Hungary, 1986-1994.)Institute of Economics mimeo. 1995, Budapest.
Köllõ [1997]: Transformation Before the Transition. Institute of EconomicsWorking Papers. 1997, Budapest.
Ministry of Education [1997]: Higher Education Admission Bulletin (inHungarian). Ministry of Education, 1997, Budapest

16

17
Annex
Public-private salary difference change decomposition model
Average earnings are equal the weighted averages of education levelearnings in all sectors:
W f Wp pi p ii
9 6 9 6 9 6= ∑ and W f Wc ci cii
9 6 9 6 9 6= ∑ ,
whereW denotes the average real earnings in the sector,p and c denote the sector indices (p=“public”, c=“competitive”)i denotes the index of the schooling level category,fi denotes the i-th category weight in the sector,and the upper indices (96 and 86) denote the year of observation.
The data are summarized in the following table.
Real earnings (in 1990 forints)
Sector 0-11 classes Secondary ed. Higher ed. Total
1986 1996 1986 1996 1986 1996 1986 1996
Publicadministration
6 903 7 270 9 473 11 774 14 544 19 098 10 264 12 031
Public education 6 662 6 168 9 079 8 874 12 051 12 641 9 610 10 205Higher education 7 607 6 729 9 343 8 555 12 338 16 092 10 594 12 371Health 7 657 7 412 8 634 9 768 15 755 16 767 9 338 10 063Competitive sector 9 514 9 528 10 778 14 005 16 089 30 389 10 187 12 556
Composition of employment (%)Sector 0-11 classes Secondary ed. Higher ed. Total
1986 1996 1986 1996 1986 1996 1986 1996
Publicadministration
29.4 37.7 40.1 35.6 30.5 26.7 100.0 100.0
Public education 28.9 27.1 29.7 18.1 41.4 54.8 100.0 100.0Higher education 23.0 22.4 21.9 21.6 55.1 56.1 100.0 100.0Health 50.5 44.1 32.7 36.8 16.8 19.1 100.0 100.0Competitive sector 72.3 63.0 21.6 28.6 6.1 8.4 100.0 100.0

18
Let us use the following notation, for the two years (with upper indices 86and 96):
D W W f W f Wp c pi p ii
ci cii
9 6 9 6 9 6 9 6 9 6 9 6 9 6= − = −∑ ∑ .
The public-competitive wage difference, D can be decomposed in twoways:
( ) ( )D f f W W W fpi ci cii
p i ci p ii
9 6 9 6 9 6 9 6 9 6 9 6 9 6= − + −∑ ∑ .
( ) ( )= − + −∑ ∑f f W W W fpi ci p ii
p i ci cii
9 6 9 6 9 6 9 6 9 6 9 6 .
With these notations, decomposition of change between 1986 and 1996earnings differences in the public and “private” (competitive) sector, ∆Dcan be captured by the following equation:
( ) ( )∆D D D W W W Wp c p c= − = − − −9 6 8 6 9 6 9 6 8 6 8 6
= + + +∑ ∑ ∑ ∑W D D W f D D fi f ii
f i ii
i W ii
W i ii
∆ ∆ ∆ ∆ , where
D f ff i p i ci= − ,D W WW i pi ci= − , and∆ denotes the change between 1986 and 1996.
In the decomposition model, one can choose between 23=8 differentweight-combinations. (2 year-combinations for the first two terms, 2 for thesecond two terms, and choosing the competitive for the first and the publicsector for the second two terms as weight, or vice versa.) Using one of thecombinations of weights, the above are the abbreviations of the followingterms:
∆ ∆ ∆ ∆ ∆D W D D W f D D fpi f i f i p iii
ci W ii
W i cii
= + + +∑∑ ∑ ∑9 6 8 6 9 6 8 6
The first term of the decomposition captures the effect of the change instructural differences of the sectors, the second term captures the effect ofoverall relative wage changes of the categories, that is, the changes inreturns to human capital, through the different composition of the sectors.The third term represents the the effect of relative in-category relative

19
wage changes of the two sectors, that is the change in differences of returnsto human capital for the two sectors. Last, the fourth term captures theeffect of overall structural changes in the economy. In some cases, theresults are very sensitive to the choice of weights. For instance, verydifferent magnitudes can be assigned to the “overall” wage shift betweencategories if one considers the competitive sector (index c) or the publicsector (index p). While the absolute effects suffer from these problems, thesign and relative magnitude of the effects are much less sensitive to thechoice of weight-combination. The following tables show the effectaverages and standard deviations.
Average effects, in the percentage of relativetotal earnings difference changesa
Relativeto-tal
earningsPublic sector
D Wfi ii∑ D fW i i
i
∆∑ f Di W ii
∆∑ W Di fii
∆∑ differencechangesa
Publicadministration
24.2 0.4 -19.5 -11.4 -6.3
Public education 28.9 -5.6 -45.2 5.5 -16.5Higher education 28.1 -0.9 -28.9 -1.9 -3.7Health 10.3 -1.8 -24.0 -0.7 -16.1
a Measured as the ratio of total real earnings difference changes and1986 competitive average wage (dD/Wc
86).
Standard deviation of effects, in the percentageof relative total earnings difference changesa
Relativeto-tal
earningsPublic sector
D Wfi ii∑ D fW i i
i
∆∑ f Di W ii
∆∑ W Di fii
∆∑ differencechangesa
Publicadministration
14.1 2.4 13.2 5.4 6.3
Public education 26.8 6.7 27.1 5.3 16.5Higher education 15.2 1.2 15.2 1.2 3.7Health 8.3 2.1 8.5 0.4 16.1
a Measured as the ratio of total real earnings difference changes and1986 competitive average wage (dD/Wc
86).