wages, employment, and capital in capitalist and worker-owned firms
TRANSCRIPT
23
T
Industrial and Labor Relations Review, Vol. 60, No. 1 (October 2006). © by Cornell University. 0019-7939/00/6001 $01.00
WAGES, EMPLOYMENT, AND CAPITAL
IN CAPITALIST AND WORKER-OWNED FIRMS
JOHN PENCAVEL, LUIGI PISTAFERRI, and FABIANO SCHIVARDI*
The authors investigate how worker-owned and capitalist enterprises differ with respect to wages, employment, and capital in Italy, the market economy with the great-est incidence of worker-owned and worker-managed firms. Estimates calculated using a matched employer-worker panel data set for the years 1982–94 largely corroborate the implications of orthodox behavioral models of the two types of enterprise. Co-ops had 14% lower wages than capitalist enterprises, on average; more volatile wages; and less volatile employment. Given the quality of the data set analyzed, the authors argue, these results can be regarded as having broad generality.
*John Pencavel is Levin Professor of Economics at Stanford University; Luigi Pistaferri is Associate Pro-fessor of Economics, also at Stanford University; and Fabiano Schivardi is a Senior Economist at the Research Department of the Bank of Italy. The authors thank Robert Fairlie and seminar participants at the Hoover Institution for helpful comments on an earlier version of this paper.
The data in this research are partly proprietary (the Centrale dei Bilanci data) and partly confidential (the Instituto Nazionale della Previdenza Sociale data). For
information on how to access the former, see http://www.centraledeibilanci.com/. The authors do not have exclusive access to the confidential INPS data, as they are made accessible for research purposes to a number of institutions, such as the LABORatorio Revelli–Center for Employment Studies in Turin, the Ministry of Wel-fare, and the Bank of Italy itself. Interested researchers should contact one of these institutions to set up a joint research project. The authors thank the INPS for mak-ing the workers’ data available to them.
his paper examines how two types of firms differ in their responses to changes in their environment and assesses whether these firms’ reactions conform to textbook models of their behavior. One type of firm is the familiar proprietorship or corporation in which those who supply the firm’s capital manage the company (or select the manag-ers) and enjoy the residual returns. Such capital-owned and capital-managed firms are the dominant form of economic organization in the private sector of market economies and their prevalence provides the rationale for calling such economies capitalist. Workers are hired—often indirectly—by those who provide the firm’s capital.
A second type of firm is that owned and managed by its workers. We label such a worker-owned and worker-managed firm a worker cooperative. In a worker co-op, capital is borrowed from financial intermediaries or provided by the workers who act as holders of the equity. Ultimate managerial decisions in a co-op rest with the worker-owners.
The general issue is whether firms operate differently when workers have a greater voice over the activities of enterprises. Whereas unionized workers in a capitalist firm must bargain with the firm’s owners (or the rep-resentatives of the firm’s owners) to achieve certain goals, the worker-owned and worker-managed firm does not require such a step, and thus, in co-ops, observed outcomes do not reflect the mixed objectives of workers
24 INDUSTRIAL AND LABOR RELATIONS REVIEW
and management. Do firms in which workers have such ultimate voice operate differently from firms in which this voice is muted?
These issues have been addressed in a number of case studies, but in this paper we move beyond case studies to an analysis of a large number of capitalist firms and worker co-ops in Italy, the country with the most ex-tensive worker co-ops of any modern market economy.1 There are more than 38,000 worker co-ops (including those in agriculture) in Italy (see Ammirato 1996) and their conspicuous role in the economy has made them a subject of frequent study by economists (such as Bartlett et al. 1992, Jones and Svejnar 1985, and Smith 1994), though never with as rich a data set as is compiled here. In this paper, we combine two surveys, one of workplaces and another of workers, that permit us to follow the same firms and workers over time. Our pooling of 13 years’ data (1982–94) resulted in observations on about 2,000 worker co-ops, which we compare with observations on over 150,000 capitalist workplaces. We also have usable observations on an average of almost 13,000 individual workers per year, some 2–4% of them working in co-ops. These surveys allow us to match workers with their workplaces, and the panel feature of the data means we control for invariant attributes of firms and of individuals that are intrinsically unobserved by researchers and that we may treat as fixed effects. In all, in these matched worker-workplace panel data, we have the richest set of observations on worker co-ops ever examined by economists.
Our principal goal is to describe empirical regularities regarding wages and employment in co-op and capitalist workplaces within a framework suggested by textbook models of these organizations. In addition, in view of the importance placed on capital market issues
in conjectures offered to explain the infre-quency of worker co-ops as an organizational form, we examine differences in physical capital inputs between capitalist and co-op enterprises. There is a growing literature using micro-economic data to examine the implications of conventional firms’ profit-maximizing behavior (for instance, Bond and Van Reenan 2006) and our research is in this vein.
I. Income-Maximizing Models of the Capitalist Firm and Worker Co-op Compared
This section lays out and contrasts the main implications of economists’ basic models of the capitalist firm and the co-op. Many dif-ferent models have been proposed for both capitalist firms and co-ops, but we restrict ourselves to the canonical models from which other models take their reference. These models are elementary, perhaps naive, and ignore many of the complexities of these firms and their environments. However, they provide the workhorses for much economic analysis and it is important to determine their empirical relevance. Do the implications of the orthodox models of the co-op and capi-talist enterprise conform to the observations we have collected? In particular, we focus on labor market outcomes relating to wages and employment and on the use of capital by these firms.
The Capitalist Firm
First consider the prototypical capitalist firm as spelled out in micro-economic text-books, with E denoting the firm’s employment of labor and K its services from physical capital. The price per unit of output is p, the wage paid to each labor input is w, r is the rental price of capital, and F denotes the firm’s fixed (that is, unavoidable contractual) costs. In the classical case, these monetary values—p, w, r, and F—are given to the firm and define its economic environment. If the firm does not face a given value of p, then p stands for the state of product market condi-tions, in general.
1Subjects of well-known case studies include the Mondragon group in the Basque country of Spain (Whyte and Whyte 1991), plywood co-ops in the Pacific Northwest (Pencavel 2001), sanitation workers in the San Francisco Bay Area (Russell 1985), and kibbutzim in Israel (Warhurst 1999). Each of these organization types differs from the others, of course, but all share the feature that many of the workers “own” and “man-age” the firm.
CAPITALIST AND WORKER-OWNED FIRMS 25
A price-taking firm faces a given wage that is independent of p, r, and F. As we shall note below, this property is not shared with the standard model of the co-op. Treating w as fixed in this firm’s optimizing problem does not necessarily require that the firm’s labor supply function be horizontal; it follows also if collective bargaining at the industry or regional or national level (as is typical in Italy) sets the wage that the capitalist firm must pay.
The capitalist firm selects its inputs to maximize net revenues, and the resulting labor demand and capital services func-tions may be written as E = Ep(p, w, r) and K = K p(p, w, r). Normally, the labor demand function has the features that E rises with an increase in p and E falls with an increase in w. Analogously, according to the capital services demand function, K rises with an increase in p and K falls with an increase in r. Changes in F do not induce alterations in the optimal levels of E and K.
The Worker Co-op
Consider the twin worker-owned firm in the same market environment with the same production function as the capitalist firm. An issue deferred to future research is whether the internal operations (the production func-tions) of co-ops are less or more efficient than those of capitalist enterprises. Though there are many variations, two principal models of the co-op might be entertained.
One model assumes that there is a market for co-op membership and that the prices of each co-op’s shares fluctuate in response to changes in expectations about an enterprise’s fortunes (Sertel 1982; Fehr 1993). A draw-back of this model for our purposes is that there is little evidence of such markets for membership in the Italian case. There are admission fees to most Italian co-ops and each member is required to contribute some of the enterprise’s financial capital. How-ever, these contributions do not constitute market membership prices because Italian law specifies both minimum and maximum amounts that new members must advance to their co-ops. Furthermore, upon leav-ing the enterprise, normally the individual
gets back what he put in (less the admission fee) and what he receives is independent of the future stream of the enterprise’s net returns. Hence, an unregulated market for tradable co-op membership rights does not exist in Italy.2
In the second model of the worker co-op and the one investigated here, the co-op’s membership rules are specified by the legal system and, taking these rules as given, the co-op is assumed to maximize income per worker-member so that members have equal shares. In this case, the levels of all inputs, including labor, E, and capital, K, are selected to maximize per-worker net revenues, v. The resulting employment and capital services demand functions for the worker co-op do not contain v as a predetermined variable and may be written E = Ev(p, r, F) and K = Kv(p, r, F). For the worker co-op, increases in p do not necessarily increase the demand for workers.3 Unlike the profit-maximizing capitalist firm, the worker co-op increases E in response to an increase in F.
The co-op’s capital services demand func-tion possesses few qualitative properties un-less restrictions are placed on the form of the production function. However, if labor and capital are complementary inputs in production so that the marginal product of one input rises when more of the other
2The absence of a “thick” market in membership rights may not be the consequence of the legal struc-ture; on the contrary, the legal structure may reflect the deeper problems in markets for co-op member-ship. Unlike in a capitalist firm, in a co-op the right to a portion of net receipts entails not only ownership of the share but also the individual’s obligation to supply his labor to the organization, so the exchange of a co-op’s share involves substituting one individual’s labor supply for another’s. Hence factors that inhibit labor mobility contribute to a “thin” market for co-op mem-bership shares. In these circumstances, competition for co-op membership shares may be less common than bilateral monopoly, so the legal system may be more inclined to regulate the market for membership rights.
3As is well known, if labor is the only input, so that r is not an argument of the employment demand function, then increases in p reduce employment (and output—the so-called “perverse supply”). This inverse relation between p and E is no longer an unambiguous implication of the model of the income-maximizing co-op once output depends on other inputs in addi-tion to labor.
26 INDUSTRIAL AND LABOR RELATIONS REVIEW
input is used, then the co-op’s demand for capital falls when r rises and its demand for capital rises when fixed costs are higher. (See Pencavel and Craig 1994.)
If the co-op’s optimal values of labor, capi-tal, and other inputs are substituted into its objective function, the maximized value of v—call this v*—may be written indirectly as a function of the predetermined variables: v* = f(p, r, F). Thus, because each worker’s earnings are v*, when firms are price-takers in all markets, changes in these prices induce changes in the earnings of each co-op worker. By contrast, in the same market environment, the wages of the worker in a capitalist firm are independent of firm-specific changes in market prices. For these reasons, the wages of co-op workers are expected to be more variable than the wages of workers in capital-ist firms. More specifically, the maximized value of v is higher when p rises and v is lower when r or F falls. Thus, the co-op worker’s earnings are predicted to vary with the firm’s product market conditions (as embodied in p) and with the firm’s input prices and its fixed costs.
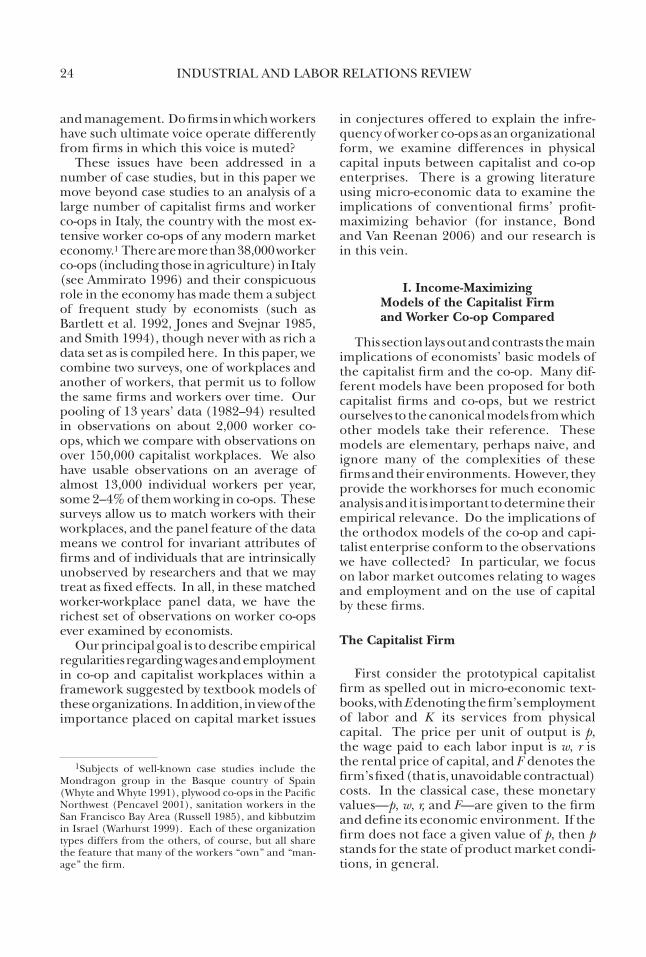
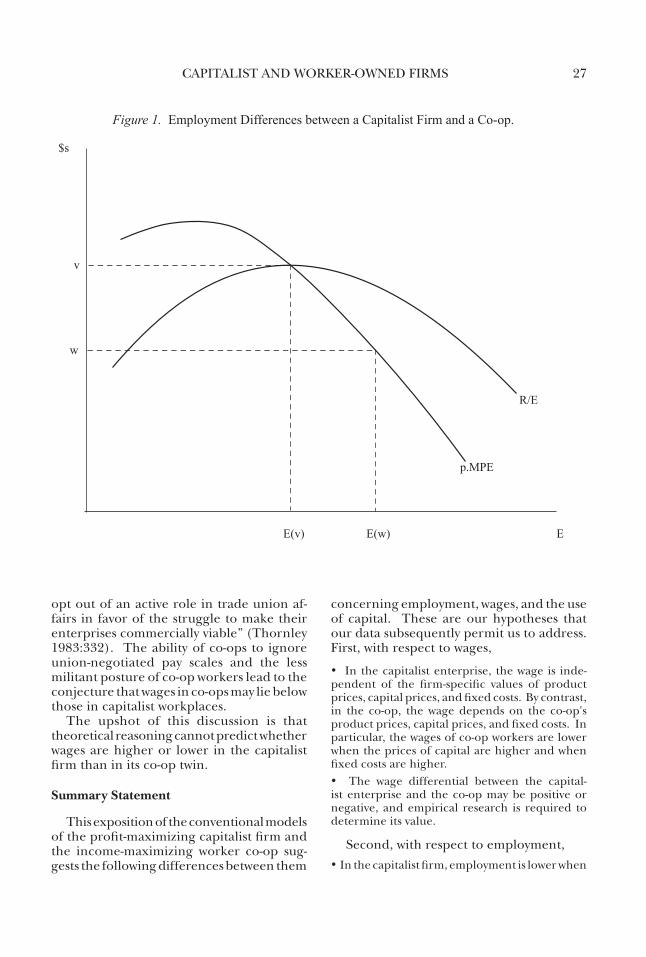
Figure 1 graphs the difference between employment in the capitalist and the co-op firms. For the capitalist firm, employment is set at E(w), where the value of the marginal product of labor (here given by p.MPE) equals the given wage, w. For the income-maximiz-ing co-op, employment is set at E(v), where the value of the marginal product of labor equals income per worker, v, which in turn equals revenues per worker, R/E. Because the maximized value of v, v*, is no less than w, employment at the capitalist firm is not less than employment in the co-op. If the capitalist firm’s wage, w, exceeded revenues per worker, R/E, the capitalist firm would earn negative profits and would cease pro-duction.
Other Issues Bearing on Wage Differentials
This familiar implication that, other things equal, the earnings of the co-op worker will exceed the earnings of the worker in the capitalist enterprise assumes the absence of any labor supply constraints on the co-op.
In fact, labor supply functions to the co-op may prevent attainment of the maximum per-worker income described in the previous subsection. Once labor supply considerations become relevant, the non-pecuniary employ-ment conditions in the two types of firms need to be assessed. For instance, insofar as workers place a value on participating in the co-op’s governance, they will be willing to work at wages different from those prevail-ing in the capitalist enterprise. Or, as noted above, the model of the income-maximizing co-op implies that the co-op’s wages respond to firm-specific prices and fixed costs and, therefore, they tend to fluctuate more than wages in capitalist firms. Other things equal, these greater wage fluctuations have the effect of mitigating employment varia-tions. Consequently, employment loss may be viewed as less of a risk by co-op workers than by workers in capitalist firms and co-op workers may, accordingly, be willing to accept lower wages than workers in capitalist firms. These considerations frustrate clear predic-tions about the sign of the capitalist–co-op wage differential.
Also possibly affecting these implications about capitalist-coop wage differentials is the presence of unionism. Most Italian workers are covered by collective bargain-ing agreements that apply to all firms in a given industry or region. Typically these agreements stipulate minimum rates of pay, though plant-level bargaining may result in wages at a particular workplace “drifting” above this floor. In other instances, espe-cially in small establishments, the terms of collective bargaining agreements may be disregarded. Hence actual pay differentials across establishments in the same industry are greater than those specified in the multi-employer agreements.
In the period of our study, co-ops were not legally required to adhere to the minimum rates of pay set down in industry-wide union contracts, although a number of them did. While in many cases workers in co-ops are af-filiated with the relevant industrial union, the co-op workers tend to display less militancy than workers in capitalist firms. This has caused “frustration [among union leaders] that co-operative workers must, of necessity,
CAPITALIST AND WORKER-OWNED FIRMS 27
opt out of an active role in trade union af-fairs in favor of the struggle to make their enterprises commercially viable” (Thornley 1983:332). The ability of co-ops to ignore union-negotiated pay scales and the less militant posture of co-op workers lead to the conjecture that wages in co-ops may lie below those in capitalist workplaces.
The upshot of this discussion is that theoretical reasoning cannot predict whether wages are higher or lower in the capitalist firm than in its co-op twin.
Summary Statement
This exposition of the conventional models of the profit-maximizing capitalist firm and the income-maximizing worker co-op sug-gests the following differences between them
concerning employment, wages, and the use of capital. These are our hypotheses that our data subsequently permit us to address. First, with respect to wages,
• In the capitalist enterprise, the wage is inde-pendent of the firm-specific values of product prices, capital prices, and fixed costs. By contrast, in the co-op, the wage depends on the co-op's product prices, capital prices, and fixed costs. In particular, the wages of co-op workers are lower when the prices of capital are higher and when fixed costs are higher.• The wage differential between the capital-ist enterprise and the co-op may be positive or negative, and empirical research is required to determine its value.
Second, with respect to employment,• In the capitalist firm, employment is lower when
Figure 1. Employment Differences between a Capitalist Firm and a Co-op.
$s
v
w
EE(w)E(v)
R/E
p.MPE
Pncvl Et Al 1 of 2
28 INDUSTRIAL AND LABOR RELATIONS REVIEW
the wage rate is higher. In the co-op, employ-ment and wages are jointly determined variables and causation does not run simply from wages to employment. The sign of the correlation between wages and employment among co-ops is unspecified.• In the capitalist firm, employment is indepen-dent of fixed costs. In the co-op, employment is higher when fixed costs are greater.
• Wages will tend to be more responsive and employment less responsive to product market shocks in the co-op than in the capitalist firm. This is because in the capitalist firm the enterprise takes wages as given in which case product demand shocks (changes in output prices) induce the firm to make quantity—including employment—reac-tions. Thus, in the capitalist firm, employment (and other input quantities) will take the brunt of product market shocks to the firm's economic environment, while in the co-op, such shocks will have a first-order impact on each member's wages. These effects on the co-op member's wages will temper employment responses.
Third, with respect to the use of physical capital,• In the capitalist firm, the use of capital falls when the price of capital rises, but the use of capital is independent of fixed costs. By contrast, if capital and labor are complementary inputs (defined above), the co-op's demand for capital falls when the price of capital rises and the use of capital increases when fixed costs increase.
Before examining the empirical relevance of these implications, consider the following description of the Italian co-op movement.
II. Worker Co-ops in Italy
Brief History
The cooperative movement in Italy dates back to mutual aid and insurance societies in the nineteenth century. A co-op confedera-tion was established in 1886 that later became La Lega (Nazionale delle Cooperative), the largest umbrella organization of co-ops today. The confederation’s principal function was to act as a pressure group on government, and, indeed, legislation was secured grant-ing co-ops exemption from certain taxes and providing them with preferential access to public works projects. Favored in this way by the state and enjoying widespread ideo-
logical approval, the cooperative movement grew such that by 1921 some 20,000 co-ops were operating (Ammirato 1996:78). The co-ops suffered during the years of Fascist government, but after the overthrow of Mus-solini they recovered and the state reverted to granting them various favors.4
In the 1970s co-ops secured further tax advantages, including exemption from all taxes on surpluses channeled to the reserves. Public works projects (transport, housing, and schools) were steered toward co-ops and, to counter unemployment among young people, the state provided financial support to youths starting cooperative ventures. In 1977–79, almost 1,300 co-ops were formed in this manner (Ammirato 1996:95).
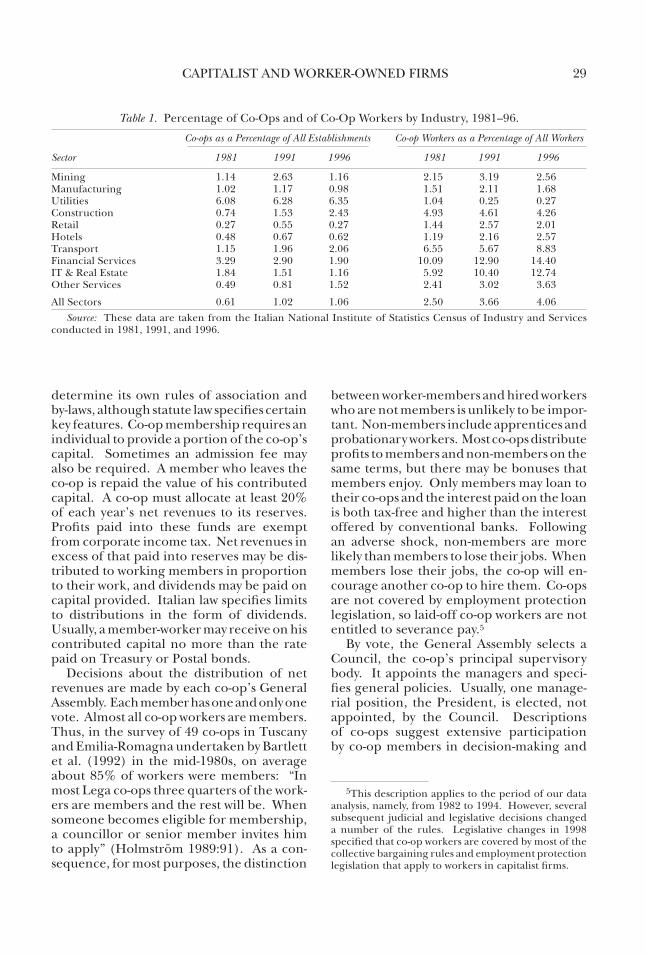
The environment of the 1980s was less hospitable to the co-ops. Facing reduced financial support as the state strove to cor-rect its large fiscal deficits, co-ops modified their vision. They tried to shed their image of working-class culture and aversion to pri-vate enterprise and they adopted an attitude favorable to economic efficiency and financial incentives. Co-op members were encouraged to view their organization as purely a financial investment and monetary incentives were provided to bolster this view. Increasingly, supervisors with a practical business mentality were hired into the co-ops from outside the co-op movement. The Census data in Table 1 indicate that, over the period of our empirical analysis from the early 1980s to the mid-1990s, worker co-ops grew in Italy. Nevertheless, by 1996, employment in co-ops constituted only 4% of total employment, with greater representation in construction, transport, and some service industries.
Structure of Co-ops
According to Italian law, each co-op may
4The Basevi Law of 1947 granted co-ops tax benefits, the amount of which depended on the importance of labor costs in total costs. At maximum, a co-op was ex-empted from paying all taxes if labor costs represented 60% or more (reduced to 50% or more in 1992) of total costs (excluding raw material costs). The law also regulated other financial aspects of co-ops, including the amount each worker could invest in the organiza-tion and the maximum interest he could earn on this capital. These limits were eased in 1971.
CAPITALIST AND WORKER-OWNED FIRMS 29
determine its own rules of association and by-laws, although statute law specifies certain key features. Co-op membership requires an individual to provide a portion of the co-op’s capital. Sometimes an admission fee may also be required. A member who leaves the co-op is repaid the value of his contributed capital. A co-op must allocate at least 20% of each year’s net revenues to its reserves. Profits paid into these funds are exempt from corporate income tax. Net revenues in excess of that paid into reserves may be dis-tributed to working members in proportion to their work, and dividends may be paid on capital provided. Italian law specifies limits to distributions in the form of dividends. Usually, a member-worker may receive on his contributed capital no more than the rate paid on Treasury or Postal bonds.
Decisions about the distribution of net revenues are made by each co-op’s General Assembly. Each member has one and only one vote. Almost all co-op workers are members. Thus, in the survey of 49 co-ops in Tuscany and Emilia-Romagna undertaken by Bartlett et al. (1992) in the mid-1980s, on average about 85% of workers were members: “In most Lega co-ops three quarters of the work-ers are members and the rest will be. When someone becomes eligible for membership, a councillor or senior member invites him to apply” (Holmström 1989:91). As a con-sequence, for most purposes, the distinction
between worker-members and hired workers who are not members is unlikely to be impor-tant. Non-members include apprentices and probationary workers. Most co-ops distribute profits to members and non-members on the same terms, but there may be bonuses that members enjoy. Only members may loan to their co-ops and the interest paid on the loan is both tax-free and higher than the interest offered by conventional banks. Following an adverse shock, non-members are more likely than members to lose their jobs. When members lose their jobs, the co-op will en-courage another co-op to hire them. Co-ops are not covered by employment protection legislation, so laid-off co-op workers are not entitled to severance pay.5
By vote, the General Assembly selects a Council, the co-op’s principal supervisory body. It appoints the managers and speci-fies general policies. Usually, one manage-rial position, the President, is elected, not appointed, by the Council. Descriptions of co-ops suggest extensive participation by co-op members in decision-making and
Table 1. Percentage of Co-Ops and of Co-Op Workers by Industry, 1981–96.
Co-ops as a Percentage of All Establishments Co-op Workers as a Percentage of All Workers
Sector 1981 1991 1996 1981 1991 1996
Mining 1.14 2.63 1.16 2.15 3.19 2.56Manufacturing 1.02 1.17 0.98 1.51 2.11 1.68Utilities 6.08 6.28 6.35 1.04 0.25 0.27Construction 0.74 1.53 2.43 4.93 4.61 4.26Retail 0.27 0.55 0.27 1.44 2.57 2.01Hotels 0.48 0.67 0.62 1.19 2.16 2.57Transport 1.15 1.96 2.06 6.55 5.67 8.83Financial Services 3.29 2.90 1.90 10.09 12.90 14.40IT & Real Estate 1.84 1.51 1.16 5.92 10.40 12.74Other Services 0.49 0.81 1.52 2.41 3.02 3.63
All Sectors 0.61 1.02 1.06 2.50 3.66 4.06Source: These data are taken from the Italian National Institute of Statistics Census of Industry and Services
conducted in 1981, 1991, and 1996.
5This description applies to the period of our data analysis, namely, from 1982 to 1994. However, several subsequent judicial and legislative decisions changed a number of the rules. Legislative changes in 1998 specified that co-op workers are covered by most of the collective bargaining rules and employment protection legislation that apply to workers in capitalist firms.
30 INDUSTRIAL AND LABOR RELATIONS REVIEW
considerable turnover of officers (Holm-ström 1989).
Often basic pay scales in co-ops are those negotiated by the national union and the relevant confederation of employers at the regional or national level, but supplementary payments, as well as promotions, working conditions, and grievances, are determined inside the enterprise. Earnings may therefore exceed the regionally negotiated or nationally negotiated minima and there may be consid-erable differences in pay across firms in the same industry or region. When wages tend to lie above those set down in multi-employer collective bargaining agreements, it is dif-ficult to gauge the extent to which the wage structure diverges from that which would obtain in the absence of unionism.
Within the co-op, the union may have a well-defined role in serving the interests of workers who are not members, although, usually, these constitute a small minority of a co-op’s work force and, in any event, most non-members aspire to and will become members. The union may also have a role if the co-op’s representation mechanisms are not functioning well and a group of workers feel their interests are being slighted. How-ever, a basic co-op principle is that workers participate in the enterprise’s governance, and if the mechanisms for worker participa-tion are functioning as designed, it is not clear what constructive role can be played within the co-op by a union. A union’s role as watchdog of management seems anoma-lous when the workers select and have the authority to dismiss the managers. (See Holmström 1989:89–108; Thornley 1983; Earle 1986.)
III. Two Sources of Data
Two types of data are exploited in this paper. One is an annual survey of companies and the other is an annual survey of workers. The survey of workers is based on Social Se-curity records. Because these records cover a number of years and include employer tax codes, they allow for the construction of a matched employer-worker longitudinal data set. Consider first the information contained in the company survey.
The Survey of Companies
The company data are drawn from the archives of the Italian Company Accounts Data Service, which collects balance sheet information and other items on over 30,000 Italian firms. Available since 1982, the data are gathered by Centrale dei Bilanci, an organization established in the early 1980s jointly by the Bank of Italy, the Italian Bank-ing Association (ABI), and a pool of leading banks to construct and share information on borrowers. Besides balance sheet items, there is information on the level of employ-ment, on the establishment’s flow of funds, and on various attributes of the firm such as the year founded, its location, its legal form of organization, its ownership status, and its control structure. The entry on the legal form of organization allows the identifica-tion of co-ops.
Balance sheets for the banks’ major clients (defined according to the level of borrow-ing) are collected by the banks. The focus on the level of borrowing skews the sample toward larger firms. The aim of increasing the representation of medium-sized firms, however, resulted in an increase in the sample size in 1993. Consequently, since 1993, more companies from the middle range of the size distribution are included. Given that our method is not based on time series comparisons and we invariably include time dummy variables in our statistical analysis, this change in sampling in 1993 and 1994 should not affect our results.
Because most of the leading banks are in the northern part of the country, the sample has more firms headquartered in the North than in the South. Also, banks deal mainly with firms with a good history of borrowing, so the sample is tilted toward the more cred-itworthy firms. Even with these restrictions, these data provide a very comprehensive description of Italian firms. The firms in-cluded in the sample (which excludes the public sector) account for more than 50% of total employment in Italy (Cingano and Schivardi 2004).
Descriptive statistics on the firm sample for three representative years are provided in Table 2, which restricts the data to the
CAPITALIST AND WORKER-OWNED FIRMS 31
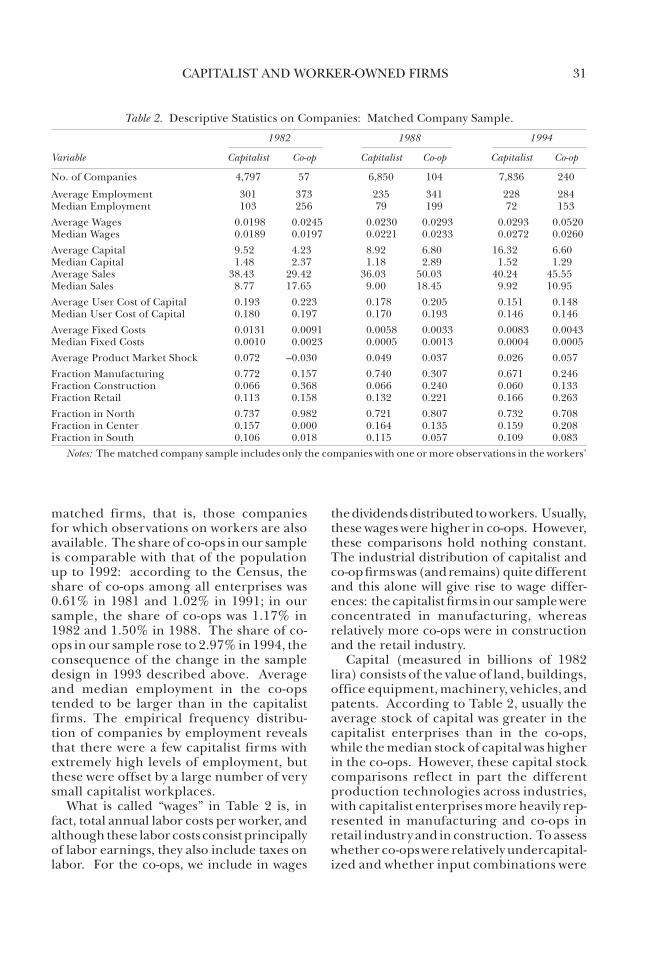
matched firms, that is, those companies for which observations on workers are also available. The share of co-ops in our sample is comparable with that of the population up to 1992: according to the Census, the share of co-ops among all enterprises was 0.61% in 1981 and 1.02% in 1991; in our sample, the share of co-ops was 1.17% in 1982 and 1.50% in 1988. The share of co-ops in our sample rose to 2.97% in 1994, the consequence of the change in the sample design in 1993 described above. Average and median employment in the co-ops tended to be larger than in the capitalist firms. The empirical frequency distribu-tion of companies by employment reveals that there were a few capitalist firms with extremely high levels of employment, but these were offset by a large number of very small capitalist workplaces.
What is called “wages” in Table 2 is, in fact, total annual labor costs per worker, and although these labor costs consist principally of labor earnings, they also include taxes on labor. For the co-ops, we include in wages
the dividends distributed to workers. Usually, these wages were higher in co-ops. However, these comparisons hold nothing constant. The industrial distribution of capitalist and co-op firms was (and remains) quite different and this alone will give rise to wage differ-ences: the capitalist firms in our sample were concentrated in manufacturing, whereas relatively more co-ops were in construction and the retail industry.
Capital (measured in billions of 1982 lira) consists of the value of land, buildings, office equipment, machinery, vehicles, and patents. According to Table 2, usually the average stock of capital was greater in the capitalist enterprises than in the co-ops, while the median stock of capital was higher in the co-ops. However, these capital stock comparisons reflect in part the different production technologies across industries, with capitalist enterprises more heavily rep-resented in manufacturing and co-ops in retail industry and in construction. To assess whether co-ops were relatively undercapital-ized and whether input combinations were
Table 2. Descriptive Statistics on Companies: Matched Company Sample.
1982 1988 1994
Variable Capitalist Co-op Capitalist Co-op Capitalist Co-op
No. of Companies 4,797 57 6,850 104 7,836 240
Average Employment 301 373 235 341 228 284Median Employment 103 256 79 199 72 153Average Wages 0.0198 0.0245 0.0230 0.0293 0.0293 0.0520Median Wages 0.0189 0.0197 0.0221 0.0233 0.0272 0.0260Average Capital 9.52 4.23 8.92 6.80 16.32 6.60Median Capital 1.48 2.37 1.18 2.89 1.52 1.29Average Sales 38.43 29.42 36.03 50.03 40.24 45.55Median Sales 8.77 17.65 9.00 18.45 9.92 10.95Average User Cost of Capital 0.193 0.223 0.178 0.205 0.151 0.148Median User Cost of Capital 0.180 0.197 0.170 0.193 0.146 0.146Average Fixed Costs 0.0131 0.0091 0.0058 0.0033 0.0083 0.0043Median Fixed Costs 0.0010 0.0023 0.0005 0.0013 0.0004 0.0005Average Product Market Shock 0.072 –0.030 0.049 0.037 0.026 0.057Fraction Manufacturing 0.772 0.157 0.740 0.307 0.671 0.246Fraction Construction 0.066 0.368 0.066 0.240 0.060 0.133Fraction Retail 0.113 0.158 0.132 0.221 0.166 0.263Fraction in North 0.737 0.982 0.721 0.807 0.732 0.708Fraction in Center 0.157 0.000 0.164 0.135 0.159 0.208Fraction in South 0.106 0.018 0.115 0.057 0.109 0.083
Notes: The matched company sample includes only the companies with one or more observations in the workers’
32 INDUSTRIAL AND LABOR RELATIONS REVIEW
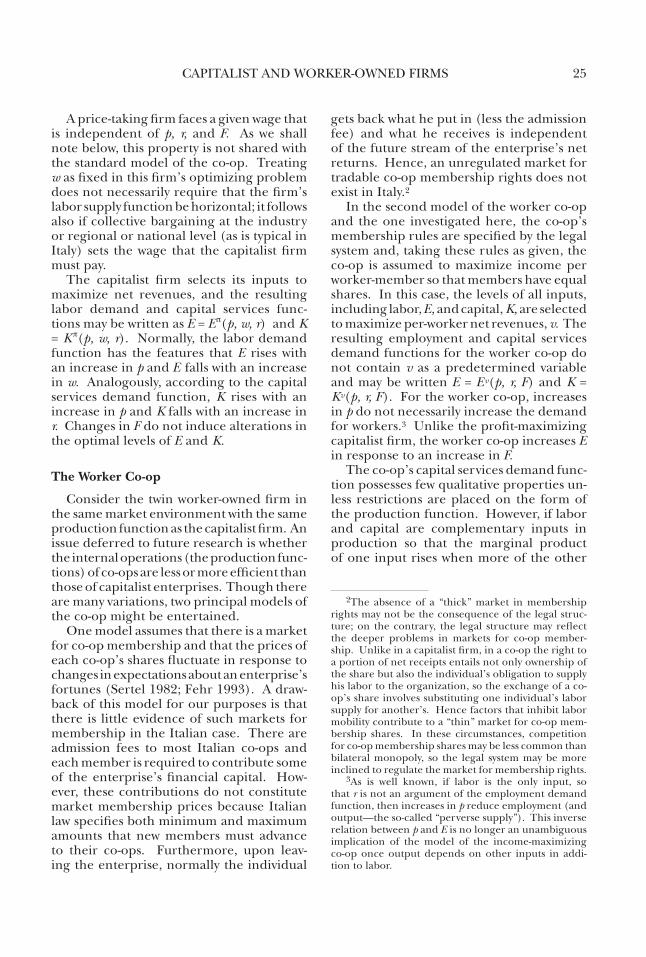
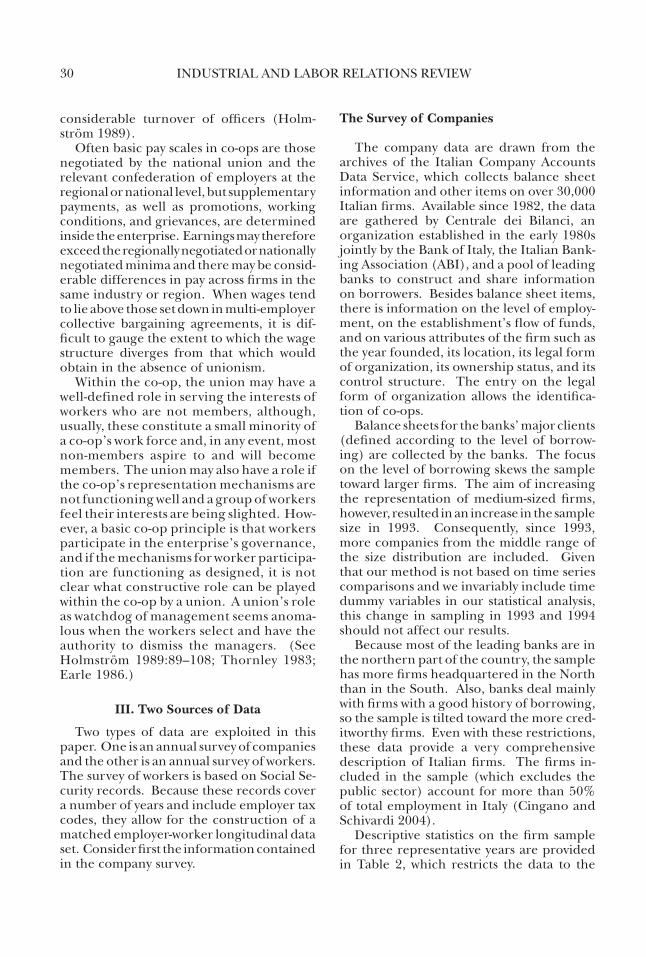
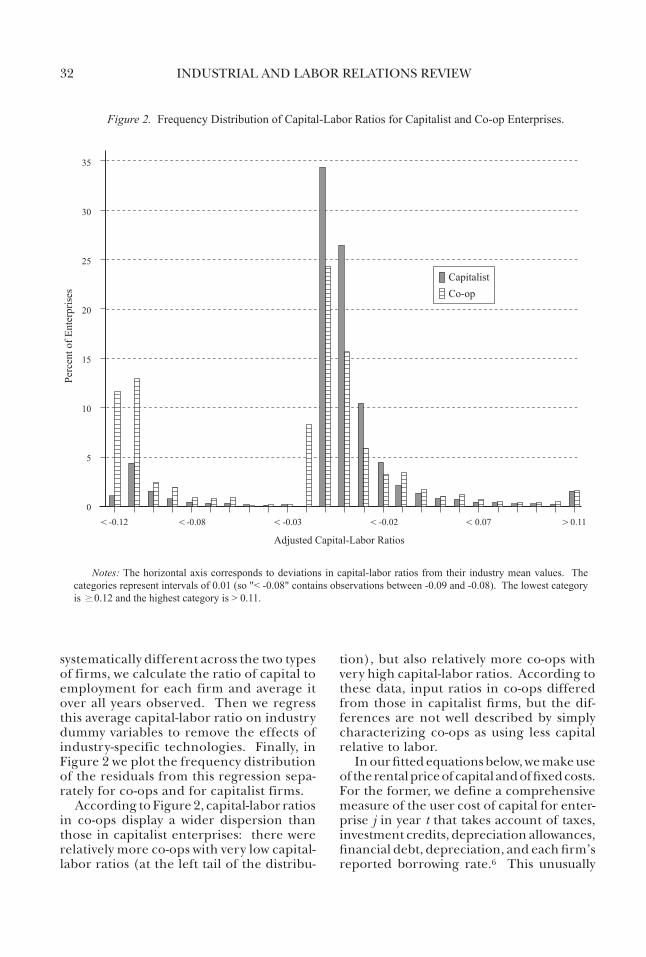
systematically different across the two types of firms, we calculate the ratio of capital to employment for each firm and average it over all years observed. Then we regress this average capital-labor ratio on industry dummy variables to remove the effects of industry-specific technologies. Finally, in Figure 2 we plot the frequency distribution of the residuals from this regression sepa-rately for co-ops and for capitalist firms.
According to Figure 2, capital-labor ratios in co-ops display a wider dispersion than those in capitalist enterprises: there were relatively more co-ops with very low capital-labor ratios (at the left tail of the distribu-
tion), but also relatively more co-ops with very high capital-labor ratios. According to these data, input ratios in co-ops differed from those in capitalist firms, but the dif-ferences are not well described by simply characterizing co-ops as using less capital relative to labor.
In our fitted equations below, we make use of the rental price of capital and of fixed costs. For the former, we define a comprehensive measure of the user cost of capital for enter-prise j in year t that takes account of taxes, investment credits, depreciation allowances, financial debt, depreciation, and each firm’s reported borrowing rate.6 This unusually
Figure 2. Frequency Distribution of Capital-Labor Ratios for Capitalist and Co-op Enterprises.
Perc
ento
fEnt
erpr
ises
35
30
25
20
15
10
5
0
Adjusted Capital-Labor Ratios
-0.12 -0.08 -0.03 -0.02 0.07 0.11< <<< < >
CapitalistCo-op
Pncvl et al. 2 of 2
Notes: The horizontal axis corresponds to deviations in capital-labor ratios from their industry mean values. Thecategories represent intervals of 0.01 (so "< -0.08" contains observations between -0.09 and -0.08). The lowest categoryis 0.12 and the highest category is > 0.11.
CAPITALIST AND WORKER-OWNED FIRMS 33
precise measure of the user cost of capital, denoted rjt, has a mean value of 0.197.
To measure fixed costs, Fjt, we use each company’s long-term debt payments in each year (measured in real terms). These long-term debts represent contractual payments the firm must make on its commitments from previous years and they correspond to the unavoidable nature of fixed costs in economic models of the firm. These ex-penditures, which must be made regardless of the enterprise’s decisions and actions, illustrate the principle that “sunk costs are sunk.” The mean of Fjt is 0.005 and its fre-quency distribution is skewed to the right, with 25% of observations having a Fjt value of zero. This definition of fixed costs is the best available in these data.7 To ensure that our results with respect to other relationships are not simply an artifact of this particular way of computing fixed costs, all the equa-tions reported below were estimated also by omitting this measure of Fjt .
The argument in Section I also alluded to the effects on wages and employment of transitory product market shocks. With the available data, such shocks for each firm in a given year are measured by the deviation of its sales in that year from the sales predicted by a linear regression. More precisely, we regress the logarithm of real sales on a firm
fixed effect and a linear time trend and allow this trend to be different across industries and across regions of the country. Then we mea-sure the product market shock for each firm in each year by the deviation of the logarithm of real sales from the value predicted from this regression (including the firm’s fixed effect).8 In our estimating equations below, this variable is denoted by Sjt, an indicator of firm j’s transitory shocks in the product market in year t; in Table 2, this variable is labeled “product market shock.”
The Survey of Workers
The Italian National Institute for Social Security (Istituto Nazionale della Previdenza Sociale) requires firms to file a yearly report for each worker on their payroll. The data are used to estimate the amount of withhold-ing tax the employer has to pay on behalf of the employees and to the INPS as contribu-tions for pensions and health insurance. The forms are roughly comparable to those collected by the Internal Revenue Service in the United States. However, while U.S. administrative data are usually provided on a grouped basis, the INPS has truly individual records. Moreover, in the United States, earnings records are censored at the top of the tax bracket, while the Italian data are not subject to top-coding.
The data cover all employees in the pri-vate sector. The INPS supplies observations on a subsample of the universe, namely, all those workers born on two particular days of the year. We restrict the data to the period from 1982 to 1994 so they can be paired with the establishment data. The form reports information on each worker’s annual earnings and on the number of days and weeks worked.9
6To be precise, the user cost of capital for establish-ment j in year t is given by
rjt = (1 – sjt)(1 – tjt)–1[gjtijt(1 – tjt) +
(1 + gjt)et – pjt + djt],
where s reflects corporate tax rates, investment tax cred-its, depreciation allowances, and subsidies (which vary by region), t is the corporate tax rate, g is the ratio of financial debt to total liabilities, i is the average borrowing rate paid by the firm, e is the nominal return on equity (the yield on Italian Treasury bonds), p is the sector-specific expected increase in the prices of capital goods (from the Bank of Italy survey of investment in manufac-turing), and d is the sector-specific rate of depreciation.
7Fjt is defined as (Djt.Jt)/(ppi)t , where (ppi) is the producer price index, D is the stock of long-term debt to all financial intermediaries, and J is the long-term nomi-nal interest rate on borrowing. The latter is regarded as confidential information and is not available for any establishment, so we use the economy-wide medium and long-term rate on bank borrowing. Fixed costs are measured in hundreds of billions of 1982 lira.
8Other specifications of the equation imput-ing product market shocks were applied with small consequences for the estimates reported below. Of course, if Sjt were pure measurement error, it should be uncorrelated with wages and employment.
9Information on hours worked is not available, though there is less variation in hours worked in Italy than in many other countries. Wages consist of two components: normal and occasional. Occasional wages
34 INDUSTRIAL AND LABOR RELATIONS REVIEW
Workers are identified by broad job cate-gory: apprentices, production workers, cleri-cal workers, and managers. Information on education is unavailable, but days and weeks of work and the date employment ended (if this occurs) are provided. From each worker’s social security number, information can be retrieved on the worker’s gender, year of birth (and thus age), and place of birth. Finally, the employer’s tax code allows us to match information on the worker with that on the firm.
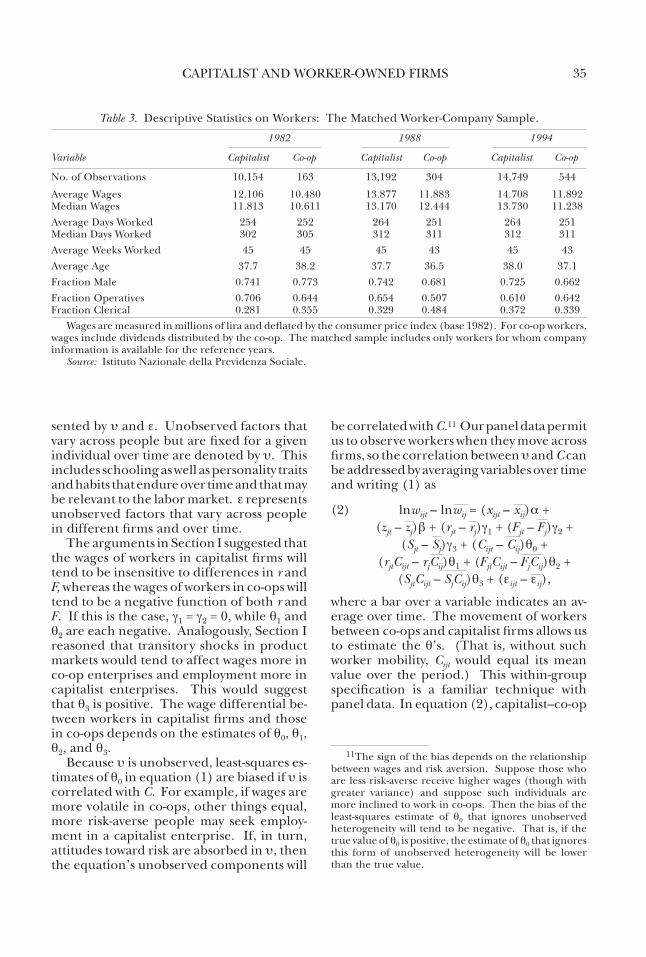
Table 3 presents information on the char-acteristics of workers matched with their workplaces. Workers aged less than 18 years and more than 65 years are omitted, as are all those observations lacking data on wages and the extent of work in the year. Whereas the unit of observation in Table 2 is the company, the unit of observation in Table 3 is the worker. According to the observa-tions on workers, average and median wages were a little lower for co-op workers than for workers in capitalist firms. When a simple descriptive regression equation is fitted to the company data and to the worker data, holding constant region and industry, the wage dif-ference between the co-ops and the capitalist enterprises measured in the company data and in the worker data is similar.10
IV. Empirical Specifications and Results for Wages
A priori reasoning in Section I could not yield a prediction regarding the sign of the co-op–capitalist wage differential, although we surmised that, whereas wages in capitalist firms are independent of variations in the prices of non-labor inputs (in particular, of rjt, the user cost of capital) and of fixed costs, Fjt, the wages of co-op workers are lower when rjt and Fjt are each higher. Also, the models of the capitalist firm and the worker co-op in Section I hypothesized that wages would tend to be more volatile in the co-op. That is, when the capitalist firm operates with a horizontal labor supply curve or when wages are fixed by multi-employer collective bargaining agreements, wages in the capital-ist firm are independent of shocks to the firm’s labor demand function. Such shocks will have first-order effects on employment, hours, and other input quantities such as capital. By contrast, in the co-op, shocks to labor demand will be directly transmitted to the co-op workers’ wages.
Using these data to address these issues, our observations on wages describe worker i in company j in calendar year t. These are unbalanced data because a worker may not be observed in every year. If a worker was employed by two firms in a year, there will be two observations on this worker that year. An equation that provides a method to investigate these differences in wages among individuals in capitalist firms and worker co-ops is
(1) lnwijt = xijta + zjtb + rjtg1 + Fjtg2 + Sjtg3 + Cijtq0 + rjtCijtq1 + FjtCijtq2 + SjtCijtq3 + ui + eijt,
where lnw stands for the logarithm of real wages, x are observed characteristics of the individual worker, z are observed features of the enterprise where the individual works, and C is a indicator taking the value of unity when individual i works in a co-op. rjt is the user cost of capital, Fjt is fixed costs, and, as described in Section III, Sjt is our measure of observed transitory shocks to firm j’s product market in year t. Factors that affect wages but are unobserved by the researcher are repre-
include sums drawn from the wage supplementation fund for laid-off or short-time workers, seniority and loyalty premia, one-time bonuses, moving expenses and business travel refunds, the monetary value of goods in kind, and allowances for lost tips and commissions. On average, occasional wages are less than 10% of the total. Our measure of gross wages is the sum of the two components. For co-op workers, wages include dividends distributed to them by their firm, where the information about dividends comes from the company data set.
10More precisely, for the data on individual workers, we regressed the logarithm of real annual wages on indus-try dummy variables, regional dummy variables, calendar year dummy variables, and a dummy variable taking the value of unity for a co-op observation. Similarly, for the data on establishments, we regressed the logarithm of real annual labor costs per worker on the same set of variables. In the former regression the estimated coef-ficient on the co-op dummy was –0.083 (with an estimated standard error of 0.015), and in the latter regression it was –0.016 (with an estimated standard error of 0.007). Given the different concepts, it is natural that the two estimates should not be identical. However, their com-mon sign and similar magnitude suggest that the “raw” differences in Tables 2 and 3 conceal basic similarities.
CAPITALIST AND WORKER-OWNED FIRMS 35
sented by u and e. Unobserved factors that vary across people but are fixed for a given individual over time are denoted by u. This includes schooling as well as personality traits and habits that endure over time and that may be relevant to the labor market. e represents unobserved factors that vary across people in different firms and over time.
The arguments in Section I suggested that the wages of workers in capitalist firms will tend to be insensitive to differences in r and F, whereas the wages of workers in co-ops will tend to be a negative function of both r and F. If this is the case, g1 = g2 = 0, while q1 and q2 are each negative. Analogously, Section I reasoned that transitory shocks in product markets would tend to affect wages more in co-op enterprises and employment more in capitalist enterprises. This would suggest that q3 is positive. The wage differential be-tween workers in capitalist firms and those in co-ops depends on the estimates of q0, q1, q2, and q3.
Because u is unobserved, least-squares es-timates of q0 in equation (1) are biased if u is correlated with C. For example, if wages are more volatile in co-ops, other things equal, more risk-averse people may seek employ-ment in a capitalist enterprise. If, in turn, attitudes toward risk are absorbed in u, then the equation’s unobserved components will
be correlated with C.11 Our panel data permit us to observe workers when they move across firms, so the correlation between u and C can be addressed by averaging variables over time and writing (1) as
(2) lnwijt – lnwij = (xijt – xij)a + (zjt – zj)b + (rjt – rj)g1 + (Fjt – Fj)g2 + (Sjt – Sj)g3 + (Cijt – Cij)q0 + (rjtCijt – rjCij)q1 + (FjtCijt – FjCij)q2 + (SjtCijt – SjCij)q3 + (eijt – eij),
where a bar over a variable indicates an av-erage over time. The movement of workers between co-ops and capitalist firms allows us to estimate the q’s. (That is, without such worker mobility, Cijt would equal its mean value over the period.) This within-group specification is a familiar technique with panel data. In equation (2), capitalist–co-op
Table 3. Descriptive Statistics on Workers: The Matched Worker-Company Sample.
1982 1988 1994
Variable Capitalist Co-op Capitalist Co-op Capitalist Co-op
No. of Observations 10,154 163 13,192 304 14,749 544
Average Wages 12.106 10.480 13.877 11.883 14.708 11.892Median Wages 11.813 10.611 13.170 12.444 13.730 11.238Average Days Worked 254 252 264 251 264 251Median Days Worked 302 305 312 311 312 311Average Weeks Worked 45 45 45 43 45 43Average Age 37.7 38.2 37.7 36.5 38.0 37.1Fraction Male 0.741 0.773 0.742 0.681 0.725 0.662Fraction Operatives 0.706 0.644 0.654 0.507 0.610 0.642Fraction Clerical 0.281 0.355 0.329 0.484 0.372 0.339
Wages are measured in millions of lira and deflated by the consumer price index (base 1982). For co-op workers, wages include dividends distributed by the co-op. The matched sample includes only workers for whom company information is available for the reference years.
Source: Istituto Nazionale della Previdenza Sociale.
11The sign of the bias depends on the relationship between wages and risk aversion. Suppose those who are less risk-averse receive higher wages (though with greater variance) and suppose such individuals are more inclined to work in co-ops. Then the bias of the least-squares estimate of q0 that ignores unobserved heterogeneity will tend to be negative. That is, if the true value of q0 is positive, the estimate of q0 that ignores this form of unobserved heterogeneity will be lower than the true value.
36 INDUSTRIAL AND LABOR RELATIONS REVIEW
wage differentials are measured controlling for unchanging characteristics of workers (such as schooling and gender), although the magnitude of the partial correlation between wages and each of the fixed char-acteristics of workers cannot be computed.12 In essence, equation (2) asks, what change in wages is experienced by a worker who moves between a co-op enterprise and a capitalist enterprise?
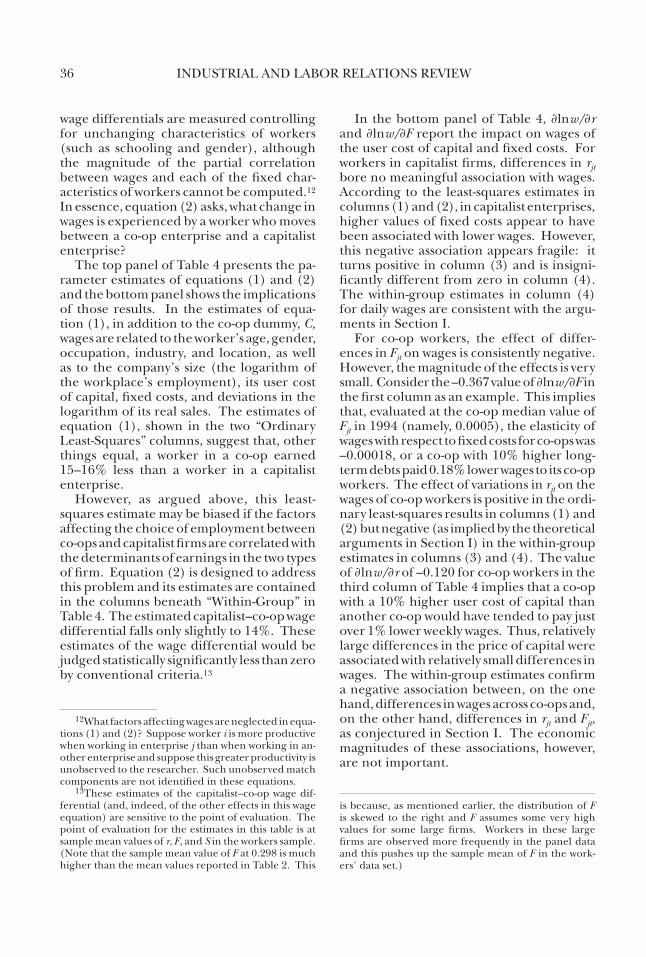
The top panel of Table 4 presents the pa-rameter estimates of equations (1) and (2) and the bottom panel shows the implications of those results. In the estimates of equa-tion (1), in addition to the co-op dummy, C, wages are related to the worker’s age, gender, occupation, industry, and location, as well as to the company’s size (the logarithm of the workplace’s employment), its user cost of capital, fixed costs, and deviations in the logarithm of its real sales. The estimates of equation (1), shown in the two “Ordinary Least-Squares” columns, suggest that, other things equal, a worker in a co-op earned 15–16% less than a worker in a capitalist enterprise.
However, as argued above, this least-squares estimate may be biased if the factors affecting the choice of employment between co-ops and capitalist firms are correlated with the determinants of earnings in the two types of firm. Equation (2) is designed to address this problem and its estimates are contained in the columns beneath “Within-Group” in Table 4. The estimated capitalist–co-op wage differential falls only slightly to 14%. These estimates of the wage differential would be judged statistically significantly less than zero by conventional criteria.13
In the bottom panel of Table 4, ∂lnw/∂r and ∂lnw/∂F report the impact on wages of the user cost of capital and fixed costs. For workers in capitalist firms, differences in rjt bore no meaningful association with wages. According to the least-squares estimates in columns (1) and (2), in capitalist enterprises, higher values of fixed costs appear to have been associated with lower wages. However, this negative association appears fragile: it turns positive in column (3) and is insigni-ficantly different from zero in column (4). The within-group estimates in column (4) for daily wages are consistent with the argu-ments in Section I.
For co-op workers, the effect of differ-ences in Fjt on wages is consistently negative. However, the magnitude of the effects is very small. Consider the –0.367 value of ∂lnw/∂F in the first column as an example. This implies that, evaluated at the co-op median value of Fjt in 1994 (namely, 0.0005), the elasticity of wages with respect to fixed costs for co-ops was –0.00018, or a co-op with 10% higher long-term debts paid 0.18% lower wages to its co-op workers. The effect of variations in rjt on the wages of co-op workers is positive in the ordi-nary least-squares results in columns (1) and (2) but negative (as implied by the theoretical arguments in Section I) in the within-group estimates in columns (3) and (4). The value of ∂lnw/∂r of –0.120 for co-op workers in the third column of Table 4 implies that a co-op with a 10% higher user cost of capital than another co-op would have tended to pay just over 1% lower weekly wages. Thus, relatively large differences in the price of capital were associated with relatively small differences in wages. The within-group estimates confirm a negative association between, on the one hand, differences in wages across co-ops and, on the other hand, differences in rjt and Fjt, as conjectured in Section I. The economic magnitudes of these associations, however, are not important.
12What factors affecting wages are neglected in equa-tions (1) and (2)? Suppose worker i is more productive when working in enterprise j than when working in an-other enterprise and suppose this greater productivity is unobserved to the researcher. Such unobserved match components are not identified in these equations.
13These estimates of the capitalist–co-op wage dif-ferential (and, indeed, of the other effects in this wage equation) are sensitive to the point of evaluation. The point of evaluation for the estimates in this table is at sample mean values of r, F, and S in the workers sample. (Note that the sample mean value of F at 0.298 is much higher than the mean values reported in Table 2. This
is because, as mentioned earlier, the distribution of F is skewed to the right and F assumes some very high values for some large firms. Workers in these large firms are observed more frequently in the panel data and this pushes up the sample mean of F in the work-ers’ data set.)
CAPITALIST AND WORKER-OWNED FIRMS 37
In describing models of the capitalist firm and the worker co-op in Section I, we hypothesized that wages would tend to be more volatile in the co-op. In particular, when the capitalist firm operates with a horizontal labor supply curve or when wages are fixed by multi-employer collective bargaining, wages in the capitalist firm are independent
of product market shocks to the firm’s labor demand function. Such shocks will have first-order effects on employment, hours, and other input quantities. This is not the case in the co-op, where shocks to labor demand will affect the co-op’s wages. The presence of Sjt in equations (1) and (2) is designed to measure these effects.
Table 4. Estimates of the Wage Equations (1) and (2).
Ordinary Least-Squares Within-Group
(1) (2) (3) (4)Description ln(Weekly Wages) ln(Daily Wages) ln(Weekly Wages) ln(Daily Wages)
Parameter Estimates
Co-op (C) –0.078 –0.095 0.028 0.015 (0.019) (0.018) (0.026) (0.026)User Cost of Capital (r) –0.011 –0.00 I –0.011 0.009 (0.012) (0.011) (0.010) (0.010)(User Cost of Capital)*Co-op 0.107 0.110 –0.110 –0.113 (0.084) (0.079) (0.084) (0.086)Fixed Costs (F) –0.004 –0.004 0.005 –0.002 (0.001) (0.001) (0.002) (0.002)(Fixed Costs)*Co-op –0.363 –0.247 –0.502 –0.463 (0.099) (0.093) (0.074) (0.075)Product Market Shock (S) 0.037 0.017 0.052 0.029 (0.003) (0.003) (0.002) (0.002)(Product Market Shock)*Co-op 0.032 0.045 0.052 0.078 (0.024) (0.022) (0.019) (0.019)
Implied Effects
Capitalist-Coop Log Wage Differential –0.164 –0.146 –0.140 –0.141 (0.028) (0.026) (0.028) (0.028)∂lnw/∂r: Capitalist Firms –0.011 –0.001 –0.011 0.009 (0.012) (0.011) (0.010) (0.010)∂lnw/∂r: Co-ops 0.096 0.110 –0.120 –0.104 (0.083) (0.078) (0.084) (0.085)∂lnw/∂F: Capitalist Firms –0.004 –0.004 0.005 –0.002 (0.001) (0.001) (0.002) (0.002)∂lnw/∂F: Co-ops –0.367 –0.252 –0.498 –0.465 (0.099) (0.093) (0.074) (0.075)∂lnw/∂S: Capitalist Firms 0.037 0.017 0.052 0.029 (0.003) (0.003) (0.002) (0.002)∂lnw/∂S: Co-ops 0.068 0.062 0.103 0.107 (0.024) (0.022) (0.019) (0.019)
Notes: Estimated standard errors are in parentheses beneath their estimated coefficients. In deriving the esti-mates of equation (1) reported in columns (1) and (2) above, in addition to the variables listed above, the equations are estimated including the following variables: age, age squared, gender, two regional variables (distinguishing the North, Center, and South), three industry variables (distinguishing manufacturing, construction, retail trade, and other industries), two occupation variables (distinguishing operatives, clerical workers, and managers), the logarithm of employment (to allow for any company size effects on wages), and dummy variables for each calendar year. The capitalist–co-op log wage differential is evaluated at the overall mean values for r, F, and S, namely, r = 0.188, F = 0.298, and S = 0.044. These equations use 137,682 observations.
38 INDUSTRIAL AND LABOR RELATIONS REVIEW
In fact, the estimated values of ∂ lnw/∂ S indicate that wages were responsive to product market shocks in both capitalist enterprises and co-ops. However, the posi-tive fillip to wages was larger in the co-ops and, in the within-group estimates, the in-teraction between S and the co-op dummy is significantly greater than zero (as judged by conventional statistical criteria). In the within-group estimates in columns (3) and (4), the effect of such shocks is roughly two to three times higher in co-ops than it is esti-mated to have been in capitalist enterprises: in co-ops, a positive 10% product market shock was associated with 1% higher wages, whereas in capitalist enterprises the same shock was associated with between 0.3% and 0.5% higher wages.14 These inferences are insensitive to the presence of fixed costs, Fjt, in the equation.
V. Empirical Specifications and Results for Employment and Capital
Employment
The models outlined in Section I suggest that, for capitalist firms, a causal relationship from wages to employment exists such that, other things equal, employment is a negative function of wages. For co-ops, wages are jointly determined with employment and a well-defined causal relationship from wages to employment does not obtain. In addition, the models in Section I imply that employment is independent of fixed costs in the capitalist enterprise but is a positive function of fixed costs in the co-op. Furthermore, employment is expected to be more responsive to transi-tory product market shocks experienced by the capitalist enterprise than to those expe-rienced by the co-op.
A specification enabling us to examine these differences between capitalist and co-op enterprises is
(3) lnEjt = lnwjth0 + (lnwjtCj)h1 + rjth2 + (rjtCj)h3 +Fjth4 + (FjtCj)h5 + Sjth6 + (SjtCj)h7 + zjty1 + w1j + v1jt,
where lnEjt stands for the logarithm of em-ployment and lnwjt represents the logarithm of real average annual wages in firm j in year t. The elasticity of employment with respect to wages in capitalist firms is given by h0. C takes the value of unity for a co-op and zero for a capitalist firm. The logarithmic employment-wage association in co-ops is given by h0 + h1.
The user cost of capital paid by the firm is given by r, the company’s fixed costs by F, and transitory product market shocks by S. Interactions between r and C and between F and C allow the effects on employment of input prices and fixed costs in co-ops to differ from those in capitalist firms. Interac-tions between S and C allow the two kinds of firms to differ, as well, in the employment impact of product market shocks. z stands for other observed attributes of firms, in-cluding their regional location and their general industry. Factors affecting the logarithm of employment but unobserved by the researcher are given by w and v. Those factors specific to each enterprise and constant over time are represented by w1j. v1jt stands for factors that vary across firms and over time.
A simple way of estimating equation (3) is to first-difference it from one year to the next and thereby eliminate the enterprise fixed effects, w1j. For the co-op enterprises, because wages are jointly determined with employment, we need to recognize the po-tential correlation between the equation’s stochastic term and wage changes. We cannot use a within-group strategy for employment as we have done for wages because, in addition to the problem of fixed unobserved hetero-geneity, we have the problem that the wage is endogenous, a problem we address using lagged values of the wage as instrumental variables. The endogeneity of wages means the wage is contemporaneously correlated
14This result is compatible with Guiso, Pistaferri, and Schivardi’s (2005) analysis of the transmission of firms’ shocks to wages. They found that permanent shocks to firms’ value added are transmitted to workers in the form of changes in their compensation, a finding that may be attributable to risk of bankruptcy and to incentive effects. The magnitude of the effect is small, however, and its estimation does not distinguish between co-ops and capitalist firms.
CAPITALIST AND WORKER-OWNED FIRMS 39
with the error term of the employment equa-tion. If we used a within-group strategy to remove the firm fixed effect, our instruments would be invalid (in short panels) because the within-group error term is the deviation of the original error term from its time-series mean and this contains its past values that are correlated with the past values of the wage. A first difference–instrumental variable strategy solves both the unobserved heterogeneity problem and the problem caused by the endogeneity of wages.
The wages of co-ops and capitalist firms are treated symmetrically so, using two-year and three-year lagged values as instruments, both Dln(wjt).C and Dln(wjt) are instrumented.15
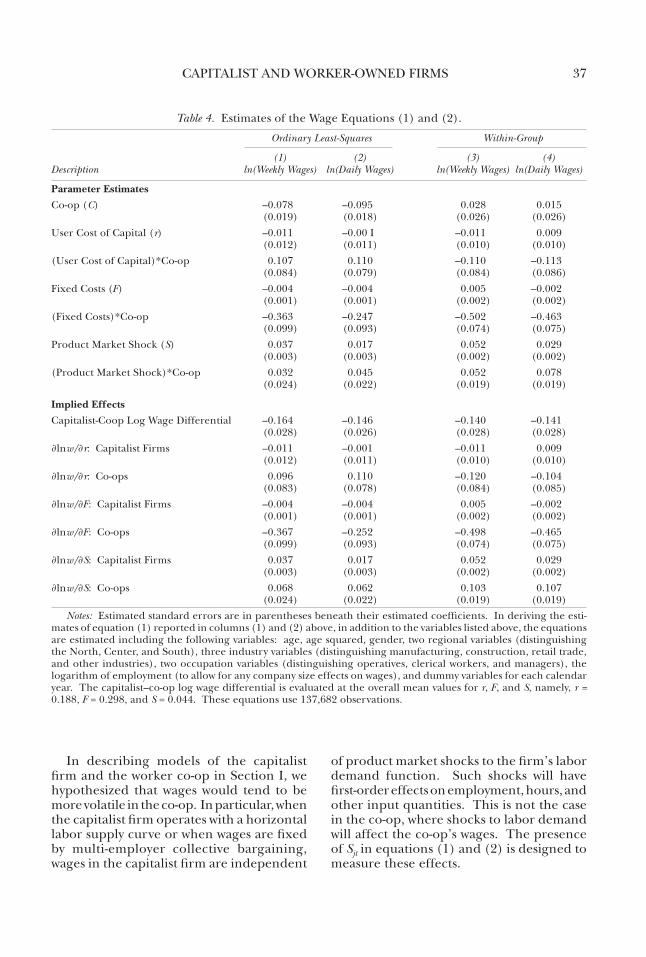
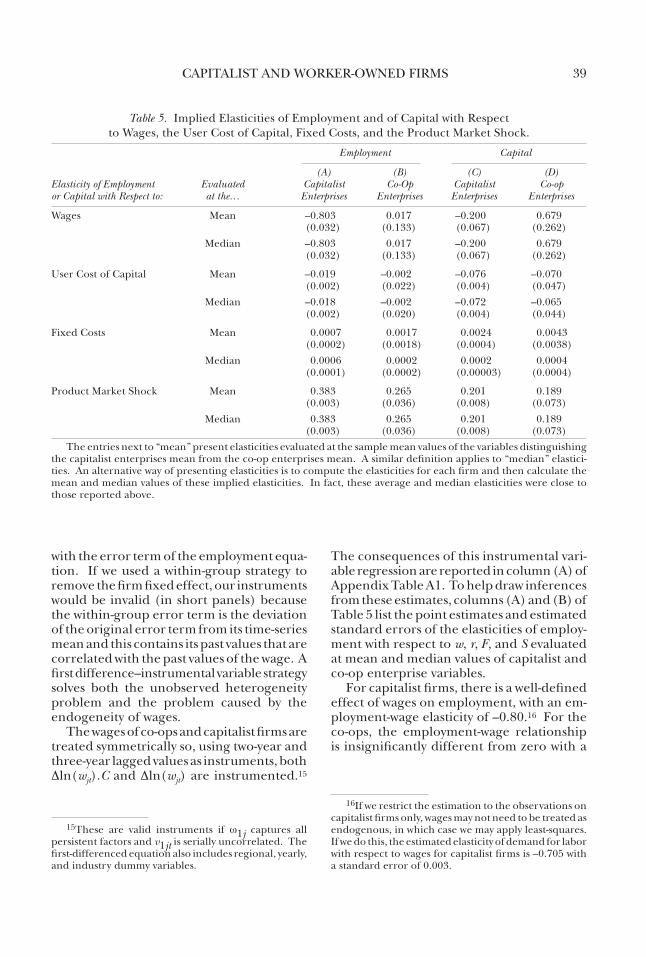
The consequences of this instrumental vari-able regression are reported in column (A) of Appendix Table A1. To help draw inferences from these estimates, columns (A) and (B) of Table 5 list the point estimates and estimated standard errors of the elasticities of employ-ment with respect to w, r, F, and S evaluated at mean and median values of capitalist and co-op enterprise variables.
For capitalist firms, there is a well-defined effect of wages on employment, with an em-ployment-wage elasticity of –0.80.16 For the co-ops, the employment-wage relationship is insignificantly different from zero with a
Table 5. Implied Elasticities of Employment and of Capital with Respect to Wages, the User Cost of Capital, Fixed Costs, and the Product Market Shock.
Employment Capital
(A) (B) (C) (D)Elasticity of Employment Evaluated Capitalist Co-Op Capitalist Co-op or Capital with Respect to: at the… Enterprises Enterprises Enterprises Enterprises
Wages Mean –0.803 0.017 –0.200 0.679 (0.032) (0.133) (0.067) (0.262) Median –0.803 0.017 –0.200 0.679 (0.032) (0.133) (0.067) (0.262)
User Cost of Capital Mean –0.019 –0.002 –0.076 –0.070 (0.002) (0.022) (0.004) (0.047) Median –0.018 –0.002 –0.072 –0.065 (0.002) (0.020) (0.004) (0.044)
Fixed Costs Mean 0.0007 0.0017 0.0024 0.0043 (0.0002) (0.0018) (0.0004) (0.0038) Median 0.0006 0.0002 0.0002 0.0004 (0.0001) (0.0002) (0.00003) (0.0004)
Product Market Shock Mean 0.383 0.265 0.201 0.189 (0.003) (0.036) (0.008) (0.073) Median 0.383 0.265 0.201 0.189 (0.003) (0.036) (0.008) (0.073)
The entries next to “mean” present elasticities evaluated at the sample mean values of the variables distinguishing the capitalist enterprises mean from the co-op enterprises mean. A similar definition applies to “median” elastici-ties. An alternative way of presenting elasticities is to compute the elasticities for each firm and then calculate the mean and median values of these implied elasticities. In fact, these average and median elasticities were close to those reported above.
15These are valid instruments if w1j captures all persistent factors and v1jt is serially uncorrelated. The first-differenced equation also includes regional, yearly, and industry dummy variables.
16If we restrict the estimation to the observations on capitalist firms only, wages may not need to be treated as endogenous, in which case we may apply least-squares. If we do this, the estimated elasticity of demand for labor with respect to wages for capitalist firms is –0.705 with a standard error of 0.003.
40 INDUSTRIAL AND LABOR RELATIONS REVIEW
very small point estimate.17 Employment in the capitalist firms is relatively insensitive to changes in the user cost of capital, r: a 10% increase in the user cost of capital reduces employment by 0.2%. This elasticity is even smaller for the co-ops and its point estimate is virtually zero. The estimates attached to fixed costs imply that, for both capitalist enter-prises and co-ops, employment was virtually independent of differences in fixed costs.
According to the estimates of the parame-ters attached to the transitory product market shock variable, employment in both capitalist and co-op enterprises responded positively to transitory product market shocks. How-ever, the employment response was smaller for co-ops than for capitalist enterprises and the interaction between the product market shock and the co-op dummy is significantly less than zero. A positive 10% product market shock is associated with almost 4% greater employment in the capitalist enterprises and about 2.5% greater employment in the co-ops. More generally, the estimates suggest that, for the co-ops, employment is relatively insensitive to changes in all the right-hand side variables, a finding that replicates previ-ous research on employment in co-operative enterprises (see Pencavel and Craig 1994).
Capital
A specification analogous to equation (3) may be applied to describe the use of physical capital across enterprises and years:
(4) lnKjt = lnwjtm0 + (lnwjtCj)m1 + rjtm2 + (rjtCj)m3 +Fjtm4 + (FjtCj)m5 + Sjtm6 + (SjtCj)m7 + zjty2 + w2j + v2jt,
where lnKjt stands for the logarithm of capital. Applying the same logic we did for employ-ment, we estimate this equation in first-
differences, treating Dln(wjt) and Dln(wjt).C as endogenous and using two-year and three-year lagged values of these variables as instrumental variables. The resulting estimates of equation (4) are contained in column (B) of Appendix Table A1 and their implications are presented in columns (C) and (D) of Table 5.
For the capitalist firms, the demand for capital with respect to the user cost of capital is negative; the coefficient on wages is also negative, so that capital and labor are comple-ments (as implied also by the estimates in column (A) for employment); and capital is relatively unresponsive to differences in fixed costs. The point estimates suggest that differences in fixed costs had larger ef-fects on capital for the co-ops than for the capitalist enterprises, although these co-op estimates are not calculated with precision. For co-ops, the association between capital and wages was positive. This finding is fully compatible with an income-maximizing in-stitution because wage income enters the co-op’s objective function. The co-ops and capitalist enterprises had similar elasticities of demand for capital with respect to the user cost of capital. Transitory product market shocks were associated with about the same changes in capital in the capitalist firms as in the co-ops: a positive 10% product market shock was associated with 2% greater use of capital in capitalist and co-op enterprises.
Assessment
These results are broadly compatible with the implications of the simple models of the capitalist firm and the co-op we sketched in Section I. Thus, a well-defined impact of wages on employment and on capital is im-plied by the textbook model of the capitalist firm and this is borne out by the estimates in Table 5: a negative employment-wage elasticity and a capital-wage elasticity are measured for capitalist enterprises. Because wages constitute the maximand for a co-op, the model of the income-maximizing co-op developed in Section I does not permit the question to be asked, “What is the effect of a co-op’s wages on employment and capital?”
Similarly, it is a fundamental implication of
17The absence of a meaningfult association between wages and employment in co-ops speaks to an alternative model that has been ascribed to Italian co-ops, namely one in which employment is maximized subject to paying a wage comparable to that paid by capitalist firms. If this were the case, increases in wages induced by union-management bargaining in the non–co-op sector would induce contractions of employment by co-ops, yet no such relationship is estimated for co-ops.
CAPITALIST AND WORKER-OWNED FIRMS 41
profit-maximizing behavior of the capitalist firm that, among firms remaining profitable, increases in fixed costs have no impact on employment. This is consistent with the very small estimated elasticities of employment and capital with respect to fixed costs. By contrast, increases in fixed costs are predicted to lead to greater employment and greater capital in co-ops. It takes a generous reading of our results to discern support for that pre-diction. This may suggest that our measure of fixed costs, long-term debt payments, is wanting: because this measure contains the price of financial capital, its variations could embody a price effect and not simply the ef-fect of changes in the enterprise’s contractual payments. More generally, for the co-ops, the use of employment and capital is pretty much independent of changes in fixed costs. The estimates of the coefficients on w, r, and S for both capitalist enterprises and co-ops are almost totally unaffected if the variable measuring fixed costs, F, is omitted from the estimating equations.
Finally, employment was somewhat more responsive to product market shocks in capitalist enterprises than in co-ops. This is consonant with the reasoning that transitory shocks affect wages more and employment less in co-ops than in capitalist firms. Product market shocks, we found, were associated with about the same changes in capital in capitalist enterprises as in co-ops.
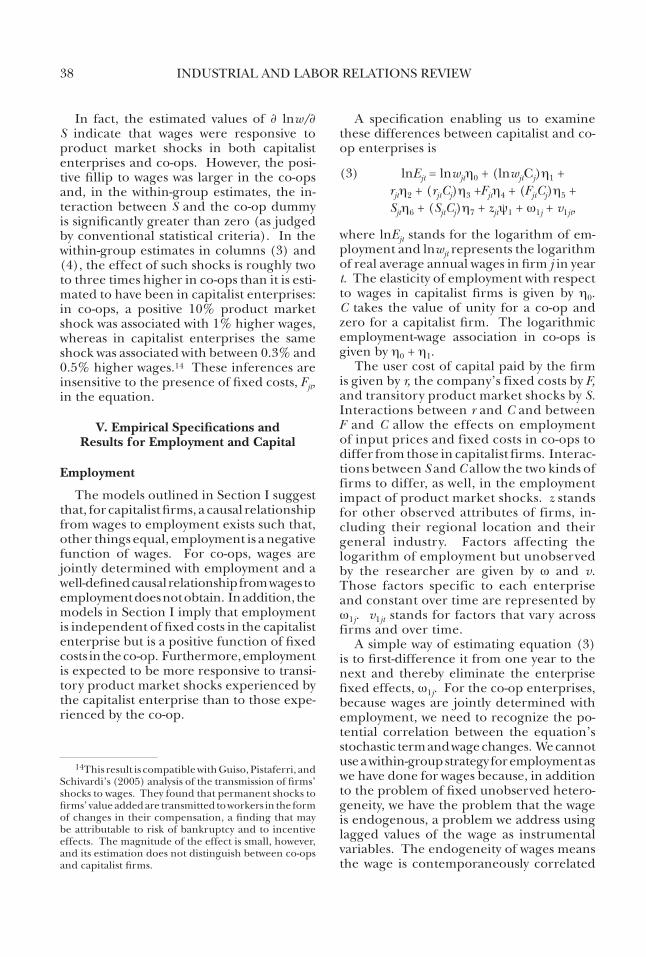
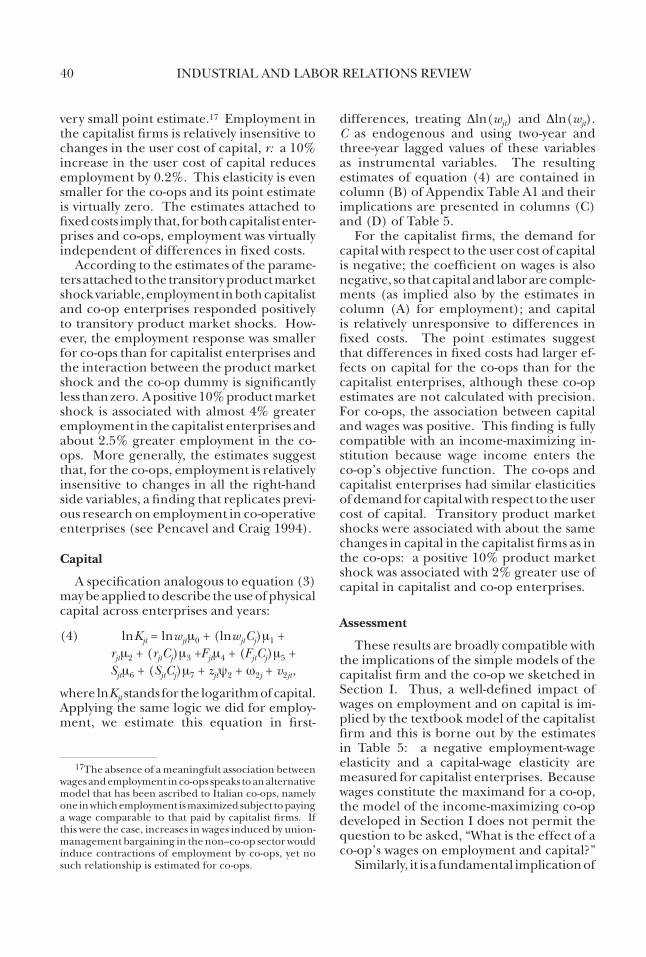
The estimates of equations (3) and (4) do not, of course, constitute the co-ops’ reduced form input demand functions, because the co-op worker’s wage appears on the right-hand side of these equations. Least-squares estimates of the coefficients on r, F , and S of the relevant input demand functions for the co-ops are reported in Table 6.18 The signs of each of the estimated coefficients in Table 6 are consistent with the arguments in Sec-tion I: employment is a positive function of
F and S; and, assuming labor and capital are complementary in the production function, the demand for capital is a negative function of r and a positive function of F and S. Though the statistical significance of differences in F is questionable, the measured effect of varia-tions in the user cost of capital on the demand for capital is economically meaningful: a 10-percentage-point increase in the user cost of capital reduced the demand for capital by almost 5%. These co-ops clearly altered their use of labor and capital in response to transitory product market shocks.
VI. Conclusions
We have used data on individual workers and individual companies to compare the wage and employment outcomes of capitalist enterprises with those of worker co-ops. We have also investigated differences in the use of capital. Previous research has relied on case studies to investigate these issues and has used data sets on workers and firms much smaller and less extensive than those we ex-ploit in this paper. In this sense, our results can claim to constitute general findings about capitalist and co-op enterprises. In organiz-ing our thoughts about these outcomes, we have drawn upon conventional models of the profit-maximizing capitalist enterprise and the income-maximizing worker co-op.
With respect to employment and capi-tal, these models’ implications are largely congruent with our empirical findings.
18These estimates are derived from using only the sample of co-op observations to regress the year-to-year change in employment and the year-to-year change in capital on the first differences in r, F, and S in addition to year dummy variables, region dummy variables, and industry dummy variables.
Table 6. Least-Squares Estimates of the Co-ops’ Input Demand Functions.
Right-Hand Side Variable ln(Employment) ln(Capital)
User Cost of Capital, r 0.061 –0.478 (0.186) (0.212)Fixed Costs, F 0.316 0.434 (0.373) (0.423)Product Market Shock, S 0.503 0.409 (0.035) (0.040)
R2 0.205 0.140nobs 975 969
Estimated standard errors are in parentheses beneath their estimated coefficients.
42 INDUSTRIAL AND LABOR RELATIONS REVIEW
That is, well-defined employment-wage and capital-wage relationships are estimated for capitalist firms that may be interpreted as the elasticities of demand for labor and for capital with respect to wages; the employment-wage elasticity is calculated to have been –0.80 and the capital-wage elasticity –0.20. The labor demand and the capital demand equations estimated for capitalist enterprises suggest that labor and capital were complements as increases in the cost of capital reduced employment and increases in wages reduced the use of capital.
For co-ops, the partial correlation be-tween wages and employment was essentially zero, while capital was higher in those co-ops paying relatively high wages. The income-maximizing model of the co-op suggests that these links between employment and wages and capital and wages are not causal. Con-sistent with the profit maximization model of the capitalist enterprise, employment and capital in such firms were unaffected by changes in fixed costs. Finally, employment was somewhat less responsive to product market shocks in co-ops than in capitalist firms, which is consistent with the notion that enterprises where workers command a greater voice will protect workers from employment reductions.
With respect to wages, we hypothesized that capitalist wages would not be corre-lated with input prices and fixed costs. The results in Table 4 suggest that, in the capi-talist enterprises we studied, the association between wages and the user cost of capital was certainly weak and the link between wages and fixed costs was fragile, in some instances positive and in other instances negative. As we surmised, wages tended to
be more sensitive to product market shocks in co-ops than in capitalist firms. Our simple model of the income-maximizing co-op led us to expect that co-op wages would be negatively associated with input prices and fixed costs and these hypotheses, at least for the within-group estimates, are consistent with our results. However, the magnitude of these links is small: we find that co-ops fac-ing a 10% higher price of capital tended to pay about 1% lower wages; co-ops with 10% higher fixed costs paid 0.18% lower wages to their co-op workers.
The empirical regularities we have docu-mented have been organized around simple income-maximizing models of the capitalist and co-op enterprises, and the implications of these models have generally fared well when pitted against the data. Consequently, the need for other models might seem less compelling even though, no doubt, imagi-native minds could advance other models. The hard work consists not in envisaging other models but, first, in identifying tests that discriminate between the simple mod-els advanced here and more complicated models, and, second, in organizing a large and representative set of data to speak to these tests.
Certainly, the models we have investigated ignore many confounding features, such as intertemporal considerations, the costs of making input adjustments, and issues associ-ated with bargaining. Moreover, because of lack of data, we have ignored the prices of many other inputs, such as raw materials and energy, and variations in these other input prices are not likely to be uncorrelated with variations in the price of capital. These issues warrant further investigation.
CAPITALIST AND WORKER-OWNED FIRMS 43
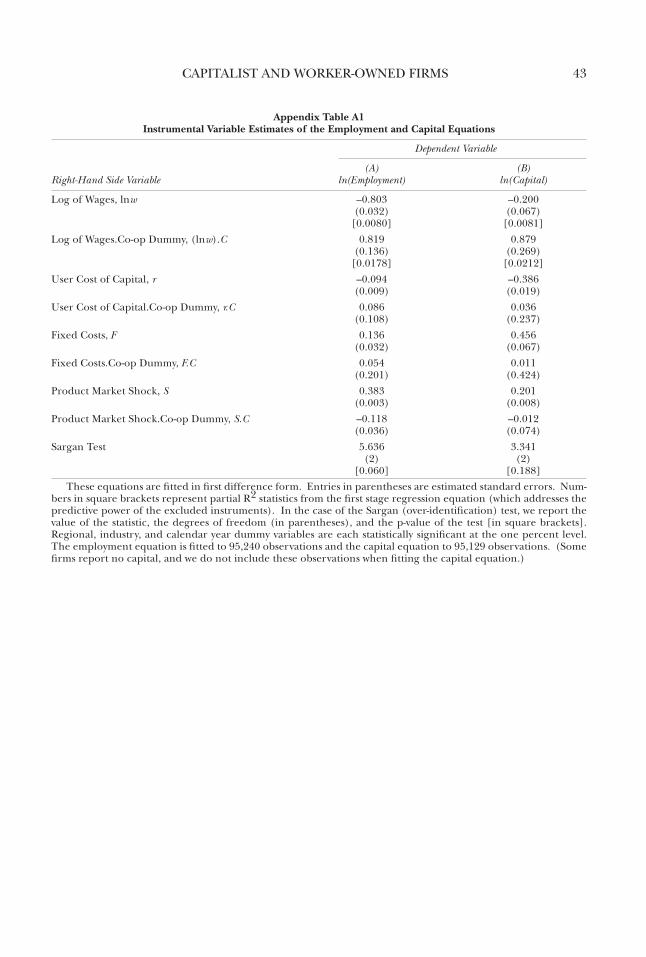
Appendix Table A1Instrumental Variable Estimates of the Employment and Capital Equations
Dependent Variable
(A) (B)Right-Hand Side Variable ln(Employment) ln(Capital)
Log of Wages, lnw –0.803 –0.200 (0.032) (0.067) [0.0080] [0.0081]Log of Wages.Co-op Dummy, (lnw).C 0.819 0.879 (0.136) (0.269) [0.0178] [0.0212]User Cost of Capital, r –0.094 –0.386 (0.009) (0.019)User Cost of Capital.Co-op Dummy, r.C 0.086 0.036 (0.108) (0.237)Fixed Costs, F 0.136 0.456 (0.032) (0.067)Fixed Costs.Co-op Dummy, F.C 0.054 0.011 (0.201) (0.424)Product Market Shock, S 0.383 0.201 (0.003) (0.008)Product Market Shock.Co-op Dummy, S.C –0.118 –0.012 (0.036) (0.074)Sargan Test 5.636 3.341 (2) (2) [0.060] [0.188]
These equations are fitted in first difference form. Entries in parentheses are estimated standard errors. Num-bers in square brackets represent partial R2 statistics from the first stage regression equation (which addresses the predictive power of the excluded instruments). In the case of the Sargan (over-identification) test, we report the value of the statistic, the degrees of freedom (in parentheses), and the p-value of the test [in square brackets]. Regional, industry, and calendar year dummy variables are each statistically significant at the one percent level. The employment equation is fitted to 95,240 observations and the capital equation to 95,129 observations. (Some firms report no capital, and we do not include these observations when fitting the capital equation.)
44 INDUSTRIAL AND LABOR RELATIONS REVIEW
REFERENCES
Ammirato, Piero. 1996. La Lega: The Making of a Suc-cessful Cooperative Network. Aldershot: Dartmouth Publishing.
Bartlett, Will, John Cable, Saul Estrin, Derek C. Jones, and Stephen C. Smith. 1992. “Labor-Managed Coop-eratives and Private Firms in North Central Italy: An Empirical Comparison.” Industrial and Labor Relations Review, Vol. 46, No. 1 (October), pp. 103–18.
Bond, Stephen, and John Van Reenan. 2006. “Micro-economic Models of Investment and Employment.” In James J. Heckman and Edward E. Leamer, eds., Handbook of Econometrics. Amsterdam: Elsevier, forthcoming.
Cingano, Federico, and Fabiano Schivardi. 2004. “Identifying the Sources of Local Productivity Growth.” Journal of the European Economic Association, Vol. 2, pp. 720–42.
Earle, John. 1986. The Italian Cooperative Movement. London: Allen & Unwin.
Fehr, Ernst. 1993. “The Simple Analytics of a Mem-bership Market in a Labor-Managed Economy.” In Samuel Bowles, Herbert Gintis, and Bo Gustafsson, eds., Markets and Democracy: Participation, Accountability, and Efficiency, pp. 260–76. Cambridge: Cambridge University Press.
Guiso, Luigi, Luigi Pistaferri, and Fabiano Schivardi. 2005. “Insurance within the Firm.” Journal of Political Economy, Vol. 113, No. 5 (October), pp. 1054–87.
Holmström, Mark. {{Gail: There should be an umlaut over the second o in “Holmstrom.”}} 1989. Industrial Democracy in Italy: Workers Co-ops and the Self-Management Debate. Aldershot: Gower.
Jones, Derek C., and Jan Svejnar. 1985. “Participation,
Profit-Sharing, Worker Ownership, and Efficiency in Italian Producer Cooperatives.” Economica, Vol. 52, No. 208 (November), pp. 449–65.
Pencavel, John. 2001. Worker Participation: Lessons from the Worker Co-ops of the Pacific Northwest. New York: Russell Sage Foundation.
Pencavel, John, and Ben Craig. 1994. “The Empiri-cal Performance of Orthodox Models of the Firm: Conventional Firms and Worker Cooperatives.” Journal of Political Economy, Vol. 102, No. 4 (August), pp. 718–44.
Russell, Raymond. 1985. Sharing Ownership in the Work-place. Albany: State University of New York Press.
Sertel, Murat R. 1982. “A Rehabilitation of the Labor-Managed Firm.” In Murat R. Sertel, ed., Workers and Incentives, pp. 11–26. Amsterdam: Contributions to Economic Analysis, Vol. 140, North-Holland.
Smith, Stephen C. 1994. “Innovation and Market Strat-egy in Italian Industrial Cooperatives: Econometric Evidence on Organizational Comparative Advantage.” Journal of Economic Behavior and Organization, Vol. 23, No. 3 (May), pp. 303–20.
Thornley, Jenny. 1983. “Workers’ Co-operatives and Trade Unions: The Italian Experience.” Economic and Industrial Democracy, Vol. 4, No. 3 (August), pp. 321–44.
Warhurst, Christopher. 1999. Between Market, State, and Kibbutz: The Management and Transformation of Socialist Industry. London: Mansell.
Whyte, William F., and Kathleen K. Whyte. 1991. Mak-ing Mondragon: The Growth and Dynamics of the Worker Cooperative Complex, 2nd ed. Ithaca, N.Y.: ILR Press, Cornell University.