wa health performance report health performance report | july to september 2015 quarter iii list of...
TRANSCRIPT

WA Health Performance ReportJuly to September 2015 Quarter
health.wa.gov.au

WA Health Performance Report | July to September 2015 Quarter
i
ContentsList of Acronyms iii
Introduction iv
Notes v
At a Glance vii
WA Health System Performance – Statewide viiWA Health System Performance – Metropolitan ixWA Health System Performance – Country xi
1. Public Hospital Separations 1
1.1 Separations 11.2 Acute Separations 21.3 Elective Acute Separations 31.4 Acute Medical Separations 41.5 Acute Surgical Separations 51.6 Renal Dialysis Separations 61.7 Acute Average Length of Stay 71.8 Newborn Separations 8
2. Public Hospital Capacity 9
2.1 Available Active Same-day Beds 92.2 Available Active Overnight Beds 102.3 Occupancy of Overnight beds 11
3. Elective Surgery Wait List 12
3.1 Patients on the Elective Surgery Wait List 123.2 Admissions from Elective Surgery Wait List 133.3 Median Waiting Time (In Months) 14
4. Public Emergency Departments (ED) 15
4.1 Total Emergency Department Attendances 154.2 ED Triage 1 164.3 ED Triage 2 174.4 ED Triage 3 184.5 ED Triage 4 194.6 ED Triage 5 204.7 Admissions from Emergency Departments 21
Contents

WA Health Performance Report | July to September 2015 Quarter
ii
5. Mental Health 22
5.1 Mental Health Separations 225.2 Mental Health Outpatients 23
6. Ambulatory Surgery Initiative (ASI) 24
6.1 Ambulatory Surgery Initiative Cases 24
7. Public Dental Health Clinics 25
7.1 Dental Visits 257.2 Dental Clinic Waiting List 26
8. Activity – General Practitioner (GP) After Hours Clinics 27
8.1 Clients attending GP After Hours Clinics 27
9. National Elective Surgery Targets 28
9.1 Elective Surgery Wait List Category 1 Cases Treated (Admitted) within the Clinically Recommended Time 299.2 Elective Surgery Wait List Category 2 Cases Treated (Admitted) within the Clinically Recommended Time 309.3 Elective Surgery Wait List Category 3 Cases Treated (Admitted) within the Clinically Recommended Time 319.4 Average Overdue Wait Time (Days) for Category 1 Cases 329.5 Average Overdue Wait Time (Days) for Category 2 Cases 339.6 Average Overdue Wait Time (Days) for Category 3 Cases 34
10. National Emergency Access Target (NEAT) 35
10.1 NEAT Total Emergency Department Attendances 3610.2 NEAT Total Admissions from Emergency Department 3710.3 NEAT Percentage of Emergency Department Attendances Admitted 3810.4 NEAT Total Mental Health Admissions from Emergency Department 3910.5 NEAT Total Emergency Department Attendances Transferred to another Hospital 4010.6 NEAT Percentage of Emergency Department Attendances with Length of Episode (LOE) of Four Hours or Less 4110.7 NEAT Percentage of Emergency Department Attendances with LOE greater than Twelve Hours 4210.8 NEAT Percentage of Emergency Department Admissions with LOE of Four Hours or Less 4310.9 NEAT Percentage of Emergency Department Transfers with LOE of Four Hours or Less 4410.10 NEAT Percentage of Emergency Department Departures with LOE of Four Hours or Less 4510.11 Percentage of St John Ambulance Australia (SJAA) Patients with Off Stretcher Time Waiting Within 20 Minutes 46
11. Data Definitions and Business Rules 47
Contents

WA Health Performance Report | July to September 2015 Quarter
iii
List of AcronymsACEM The Australasian College of Emergency Medicine LOE Length of Episode
AH Albany Hospital MHIS Mental Health Information System
AIHW Australian Institute of Health and Welfare NBH Nickol Bay Hospital
AKMH Armadale-Kelmscott Memorial Hospital NEAT National Emergency Access Target
ASI Ambulatory Surgery Initiative NEST National Elective Surgery Target
BH Broome Hospital NGOs Non-Government Organisations
BRH Bunbury Regional Hospital NPA National Partnership Agreement
DHS Dental Health Services PHC Peel Health Campus
ED Emergency Department PMH Princess Margaret Hospital
EDDC Emergency Department Data Collection RGH Rockingham General Hospital
FH Fremantle Hospital RPH Royal Perth Hospital
FSH Fiona Stanley Hospital SCGH Sir Charles Gairdner Hospital
GH Geraldton Hospital SDH Swan District Hospital
GP General Practitioner SJAA St John Ambulance Australia
HCARe Health Care and Related Information System TOPAS The Open Patient Administration System
HHC Hedland Health Campus WA Western Australia
HMDC Hospital Morbidity Data Collection webPAS Web-based Patient Administration System
JHC Joondalup Health Campus WLDC Wait List Data Collection
KEMH King Edward Memorial Hospital YTD Year to date
KH Kalgoorlie Hospital
List of Acronyms

WA Health Performance Report | July to September 2015 Quarter
iv
IntroductionWestern Australia’s (WA) public health system aims to ensure healthier, longer and better lives for all West Australians, and to improve and protect the health of our community by providing a safe, high-quality, accountable and sustainable health care system.
WA Health is focused on managing improvements in health performance, particularly in the areas of Emergency Demand, Elective Surgery, Outpatients and Mental Health. WA Health is committed to meeting the National Elective Surgery Target (NEST) and National Emergency Access Target (NEAT) reforms outlined in The National Health Reform Agreement – National Partnership Agreement on Improving Public Hospital Services.
The purpose of the WA Health Performance Report is to provide information to monitor WA Health’s performance at the state, metropolitan and country level. Performance information is reported on a quarterly basis for:
* Hospital separations* Hospital capacity* Elective surgery wait list* Emergency Departments* Mental Health* Ambulatory Surgery Initiative* Dental Care* General Practitioner After Hours* National Elective Surgery Target Indicators* National Emergency Access Target Indicators.
To interpret the figures including symbols in this report, refer to the Notes section (page v) and the Data Definitions and Business Rules (pages 47 to 68).
The report supports government’s policies of accountability and commitment to informing consumers, and makes information on system performance readily accessible to WA Health staff to support the management and planning of services.
Introduction

WA Health Performance Report | July to September 2015 Quarter
v
Notes1 "Discharges" refers to the count of separations.
2 Figures represent the average number of available active same-day beds/chairs for a weekday (Monday–Friday) of the last month of the quarter. Available active includes all beds/chairs that are immediately available for use.
3 Figures represent the average number of available active overnight beds on each day for the last month of the quarter. Available active includes all overnight beds that are immediately available for use.
4 Figures represent the percentage of occupied overnight beds to total available active overnight beds for the last month of the quarter. Available active includes all overnight beds that are immediately available for use.
5 Figures reflect patients waiting for elective surgery on the last day of the quarter.
6 Figures for mental health separations are preliminary for the September 2015 quarter.
7 Figures for mental health services at outpatient clinics are preliminary for the September 2015 quarter
8 Figures represent the number of people waiting for dental services on the last day of the quarter.
9 National Partnership Agreement (NPA) National Elective Surgery Target (NEST) Indicator.
10 Data includes National Emergency Access Target (NEAT) participating hospitals only, excluding Peel Health Campus as a result of data capture system limitations.
11 Data includes the following metropolitan hospitals: Armadale-Kelmscott Memorial, Fiona Stanley, Fremantle, Joondalup Health Campus, King Edward Memorial, Peel Health Campus, Princess Margaret, Rockingham General, Royal Perth, Sir Charles Gairdner and Swan District.
12 Data excludes Peel Health Campus as a result of data capture system limitations.
N/A – September 2014 quarter to September 2015 quarter comparison is not available.
^ Data is not complete for the quarter. The data will be updated in future reports.
N/C – Data is not calculable due to division by 0.
For sections 1.1 to 2.3; 3.2; 4.1 to 7.1; 9.1 to 9.3; 10.1 to 10.10, figures are preliminary. Figures may change within the 2013-14, 2014-15 and 2015-16 reporting period due to timing of coding and editing.
Notes

WA Health Performance Report | July to September 2015 Quarter
vi
At a GlanceWA Health System Performance – Statewide
Health Performance IndicatorsSeptember
2015 Quarter
Compared to September
2014 Quarter
Differences % Variation
Inpatient Activity
Total number of patients who were discharged from hospital1 140,080 994 0.7%
Total number of acute admissions that have been discharged from hospital1 131,453 995 0.8%
Total number of elective acute admissions that have been discharged from hospital1 68,330 1,118 1.6%
Total number of acute medical admissions that have been discharged from hospital1 88,999 1,593 1.8%
Total number of acute surgical admissions that have been discharged from hospital1 35,336 1,733 5.2%
Total number of renal dialysis admissions that have been discharged from hospital1 33,356 560 1.7%
Acute average length of stay (in days) for discharged patients1 2.60 0.17 6.1%
Total number of newborn admissions that have been discharged from hospital1 6,659 152 2.3%
Elective Surgery Wait List
Total number of patients on the elective surgery wait list5 17,270 593 3.6%
Total number of admissions from the elective surgery wait list 23,005 979 4.4%
Median waiting time for patients (in months) on the elective surgery wait list5 1.87 0.03 1.7%
Emergency Department Activity
Total number of people who attended emergency departments 258,736 4,744 1.9%
Percentage of Triage 1 patients who were seen within the recommended time (immediately) 99.8%^ N/A N/A N/A
Percentage of Triage 2 patients who were seen within the recommended time (10 minutes) 78.9%^ N/A N/A N/A
Percentage of Triage 3 patients who were seen within the recommended time (30 minutes) 58.8%^ N/A N/A N/A
Percentage of Triage 4 patients who were seen within the recommended time (1 hour) 71.2%^ N/A N/A N/A
Percentage of Triage 5 patients who were seen within the recommended time (2 hours) 95.8%^ N/A N/A N/A
Total number of people who were admitted into hospitals from emergency departments 52,043 2,038 3.8%
Mental Health
Total number of people who were discharged from mental health services6 3,674 502 15.8%
Total attendances at mental health outpatient clinics7 219,206 15,989 6.8%
Ambulatory Surgery Initiative (ASI)
Total Ambulatory Surgery Initiative cases 1,820 769 29.7%
At a Glance

WA Health Performance Report | July to September 2015 Quarter
vii
Health Performance IndicatorsSeptember
2015 Quarter
Compared to September
2014 Quarter
Differences % Variation
Dental Health
Total number of visits to dental health clinics 118,762 N/A N/A N/A
Total number of people waiting for services at dental health clinics8 6,376 393 5.8%
General Practitioner After Hours Service
Total number of people who attended a General Practitioner After Hours service 13,536 607 4.3%
National Elective Surgery Target Indicators
Percentage of elective surgery Category 1 cases treated within the recommended time9 93.2% 4.8% 4.9%
Percentage of elective surgery Category 2 cases treated within the recommended time9 87.9% 4.0% 4.3%
Percentage of elective surgery Category 3 cases treated within the recommended time9 98.0% 0.6% 0.6%
Average overdue wait time for elective surgery Category 1 cases5,9 23.86 11.36 90.9%
Average overdue wait time for elective surgery Category 2 cases5,9 74.09 33.33 81.8%
Average overdue wait time for elective surgery Category 3 cases5,9 92.84 39.86 75.2%
National Emergency Access Target Indicators (data is for participating hospitals only – refer to page 35)
NEAT total emergency department attendances 205,359 5,671 2.8%
NEAT total admissions from emergency departments 55,804 2,584 4.9%
NEAT percentage of emergency department attendances admitted 27.2% 0.5% 2.0%
NEAT total mental health admissions from emergency departments10 3,804^ N/A N/A N/A
NEAT percentage of emergency department attendances transferred to another hospital 2.1% 0.2% 10.3%
NEAT percentage of emergency department attendances with length of episode (LOE) of four hours or less 76.4%^ N/A N/A N/A
NEAT percentage of emergency department attendances with LOE greater than twelve hours 2.1%^ N/A N/A N/A
NEAT percentage of emergency department admissions with LOE of four hours or less 50.9%^ N/A N/A N/A
NEAT percentage of emergency department transfers with LOE of four hours or less 44.4%^ N/A N/A N/A
NEAT percentage of emergency department departures with LOE of four hours or less 87.2%^ N/A N/A N/A
Percentage of St John Ambulance Australia (SJAA) Patients with Off Stretcher Time Within 20 Minutes11 66.1% 2.9% 4.6%
* Refer to the Notes section (page v) and the Data Definitions and Business Rules (pages 47 to 68) for information on how to interpret the figures including symbols in this report.
At a Glance
WA Health System Performance – Statewide (cont.)

WA Health Performance Report | July to September 2015 Quarter
viii
WA Health System Performance – Metropolitan
Health Performance IndicatorsSeptember
2015 Quarter
Compared to September
2014 Quarter
Differences % Variation
Inpatient Activity
Total number of patients who were discharged from hospital1 109,098 1,156 1.1%
Total number of acute admissions that have been discharged from hospital1 102,166 1,149 1.1%
Total number of elective acute admissions that have been discharged from hospital1 52,898 1,471 2.7%
Total number of acute medical admissions that have been discharged from hospital1 68,832 1,214 1.7%
Total number of acute surgical admissions that have been discharged from hospital1 27,011 1,956 7.8%
Total number of renal dialysis admissions that have been discharged from hospital1 24,204 645 2.6%
Acute average length of stay (in days) for discharged patients1 2.72 0.20 6.8%
Total number of newborn admissions that have been discharged from hospital1 5,328 108 2.1%
Beds-Capacity
Average number of available active same-day (occupied and unoccupied) beds/chairs2 413^ N/A N/A N/A
Average number of available active overnight (occupied and unoccupied) beds3 3,313^ N/A N/A N/A
Overnight bed occupancy4 86.4%^ N/A N/A N/A
Elective Surgery Wait List
Total number of patients on the elective surgery wait list5 13,847 891 6.9%
Total number of admissions from the elective surgery wait list 18,585 971 5.5%
Median waiting time for patients (in months) on the elective surgery wait list5 1.87 0.07 3.4%
Emergency Department Activity
Total number of people who attended emergency departments 160,355 6,654 4.3%
Percentage of Triage 1 patients who were seen within the recommended time (immediately) 99.9%^ N/A N/A N/A
Percentage of Triage 2 patients who were seen within the recommended time (10 minutes) 77.0%^ N/A N/A N/A
Percentage of Triage 3 patients who were seen within the recommended time (30 minutes) 46.8%^ N/A N/A N/A
Percentage of Triage 4 patients who were seen within the recommended time (1 hour) 60.0%^ N/A N/A N/A
Percentage of Triage 5 patients who were seen within the recommended time (2 hours) 92.9%^ N/A N/A N/A
Total number of people who were admitted into hospitals from emergency departments 41,729 490 1.2%
Mental Health
Total number of people who were discharged from mental health services6 3,266 525 19.2%
Total attendances at mental health outpatient clinics7 176,789 14,027 7.4%
At a Glance

WA Health Performance Report | July to September 2015 Quarter
ix
Health Performance IndicatorsSeptember
2015 Quarter
Compared to September
2014 Quarter
Differences % Variation
Ambulatory Surgery Initiative (ASI)
Total Ambulatory Surgery Initiative cases 1,678 739 30.6%
Dental Health
Total number of visits to dental health clinics 30,689 N/A N/A N/A
General Practitioner After Hours Service
Total number of people who attended a General Practitioner After Hours service 13,536 607 4.3%
National Elective Surgery Target Indicators
Percentage of elective surgery Category 1 cases treated within the recommended time9 92.3% 5.4% 5.5%
Percentage of elective surgery Category 2 cases treated within the recommended time9 85.5% 4.8% 5.3%
Percentage of elective surgery Category 3 cases treated within the recommended time9 97.9% 0.6% 0.7%
Average overdue wait time for elective surgery Category 1 cases5,9 23.86 11.36 90.9%
Average overdue wait time for elective surgery Category 2 cases5,9 74.09 33.33 81.8%
Average overdue wait time for elective surgery Category 3 cases5,9 99.17 39.83 67.1%
National Emergency Access Target Indicators (data is for participating hospitals only – refer to page 35)
NEAT total emergency department attendances 160,245 6,607 4.3%
NEAT total admissions from emergency departments 47,452 2,236 4.9%
NEAT percentage of emergency department attendances admitted 29.6% 0.2% 0.6%
NEAT total mental health admissions from emergency departments12 3,163 166 5.5%
NEAT percentage of emergency department attendances transferred to another hospital 2.4% 0.3% 11.2%
NEAT percentage of emergency department attendances with length of episode (LOE) of four hours or less 73.8%^ N/A N/A N/A
NEAT percentage of emergency department attendances with LOE greater than twelve hours 2.4%^ N/A N/A N/A
NEAT percentage of emergency department admissions with LOE of four hours or less 49.7%^ N/A N/A N/A
NEAT percentage of emergency department transfers with LOE of four hours or less 45.0%^ N/A N/A N/A
NEAT percentage of emergency department departures with LOE of four hours or less 85.5%^ N/A N/A N/A
Percentage of St John Ambulance Australia (SJAA) Patients with Off Stretcher Time Within 20 Minutes11 66.1% 2.9% 4.6%
* Refer to the Notes section (page v) and the Data Definitions and Business Rules (pages 47 to 68) for information on how to interpret the figures including symbols in this report.
At a Glance
WA Health System Performance – Metropolitan (cont.)

WA Health Performance Report | July to September 2015 Quarter
x
WA Health System Performance – Country
Health Performance IndicatorsSeptember
2015 Quarter
Compared to September
2014 Quarter
Differences % Variation
Inpatient Activity
Total number of patients who were discharged from hospital1 30,982 162 0.5%
Total number of acute admissions that have been discharged from hospital1 29,287 154 0.5%
Total number of elective acute admissions that have been discharged from hospital1 15,432 353 2.3%
Total number of acute medical admissions that have been discharged from hospital1 20,167 379 1.8%
Total number of acute surgical admissions that have been discharged from hospital1 8,325 223 2.6%
Total number of renal dialysis admissions that have been discharged from hospital1 9,152 1,205 15.2%
Acute average length of stay (in days) for discharged patients1 2.17 0.08 3.4%
Total number of newborn admissions that have been discharged from hospital1 1,331 44 3.4%
Elective Surgery Wait List
Total number of patients on the elective surgery wait list5 3,423 298 8.0%
Total number of admissions from the elective surgery wait list 4,420 8 0.2%
Median waiting time for patients (in months) on the elective surgery wait list5 1.84 0.03 1.8%
Emergency Department Activity
Total number of people who attended emergency departments 98,381 1,910 1.9%
Percentage of Triage 1 patients who were seen within the recommended time (immediately) 99.4% 1.0% 1.0%
Percentage of Triage 2 patients who were seen within the recommended time (10 minutes) 84.7% 7.9% 8.5%
Percentage of Triage 3 patients who were seen within the recommended time (30 minutes) 82.2% 4.3% 5.0%
Percentage of Triage 4 patients who were seen within the recommended time (1 hour) 86.4% 1.8% 2.0%
Percentage of Triage 5 patients who were seen within the recommended time (2 hours) 97.3% 0.1% 0.1%
Total number of people who were admitted into hospitals from emergency departments 10,314 1,548 13.1%
Mental Health
Total number of people who were discharged from mental health services6 408 23 5.3%
Total attendances at mental health outpatient clinics7 42,417 1,962 4.4%
Ambulatory Surgery Initiative (ASI)
Total Ambulatory Surgery Initiative cases 142 30 17.4%
Dental Health
Total number of visits to dental health clinics 15,689 N/A N/A N/A
At a Glance

WA Health Performance Report | July to September 2015 Quarter
xi
Health Performance IndicatorsSeptember
2015 Quarter
Compared to September
2014 Quarter
Differences % Variation
National Elective Surgery Target Indicators
Percentage of elective surgery Category 1 cases treated within the recommended time9 99.4% 0.3% 0.3%
Percentage of elective surgery Category 2 cases treated within the recommended time9 99.8% 0.1% 0.1%
Percentage of elective surgery Category 3 cases treated within the recommended time9 98.3% 0.6% 0.6%
Average overdue wait time for elective surgery Category 1 cases5,9 0.00 0.00 N/C
Average overdue wait time for elective surgery Category 2 cases5,9 0.00 0.00 N/C
Average overdue wait time for elective surgery Category 3 cases5,9 39.05 28.61 274.1%
National Emergency Access Target Indicators (data is for participating hospitals only – refer to page 35)
NEAT total emergency department attendances 45,114 936 2.0%
NEAT total admissions from emergency departments 8,352 348 4.3%
NEAT percentage of emergency department attendances admitted 18.5% 1.1% 6.5%
NEAT total mental health admissions from emergency departments 641^ N/A N/A N/A
NEAT percentage of emergency department attendances transferred to another hospital 0.8% 0.1% 9.3%
NEAT percentage of emergency department attendances with length of episode (LOE) of four hours or less 85.0% 0.3% 0.4%
NEAT percentage of emergency department attendances with LOE greater than twelve hours 1.0% 0.2% 17.5%
NEAT percentage of emergency department admissions with LOE of four hours or less 57.1% 4.0% 7.5%
NEAT percentage of emergency department transfers with LOE of four hours or less 39.2% 2.1% 5.2%
NEAT percentage of emergency department departures with LOE of four hours or less 91.8% 0.8% 0.9%
* Refer to the Notes section (page v) and the Data Definitions and Business Rules (pages 47 to 68) for information on how to interpret the figures including symbols in this report.
WA Health System Performance – Country (cont.)
At a Glance

WA Health Performance Report | July to September 2015 Quarter
1
1. Public Hospital Separations1.1 SeparationsWhat do these figures show? For the September 2015 quarter, there were 994 (or 0.7%) more public hospital separations compared with the September 2014 quarter.
For the same period, metropolitan public hospital separations increased by 1,156 (or 1.1%) and country public hospital separations decreased by 162 (or 0.5%).
Separations includes all public hospitals and public patients at Joondalup and Peel Health Campuses.
Table 1: Public hospital separations*
AreaDecember
2013 QuarterMarch
2014 QuarterJune
2014 QuarterSeptember
2014 QuarterDecember
2014 QuarterMarch
2015 QuarterJune
2015 QuarterSeptember
2015 Quarter
% change Sep'14 to Sep'15
Quarters
Metropolitan 105,895 103,697 105,818 107,942 106,107 102,601 105,664 109,098 1.1%
Country 30,226 29,082 29,922 31,144 30,209 28,742 30,086 30,982 -0.5%
WA State 136,121 132,779 135,740 139,086 136,316 131,343 135,750 140,080 0.7%
* Refer to the Notes section (page v) and the Data Definitions and Business Rules (pages 47 to 68) for information on how to interpret the figures including symbols in this report.
Public Hospital Separations
Previous (Dec ‘13 Qtr – Sep ‘14 Qtr)Current (Dec ‘14 Qtr – Sep ‘15 Qtr)
120,000
125,000
130,000
135,000
140,000
145,000
December Qtr March Qtr June Qtr September Qtr
No.
of s
epar
atio
ns
Figure 1: Public hospital separations (WA State)

WA Health Performance Report | July to September 2015 Quarter
2
1.2 Acute SeparationsWhat do these figures show? For the September 2015 quarter, there were 995 (or 0.8%) more public hospital acute separations compared with the September 2014 quarter.
For the same period, metropolitan public hospital acute separations increased by 1,149 (or 1.1%) and country public hospital acute separations decreased by 154 (or 0.5%).
Acute separations includes all public hospitals and public patients at Joondalup and Peel Health Campuses.
Table 2: Public hospital acute separations*
AreaDecember
2013 QuarterMarch
2014 QuarterJune
2014 QuarterSeptember
2014 QuarterDecember
2014 QuarterMarch
2015 QuarterJune
2015 QuarterSeptember
2015 Quarter
% change Sep'14 to Sep'15
Quarters
Metropolitan 99,041 96,898 98,935 101,017 99,300 96,297 99,232 102,166 1.1%
Country 28,454 27,295 28,173 29,441 28,522 26,948 28,321 29,287 -0.5%
WA State 127,495 124,193 127,108 130,458 127,822 123,245 127,553 131,453 0.8%
* Refer to the Notes section (page v) and the Data Definitions and Business Rules (pages 47 to 68) for information on how to interpret the figures including symbols in this report.
Public Hospital Separations
Previous (Dec ‘13 Qtr – Sep ‘14 Qtr)Current (Dec ‘14 Qtr – Sep ‘15 Qtr)
110,000
115,000
120,000
125,000
130,000
135,000
140,000
December Qtr March Qtr June Qtr September Qtr
No.
of a
cute
sep
arat
ions
Figure 2: Public hospital acute separations (WA State)

WA Health Performance Report | July to September 2015 Quarter
3
1.3 Elective Acute SeparationsWhat do these figures show?For the September 2015 quarter, there were 1,118 (or 1.6%) fewer public hospital elective acute separations compared with the September 2014 quarter.
For the same period, metropolitan public hospital elective acute separations decreased by 1,471 (or 2.7%) and country public hospital elective acute separations increased by 353 (or 2.3%).
Elective acute separations includes all public hospitals and public patients at Joondalup and Peel Health Campuses.
Table 3: Public hospital elective acute separations*
AreaDecember
2013 QuarterMarch
2014 QuarterJune
2014 QuarterSeptember
2014 QuarterDecember
2014 QuarterMarch
2015 QuarterJune
2015 QuarterSeptember
2015 Quarter
% change Sep'14 to Sep'15
Quarters
Metropolitan 52,599 51,758 52,944 54,369 53,152 48,027 48,730 52,898 -2.7%
Country 14,550 13,982 14,701 15,079 14,815 13,702 14,973 15,432 2.3%
WA State 67,149 65,740 67,645 69,448 67,967 61,729 63,703 68,330 -1.6%
* Refer to the Notes section (page v) and the Data Definitions and Business Rules (pages 47 to 68) for information on how to interpret the figures including symbols in this report.
Public Hospital Separations
Previous (Dec ‘13 Qtr – Sep ‘14 Qtr)Current (Dec ‘14 Qtr – Sep ‘15 Qtr)
50,000
55,000
60,000
65,000
70,000
75,000
December Qtr March Qtr June Qtr September Qtr
No.
of e
lect
ive
acut
e se
para
tions
Figure 3: Public hospital elective acute separations (WA State)

WA Health Performance Report | July to September 2015 Quarter
4
1.4 Acute Medical SeparationsWhat do these figures show? For the September 2015 quarter, there were 1,593 (or 1.8%) fewer public hospital acute medical separations compared with the September 2014 quarter.
For the same period, metropolitan public hospital acute medical separations decreased by 1,214 (or 1.7%) and country public hospital acute medical separations decreased by 379 (or 1.8%).
Acute medical separations includes all public hospitals and public patients at Joondalup and Peel Health Campuses.
Table 4: Public hospital acute medical separations*
AreaDecember
2013 QuarterMarch
2014 QuarterJune
2014 QuarterSeptember
2014 QuarterDecember
2014 QuarterMarch
2015 QuarterJune
2015 QuarterSeptember
2015 Quarter
% change Sep'14 to Sep'15
Quarters
Metropolitan 67,824 66,455 67,807 70,046 68,945 67,090 68,297 68,832 -1.7%
Country 19,726 19,111 19,326 20,546 19,836 19,010 19,585 20,167 -1.8%
WA State 87,550 85,566 87,133 90,592 88,781 86,100 87,882 88,999 -1.8%
* Refer to the Notes section (page v) and the Data Definitions and Business Rules (pages 47 to 68) for information on how to interpret the figures including symbols in this report.
Public Hospital Separations
Previous (Dec ‘13 Qtr – Sep ‘14 Qtr)Current (Dec ‘14 Qtr – Sep ‘15 Qtr)
60,000
70,000
80,000
90,000
100,000
December Qtr March Qtr June Qtr September Qtr
No.
of a
cute
med
ical
sep
arat
ions
Figure 4: Public hospital acute medical separations (WA State)

WA Health Performance Report | July to September 2015 Quarter
5
1.5 Acute Surgical SeparationsWhat do these figures show? For the September 2015 quarter, there were 1,733 (or 5.2%) more public hospital acute surgical separations compared with the September 2014 quarter.
For the same period, metropolitan public hospital acute surgical separations increased by 1,956 (or 7.8%) and country public hospital acute surgical separations decreased by 223 (or 2.6%).
Acute surgical separations includes all public hospitals and public patients at Joondalup and Peel Health Campuses.
Table 5: Public hospital acute surgical separations*
AreaDecember
2013 QuarterMarch
2014 QuarterJune
2014 QuarterSeptember
2014 QuarterDecember
2014 QuarterMarch
2015 QuarterJune
2015 QuarterSeptember
2015 Quarter
% change Sep'14 to Sep'15
Quarters
Metropolitan 25,544 24,604 25,144 25,055 24,544 23,597 25,230 27,011 7.8%
Country 8,356 7,851 8,526 8,548 8,170 7,392 8,049 8,325 -2.6%
WA State 33,900 32,455 33,670 33,603 32,714 30,989 33,279 35,336 5.2%
* Refer to the Notes section (page v) and the Data Definitions and Business Rules (pages 47 to 68) for information on how to interpret the figures including symbols in this report.
Public Hospital Separations
Previous (Dec ‘13 Qtr – Sep ‘14 Qtr)Current (Dec ‘14 Qtr – Sep ‘15 Qtr)
25,000
30,000
35,000
40,000
December Qtr March Qtr June Qtr September Qtr
No.
of a
cute
sur
gica
l sep
arat
ions
Figure 5: Public hospital acute surgical separations (WA State)

WA Health Performance Report | July to September 2015 Quarter
6
1.6 Renal Dialysis SeparationsWhat do these figures show? For the September 2015 quarter, renal dialysis separations were 560 (or 1.7%) more compared with the September 2014 quarter.
For the same period, metropolitan renal dialysis separations decreased by 645 (or 2.6%) and country renal dialysis separations increased by 1,205 (or 15.2%).
Figures show renal dialysis treatment for patients at public hospitals and public patients at Joondalup and Peel Health Campuses. Includes public dialysis patient services contracted to non-government organisations.
Table 6: Number of renal dialysis separations*
AreaDecember
2013 QuarterMarch
2014 QuarterJune
2014 QuarterSeptember
2014 QuarterDecember
2014 QuarterMarch
2015 QuarterJune
2015 QuarterSeptember
2015 Quarter
% change Sep'14 to Sep'15
Quarters
Metropolitan 23,852 23,703 24,251 24,849 24,524 23,874 23,919 24,204 -2.6%
Country 7,564 7,328 7,729 7,947 8,575 8,582 9,013 9,152 15.2%
WA State 31,416 31,031 31,980 32,796 33,099 32,456 32,932 33,356 1.7%
* Refer to the Notes section (page v) and the Data Definitions and Business Rules (pages 47 to 68) for information on how to interpret the figures including symbols in this report.
Public Hospital Separations
Previous (Dec ‘13 Qtr – Sep ‘14 Qtr)Current (Dec ‘14 Qtr – Sep ‘15 Qtr)
20,000
25,000
30,000
35,000
December Qtr March Qtr June Qtr September Qtr
No.
ren
al d
ialy
sis
sepa
ratio
ns
Figure 6: Number of renal dialysis separations (WA State)

WA Health Performance Report | July to September 2015 Quarter
7
1.7 Acute Average Length of StayWhat do these figures show?For the September 2015 quarter, the average length of stay for overall (same-day and overnight) acute separations was 0.17 days (or 6.1%) less than in the September 2014 quarter.
For the same period, metropolitan public hospital average length of stay decreased by 0.20 days (or 6.8%) and country public hospital average length of stay decreased by 0.08 days (or 3.4%).
Average length of stay includes all public hospitals and public patients at Joondalup and Peel Health Campuses.
Note: Figures shown in the table are rounded to two decimal places. The actual and % changes in figures between the September 2014 and September 2015 quarters are calculated using actual numbers that contain more than two decimal places, and therefore the change figures presented in the table and text may be slightly different to those calculated using the rounded figures in the table.
Table 7: Public hospital overall acute (same-day and overnight) average length of stay (in days)*
AreaDecember
2013 QuarterMarch
2014 QuarterJune
2014 QuarterSeptember
2014 QuarterDecember
2014 QuarterMarch
2015 QuarterJune
2015 QuarterSeptember
2015 Quarter
% change Sep'14 to Sep'15
Quarters
Metropolitan 2.91 2.85 2.81 2.91 2.87 2.84 2.91 2.72 -6.8%
Country 2.19 2.24 2.20 2.25 2.19 2.23 2.23 2.17 -3.4%
WA State 2.75 2.71 2.68 2.76 2.72 2.71 2.76 2.60 -6.1%
* Refer to the Notes section (page v) and the Data Definitions and Business Rules (pages 47 to 68) for information on how to interpret the figures including symbols in this report.
Public Hospital Separations
Previous (Dec ‘13 Qtr – Sep ‘14 Qtr)Current (Dec ‘14 Qtr – Sep ‘15 Qtr)
2.50
2.60
2.70
2.80
2.90
3.00
December Qtr March Qtr June Qtr September Qtr
Acu
te a
vera
ge le
ngth
of s
tay
(in d
ays)
Figure 7: Public hospital overall acute (same-day and overnight) average length of stay (in days) (WA State)

WA Health Performance Report | July to September 2015 Quarter
8
1.8 Newborn SeparationsWhat do these figures show? The number of newborn separations increased by 152 (or 2.3%) in the September 2015 quarter compared with the same quarter in 2014.
For the same period, metropolitan public hospital newborn separations increased by 108 (or 2.1%). There were 44 (or 3.4%) more newborn separations in country public hospitals for the September 2015 quarter compared with the September 2014 quarter.
Figures include newborns at all public hospitals and public patients at Joondalup and Peel Health Campuses.
Table 8: Public hospital newborns*
AreaDecember
2013 QuarterMarch
2014 QuarterJune
2014 QuarterSeptember
2014 QuarterDecember
2014 QuarterMarch
2015 QuarterJune
2015 QuarterSeptember
2015 Quarter
% change Sep'14 to Sep'15
Quarters
Metropolitan 4,993 5,130 5,144 5,220 5,130 5,175 5,103 5,328 2.1%
Country 1,281 1,409 1,372 1,287 1,332 1,362 1,316 1,331 3.4%
WA State 6,274 6,539 6,516 6,507 6,462 6,537 6,419 6,659 2.3%
* Refer to the Notes section (page v) and the Data Definitions and Business Rules (pages 47 to 68) for information on how to interpret the figures including symbols in this report.
Public Hospital Separations
Previous (Dec ‘13 Qtr – Sep ‘14 Qtr)Current (Dec ‘14 Qtr – Sep ‘15 Qtr)
5,600
5,800
6,000
6,200
6,400
6,600
6,800
7,000
December Qtr March Qtr June Qtr September Qtr
No.
of n
ewbo
rns
Figure 8: Number of public hospital newborns (WA State)

WA Health Performance Report | July to September 2015 Quarter
9
2. Public Hospital Capacity2.1 Available Active Same-day BedsWhat do these figures show? For September 2015, there were, on average, 413^ available same-day active beds/chairs in metropolitan hospitals.
The available active same-day beds/chairs data in metropolitan hospitals is not complete for September 2015, therefore a comparison cannot be made between September 2014 and September 2015.
Figures include the average number of available same-day beds/chairs at all metropolitan public hospitals, excluding Joondalup and Peel Health Campuses.
Note: Available active same-day beds/chairs includes all same-day beds/chairs that are immediately available for use. Figures shown in the table are rounded to whole numbers.
Table 9: Average number of available active same-day beds/chairs*,2
AreaDecember
2013March 2014
June 2014
September 2014
December 2014
March 2015
June 2015
September 2015
% change Sep'14 to Sep'15
Metropolitan 393 426 438 429 373 443 434 413^ N/A
* Refer to the Notes section (page v) and the Data Definitions and Business Rules (pages 47 to 68) for information on how to interpret the figures including symbols in this report.
Public Hospital Capacity
Ave
rage
num
ber
of a
vaila
ble
sam
e-da
y be
ds/c
hairs
Previous (Dec ‘13 – Sep ‘14)Current (Dec ‘14 – Sep ‘15)
300
350
400
450
500
December March June September
Figure 9: Average available active same-day beds/chairs (Metropolitan)

WA Health Performance Report | July to September 2015 Quarter
10
2.2 Available Active Overnight BedsWhat do these figures show? For September 2015, there were, on average, 3,313^ available active overnight beds in metropolitan hospitals.
The available active overnight beds data in metropolitan hospitals is not complete for September 2015, therefore a comparison cannot be made between September 2014 and September 2015.
Figures include the average number of available overnight beds at all metropolitan public hospitals, excluding Joondalup and Peel Health Campuses.
Note: Available active overnight beds includes all overnight beds that are immediately available for use. Figures shown in the table are rounded to whole numbers.
Table 10: Average number of available active overnight beds*,3
AreaDecember
2013March 2014
June 2014
September 2014
December 2014
March 2015
June 2015
September 2015
% change Sep'14 to Sep'15
Metropolitan 3,261 3,375 3,355 3,367 3,283 3,430 3,427 3,313^ N/A
* Refer to the Notes section (page v) and the Data Definitions and Business Rules (pages 47 to 68) for information on how to interpret the figures including symbols in this report.
Public Hospital Capacity
Previous (Dec ‘13 – Sep ‘14)Current (Dec ‘14 – Sep ‘15)
Ave
rage
num
ber
of a
vaila
ble
over
nigh
t bed
s
2,000
2,500
3,000
3,500
4,000
December March June September
Figure 10: Average number of available active overnight beds (Metropolitan)
WA Health Performance Report | July to September 2015 Quarter
11
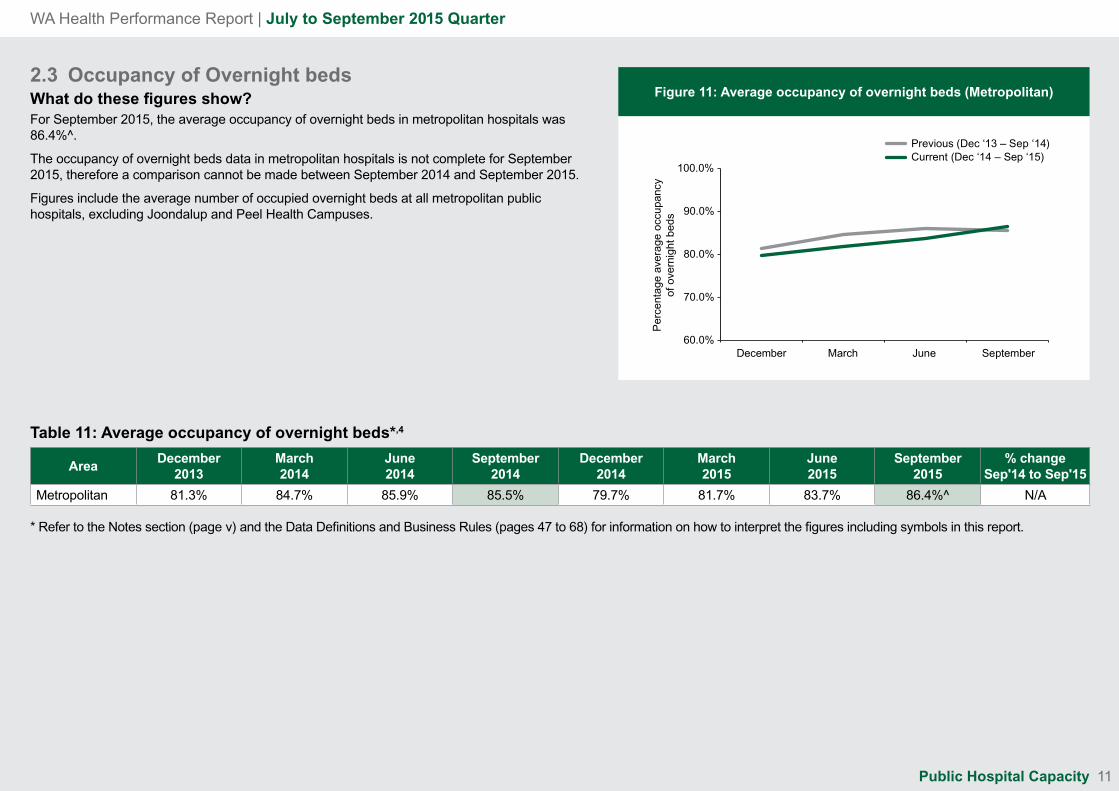
2.3 Occupancy of Overnight bedsWhat do these figures show? For September 2015, the average occupancy of overnight beds in metropolitan hospitals was 86.4%^.
The occupancy of overnight beds data in metropolitan hospitals is not complete for September 2015, therefore a comparison cannot be made between September 2014 and September 2015.
Figures include the average number of occupied overnight beds at all metropolitan public hospitals, excluding Joondalup and Peel Health Campuses.
Table 11: Average occupancy of overnight beds*,4
AreaDecember
2013March 2014
June 2014
September 2014
December 2014
March 2015
June 2015
September 2015
% change Sep'14 to Sep'15
Metropolitan 81.3% 84.7% 85.9% 85.5% 79.7% 81.7% 83.7% 86.4%^ N/A
* Refer to the Notes section (page v) and the Data Definitions and Business Rules (pages 47 to 68) for information on how to interpret the figures including symbols in this report.
Public Hospital Capacity
Previous (Dec ‘13 – Sep ‘14)Current (Dec ‘14 – Sep ‘15)
60.0%
70.0%
80.0%
90.0%
100.0%
December March June September
Per
cent
age
aver
age
occu
panc
yof
ove
rnig
ht b
eds
Figure 11: Average occupancy of overnight beds (Metropolitan)
WA Health Performance Report | July to September 2015 Quarter
12
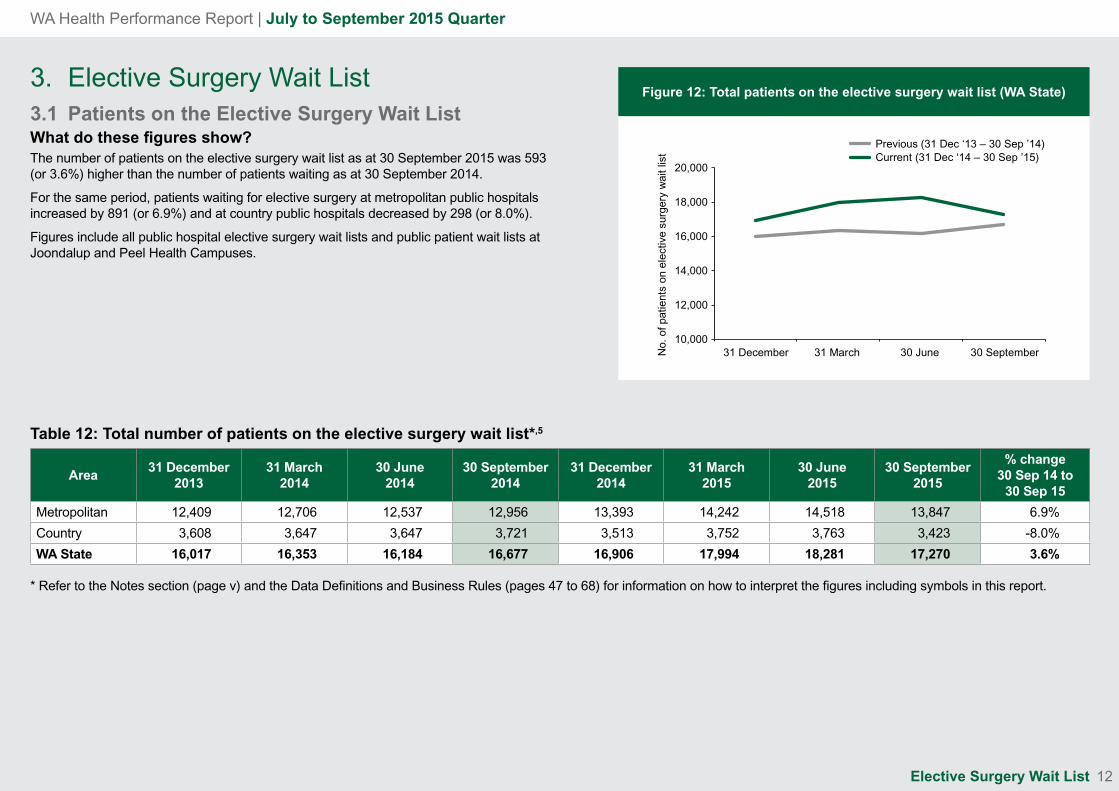
3. Elective Surgery Wait List3.1 Patients on the Elective Surgery Wait ListWhat do these figures show? The number of patients on the elective surgery wait list as at 30 September 2015 was 593 (or 3.6%) higher than the number of patients waiting as at 30 September 2014.
For the same period, patients waiting for elective surgery at metropolitan public hospitals increased by 891 (or 6.9%) and at country public hospitals decreased by 298 (or 8.0%).
Figures include all public hospital elective surgery wait lists and public patient wait lists at Joondalup and Peel Health Campuses.
Table 12: Total number of patients on the elective surgery wait list*,5
Area31 December
201331 March
201430 June
201430 September
201431 December
201431 March
201530 June
201530 September
2015
% change 30 Sep 14 to
30 Sep 15
Metropolitan 12,409 12,706 12,537 12,956 13,393 14,242 14,518 13,847 6.9%
Country 3,608 3,647 3,647 3,721 3,513 3,752 3,763 3,423 -8.0%
WA State 16,017 16,353 16,184 16,677 16,906 17,994 18,281 17,270 3.6%
* Refer to the Notes section (page v) and the Data Definitions and Business Rules (pages 47 to 68) for information on how to interpret the figures including symbols in this report.
Elective Surgery Wait List
Previous (31 Dec ‘13 – 30 Sep ’14)Current (31 Dec ‘14 – 30 Sep ’15)
10,000
12,000
14,000
16,000
18,000
20,000
31 December 31 March 30 June 30 SeptemberNo.
of p
atie
nts
on e
lect
ive
surg
ery
wai
t lis
t
Figure 12: Total patients on the elective surgery wait list (WA State)

WA Health Performance Report | July to September 2015 Quarter
13
3.2 Admissions from the Elective Surgery Wait ListWhat do these figures show? The number of admissions from the elective surgery wait list in the September 2015 quarter was 979 (or 4.4%) higher than the number of admissions in the September 2014 quarter.
For the same period, admissions from the elective surgery wait lists at metropolitan public hospitals increased by 971 (or 5.5%) and at country public hospitals increased by 8 (or 0.2%).
Figures include all public hospital elective surgery wait lists and public patient wait lists at Joondalup and Peel Health Campuses.
Table 13: Total number admissions from the elective surgery wait list*
AreaDecember
2013 QuarterMarch
2014 QuarterJune
2014 QuarterSeptember
2014 QuarterDecember
2014 QuarterMarch
2015 QuarterJune
2015 QuarterSeptember
2015 Quarter
% change Sep'14 to Sep'15
Quarters
Metropolitan 17,402 16,657 17,035 17,614 16,768 14,989 16,447 18,585 5.5%
Country 4,032 3,823 4,345 4,412 4,040 3,658 4,173 4,420 0.2%
WA State 21,434 20,480 21,380 22,026 20,808 18,647 20,620 23,005 4.4%
* Refer to the Notes section (page v) and the Data Definitions and Business Rules (pages 47 to 68) for information on how to interpret the figures including symbols in this report.
Elective Surgery Wait List
Previous (Dec ‘13 Qtr – Sep ‘14 Qtr)Current (Dec ‘14 Qtr – Sep ‘15 Qtr)
10,000
15,000
20,000
25,000
30,000
December Qtr March Qtr June Qtr September Qtr
No.
of p
atie
nts
adm
itted
from
ele
ctiv
esu
rger
y w
ait l
ist
Figure 13: Total admissions from the elective surgery wait list (WA State)
WA Health Performance Report | July to September 2015 Quarter
14
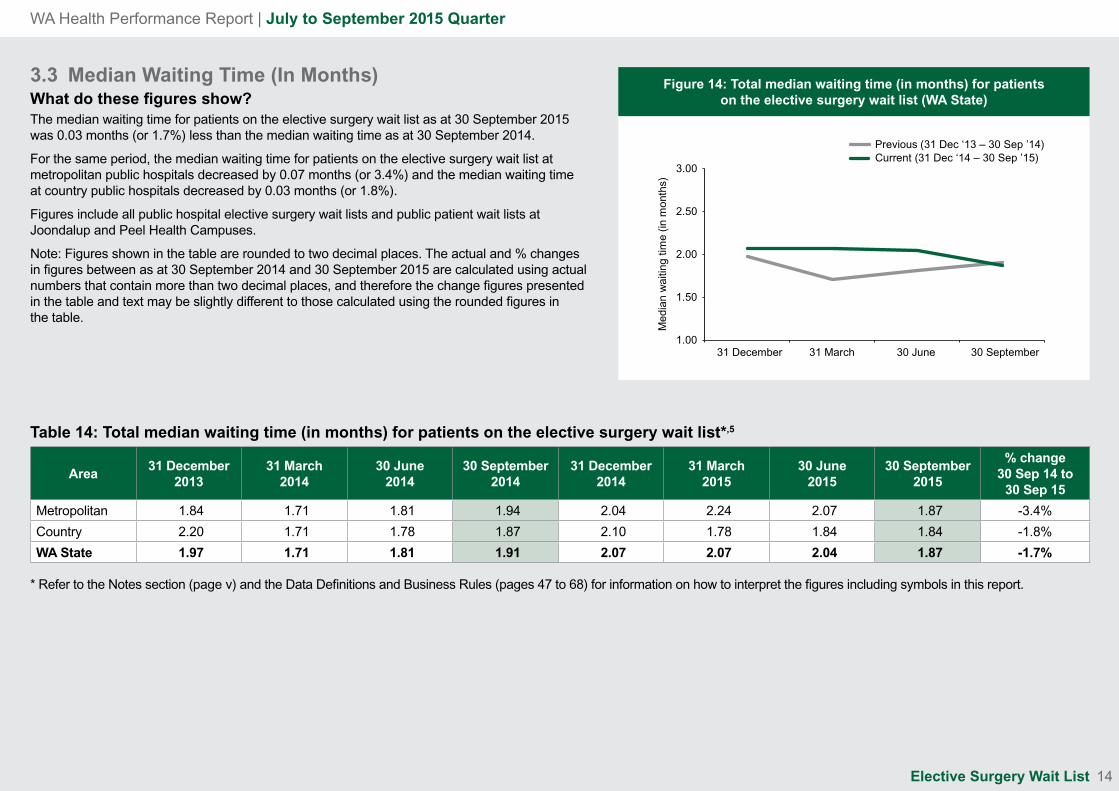
3.3 Median Waiting Time (In Months)What do these figures show? The median waiting time for patients on the elective surgery wait list as at 30 September 2015 was 0.03 months (or 1.7%) less than the median waiting time as at 30 September 2014.
For the same period, the median waiting time for patients on the elective surgery wait list at metropolitan public hospitals decreased by 0.07 months (or 3.4%) and the median waiting time at country public hospitals decreased by 0.03 months (or 1.8%).
Figures include all public hospital elective surgery wait lists and public patient wait lists at Joondalup and Peel Health Campuses.
Note: Figures shown in the table are rounded to two decimal places. The actual and % changes in figures between as at 30 September 2014 and 30 September 2015 are calculated using actual numbers that contain more than two decimal places, and therefore the change figures presented in the table and text may be slightly different to those calculated using the rounded figures in the table.
Table 14: Total median waiting time (in months) for patients on the elective surgery wait list*,5
Area31 December
201331 March
201430 June
201430 September
201431 December
201431 March
201530 June
201530 September
2015
% change 30 Sep 14 to
30 Sep 15
Metropolitan 1.84 1.71 1.81 1.94 2.04 2.24 2.07 1.87 -3.4%
Country 2.20 1.71 1.78 1.87 2.10 1.78 1.84 1.84 -1.8%
WA State 1.97 1.71 1.81 1.91 2.07 2.07 2.04 1.87 -1.7%
* Refer to the Notes section (page v) and the Data Definitions and Business Rules (pages 47 to 68) for information on how to interpret the figures including symbols in this report.
Elective Surgery Wait List
Previous (31 Dec ‘13 – 30 Sep ’14)Current (31 Dec ‘14 – 30 Sep ’15)
1.00
1.50
2.00
2.50
3.00
31 December 31 March 30 June 30 September
Med
ian
wai
ting
time
(in m
onth
s)
Figure 14: Total median waiting time (in months) for patients on the elective surgery wait list (WA State)

WA Health Performance Report | July to September 2015 Quarter
15
4. Public Emergency Departments (ED)4.1 Total Emergency Department AttendancesWhat do these figures show? In the September 2015 quarter, there was an increase of 4,744 (or 1.9%) in total emergency department attendances in public hospitals compared with the same quarter in the previous year.
For the same period, metropolitan public hospital emergency department attendances increased by 6,654 (or 4.3%). Country public hospital emergency department attendances decreased by 1,910 (or 1.9%).
Emergency departments of metropolitan hospitals include Armadale-Kelmscott Memorial, Fiona Stanley (opened on 3 February 2015), Fremantle (closed on 3 February 2015), Joondalup Health Campus, King Edward Memorial, Peel Health Campus, Princess Margaret, Rockingham General, Royal Perth, Sir Charles Gairdner and Swan District. Emergency Services at country hospitals are included.
Table 15: Total emergency department attendances*
AreaDecember
2013 QuarterMarch
2014 QuarterJune
2014 QuarterSeptember
2014 QuarterDecember
2014 QuarterMarch
2015 QuarterJune
2015 QuarterSeptember
2015 Quarter
% change Sep'14 to Sep'15
Quarters
Metropolitan 151,825 147,589 148,079 153,701 153,557 152,147 153,437 160,355 4.3%
Country 100,303 96,174 93,336 100,291 98,804 94,967 94,455 98,381 -1.9%
WA State 252,128 243,763 241,415 253,992 252,361 247,114 247,892 258,736 1.9%
* Refer to the Notes section (page v) and the Data Definitions and Business Rules (pages 47 to 68) for information on how to interpret the figures including symbols in this report.
Public Emergency Departments
Previous (Dec ‘13 Qtr – Sep ‘14 Qtr)Current (Dec ‘14 Qtr – Sep ‘15 Qtr)
200,000
220,000
240,000
260,000
280,000
December Qtr March Qtr June Qtr September QtrNo.
of e
mer
genc
y de
part
men
t atte
ndan
ces
Figure 15: Total emergency department attendances (WA State)

WA Health Performance Report | July to September 2015 Quarter
16
4.2 ED Triage 1What do these figures show?The Australasian College of Emergency Medicine (ACEM) recommends that 100% of Triage 1 emergency department patients are to be seen by a clinician immediately. This target was not achieved in the September 2015 quarter, where 99.8%^ of patients were seen within the recommended time.
For the September 2015 quarter, the percentage of Triage 1 patients seen within the recommended time at country hospitals was 99.4%. This represent a 1.0% increase compared with the same quarter in the previous year.
Data for the percentage of Triage 1 patients seen within recommended time at metropolitan hospitals is not complete for the September 2015 quarter, therefore a comparison cannot be made between the September 2014 and September 2015 quarters.
Triage 1 figures are collated from all WA public hospitals that provide emergency department services, including public patients at Joondalup Health Campus and Peel Health Campus.
Triage is a process used at emergency departments to determine the urgency of the patient's need for medical and nursing care. Patients with life threatening or potentially life threatening conditions will be seen immediately in emergency departments.
The calculation of the Western Australian Emergency Department waiting time is based on the commencement of clinical care by either a doctor, nurse, mental health practitioner or other health professional, which is based on the National definition. Metropolitan emergency departments began recording of the commencement of clinical care by a nurse, mental health practitioner or other health professional in November 2013.
Note: Figures shown in the table are rounded to one decimal place. The actual and % changes in figures between the September 2014 and September 2015 quarters are calculated using actual numbers that contain more than one decimal place, and therefore the change figure presented above may be slightly different to those calculated using the rounded figures in the table.
Table 16: Percentage of ED Triage 1 patients seen within the recommended time (immediately)*
AreaDecember
2013 QuarterMarch
2014 QuarterJune
2014 QuarterSeptember
2014 QuarterDecember
2014 QuarterMarch
2015 QuarterJune
2015 QuarterSeptember
2015 Quarter
% change Sep'14 to Sep'15
Quarters
Metropolitan 99.8% 99.5% 99.8% 99.9% 100%^ 99.8%^ 99.8%^ 99.9%^ N/A
Country 99.3% 98.1% 98.0% 98.4% 99.2% 98.8% 99.7% 99.4% 1.0%
WA State 99.7% 99.2% 99.4% 99.6% 99.8%^ 99.6%^ 99.7%^ 99.8%^ N/A
* Refer to the Notes section (page v) and the Data Definitions and Business Rules (pages 47 to 68) for information on how to interpret the figures including symbols in this report.
Public Emergency Departments
Previous (Dec ‘13 Qtr – Sep ‘14 Qtr)Current (Dec ‘14 Qtr – Sep ‘15 Qtr)Target
90%
92%
94%
96%
98%
100%
December Qtr March Qtr June Qtr September Qtr
Per
cent
age
of T
riage
1 p
atie
nts
Figure 16: Percentage of ED Triage 1 patients seen within the recommended time (immediately) (WA State)

WA Health Performance Report | July to September 2015 Quarter
17
4.3 ED Triage 2What do these figures show? The Australasian College of Emergency Medicine (ACEM) recommends that 80% of Triage 2 emergency department patients are to be seen by a clinician within ten minutes. This target was not achieved in the September 2015 quarter, where 78.9%^ of patients were seen within the recommended time.
For the September 2015 quarter, the percentage of Triage 2 patients seen within the recommended time at country hospitals was 84.7%. This represent a 8.5% decrease compared with the same quarter in the previous year.
Data for the percentage of Triage 2 patients seen within recommended time at metropolitan hospitals is not complete for the September 2015 quarter, therefore a comparison cannot be made between the September 2014 and September 2015 quarters.
Triage 2 figures are collated from all WA public hospitals that provide emergency department services, including public patients at Joondalup Health Campus and Peel Health Campus.
The calculation of the Western Australian Emergency Department waiting time is based on the commencement of clinical care by either a doctor, nurse, mental health practitioner or other health professional, which is based on the National definition. Metropolitan emergency departments began recording of the commencement of clinical care by a nurse, mental health practitioner or other health professional in November 2013.
Note: Figures shown in the table are rounded to one decimal place. The actual and % changes in figures between the September 2014 and September 2015 quarters are calculated using actual numbers that contain more than one decimal place, and therefore the change figure presented above may be slightly different to those calculated using the rounded figures in the table.
Table 17: Percentage of ED Triage 2 patients seen within the recommended time (10 minutes)*
AreaDecember
2013 QuarterMarch
2014 QuarterJune
2014 QuarterSeptember
2014 QuarterDecember
2014 QuarterMarch
2015 QuarterJune
2015 QuarterSeptember
2015 Quarter
% change Sep'14 to Sep'15
Quarters
Metropolitan 85.5% 86.3% 87.3% 83.4% 84.5%^ 81.5%^ 80.6%^ 77.0%^ N/A
Country 90.4% 91.4% 92.4% 92.6% 88.6% 87.4% 86.3% 84.7% -8.5%
WA State 86.9% 87.6% 88.6% 85.7% 85.6%^ 83.0%^ 82.1%^ 78.9%^ N/A
* Refer to the Notes section (page v) and the Data Definitions and Business Rules (pages 47 to 68) for information on how to interpret the figures including symbols in this report.
Public Emergency Departments
Previous (Dec ‘13 Qtr – Sep ‘14 Qtr)Current (Dec ‘14 Qtr – Sep ‘15 Qtr)Target
50%
60%
70%
80%
90%
December Qtr March Qtr June Qtr September Qtr
Per
cent
age
of T
riage
2 p
atie
nts
Figure 17: Percentage of ED Triage 2 patients seen within the recommended time (10 minutes) (WA State)
WA Health Performance Report | July to September 2015 Quarter
18
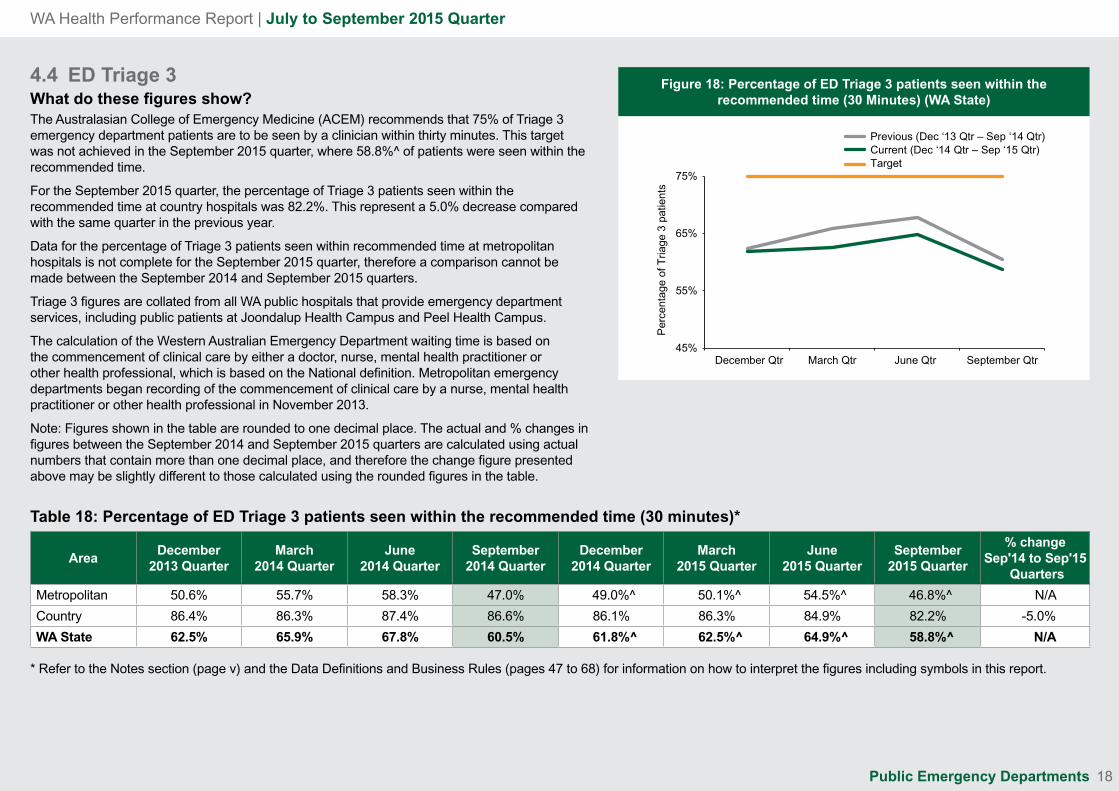
4.4 ED Triage 3What do these figures show? The Australasian College of Emergency Medicine (ACEM) recommends that 75% of Triage 3 emergency department patients are to be seen by a clinician within thirty minutes. This target was not achieved in the September 2015 quarter, where 58.8%^ of patients were seen within the recommended time.
For the September 2015 quarter, the percentage of Triage 3 patients seen within the recommended time at country hospitals was 82.2%. This represent a 5.0% decrease compared with the same quarter in the previous year.
Data for the percentage of Triage 3 patients seen within recommended time at metropolitan hospitals is not complete for the September 2015 quarter, therefore a comparison cannot be made between the September 2014 and September 2015 quarters.
Triage 3 figures are collated from all WA public hospitals that provide emergency department services, including public patients at Joondalup Health Campus and Peel Health Campus.
The calculation of the Western Australian Emergency Department waiting time is based on the commencement of clinical care by either a doctor, nurse, mental health practitioner or other health professional, which is based on the National definition. Metropolitan emergency departments began recording of the commencement of clinical care by a nurse, mental health practitioner or other health professional in November 2013.
Note: Figures shown in the table are rounded to one decimal place. The actual and % changes in figures between the September 2014 and September 2015 quarters are calculated using actual numbers that contain more than one decimal place, and therefore the change figure presented above may be slightly different to those calculated using the rounded figures in the table.
Table 18: Percentage of ED Triage 3 patients seen within the recommended time (30 minutes)*
AreaDecember
2013 QuarterMarch
2014 QuarterJune
2014 QuarterSeptember
2014 QuarterDecember
2014 QuarterMarch
2015 QuarterJune
2015 QuarterSeptember
2015 Quarter
% change Sep'14 to Sep'15
Quarters
Metropolitan 50.6% 55.7% 58.3% 47.0% 49.0%^ 50.1%^ 54.5%^ 46.8%^ N/A
Country 86.4% 86.3% 87.4% 86.6% 86.1% 86.3% 84.9% 82.2% -5.0%
WA State 62.5% 65.9% 67.8% 60.5% 61.8%^ 62.5%^ 64.9%^ 58.8%^ N/A
* Refer to the Notes section (page v) and the Data Definitions and Business Rules (pages 47 to 68) for information on how to interpret the figures including symbols in this report.
Public Emergency Departments
Previous (Dec ‘13 Qtr – Sep ‘14 Qtr)Current (Dec ‘14 Qtr – Sep ‘15 Qtr)Target
45%
55%
65%
75%
December Qtr March Qtr June Qtr September Qtr
Per
cent
age
of T
riage
3 p
atie
nts
Figure 18: Percentage of ED Triage 3 patients seen within the recommended time (30 Minutes) (WA State)

WA Health Performance Report | July to September 2015 Quarter
19
4.5 ED Triage 4What do these figures show? The Australasian College of Emergency Medicine (ACEM) recommends that 70% of Triage 4 emergency department patients are to be seen by a clinician within an hour. This target was achieved in the September 2015 quarter, where 71.2%^ of patients were seen within the recommended time.
For the September 2015 quarter, the percentage of Triage 4 patients seen within the recommended time at country hospitals was 86.4%. This represent a 2.0% decrease compared with the same quarter in the previous year.
Data for the percentage of Triage 4 patients seen within recommended time at metropolitan hospitals is not complete for the September 2015 quarter, therefore a comparison cannot be made between the September 2014 and September 2015 quarters.
Triage 4 figures are collated from all WA public hospitals that provide emergency department services, including public patients at Joondalup Health Campus and Peel Health Campus.
The calculation of the Western Australian Emergency Department waiting time is based on the commencement of clinical care by either a doctor, nurse, mental health practitioner or other health professional, which is based on the National definition. Metropolitan emergency departments began recording of the commencement of clinical care by a nurse, mental health practitioner or other health professional in November 2013.
Note: Figures shown in the table are rounded to one decimal place. The actual and % changes in figures between the September 2014 and September 2015 quarters are calculated using actual numbers that contain more than one decimal place, and therefore the change figure presented above may be slightly different to those calculated using the rounded figures in the table.
Table 19: Percentage of ED Triage 4 patients seen within the recommended time (1 hour)*
AreaDecember
2013 QuarterMarch
2014 QuarterJune
2014 QuarterSeptember
2014 QuarterDecember
2014 QuarterMarch
2015 QuarterJune
2015 QuarterSeptember
2015 Quarter
% change Sep'14 to Sep'15
Quarters
Metropolitan 66.2% 70.0% 70.0% 59.8% 63.0%^ 65.5%^ 67.9%^ 60.0%^ N/A
Country 89.9% 89.0% 90.3% 88.2% 89.3% 89.1% 88.5% 86.4% -2.0%
WA State 75.8% 77.7% 78.2% 71.6% 74.4%^ 75.5%^ 76.5%^ 71.2%^ N/A
* Refer to the Notes section (page v) and the Data Definitions and Business Rules (pages 47 to 68) for information on how to interpret the figures including symbols in this report.
Public Emergency Departments
Previous (Dec ‘13 Qtr – Sep ‘14 Qtr)Current (Dec ‘14 Qtr – Sep ‘15 Qtr)Target
50%
60%
70%
80%
90%
December Qtr March Qtr June Qtr September Qtr
Per
cent
age
of T
riage
4 p
atie
nts
Figure 19: Percentage of ED Triage 4 patients seen within the recommended time (1 hour) (WA State)
WA Health Performance Report | July to September 2015 Quarter
20
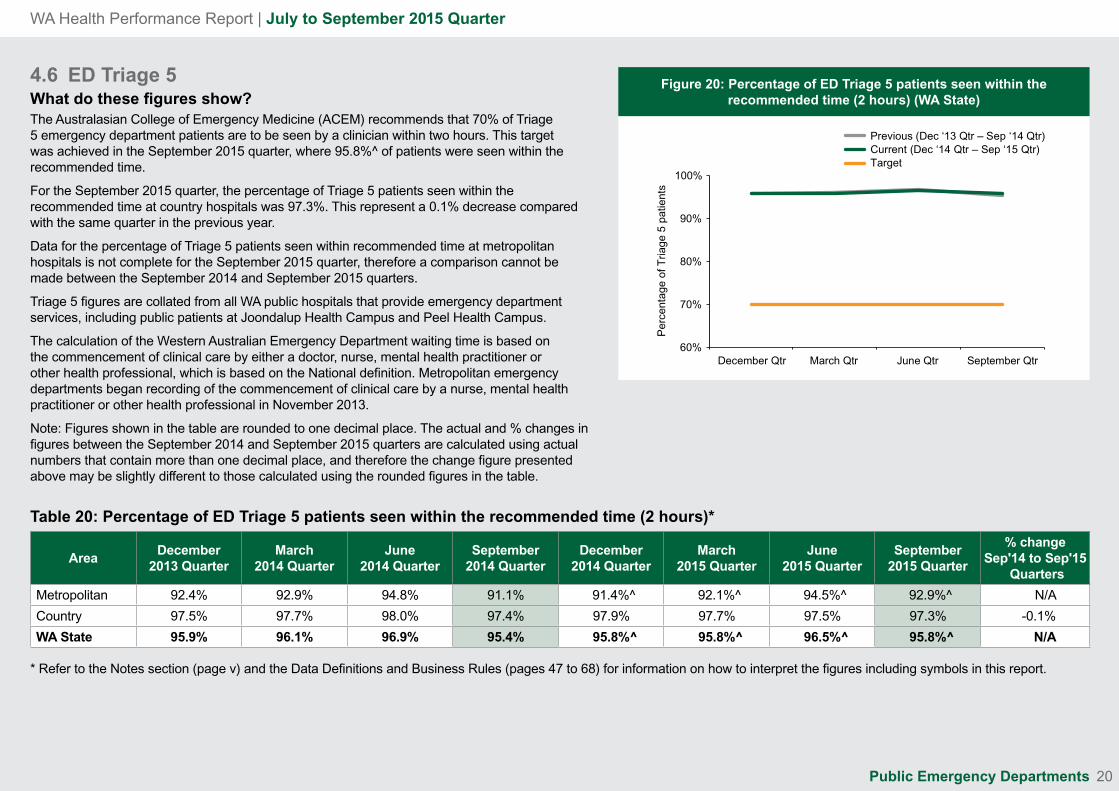
4.6 ED Triage 5What do these figures show? The Australasian College of Emergency Medicine (ACEM) recommends that 70% of Triage 5 emergency department patients are to be seen by a clinician within two hours. This target was achieved in the September 2015 quarter, where 95.8%^ of patients were seen within the recommended time.
For the September 2015 quarter, the percentage of Triage 5 patients seen within the recommended time at country hospitals was 97.3%. This represent a 0.1% decrease compared with the same quarter in the previous year.
Data for the percentage of Triage 5 patients seen within recommended time at metropolitan hospitals is not complete for the September 2015 quarter, therefore a comparison cannot be made between the September 2014 and September 2015 quarters.
Triage 5 figures are collated from all WA public hospitals that provide emergency department services, including public patients at Joondalup Health Campus and Peel Health Campus.
The calculation of the Western Australian Emergency Department waiting time is based on the commencement of clinical care by either a doctor, nurse, mental health practitioner or other health professional, which is based on the National definition. Metropolitan emergency departments began recording of the commencement of clinical care by a nurse, mental health practitioner or other health professional in November 2013.
Note: Figures shown in the table are rounded to one decimal place. The actual and % changes in figures between the September 2014 and September 2015 quarters are calculated using actual numbers that contain more than one decimal place, and therefore the change figure presented above may be slightly different to those calculated using the rounded figures in the table.
Table 20: Percentage of ED Triage 5 patients seen within the recommended time (2 hours)*
AreaDecember
2013 QuarterMarch
2014 QuarterJune
2014 QuarterSeptember
2014 QuarterDecember
2014 QuarterMarch
2015 QuarterJune
2015 QuarterSeptember
2015 Quarter
% change Sep'14 to Sep'15
Quarters
Metropolitan 92.4% 92.9% 94.8% 91.1% 91.4%^ 92.1%^ 94.5%^ 92.9%^ N/A
Country 97.5% 97.7% 98.0% 97.4% 97.9% 97.7% 97.5% 97.3% -0.1%
WA State 95.9% 96.1% 96.9% 95.4% 95.8%^ 95.8%^ 96.5%^ 95.8%^ N/A
* Refer to the Notes section (page v) and the Data Definitions and Business Rules (pages 47 to 68) for information on how to interpret the figures including symbols in this report.
Public Emergency Departments
Previous (Dec ‘13 Qtr – Sep ‘14 Qtr)Current (Dec ‘14 Qtr – Sep ‘15 Qtr)Target
60%
70%
80%
90%
100%
December Qtr March Qtr June Qtr September Qtr
Per
cent
age
of T
riage
5 p
atie
nts
Figure 20: Percentage of ED Triage 5 patients seen within the recommended time (2 hours) (WA State)

WA Health Performance Report | July to September 2015 Quarter
21
4.7 Admissions from Emergency DepartmentsWhat do these figures show? In the September 2015 quarter, there was a decrease of 2,038 (or 3.8%) in total public hospital admissions from emergency departments compared with the same quarter in the previous year.
For the same period, metropolitan public hospital admissions from emergency departments decreased by 490 (or 1.2%). Country public hospital admissions from emergency departments decreased by 1,548 (or 13.1%).
The figures include all WA public hospitals that provide emergency department services, including public patients at Joondalup Health Campus and Peel Health Campus.
Table 21: Admissions from emergency departments*
AreaDecember
2013 QuarterMarch
2014 QuarterJune
2014 QuarterSeptember
2014 QuarterDecember
2014 QuarterMarch
2015 QuarterJune
2015 QuarterSeptember
2015 Quarter
% change Sep'14 to Sep'15
Quarters
Metropolitan 43,734 42,290 42,357 42,219 42,175 41,692 40,628 41,729 -1.2%
Country 13,113 12,466 12,144 11,862 10,662 10,299 10,229 10,314 -13.1%
WA State 56,847 54,756 54,501 54,081 52,837 51,991 50,857 52,043 -3.8%
* Refer to the Notes section (page v) and the Data Definitions and Business Rules (pages 47 to 68) for information on how to interpret the figures including symbols in this report.
Public Emergency Departments
Previous (Dec ‘13 Qtr – Sep ‘14 Qtr)Current (Dec ‘14 Qtr – Sep ‘15 Qtr)
40,000
50,000
60,000
70,000
December Qtr March Qtr June Qtr September QtrAdm
issi
ons
from
em
erge
ncy
depa
rtm
ents
Figure 21: Admissions from emergency departments (WA State)

WA Health Performance Report | July to September 2015 Quarter
22
5. Mental Health5.1 Mental Health SeparationsWhat do these figures show? Preliminary figures indicate that in the September 2015 quarter, there was an increase of 502 (or 15.8%) public mental health separations compared with the same quarter in the previous year. This is due to the progressive opening of additional mental health wards/beds at Fiona Stanley Hospital (FSH).
Preliminary figures indicate that metropolitan public hospital mental health separations increased by 525 (or 19.2%). For country public hospitals there were 23 (or 5.3%) less mental health separations for the September 2015 quarter compared with the September 2014 quarter.
Figures include mental health separations at all authorised hospitals and designated mental health inpatient units at public hospitals and the authorised mental health inpatient units at Joondalup Health Campus and St John of God Mt Lawley Hospital. Peel Health Campus is excluded as it is not a designated mental health facility.
Separations from mental health services can vary from year to year. Factors that can impact on separations during any year include the availability of beds and staffing levels.
Table 22: Number of public mental health separations*,6
AreaDecember
2013 QuarterMarch
2014 QuarterJune
2014 QuarterSeptember
2014 QuarterDecember
2014 QuarterMarch
2015 QuarterJune
2015 QuarterSeptember
2015 Quarter
% change Sep'14 to Sep'15
Quarters
Metropolitan 2,667 2,583 2,621 2,741 2,839 2,796 3,022 3,266 19.2%
Country 422 414 386 431 439 379 388 408 -5.3%
WA State 3,089 2,997 3,007 3,172 3,278 3,175 3,410 3,674 15.8%
* Refer to the Notes section (page v) and the Data Definitions and Business Rules (pages 47 to 68) for information on how to interpret the figures including symbols in this report.
Mental Health
Previous (Dec ‘13 Qtr – Sep ‘14 Qtr)Current (Dec ‘14 Qtr – Sep ‘15 Qtr)
2,400
2,600
2,800
3,000
3,200
3,400
3,600
3,800
December Qtr March Qtr June Qtr September Qtr
No.
of m
enta
l hea
lth s
epar
atio
ns
Figure 22: Number of public mental health separations (WA State)

WA Health Performance Report | July to September 2015 Quarter
23
5.2 Mental Health OutpatientsWhat do these figures show? Preliminary figures indicate that in the September 2015 quarter, there was a decrease of 15,989 (or 6.8%) attendances for services at public mental health outpatient clinics compared with the same quarter in the previous year.
Preliminary figures indicate that attendances for mental health outpatient services in the metropolitan area decreased by 14,027 (or 7.4%) and in the country attendances decreased by 1,962 (or 4.4%) for the September 2015 quarter compared with the same quarter in the previous year.
Figures include all public outpatient mental health services. All outpatient services for Peel and Joondalup areas are provided by the metropolitan public mental health services.
Table 23: Number of attendances for mental health services at outpatient clinics*,7
AreaDecember
2013 QuarterMarch
2014 QuarterJune
2014 QuarterSeptember
2014 QuarterDecember
2014 QuarterMarch
2015 QuarterJune
2015 QuarterSeptember
2015 Quarter
% change Sep'14 to Sep'15
Quarters
Metropolitan 169,758 172,366 185,261 190,816 168,901 174,913 177,771 176,789 -7.4%
Country 40,997 40,436 42,408 44,379 38,595 42,873 41,832 42,417 -4.4%
WA State 210,755 212,802 227,669 235,195 207,496 217,786 219,603 219,206 -6.8%
* Refer to the Notes section (page v) and the Data Definitions and Business Rules (pages 47 to 68) for information on how to interpret the figures including symbols in this report.
Mental Health
Previous (Dec ‘13 Qtr – Sep ‘14 Qtr)Current (Dec ‘14 Qtr – Sep ‘15 Qtr)
160,000
180,000
200,000
220,000
240,000
260,000
December Qtr March Qtr June Qtr September QtrNo.
of o
utpa
tient
men
tal h
ealth
atte
ndan
ces
Figure 23: Number of attendances for mental health services at outpatient clinics (WA State)

WA Health Performance Report | July to September 2015 Quarter
24
6. Ambulatory Surgery Initiative (ASI)6.1 Ambulatory Surgery Initiative CasesWhat do these figures show? In the September 2015 quarter, there was a decrease of 769 (or 29.7%) in the number of ASI cases compared with the same quarter in the previous year.
For the same period, the number of ASI cases in the metropolitan area decreased by 739 (or 30.6%) and in the country area decreased by 30 (or 17.4%) compared with the same quarter in the previous year.
Table 24: Number of ASI cases*
AreaDecember
2013 QuarterMarch
2014 QuarterJune
2014 QuarterSeptember
2014 QuarterDecember
2014 QuarterMarch
2015 QuarterJune
2015 QuarterSeptember
2015 Quarter
% change Sep'14 to Sep'15
Quarters
Metropolitan 2,026 2,225 2,233 2,417 1,920 1,567 1,607 1,678 -30.6%
Country 119 125 161 172 114 123 136 142 -17.4%
WA State 2,145 2,350 2,394 2,589 2,034 1,690 1,743 1,820 -29.7%
* Refer to the Notes section (page v) and the Data Definitions and Business Rules (pages 47 to 68) for information on how to interpret the figures including symbols in this report.
Ambulatory Surgery Initiative
Previous (Dec ‘13 Qtr – Sep ‘14 Qtr)Current (Dec ‘14 Qtr – Sep ‘15 Qtr)
0
1,000
2,000
3,000
4,000
December Qtr March Qtr June Qtr September Qtr
No.
of A
SI c
ases
Figure 24: Number of ASI cases (WA State)

WA Health Performance Report | July to September 2015 Quarter
25
7. Public Dental Health Clinics7.1 Dental VisitsWhat do these figures show? In the September 2015 quarter, there was an increase of 1,695 (or 2.4%) in the number of visits to school dental health clinics compared with the same quarter in the previous year.
From the September 2015 quarter, both metropolitan and country dental health clinic figures include the estimated visits associated with patients who had been given vouchers to attend a participating private practice for treatment under the State Subsidy Scheme (Country Patients’ Dental Subsidy Scheme and Metropolitan Patients’ Dental Subsidy Scheme). Therefore a direct comparison cannot be made between the September 2015 and previous quarters.
School dental figures from December 2013 to November 2014 have been updated with actual data in the March 2015 quarter report. The figures from December 2014 to January 2015 are estimates only. School Dental Service data collection was 100% online from February 2015. All school dental service data from February 2015 onwards are actuals.
Public Dental Health figures are calculated based on state-funded operational activity.
Table 25: Number of visits to dental health clinics*
AreaDecember
2013 QuarterMarch
2014 QuarterJune
2014 QuarterSeptember
2014 QuarterDecember
2014 QuarterMarch
2015 QuarterJune
2015 QuarterSeptember
2015 Quarter
% change Sep'14 to Sep'15
Quarters
Metro Clinics 30,584 29,997 29,435 30,592 28,715 29,262 29,444 30,689 N/A
Rural Clinics 9,463 8,781 8,580 10,042 8,737 8,425 8,980 15,689 N/A
School Clinics 61,370 60,800 76,353 70,689 65,617 51,121 79,422 72,384 2.4%
WA State 101,417 99,578 114,368 111,323 103,069 88,808 117,846 118,762 N/A
* Refer to the Notes section (page v) and the Data Definitions and Business Rules (pages 47 to 68) for information on how to interpret the figures including symbols in this report.
Public Dental Clinics
Previous (Dec ‘13 Qtr – Sep ‘14 Qtr)Current (Dec ‘14 Qtr – Sep ‘15 Qtr)
80,000
90,000
100,000
110,000
120,000
130,000
December Qtr March Qtr June Qtr September Qtr
No.
of d
enta
l vis
its
Figure 25: Number of visits to dental clinics (WA State)

WA Health Performance Report | July to September 2015 Quarter
26
7.2 Dental Health Clinic Waiting ListWhat do these figures show? The number of patients waiting for dental health clinic services as at 30 September 2015 decreased by 3,014 (or 32.1%) compared with the number of patients waiting as at 30 June 2015.
The decrease is due to the anticipated implementation of a new National Partnership Agreement on Adult Public Dental Services.
Table 26: Number of patients waiting for services at dental health clinics*,8
Area31 December
201331 March
201430 June
201430 September
201431 December
201431 March
201530 June
201530 September
2015
% change 30 Sep 14 to
30 Sep 15
WA State 11,662 10,973 7,537 6,769 6,952 7,693 9,390 6,376 -5.8%
* Refer to the Notes section (page v) and the Data Definitions and Business Rules (pages 47 to 68) for information on how to interpret the figures including symbols in this report.
Public Dental Clinics
Previous (31 Dec ‘13 – 30 Sep ’14)Current (31 Dec ‘14 – 30 Sep ’15)
0
5,000
10,000
15,000
20,000
31 December 31 March 30 June 30 September
No.
of p
atie
nts
wai
ting
Figure 26: Number of patients waiting for services at dental clinics (WA State)
WA Health Performance Report | July to September 2015 Quarter
27
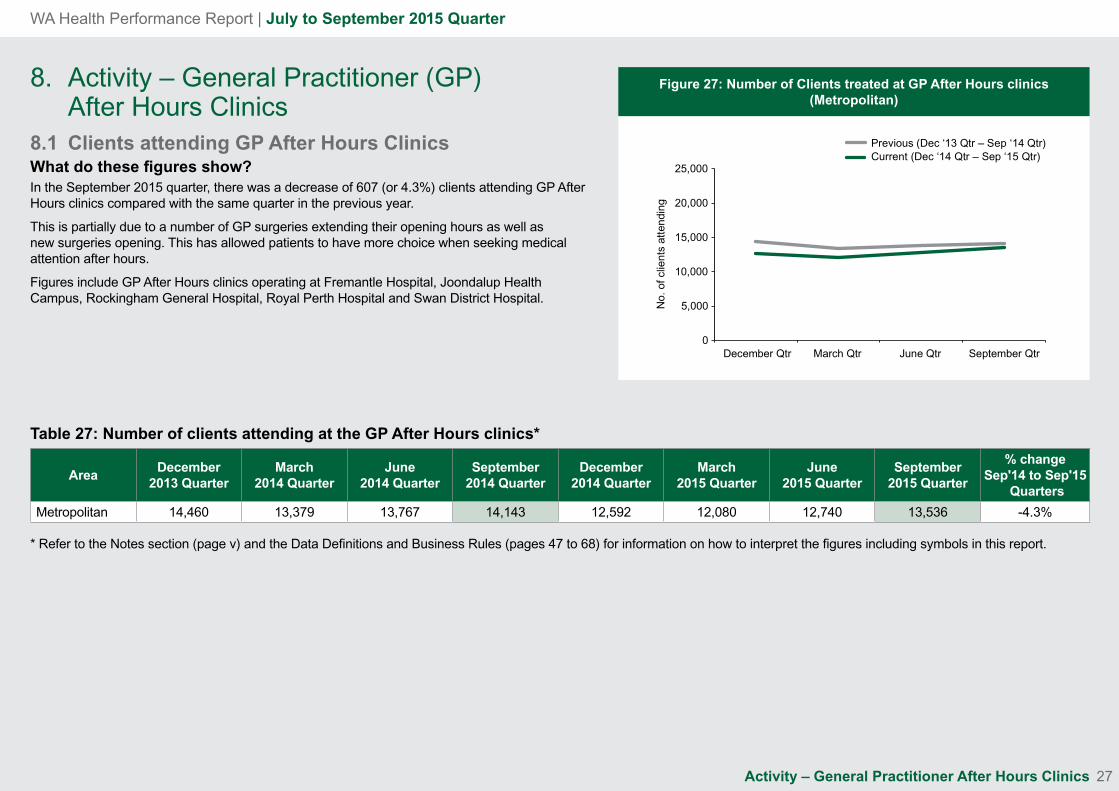
8. Activity – General Practitioner (GP) After Hours Clinics8.1 Clients attending GP After Hours ClinicsWhat do these figures show? In the September 2015 quarter, there was a decrease of 607 (or 4.3%) clients attending GP After Hours clinics compared with the same quarter in the previous year.
This is partially due to a number of GP surgeries extending their opening hours as well as new surgeries opening. This has allowed patients to have more choice when seeking medical attention after hours.
Figures include GP After Hours clinics operating at Fremantle Hospital, Joondalup Health Campus, Rockingham General Hospital, Royal Perth Hospital and Swan District Hospital.
Table 27: Number of clients attending at the GP After Hours clinics*
AreaDecember
2013 QuarterMarch
2014 QuarterJune
2014 QuarterSeptember
2014 QuarterDecember
2014 QuarterMarch
2015 QuarterJune
2015 QuarterSeptember
2015 Quarter
% change Sep'14 to Sep'15
Quarters
Metropolitan 14,460 13,379 13,767 14,143 12,592 12,080 12,740 13,536 -4.3%
* Refer to the Notes section (page v) and the Data Definitions and Business Rules (pages 47 to 68) for information on how to interpret the figures including symbols in this report.
Activity – General Practitioner After Hours Clinics
Previous (Dec ‘13 Qtr – Sep ‘14 Qtr)Current (Dec ‘14 Qtr – Sep ‘15 Qtr)
0
5,000
10,000
15,000
20,000
25,000
December Qtr March Qtr June Qtr September Qtr
No.
of c
lient
s at
tend
ing
Figure 27: Number of Clients treated at GP After Hours clinics (Metropolitan)

WA Health Performance Report | July to September 2015 Quarter
28
9. National Elective Surgery Targets Did you know?The Australian Government, under The National Health Reform Agreement – National Partnership Agreement (NPA) on Improving Public Hospital Services, provided up to $650 million for improvements in access to elective surgery in order to progressively increase the number of elective surgeries performed so that 100% of patients received their elective surgery within the clinically recommended time by 2016. This NPA and remaining reward funding was terminated by the Commonwealth effective 1 July 2015. To ensure continued improvement in patient access to elective surgery, WA Health are maintaining NEST 2015 targets in the interim.
Two complementary strategies are required in order to reach the NEST:
Part 1: A stepped improvement in the number of patients treated within the clinically recommended time; and Part 2: A progressive reduction in the number of patients who are overdue for surgery, particularly patients who have waited the longest beyond the clinically recommended time.
WA targets for these strategies are outlined below:
Proportion of cases treated within clinically recommended time
Category 31-Dec-12 31-Dec-13 31-Dec-14 31-Dec-15
1 94.0% 100% 100% 100%
2 84.0% 88.0% 95.0% 100%
3 98.0% 98.0% 98.5% 100%
Average overdue wait time (in days) for those that have waited beyond the clinically recommended time
Category 31-Dec-12 31-Dec-13 31-Dec-14 31-Dec-15
1 0 0 0 0
2 68 45 23 0
3 65 44 22 0
National Elective Surgery Targets

WA Health Performance Report | July to September 2015 Quarter
29
9.1 Elective Surgery Wait List Category 1 Cases Treated (Admitted) within Clinically Recommended TimeWhat do these figures show? The December 2015 target for Category 1 cases treated within the clinically recommended time is 100%.
In the September 2015 YTD calendar period, 93.2% of cases were treated within the clinically recommended time. This represents a 4.9% decrease in cases treated within the clinically recommended time compared with the same period in the previous year.
For the same period, the proportion of Category 1 cases treated within the clinically recommended time at metropolitan hospitals decreased by 5.5% and at country hospitals decreased by 0.3%.
Figures include all public hospital elective surgery wait lists and the public patient wait lists at Joondalup and Peel Health Campuses.
Note: Figures shown in the table are rounded to one decimal place. The actual and % changes in figures between September 2014 YTD and September 2015 YTD are calculated using actual numbers that contain more than one decimal place, and therefore the change figures presented in the table and text may be slightly different to those calculated using the rounded figures in the table.
Table 28: Percentage of Category 1 cases treated (admitted) within clinically recommended time*,9
AreaMarch
2014 YTDJune
2014 YTDSeptember 2014 YTD
December 2014 YTD
March 2015 YTD
June 2015 YTD
September 2015 YTD
December 2015 YTD
% change Sep '14 YTD to
Sep '15 YTD
Metropolitan 97.6% 97.8% 97.7% 97.9% 93.8% 92.6% 92.3% -5.5%
Country 99.8% 99.6% 99.7% 99.6% 99.6% 99.7% 99.4% -0.3%
WA State 97.9% 98.0% 98.0% 98.1% 94.5% 93.5% 93.2% -4.9%
* Refer to the Notes section (page v) and the Data Definitions and Business Rules (pages 47 to 68) for information on how to interpret the figures including symbols in this report.
National Elective Surgery Targets
Mar '15 YTD - Sep '15 YTDNPA Dec 2014 and 2015 Target
Mar '14 YTD - Dec '14 YTD87.4% Baseline (2010)
70%
75%
80%
85%
90%
95%
100%
March YTD June YTD September YTD December YTD
Per
cent
age
of c
ateg
ory
1 ca
ses
trea
ted
with
in r
ecom
men
ded
tim
e
Figure 28: Percentage of Category 1 cases treated (admitted) within clinically recommended time

WA Health Performance Report | July to September 2015 Quarter
30
9.2 Elective Surgery Wait List Category 2 Cases Treated (Admitted) within Clinically Recommended TimeWhat do these figures show? The December 2015 target for Category 2 cases treated within the clinically recommended time is 100%.
In the September 2015 YTD calendar period, 87.9% of cases were treated within the clinically recommended time. This represents a 4.3% decrease in cases treated within the clinically recommended time compared with the same period in the previous year.
For the same period, the proportion of Category 2 cases treated within the clinically recommended time at metropolitan hospitals decreased by 5.3% and at country hospitals decreased by 0.1%.
Figures include all public hospital elective surgery wait lists and the public patient wait lists at Joondalup and Peel Health Campuses.
Note: Figures shown in the table are rounded to one decimal place. The actual and % changes in figures between September 2014 YTD and September 2015 YTD are calculated using actual numbers that contain more than one decimal place, and therefore the change figures presented in the table and text may be slightly different to those calculated using the rounded figures in the table.
Table 29: Percentage of Category 2 cases treated (admitted) within clinically recommended time*,9
AreaMarch
2014 YTDJune
2014 YTDSeptember 2014 YTD
December 2014 YTD
March 2015 YTD
June 2015 YTD
September 2015 YTD
December 2015 YTD
% change Sep '14 YTD to
Sep '15 YTD
Metropolitan 91.0% 90.9% 90.3% 90.0% 84.1% 84.6% 85.5% -5.3%
Country 99.9% 99.8% 99.9% 99.9% 99.9% 99.9% 99.8% -0.1%
WA State 92.4% 92.4% 91.9% 91.7% 86.9% 87.3% 87.9% -4.3%
* Refer to the Notes section (page v) and the Data Definitions and Business Rules (pages 47 to 68) for information on how to interpret the figures including symbols in this report.
National Elective Surgery Targets
70%
75%
80%
85%
90%
95%
100%
March YTD June YTD September YTD December YTD
Per
cent
age
of c
ateg
ory
2 ca
ses
trea
ted
with
in r
ecom
men
ded
time
Mar '15 YTD - Sep '15 YTDNPA Dec 2015 Target79.2% Baseline (2010)
Mar '14 YTD - Dec '14 YTDNPA Dec 2014 Target
Figure 29: Percentage of Category 2 cases treated (admitted) within clinically recommended time

WA Health Performance Report | July to September 2015 Quarter
31
9.3 Elective Surgery Wait List Category 3 Cases Treated (Admitted) within Clinically Recommended TimeWhat do these figures show? The December 2015 target for Category 3 cases treated within the clinically recommended time is 100%.
In the September 2015 YTD calendar period, 98.0% of cases were treated within the clinically recommended time. This represents a 0.6% decrease in cases treated within the clinically recommended time compared with the same period in the previous year.
For the same period, the proportion of Category 3 cases treated within the clinically recommended time at metropolitan hospitals decreased by 0.7% and at country hospitals decreased by 0.6%.
Figures include all public hospital elective surgery wait lists and the public patient wait lists at Joondalup and Peel Health Campuses.
Note: Figures shown in the table are rounded to one decimal place. The actual and % changes in figures between September 2014 YTD and September 2015 YTD are calculated using actual numbers that contain more than one decimal place, and therefore the change figures presented in the table and text may be slightly different to those calculated using the rounded figures in the table.
Table 30: Percentage of Category 3 cases treated (admitted) within clinically recommended time*,9
AreaMarch
2014 YTDJune
2014 YTDSeptember 2014 YTD
December 2014 YTD
March 2015 YTD
June 2015 YTD
September 2015 YTD
December 2015 YTD
% change Sep '14 YTD to
Sep '15 YTD
Metropolitan 98.6% 98.5% 98.5% 98.4% 98.6% 98.1% 97.9% -0.7%
Country 98.5% 98.5% 98.9% 98.9% 97.5% 98.1% 98.3% -0.6%
WA State 98.5% 98.5% 98.6% 98.5% 98.3% 98.1% 98.0% -0.6%
* Refer to the Notes section (page v) and the Data Definitions and Business Rules (pages 47 to 68) for information on how to interpret the figures including symbols in this report.
National Elective Surgery Targets
Mar '15 YTD - Sep '15 YTDNPA Dec 2015 Target97.2% Baseline (2010)
Mar '14 YTD - Dec '14 YTDNPA Dec 2014 Target
90%
92%
94%
96%
98%
100%
March YTD June YTD September YTD December YTD
Per
cent
age
of c
ateg
ory
3 ca
ses
trea
ted
with
in r
ecom
men
ded
time
Figure 30: Percentage of Category 3 cases treated (admitted) within clinically recommended time

WA Health Performance Report | July to September 2015 Quarter
32
9.4 Average Overdue Wait Time (Days) for Category 1 CasesWhat do these figures show? The December 2015 target for average overdue wait time (days) for Category 1 cases that have waited beyond the clinically recommended time is 0 days.
The average overdue wait time for Category 1 cases on the elective surgery wait list as at 30 September 2015 was 23.86 days. This represents an increase of 11.36 days (or 90.9%) in average overdue wait time for Category 1 cases compared with 30 September 2014. This was due to the significant elective surgery reconfiguration and workforce changes related to the commissioning of Fiona Stanley Hospital during this period.
For the same period, the average overdue wait time for Category 1 cases at country public hospitals remained the same (0.00 days).
Figures include all public hospital elective surgery wait lists and the public patient wait lists at Joondalup and Peel Health Campuses.
Note: Figures shown in the table are rounded to two decimal places. The actual and % changes in figures between as at 30 September 2014 and 30 September 2015 are calculated using actual numbers that contain more than two decimal places, and therefore the change figures presented in the table and text may be slightly different to those calculated using the rounded figures in the table.
Table 31: Average overdue wait time (days) for Category 1 cases that have waited beyond the clinically recommended time*,9,5
Area31 March
201430 June
201430 September
201431 December
201431 March
201530 June
201530 September
201531 December
2015
% change 30 Sep 14 to
30 Sep 15
Metropolitan 7.27 9.64 12.50 36.25 26.48 11.05 23.86 90.9%
Country 0.00 0.00 0.00 0.00 0.00 17.50 0.00 N/C
WA State 7.27 9.64 12.50 36.25 26.48 11.24 23.86 90.9%
* Refer to the Notes section (page v) and the Data Definitions and Business Rules (pages 47 to 68) for information on how to interpret the figures including symbols in this report.
National Elective Surgery Targets
31 Mar '15 - 30 Sep '1531 Mar '14 - 31 Dec '14NPA Dec 2014 and 2015 Target
0.0
5.0
10.0
15.0
20.0
25.0
30.0
35.0
40.0
31 March 30 June 30 September 31 December
Ave
rage
ove
rdue
wai
t tim
e (d
ays)
for
cate
gory
1 c
ases
Figure 31: Average overdue wait time (days) for category 1 cases that have waited beyond the clinically recommended time

WA Health Performance Report | July to September 2015 Quarter
33
9.5 Average Overdue Wait Time (Days) for Category 2 CasesWhat do these figures show? The December 2015 target for average overdue wait time (days) for Category 2 cases that have waited beyond the clinically recommended time is 0 days.
The average overdue wait time for Category 2 cases on the elective surgery wait list as at 30 September 2015 was 74.09 days. This represents an increase of 33.33 days (or 81.8%) in average overdue wait time for Category 2 cases compared with 30 September 2014. This was due to the significant elective surgery reconfiguration and workforce changes related to the commissioning of Fiona Stanley Hospital during this period.
For the same period, the average overdue wait time for Category 2 cases at country public hospitals remained the same (0.00 days).
Figures include all public hospital elective surgery wait lists and the public patient wait lists at Joondalup and Peel Health Campuses.
Note: Figures shown in the table are rounded to two decimal places. The actual and % changes in figures between as at 30 September 2014 and 30 September 2015 are calculated using actual numbers that contain more than two decimal places, and therefore the change figures presented in the table and text may be slightly different to those calculated using the rounded figures in the table.
Table 32: Average overdue wait time (days) for Category 2 cases that have waited beyond the clinically recommended time*,9,5
Area31 March
201430 June
201430 September
201431 December
201431 March
201530 June
201530 September
201531 December
2015
% change 30 Sep 14 to
30 Sep 15
Metropolitan 37.63 42.05 40.76 48.57 62.51 87.93 74.09 81.8%
Country 0.00 8.00 0.00 3.00 19.00 18.00 0.00 N/C
WA State 37.63 41.95 40.76 48.50 62.46 87.70 74.09 81.8%
* Refer to the Notes section (page v) and the Data Definitions and Business Rules (pages 47 to 68) for information on how to interpret the figures including symbols in this report.
National Elective Surgery Targets
0.0
10.0
20.0
30.0
40.0
50.0
60.0
70.0
80.0
90.0
31 March 30 June 30 September 31 December
Ave
rage
ove
rdue
wai
t tim
e (d
ays)
for
cate
gory
2 c
ases
31 Mar '15 - 30 Sep '15NPA Dec 2015 Target
31 Mar '14 - 31 Dec '14NPA Dec 2014 Target
Figure 32: Average overdue wait time (days) for category 2 cases that have waited beyond the clinically recommended time

WA Health Performance Report | July to September 2015 Quarter
34
9.6 Average Overdue Wait Time (Days) for Category 3 CasesWhat do these figures show? The December 2015 target for average overdue wait time (days) for Category 3 cases that have waited beyond the clinically recommended time is 0 days.
The average overdue wait time for Category 3 cases on the elective surgery wait list as at 30 September 2015 was 92.84 days. This represents an increase of 39.86 days (or 75.2%) in average overdue wait time for Category 3 cases compared with 30 September 2014. This was due to the significant elective surgery reconfiguration and workforce changes related to the commissioning of Fiona Stanley Hospital during this period.
For the same period, the average overdue wait time for Category 3 cases at metropolitan public hospitals increased by 39.83 days (or 67.1%) and at country public hospitals increased by 28.61 days (or 274.1%). The increase at country hospitals relates to a low total volume of category 3 over boundary cases. Of this total, there were a small number of patients that were unable to be seen, impacting on average wait times.
Figures include all public hospital elective surgery wait lists and the public patient wait lists at Joondalup and Peel Health Campuses.
Note: Figures shown in the table are rounded to two decimal places. The actual and % changes in figures between as at 30 September 2014 and 30 September 2015 are calculated using actual numbers that contain more than two decimal places, and therefore the change figures presented in the table and text may be slightly different to those calculated using the rounded figures in the table.
Table 33: Average overdue wait time (days) for Category 3 cases that have waited beyond the clinically recommended time*,9,5
Area31 March
201430 June
201430 September
201431 December
201431 March
201530 June
201530 September
201531 December
2015
% change 30 Sep 14 to
30 Sep 15
Metropolitan 51.32 47.86 59.35 68.19 80.87 93.90 99.17 67.1%
Country 49.07 2.33 10.44 26.83 29.00 34.93 39.05 274.1%
WA State 50.95 44.79 52.98 62.90 76.38 85.73 92.84 75.2%
* Refer to the Notes section (page v) and the Data Definitions and Business Rules (pages 47 to 68) for information on how to interpret the figures including symbols in this report.
National Elective Surgery Targets
31 Mar '15 - 30 Sep '15NPA Dec 2015 Target
31 Mar '14 - 31 Dec '14NPA Dec 2014 Target
0.0
10.0
20.0
30.0
40.0
50.0
60.0
70.0
80.0
90.0
100.0
31 March 30 June 30 September 31 December
Ave
rage
ove
rdue
wai
t tim
e (d
ays)
for
cate
gory
3 c
ases
Figure 33: Average overdue wait time (days) for category 3 cases that have waited beyond the clinically recommended time

WA Health Performance Report | July to September 2015 Quarter
35
10. National Emergency Access TargetDid you know?The National Emergency Access Target (NEAT) is a national four hour target where, by 2015, 90 per cent of all patients presenting to a public hospital ED will physically leave the ED for admission to hospital, be referred to another hospital for treatment or be discharged, within four hours. The aim of the target is to improve the patient experience and quality of care by reducing delays in the ED and streamlining processes for admission and discharge across the hospital. Service improvement activity that commenced under the Four Hour Rule Program will continue as part of ongoing emergency care reform and the NEAT, as will the public reporting of performance and safety and quality indicators.
Staged implementation for NEAT is across all triage categories by calendar year commencing in 2012, as listed in the table below:
State1 Jan 2012 to 31 Dec 2012
(Period 1)1 Jan 2013 to 31 Dec 2013
(Period 2)1 Jan 2014 to 31 Dec 2014
(Period 3)1 Jan 2015 to 31 Dec 2015
(Period 4)
WA 76.0% 81.0% 85.0% 90.0%
What hospitals does it cover? Tertiary#: Fiona Stanley Hospital (FSH), Fremantle Hospital (FH), King Edward Memorial Hospital (KEMH), Princess Margaret Hospital (PMH), Royal Perth Hospital (RPH) and Sir Charles Gairdner Hospital (SCGH). Metropolitan General:
Armadale-Kelmscott Memorial Hospital (AKMH), Joondalup Health Campus (JHC), Peel Health Campus (PHC), Rockingham General Hospital (RGH) and Swan District Hospital (SDH).
Rural: Albany Hospital (AH), Broome Hospital (BH), Bunbury Regional Hospital (BRH), Geraldton Hospital (GH), Hedland Health Campus (HHC), Kalgoorlie Hospital (KH) and Nickol Bay Hospital (NBH).
# Fremantle Hospital Emergency Department was closed on 3 February 2015. Fiona Stanley Hospital Emergency Department opened on 3 February 2015.
How can I get more information? Further information about National Emergency Access Target and the performance of individual hospitals is available at www.health.wa.gov.au/emergencyaccessreform/home/.
National Emergency Access Target

WA Health Performance Report | July to September 2015 Quarter
36
10.1 NEAT Total Emergency Department AttendancesWhat do these figures show? In the September 2015 quarter, there was an increase of 5,671 (or 2.8%) in total emergency department attendances in National Emergency Access Target hospitals compared with the same quarter in the previous year.
For the same period, metropolitan National Emergency Access Target hospital emergency department attendances increased by 6,607 (or 4.3%). Country National Emergency Access Target hospital emergency department attendances decreased by 936 (or 2.0%).
Tertiary hospital emergency department attendances increased by 7,522 (or 10.0%) and metropolitan general hospital emergency department attendances decreased by 915 (or 1.2%).
Table 34 – NEAT total emergency department attendances*
AreaDecember
2013 QuarterMarch
2014 QuarterJune
2014 QuarterSeptember
2014 QuarterDecember
2014 QuarterMarch
2015 QuarterJune
2015 QuarterSeptember
2015 Quarter
% change Sep'14 to Sep'15
Quarters
Metropolitan 151,788 147,559 148,041 153,638 153,502 152,088 153,378 160,245 4.3%
Country 45,153 43,547 43,078 46,050 44,681 43,146 43,480 45,114 -2.0%
WA State 196,941 191,106 191,119 199,688 198,183 195,234 196,858 205,359 2.8%
Hospital Grouping
Tertiary 74,305 72,528 72,667 75,217 74,775 76,275 78,831 82,739 10.0%
Metropolitan General
77,483 75,031 75,374 78,421 78,727 75,813 74,547 77,506 -1.2%
Rural 45,153 43,547 43,078 46,050 44,681 43,146 43,480 45,114 -2.0%
* Refer to the Notes section (page v) and the Data Definitions and Business Rules (pages 47 to 68) for information on how to interpret the figures including symbols in this report.
National Emergency Access Target
Previous (Dec ‘13 Qtr – Sep ‘14 Qtr)Current (Dec ‘14 Qtr – Sep ‘15 Qtr)
120,000
140,000
160,000
180,000
200,000
220,000
December Qtr March Qtr June Qtr September Qtr
Tot
al N
EA
T E
D A
ttend
ance
s
Figure 34: NEAT total emergency department attendances – NEAT hospitals

WA Health Performance Report | July to September 2015 Quarter
37
10.2 NEAT Total Admissions from Emergency DepartmentsWhat do these figures show? In the September 2015 quarter, there was an increase of 2,584 (or 4.9%) in admissions from emergency departments in National Emergency Access Target hospitals compared with the same quarter in the previous year.
For the same period, admissions from metropolitan National Emergency Access Target hospital emergency departments increased by 2,236 (or 4.9%). Admissions from country National Emergency Access Target hospital emergency departments increased by 348 (or 4.3%).
Admissions from tertiary hospital emergency departments increased by 1,646 (or 5.9%) and metropolitan general hospital emergency departments increased by 590 (or 3.4%).
Table 35 – NEAT total admissions from emergency departments*
AreaDecember
2013 QuarterMarch
2014 QuarterJune
2014 QuarterSeptember
2014 QuarterDecember
2014 QuarterMarch
2015 QuarterJune
2015 QuarterSeptember
2015 Quarter
% change Sep'14 to Sep'15
Quarters
Metropolitan 43,244 43,071 43,929 45,216 44,656 44,630 45,398 47,452 4.9%
Country 7,812 7,395 7,605 8,004 7,677 7,554 7,852 8,352 4.3%
WA State 51,056 50,466 51,534 53,220 52,333 52,184 53,250 55,804 4.9%
Hospital Grouping
Tertiary 27,101 27,019 27,623 27,992 27,641 27,144 27,879 29,638 5.9%
Metropolitan General
16,143 16,052 16,306 17,224 17,015 17,486 17,519 17,814 3.4%
Rural 7,812 7,395 7,605 8,004 7,677 7,554 7,852 8,352 4.3%
* Refer to the Notes section (page v) and the Data Definitions and Business Rules (pages 47 to 68) for information on how to interpret the figures including symbols in this report.
National Emergency Access Target
Previous (Dec ‘13 Qtr – Sep ‘14 Qtr)Current (Dec ‘14 Qtr – Sep ‘15 Qtr)
30,000
40,000
50,000
60,000
70,000
December Qtr March Qtr June Qtr September Qtr
Tot
al N
EA
T A
dmis
sion
s fr
om E
D
Figure 35: NEAT total admissions from emergency department – NEAT hospitals

WA Health Performance Report | July to September 2015 Quarter
38
10.3 NEAT Percentage of Emergency Department Attendances AdmittedWhat do these figures show? For the September 2015 quarter, the percentage of total emergency department attendances admitted in National Emergency Access Target hospitals was 2.0% higher than the same quarter in the previous year.
For the same period, the percentage of total emergency department attendances admitted in metropolitan National Emergency Access Target hospitals increased by 0.6% and in country National Emergency Access Target hospitals increased by 6.5%.
The percentage of total emergency department attendances admitted at tertiary hospitals decreased by 3.7% and metropolitan general hospitals increased by 4.6%.
Note: Figures shown in the table are rounded to one decimal place. The actual and % changes in figures between the September 2014 and September 2015 quarters are calculated using actual numbers that contain more than one decimal place, and therefore the change figures presented above may be slightly different to those calculated using the rounded figures in the table.
Table 36 – NEAT percentage of total emergency department attendances admitted*
AreaDecember
2013 QuarterMarch
2014 QuarterJune
2014 QuarterSeptember
2014 QuarterDecember
2014 QuarterMarch
2015 QuarterJune
2015 QuarterSeptember
2015 Quarter
% change Sep'14 to Sep'15
Quarters
Metropolitan 28.5% 29.2% 29.7% 29.4% 29.1% 29.3% 29.6% 29.6% 0.6%
Country 17.3% 17.0% 17.7% 17.4% 17.2% 17.5% 18.1% 18.5% 6.5%
WA State 25.9% 26.4% 27.0% 26.7% 26.4% 26.7% 27.0% 27.2% 2.0%
Hospital Grouping
Tertiary 36.5% 37.3% 38.0% 37.2% 37.0% 35.6% 35.4% 35.8% -3.7%
Metropolitan General
20.8% 21.4% 21.6% 22.0% 21.6% 23.1% 23.5% 23.0% 4.6%
Rural 17.3% 17.0% 17.7% 17.4% 17.2% 17.5% 18.1% 18.5% 6.5%
* Refer to the Notes section (page v) and the Data Definitions and Business Rules (pages 47 to 68) for information on how to interpret the figures including symbols in this report.
National Emergency Access Target
Previous (Dec ‘13 Qtr – Sep ‘14 Qtr)Current (Dec ‘14 Qtr – Sep ‘15 Qtr)
20.0%
22.0%
24.0%
26.0%
28.0%
30.0%
December Qtr March Qtr June Qtr September Qtr
Per
cent
age
Figure 36: NEAT percentage of total emergency department attendances admitted – NEAT hospitals

WA Health Performance Report | July to September 2015 Quarter
39
10.4 NEAT Total Mental Health Admissions from Emergency DepartmentWhat do these figures show? In the September 2015 quarter, there was an increase of 166 (or 5.5%) in mental health admissions from emergency departments in metropolitan National Emergency Access Target hospitals compared with the same quarter in the previous year.
For the same period, mental health admissions from emergency departments in tertiary hospitals increased by 74 (or 3.6%) and metropolitan general hospitals increased by 92 (or 9.9%).
Country and rural National Emergency Access Target ED mental health admissions data is not complete for the September 2015 quarter, therefore a comparison cannot be made between the September 2014 and September 2015 quarters.
Metropolitan data excludes Peel Health Campus as a result of data capture system limitations.
Table 37 – NEAT total mental health emergency department admissions*,10
AreaDecember
2013 QuarterMarch
2014 QuarterJune
2014 QuarterSeptember
2014 QuarterDecember
2014 QuarterMarch
2015 QuarterJune
2015 QuarterSeptember
2015 Quarter
% change Sep'14 to Sep'15
Quarters
Metropolitan 2,685 2,866 2,721 2,997 3,111 3,115 3,222 3,163 5.5%
Country 628^ 650^ 584^ 649^ 696^ 663^ 620^ 641^ N/A
WA State 3,313^ 3,516^ 3,305^ 3,646^ 3,807^ 3,778^ 3,842^ 3,804^ N/A
Hospital Grouping
Tertiary 1,752 1,936 1,839 2,070 2,114 2,119 2,225 2,144 3.6%
Metropolitan General
933 930 882 927 997 996 997 1,019 9.9%
Rural 628^ 650^ 584^ 649^ 696^ 663^ 620^ 641^ N/A
* Refer to the Notes section (page v) and the Data Definitions and Business Rules (pages 47 to 68) for information on how to interpret the figures including symbols in this report.
National Emergency Access Target
Previous (Dec ‘13 Qtr – Sep ‘14 Qtr)Current (Dec ‘14 Qtr – Sep ‘15 Qtr)
0
1,000
2,000
3,000
4,000
5,000
6,000
December Qtr March Qtr June Qtr September QtrTot
al N
EA
T M
enta
l Hea
lth E
D A
dmis
sion
s
Figure 37: NEAT Total Mental health emergency department admissions – NEAT hospitals

WA Health Performance Report | July to September 2015 Quarter
40
10.5 NEAT Percentage of Total Emergency Department Attendances Transferred to another HospitalWhat do these figures show? For the September 2015 quarter, the percentage of total emergency department attendances transferred from National Emergency Access Target hospitals was 10.3% lower than the same quarter in the previous year.
For the same period, the percentage of total emergency department attendances at metropolitan National Emergency Access Target hospitals transferred to another hospital decreased by 11.2% and at country National Emergency Access Target hospitals decreased by 9.3%.
The percentage of total emergency department attendances at tertiary hospitals transferred to another hospital increased by 2.6% and metropolitan general hospitals decreased by 13.3%.
Note: Figures shown in the table are rounded to one decimal place. The actual and % changes in figures between the September 2014 and September 2015 quarters are calculated using actual numbers that contain more than one decimal place, and therefore the change figures presented above may be slightly different to those calculated using the rounded figures in the table.
Table 38 – NEAT percentage of total emergency department attendances transferred to another hospital*
AreaDecember
2013 QuarterMarch
2014 QuarterJune
2014 QuarterSeptember
2014 QuarterDecember
2014 QuarterMarch
2015 QuarterJune
2015 QuarterSeptember
2015 Quarter
% change Sep'14 to Sep'15
Quarters
Metropolitan 2.6% 2.6% 2.8% 2.7% 2.4% 2.3% 2.4% 2.4% -11.2%
Country 0.8% 0.9% 0.9% 0.9% 0.9% 1.0% 1.0% 0.8% -9.3%
WA State 2.2% 2.2% 2.4% 2.3% 2.1% 2.0% 2.1% 2.1% -10.3%
Hospital Grouping
Tertiary 1.4% 1.4% 1.4% 1.4% 1.2% 1.3% 1.3% 1.5% 2.6%
Metropolitan General
3.8% 3.8% 4.1% 4.0% 3.5% 3.3% 3.6% 3.4% -13.3%
Rural 0.8% 0.9% 0.9% 0.9% 0.9% 1.0% 1.0% 0.8% -9.3%
* Refer to the Notes section (page v) and the Data Definitions and Business Rules (pages 47 to 68) for information on how to interpret the figures including symbols in this report.
National Emergency Access Target
Previous (Dec ‘13 Qtr – Sep ‘14 Qtr)Current (Dec ‘14 Qtr – Sep ‘15 Qtr)
0.0%
0.5%
1.0%
1.5%
2.0%
2.5%
3.0%
December Qtr March Qtr June Qtr September Qtr
Per
cent
age
Figure 38: NEAT percentage of total emergency department attendances transferred to another hospital – NEAT hospitals

WA Health Performance Report | July to September 2015 Quarter
41
10.6 NEAT Percentage of Emergency Department Attendances with Length of Episode (LOE) of Four Hours or LessWhat do these figures show? Under The National Health Reform Agreement – National Partnership Agreement (NPA) on improving Public Hospital Services, reward funding was made available to WA under the National Emergency Access Target (NEAT). The NPA and remaining reward funding was terminated by the Commonwealth effective 1 July 2015. To ensure continued improvement in patient access to emergency department, WA Health are maintaining NEAT 2015 target in the interim. The 2015 target for ED attendances with LOE of four hours or less is 90%.
For the September 2015 quarter, the percentage of emergency department attendances with LOE of four hours or less at tertiary hospitals decreased by 1.0% and at rural hospitals decreased by 0.4% compared with the same quarter in the previous year.
Data for the percentage of emergency department attendances with LOE of four hours or less at metropolitan general hospitals is not complete for the September 2015 quarter, therefore a comparison cannot be made between the September 2014 and September 2015 quarters.
Note: Figures shown in the table are rounded to one decimal place. The actual and % changes in figures between the September 2014 and September 2015 quarters are calculated using actual numbers that contain more than one decimal place, and therefore the change figures presented above may be slightly different to those calculated using the rounded figures in the table.
Table 39 – NEAT percentage of emergency department attendances with LOE of four hours or less*
AreaMarch
2014 QuarterJune
2014 QuarterSeptember
2014 QuarterDecember
2014 QuarterMarch
2015 QuarterJune
2015 QuarterSeptember
2015 QuarterDecember
2015 Quarter
% change Sep'14 to Sep'15
Quarters
Metropolitan 78.1% 79.5% 74.7% 77.9%^ 76.9%^ 77.8%^ 73.8%^ N/A
Country 84.8% 86.8% 85.3% 86.4% 85.8% 85.7% 85.0% -0.4%
WA State 79.7% 81.1% 77.2% 80.0%^ 79.0%^ 79.7%^ 76.4%^ N/A
Hospital Grouping
Tertiary 80.3% 83.3% 77.9% 80.6% 79.2% 80.8% 77.2% -1.0%
Metropolitan General
76.0% 75.7% 71.7% 75.0%^ 74.1%^ 74.1%^ 69.6%^ N/A
Rural 84.8% 86.8% 85.3% 86.4% 85.8% 85.7% 85.0% -0.4%
* Refer to the Notes section (page v) and the Data Definitions and Business Rules (pages 47 to 68) for information on how to interpret the figures including symbols in this report.
National Emergency Access Target
60.0%
70.0%
80.0%
90.0%
100.0%
March Qtr June Qtr September Qtr December Qtr
Per
cent
age
Mar '15 Qtr - Sep '15 Qtr2015 Target 90%
Mar '14 Qtr - Dec '14 Qtr2014 Target 85%
Figure 39: NEAT percentage of emergency department attendances with LOE of four hours or less – NEAT hospitals
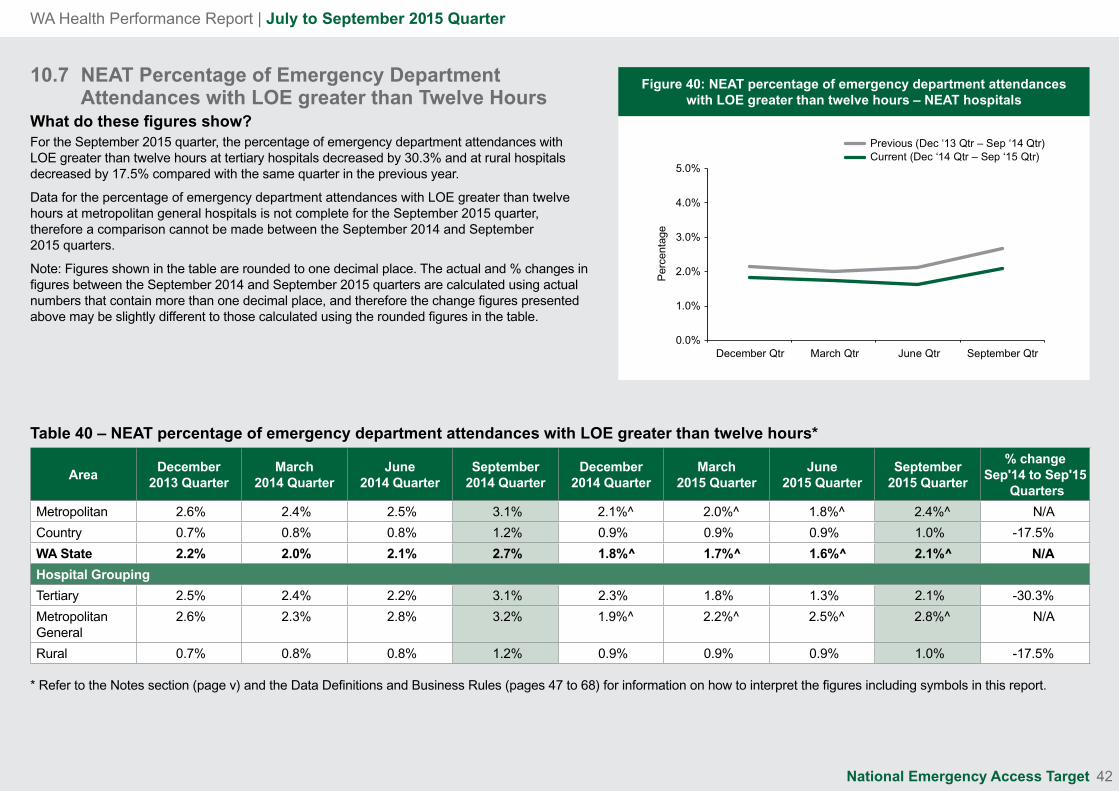
WA Health Performance Report | July to September 2015 Quarter
42
10.7 NEAT Percentage of Emergency Department Attendances with LOE greater than Twelve HoursWhat do these figures show? For the September 2015 quarter, the percentage of emergency department attendances with LOE greater than twelve hours at tertiary hospitals decreased by 30.3% and at rural hospitals decreased by 17.5% compared with the same quarter in the previous year.
Data for the percentage of emergency department attendances with LOE greater than twelve hours at metropolitan general hospitals is not complete for the September 2015 quarter, therefore a comparison cannot be made between the September 2014 and September 2015 quarters.
Note: Figures shown in the table are rounded to one decimal place. The actual and % changes in figures between the September 2014 and September 2015 quarters are calculated using actual numbers that contain more than one decimal place, and therefore the change figures presented above may be slightly different to those calculated using the rounded figures in the table.
Table 40 – NEAT percentage of emergency department attendances with LOE greater than twelve hours*
AreaDecember
2013 QuarterMarch
2014 QuarterJune
2014 QuarterSeptember
2014 QuarterDecember
2014 QuarterMarch
2015 QuarterJune
2015 QuarterSeptember
2015 Quarter
% change Sep'14 to Sep'15
Quarters
Metropolitan 2.6% 2.4% 2.5% 3.1% 2.1%^ 2.0%^ 1.8%^ 2.4%^ N/A
Country 0.7% 0.8% 0.8% 1.2% 0.9% 0.9% 0.9% 1.0% -17.5%
WA State 2.2% 2.0% 2.1% 2.7% 1.8%^ 1.7%^ 1.6%^ 2.1%^ N/A
Hospital Grouping
Tertiary 2.5% 2.4% 2.2% 3.1% 2.3% 1.8% 1.3% 2.1% -30.3%
Metropolitan General
2.6% 2.3% 2.8% 3.2% 1.9%^ 2.2%^ 2.5%^ 2.8%^ N/A
Rural 0.7% 0.8% 0.8% 1.2% 0.9% 0.9% 0.9% 1.0% -17.5%
* Refer to the Notes section (page v) and the Data Definitions and Business Rules (pages 47 to 68) for information on how to interpret the figures including symbols in this report.
National Emergency Access Target
Previous (Dec ‘13 Qtr – Sep ‘14 Qtr)Current (Dec ‘14 Qtr – Sep ‘15 Qtr)
0.0%
1.0%
2.0%
3.0%
4.0%
5.0%
December Qtr March Qtr June Qtr September Qtr
Per
cent
age
Figure 40: NEAT percentage of emergency department attendances with LOE greater than twelve hours – NEAT hospitals

WA Health Performance Report | July to September 2015 Quarter
43
10.8 NEAT Percentage of Emergency Department Admissions with LOE of Four Hours or LessWhat do these figures show? For the September 2015 quarter, the percentage of emergency department admissions with LOE of four hours or less at tertiary hospitals decreased by 2.5% and at rural hospitals increased by 7.5% compared with the same quarter in the previous year.
Data for the percentage of emergency department admissions with LOE of four hours or less at metropolitan general hospitals is not complete for the September 2015 quarter, therefore a comparison cannot be made between the September 2014 and September 2015 quarters.
Note: Figures shown in the table are rounded to one decimal place. The actual and % changes in figures between the September 2014 and September 2015 quarters are calculated using actual numbers that contain more than one decimal place, and therefore the change figures presented above may be slightly different to those calculated using the rounded figures in the table.
Table 41 – NEAT percentage of emergency department admissions with LOE of four hours or less*
AreaDecember
2013 QuarterMarch
2014 QuarterJune
2014 QuarterSeptember
2014 QuarterDecember
2014 QuarterMarch
2015 QuarterJune
2015 QuarterSeptember
2015 Quarter
% change Sep'14 to Sep'15
Quarters
Metropolitan 54.9% 56.5% 59.4% 50.3% 57.1%^ 55.1%^ 55.4%^ 49.7%^ N/A
Country 53.7% 54.9% 58.4% 53.2% 57.8% 58.8% 58.9% 57.1% 7.5%
WA State 54.7% 56.3% 59.3% 50.7% 57.2%^ 55.6%^ 55.9%^ 50.9%^ N/A
Hospital Grouping
Tertiary 61.8% 62.2% 68.5% 57.8% 63.0% 60.7% 62.1% 56.4% -2.5%
Metropolitan General
43.3% 47.0% 44.2% 38.1% 46.0%^ 44.9%^ 42.8%^ 36.8%^ N/A
Rural 53.7% 54.9% 58.4% 53.2% 57.8% 58.8% 58.9% 57.1% 7.5%
* Refer to the Notes section (page v) and the Data Definitions and Business Rules (pages 47 to 68) for information on how to interpret the figures including symbols in this report.
National Emergency Access Target
Previous (Dec ‘13 Qtr – Sep ‘14 Qtr)Current (Dec ‘14 Qtr – Sep ‘15 Qtr)
20.0%
30.0%
40.0%
50.0%
60.0%
70.0%
December Qtr March Qtr June Qtr September Qtr
Per
cent
age
Figure 41: NEAT percentage of emergency department admissions with LOE of four hours or less – NEAT hospitals

WA Health Performance Report | July to September 2015 Quarter
44
10.9 NEAT Percentage of Emergency Department Transfers with LOE of Four Hours or LessWhat do these figures show? For the September 2015 quarter, the percentage of emergency department transfers with LOE of four hours or less at tertiary hospitals decreased by 23.7% and at rural hospitals decreased by 5.2% compared with the same quarter in the previous year.
Data for the percentage of emergency department transfers with LOE of four hours or less at metropolitan general hospitals is not complete for the September 2015 quarter, therefore a comparison cannot be made between the September 2014 and September 2015 quarters.
Note: Figures shown in the table are rounded to one decimal place. The actual and % changes in figures between the September 2014 and September 2015 quarters are calculated using actual numbers that contain more than one decimal place, and therefore the change figures presented above may be slightly different to those calculated using the rounded figures in the table.
Table 42 – NEAT percentage of emergency department transfers with LOE of four hours or less*
AreaDecember
2013 QuarterMarch
2014 QuarterJune
2014 QuarterSeptember
2014 QuarterDecember
2014 QuarterMarch
2015 QuarterJune
2015 QuarterSeptember
2015 Quarter
% change Sep'14 to Sep'15
Quarters
Metropolitan 57.2% 57.0% 57.1% 53.4% 54.3%^ 52.4%^ 51.3%^ 45.0%^ N/A
Country 44.9% 39.4% 42.2% 41.3% 43.7% 42.1% 38.4% 39.2% -5.2%
WA State 56.1% 55.4% 55.7% 52.3% 53.1%^ 51.1%^ 49.8%^ 44.4%^ N/A
Hospital Grouping
Tertiary 53.5% 56.1% 59.5% 56.8% 54.9% 53.3% 50.1% 43.3% -23.7%
Metropolitan General
58.5% 57.4% 56.3% 52.2% 54.0%^ 51.9%^ 51.9%^ 45.9%^ N/A
Rural 44.9% 39.4% 42.2% 41.3% 43.7% 42.1% 38.4% 39.2% -5.2%
* Refer to the Notes section (page v) and the Data Definitions and Business Rules (pages 47 to 68) for information on how to interpret the figures including symbols in this report.
National Emergency Access Target
Previous (Dec ‘13 Qtr – Sep ‘14 Qtr)Current (Dec ‘14 Qtr – Sep ‘15 Qtr)
20.0%
30.0%
40.0%
50.0%
60.0%
70.0%
December Qtr March Qtr June Qtr September Qtr
Per
cent
age
Figure 42: NEAT percentage of emergency department transfers with LOE of four hours or less – NEAT hospitals

WA Health Performance Report | July to September 2015 Quarter
45
10.10 NEAT Percentage of Emergency Department Departures with LOE of Four Hours or LessWhat do these figures show? For the September 2015 quarter, the percentage of emergency department departures with LOE of four hours or less at tertiary hospitals decreased by 0.8% and at rural hospitals decreased by 0.9% compared with the same quarter in the previous year.
Data for the percentage of emergency department departures with LOE of four hours or less at metropolitan general hospitals is not complete for the September 2015 quarter, therefore a comparison cannot be made between the September 2014 and September 2015 quarters.
Note: Figures shown in the table are rounded to one decimal place. The actual and % changes in figures between the September 2014 and September 2015 quarters are calculated using actual numbers that contain more than one decimal place, and therefore the change figures presented above may be slightly different to those calculated using the rounded figures in the table.
Table 43 – NEAT percentage of emergency department departures with LOE of four hours or less*
AreaDecember
2013 QuarterMarch
2014 QuarterJune
2014 QuarterSeptember
2014 QuarterDecember
2014 QuarterMarch
2015 QuarterJune
2015 QuarterSeptember
2015 Quarter
% change Sep'14 to Sep'15
Quarters
Metropolitan 88.0% 88.2% 89.2% 86.2% 87.9%^ 87.3%^ 88.7%^ 85.5%^ N/A
Country 91.6% 91.5% 93.4% 92.7% 92.9% 92.1% 92.3% 91.8% -0.9%
WA State 88.9% 89.1% 90.3% 87.9% 89.3%^ 88.6%^ 89.7%^ 87.2%^ N/A
Hospital Grouping
Tertiary 92.1% 91.9% 93.2% 90.6% 91.6% 90.2% 91.8% 89.8% -0.8%
Metropolitan General
84.7% 85.3% 86.0% 82.7% 84.5%^ 84.4%^ 85.3%^ 81.0%^ N/A
Rural 91.6% 91.5% 93.4% 92.7% 92.9% 92.1% 92.3% 91.8% -0.9%
* Refer to the Notes section (page v) and the Data Definitions and Business Rules (pages 47 to 68) for information on how to interpret the figures including symbols in this report.
National Emergency Access Target
Previous (Dec ‘13 Qtr – Sep ‘14 Qtr)Current (Dec ‘14 Qtr – Sep ‘15 Qtr)
80.0%
82.0%
84.0%
86.0%
88.0%
90.0%
92.0%
94.0%
December Qtr March Qtr June Qtr September Qtr
Per
cent
age
Figure 43: NEAT percentage of emergency department departures with LOE of four hours or less – NEAT hospitals
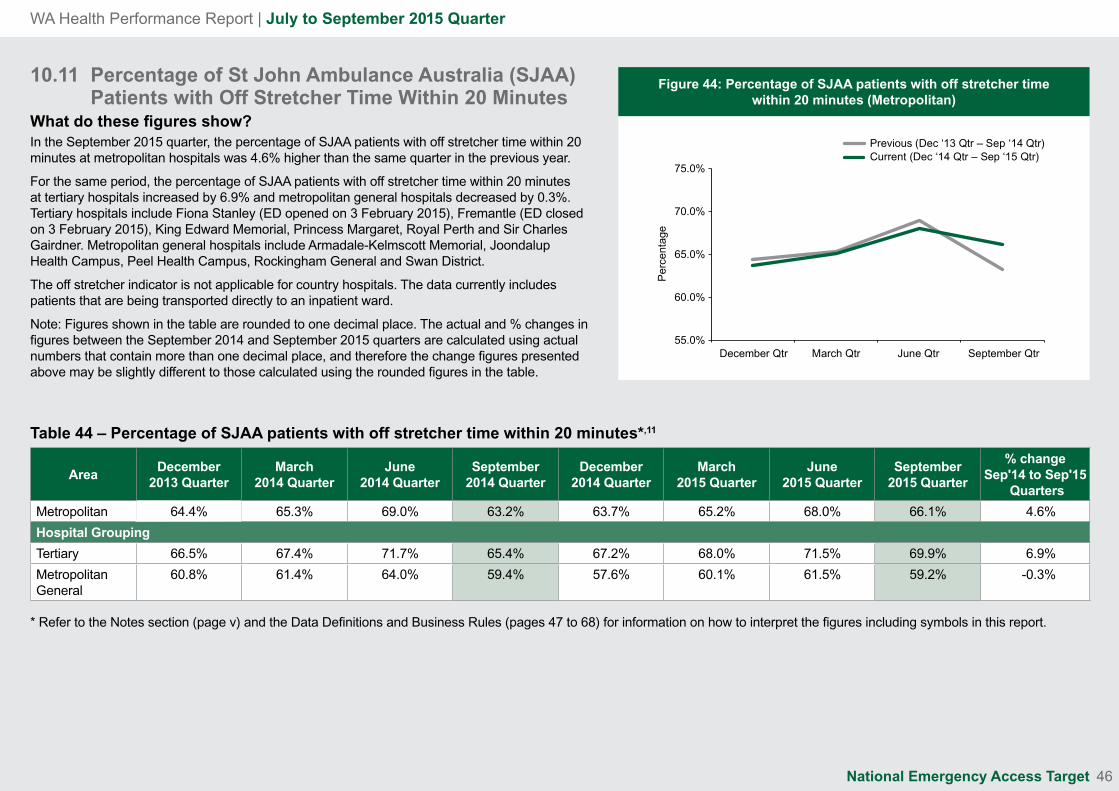
WA Health Performance Report | July to September 2015 Quarter
46
10.11 Percentage of St John Ambulance Australia (SJAA) Patients with Off Stretcher Time Within 20 MinutesWhat do these figures show?In the September 2015 quarter, the percentage of SJAA patients with off stretcher time within 20 minutes at metropolitan hospitals was 4.6% higher than the same quarter in the previous year.
For the same period, the percentage of SJAA patients with off stretcher time within 20 minutes at tertiary hospitals increased by 6.9% and metropolitan general hospitals decreased by 0.3%. Tertiary hospitals include Fiona Stanley (ED opened on 3 February 2015), Fremantle (ED closed on 3 February 2015), King Edward Memorial, Princess Margaret, Royal Perth and Sir Charles Gairdner. Metropolitan general hospitals include Armadale-Kelmscott Memorial, Joondalup Health Campus, Peel Health Campus, Rockingham General and Swan District.
The off stretcher indicator is not applicable for country hospitals. The data currently includes patients that are being transported directly to an inpatient ward.
Note: Figures shown in the table are rounded to one decimal place. The actual and % changes in figures between the September 2014 and September 2015 quarters are calculated using actual numbers that contain more than one decimal place, and therefore the change figures presented above may be slightly different to those calculated using the rounded figures in the table.
Table 44 – Percentage of SJAA patients with off stretcher time within 20 minutes*,11
AreaDecember
2013 QuarterMarch
2014 QuarterJune
2014 QuarterSeptember
2014 QuarterDecember
2014 QuarterMarch
2015 QuarterJune
2015 QuarterSeptember
2015 Quarter
% change Sep'14 to Sep'15
Quarters
Metropolitan 64.4% 65.3% 69.0% 63.2% 63.7% 65.2% 68.0% 66.1% 4.6%
Hospital Grouping
Tertiary 66.5% 67.4% 71.7% 65.4% 67.2% 68.0% 71.5% 69.9% 6.9%
Metropolitan General
60.8% 61.4% 64.0% 59.4% 57.6% 60.1% 61.5% 59.2% -0.3%
* Refer to the Notes section (page v) and the Data Definitions and Business Rules (pages 47 to 68) for information on how to interpret the figures including symbols in this report.
National Emergency Access Target
Previous (Dec ‘13 Qtr – Sep ‘14 Qtr)Current (Dec ‘14 Qtr – Sep ‘15 Qtr)
55.0%
60.0%
65.0%
70.0%
75.0%
December Qtr March Qtr June Qtr September Qtr
Per
cent
age
Figure 44: Percentage of SJAA patients with off stretcher time within 20 minutes (Metropolitan)
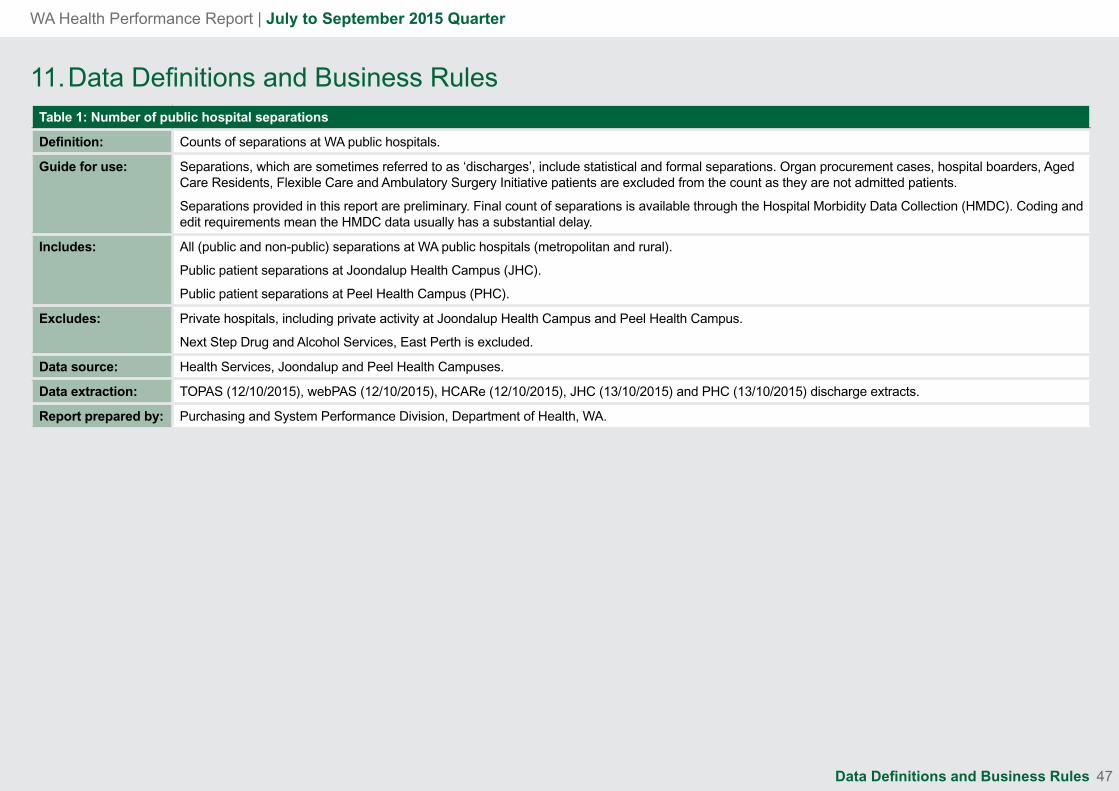
WA Health Performance Report | July to September 2015 Quarter
47
11. Data Definitions and Business RulesTable 1: Number of public hospital separations
Definition: Counts of separations at WA public hospitals.
Guide for use: Separations, which are sometimes referred to as ‘discharges’, include statistical and formal separations. Organ procurement cases, hospital boarders, Aged Care Residents, Flexible Care and Ambulatory Surgery Initiative patients are excluded from the count as they are not admitted patients.
Separations provided in this report are preliminary. Final count of separations is available through the Hospital Morbidity Data Collection (HMDC). Coding and edit requirements mean the HMDC data usually has a substantial delay.
Includes: All (public and non-public) separations at WA public hospitals (metropolitan and rural).
Public patient separations at Joondalup Health Campus (JHC).
Public patient separations at Peel Health Campus (PHC).
Excludes: Private hospitals, including private activity at Joondalup Health Campus and Peel Health Campus.
Next Step Drug and Alcohol Services, East Perth is excluded.
Data source: Health Services, Joondalup and Peel Health Campuses.
Data extraction: TOPAS (12/10/2015), webPAS (12/10/2015), HCARe (12/10/2015), JHC (13/10/2015) and PHC (13/10/2015) discharge extracts.
Report prepared by: Purchasing and System Performance Division, Department of Health, WA.
Data Definitions and Business Rules

WA Health Performance Report | July to September 2015 Quarter
48
Table 2: Public hospital acute separations
Definition: Counts of acute separations at WA public hospitals.
Guide for use: Total acute separations include medical, surgical, obstetric, dialysis, mental health and qualified newborn separations, excluding boarders, organ procurement cases, psychogeriatric patients and unqualified newborns.
Separations, which are sometimes referred to as ‘discharges’, include statistical and formal separations. Organ procurement cases, hospital boarders, Aged Care Residents, Flexible Care and Ambulatory Surgery Initiative patients are excluded from the count as they are not admitted patients.
Separations provided in this report are preliminary. Final count of separations is available through the Hospital Morbidity Data Collection (HMDC). Coding and edit requirements mean the HMDC data usually has a substantial delay.
Includes: All (public and non-public) separations at WA public hospitals (metropolitan and rural).
Public patient separations at Joondalup Health Campus.
Public patient separations at Peel Health Campus.
Excludes: Private hospitals, including private activity at Joondalup Health Campus and Peel Health Campus.
Next Step Drug and Alcohol Services, East Perth is excluded.
Data source: Health Services, Joondalup and Peel Health Campuses.
Data extraction: TOPAS (12/10/2015), webPAS (12/10/2015), HCARe (12/10/2015), JHC (13/10/2015) and PHC (13/10/2015) discharge extracts.
Report prepared by: Purchasing and System Performance Division, Department of Health, WA.
Data Definitions and Business Rules

WA Health Performance Report | July to September 2015 Quarter
49
Table 3: Public hospital elective acute separations
Definition: Counts of elective acute separations at WA public hospitals.
Guide for use: Total elective acute separations are counts of acute separations from elective wait list and elective non-wait list admissions.
Separations, which are sometimes referred to as ‘discharges’, include statistical and formal separations. Organ procurement cases, hospital boarders, Aged Care Residents, Flexible Care and Ambulatory Surgery Initiative patients are excluded from the count as they are not admitted patients.
Separations provided in this report are preliminary. Final count of separations is available through the Hospital Morbidity Data Collection (HMDC). Coding and edit requirements mean the HMDC data usually has a substantial delay.
Includes: All (public and non-public) separations at WA public hospitals (metropolitan and rural).
Public patient separations at Joondalup Health Campus.
Public patient separations at Peel Health Campus.
Excludes: Private hospitals, including private activity at Joondalup Health Campus and Peel Health Campus.
Next Step Drug and Alcohol Services, East Perth is excluded.
Data source: Health Services, Joondalup and Peel Health Campuses.
Data extraction: TOPAS (12/10/2015), webPAS (12/10/2015), HCARe (12/10/2015), JHC (13/10/2015) and PHC (13/10/2015) discharge extracts.
Report prepared by: Purchasing and System Performance Division, Department of Health, WA.
Data Definitions and Business Rules

WA Health Performance Report | July to September 2015 Quarter
50
Table 4: Public hospital acute medical separations
Definition: Counts of acute medical separations at WA public hospitals.
Guide for use: Total acute medical separations are counts of emergency and elective separations from medical specialty on discharge, excluding boarders, organ procurement cases, psychogeriatric patients and unqualified newborns.
Separations, which are sometimes referred to as ‘discharges’, include statistical and formal separations. Organ procurement cases, hospital boarders, Aged Care Residents, Flexible Care and Ambulatory Surgery Initiative patients are excluded from the count as they are not admitted patients.
Separations provided in this report are preliminary. Final count of separations is available through the Hospital Morbidity Data Collection (HMDC). Coding and edit requirements mean the HMDC data usually has a substantial delay.
Includes: All (public and non-public) separations at WA public hospitals (metropolitan and rural).
Public patient separations at Joondalup Health Campus.
Public patient separations at Peel Health Campus.
Excludes: Private hospitals, including private activity at Joondalup Health Campus and Peel Health Campus.
Next Step Drug and Alcohol Services, East Perth is excluded.
Data source: Health Services, Joondalup and Peel Health Campuses.
Data extraction: TOPAS (12/10/2015), webPAS (12/10/2015), HCARe (12/10/2015), JHC (13/10/2015) and PHC (13/10/2015) discharge extracts.
Report prepared by: Purchasing and System Performance Division, Department of Health, WA.
Data Definitions and Business Rules

WA Health Performance Report | July to September 2015 Quarter
51
Table 5: Public hospital acute surgical separations
Definition: Counts of acute surgical separations at WA public hospitals.
Guide for use: Total acute surgical separations are counts of emergency and elective separations from surgical specialty on discharge, excluding boarders, organ procurement cases, psychogeriatric patients and unqualified newborns.
Separations, which are sometimes referred to as ‘discharges’, include statistical and formal separations. Organ procurement cases, hospital boarders, Aged Care Residents, Flexible Care and Ambulatory Surgery Initiative patients are excluded from the count as they are not admitted patients.
Separations provided in this report are preliminary. Final count of separations is available through the Hospital Morbidity Data Collection (HMDC). Coding and edit requirements mean the HMDC data usually has a substantial delay.
Includes: All (public and non-public) separations at WA public hospitals (metropolitan and rural).
Public patient separations at Joondalup Health Campus.
Public patient separations at Peel Health Campus.
Excludes: Private hospitals, including private activity at Joondalup Health Campus and Peel Health Campus.
Next Step Drug and Alcohol Services, East Perth is excluded.
Data source: Health Services, Joondalup and Peel Health Campuses.
Data extraction: TOPAS (12/10/2015), webPAS (12/10/2015), HCARe (12/10/2015), JHC (13/10/2015) and PHC (13/10/2015) discharge extracts.
Report prepared by: Purchasing and System Performance Division, Department of Health, WA.
Table 6: Number of renal dialysis separations
Definition: Counts of admitted renal dialysis patient separations.
Guide for use: Total renal dialysis separations are counts of either statistical and formal separations of all cases (elective and emergency) from Renal Dialysis specialty. Excludes boarders, organ procurement cases and newborns.
Separations provided in this report are preliminary. A final count of separations is available through the HMDC. Coding and edit requirements mean the HMDC data usually has a delay.
Includes: All renal dialysis separations at WA public Hospitals (metropolitan and rural).
Public patient separations at Joondalup and Peel Health Campuses and non-government organisations.
Excludes: Data excludes private hospitals not contracted for public renal dialysis separations.
Data source: Health Services, Joondalup and Peel Health Campuses and contracted non-government organisations.
Data extraction: TOPAS (12/10/2015), webPAS (12/10/2015), HCARe (12/10/2015), JHC (13/10/2015) and PHC (13/10/2015) discharge extracts. HMDS 09/10/2015), Country NGOs' data received on 13/10/2015.
Report prepared by: Purchasing and System Performance Division, Department of Health, WA.
Data Definitions and Business Rules

WA Health Performance Report | July to September 2015 Quarter
52
Table 7: Public hospital overall acute (same-day and overnight) average length of stay (in days)
Definition: Average length of stay, in days, of acute (same-day and overnight) separations from WA Public Hospitals.
Guide for use: The length of stay for an overnight patient is calculated by subtracting admission date from separation date and deducting any days a patient is on leave (if any) during the episode of care. A same-day patient has a length of stay of 1 day.
For a particular month the calculation is the number of days of hospital stay (regardless of whether all bed-days fall within the month) for all acute separations during the quarter divided by the number of acute separations during the quarter.
Includes: All (public and non-public) separations at WA public hospitals (metropolitan and rural).
Public patient separations at Joondalup Health Campus.
Public patient separations at Peel Health Campus.
Excludes: Private hospitals, including private activity at Joondalup Health Campus and Peel Health Campus.
Next Step Drug and Alcohol Services, East Perth is excluded.
Data source: Health Services, Joondalup & Peel Health Campuses.
Data extraction: TOPAS (12/10/2015), webPAS (12/10/2015), HCARe (12/10/2015), JHC (13/10/2015) and PHC (13/10/2015) discharge extracts.
Report prepared by: Purchasing and System Performance Division, Department of Health, WA.
Table 8: Number of public hospital newborns
Definition: Counts of newborn separations at WA public hospitals.
Guide for use: Separations provided in this report are preliminary. Final count of separations is available through the Hospital Morbidity Data Collection (HMDC). Coding and edit requirements mean the HMDC data usually has a substantial delay.
Includes: All newborn separations at WA public hospitals (metropolitan and rural).
Newborn public patient separations at Joondalup Health Campus.
Newborn public patient separations at Peel Health Campus.
Total newborns are counts of either statistical or formal separations of all newborn care cases (qualified and unqualified). Qualified newborns are those who turn 10 days of age or require clinical care until discharged. Unqualified newborns are those who turn 10 days of age, do not require clinical care and are statistically discharged before being statistically readmitted as boarders.
Excludes: Private hospitals, including private activity at Joondalup Health Campus and Peel Health Campus.
Data source: Health Services, Joondalup and Peel Health Campuses.
Data extraction: TOPAS (12/10/2015), webPAS (12/10/2015), HCARe (12/10/2015), JHC (13/10/2015) and PHC (13/10/2015) discharge extracts.
Report prepared by: Purchasing and System Performance Division, Department of Health, WA.
Data Definitions and Business Rules

WA Health Performance Report | July to September 2015 Quarter
53
Table 9: Average number of available active same-day beds/chairs
Definition: Average number of available active same-day beds/chairs for a weekday (Monday-Friday) for the last month of the quarter.
Guide for use: Average number of available active same-day beds/chairs is the sum of available active same-day beds/chairs on each weekday of the last month of the quarter divided by the total number of weekdays during the month. Available active same-day beds/chairs are counts of dedicated beds/chairs into which patients are or can be admitted for day procedures. Such beds/chairs are fully equipped and able to be staffed within the funds available to the Health Service for the financial year. Includes renal dialysis beds/chairs. Available active includes all same-day beds/chairs that are immediately available for use.
Includes: All metropolitan public hospitals.
Excludes: Private hospitals, including Joondalup Health Campus and Peel Health Campus.
Next Step Drug and Alcohol Services, East Perth is excluded.
Data source: BedState Reporting System, Purchasing and System Performance Division.
Data extraction: Metro: BedState (05/10/2015).
Report prepared by: Purchasing and System Performance Division, Department of Health, WA.
Table 10: Average number of available active overnight beds
Definition: Average number of available active overnight beds for the last month of the quarter.
Guide for use: Average number of available active overnight beds is the sum of available active overnight beds on each day of the last month of the quarter divided by the total number of days during the month. Available active overnight beds are counts of overnight type beds into which patients are or can be admitted. Such beds are fully equipped and able to be staffed within the funds available to the Health Service for the financial year. Overnight beds is an average bed count for the last month of the quarter. Available active includes all overnight beds that are immediately available for use.
Includes: All metropolitan public hospitals.
Excludes: Private hospitals, including Joondalup Health Campus and Peel Health Campus.
Next Step Drug and Alcohol Services, East Perth is excluded.
Data source: BedState Reporting System, Purchasing and System Performance Division.
Data extraction: Metro: BedState (05/10/2015).
Report prepared by: Purchasing and System Performance Division, Department of Health, WA.
Data Definitions and Business Rules

WA Health Performance Report | July to September 2015 Quarter
54
Table 11: Average occupancy of overnight beds
Definition: Percentage of occupied overnight beds to total available active overnight beds for the last month of the quarter.
Guide for use: Average number of beds occupied by overnight patients at 12 midnight ‘each day’ over the reporting of the last month of the quarter divided by number of average available active (occupied and unoccupied) overnight beds for the month, expressed as a percentage. Available active includes all overnight beds that are immediately available for use.
Includes: All (public and non-public) separations at metropolitan public hospitals.
Excludes: Private hospitals, including public and private activity at Joondalup Health Campus and Peel Health Campus.
Next Step Drug and Alcohol Services, East Perth is excluded.
Data source: BedState Reporting System, Purchasing and System Performance Division.
Data extraction: Metro: BedState (05/10/2015).
Report prepared by: Purchasing and System Performance Division, Department of Health, WA.
Table 12: Number of patients on the elective surgery wait list
Definition: Counts of people from public and privately managed hospitals on the elective surgical wait list.
Guide for use: Total patients on elective surgery wait lists are counted from extracted records on the last day of the quarter.
The Australian Institute of Health and Welfare (AIHW) definitions are used for the patient counting.
Includes: All patients on elective surgical wait lists at WA Public Hospitals (metropolitan and rural).
Public patients on elective surgical wait lists at Joondalup Health Campus.
Public patients on elective surgical wait lists at Peel Health Campus.
Excludes: Private hospitals, Graylands and Selby Authorised Lodge, and Next Step Drug and Alcohol Services, East Perth.
Data source: Health Services/Purchasing and System Performance Division, Department of Health, WA.
Data extraction: Wait List Data Collection (WLDC) (04/10/2015).
Report prepared by: Purchasing and System Performance Division, Department of Health, WA.
Data Definitions and Business Rules

WA Health Performance Report | July to September 2015 Quarter
55
Table 13: Number of admissions from the elective surgery wait list
Definition: Counts of admissions from public and privately managed hospitals from the elective surgical wait list.
Guide for use: Includes all admissions from the elective surgery wait list during each quarter.
The Australian Institute of Health and Welfare (AIHW) definitions are used for the patient counting.
Includes: All admissions from the elective surgical wait lists at WA Public Hospitals (metropolitan and rural).
Public patients on elective surgical wait lists at Joondalup Health Campus.
Public patients on elective surgical wait lists at Peel Health Campus.
Excludes: Private hospitals, Graylands and Selby Authorised Lodge, and Next Step Drug and Alcohol Services, East Perth.
Data source: Health Services/Purchasing and System Performance Division, Department of Health, WA.
Data extraction: WLDC (04/10/2015).
Report prepared by: Purchasing and System Performance Division, Department of Health, WA.
Table 14: Total median waiting time (in months) for patients on the elective surgery wait list
Definition: The median value of waiting times of all patients on the elective surgery wait list.
Guide for use: Total patients on elective surgery waitlists are counted from extracted records on the last day of the quarter (census date). Waiting time (at census date) is the time elapsed (in months) for a patient on the elective surgery wait list from the date that patient was added to the waiting list to a designated census date.
If a patient was assigned with more than 1 clinical urgency category while waiting on a list, the waiting time is calculated for the assigned clinical urgency category at a designated census date.
The Australian Institute of Health and Welfare (AIHW) definitions are used for the patient counting.
Includes: Public Hospitals (metropolitan and rural).
Joondalup Health Campus, public patients.
Peel Health Campus, public patients.
Excludes: Private hospitals, Graylands and Selby Authorised Lodge, and Next Step Drug and Alcohol Services, East Perth.
Data source: Health Services/Purchasing and System Performance Division, Department of Health, WA.
Data extraction: WLDC (04/10/2015).
Report prepared by: Purchasing and System Performance Division, Department of Health, WA.
Data Definitions and Business Rules

WA Health Performance Report | July to September 2015 Quarter
56
Table 15: Total emergency department attendances
Definition: The total number of all public emergency department (ED) attendances.
Guide for use: Includes all episodes where a patient presented at the emergency department and was registered in any manner in one of the electronic data collection systems.
Includes: All eligible (by definition) attendances. Hospitals include Armadale-Kelmscott, Fiona Stanley Hospital (ED opened on 3 February 2015), Fremantle (ED closed on 3 February 2015), Rockingham General, Swan District, Sir Charles Gairdner, Royal Perth, King Edward Memorial, Princess Margaret and country hospitals. Publicly funded activity at Joondalup and Peel Health Campuses is included.
Excludes: Nursing posts and other non-hospital establishments and private hospitals.
Data source: Purchasing and System Performance Division, Department of Health, WA.
Data extraction: EDDC (13/10/2015).
Report prepared by: Purchasing and System Performance Division, Department of Health, WA.
Table 16: Percentage of ED Triage 1 patients seen within the recommended time
Definition: Number of ED Triage 1 patients seen immediately divided by total number of Triage 1 patients. ‘Immediately’ is defined as waiting up to 2 minutes.
Guide for use: This includes people who did not wait for treatment or were referred elsewhere. Data is expressed as a percentage.
Includes: All WA public hospitals (that provide emergency department services) and publicly funded activity at Joondalup Health Campus and Peel Health Campus.
Excludes: Nursing posts and other non-hospital establishments and private hospitals.
Data source: Purchasing and System Performance Division, Department of Health, WA.
Data extraction: EDDC (13/10/2015).
Report prepared by: Purchasing and System Performance Division, Department of Health, WA.
Table 17: Percentage of ED Triage 2 patients seen within the recommended time
Definition: Number of ED Triage 2 patients seen within 10 minutes divided by total number of Triage 2 patients.
Guide for use: This includes people who did not wait for treatment or were referred elsewhere. Data is expressed as a percentage.
Includes: All WA public hospitals (that provide emergency department services) and publicly funded activity at Joondalup Health Campus and Peel Health Campus.
Excludes: Nursing posts and other non-hospital establishments and private hospitals.
Data source: Purchasing and System Performance Division, Department of Health, WA.
Data extraction: EDDC (13/10/2015).
Report prepared by: Purchasing and System Performance Division, Department of Health, WA.
Data Definitions and Business Rules

WA Health Performance Report | July to September 2015 Quarter
57
Table 18: Percentage of ED Triage 3 patients seen within the recommended time
Definition: Number of ED Triage 3 patients seen within 30 minutes divided by total number of Triage 3 patients.
Guide for use: This includes people who did not wait for treatment or were referred elsewhere. Data is expressed as a percentage.
Includes: All WA public hospitals (that provide emergency department services) and publicly funded activity at Joondalup Health Campus and Peel Health Campus.
Excludes: Nursing posts and other non-hospital establishments and private hospitals.
Data source: Purchasing and System Performance Division, Department of Health, WA.
Data extraction: EDDC (13/10/2015).
Report prepared by: Purchasing and System Performance Division, Department of Health, WA.
Table 19: Percentage of ED Triage 4 patients seen within the recommended time
Definition: Number of ED Triage 4 patients seen within 1 hour divided by total number of Triage 4 patients.
Guide for use: This includes people who did not wait for treatment or were referred elsewhere. Data is expressed as a percentage.
Includes: All WA public hospitals (that provide emergency department services) and publicly funded activity at Joondalup Health Campus and Peel Health Campus.
Excludes: Nursing posts and other non-hospital establishments and private hospitals.
Data source: Purchasing and System Performance Division, Department of Health, WA.
Data extraction: EDDC (13/10/2015).
Report prepared by: Purchasing and System Performance Division, Department of Health, WA.
Table 20: Percentage of ED Triage 5 patients seen within the recommended time
Definition: Number of ED Triage 5 patients seen within 2 hours divided by total number of Triage 5 patients.
Guide for use: This includes people who did not wait for treatment or were referred elsewhere. Data is expressed as a percentage.
Includes: All WA public hospitals (that provide emergency department services) and publicly funded activity at Joondalup Health Campus and Peel Health Campus.
Excludes: Nursing posts and other non-hospital establishments and private hospitals.
Data source: Purchasing and System Performance Division, Department of Health, WA.
Data extraction: EDDC (13/10/2015).
Report prepared by: Purchasing and System Performance Division, Department of Health, WA.
Data Definitions and Business Rules

WA Health Performance Report | July to September 2015 Quarter
58
Table 21: Total number of emergency department admissions
Definition: Counts of ED attendances where patients were admitted to hospital inpatient wards.
Guide for use: An admission process is the process whereby the hospital accepts responsibility for the patient’s care and/or treatment.
Includes: All WA public hospitals (that provide emergency department services) and publicly funded activity at Joondalup Health Campus and Peel Health Campus.
Excludes: Nursing posts and other non-hospital establishments and private hospitals.
Data source: Purchasing and System Performance Division, Department of Health, WA.
Data extraction: EDDC (13/10/2015).
Report prepared by: Purchasing and System Performance Division, Department of Health, WA.
Table 22: Number of mental health separations
Definition: Counts of mental health patient separations from WA public hospitals mental health designated units.
Guide for use: Due to the timely requirements of the data, data is sourced from the Inpatient Discharge Extract which do not undergo data quality assurance process. Therefore, data is preliminary and should be interpreted with caution.
Includes: Public Hospitals (metropolitan and rural).
Joondalup Health Campus and St John of God Mt Lawley Hospital, publicly funded activity only.
Excludes: Private hospitals, including private activity at Joondalup Health Campus and St John of God Mt Lawley Hospital. Peel Health Campus is not a designated mental health unit and is excluded from the figures. Next Step Drug and Alcohol Services, East Perth is excluded.
Data source: TOPAS, HCARe, and Joondalup discharge extracts.
Data extraction: Mental Health Data Collection (08/10/2015).
Report prepared by: Purchasing and System Performance Division, Department of Health, WA.
Data Definitions and Business Rules

WA Health Performance Report | July to September 2015 Quarter
59
Table 23: Number of attendances for mental health services at outpatient clinics
Definition: Counts of occasions of service provided by community mental health clinics that deliver mental health care or treatment.
Guide for use: Occasions of service provided in this report are preliminary. Includes all mental health outpatient occasions of service (single and group therapy consultations).
Includes: WA public community mental health service sites (rural and metropolitan).
Excludes: Private hospitals, including private activity at Joondalup Health Campus. Peel and Joondalup Health Campuses do not undertake mental health outpatient services for public patients. Next Step Drug and Alcohol Services, East Perth is excluded.
Data source: Mental Health Information System (MHIS), Department of Health, WA.
Data extraction: Mental Health Data Collection (08/10/2015).
Report prepared by: Purchasing and System Performance Division, Department of Health, WA.
Table 24: Number of Ambulatory Surgery Initiative (ASI) cases
Definition: Ambulatory Surgery Initiative (ASI) cases are counts of patients treated under the auspices of the Ambulatory Surgery Initiative.
Guide for use: One case may have multiple procedures.
Includes: All hospitals that treated patients under the ASI program during the reporting periods are presented, i.e., Albany Hospital, Armadale-Kelmscott Hospital, Osborne Park Hospital, Bentley Hospital, Swan District Hospital, Kaleeya Hospital, Broome Hospital and Rockingham General Hospital.
Excludes: Hospitals not currently implementing the ASI program.
Data source: WLDC.
Data extraction: 02/10/2015.
Report prepared by: Purchasing and System Performance Division, Department of Health, WA.
Table 25: Number of visits to dental clinics
Definition: Number of client visits at WA public dental health clinics.
Includes: Public dental clinics (metropolitan and rural).
Excludes: Private dental clinics.
Data source: Dental Health Services.
Data extraction: 02/10/2015.
Report prepared by: Purchasing and System Performance Division, Department of Health, WA.
Data Definitions and Business Rules

WA Health Performance Report | July to September 2015 Quarter
60
Table 26: Number of patients waiting for dental services
Definition: Number of patients on public dental health wait list.
Guide for use: Total patients waiting for dental clinic services are counted from extracted records as at the last day of the quarter.
Includes: Public dental clinics (metropolitan and rural).
Excludes: Private dental clinics.
Data source: Dental Health Services.
Data extraction: 02/10/2015.
Report prepared by: Purchasing and System Performance Division, Department of Health, WA.
Table 27: Number of clients treated at the General Practitioner (GP) After Hours clinics
Definition: Number of clients treated at GP After Hours clinics.
Includes: Joondalup Health Campus, Royal Perth Hospital, Fremantle Hospital, Swan District Hospital and Rockingham-Kwinana Hospital.
Excludes: Clinics not funded by Department of Health, WA.
Data source: GP After Hours clinics Activity Statistics.
Data extraction: 08/10/2015.
Report prepared by: Purchasing and System Performance Division, Department of Health, WA.
Table 28: Percentage of Category 1 cases treated (admitted) within the clinically recommended time
Definition: The proportion of all elective surgery Category 1 wait list cases where treatment (admission) was within the clinically recommended time of 30 days.
Guide for use: Includes all admissions, including emergency admissions, from the elective surgery wait list during each quarter.
The Australian Institute of Health and Welfare (AIHW) definitions are used for the patient counting.
Includes: All admissions from the elective surgical wait lists at WA Public Hospitals (metropolitan and rural).
Public patients on elective surgical wait lists at Joondalup Health Campus.
Public patients on elective surgical wait lists at Peel Health Campus.
Excludes: Private hospitals, Graylands and Selby Authorised Lodge, and Next Step Drug and Alcohol Services, East Perth.
Data source: Health Services/Purchasing and System Performance Division, Department of Health, WA.
Data extraction: WLDC (04/10/2015).
Report prepared by: Purchasing and System Performance Division, Department of Health, WA.
Data Definitions and Business Rules

WA Health Performance Report | July to September 2015 Quarter
61
Table 29: Percentage of Category 2 cases treated (admitted) within the clinically recommended time
Definition: The proportion of all elective surgery Category 2 wait list cases where treatment (admission) was within the clinically recommended time of 90 days.
Guide for use: Includes all admissions, including emergency admissions, from the elective surgery wait list during each quarter.
The Australian Institute of Health and Welfare (AIHW) definitions are used for the patient counting.
Includes: Admissions from the elective surgical wait lists at WA Public Hospitals (metropolitan and rural).
Public patients on elective surgical wait lists at Joondalup Health Campus.
Public patients on elective surgical wait lists at Peel Health Campus.
Excludes: Private hospitals, Graylands and Selby Authorised Lodge, and Next Step Drug and Alcohol Services, East Perth.
Data source: Health Services/Purchasing and System Performance Division, Department of Health, WA.
Data extraction: WLDC (04/10/2015).
Report prepared by: Purchasing and System Performance Division, Department of Health, WA.
Table 30: Percentage of Category 3 cases treated (admitted) within the clinically recommended time
Definition: The proportion of all elective surgery Category 3 wait list cases where treatment (admission) was within the clinically recommended time of 365 days.
Guide for use: Includes all admissions, including emergency admissions, from the elective surgery wait list during each quarter.
The Australian Institute of Health and Welfare (AIHW) definitions are used for the patient counting.
Includes: Admissions from the elective surgical wait lists at WA Public Hospitals (metropolitan and rural).
Public patients on elective surgical wait lists at Joondalup Health Campus.
Public patients on elective surgical wait lists at Peel Health Campus.
Excludes: Private hospitals, Graylands and Selby Authorised Lodge, and Next Step Drug and Alcohol Services, East Perth.
Data source: Health Services/Purchasing and System Performance Division, Department of Health, WA.
Data extraction: WLDC (04/10/2015).
Report prepared by: Purchasing and System Performance Division, Department of Health, WA.
Data Definitions and Business Rules

WA Health Performance Report | July to September 2015 Quarter
62
Table 31: Average overdue wait time (days) for Category 1 cases that have waited beyond the clinically recommended time
Definition: The average overdue wait time (days) for Category 1 cases that have waited over the clinically recommended time of 30 days.
Guide for use: Total patients on elective surgery wait lists are counted from extracted records on the last day of the quarter.
The Australian Institute of Health and Welfare (AIHW) definitions are used for the patient counting.
Includes: Patients on elective surgical wait lists at WA Public Hospitals (metropolitan and rural).
Public patients on elective surgical wait lists at Joondalup Health Campus.
Public patients on elective surgical wait lists at Peel Health Campus.
Excludes: Private hospitals, Graylands and Selby Authorised Lodge, and Next Step Drug and Alcohol Services, East Perth.
Data source: Health Services/Purchasing and System Performance Division, Department of Health, WA.
Data extraction: WLDC (04/10/2015).
Report prepared by: Purchasing and System Performance Division, Department of Health, WA.
Table 32: Average overdue wait time (days) for Category 2 cases that have waited beyond the clinically recommended time
Definition: The average overdue wait time (days) for Category 2 cases that have waited over the clinically recommended time of 90 days.
Guide for use: Total patients on elective surgery wait lists are counted from extracted records on the last day of the quarter.
The Australian Institute of Health and Welfare (AIHW) definitions are used for the patient counting.
Includes: Patients on elective surgical wait lists at WA Public Hospitals (metropolitan and rural).
Public patients on elective surgical wait lists at Joondalup Health Campus.
Public patients on elective surgical wait lists at Peel Health Campus.
Excludes: Private hospitals, Graylands and Selby Authorised Lodge, and Next Step Drug and Alcohol Services, East Perth.
Data source: Health Services/Purchasing and System Performance Division, Department of Health, WA.
Data extraction: WLDC (04/10/2015).
Report prepared by: Purchasing and System Performance Division, Department of Health, WA.
Data Definitions and Business Rules

WA Health Performance Report | July to September 2015 Quarter
63
Table 33: Average overdue wait time (days) for Category 3 cases that have waited beyond the clinically recommended time
Definition: The average overdue wait time (days) for Category 3 cases that have waited over the clinically recommended time of 365 days.
Guide for use: Total patients on elective surgery wait lists are counted from extracted records on the last day of the quarter.
The Australian Institute of Health and Welfare (AIHW) definitions are used for the patient counting.
Includes: Patients on elective surgical wait lists at WA Public Hospitals (metropolitan and rural).
Public patients on elective surgical wait lists at Joondalup Health Campus.
Public patients on elective surgical wait lists at Peel Health Campus.
Excludes: Private hospitals, Graylands and Selby Authorised Lodge, and Next Step Drug and Alcohol Services, East Perth.
Data source: Health Services/Purchasing and System Performance Division, Department of Health, WA.
Data extraction: WLDC (04/10/2015).
Report prepared by: Purchasing and System Performance Division, Department of Health, WA.
Table 34: NEAT total emergency department attendances
Definition: The total number of all public emergency department (ED) attendances.
Guide for use: Includes all episodes where a patient presented at the emergency department and was registered in any manner in one of the electronic data collection systems.
Includes: All participating National Emergency Access Target hospitals. Refer to page 35.
Excludes: All other public and private hospitals.
Data source: Purchasing and System Performance Division, Department of Health, WA.
Data extraction: EDDC (13/10/2015).
Report prepared by: Purchasing and System Performance Division, Department of Health, WA.
Data Definitions and Business Rules

WA Health Performance Report | July to September 2015 Quarter
64
Table 35: NEAT total admissions from emergency department
Definition: Counts of emergency department attendances where patients were admitted to a hospital ward.
Guide for use: An admission process is the process whereby the hospital accepts responsibility for the patient’s care and/or treatment.
Includes: All participating National Emergency Access Target hospitals. Refer to page 35.
Excludes: All other public and private hospitals.
Data source: Purchasing and System Performance Division, Department of Health, WA.
Data extraction: EDDC (13/10/2015).
Report prepared by: Purchasing and System Performance Division, Department of Health, WA.
Table 36: NEAT percentage of total emergency department attendances admitted
Definition: The proportion of all emergency department attendances where patients were admitted to a hospital ward.
Guide for use: Data is expressed as a percentage.
Includes: All participating National Emergency Access Target hospitals. Refer to page 35.
Excludes: All other public and private hospitals.
Data source: Purchasing and System Performance Division, Department of Health, WA.
Data extraction: EDDC (13/10/2015).
Report prepared by: Purchasing and System Performance Division, Department of Health, WA.
Table 37: NEAT total mental health emergency department admissions
Definition: Counts of mental health emergency department attendances where patients were admitted to a hospital ward.
Guide for use: An admission process is the process whereby the hospital accepts responsibility for the patient’s care and/or treatment.
Includes: All participating National Emergency Access Target hospitals excluding Peel Health Campus. Refer to page 35.
Excludes: Peel Health Campus and all other public and private hospitals.
Data source: Purchasing and System Performance Division, Department of Health, WA.
Data extraction: EDDC (13/10/2015).
Report prepared by: Purchasing and System Performance Division, Department of Health, WA.
Data Definitions and Business Rules

WA Health Performance Report | July to September 2015 Quarter
65
Table 38: NEAT percentage of total emergency department attendances transferred to another hospital
Definition: The proportion of all emergency department attendances where patients were transferred from the emergency department to another hospital for care.
Guide for use: Data is expressed as a percentage.
Includes: All participating National Emergency Access Target hospitals. Refer to page 35.
Excludes: All other public and private hospitals.
Data source: Purchasing and System Performance Division, Department of Health, WA.
Data extraction: EDDC (13/10/2015).
Report prepared by: Purchasing and System Performance Division, Department of Health, WA.
Table 39: NEAT percentage of emergency department attendances with LOE of four hours or less
Definition: The proportion of all emergency department attendances where the time to admit, transfer or discharge the patient from the emergency department was within four hours of their presentation.
Guide for use: Excludes patients that had an invalid presentation or departure time. Data is expressed as a percentage.
Includes all valid attendances.
Length of episode is counted from the time the patient presents to a staff member (nurse, clerk, etc.) to the time the patient leaves the emergency department or is admitted to the Short Stay Unit.
Includes: All participating National Emergency Access Target hospitals. Refer to page 35.
Excludes: All other public and private hospitals.
Data source: Purchasing and System Performance Division, Department of Health, WA.
Data extraction: EDDC (13/10/2015).
Report prepared by: Purchasing and System Performance Division, Department of Health, WA.
Data Definitions and Business Rules

WA Health Performance Report | July to September 2015 Quarter
66
Table 40: NEAT percentage of emergency department attendances with LOE greater than twelve hours
Definition: The proportion of all emergency department attendances where the time to admit, transfer or discharge the patient from the Emergency Department was greater than 12 hours from their time of arrival.
Guide for use: Excludes patients that had an invalid presentation or departure time. Data is expressed as a percentage.
Includes all valid attendances.
Length of episode is counted from the time the patient presents to a staff member (nurse, clerk, etc.) to the time the patient leaves the emergency department or is admitted to the Short Stay Unit.
Includes: All participating National Emergency Access Target hospitals. Refer to page 35.
Excludes: All other public and private hospitals.
Data source: Purchasing and System Performance Division, Department of Health, WA.
Data extraction: EDDC (13/10/2015).
Report prepared by: Purchasing and System Performance Division, Department of Health, WA.
Table 41: NEAT percentage of emergency department admissions with LOE of four hours or less
Definition: The proportion of all admissions from the emergency department where the time to admit the patient to a ward was within four hours of their presentation.
Guide for use: An admission process is the process whereby the hospital accepts responsibility for the patient’s care and/or treatment.
Excludes patients that had an invalid presentation or departure time. Data is expressed as a percentage.
Includes all attendances that were admitted, that is, have an admission date recorded.
Length of episode is counted from the time the patient presents to a staff member (nurse, clerk, etc.) to the time the patient leaves the emergency department or is admitted to the Short Stay Unit.
Includes: All participating National Emergency Access Target hospitals. Refer to page 35.
Excludes: All other public and private hospitals.
Data source: Purchasing and System Performance Division, Department of Health, WA.
Data extraction: EDDC (13/10/2015).
Report prepared by: Purchasing and System Performance Division, Department of Health, WA.
Data Definitions and Business Rules

WA Health Performance Report | July to September 2015 Quarter
67
Table 42: NEAT percentage of emergency department transfers with LOE of four hours or less
Definition: The proportion of all emergency department transfers where the time to transfer the patient to another hospital was within four hours of their presentation.
Guide for use: Excludes records with an invalid presentation or departure time.
Data is expressed as a percentage.
Includes all attendances that were transferred to another hospital on ED departure.
Length of episode is counted from the time the patient presents to a staff member (nurse, clerk, etc.) to the time the patient leaves the emergency department or is admitted to the Short Stay Unit.
Includes: All participating National Emergency Access Target hospitals. Refer to page 35.
Excludes: All other public and private hospitals.
Data source: Purchasing and System Performance Division, Department of Health, WA.
Data extraction: EDDC (13/10/2015).
Report prepared by: Purchasing and System Performance Division, Department of Health, WA.
Table 43: NEAT percentage of emergency department departures with LOE of four hours or less
Definition: The proportion of non-admitted emergency department departures where the time to discharge the patient was within four hours of their presentation.
Guide for use: Excludes records with an invalid presentation or departure time. Data is expressed as a percentage.
Includes all attendances that were admitted and then transferred to another hospital on ED departure.
Length of episode is counted from the time the patient presents to a staff member (nurse, clerk, etc.) to the time the patient leaves the emergency department or is admitted to the Short Stay Unit.
Includes: All participating National Emergency Access Target hospitals. Refer to page 35.
Excludes: All other public and private hospitals.
Data source: Purchasing and System Performance Division, Department of Health, WA.
Data extraction: EDDC (13/10/2015).
Report prepared by: Purchasing and System Performance Division, Department of Health, WA.
Data Definitions and Business Rules

WA Health Performance Report | July to September 2015 Quarter
68
Table 44: Percentage of SJAA patients with off stretcher time within 20 minutes – Metropolitan Hospitals
Definition: The proportion of patients in SJAA ambulance's records where off stretcher time is within 20 minutes.
Guide for use: Off Stretcher time is the duration from the arrival of the ambulance at the receiving hospital’s Emergency Department (ED) to the transfer of the patient from the care of St John Ambulance Australia (SJAA) crew to the care of the ED staff.
Includes all SJAA patients that have valid off stretcher time.
Excludes records with an invalid date and time that SJAA crew arrives at the destination hospital, completes the handover of the patient to the hospital and departs the hospital.
Data is expressed as a percentage.
Includes: Metropolitan hospitals: Armadale-Kelmscott Memorial, Fiona Stanley Hospital (ED opened on 3 February 2015), Fremantle (ED closed on 3 February 2015), Joondalup Health Campus, King Edward Memorial, Peel Health Campus, Princess Margaret, Rockingham General, Royal Perth, Sir Charles Gairdner and Swan District.
Excludes: All other public and private hospitals.
Data source: St John Ambulance Australia (SJAA).
Data extraction: 05/10/2015.
Report prepared by: Purchasing and System Performance Division, Department of Health, WA.
Data Definitions and Business Rules

PS
P-0
1215
6 O
CT
’15
health.wa.gov.au
This document can be made available in alternative formats on request for a person with a disability.
Produced by Purchasing and System Performance Division© Department of Health 2015
Copyright to this material is vested in the State of Western Australia unless otherwise indicated. Apart from any fair dealing for the purposes of private study, research, criticism or review, as permitted under the provisions of the Copyright Act 1968, no part may be reproduced or re-used for any purposes whatsoever without written permission of the State of Western Australia.