w00212 dr coverpage - data.ngdc.noaa.gov multibeam data were collected using hypack hysweep software...
TRANSCRIPT

NOAA FORM 76-35A
U.S. DEPARTMENT OF COMMERCE NATIONAL OCEANIC AND ATMOSPHERIC ADMINISTRATION
NATIONAL OCEAN SURVEY
DESCRIPTIVE REPORT
Type of Survey Hydrographic Survey Field No. M/V Red Witch
Registry No. W00212
LOCALITY
State St. Thomas, USVI
General Locality Charlotte Amalie Sub-locality Crown Bay
2010
CHIEF OF PARTY
Frank J. Sawyer

NOAA FORM 77-28 U.S. DEPARTMENT OF COMMERCE REGISTRY No. (11-72) NATIONAL OCEANIC AND ATMOSPHERIC ADMINISTRATION
HYDROGRAPHIC TITLE SHEET W00212
FIELD No.
INSTRUCTIONS – The Hydrographic Sheet should be accompanied by this form, filled in as completely as possible, when the sheet is forwarded to the Office.
State U.S. Virgin Islands General Locality Charlotte Amalie Sub-Locality Crown Bay Scale 1:10000 Date of Survey 05/19/10-05/20/10 Instructions dated N/A Project No. OSD-ARC-10 Vessel M/V Red Witch Chief of Party Frank J. Sawyer Surveyed by Frank Sawyer and Geoff Crews of ARC Surveying & Mapping
Soundings by echo sounder, hand lead, pole , Reson 7101 SWMB
Graphic record scaled by Graphic record checked by Automated Plot N/A Verification by Atlantic Hydrographic Branch Soundings in fathoms feet at MLW MLLW FEET at MLLW REMARKS: All times in UTC All soundings corrected with verified tides Map Projection is UTM zone 20 North

Project: OSD-ARC-10 Registry #: W00212 State: St. Thomas, USVI Locality: Charlotte Amalie Sub-locality: Crown Bay Surveyed by: ARC Surveying & Mapping M/V Red Witch The data for this project were collected by ARC Surveying & Mapping for the USVI Port Authority. Crown Bay is a popular destination for cruise lines. The cruise ships’ drafts call for critical under keel clearance approaching the piers. This survey was intended to provide bathymetric information in order to facilitate possible dredging for some of the newer 35-ft draft cruise ships. It has been determined through the Survey Acceptance Review process that this data is of suitable quality for nautical chart update purposes. Data were collected aboard the M/V Red Witch, a 21-ft MonArk Little Giant, owned and operated by ARC Surveying & Mapping out of Jacksonville, FL. The M/V Red Witch’s survey sensors include a 240 kHz Reson 7101 sonar providing bathymetry, a TSS VRU-210 Motion Reference Unit which measures attitude, a Trimble DSM232 GPS receiver for position, a TSS Meridian Gyro Compass for heading, and an Odom Digibar Pro for measuring sound speed profiles. Reson 7101 multibeam data were collected from 19 May – 20 May, 2010 at Little Krum Bay and out to the port area of Crown Bay and the northeast section of the West Gregerie Channel. These multibeam data were collected using Hypack Hysweep software version 2009a with the Hysweep HSX extension and processed using Hysweep MB Max editing software with the HS2 file extension. All corrections were applied during acquisition except for final tides which were incorporated prior to data submission. The processed HS2 files were converted into Caris for review and analysis by the Atlantic Hydrographic Branch reviewer. Horizontal accuracy is 10m (using DGPS corrections from the USCG beacon located in Isabela, Puerto Rico). Vertical accuracy is depth dependent (~1% of water depth), WGS84 datum. NOTE: The field unit’s descriptive report is pending. Due to the priority of this survey, the field unit’s Data Acquisition and Processing Report (DAPR) is included in this data submission package. Please see the H-Cell Report for Section D. Results and Recommendations.

Data Acquisition and Processing Report
Arc Surveying and Mapping
Vessel Red Witch
1

2
TABLE OF CONTENTS Introduction……………………………………………….......………….……..3 A. Equipment…………………………………....……......…….……….………3
A.1 Survey Launch Red Witch…………..……….…......…………….………..3 A.2 Sounding Equipment…………………..……..……………….………...3 A.3 Positioning Equipment………………….....…………………...……….4
A.3.1 TSS VRU-210Motion Reference Unit.............………………….…..4 A.3.2 Trimble DSM232………………………………………….………...4 A.3.3 TSS Meridian Surveyor Gyro Compass….…………………………4 A.3.4 Odum Digibar Pro Velocity Probe….........…………………………4
A.4 Software………………………………….....…………………………….....5 A.4.1 Acquisition Software…….………………………………………….5 A.4.1.1 Hypack and Hysweep 2009a………………………………............5 A.4.1.2 Hysweep 2009a……………………………………………………5
B. Data Processing and Quality Control…………...………………........…….5 B.1 Shallow-Water Multibeam Data……….………….........………………….5
C. Corrections to Echo Soundings…………………………………....………..6
C.1 Sound Velocity……....…………………………………………………........6 C.2 Vessel Offsets and Dynamic Draft Corrections…………………..........….6 C.3 Heave, Pitch, Roll, Heading, and Timing………………………….............7 C.4 Water Level Correctors………………………………………….............…7
D. Approval………………………………………………………........…………7 E. Digibar Probe Calibration..…………………………………........………..8-9

Data Acquisition and Processing Report
Introduction
This Data Acquisition and Processing Report (DAPR) details all Arc Surveying and Mapping survey equipment and methods used to acquire and process survey data. The data and deliverables were acquired according NOS HSSD, April 2010. Survey systems and methods used during this project were also chosen based on the water depth, sea and weather conditions, and the ability of the vessel to safely navigate the area.
A. Equipment
A.1 Survey Launch Red Witch
Survey Launch Red Witch is a 21-ft MonArk Little Giant, and was used to acquire multibeam echosounder data, and sound velocity profiles. The launch is 8 feet wide, has a static draft of 0.61 meters, and is powered by twin 115hp Yamaha outboards. Vessel Information: Builder: Mon Ark Built: 1978 Length Overall: 21 ft. Beam: 8 ft. Draft: 1.4ft Cruising Speed 25knts Min/Max Survey Speed: 4-5 knots. Primary Echosounder: Side Mount Reson 7101: Sound Velocity Profiler: Odom Digibar Pro Surface Sound Velocity Probe: Reson SVP
A.2 Sounding Equipment
Red Witch is equipped with a Reson 7101 Multibeam Swath System. The Reson 7101 operates at a frequency of 240 kHz. The Reson 7101 has 511 beams, each of which has a 1.5° beam width. The maximum ping rate of this echosounder is 50 Hz. Soundings are acquired in meters.
The sonar head contains a curved face projector (Reson 8101 transducer) and transmits a pulse of acoustic energy across the direction of travel illuminating a thin strip of seabed. The acoustic returns are picked up by the receiver section of the sonar head, amplified, digitized, and sent to the topside processor for beamforming and processing.
The processing unit performs the beamforming, bottom detection and controls the sonar head with respect to gain, ping rate and transmit angle. It also contains the interfaces for all time-critical external sensors such as attitude data, position, and the 1 PPS (pulse per second) signal. Real time velocities are also interfaced to the 7101 using a Reson SVP mounted on the transducer for initial beamforming and steering. Data is transmitted to the survey computer via Ethernet connection.
3
4
The sonar head is a side mount located on the port side of the vessel just aft of the wheel house. The sound velocity probe is mounted on transducer. The TSS VRU-210 Motion Reference Unit is mounted 0.52m starboard of the transducer. The Trimble DSM 232 DGPS antenna is mounted directly over the transducer and the SG Brown Meridian Surveyor Gyro Compass is mounted in the wheel house parallel to the keel of the vessel. This enables all the data to be collected with zero offsets other than the MRU.
A.3 Positioning Equipment
A.3.1 TSS VRU-210 Motion Reference Unit
The Red Witch is equipped with TSS VRU-210 Motion Reference Unit configured thru Hypack and Hysweep Data collection software. The MRU is offset .058 meters starboard of the multibeam transducer with a zero offset fore and aft. The data string (TSS1) is sent to the survey computer via a serial connection at a rate of 40hz. The unit is fully aided using the NEMA GGA string from the Trimble DSM 232 and heading information supplied by the Gyro Compass.
A.3.2 Trimble DSM232
The Red Witch is equipped with a Trimble DSM232 integrated 12-channel GPS receiver. There are three modes: Auto-Range, which locks onto the beacon nearest the vessel, Auto-Power, which locks onto the beacon with the greatest signal strength, and Manual, which allows the user to select the desired beacon. Additionally, the DSM232 can accept differential correctors (RTCM messages) from an external source such as a user established DGPS reference station. The unit was set to receive DGPS corrections from the USCG Beacon located in Isabela Puerto Rico. The DGPS antenna is mounted directly over the transducer enabling an offset of 0.00. The DSM232 is configured in the auto-power mode to only use correctors from the strongest USCG beacon, to go off-line if the age of DGPS correctors exceeded 20 seconds, and to exclude satellites with an altitude below 8°. The 1PPS signal and the NEMA ZDA timing are sent from the unit to the Reson via interface on the 7101 processor.
A.3.3 TSS Meridian Surveyor Gyro Compass
The Red Witch is equipped with a Meridian Surveyor Gyro Compass for precise heading information. The Gyro has a dynamic heading accuracy of +/- .02deg. The Gyro is located in the wheel house and mounted parallel to the keel /centerline of the vessel. The heading information is sent to Hysweep via a serial connection and also splits to the MRU. This device also has an offset of 0.00.
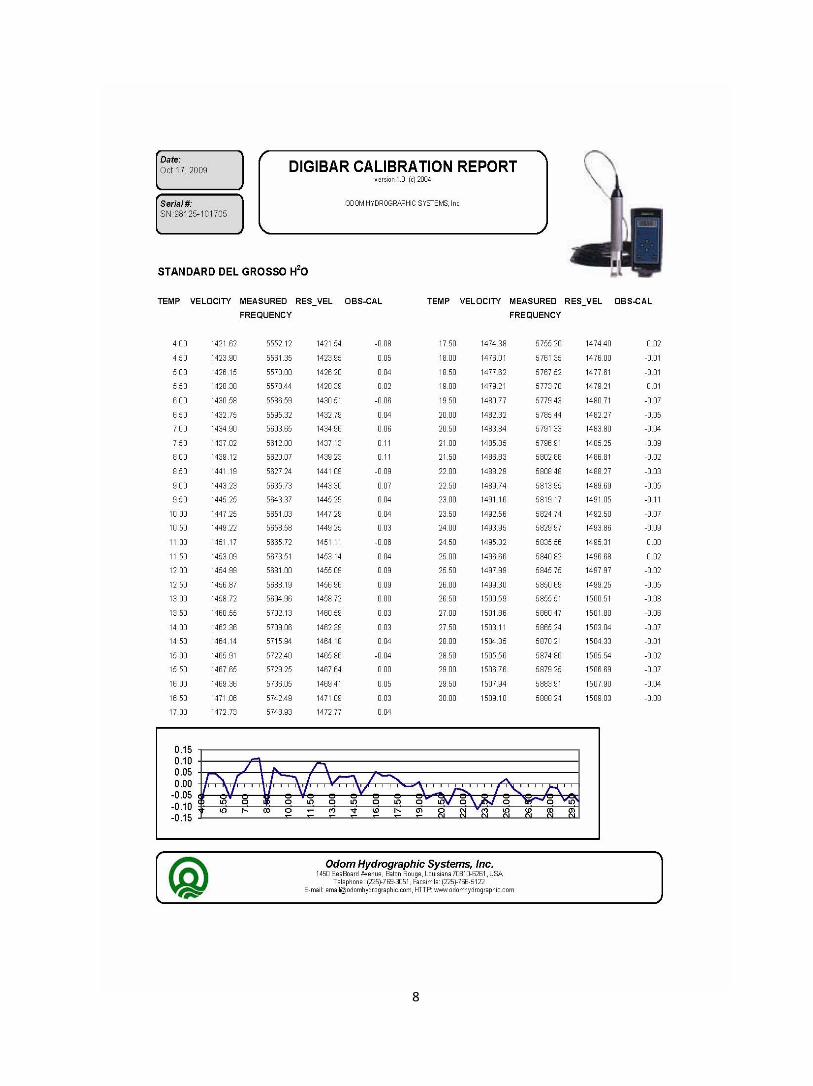
A.3.4 Odom Digibar Pro Velocity Probe
The Odom Digibar Pro is used to obtain sound velocity profiles at frequent intervals during the coarse of the survey. Sound velocities are collected at .5 meter intervals through the water column at different locations in the survey area. These velocities are post processed into the multibeam data.

5
A.4 Software
A.4.1 Acquisition Software
A.4.1.1 Hypack and Hysweep Version’s 2009a
Hypack is used for vessel navigation and line tracking during data collection. Hypack’s Survey program is used to log data and is used in conjunction with Hypack's Hysweep Survey program to log vessel positioning. In addition, the hysweep interface enables the boat operator to view the nadir depths in the hypack survey data information window. The vessels DGPS system is configured in the software for positioning only. Data is saved with a .RAW extension.
A.4.1.2 Hysweep 2009a
Hysweep is used for Multibeam data collection as well as navigation. Different displays are available for the survey technician to ensure bottom coverage and real time QC of data during the survey. The MRU, Gyro and the Reson 7101 are configured in Hysweep for data collection. Data is collected on the survey computer (Dell Laptop). Survey lines were laid out at a 16m interval to ensure 200 percent bottom coverage during the survey. The files are collected with a .HSX extension these are raw multibeam files in Hysweep.
B. Data Processing and Quality Control B.1 Shallow-Water Multibeam Data MB MAX (Hysweep)
Shallow-water multibeam (SWMB) data were monitored in real-time using the 2-D and 3-D data display windows in Hypack Hysweep, and the Reson controller window. The Reson 7101 control interface allows the operator the ability to control ping rate and pulse length as well as gain and power settings. The Reson 7101 control interface is virtually hands free and is typically set up prior to data collection. Adjustments to the gates can be made to ensure that false returns or outliers are eliminated during data collection. Power settings can be adjusted along dock faces or around structures to eliminate reflections or false returns. Data is also viewed in the Hysweep interface screen allowing the operator to see 3-D representations of the bottom, as well as cross section views along with pre set error displays, such as heave drift and sounding overlays to previous sweeps and numerous other QA tools built into the software. During data collection any soundings not meeting IHO standards are automatically removed .
Hypack Hysweep .HSX files are loaded into the Hysweep MB MAX multibeam data processing software at the completion of the survey. The data in the HSX file is displayed in a way that heave, pitch, roll and heading as well as positioning, velocities, and tide values for each individual line are displayed prior to integration into the sounding information from the 7101. After examination of this data it is then combined with the Reson 7101 data and the sweeps are reviewed. Typically 100 sweeps are displayed at a time and any outliers are removed with the editing tools available in MB Max. Any anomalies found during this step of the processing such as targets identified on the seafloor are saved to a Hypack target file (.TGT). Upon completion of sweep editing, all data is saved to Hysweeps .HS2 format then exported in the appropriate matrix i.e. 1mx1m grid with the minimum sounding being exported. An all file is also saved containing every data point in an ASCII format.

C. Corrections to Echo Soundings
C.1. Sound Velocity
As stated above sound velocity data is collected real time at the transducer via RESON SVP sound velocity probe attached directly to the transducer.
The Odom digibar Pro is used to collect sound velocity profiles throughout the water column during the survey and is incorporated into the data during post processing. *See page 8 & 9 for calibration report. C.2. Vessel Offsets and Dynamic Draft Corrections
Angular offsets and navigation timing errors of the multibeam system were determined using a patch test. A series of calibration lines are run and processed using Hysweeps Patch test program. The test was conducted following the re-installation of the multibeam transducer. These values were entered into the device setup in Hysweep prior to data collection.
Static Draft/Bar Check
Bar Depth 2.00 Measured Depth 2.00 Beam Samples Min Max Ave Diff
107 16 1.93 2.01 1.96 0.04 108 32 1.93 2.05 1.99 0.01 109 44 1.89 2.06 1.98 0.02 110 49 1.91 2.07 1.97 0.03 111 49 1.88 2.08 1.97 0.03 112 49 1.81 2.13 1.97 0.03 113 46 1.89 2.12 1.99 0.01 114 49 1.89 2.12 1.99 0.01 115 48 1.78 2.10 1.97 0.03 116 47 1.81 3.48 2.04 ‐0.04 117 49 1.88 3.52 2.11 ‐0.11 118 49 1.63 3.23 2.04 ‐0.04 119 49 1.86 2.14 1.99 0.01 120 47 1.59 2.25 2.00 0.00 121 49 1.62 2.14 1.98 0.02 122 47 1.68 2.25 1.98 0.02 123 46 1.68 3.04 2.01 ‐0.01 124 47 1.80 3.36 2.02 ‐0.02 125 47 1.85 3.50 2.04 ‐0.04 126 45 1.64 2.16 1.97 0.03 127 23 1.78 2.11 1.96 0.04 128 11 1.84 2.03 1.93 0.07
Red Witch Vessel Offsets
Red Witch Squat Corrections
6

8

9

Appendix I
Danger(s) to Navigation

There were no danger(s) to navigation present on this survey.

Appendix II
Features Report

W00212 Appendix II Charted Features
Registry Number: W00212
State: Virgin Islands
Locality: St. Thomas
Sub-locality: Crown Bay
Project Number: USVI-KR-1010
Survey Dates: 05/20/2010 - 06/25/2010
Charts Affected
Number Edition Date Scale (RNC) RNC Correction(s)*
25649 19th 08/01/2003 1:10,000 (25649_1)USCG LNM: 06/16/2009 (04/20/2010)NGA NTM: 07/27/2002 (05/01/2010)
25641 27th 01/01/2004 1:100,000 (25641_1) [L]NTM: ?
25650 34th 04/01/2004 1:100,000 (25650_1) [L]NTM: ?
25640 43rd 11/01/2008 1:326,856 (25640_1) [L]NTM: ?
* Correction(s) - source: last correction applied (last correction reviewed--"cleared date")
Features
No. NameFeatureType
SurveyDepth
SurveyLatitude
SurveyLongitude
1.1 404/122 - Charted 22ft Wk Wreck 7.24 m 18° 19' 49.4" N 064° 57' 16.1" W
1.2 6532/18 - Charted 32ft Wreck Wreck 9.93 m 18° 19' 45.0" N 064° 57' 01.1" W
1.3 570/46 - Charted 30ft Obstn Obstruction 9.14 m 18° 19' 59.9" N 064° 56' 41.4" W
1.4 mooring dolphin Dolphin [None] 18° 19' 53.2" N 064° 57' 05.9" W
Generated by Pydro v9.10 (r2824) on Fri Jul 30 12:13:06 2010 [UTC]

1 - DR_Charted
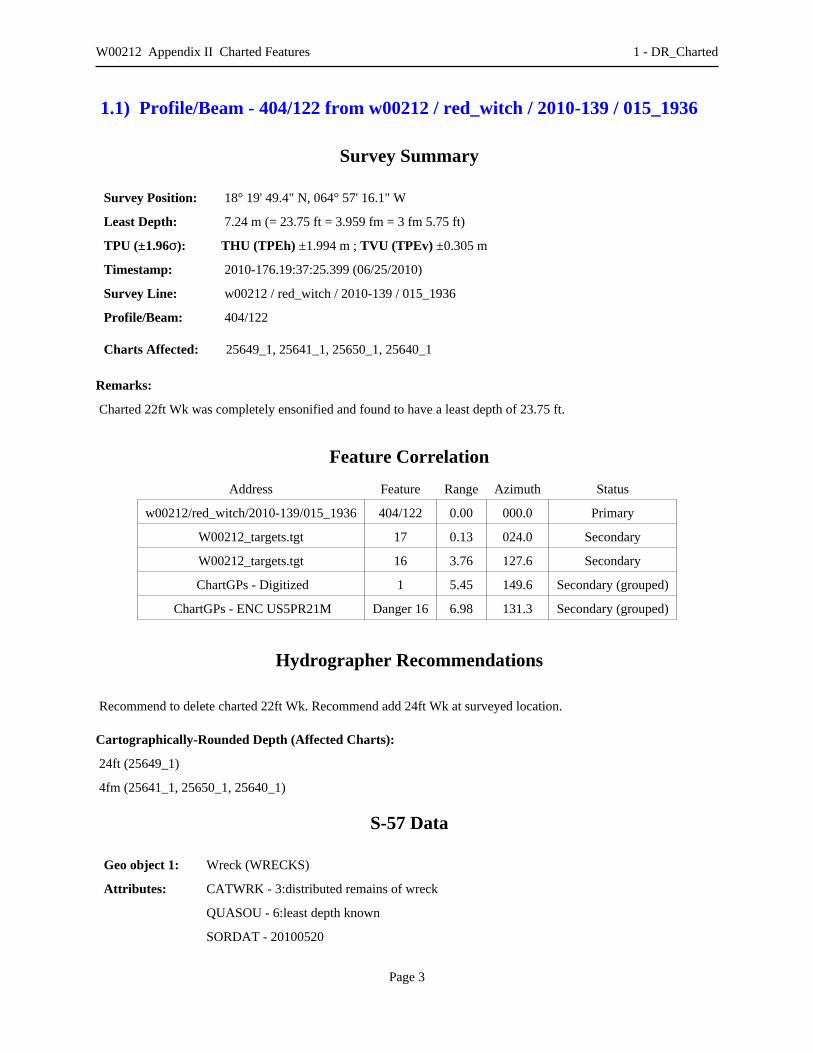
1.1) Profile/Beam - 404/122 from w00212 / red_witch / 2010-139 / 015_1936
Survey Summary
Survey Position: 18° 19' 49.4" N, 064° 57' 16.1" W
Least Depth: 7.24 m (= 23.75 ft = 3.959 fm = 3 fm 5.75 ft)
TPU (±1.96σ): THU (TPEh) ±1.994 m ; TVU (TPEv) ±0.305 m
Timestamp: 2010-176.19:37:25.399 (06/25/2010)
Survey Line: w00212 / red_witch / 2010-139 / 015_1936
Profile/Beam: 404/122
Charts Affected: 25649_1, 25641_1, 25650_1, 25640_1
Remarks:
Charted 22ft Wk was completely ensonified and found to have a least depth of 23.75 ft.
Feature Correlation
Address Feature Range Azimuth Status
w00212/red_witch/2010-139/015_1936 404/122 0.00 000.0 Primary
W00212_targets.tgt 17 0.13 024.0 Secondary
W00212_targets.tgt 16 3.76 127.6 Secondary
ChartGPs - Digitized 1 5.45 149.6 Secondary (grouped)
ChartGPs - ENC US5PR21M Danger 16 6.98 131.3 Secondary (grouped)
Hydrographer Recommendations
Recommend to delete charted 22ft Wk. Recommend add 24ft Wk at surveyed location.
Cartographically-Rounded Depth (Affected Charts):
24ft (25649_1)
4fm (25641_1, 25650_1, 25640_1)
S-57 Data
Geo object 1: Wreck (WRECKS)
Attributes: CATWRK - 3:distributed remains of wreck
QUASOU - 6:least depth known
SORDAT - 20100520
W00212 Appendix II Charted Features 1 - DR_Charted
Page 3

SORIND - US,US,Graph,W00212
TECSOU - 3:found by multi-beam
VALSOU - 7.240 m
WATLEV - 3:always under water/submerged
Office Notes
Concur.
W00212 Appendix II Charted Features 1 - DR_Charted
Page 4

Feature Images
Figure 1.1.1
W00212 Appendix II Charted Features 1 - DR_Charted
Page 5
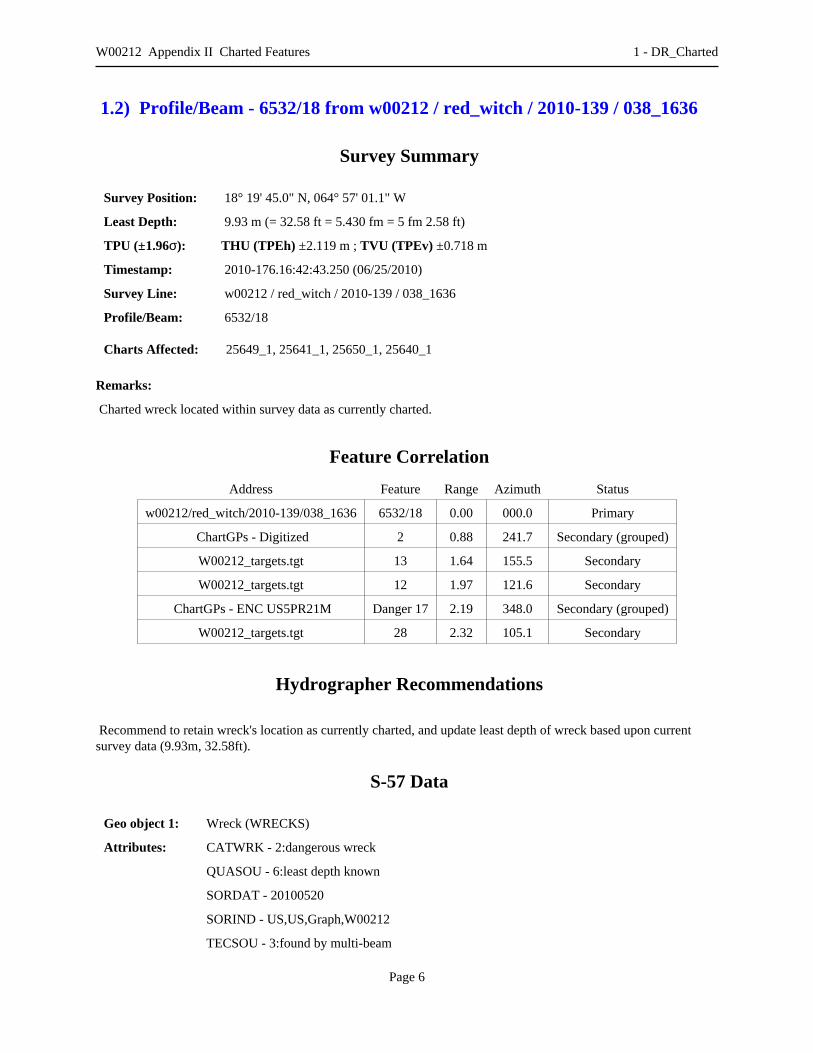
1.2) Profile/Beam - 6532/18 from w00212 / red_witch / 2010-139 / 038_1636
Survey Summary
Survey Position: 18° 19' 45.0" N, 064° 57' 01.1" W
Least Depth: 9.93 m (= 32.58 ft = 5.430 fm = 5 fm 2.58 ft)
TPU (±1.96σ): THU (TPEh) ±2.119 m ; TVU (TPEv) ±0.718 m
Timestamp: 2010-176.16:42:43.250 (06/25/2010)
Survey Line: w00212 / red_witch / 2010-139 / 038_1636
Profile/Beam: 6532/18
Charts Affected: 25649_1, 25641_1, 25650_1, 25640_1
Remarks:
Charted wreck located within survey data as currently charted.
Feature Correlation
Address Feature Range Azimuth Status
w00212/red_witch/2010-139/038_1636 6532/18 0.00 000.0 Primary
ChartGPs - Digitized 2 0.88 241.7 Secondary (grouped)
W00212_targets.tgt 13 1.64 155.5 Secondary
W00212_targets.tgt 12 1.97 121.6 Secondary
ChartGPs - ENC US5PR21M Danger 17 2.19 348.0 Secondary (grouped)
W00212_targets.tgt 28 2.32 105.1 Secondary
Hydrographer Recommendations
Recommend to retain wreck's location as currently charted, and update least depth of wreck based upon currentsurvey data (9.93m, 32.58ft).
S-57 Data
Geo object 1: Wreck (WRECKS)
Attributes: CATWRK - 2:dangerous wreck
QUASOU - 6:least depth known
SORDAT - 20100520
SORIND - US,US,Graph,W00212
TECSOU - 3:found by multi-beam
W00212 Appendix II Charted Features 1 - DR_Charted
Page 6

VALSOU - 9.930 m
WATLEV - 3:always under water/submerged
Office Notes
Concur.
W00212 Appendix II Charted Features 1 - DR_Charted
Page 7

Feature Images
Figure 1.2.1
W00212 Appendix II Charted Features 1 - DR_Charted
Page 8

1.3) Profile/Beam - 570/46 from w00212 / red_witch / 2010-139 / 045_1557
Survey Summary
Survey Position: 18° 19' 59.9" N, 064° 56' 41.4" W
Least Depth: 9.14 m (= 29.99 ft = 4.998 fm = 4 fm 5.99 ft)
TPU (±1.96σ): THU (TPEh) ±2.056 m ; TVU (TPEv) ±0.489 m
Timestamp: 2010-176.15:58:05.444 (06/25/2010)
Survey Line: w00212 / red_witch / 2010-139 / 045_1557
Profile/Beam: 570/46
Charts Affected: 25649_1, 25641_1, 25650_1, 25640_1
Remarks:
Charted 30ft Obstn was located at charted location.
Feature Correlation
Address Feature Range Azimuth Status
w00212/red_witch/2010-139/045_1557 570/46 0.00 000.0 Primary
W00212_targets.tgt 11 0.18 043.1 Secondary
W00212_targets.tgt 6 0.28 021.4 Secondary
ChartGPs - ENC US5PR21M Danger 4 1.72 029.0 Secondary (grouped)
ChartGPs - Digitized 3 4.23 230.5 Secondary (grouped)
Hydrographer Recommendations
Update features location and depth as per current survey data. Recommend delete charted 30ft Obstn. Recommendto add 30ft Obstn at current surveyed location with least depth of 9.14m,29.99ft.
S-57 Data
Geo object 1: Obstruction (OBSTRN)
Attributes: QUASOU - 6:least depth known
SORDAT - 20100520
SORIND - US,US,Graph,W00212
TECSOU - 3:found by multi-beam
VALSOU - 9.140 m
WATLEV - 3:always under water/submerged
W00212 Appendix II Charted Features 1 - DR_Charted
Page 9

Office Notes
Concur.
W00212 Appendix II Charted Features 1 - DR_Charted
Page 10

Feature Images
Figure 1.3.1
W00212 Appendix II Charted Features 1 - DR_Charted
Page 11

1.4) GP No. - 1 from W00212_targets2.tgt
Survey Summary
Survey Position: 18° 19' 53.2" N, 064° 57' 05.9" W
Least Depth: [None]
TPU (±1.96σ): THU (TPEh) [None] ; TVU (TPEv) [None]
Timestamp: 2010-140.20:24:22.000 (05/20/2010)
GP Dataset: W00212_targets2.tgt
GP No.: 1
Charts Affected: 25649_1, 25641_1, 25650_1, 25640_1
Remarks:
Concrete filled Mooring Dolphin
Feature Correlation
Address Feature Range Azimuth Status
W00212_targets2.tgt 1 0.00 000.0 Primary
ChartGPs - Digitized 4 2.54 131.9 Secondary (grouped)
W00212_targets.tgt 22 3.54 355.2 Secondary
W00212_targets.tgt 23 6.03 205.6 Secondary
W00212_targets.tgt 21 6.80 111.8 Secondary (grouped)
W00212_targets.tgt 20 31.18 105.0 Secondary
W00212_targets.tgt 24 41.15 133.6 Secondary
W00212_targets.tgt 25 45.80 133.9 Secondary
Hydrographer Recommendations
Chart dolphin at surveyed location.
S-57 Data
Geo object 1: Mooring/warping facility (MORFAC)
Attributes: CATMOR - 1:dolphin
SORDAT - 20100520
SORIND - US,US,Graph,W00212
W00212 Appendix II Charted Features 1 - DR_Charted
Page 12

STATUS - 1:permanent
Office Notes
Concur.
W00212 Appendix II Charted Features 1 - DR_Charted
Page 13

W00212 Appendix II Uncharted Features
Registry Number: W00212
State: Virgin Islands
Locality: St. Thomas
Sub-locality: Crown Bay
Project Number: USVI-KR-1010
Survey Dates: 05/19/2010 - 07/02/2010
Charts Affected
Number Edition Date Scale (RNC) RNC Correction(s)*
25649 19th 08/01/2003 1:10,000 (25649_1)USCG LNM: 06/16/2009 (04/20/2010)NGA NTM: 07/27/2002 (05/01/2010)
25641 27th 01/01/2004 1:100,000 (25641_1) [L]NTM: ?
25650 34th 04/01/2004 1:100,000 (25650_1) [L]NTM: ?
25640 43rd 11/01/2008 1:326,856 (25640_1) [L]NTM: ?
* Correction(s) - source: last correction applied (last correction reviewed--"cleared date")
Features
No. NameFeatureType
SurveyDepth
SurveyLatitude
SurveyLongitude
1.1 314/64 - Uncharted 17ft Wreck Wreck 5.19 m 18° 19' 47.1" N 064° 57' 16.7" W
1.2 red can 6 white light - Uncharted Red buoy, lighted 9.68 m 18° 19' 52.8" N 064° 56' 52.9" W
1.3 1117/140 - Uncharted 49ft Rk Rock 15.04 m 18° 19' 39.4" N 064° 57' 11.9" W
1.4 Uncharted Mooring Dolphin Dolphin [None] 18° 19' 53.2" N 064° 57' 06.0" W
Generated by Pydro v9.10 (r2824) on Fri Jul 30 12:14:08 2010 [UTC]

1 - DR_UnCharted

1.1) Profile/Beam - 314/64 from w00212 / red_witch / 2010-139 / 017_1929
Survey Summary
Survey Position: 18° 19' 47.1" N, 064° 57' 16.7" W
Least Depth: 5.19 m (= 17.03 ft = 2.838 fm = 2 fm 5.03 ft)
TPU (±1.96σ): THU (TPEh) ±1.985 m ; TVU (TPEv) ±0.332 m
Timestamp: 2010-176.19:29:57.430 (06/25/2010)
Survey Line: w00212 / red_witch / 2010-139 / 017_1929
Profile/Beam: 314/64
Charts Affected: 25649_1, 25641_1, 25650_1, 25640_1
Remarks:
Wreck locasted within the survey data in the nearshore area. Least depth from multibeam is 5.19m (17.03Ft). Thedata is interpreted as a wreck (barge).
Feature Correlation
Address Feature Range Azimuth Status
w00212/red_witch/2010-139/017_1929 314/64 0.00 000.0 Primary
Hydrographer Recommendations
Recommend to chart 17 wreck.
S-57 Data
Geo object 1: Wreck (WRECKS)
Attributes: CATWRK - 2:dangerous wreck
QUASOU - 6:least depth known
SORDAT - 20100520
SORIND - US,US,Graph,W00212
TECSOU - 3:found by multi-beam
VALSOU - 5.190 m
WATLEV - 3:always under water/submerged
W00212 Appendix II Uncharted Features 1 - DR_UnCharted
Page 3

Office Notes
Concur.
W00212 Appendix II Uncharted Features 1 - DR_UnCharted
Page 4

Feature Images
Figure 1.1.1
W00212 Appendix II Uncharted Features 1 - DR_UnCharted
Page 5

1.2) GP No. - 39 from W00212_targets.tgt
Survey Summary
Survey Position: 18° 19' 52.8" N, 064° 56' 52.9" W
Least Depth: 9.68 m (= 31.76 ft = 5.293 fm = 5 fm 1.76 ft)
TPU (±1.96σ): THU (TPEh) [None] ; TVU (TPEv) [None]
Timestamp: 2010-139.21:18:33.000 (05/19/2010)
GP Dataset: W00212_targets.tgt
GP No.: 39
Charts Affected: 25649_1, 25641_1, 25650_1, 25640_1
Remarks:
Located nav aid, red can 6, with white light. Appears to be a private marker as the light is not normal USCG lightfor a red nun (buoy) nav aid
Feature Correlation
Address Feature Range Azimuth Status
W00212_targets.tgt 39 0.00 000.0 Primary
Hydrographer Recommendations
Chart red nun navigational buoy in surveyed position.
Cartographically-Rounded Depth (Affected Charts):
32ft (25649_1)
5 ¼fm (25641_1, 25650_1, 25640_1)
S-57 Data
Geo object 1: Buoy, lateral (BOYLAT)
Attributes: BOYSHP - 2:can (cylindrical)
CATLAM - 2:starboard-hand lateral mark
COLOUR - 3:red
INFORM - "6"
SORDAT - 20100520
SORIND - US,US,Graph,W00212
W00212 Appendix II Uncharted Features 1 - DR_UnCharted
Page 6

Office Notes
Concur.
W00212 Appendix II Uncharted Features 1 - DR_UnCharted
Page 7

1.3) Profile/Beam - 1117/140 from w00212 / red_witch / 2010-139 / 006_2052
Survey Summary
Survey Position: 18° 19' 39.4" N, 064° 57' 11.9" W
Least Depth: 15.04 m (= 49.34 ft = 8.224 fm = 8 fm 1.34 ft)
TPU (±1.96σ): THU (TPEh) ±2.104 m ; TVU (TPEv) ±0.336 m
Timestamp: 2010-176.20:53:53.743 (06/25/2010)
Survey Line: w00212 / red_witch / 2010-139 / 006_2052
Profile/Beam: 1117/140
Charts Affected: 25649_1, 25641_1, 25650_1, 25640_1
Remarks:
[None]
Feature Correlation
Address Feature Range Azimuth Status
w00212/red_witch/2010-139/006_2052 1117/140 0.00 000.0 Primary
W00212_targets.tgt 14 0.51 131.2 Secondary
W00212_targets.tgt 15 0.66 157.1 Secondary
Hydrographer Recommendations
Chart 49 Sounding.
S-57 Data
Geo object 1: Underwater rock / awash rock (UWTROC)
Attributes: QUASOU - 6:least depth known
SORDAT - 20100520
SORIND - US,US,Graph,W00212
TECSOU - 3:found by multi-beam
VALSOU - 15.040 m
WATLEV - 3:always under water/submerged
W00212 Appendix II Uncharted Features 1 - DR_UnCharted
Page 8

Office Notes
Concur.
W00212 Appendix II Uncharted Features 1 - DR_UnCharted
Page 9

Feature Images
Figure 1.3.1
W00212 Appendix II Uncharted Features 1 - DR_UnCharted
Page 10

1.4) GP No. - 4 from ChartGPs - Digitized
Survey Summary
Survey Position: 18° 19' 53.2" N, 064° 57' 06.0" W
Least Depth: [None]
TPU (±1.96σ): THU (TPEh) [None] ; TVU (TPEv) [None]
Timestamp: 2010-183.13:18:35 (07/02/2010)
GP Dataset: ChartGPs - Digitized
GP No.: 4
Charts Affected: 25649_1, 25641_1, 25650_1, 25640_1
Remarks:
Concrete filled lighted mooring dolphin.
Feature Correlation
Address Feature Range Azimuth Status
W00212_targets2.tgt 1 0.00 000.0 Primary
ChartGPs - Digitized 4 2.54 131.9 Secondary (grouped)
W00212_targets.tgt 22 3.54 355.2 Secondary
W00212_targets.tgt 23 6.03 205.6 Secondary
W00212_targets.tgt 21 6.80 111.8 Secondary (grouped)
W00212_targets.tgt 20 31.18 105.0 Secondary
W00212_targets.tgt 24 41.15 133.6 Secondary
W00212_targets.tgt 25 45.80 133.9 Secondary
Hydrographer Recommendations
Chart mooring facility at surveyed position.
S-57 Data
Geo object 1: Mooring/warping facility (MORFAC)
Attributes: CATMOR - 1:dolphin
CONRAD - 1:radar conspicuous
SORDAT - 20100520
W00212 Appendix II Uncharted Features 1 - DR_UnCharted
Page 11

SORIND - US,US,Graph,W00212
STATUS - 1:permanent
WATLEV - 2:always dry
Office Notes
Concur.
W00212 Appendix II Uncharted Features 1 - DR_UnCharted
Page 12

Appendix III
Survey Outline


Appendix IV
Tides and Water Levels

STATEMENT OF WORK USVI-KR-2010 Crown Bay, St. Thomas, VI (05/13/2010 DW) 1.0. TIDES AND WATER LEVELS 1.1. Specifications Tidal data acquisition, data processing, tidal datum computation and final tidal zoning shall be performed utilizing sound engineering and oceanographic practices as specified in National Ocean Service (NOS) Hydrographic Surveys Specifications and Deliverables (April 2009). 1.2. Vertical Datums The tidal datums for this project are Chart Datum, Mean Lower Low Water (MLLW) and Mean High Water (MHW). Soundings are referenced to MLLW and heights of overhead obstructions (bridges and cables) are referenced to MHW. 1.2.1. The operating National Water Level Observation Network (NWLON) station at Charlotte Amalie, St. Thomas (9751639) will serve as datum control for this project. During periods of hydrography, CO-OPS is only responsible for the operation and maintenance of NWLON control stations and the contractor is responsible for the maintenance and operations of all contractor installed (tertiary) stations. The contractor is required to monitor the NWLON control water level data via the CO-OPS website at http://tidesandcurrents.noaa.gov/hydro.shtml or through regular communications with the OCS COTR or the OCS COTR’s CO-OPS authorized point of contact (Thomas Landon at 301-713-2897 x 191 or via email: [email protected]) before and during operations. The OCS COTR or the COTR’s CO-OPS authorized point of contact (Thomas Landon) will serve as liaison between the contractor and NOS/CO-OPS to confirm operation of this station and to ensure the acquisition of NWLON control water level data during periods of hydrography. Problems or concerns regarding the acquisition of valid water level data identified by the contractor shall be communicated with the OCS COTR or the COTR’s CO-OPS authorized point of contact (Thomas Landon) to coordinate the appropriate course of action to be taken such as gauge repair and/or developing contingency plans for hydrographic survey operations. 1.3. Tide Reducer Stations The operating water level station at Charlotte Amalie, St. Thomas (9751639) will provide water level reducers for this project. Therefore it is critical that it remain in operation during the survey. 1.3.1. No subordinate water level stations are required for this project 1.3.2. This section is not applicable to this project. 1.3.3. Water Level Records: If subordinate water level stations are installed, submit water level data, such as leveling records, field reports, and any other relevant data/reports, including the data downloaded onto diskette/CD as specified in the latest version of the NOS Specifications and Deliverables document. 1.3.3.1. Tidal records should be forwarded to the following address:

NOAA/National Ocean Service/CO-OPS Chief, Engineering Division N/OPS1 - SSMC4, Station 6531 1305 East-West Highway Silver Spring, MD 20910 1.3.4. This section is not applicable to this project. 1.3.4.1. This section is not applicable to this project. 1.3.5. This section is not applicable to this project. 1.4. Zoning 1.4.1. The water level station at Charlotte Amalie, St. Thomas (9751639) is the reference station for predicted tides for hydrography at Crown Bay, St. Thomas, VI. The time and height correctors listed below for applicable zones should be applied to the predicted tides at the station indicated during the acquisition and preliminary processing phases of this project. Predictions may be retrieved in one month increments over the Internet from CO-OPS SOAP web services at http://opendap.co-ops.nos.noaa.gov/axis/text.html. The contractor must notify the COTR or the COTR's authorized representative immediately of any problems concerning the predicted tides. Predictions are six-minute time series data relative to MLLW in metric units on Greenwich Mean Time. For the time corrections, a negative (-) time correction indicates that the time of tide in that zone is earlier than (before) the predicted tides at the reference station. A positive (+) time correction indicates that the time of tide in that zone is later than (after) the predicted tides at the reference station. For height corrections, the water level heights relative to MLLW at the reference station are multiplied by the range ratio to estimate the water level heights relative to MLLW in the applicable zone. Time Range Predicted Zone Corrector (min) Ratio Reference Station VIR4C -6 1.08 9751639 VIR24 0 1.01 9751639 1.4.2. Polygon nodes and water level corrections referencing Charlotte Amalie, St. Thomas (9751639) are provided in ASCII format denoted by a *.zdf extension file name. Zoning diagrams, created in MapInfo, are provided in both digital and hard copy format to assist with the zoning. Longitude and latitude coordinates are in decimal degrees. Negative (-) longitude is a MapInfo representation of West longitude. “Preliminary” data for the control water level station, Charlotte Amalie, St. Thomas (9751639), are available in near real-time and verified data will be available on a weekly basis for the previous week. These water level data may be obtained from CO-OPS SOAP web services at http://opendap.co-ops.nos.noaa.gov/axis/text.html. Please contact the Office of Coast Survey COTR before survey operations begin and once survey operations are completed so that this project number and the appropriate CO-OPS NWLON (National Water Level Observation Network) water level stations are added to or removed from the CO-OPS Hydro Hot List (http://tidesandcurrents.noaa.gov/hydro).

1.4.3. Tide Component Error Estimation The estimated total error contribution to the total survey error budget in the vicinity of Gregerie Channel and St. Thomas Harbor is 0.09m at the 95% confidence level, and includes the estimated gauge measurement error, tidal datum computation error, and tidal zoning error. It should be noted that the tidal error component can be significantly greater than stated if a substantial meteorological event or condition should occur during the time of hydrography. 1.5. Final Zoning 1.5.1. For final processing, apply tidal zoning correctors to “verified” observed data of the NOS control station and/or the final processed data of the subordinate stations.

APPENDIX V
Supplemental Survey Records and Correspondence

Re: W00212 Progress
1 of 2 7/30/2010 11:05 AM
Subject: Re: W00212 ProgressFrom: Wesley Kitt <[email protected]>Date: Fri, 09 Jul 2010 07:49:28 -0400To: Frank Sawyer <[email protected]>CC: [email protected], [email protected], [email protected]
Good morning Frank,
Sorry about the picture. I've attached it as a separate file this time but I think you'veanswered my questions. I recall that fixed Nav Aid was in pretty poor shape, ie, rust hadeaten almost all the way through the supports. But it was still there so it will have tostay on the chart for now.
I hear ya about the time crunch. The descriptive report is a necessary deliverable butbetween the DAPR and myself being present during operations, I can work with what we havefor now.
Thanks for getting back to us so quickly!
Respectfully, Wes
Frank Sawyer wrote: Wes, Glad to here everything is looking good .I cant see the image you sent but I cananswer your questions A. There is no light at the new mooring dolphin. B.The Red nav aid looks like a replacement for the existing Red Day Marker that isshown on the chart. C.Working on the report. I need more hours in a day... Hope this helps Please call or email if you have any questions. Frank Sawyer, President Arc Surveying and Mapping 904-384-8377 office 904-237-5946 cell www.arcsurveyors.com

Re: W00212 Progress
2 of 2 7/30/2010 11:05 AM
Item_Clarification.jpgContent-Type: image/jpeg
Content-Encoding: base64
Re: W00212 Progress
1 of 2 7/30/2010 11:07 AM
Subject: Re: W00212 ProgressFrom: Frank Sawyer <[email protected]>Date: Wed, 21 Jul 2010 16:43:05 -0400To: Wesley Kitt <[email protected]>CC: "LCDR Rick Brennan, NOAA" <[email protected]>, "Castle.E.Parker" <[email protected]>
Wes, We will get with the port about the nav aid. I'm sure they can send us a photo of it.
Frank Sawyer, President Arc Surveying and Mapping 904-384-8377 office 904-237-5946 cell
On Jul 20, 2010, at 8:31 AM, Wesley Kitt <[email protected]> wrote:
Good morning Frank,
We're moving along nicely with W00212 and have started compilation. We foreseecompletion and referral to Marine Chart Division before the end of the month. A majorinterest item that came out of the SAR review meeting centers around that Nav Aid described in the target file as "red can "6" Lt." We need clarification on this. Ifthe buoy is from the USCG, it cannot be a red can. Was it a red nun? And, if so, thenit wouldn't have a white light but rather a red light. Either way, we'll needclarification. Perhaps through the Port Authority?
FYI, the soundings matched very well with the soundings originally sent in a coupleyears ago. Some soundings in question from the original set were shown to be flierswhen this year's collection was scrutinized.
Because of the fast track nature of this survey, we are proceeding with compilation without being in possession of the descriptive report with the understanding that one is "on the way."
Sincerely, Wes Kitt
Frank Sawyer wrote: Wes, Glad to here everything is looking good .I cant see the image you sent but I can answer your questions A. There is no light at the new mooring dolphin. B.The Red nav aid looks like a replacement for the existing Red Day Marker that is shown on the chart. C.Working on the report. I need more hours in a day... Hope this helps Please call or email if you have any questions. Frank Sawyer, President Arc Surveying and Mapping 904-384-8377 office 904-237-5946 cell www.arcsurveyors.com
-----Original Message----- From: Wesley Kitt <[email protected]> To: Frank Sawyer <[email protected]> Cc: LCDR Rick Brennan, NOAA <[email protected]>; Castle.E.Parker <[email protected]> Sent: Thu, Jul 8, 2010 10:48 am Subject: W00212 Progress
Good morning Frank,

Re: W00212 Progress
2 of 2 7/30/2010 11:07 AM
Hope you had a great Independence Day!
I'm in the midst of a survey acceptance review of W00212, Crown Bay, St. Thomas, andwill move on to compilation to try and fast track this survey. The HS2 filesconverted easily thru CARIS and the data looks quite good! Using the latest orthoimagery, the data matches with the changed shoreline shown on the raster. I do havea couple questions concerning new items. Please refer to the attached image:
A: This is the huge mooring dolphin that is not currently charted. Was the light(Q PA Priv) that is charted at approximately the same location still there? I don'trecall seeing it.
B: The red can buoy. Was this a private Nav Aid?
I assume these items are addressed in the descriptive report but to my knowledge we have yet to receive it. Any clarification concerning these items would be mosthelpful.
Thanks and,
Respectfully, Wes Kitt, PS-AHB
RE: W00212 Progress
1 of 3 7/30/2010 11:08 AM
Subject: RE: W00212 ProgressFrom: John Sawyer <[email protected]>Date: Thu, 22 Jul 2010 11:38:17 -0400To: 'Frank Sawyer' <[email protected]>, 'Wesley Kitt' <[email protected]>CC: "'LCDR Rick Brennan, NOAA'" <[email protected]>, "'Castle.E.Parker'" <[email protected]>, 'Patrick Sawyer' <[email protected]>, [email protected], [email protected]
Frank/Wes
I talked with USVI Ports Marine Manager (Calvin Industria) this morningregarding Buoy #6. Mr. Industria will send either a photo or a descriptionvia email. Glad to hear charting Crown Bay is moving along.
Thanks, John
John F. Sawyer, Vice PresidentArc Surveying & Mapping, Inc.5202 San Juan AvenueJacksonville, Florida 32210Office (904) 384-8377Fax (904) 384-8388Cell (904) 237-5949www.arcsurveyors.com
Subject: Re: W00212 ProgressFrom: "Frank Sawyer" <[email protected]>Date: Wed, 21 Jul 2010 16:43:05 -0400To: "Wesley Kitt" <[email protected]>CC: "LCDR Rick Brennan, NOAA" <[email protected]>, "Castle.E.Parker"<[email protected]>
Wes, We will get with the port about the nav aid. I'm sure they can send us a photo of it.
Frank Sawyer, PresidentArc Surveying and Mapping904-384-8377 office904-237-5946 cell
On Jul 20, 2010, at 8:31 AM, Wesley Kitt <[email protected]> wrote:
Good morning Frank,
We're moving along nicely with W00212 and have started compilation. We foresee completion and referral to Marine Chart Division before the end of the month. A major interest item that came out of the SAR review meeting centers around that Nav Aid described in the target file as "red can "6" Lt." We need clarification on this. If the buoy is from the USCG, it cannot be a red can. Was it a red nun? And, if so, then it wouldn't have a white light but rather a red light. Either way, we'll need clarification. Perhaps through the Port Authority?
FYI, the soundings matched very well with the soundings originally sent in a couple years ago. Some soundings in question from the original set were shown to be fliers when this year's collection was scrutinized.
RE: W00212 Progress
2 of 3 7/30/2010 11:08 AM
Because of the fast track nature of this survey, we are proceeding with compilation without being in possession of the descriptive report with the understanding that one is "on the way."
Sincerely,Wes Kitt
Frank Sawyer wrote:Wes, Glad to here everything is looking good .I cant see the image you sent but I can answer your questionsA. There is no light at the new mooring dolphin.B.The Red nav aid looks like a replacement for the existing Red Day Marker that is shown on the chart.C.Working on the report. I need more hours in a day...Hope this helpsPlease call or email if you have any questions.Frank Sawyer, PresidentArc Surveying and Mapping904-384-8377 office904-237-5946 cellwww.arcsurveyors.com
-----Original Message-----From: Wesley Kitt <[email protected]>To: Frank Sawyer <[email protected]>Cc: LCDR Rick Brennan, NOAA <[email protected]>; Castle.E.Parker <[email protected]>Sent: Thu, Jul 8, 2010 10:48 amSubject: W00212 Progress
Good morning Frank,
Hope you had a great Independence Day!
I'm in the midst of a survey acceptance review of W00212, Crown Bay, St. Thomas, and will move on to compilation to try and fast track this survey. The HS2 files converted easily thru CARIS and the data looks quite good! Using the latest ortho imagery, the data matches with the changed shoreline shown on the raster. I do have a couple questions concerning new items. Please refer to the attached image:
A: This is the huge mooring dolphin that is not currently charted. Was the light (Q PA Priv) that is charted at approximately the same location still there? I don't recall seeing it.
B: The red can buoy. Was this a private Nav Aid?
I assume these items are addressed in the descriptive report but to my knowledge we have yet to receive it. Any clarification concerning these items would be most helpful.
Thanks and,
Respectfully,Wes Kitt, PS-AHB
Re: W00212 Progress.eml Content-Type: message/rfc822

RE: W00212 Progress
3 of 3 7/30/2010 11:08 AM
Content-Encoding: 7bit

[Fwd: Re: [Fwd: Re: HURL survey for Virgin Islands chart 25649]]
1 of 2 7/30/2010 11:09 AM
Subject: [Fwd: Re: [Fwd: Re: HURL survey for Virgin Islands chart 25649]]From: "LCDR Rick Brennan, NOAA" <[email protected]>Date: Wed, 28 Jul 2010 12:46:25 -0400To: Wesley Kitt <[email protected]>CC: Edward Owens <[email protected]>
Wes,
This just came in from Mark Griffin. I would include this in the supplemental correspondence and as perMCD direction remove any SLCONS.
Rick--
LCDR Rick Brennan, NOAAChief, Atlantic Hydrographic Branch439 West York StreetNorfolk, VA 23510Office: 757-441-6746Cell: 443-994-3301
Learn about "America's Seventh Service":www.noaacorps.noaa.govLearn about NOAA's Office of Coast Survey:www.nauticalcharts.noaa.gov
Subject: Re: [Fwd: Re: HURL survey for Virgin Islands chart 25649]From: "Mark.Griffin" <[email protected]>Date: Wed, 28 Jul 2010 10:09:30 -0400To: "LCDR Rick Brennan, NOAA" <[email protected]>CC: "Kyle.Ward" <[email protected]>
Rick,
Following up on my phone message. Heres the attached GC project report. Again probablywill be better for you to leave your shoreline out of your Hcell. I have compiled theshoreline to my raster files but ENC is not in continual maintenance so they haven'tgotten this compiled to their product yet. I can probably process the raw data into ashape file, which is what ENC would be using to compile with but again it's not thecompiled version just the raw deliverable.
LCDR Rick Brennan, NOAA wrote: We did not receive this GC for this survey. If it was applied to the chart - it hasbeen recently, because the chart we are compiling to still has the old pier in CrownBay. If there is better source please provide it, because we hope to transmit thissurvey by Friday.
Rick
Kyle.Ward wrote: Mark, I do not have an outline for W00212.
[Fwd: Re: [Fwd: Re: HURL survey for Virgin Islands chart 25649]]
2 of 2 7/30/2010 11:09 AM
Rick, Was the GC listed below referenced during the compilation and evaluation of W00212?Mark was curious because they recently applied the GC to the chart.
Project ID: /VI0801/
Date: /20091211/
Description: /ST. THOMAS HARBOR, VI/
Regards, Kyle
Mark.Griffin wrote: fyi
Mark GriffinChief, Product Branch E
Marine Chart Divsion
Office of Coast Survey
Re: [Fwd: Re: HURL survey for Virgin Islands chart 25649].emlContent-Type: message/rfc822
Content-Encoding: 7bit
L270-2010[1].pdfContent-Type: application/pdf
Content-Encoding: base64

NOAA COASTAL MAPPING PROGRAM PROJECT COMPLETION REPORT
PROJECT VI0801
St. Thomas Harbor, U.S. Virgin Islands
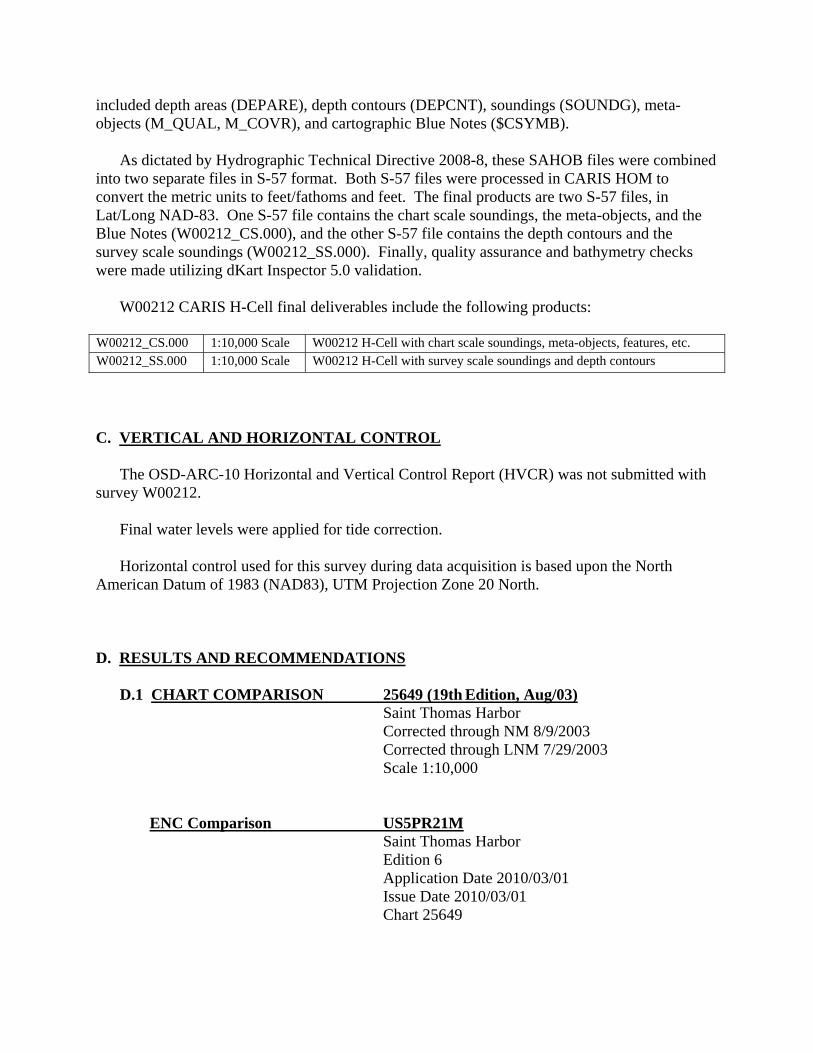
Introduction NOAA Coastal Mapping Program (CMP) Project VI0801 provides a highly accurate database of new digital shoreline data for St. Thomas Harbor, U.S. Virgin Islands, and surrounding coastal areas. The project extends from Green Cay westward to Brewers Bay and includes both East and West Gregerie Channel. Successful completion of this project resulted in a densification of the National Spatial Reference System (NSRS), a set of controlled metric-quality digital aerial images, and digital feature data of the coastal zone which complements the Nautical Charting Program (NCP) as well as geographic information systems (GIS) for a variety of coastal zone management applications. The project database consists of information measured and extracted from digital aerial images and metadata related to photogrammetric compilation. Base mapping was conducted in a digital environment using stereo softcopy photogrammetry and associated cartographic practices.
Project Design The design of Project VI0801 was accomplished by the Requirements Branch (RB) of the Remote Sensing Division (RSD) in response to the need for timely updates to the NOAA Electronic Navigational Chart (ENC) series. Project requirements were originally formulated as a result of analysis conducted within the Coast and Shoreline Change Analysis Program (CSCAP), in which NOAA nautical chart products are compared to contemporary high resolution imagery in order to ascertain the need for more current shoreline data. Subsequent to the change analysis, RSD received a request from the Office of Coast Survey (OCS) Navigation Manager in the region for updated shoreline of St. Thomas Harbor to support the application of a new hydrographic survey. Given the special request, as well as the availability of stereo color and IR imagery, the Applications Branch (AB) of RSD elected to provide full compilation of the entire project area.
Field Operations The field operations consisted of the collection of kinematic Global Positioning System (GPS) and Inertial Measurement Unit (IMU) data and the acquisition of digital aerial imagery. The photographic mission operations were conducted on April 9th, 2009 with the NOAA Cessna Citation II (N52RF) aircraft. Two strips of natural color digital images and two strips of black & white infrared (IR) for a total of forty-six (46) images
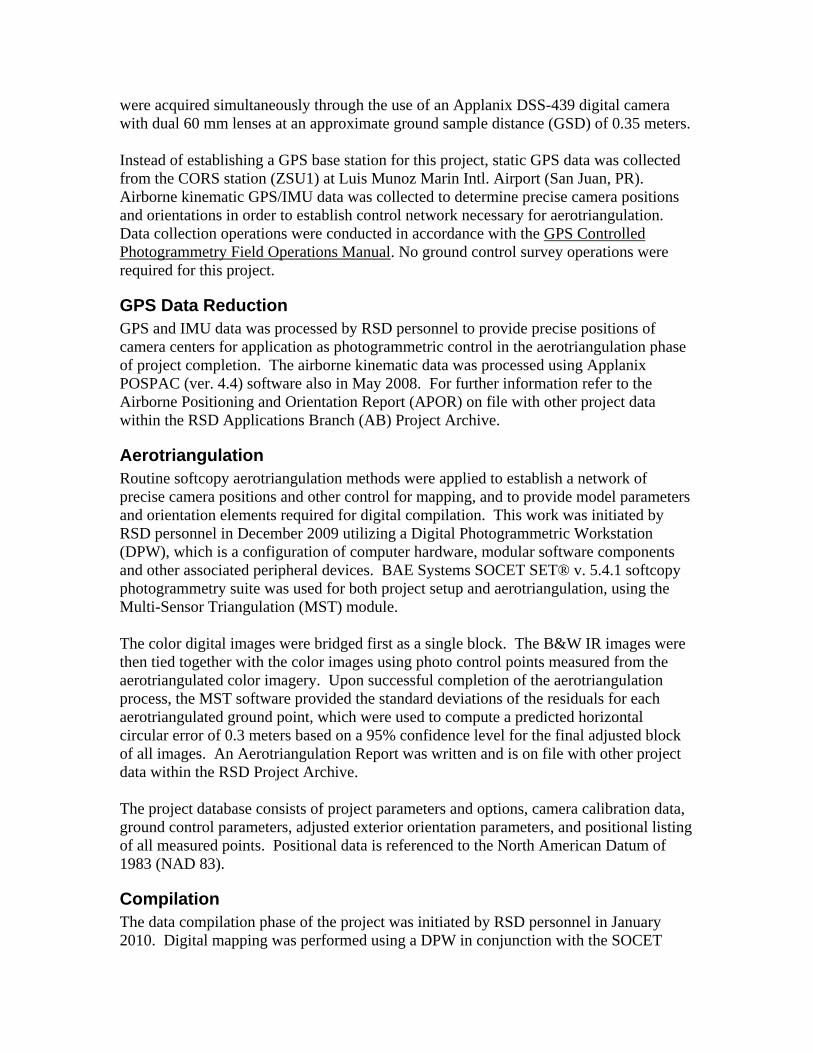
were acquired simultaneously through the use of an Applanix DSS-439 digital camera with dual 60 mm lenses at an approximate ground sample distance (GSD) of 0.35 meters. Instead of establishing a GPS base station for this project, static GPS data was collected from the CORS station (ZSU1) at Luis Munoz Marin Intl. Airport (San Juan, PR). Airborne kinematic GPS/IMU data was collected to determine precise camera positions and orientations in order to establish control network necessary for aerotriangulation. Data collection operations were conducted in accordance with the GPS Controlled Photogrammetry Field Operations Manual. No ground control survey operations were required for this project.
GPS Data Reduction GPS and IMU data was processed by RSD personnel to provide precise positions of camera centers for application as photogrammetric control in the aerotriangulation phase of project completion. The airborne kinematic data was processed using Applanix POSPAC (ver. 4.4) software also in May 2008. For further information refer to the Airborne Positioning and Orientation Report (APOR) on file with other project data within the RSD Applications Branch (AB) Project Archive.
Aerotriangulation Routine softcopy aerotriangulation methods were applied to establish a network of precise camera positions and other control for mapping, and to provide model parameters and orientation elements required for digital compilation. This work was initiated by RSD personnel in December 2009 utilizing a Digital Photogrammetric Workstation (DPW), which is a configuration of computer hardware, modular software components and other associated peripheral devices. BAE Systems SOCET SET® v. 5.4.1 softcopy photogrammetry suite was used for both project setup and aerotriangulation, using the Multi-Sensor Triangulation (MST) module. The color digital images were bridged first as a single block. The B&W IR images were then tied together with the color images using photo control points measured from the aerotriangulated color imagery. Upon successful completion of the aerotriangulation process, the MST software provided the standard deviations of the residuals for each aerotriangulated ground point, which were used to compute a predicted horizontal circular error of 0.3 meters based on a 95% confidence level for the final adjusted block of all images. An Aerotriangulation Report was written and is on file with other project data within the RSD Project Archive. The project database consists of project parameters and options, camera calibration data, ground control parameters, adjusted exterior orientation parameters, and positional listing of all measured points. Positional data is referenced to the North American Datum of 1983 (NAD 83).
Compilation The data compilation phase of the project was initiated by RSD personnel in January 2010. Digital mapping was performed using a DPW in conjunction with the SOCET

SET Feature Extraction module. Feature identification and attribution within the Geographic Cell (GC) were based on image analysis of the digital aerial imagery and information extracted from the appropriate NOAA nautical charts, US Coast Guard Light List and other ancillary sources. Feature attribution was assigned in compliance with the Coastal Cartographic Object Attribute Source Table (C-COAST), which provided the definition and attribution scheme for the full range of cartographic features pertinent to the CMP. Selected features were further modified with additional descriptive information to refine general classification. Spatial data accuracies for Project VI0801 were determined according to standard Federal Geographic Data Committee (FGDC) practices. Cartographic features were compiled to meet a horizontal accuracy of 0.6 meters at the 95% confidence level. This predicted accuracy of compiled, well defined points is derived by doubling the circular error computed from the aerotriangulation statistics. The following table provides information on the digital imagery used in the project completion:
Date Time (UTC) Roll Number
Photo Numbers
GSD (nominal)
Tide Level*
4-09-08 17:50-17:51 08NC03 150001 0489 - 150001 0499 0.35 m -0.1 m
4-09-08 17:56-17:58 08NC03 150002_0500 - 150002_0511 0.35 m -0.1 m
4-09-08 17:50-17:51 08NR02 350001_0120 - 350001_0130 0.35 m -0.1 m
4-09-08 17:56-17:58 08NR02 350002_0131 - 350002_0142 0.35 m -0.1 m
* Tide levels are given in meters above MLLW and are based on actual observations recorded by the NOS gauge at Charlotte Amalie, St. Thomas reference station at the time of photography. The elevation of MHW at Charlotte Amalie is equal to 0.7 meters above MLLW.
Quality Control / Final Review Quality control tasks were conducted during all phases of project completion by a senior member of AB. The final QC review was completed in February 2010. The review process included analysis of aerotriangulation results and assessment of the identification and attribution of digital feature data within the GC according to image analysis and criteria defined in C-COAST. The quality control process concluded with an inspection of topological connectivity within the GC using ArcGIS 9.3 software. All project data was evaluated for compliance to CMP requirements. Comparisons of the largest scale NOAA nautical charts with the imagery and compiled project data resulted in creation of the Chart Evaluation File (CEF). The following nautical chart was used in the comparison process:
25649, St. Thomas Harbor, West Indies, 1:10,000 scale, 19th Ed.

End Products and Deliverables The following specifies the location and identification of the products generated during the completion of this project:
RSD Applications Branch Archive
- Hardcopy of the Airborne Positioning and Orientation Report (APOR) - Hardcopy of the Aerotriangulation Report - Hardcopy of the Project Completion Report (PCR) - Page-size graphic plot of GC10799 file contents, attached to PCR
Remote Sensing Division Electronic Data Library
- Project database - GC10799 in shapefile format - Digital copy of the PCR in Adobe PDF format - Chart Evaluation File in shapefile format
NOAA Shoreline Data Explorer
- GC10799 in shapefile format - Metadata file for GC10799 - Digital copy of the PCR in Adobe PDF format
End of Report

!
!
!
!!
!
!
! !
!
!
!
!
!
!! !!!
!!!!
!!!
!!
!
!
!!!
!
!!
!!
!!
!
!
!!
!
!!!
!
!
!!
!!!!
!!!
!!
!
!!
!
!
!!
!!
!
!!!!!
!
!!
!!!!!!!!
!
!
!!
!
!
!!!
!!!!!!!
!!!!
!!!!! !!
!!!!!!!!
!!!!!
!!!!!
!!!!!!
!!!!!!! !!!!!!
!
!!!
!!!!
!
!!
!
!!!
!
!
!
!
!!!!
!!!
!! !!!!!
!!
!!!!!
!
!
!!!!!!!!!
!
!!
!!!!
!
!!!! !
! !!!!
!!!!!!!
!!!
!!!
!
!!!!
!
!! !!!
!!!!!
!!!
!!
!!
!
!
!!
64°55'0"W
64°55'0"W
64°57'30"W
64°57'30"W
18°20'0"N18°20'0"N
18°17'30"N18°17'30"N
ST. THOMAS HARBOR
U.S. VIRGIN ISLANDS
VI0801
GC10799
Overview
USVI
Atlantic Ocean
Long Bay
Charlotte Amalie
West Greg
erie Chan
nel
East Gregerie Channel
LindberghBay

This Document is for Office Process use only and is intended to supplement, not supersede or replace, information/recommendations in the Descriptive or Evaluation Reports
[Type text]
AHB PRE-COMPILATION LOG
General Survey Information REGISTRY No. W00212 PROJECT No. OSD-ARC-10 FIELD UNIT ARC SURVEYING & MAPPING DATE OF SURVEY MAY 19-20, 2010 LARGEST SCALE CHART 25649, edition 19, 20030800, 1: 10,000 ADDITIONAL CHARTS N/A PRE-COMPILER Wesley Kitt
Source Grids File Location & Name
T:\SAR\W00212-OSD-ARC-10\AHB_W00212-ARC-10\AHB_W00212\SAR Final Products\GRIDS\W00212_Uncertainty_50cm_Final.csar
Surfaces File Location & Name Combined T:\SAR\W00212-OSD-ARC-10\AHB_W00212-ARC-10\AHB_W00212\SAR Final
Products\GRIDS\W00212_Uncertainty_50cm_Final.csar
Interpolated TIN T:\SAR\W00212-OSD-ARC-10\AHB_W00212-ARC-10\AHB_W00212\COMPILE\Working\Interpolated TIN\W00212_1m_InterpTIN.csar
Shifted Interpolated TIN T:\SAR\W00212-OSD-ARC-10\AHB_W00212-ARC-10\AHB_W00212\COMPILE\Working\Interpolated TIN\Shifted Surface\W00212_1m_InterpTIN_Shifted_ft.csar
Final HOBs File Location & Name Survey Scale Soundings T:\SAR\W00212-OSD-ARC-10\AHB_W00212-ARC-
10\AHB_W00212\COMPILE\Working\HOB's\W00212_SS.hob Chart Scale Soundings T:\SAR\W00212-OSD-ARC-10\AHB_W00212-ARC-
10\AHB_W00212\COMPILE\Working\HOB's\W00212_CS.hob Contour Layer T:\SAR\W00212-OSD-ARC-10\AHB_W00212-ARC-
10\AHB_W00212\COMPILE\Working\HOB's\W00212_Contours.hob Feature Layer T:\SAR\W00212-OSD-ARC-10\AHB_W00212-ARC-
10\AHB_W00212\COMPILE\Working\HOB's\W00212_Features.hob Meta-Objects Layer T:\SAR\W00212-OSD-ARC-10\AHB_W00212-ARC-
10\AHB_W00212\COMPILE\Working\HOB's\MetaObjects.hob Blue Notes T:\SAR\W00212-OSD-ARC-10\AHB_W00212-ARC-
10\AHB_W00212\COMPILE\Working\HOB's\W00212_Bluenotes.hob ENC Retain Soundings N/A
SPECIFICATIONS:
I. COMBINED SURFACE: a. Number of ESAR Final Grids: 1 b. Resolution: 50 cm
II. SURVEY SCALE SOUNDINGS (SS): a. Radius b. Shoal biased c. Use Single-Defined Radius (mm at Map Scale): 1:10,000 ; Radius Value = 1 d. Queried Depth of All Soundings
i. Minimum: 2.5 m ii. Maximum: 19.5 m
III. INTERPOLATED TIN SURFACE:
a. Resolution (m): 50cm

This Document is for Office Process use only and is intended to supplement, not supersede or replace, information/recommendations in the Descriptive or Evaluation Reports
[Type text]
b. Natural Neighbor c. Shifted value: -0.75 ft
IV. CONTOURS:
a. Use a Depth List: T:\SAR\W00212-OSD-ARC-10\AHB_W00212-ARC-10\AHB_W00212\COMPILE\Working\Reference\W00212_NOAA_depth_curves_list.txt
b. Line Object: DEPCNT c. Value Attribute: VALDCO
V. FEATURES: a. Total Number of Features: 7 b. Number of Insignificant Features: 5
VI. CHART SURVEY SOUNDINGS (CS):
a. Number of ENC CS Soundings: N/A b. Radius c. Shoal biased d. Use Single-Defined Radius: m on the ground
i. Radius Value (m): 120 ii. Or use a Sounding Space Range Table (if applicable): N/A
e. Filter: Interpolated != 1 f. Number Survey CS Soundings: 68
VII. Notes:
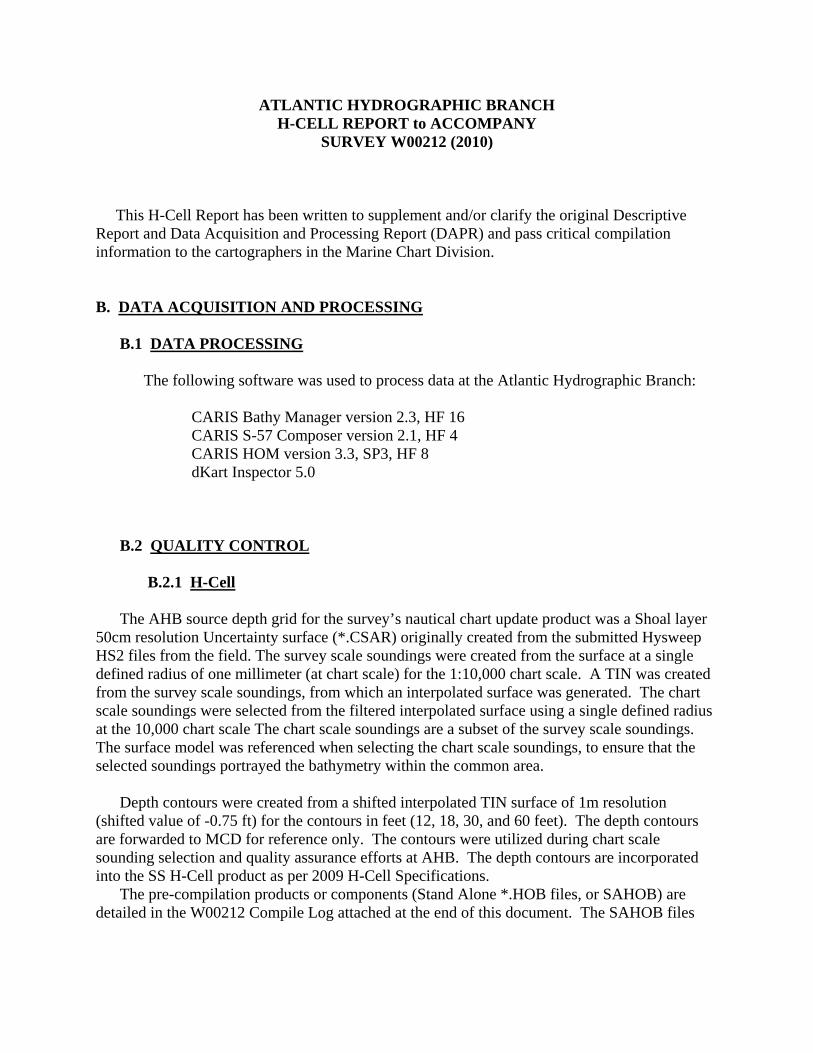
ATLANTIC HYDROGRAPHIC BRANCH H-CELL REPORT to ACCOMPANY
SURVEY W00212 (2010) This H-Cell Report has been written to supplement and/or clarify the original Descriptive Report and Data Acquisition and Processing Report (DAPR) and pass critical compilation information to the cartographers in the Marine Chart Division. B. DATA ACQUISITION AND PROCESSING B.1 DATA PROCESSING
The following software was used to process data at the Atlantic Hydrographic Branch: CARIS Bathy Manager version 2.3, HF 16 CARIS S-57 Composer version 2.1, HF 4 CARIS HOM version 3.3, SP3, HF 8 dKart Inspector 5.0
B.2 QUALITY CONTROL B.2.1 H-Cell
The AHB source depth grid for the survey’s nautical chart update product was a Shoal layer 50cm resolution Uncertainty surface (*.CSAR) originally created from the submitted Hysweep HS2 files from the field. The survey scale soundings were created from the surface at a single defined radius of one millimeter (at chart scale) for the 1:10,000 chart scale. A TIN was created from the survey scale soundings, from which an interpolated surface was generated. The chart scale soundings were selected from the filtered interpolated surface using a single defined radius at the 10,000 chart scale The chart scale soundings are a subset of the survey scale soundings. The surface model was referenced when selecting the chart scale soundings, to ensure that the selected soundings portrayed the bathymetry within the common area.
Depth contours were created from a shifted interpolated TIN surface of 1m resolution
(shifted value of -0.75 ft) for the contours in feet (12, 18, 30, and 60 feet). The depth contours are forwarded to MCD for reference only. The contours were utilized during chart scale sounding selection and quality assurance efforts at AHB. The depth contours are incorporated into the SS H-Cell product as per 2009 H-Cell Specifications.
The pre-compilation products or components (Stand Alone *.HOB files, or SAHOB) are detailed in the W00212 Compile Log attached at the end of this document. The SAHOB files
included depth areas (DEPARE), depth contours (DEPCNT), soundings (SOUNDG), meta-objects (M_QUAL, M_COVR), and cartographic Blue Notes ($CSYMB).
As dictated by Hydrographic Technical Directive 2008-8, these SAHOB files were combined
into two separate files in S-57 format. Both S-57 files were processed in CARIS HOM to convert the metric units to feet/fathoms and feet. The final products are two S-57 files, in Lat/Long NAD-83. One S-57 file contains the chart scale soundings, the meta-objects, and the Blue Notes (W00212_CS.000), and the other S-57 file contains the depth contours and the survey scale soundings (W00212_SS.000). Finally, quality assurance and bathymetry checks were made utilizing dKart Inspector 5.0 validation.
W00212 CARIS H-Cell final deliverables include the following products:
W00212_CS.000 1:10,000 Scale W00212 H-Cell with chart scale soundings, meta-objects, features, etc. W00212_SS.000 1:10,000 Scale W00212 H-Cell with survey scale soundings and depth contours
C. VERTICAL AND HORIZONTAL CONTROL
The OSD-ARC-10 Horizontal and Vertical Control Report (HVCR) was not submitted with survey W00212.
Final water levels were applied for tide correction. Horizontal control used for this survey during data acquisition is based upon the North
American Datum of 1983 (NAD83), UTM Projection Zone 20 North.
D. RESULTS AND RECOMMENDATIONS
D.1 CHART COMPARISON 25649 (19th Edition, Aug/03) Saint Thomas Harbor Corrected through NM 8/9/2003 Corrected through LNM 7/29/2003 Scale 1:10,000
ENC Comparison US5PR21M Saint Thomas Harbor Edition 6 Application Date 2010/03/01 Issue Date 2010/03/01 Chart 25649

D.1.1 Dangers to Navigation
There were no Dangers to Navigation reported for survey W00212.
D.1.2 Charted Depths and Features No AWOIS items were assigned. Please see Appendix II for recommendations
concerning charted and uncharted features.
D.1.3 Detailed Chart Comparison
The charted hydrography originates with prior surveys and requires no further consideration. The hydrographer recommends retaining all seabed characteristic point features as charted and brought into the H-Cell from the ENC.
Please refer to the following image. A “13” at 18°20’09.01”N, 064°56’49.76”W was
selected because of its critical nature. Vessels such as small container ships and ferries often butt up against the sea wall stern to as seen in the ortho image.

As seen in the following image: A charted 11-ft and 14-ft are recommended for removal and are included in the H-Cell bluenotes. They have been obscured by new shoreline construction.

As seen in the following image: A charted 27-ft is recommended for removal and is included in the H-Cell bluenotes. It has been obscured by new shoreline construction.

A red buoy is currently on station at 18°19”52.78”N, 064°56’52.93”W. We are currently awaiting on up-to-date characteristic information. It is currently believed that the buoy in question will eventually replace the fixed aid just to the southeast.
D.3 MISCELLANEOUS
Chart compilation was completed by Atlantic Hydrographic Branch personnel in Norfolk, Virginia. Compilation data will be forwarded to the Marine Chart Division in Silver Spring, Maryland. See Section D.1 of this report for a list of the Raster Charts and Electronic Navigation Charts (ENC) used for compiling the present survey.
D.4 ADEQUACY OF SURVEY The present survey is adequate to supersede the charted bathymetry within the common area. Any features not specifically addressed either in the H-Cell files or the Blue Notes should be retained as charted. Refer to the Descriptive Report for further recommendations by the hydrographer.

APPROVAL SHEET W00212
Initial Approvals:
The completed survey has been inspected with regard to survey coverage, delineation of depth contours, disposition of critical depths, cartographic symbolization, and verification or disproval of charted data. All revisions and additions made to the H-Cell files during survey processing have been entered in the digital data for this survey. The survey records and digital data comply with National Ocean Service and Office of Coast Survey requirements except where noted in the Descriptive Report and the H-Cell Report.
All final products have undergone a comprehensive review per the Hydrographic Surveys
Division Office Processing Manual and are verified to be accurate and complete except where noted. _____________________________ Wesley G Kitt Physical Scientist Atlantic Hydrographic Branch
I have reviewed the H-Cell files, accompanying data, and reports. This survey and accompanying Marine Chart Division deliverables meet National Ocean Service requirements and standards for products in support of nautical charting except where noted. Approved: ___________________________________ Richard T. Brennan Lieutenant Commander, NOAA Chief, Atlantic Hydrographic Branch